Article

The Vertical Development of Fog in the Presence of Turbulent Mixing and Low Stratus Cloud Using Infra-Red Imagery During the SOFOG3D Campaign

1
UK Met Office, FitzRoy Road, Exeter EX1 3PB, UK
2
National Center for Meteorological Research (CNRM), Université de Toulouse, UMR 3589, Météo-France/CNRS, 42 Avenue Gaspard Coriolis, 31057 Toulouse, France
3
Laboratoire Atmosphère, Milieux, et Observations Spatiales (LATMOS), 78280 Guyancourt, France
*
Author to whom correspondence should be addressed.
Atmosphere 2025, 16(12), 1338; https://doi.org/10.3390/atmos16121338
Submission received: 27 October 2025 / Revised: 18 November 2025 / Accepted: 22 November 2025 / Published: 26 November 2025
(This article belongs to the Section Atmospheric Techniques, Instruments, and Modeling)

Abstract

Observations made using infra-red cameras as part of the South-west FOGs 3D experiment (SOFOG3D) have been used to analyse the dynamics and evolution of radiation fog in the presence of turbulent-mixing at fog top. The imagery revealed that mixing between the fog and the air above was common, appearing in over 80% of the radiation-fog cases analysed. The mixing often took the form of sections of fog breaking-off and dissipating in the air above; occasionally, these break-away sections did not dissipate but instead became very low cloud elevated above the fog layer. We have found that the mixing between the fog and air above can lead to an increase in relative humidity (RH) and enhanced cooling above the fog layer. Once the RH above the fog reaches within a few percentage points from saturation, it appears that the air mixed up from the fog below can remain saturated, and the fog may then rapidly grow vertically. Therefore, the turbulent-mixing observed can influence cloud coverage via both the vertical development of existing fog and the ‘spawning’ of very-low-stratus cloud.

1. Introduction

Fog can have a significant effect on human life and the economy. Kapoor [1] reported 10,000 fatalities in India due to fog-related road accidents during the year 2019. Over five years from 2002, in Florida, there were 299 fatal crashes on the roads due to fog [2]. Gultepe et al. [3] stated that fog is the second most prevalent cause of aviation accidents due to weather. The economic losses to the transport industry can be huge [4,5,6]. During an incident of disruption caused by fog, Gadher and Baird [7] estimated that the cost to British Airways was GBP 25 million. Fog also has a great impact on various ecosystems through the introduction of both moisture and nutrients [8,9,10]. Gottlieb et al. [11] found that 92% of the moisture in the Namib desert was due to fog, which also provides a particular type of shrub with essential nutrients. Considering the significant impact on the environment and human life, it is clearly important to be able to forecast fog accurately. However, major challenges still exist when modelling such meteorological conditions.
Difficulties in initiating accurate near-surface atmospheric parameters [12,13,14] are a significant cause of errors when modelling fog. Additional errors can occur due to the complexities of modelling the subsequent boundary layer processes, including the radiation and microphysics [15,16]. Steeneveld et al. [17] found that a poorly modelled boundary layer led to surface temperatures and wind speeds that were too high. Smith et al. [18] found that modelled surface temperatures that were too high led to not enough fog formation, whereas surface temperatures that were too low led to too significant fog formation. These temperature discrepancies could be as little as 0.5 K on the hilltops and 1 K in the valley, affecting the existence and/or timing of the fog in the model relative to the observations. An inter-comparison was carried out between Large-Eddy Simulation (LES) and single column models by Boutle et al. [19] using a fog event that occurred in a large shallow valley of approximately 10 km in diameter surrounded by arable fields. They found that large differences existed in the formation and evolution of fog across all model outputs and that these discrepancies were enhanced by changes in the microphysics.
To improve the effectiveness of models in predicting fog correctly, further observation-based work must be carried out to understand the processes involved throughout the entire fog life-cycle. In this work, we focus on the vertical development of radiation fog, particularly the interaction between the fog-top and the air layer above. We asses how these interactions can influence later fog development and even stratus formation and lowering.
Stratus that lowers to form fog has been studied as part of larger experiments over the past decade or so. Dupont [20] looked at six consecutive days during the ParisFog experiment [21], where stratus lowered to form fog and then lifted, repeatedly. They found that droplet sedimentation caused by cloud-top radiative cooling resulted in the cooling and moistening of the layer below the cloud via evaporation of the droplets. This led to fog in two of the three cases. During the C-FOG campaign [22], Singh [23] found that coastal stratus that was observed along the coast of Newfoundland lowered due to cooling and moistening of the air below, which was caused by the sedimentation of droplets from the stratus cloud. These were similar to results shown by Fathalli [24] through the model simulation of an observed case that occurred during an experiment carried out on 1–2 December 2016 at ANDRA’s (the French national radioactive waste management agency) atmospheric platform in the northeast of France.
Price [25] discussed the vertical development of fog using observations and a conceptual model that indicated that the relative humidity (RH) in the layer immediately above a stable radiation fog had an important impact on vertical development of the fog. Too low RH (<98%) and vertical growth was inhibited, or fog could even disperse if mixing between the layers increased. Therefore, for shallow, stable-radiation fog to develop into a deeper, more persistent form, the RH in the layer immediately above the fog must be high. For a stable nocturnal boundary layer, one mechanism that may increase the RH in the layer above the fog is mixing from the colder fog layer into it. Various infra-red (IR) camera footage [26] shows that mixing of fronds of fog into the air above is commonplace, whereby the mixed fog evaporates into the layer and by doing so cools it and may increase the RH there. Continued mixing can then create conditions whereby the mixed air remains saturated and the fog then grows in height.
However, IR camera footage also shows that the vertical growth in fog is often associated with an advective component whereby deeper fog appears to move over a location from an apparently non-local source [26]. The horizontal scales relevant to this process do not appear to be well understood at this time but may be linked to local orographic and topographic features. Furthermore, the conditions that allow non-local fog to develop vertically whilst at other locations it does not, and the reason that the deeper fog advects and spreads to other regions, is also poorly understood. With regard to the advection of fog, we can note that since it is normal for wind shear to exist just above a fog layer, including directional shear [27,28], any coupling between the two layers will transfer momentum that may cause the direction of travel of the fog to change. In an extreme case, for example, the direction of travel of fog might completely reverse.
As such, the evolution of shallow fog and its interaction and relation to very-low-stratus clouds needs further study in order to better understand their general vertical development and spreading horizontally. In this paper, we examine data collected during the SOFOG3D (South-west FOGs 3D experiment) campaign, and we use IR camera footage together with in situ meteorological observations in an attempt to elucidate these processes further. The findings are also discussed in the context of improving numerical weather prediction model forecasts of fog evolution. We introduce the data and methodology used for this analysis in Section 2, the results of which follow in Section 3, and we provide a summary and conclusions in Section 4.

2. Methods

2.1. Field Sites and Instrumentation

SOFOG3D [29] consisted of a six-month field campaign, followed by an extensive analysis period, which aimed to characterise the fog life-cycle over both vertical and horizontal scales in the south-west of France. The area was relatively flat but carried heterogeneities in the form of varying land cover, as described by Thornton et al. [30]. Across this region were multiple measurement sites, ten of which were installed over an approximately 10 km by 10 km domain. This work focuses primarily on observations made at a super-site referred to as Le Couye (44.391821, −0.527754), but we also include those made at or near to the Jachere (44.411298, −0.614595) and Charbonniere (44.419272, −0.598146) super-sites to elucidate the coverage of fog over the area. The Jachere site was approximately 1.3 km to the south-west of Charbonniere and 6.7 km to the north-west of Le Couye; the locations can be seen in Figure 1. The area over which the sites were located is flat, with elevations ranging from 68 m at Jachere to 70 m at Le Couye. A differing property between the sites was their surroundings; whereas Charbonniere and Jachere were located in relatively ‘open’ areas amongst arable fields, Le Couye was situated in a 700 m diameter opening with surrounding forest in all directions, as shown in the satellite image in Figure 1. Additionally, shown in Figure 1 is a view towards the north-east from the Le Couye site, which illustrates the opening surrounded by trees; this is the direction that the IR camera was oriented, as described below.
As part of this, we used a subset of the instruments described by Thornton et al. [30], namely the visiometers at Le Couye, Jachere, and Charbonniere, as well as the sonic anemometer, and temperature and humidity probes at Le Couye. At Le Couye, these instruments were mounted on masts at various heights between 1.2 m and 50 m. At Jachere and Charbonniere, we use data from visiometers mounted at 3 m. As part of the analysis, we use time-series of visibility, temperatures, humidity, wind speed, and wind direction directly from these instruments and assess the variance in the vertical wind speed estimated from the sonic anemometer data to act as a proxy for vertical turbulence. In addition to these continuous measurements, radiosondes were launched from the Charbonniere site for particular nights of interest to provide vertical profiles of temperature, humidity, and wind speeds. The data from the Jachere and Charbonniere sites were collected, processed, and provided by Météo-France; those from Le Couye were collected and processed by the UK Met Office; we include a table of the instrument specifications in Appendix A (Table A1).
The wind speed and temperature data collected at four heights between 1.2 m and 48 m at Le Couye have been used to estimate the Brunt–Väisälä frequency, the Froude number, and the turbulence intensity. The former has been calculated using the Python 3.9.21 function MetPy, which takes equations from Durran and Kemp [31]. The calculated Brunt–Väisälä frequency is then used to calculate the Froude number following the method of Klaić et al. [32], F = U/Nh, where F is the Froude number, U is the mean wind speed, N is the Brunt–Väisälä frequency, and h is the height of an obstacle relative to the air-flow. In this work, the obstacle is considered to be the forest, which consists of trees up to 10 to 20 m in height. The obstacle height for the Froude number calculation has therefore been set to 20 m, i.e., the relative height of the trees when considering air-flow at 48 m would be −27 m. We use the Brunt–Väisälä frequency squared as an indicator of stability ( N 2 < 0 represents stability, whereas N 2 > 0 represents unstable conditions where a vertically displaced air parcel will continue to travel away from its original position). We use the Froude number to indicate whether gravity waves are likely to be present (F < 1) or whether air-flow is inertia-dominated (F > 1). Finally, we calculate the turbulence intensity by dividing the standard deviation of the mean wind speed over ten minutes by the mean wind speed over the same time interval [33]; a high turbulence intensity is indicative of turbulent mixing.
Additionally, multiple remote-sensing instruments were used, including Lidar and cloud radar. The BASTA (Bistatic Radar System for Atmospheric Studies) cloud radar [34] was located near the Charbonniere site and provided both backscatter and vertical velocity at 12.5 m vertical resolution, which can be used for the measurement of fog and low cloud. The first valid gate of the cloud radar is at the equivalent of 40 m altitude. This was complimented by the Halo Lidar situated at the Le Couye site and a Leosphere Windcube at Charbonniere. We also introduce here the infra-red (IR) camera that was used extensively in this study and which provided a novel method of studying the evolution of fog.
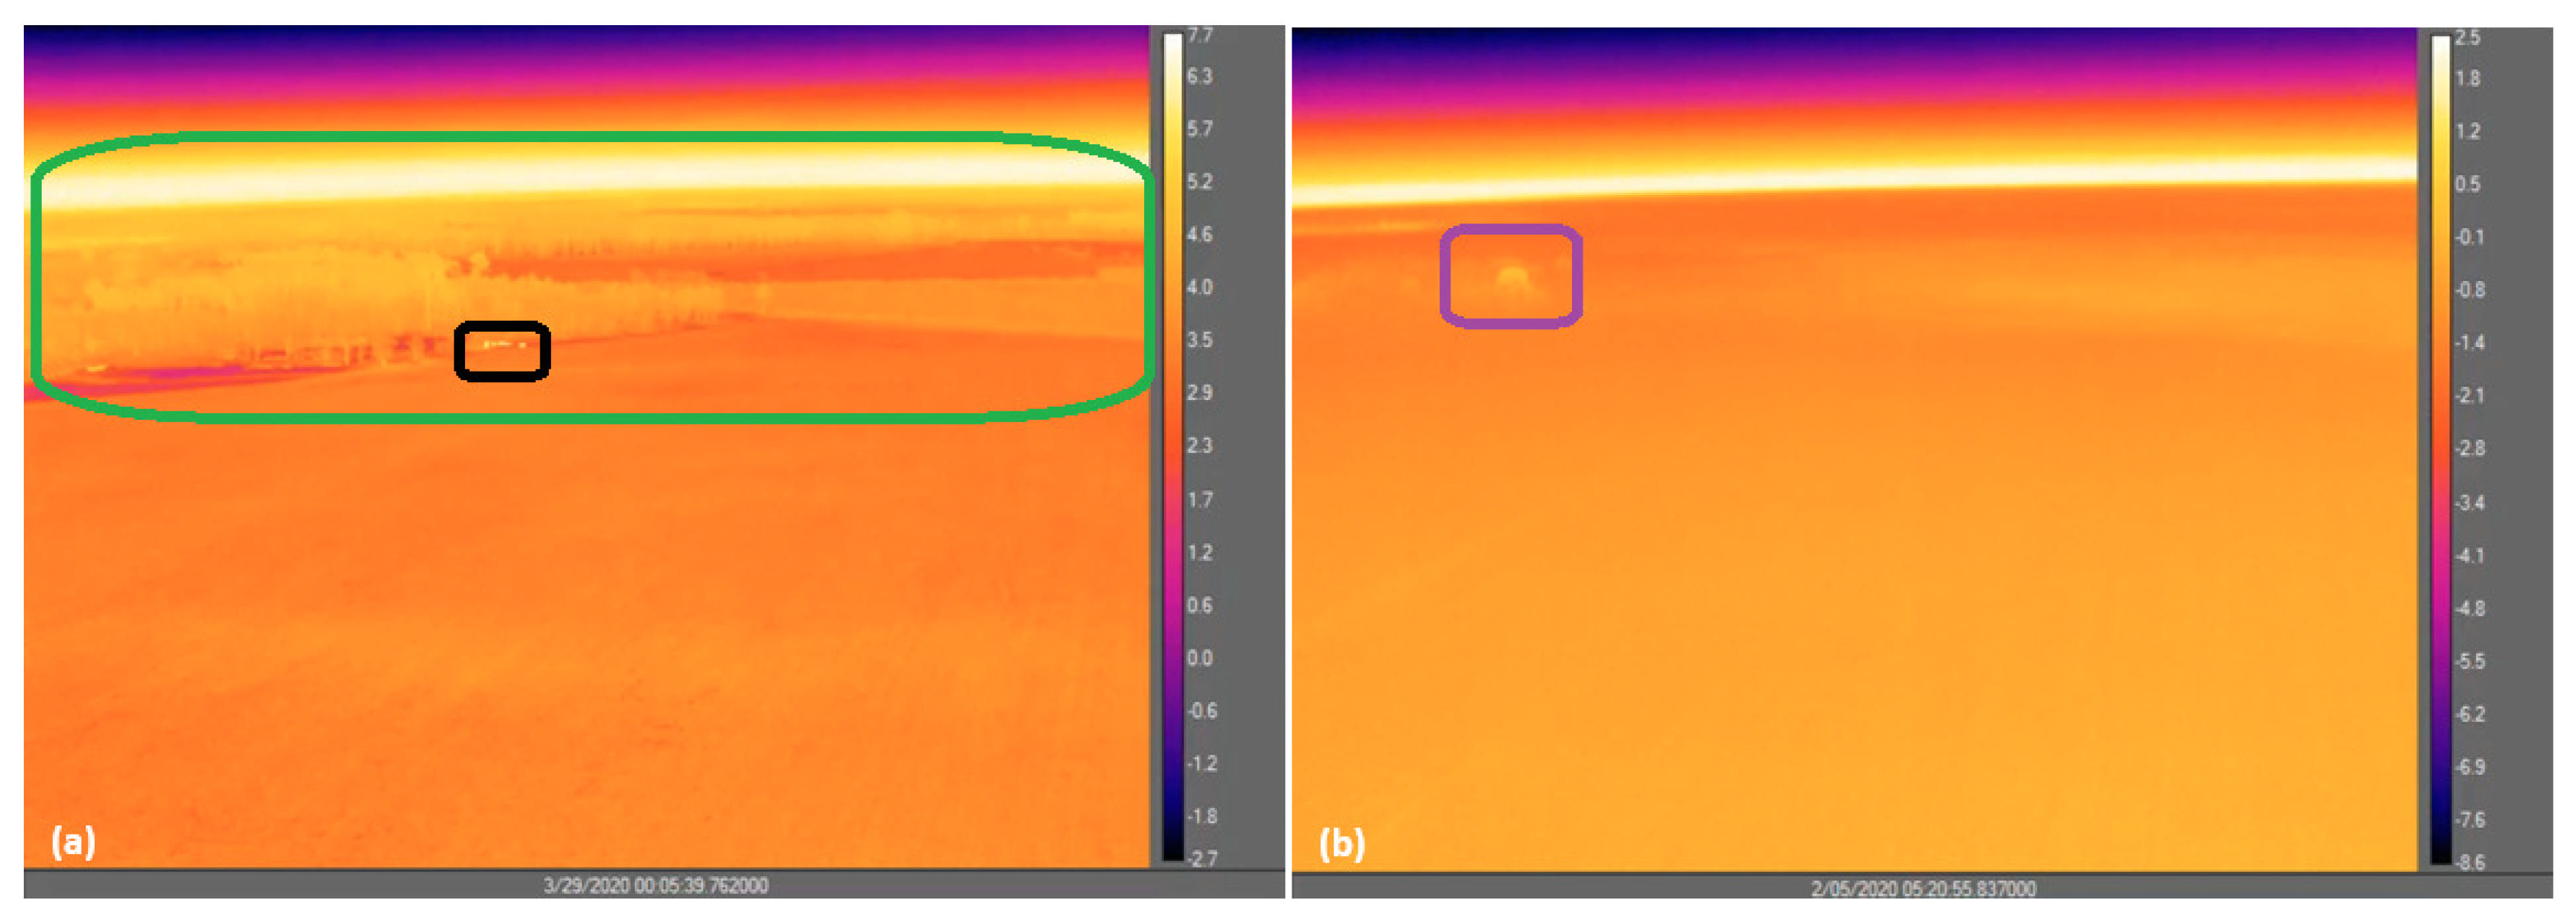
A FLIR systems A655s IR camera, described in detail in Price et al. [26], was mounted at the top of a 50 m mast at Le Couye and faced approximately north-east. The field of view of the camera was 45°; we therefore estimate that if the view of the camera from the installation site to the horizon was 5 km, then the horizontal distance captured by the camera would have been approximately 4 km. For clarity, the camera was positioned such that the horizon would be represented as a horizontal plane across the camera image. The camera was able to capture video footage of fog formation and its subsequent evolution. Since the camera was mounted at a known height, it could provide an indication of the fog-top height, i.e., if the camera was obscured by fog then the fog-top height would be in excess of 50 m. Additionally, we were able to use features in the images, i.e., tree height, to approximate the height of fog over the area surrounding the site. It is worth noting that we do not use the camera to provide an absolute value of fog-top height. IR images are shown (Figure 2) and annotated to illustrate the contrast between clear and foggy conditions, allowing the reader to visualise the site. During clear conditions (Figure 2a), the forested area can be seen within the top-half of the image, and the lower half shows the approximately 700 m diameter clearing in which the site was located. During the occurrence of shallow-fog (Figure 2b), details of the surface and forest can no longer be seen, except for the tops of a small area of trees.
The camera does provide measurements of temperature over the area of view; however, the camera was not calibrated for this purpose and therefore these data were not used as part of this study. Although the camera was not calibrated specifically before the campaign, spot check readings were carried out prior to the SOFOG3D campaign during numerous morning transition experiments at a field-site in the UK. The experiment prior to the SOFOG3D campaign (September 2019 to April 2020) was conducted at the end of February 2019. During these experiments, the camera was set up to view (from a distance) the same area of ground as the infra-red thermistors (IRTs) that constantly monitor surface temperatures at the site and are regularly calibrated. Agreement with the site IRTs was acceptable and within the specified temperature accuracy of the camera (±2 °C). Additionally, the camera was sent to the manufacturer for calibration in February 2021, and it was noted that all readings were still inside the manufacturer’s specifications. For SOFOG, the camera’s primary role was to visualise and capture fog development. The IR videos are included as supplementary material, whereas stills from the videos are presented within the paper; additionally, we include a table of the camera specifications in Appendix A (Table A2). We used these videos alongside the meteorological measurements, i.e., temperature and visibility, and additional remote-sensing data, i.e., LiDAR and cloud radar, to describe the life-cycle of radiation fog over five cases of particular interest during the SOFOG3D campaign.

2.2. Case Study Selection

At the beginning of this study, we had generated IR videos for 29 cases where LiDAR and BASTA cloud radar data suggested that there was either low stratus (cloud base below 400 m) or fog. From these, we identified 12 cases in which radiation fog was present; these then became the cases that were relevant to this study. In 10 of these 12 cases, the IR camera footage revealed periods of approximately 30 min to one hour where multiple discrete sections of the fog would lift and break-away into the layer above. These sections of fog would often appear to dissipate in the air above, but we also observed cases where this did not occur, and the break-away fog instead formed cloud elevated above the fog layer. Additionally, for one case, the IR camera footage showed sections of fog lifting and appearing to seed the low cloud directly above. These various events were present in more than 80% of the radiation fog cases assessed. For ease of description, throughout this paper, we refer to any periods of observed lifting of discrete sections of fog at the top of the layer into the air above as ‘mixing events’.
Presented here are five cases during which the mixing behaviour described above was observed; the cases differ from each other in the evolution of the fog after mixing had been observed. Table 1 lists the five case dates and the observed evolution of the fog, as well as the time period(s) over which the mixing was observed. For each case study, we describe the mixing and any relevant changes in meteorological conditions, then we continue to describe events that occurred afterwards. We elaborate on whether the events following the mixing could have been influenced by the mixing itself. The five cases include:
  • Three cases where fog mixed with air above and deepened in situ (Section 3.1, Section 3.3.1 and Section 3.3.2). Of these three cases, there are two during which stratus then appeared to lower;
  • One case where the fog mixed with the air above and stratus appeared to lower; the fog did not deepen until the stratus merged with it (Section 3.4);
  • One case where fog mixed with both air and cloud above; fog then deepened due to an advective event (Section 3.2).

3. Results

3.1. Mixing Followed by In Situ Deepening of Fog (29 to 30 October 2019)

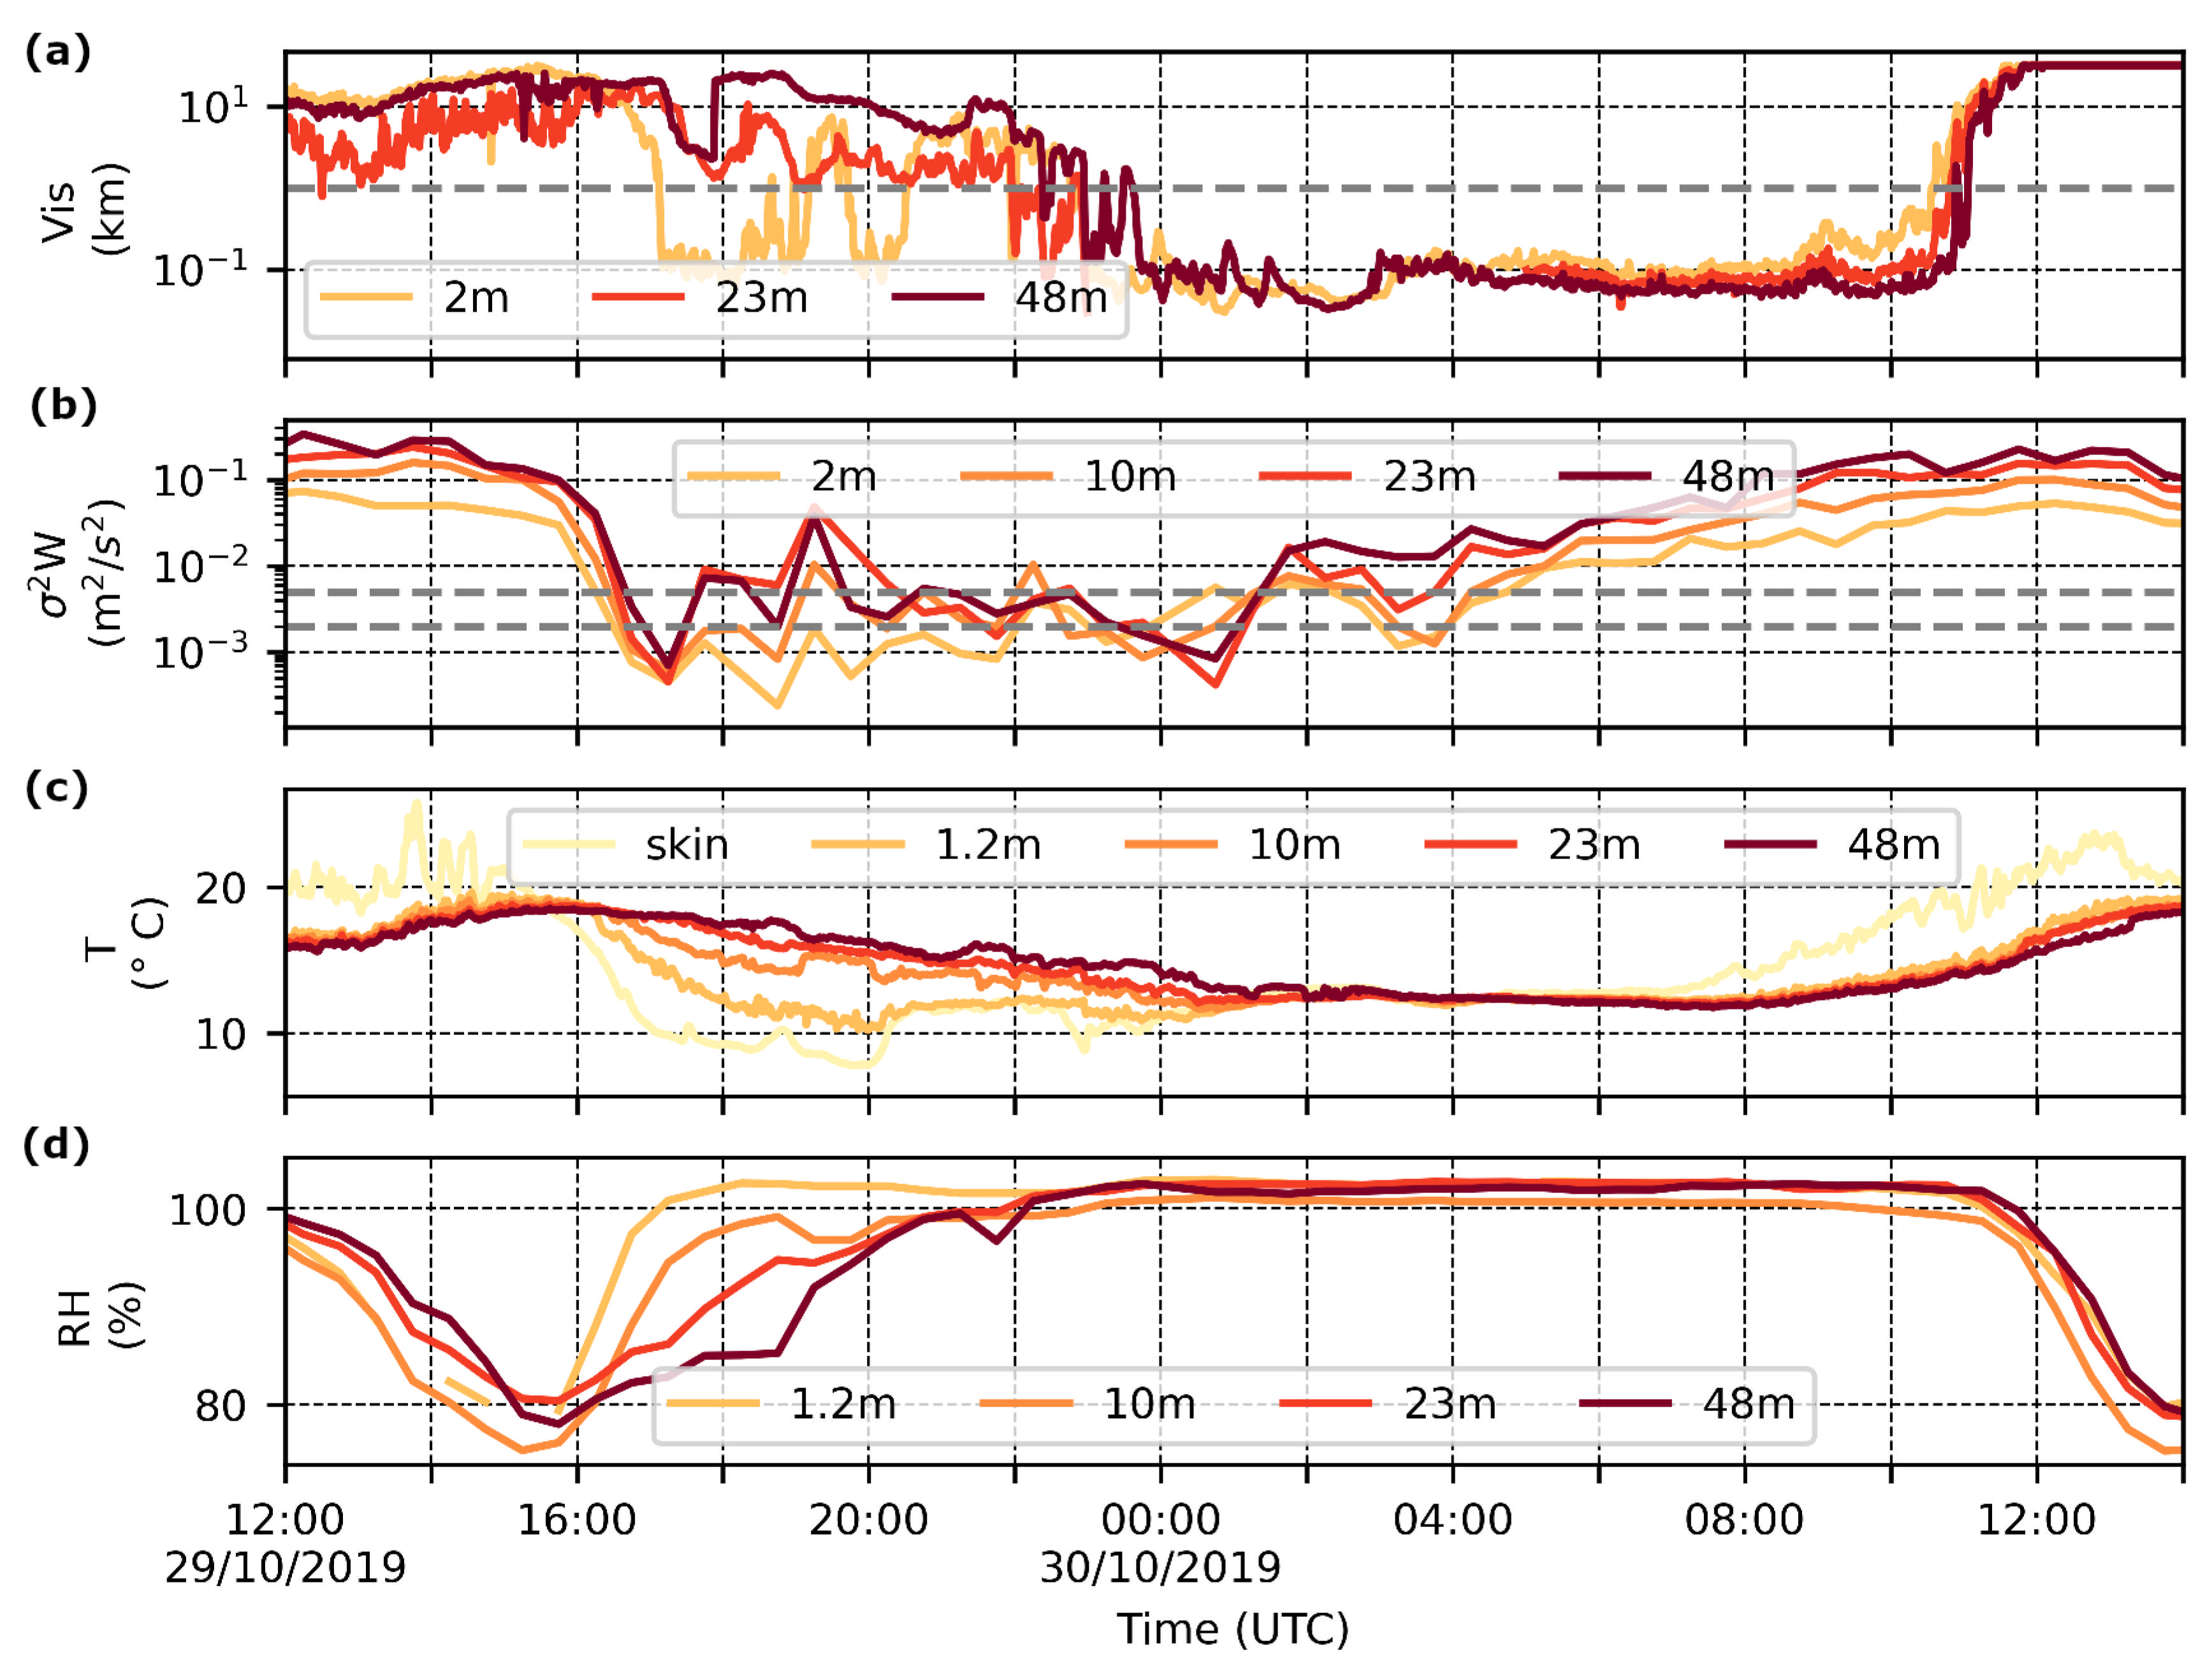
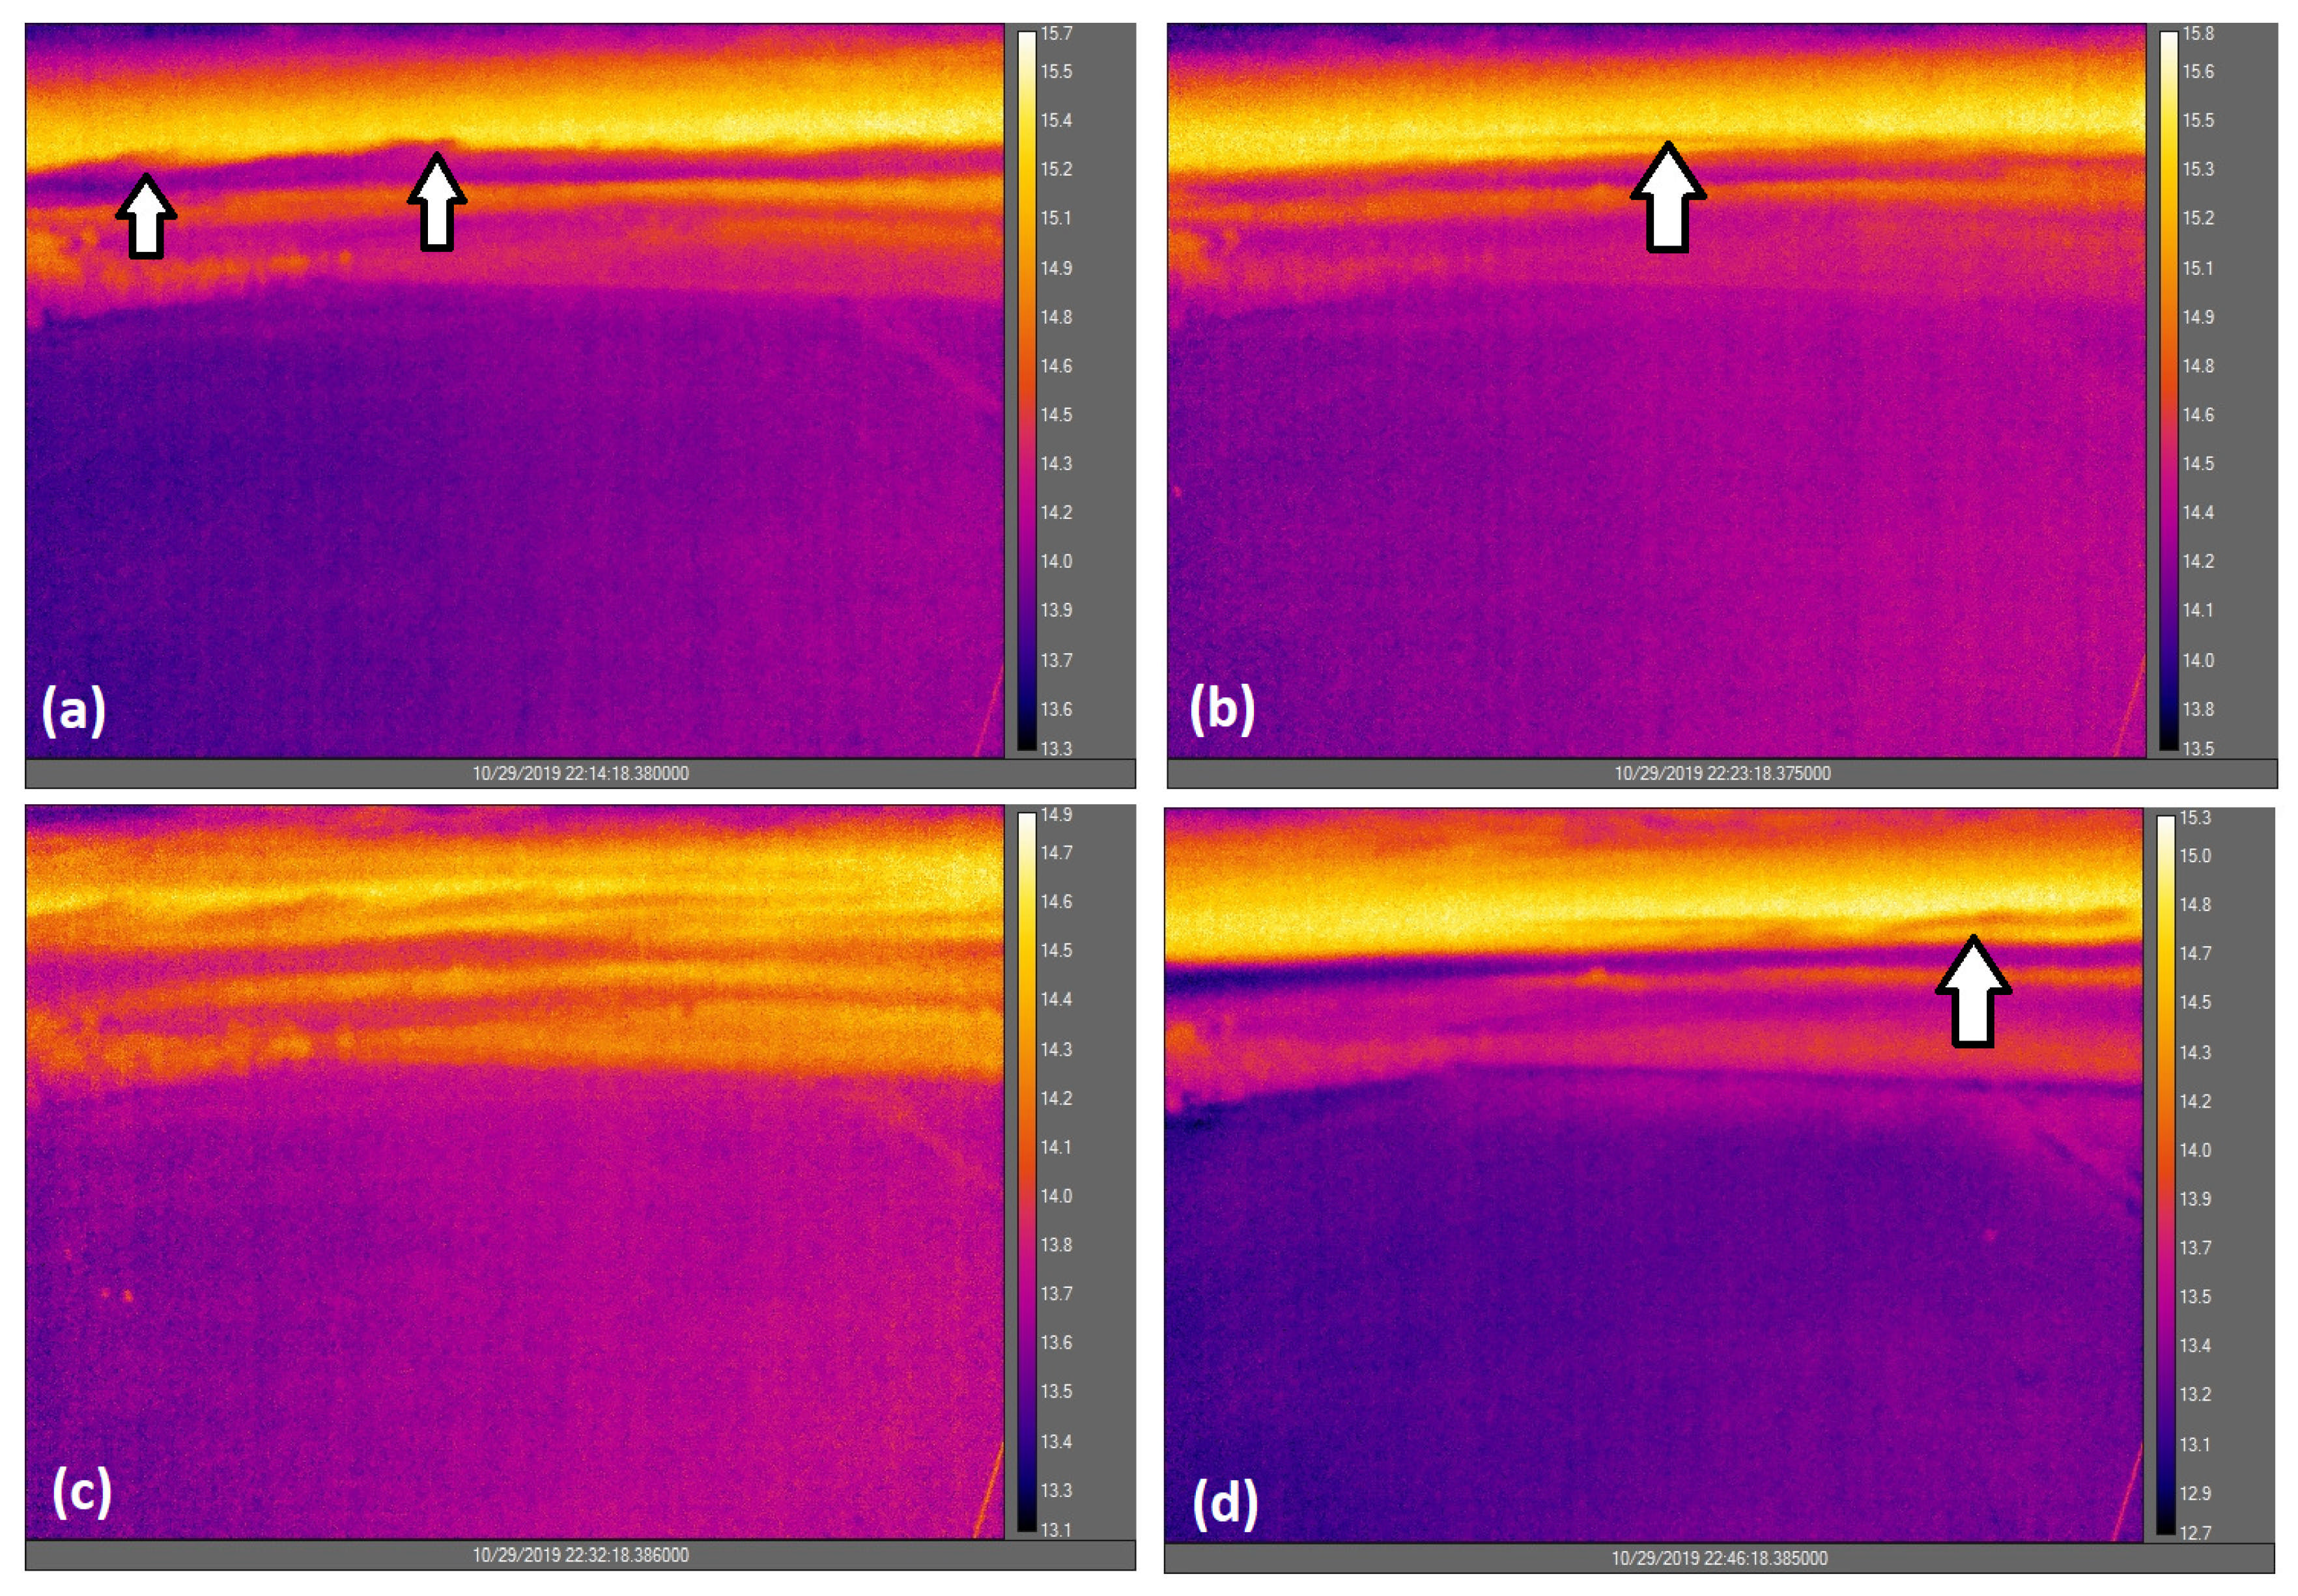
On 29 October 2019, shallow radiation fog was present at the site from 17:00 UTC and appeared to spread from the clearing in which the site was located to other clearings towards the horizon. The shallow fog underwent dissipation and reformation twice as high cloud passed over the site. It reformed rapidly and was able to develop vertically from 22:00 UTC. The visibility at 2 m and 23 m (Figure 3a) dropped below 1 km at 22:00 UTC, but it was not until 2300 UTC that it became consistently below 1 km. It then was not until approximately an hour later that the visibility at 48 m also became consistently below 1 km, where it remained for the following 11 h. Before the fog became persistent at these heights, we observed mixing between the fog top and the air above, i.e., between 22:00 UTC and 23:00 UTC. This mixing was apparent in the IR video footage; images of stills from the video are presented (Figure 4) to illustrate the mixing but do not provide as much clarity as the video itself (Video S1). The mixing took the form of sections of the fog lifting and breaking-off from the layer below. At times, the fog appeared to dissipate in the air above, but there were also instances where the break-away fog appeared to form low stratus above the existing fog layer. During the mixing, the IR camera detected a layer of low stratus elevated above the fog at approximately 22:23 UTC, and although the camera did not record the origin of this cloud, twenty minutes later at 22:46 UTC, it did capture fog breaking-off and lifting to form a similar layer of low stratus, which then propagated along with the flow in an approximately easterly direction. It therefore seems reasonable to expect that the first elevated layer observed also originated from the lower fog layer. We use here the term ‘stratus spawning’ to describe the behaviour of sections of fog lifting and breaking-off from a shallow layer of fog to form higher cloud that remains elevated above the fog layer; we are not aware of this term being previously used. Prior to the fog breaking off and forming a layer of stratus, IR imagery captured low stratus advecting to the site (at 22:32 UTC). This low stratus took the form of multiple streaks of isolated low cloud and therefore looked very similar to the low cloud that had been formed from the fog layer below.
It cannot be ascertained from the imagery whether this stratus originated as low fog that lifted and broke-off, but visibility data from a site nearby (Jachere, 7 km to the west) suggested that radiation fog was also present in the surrounding area at a similar height to that observed at the IR camera site. Therefore, it is possible that the stratus observed at Le Couye at 22:23 UTC formed in a similar way to that which was observed in the IR imagery at 22:46 UTC but at a different site upwind, then advected to the site. For the low stratus, which had lifted from the fog layer below, to remain buoyant and above the fog layer, its buoyancy, after any liquid phase changes had occurred, must match the surrounding air.
The fog developed vertically very rapidly after the mixing had been observed; by 23:00 UTC, approximately 15 min after a section of fog had been seen to lift and break-off to form low stratus, the visibility at 48 m began to drop to below 1 km. This was initially inconsistent with the visibility returning to above 1 km on two occasions, but by 23:45 UTC, the fog was well developed and the visibility up to at least 48 m remained well below 1 km until approximately 11:00 UTC the following morning. This occurred whilst the relative humidity (Figure 3d) was higher than the 98% threshold for fog to develop vertically [25]. This rapid development may have been aided by the mixing between the fog layer and air above and the stratus spawning by causing the air above the fog to become cooler and moister. During the period of mixing, the RH at all levels increased towards saturation, reaching the respective maximums by 00:00 UTC; the temperature at each height continued in a generally decreasing trend (Figure 3c). Additionally, there was an increase in the vertical velocity variance ( σ 2 W), i.e., vertical turbulence, at all heights towards the start of the mixing period, which reduced by the end, suggesting an increase in turbulent mixing during this time (Figure 3b).

3.2. Mixing with Cloud Followed by Advective Deepening (30 to 31 March 2020)

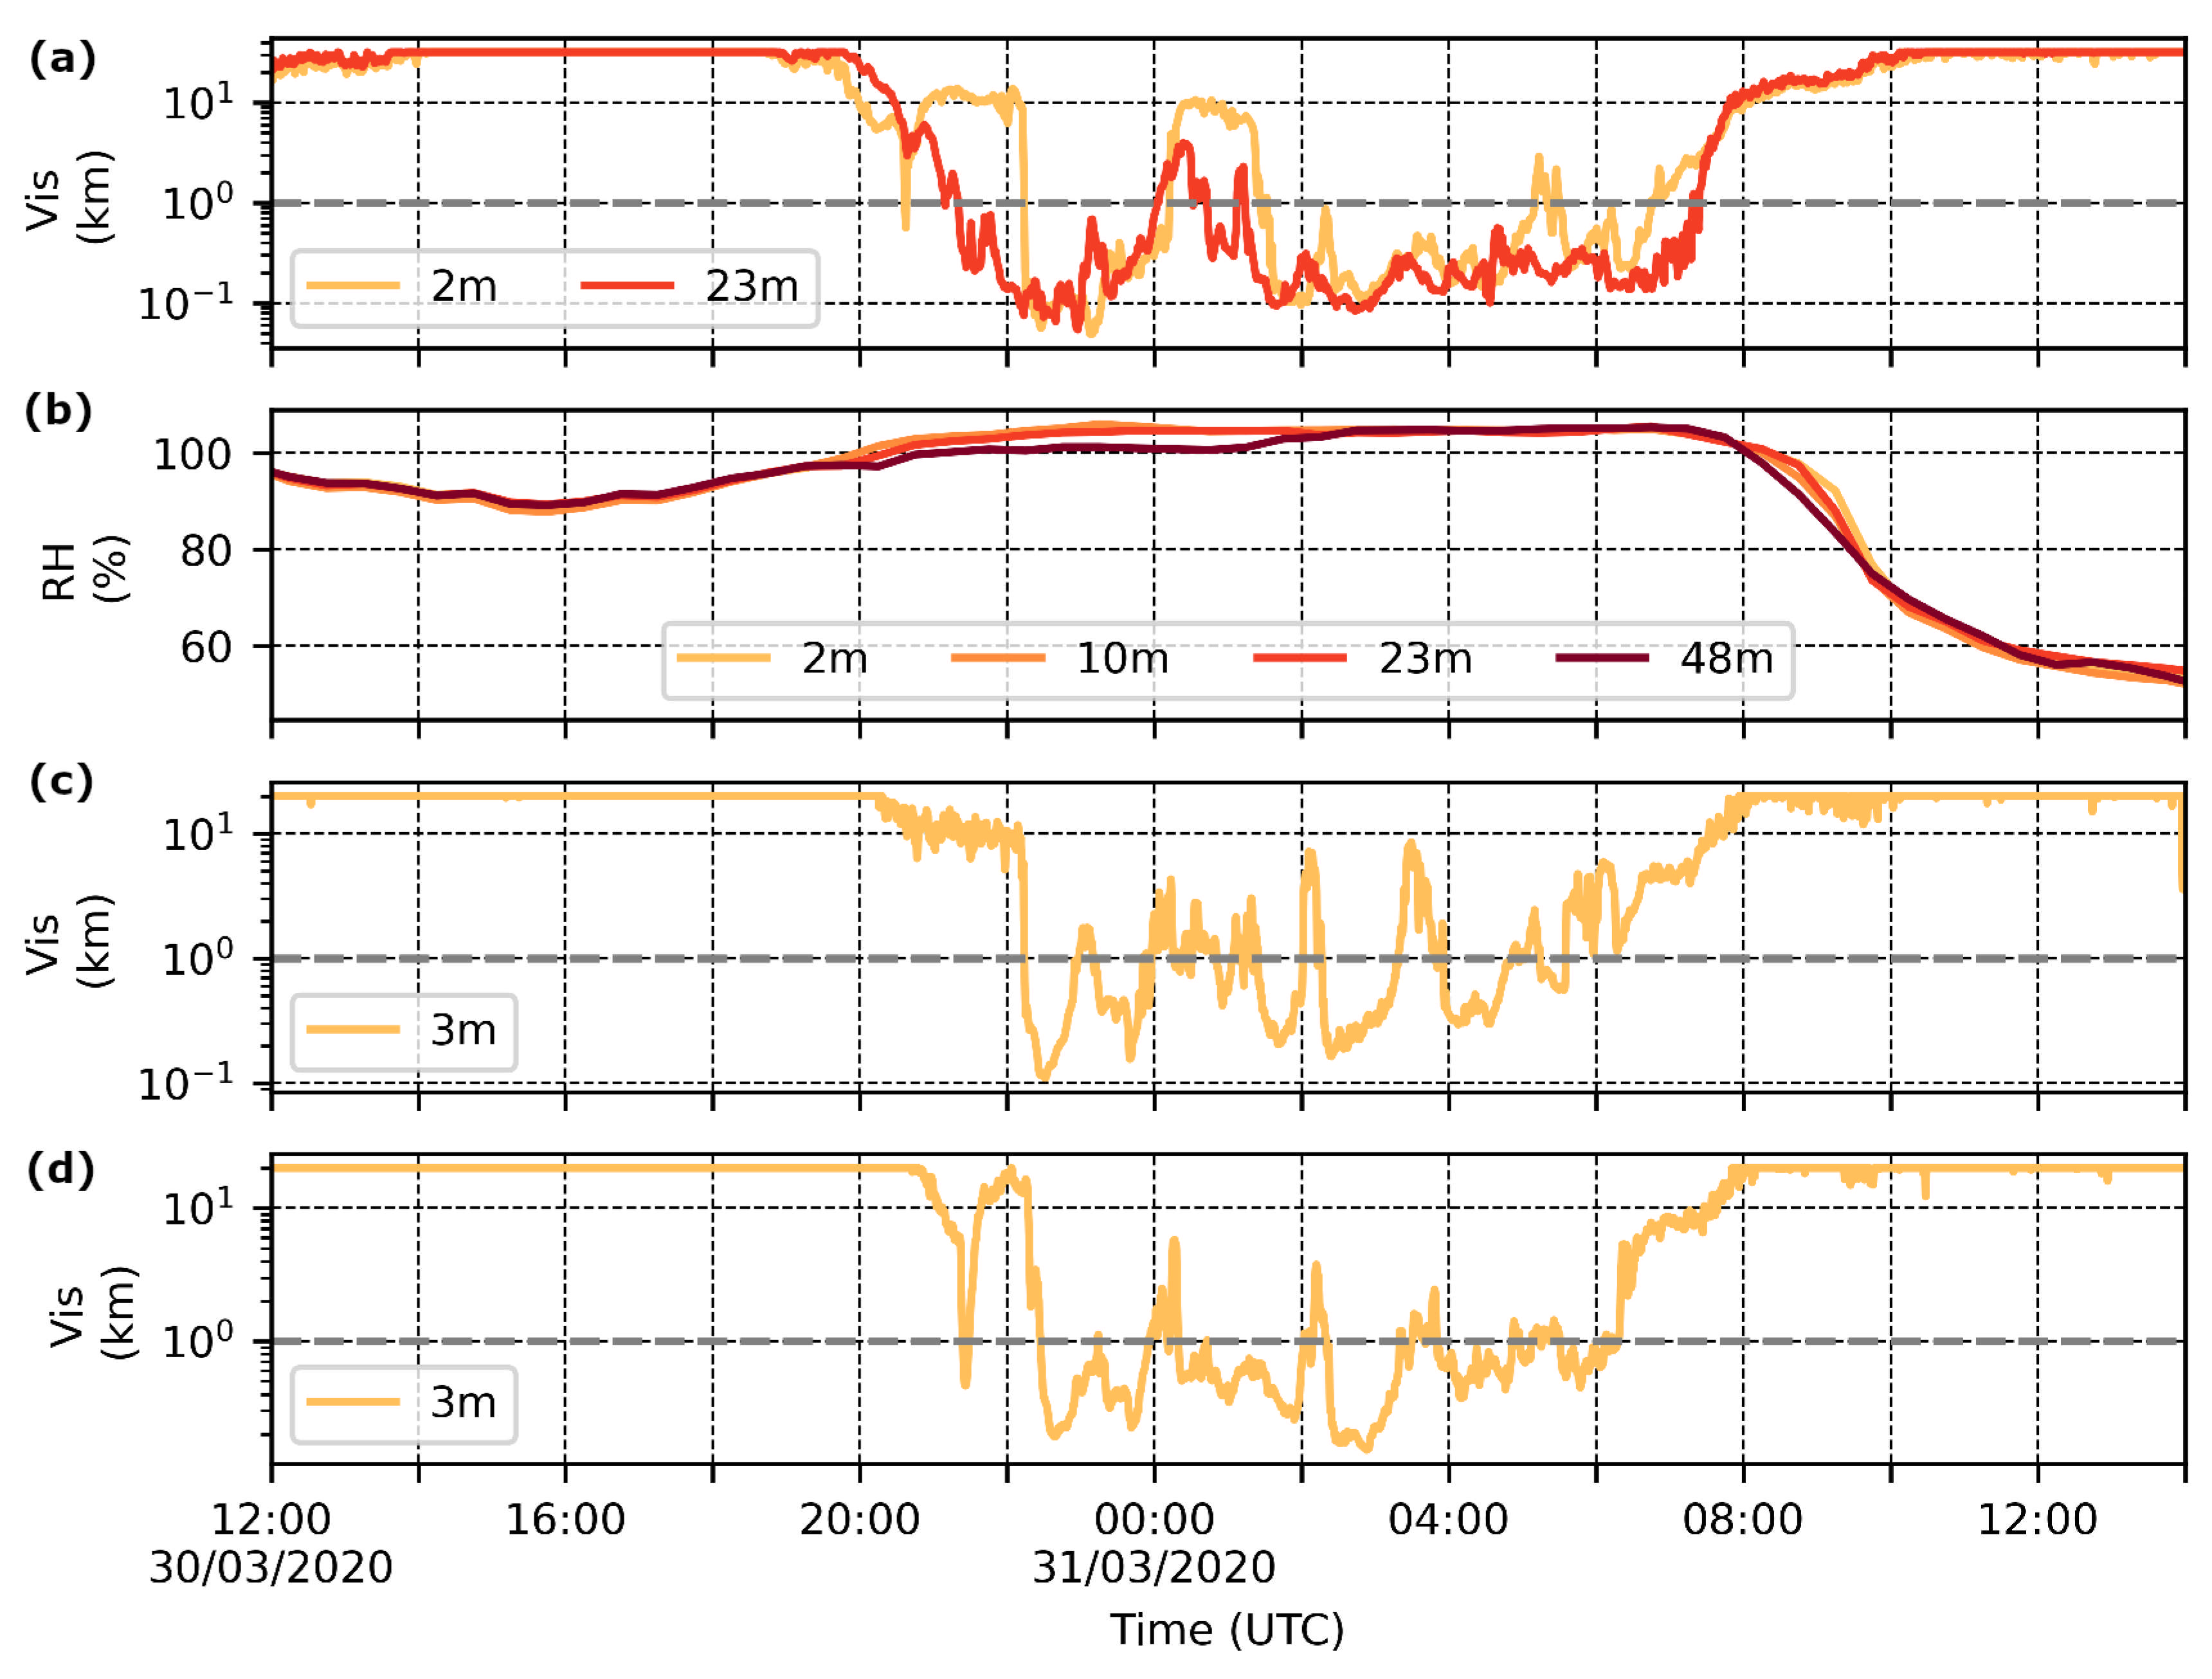
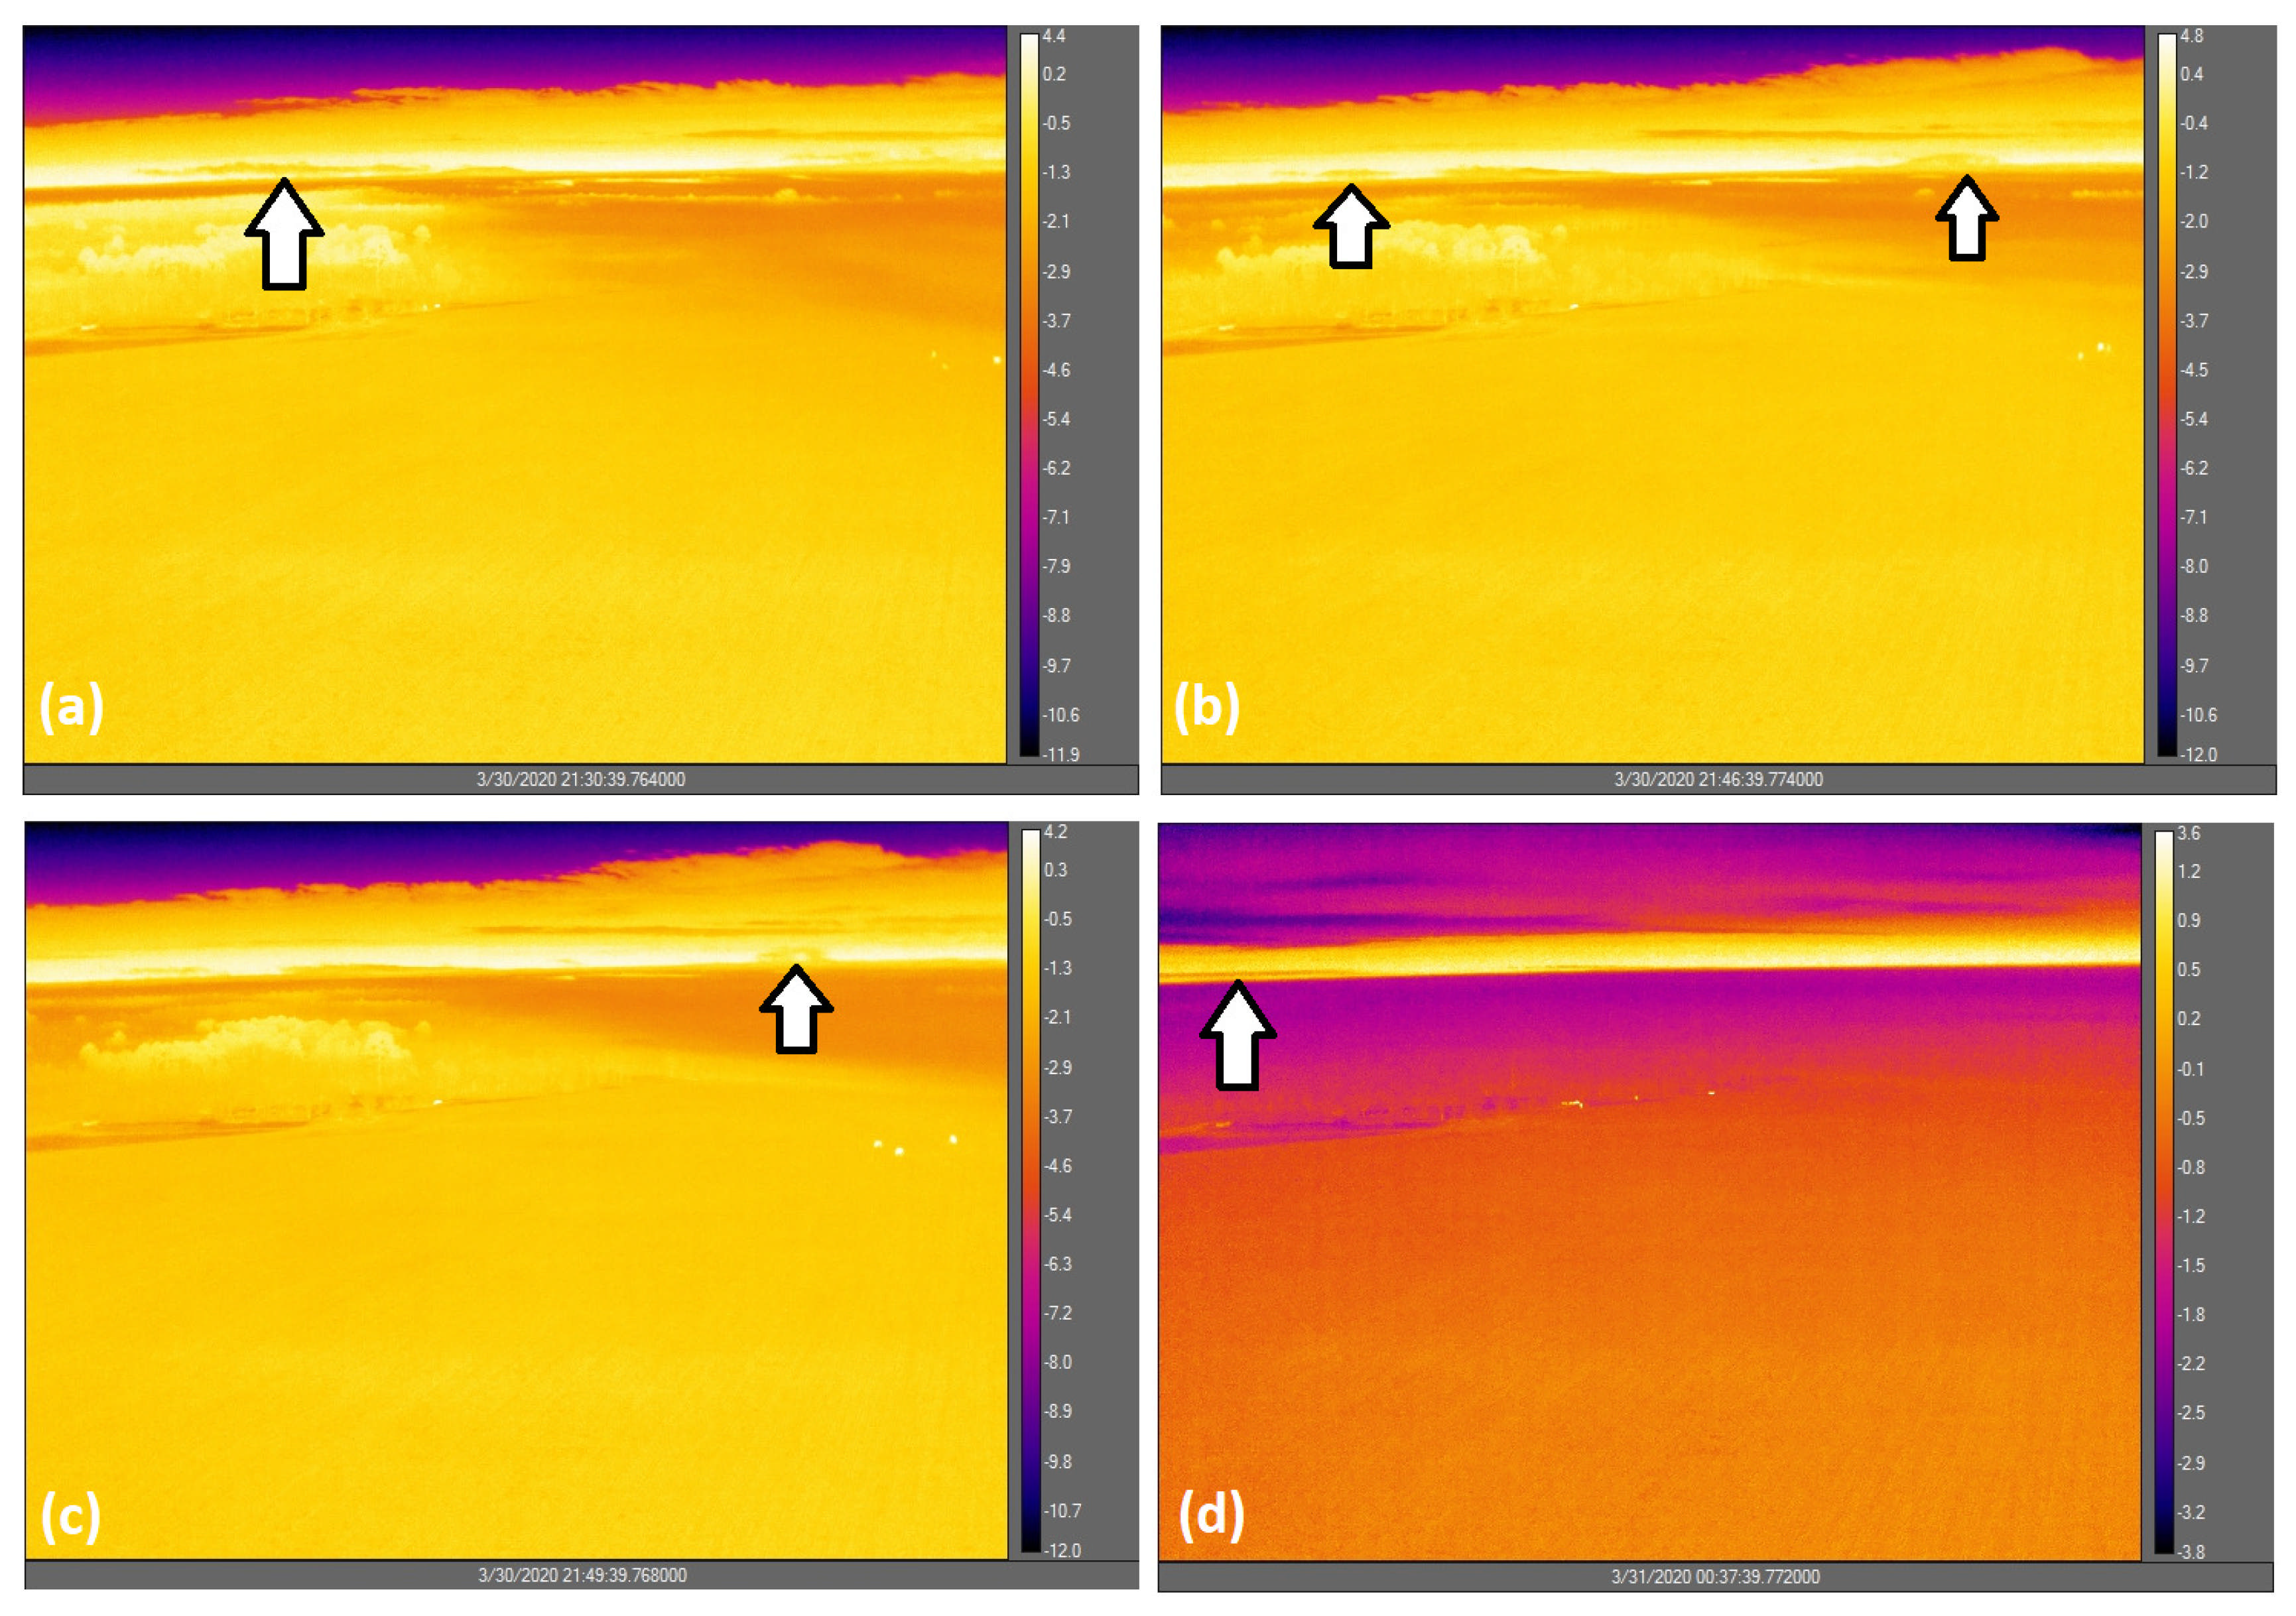
The case of 30 to 31 March 2020 started with very low stratus that advected to the site from the east. Firstly, the visibility at 23 m dropped gradually to below 1 km just after 21:00 UTC, followed by a rapid decrease in visibility at 2 m to below the same value (1 km) just after 22:00 UTC (Figure 5a). The latter occurred as dense-looking fog advected to the site, as seen in the IR video (Video S2). Similar behaviour was observed at the nearby site of Charbonniere, where the cloud radar suggested that fog (or very low cloud) was present between 21:00 and 22:00 UTC. The 3 m visibility at Charbonniere did not drop below 1 km until after 2200 UTC (Figure 5c). The sudden decrease in the near-surface visibility and the behaviour seen in the IR camera imagery suggests that the very low stratus did not necessarily lower, but instead, deeper fog continued to advect to the site. Whilst the advective event was occurring, turbulent mixing at the fog top was observed against the horizon in the IR video. This took the form of sections of fog lifting and breaking off to mix with the air above, as described in the previous case. This appeared to lead to the presence of isolated streaks of low cloud above the fog; again, the IR video itself showed this clearly, but stills from the video are shown (Figure 6) to illustrate the phenomenon. Additionally, some of the sections of fog appeared to move directly to the low cloud above, appearing to ‘seed’ the cloud. The fog then remained persistent for the following two hours, dissipating briefly at 00:00 UTC. The visibility at 2 m remained above 1 km for the following hour and half, but that at 23 m dropped back below 1 km between approximately 00:45 UTC and 01:15 UTC, and then again from 0120 UTC, suggesting the presence of very low stratus. Prior to the drop in the 23 m visibility at 00:45 UTC, streaks of stratus were observed on the horizon in the IR camera footage. This low stratus was similar in appearance to those observed a few hours earlier that had formed from discrete sections of the fog lifting and breaking-off from the layer below. We also observed fog at two nearby sites (Jachere, Charbonniere) approximately 7 km to the north-west from after 22:00 UTC until 00:00 UTC (Figure 5c,d).
Given the behaviour of fog ‘spawning’ stratus captured by the IR camera and that the fog was widespread, it is not unreasonable to assume that this kind of stratus ‘spawning’ behaviour occurred at other locations in the area. If this were the case, then it may be these ‘spawned’ low stratus clouds that caused the reduction in visibility at 23 m only between 00:45 UTC and 01:30 UTC at Le Couye. At 01:30 UTC, the fog was seen in the IR video to develop vertically, reaching the surface and temporarily covering the camera. The fog top remained at least to 23 m until 07:00 UTC, which raises the question of whether the observed phenomenon of stratus ‘spawning’ from discrete parcels of fog from a layer below allowed the fog event to be prolonged. The relative humidity suggested that the air remained saturated up to at least 23 m from 22:00 to 07:00 UTC, which may have been enabled by the presence of low stratus in the absence of fog (between 00:00 UTC and 01:30 UTC); Figure 5b.
The fog developed rapidly to cover the camera twice during this time, at 01:30 UTC and 02:00 UTC; this deepening was also observed by the cloud radar (Figure 7) at a nearby site (close to Charbonniere). The fog dissipated temporarily at 2 m at around 05:00 UTC, and there was no evidence of cloud passing over in the ceilometer or cloud radar data. The view above the fog in the IR camera imagery was obscured by the fog itself, so it is not entirely clear what caused this dissipation. The fog at this height did however reform around the time that the vertical turbulence reduced. As the fog finally dissipated at the site, between 07:00 and 08:00 UTC, it appeared to ‘retreat’ from the site and was seen to rise and break-off from the surface and dissipate on the horizon.

3.3. Mixing Followed by In Situ Deepening of Fog and Apparent Stratus Lowering

Presented here are two cases where we observed mixing between a layer of fog on the horizon with the air above followed by the fog deepening in situ and later stratus lowering. During both cases, the radiation fog that was observed on the horizon filled the entire area of view of the camera, including at the measurement site. There were instabilities at the fog top, which were evident in the IR video where we observed, on the horizon, isolated sections of the fog lifting and breaking-off and mixing with the air above. In both cases, the existing radiation fog deepened in situ approximately one hour after the mixing was observed.

3.3.1. 28 to 29 October 2019 Case

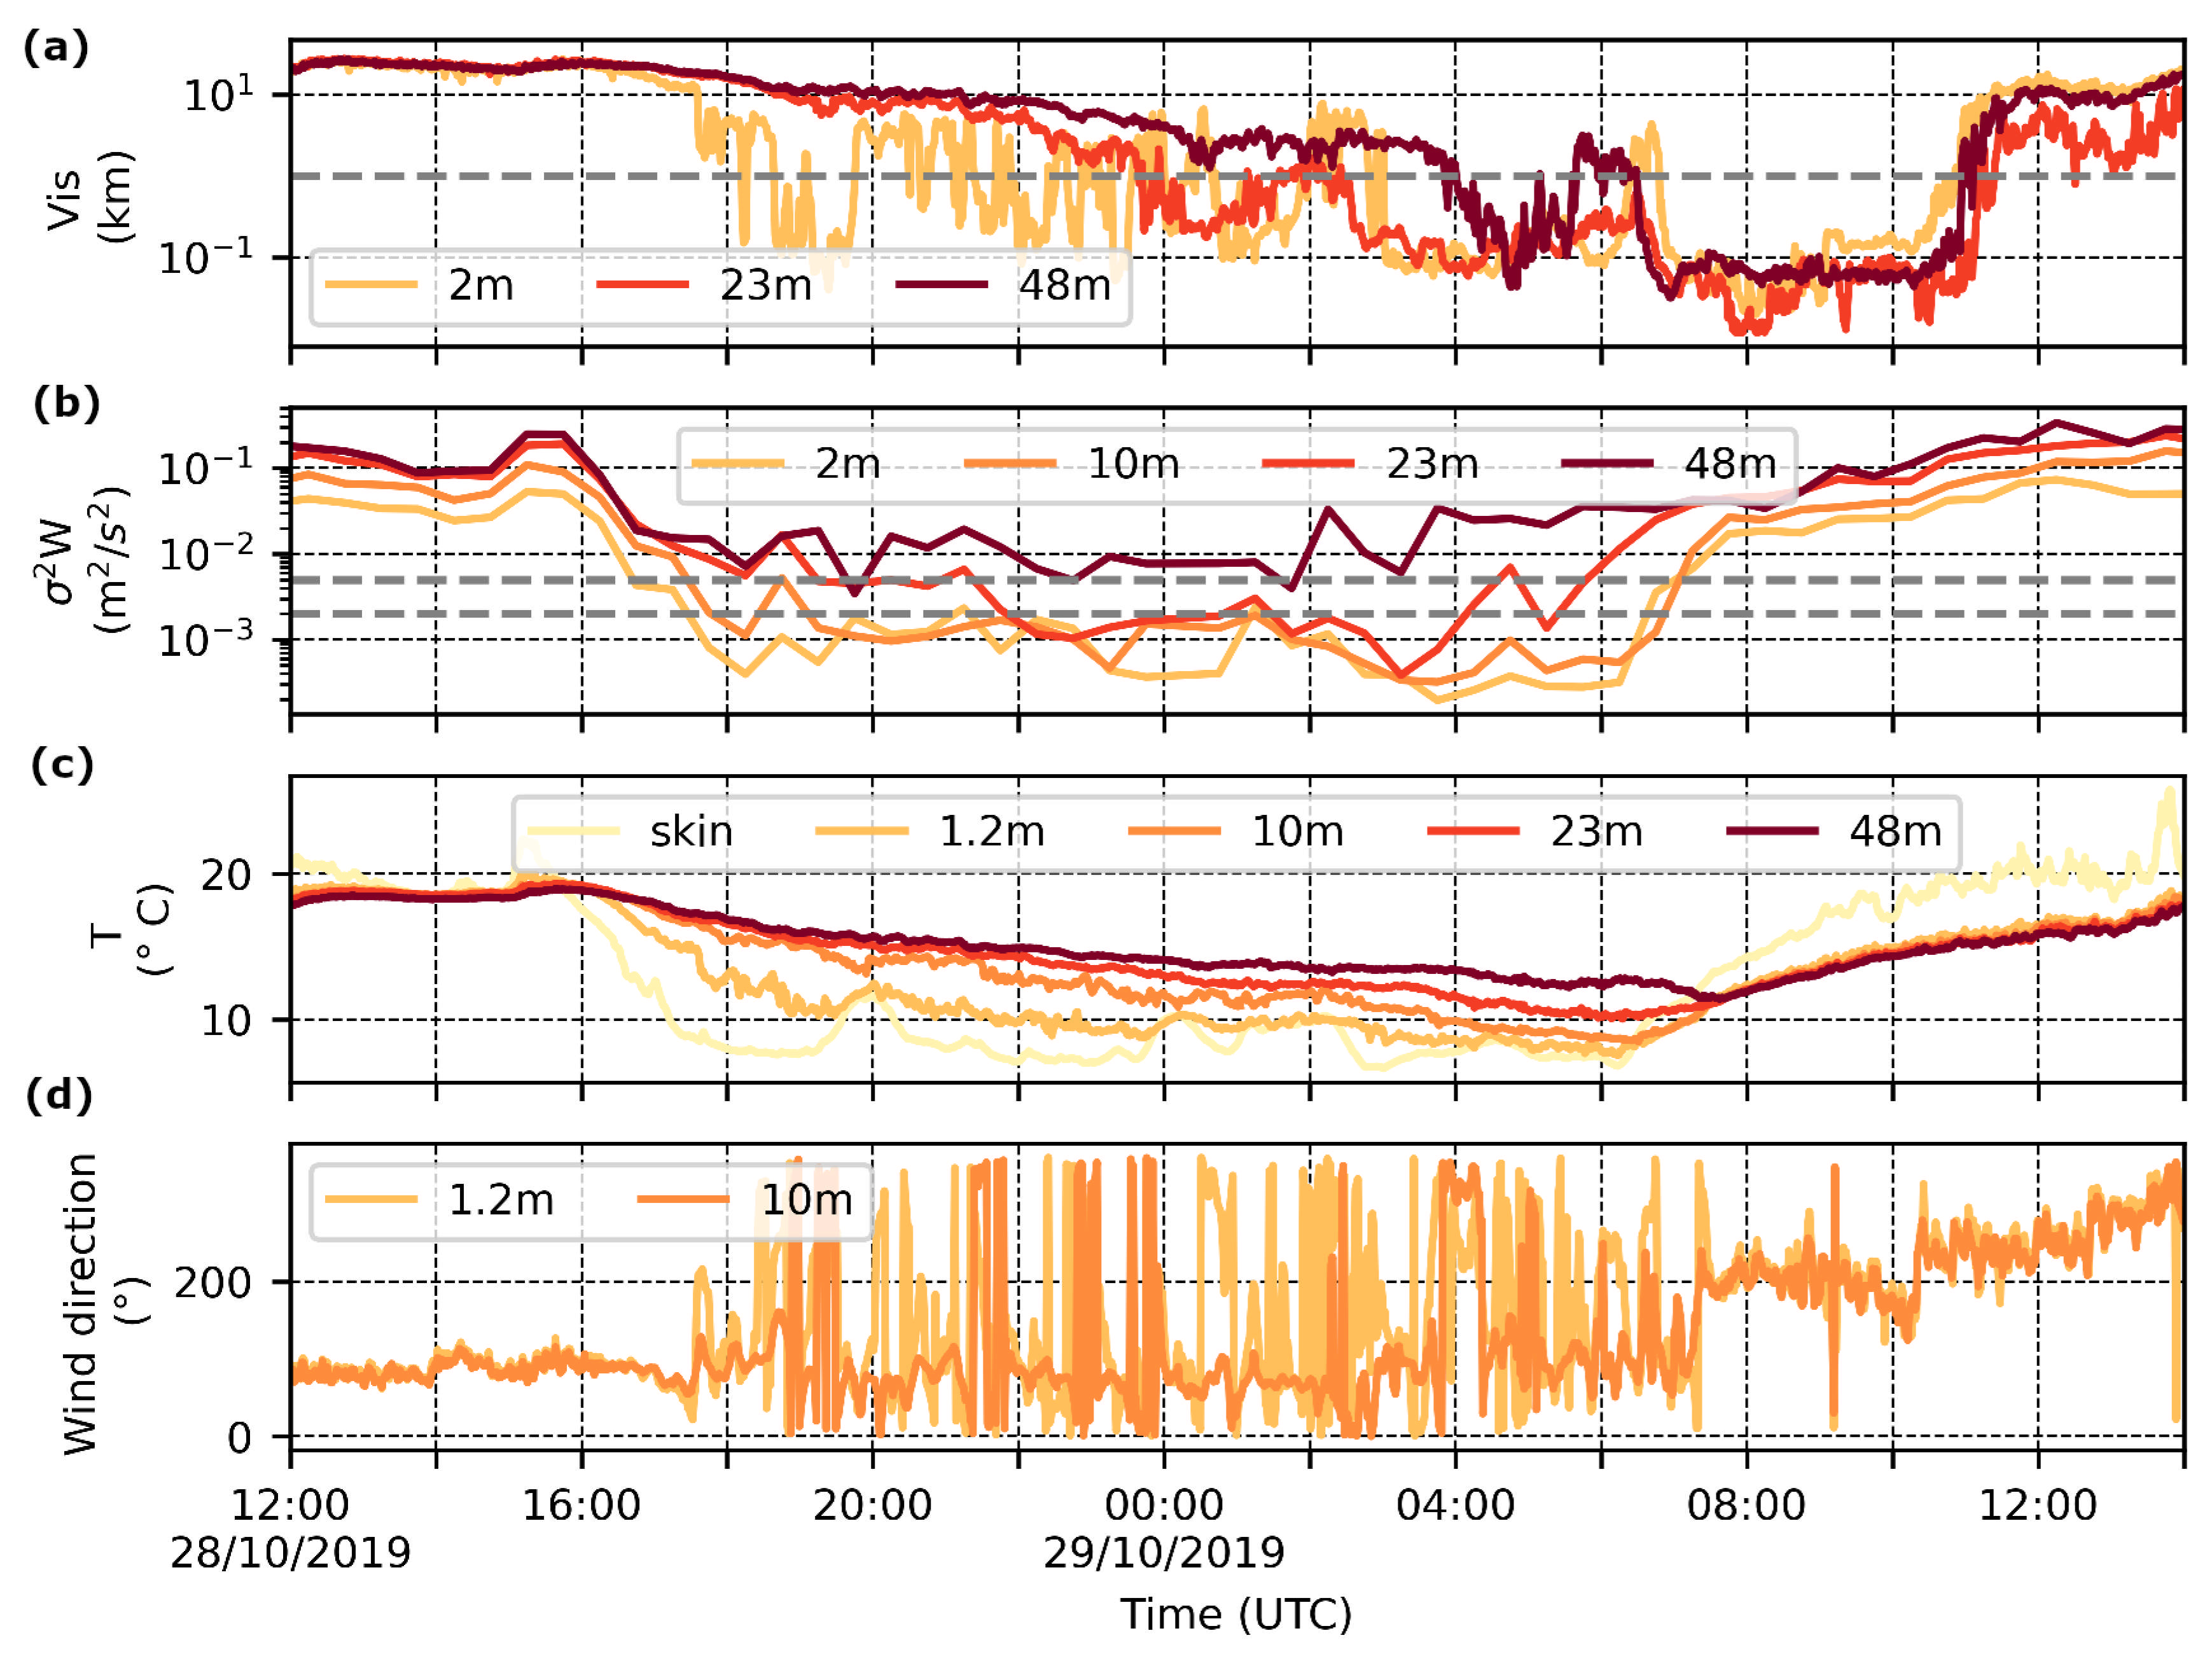
Shallow radiation fog formed at approximately 18:30 UTC during this case, as was evident by the drop in visibility and the video captured by the IR camera (Video S3 ). In the latter, the fog can be seen to move around the site and surrounding area in what was deemed a ‘sloshing’ motion by Price [26]; as in Price [26], this behaviour occurred whilst the wind direction at low level (2 m and 10 m) was very variable (Figure 8d). The shallow fog dissipated as high cloud moved over the site but reformed an hour later in the presence of patchy high cloud. This high cloud may have contributed to the fog remaining heterogeneous and limited the vertical development to below 48 m until after 04:00 UTC, some seven hours after it had initially reformed. Directly prior to the eventual vertical development, the fog was observed at 2 m and 23 m consistently for approximately two hours and had become more homogeneous (Figure 8a). During this time, the IR video revealed that fog was covering the site and the surrounding area all the way to the horizon. In the IR video, isolated sections at the fog top could be seen to lift-up into the layer of air above between 03:00 UTC and 04:00 UTC. This behaviour coincided with an increase in the vertical turbulence at both 23 m and 48 m, suggesting an increase in the amount of turbulent mixing at these heights (Figure 8b). The height of the fog on the horizon is not entirely clear, but if we assume it was similar to that at the site given that the fog coverage looked fairly uniform across the IR images, then the fog top would be somewhere between 23 m and 48 m, i.e., where we observed the increase in vertical turbulence. The temperatures at 1.2 m, 10 m, 23 m, and 48 m (Figure 8c), which had all been generally decreasing since late afternoon, and which had stabilised somewhat before the fog was seen to break-away and mix with the air above, began to drop more rapidly from the start of this ‘mixing event’. These increases in the cooling rate were staggered with the screen-level starting to cool more rapidly and earlier than at other heights. It was at approximately 03:45 UTC when the temperature at 48 m began to drop more rapidly. This occurred at the same time as the fog at the site developed vertically to this height. It is therefore possible that the mixing that was observed contributed to the cooling of the air between at least 23 m and 48 m, enabling the fog to develop vertically very rapidly. Additionally, during the mixing event, the RH at each height, which were already near saturation, continued to increase gradually. Interestingly, after the mixing event, when the fog had reached 48 m at the site, the relative humidity at this height decreased. This may also be a consequence of the fog top, after developing vertically to approximately 48 m, mixing with the drier air above; the vertical turbulence was high at 48 m during this period, which suggests high levels of turbulent mixing. The fog at this height dissipated after an hour and half (at approximately 05:30 UTC), which could have been caused by the mixing reducing the RH at this level. The fog persisted at 2 m and 23 m.
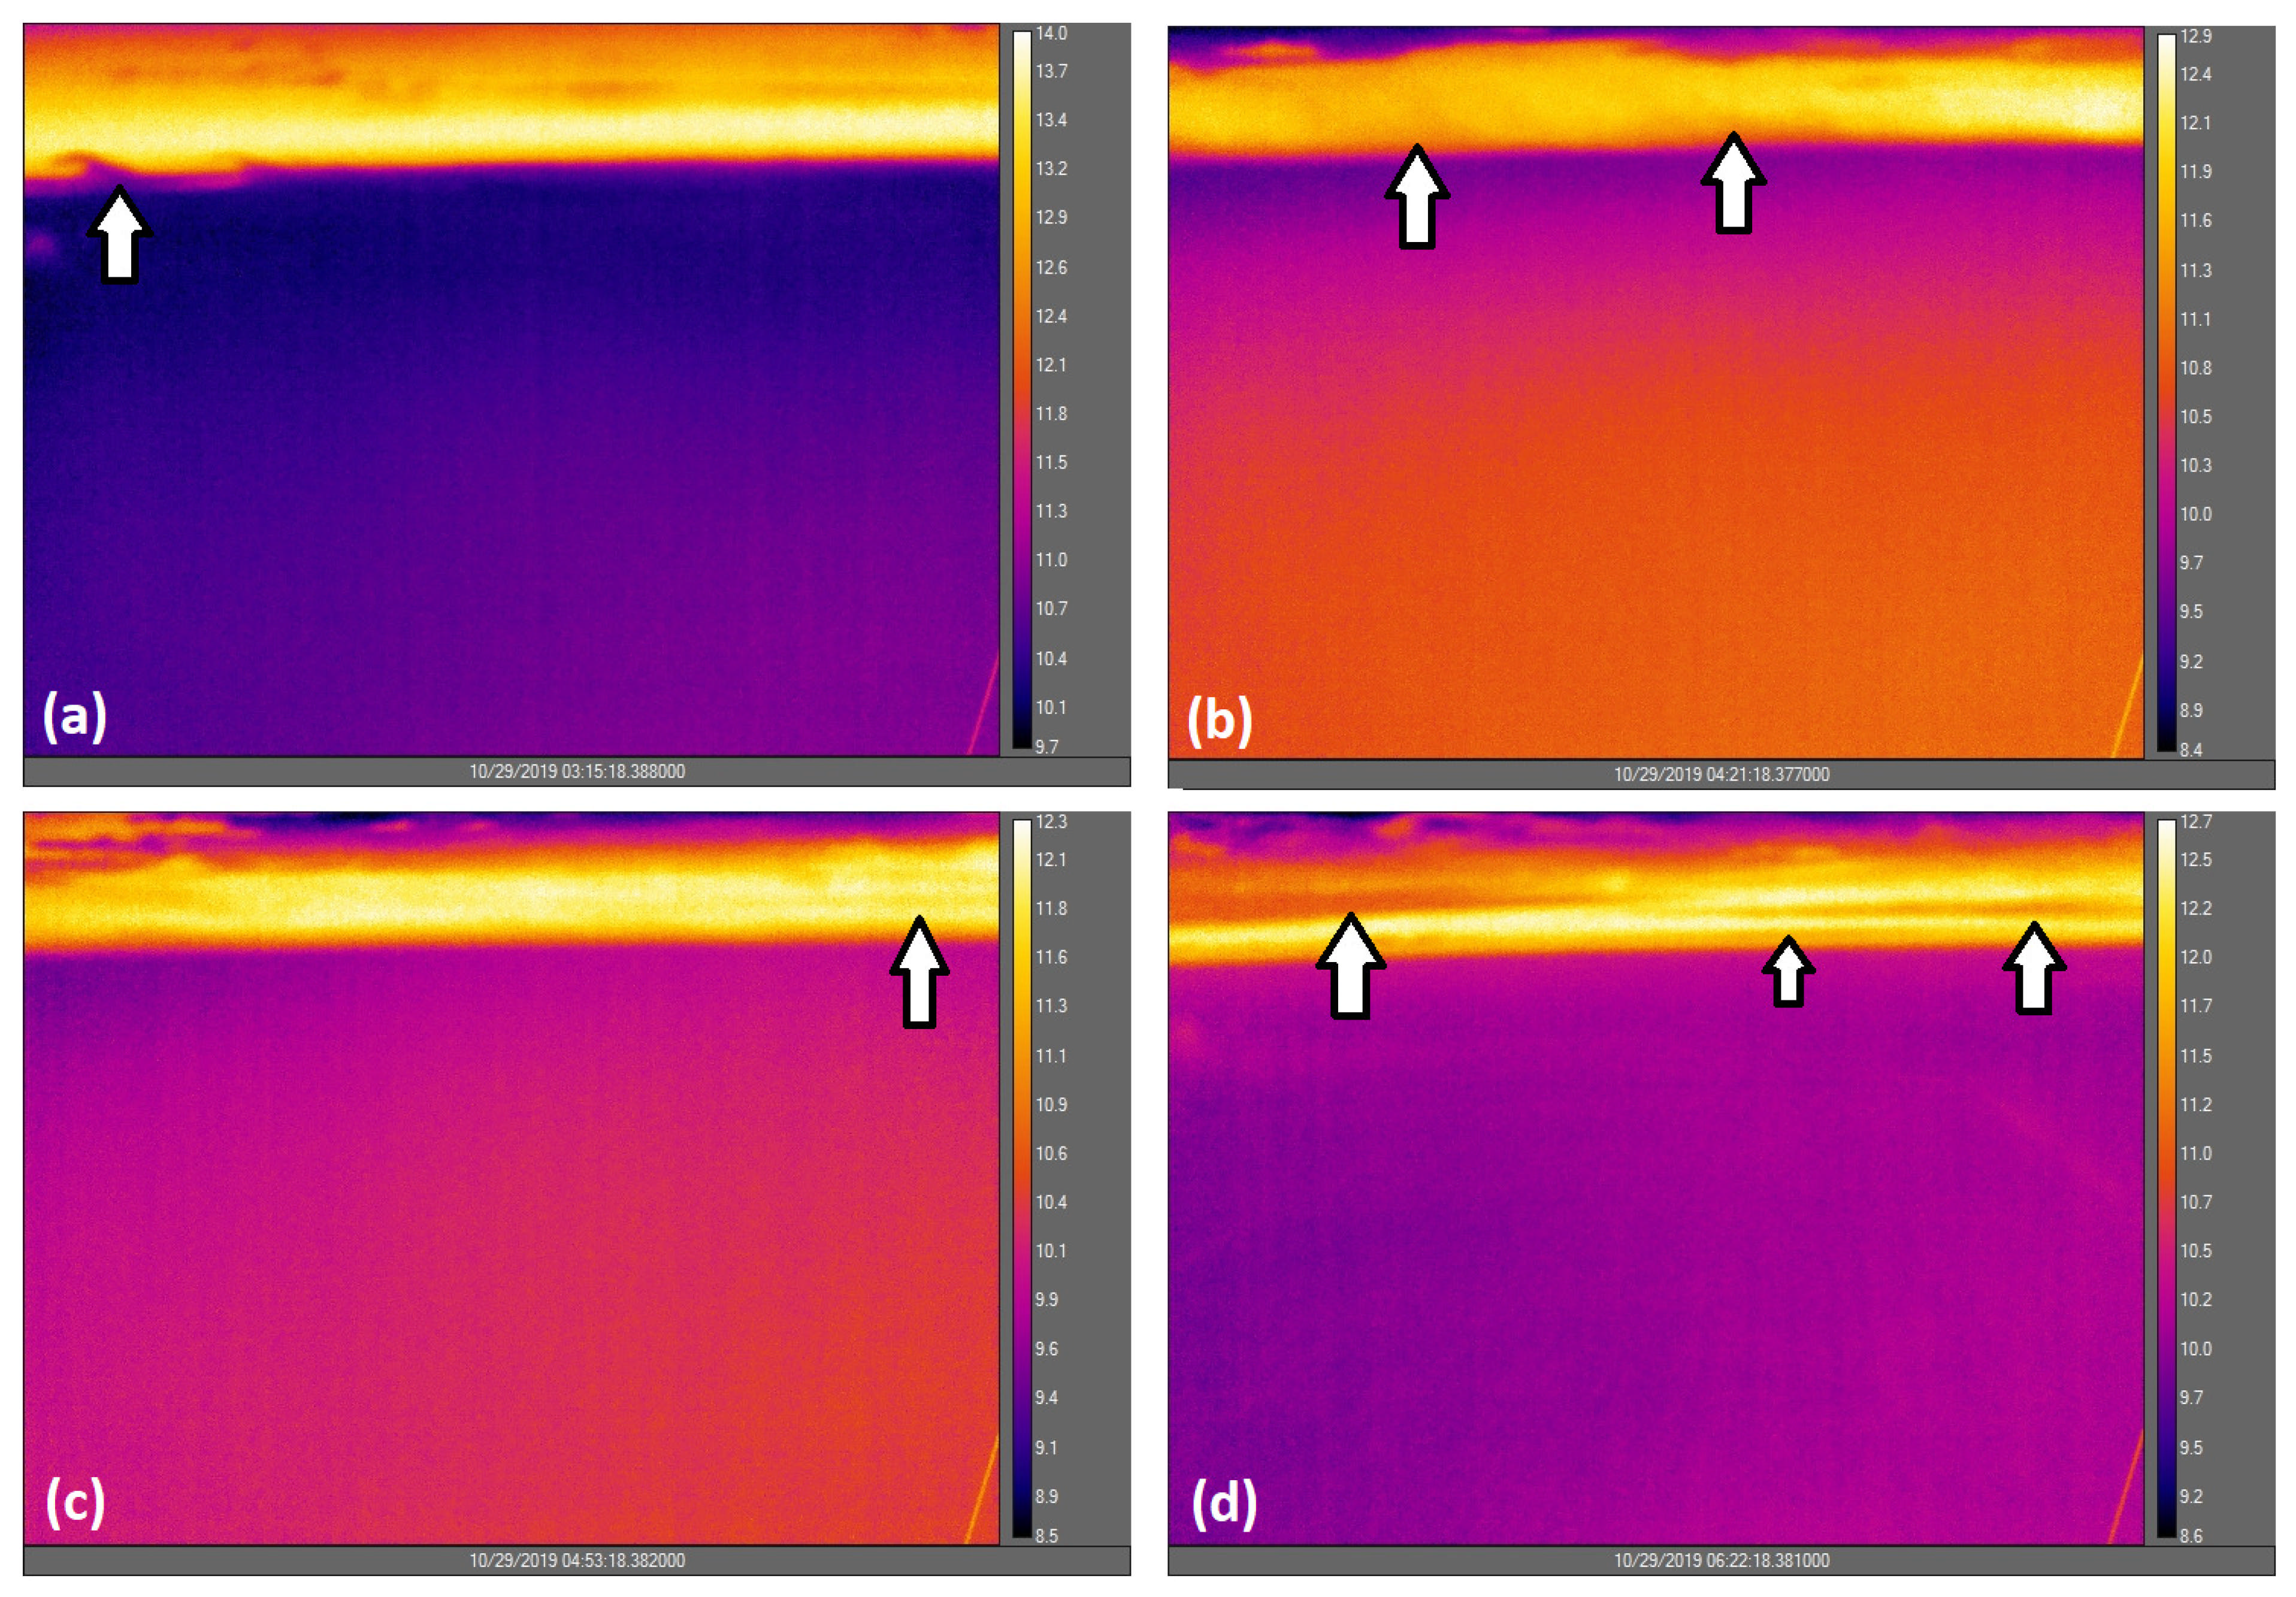
Unlike with other cases, we did not directly observe the fog lifting and breaking-off to form low stratus, but we did witness ‘streaks’ of low cloud above the fog layer on the horizon during the period of fog mixing with the air above; stills from the video are shown (Figure 9). In addition to these, we also observed isolated streaks of low stratus passing over the site from behind the camera at 06:00 UTC. At the same time, there was an increase in the vertical turbulence at 2 m and some dissipation of the fog at this height. These multiple low-stratus clouds were followed approximately 30 min later by a more persistent layer of stratus that lowered over the site, forming fog that remained present for the following four hours; this was observed by the ceilometer at the site and by a cloud radar at a site approximately 7 km to the north-west. Due to the presence of the isolated streaks of low stratus after mixing between the fog layer and the air above, and given that we have observed fog in previous cases lifting and forming these kind of break-away layers, it may be possible that these low clouds observed at 06:00 UTC developed from a fog layer elsewhere and advected to the site. The wind direction at 100 m at a site (Charbonniere) near the cloud radar was approximately 260°, suggesting that the stratus moved in a direction from this site towards the IR camera site (Le Couye). This agreed with the timings of when the downwelling longwave radiation increased and visibility decreased at another site near the cloud radar (Jachere) and at Le Couye. We do not have IR imagery from the Jachere site, but we are able to confirm from visibility measurements that radiation fog was also present at the site before the stratus arrived, highlighting the expansive area over which fog was present and therefore the possibility of fog breaking-off and forming streaks of low stratus which then travelled to the Le Couye site. The arrival of these stratus clouds at the site caused an increase in the downwelling longwave radiation at 2 m which coincided with the dissipation of fog at this height into mist. It is interesting that if these stratus clouds were formed from fog located upwind then they influenced the vertical development of fog downwind by limiting its growth.

3.3.2. 5 to 6 December 2019 Case

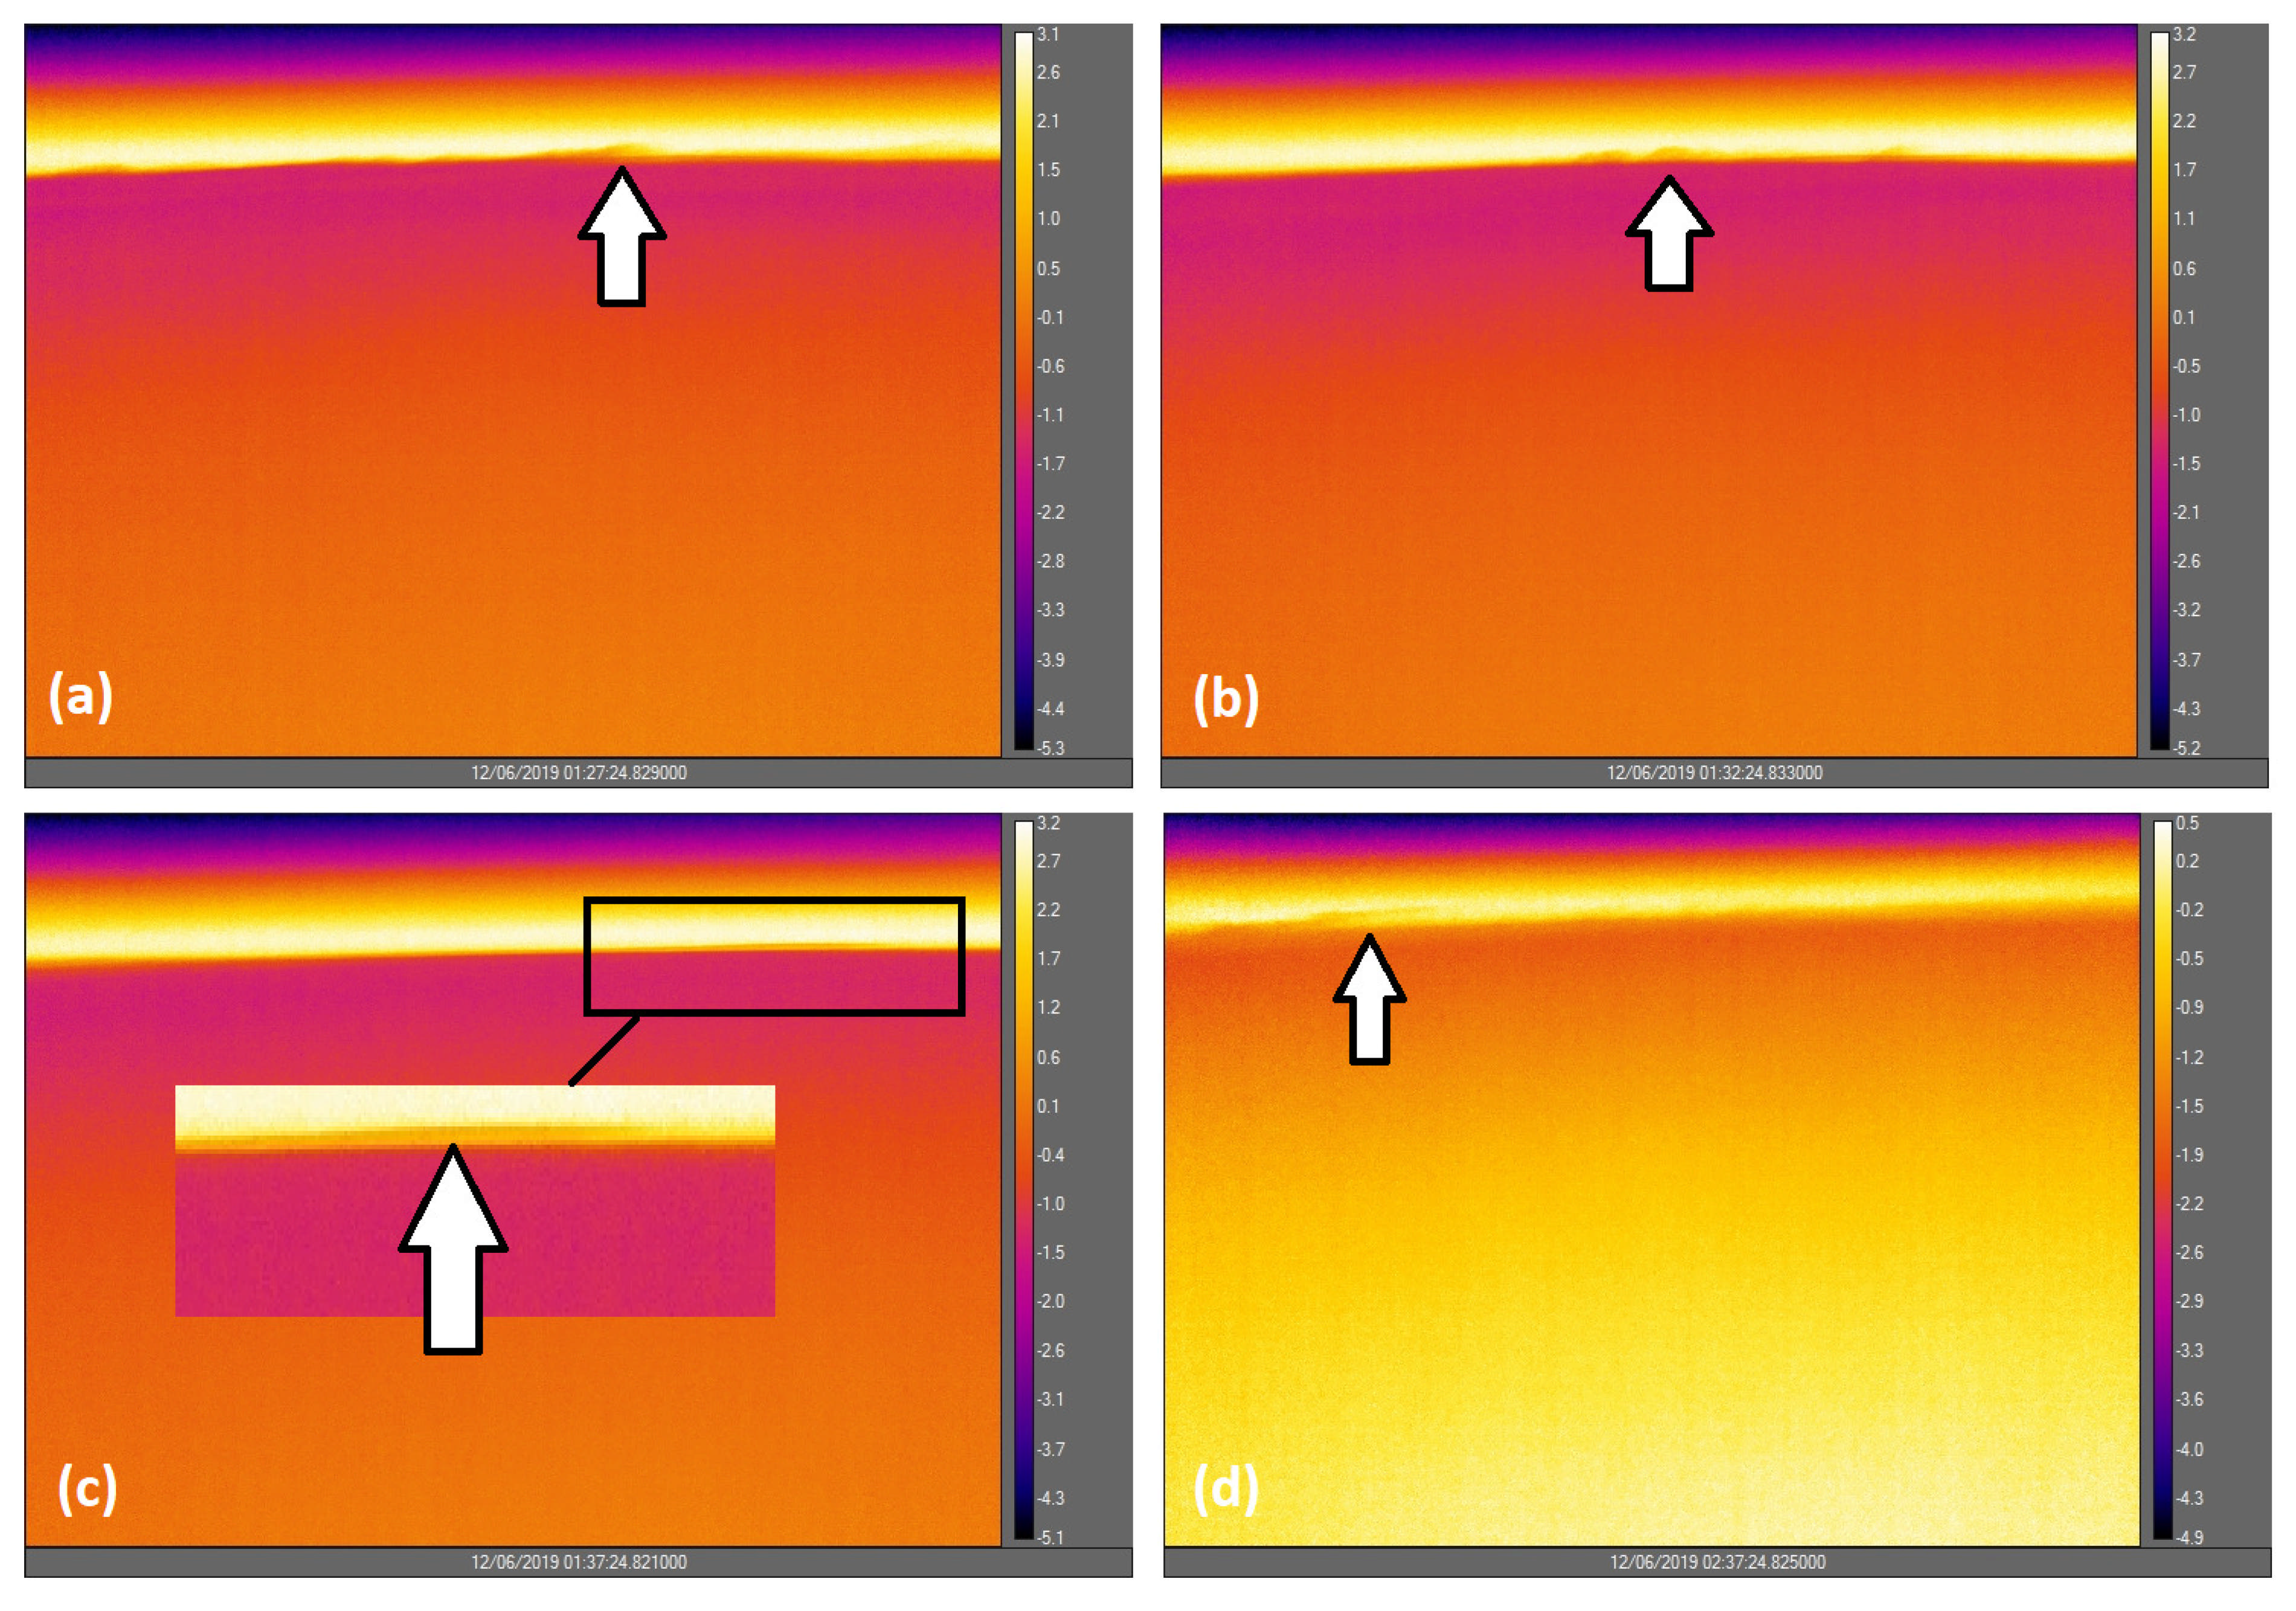
The beginning of this case was characterised by shallow radiation fog that was heterogeneous and could be seen in the IR camera video (Video S4) to be moving around the site and surrounding area in a ‘sloshing’ motion (again in the presence of variable wind direction at 2 m and 10 m). The shallow fog eventually developed vertically to at least 23 m by 23:30 UTC and remained persistent until 06:00 UTC (Figure 10a). It was between approximately 01:20 UTC and 01:40 UTC that sections at the fog top were seen to lift and break-off, mixing with the air above; stills from the video are shown (Figure 11). Please refer to the video for enhanced clarity. These breakaway sections of fog appear to dissipate in the air layer above. During this event, the fog across the whole of the camera’s field of view had just developed to above tree height, suggesting that the fog top in the surrounding area was similar to that at the site, approximately 23 m. While we observed the mixing between the sections of break-away fog and the air above, there was what looked like a layer of low stratus on the horizon that was slightly elevated above the radiation fog (Figure 11). This moved across the IR video while the mixing was occurring. The origin of this layer is not clear, but it was similar in appearance to the break-away sections of fog that we witnessed lifting and forming ‘strips’ of low stratus above the fog layer during other cases, i.e., 29 to 30 October 2019. Additionally, an hour later (02:37 UTC), we observed a section of fog lifting from the layer below to form low stratus (Figure 11d and Video S4); however, the fog deepened and obscured the camera view before we were able to observe the layer completely lift and break-away.
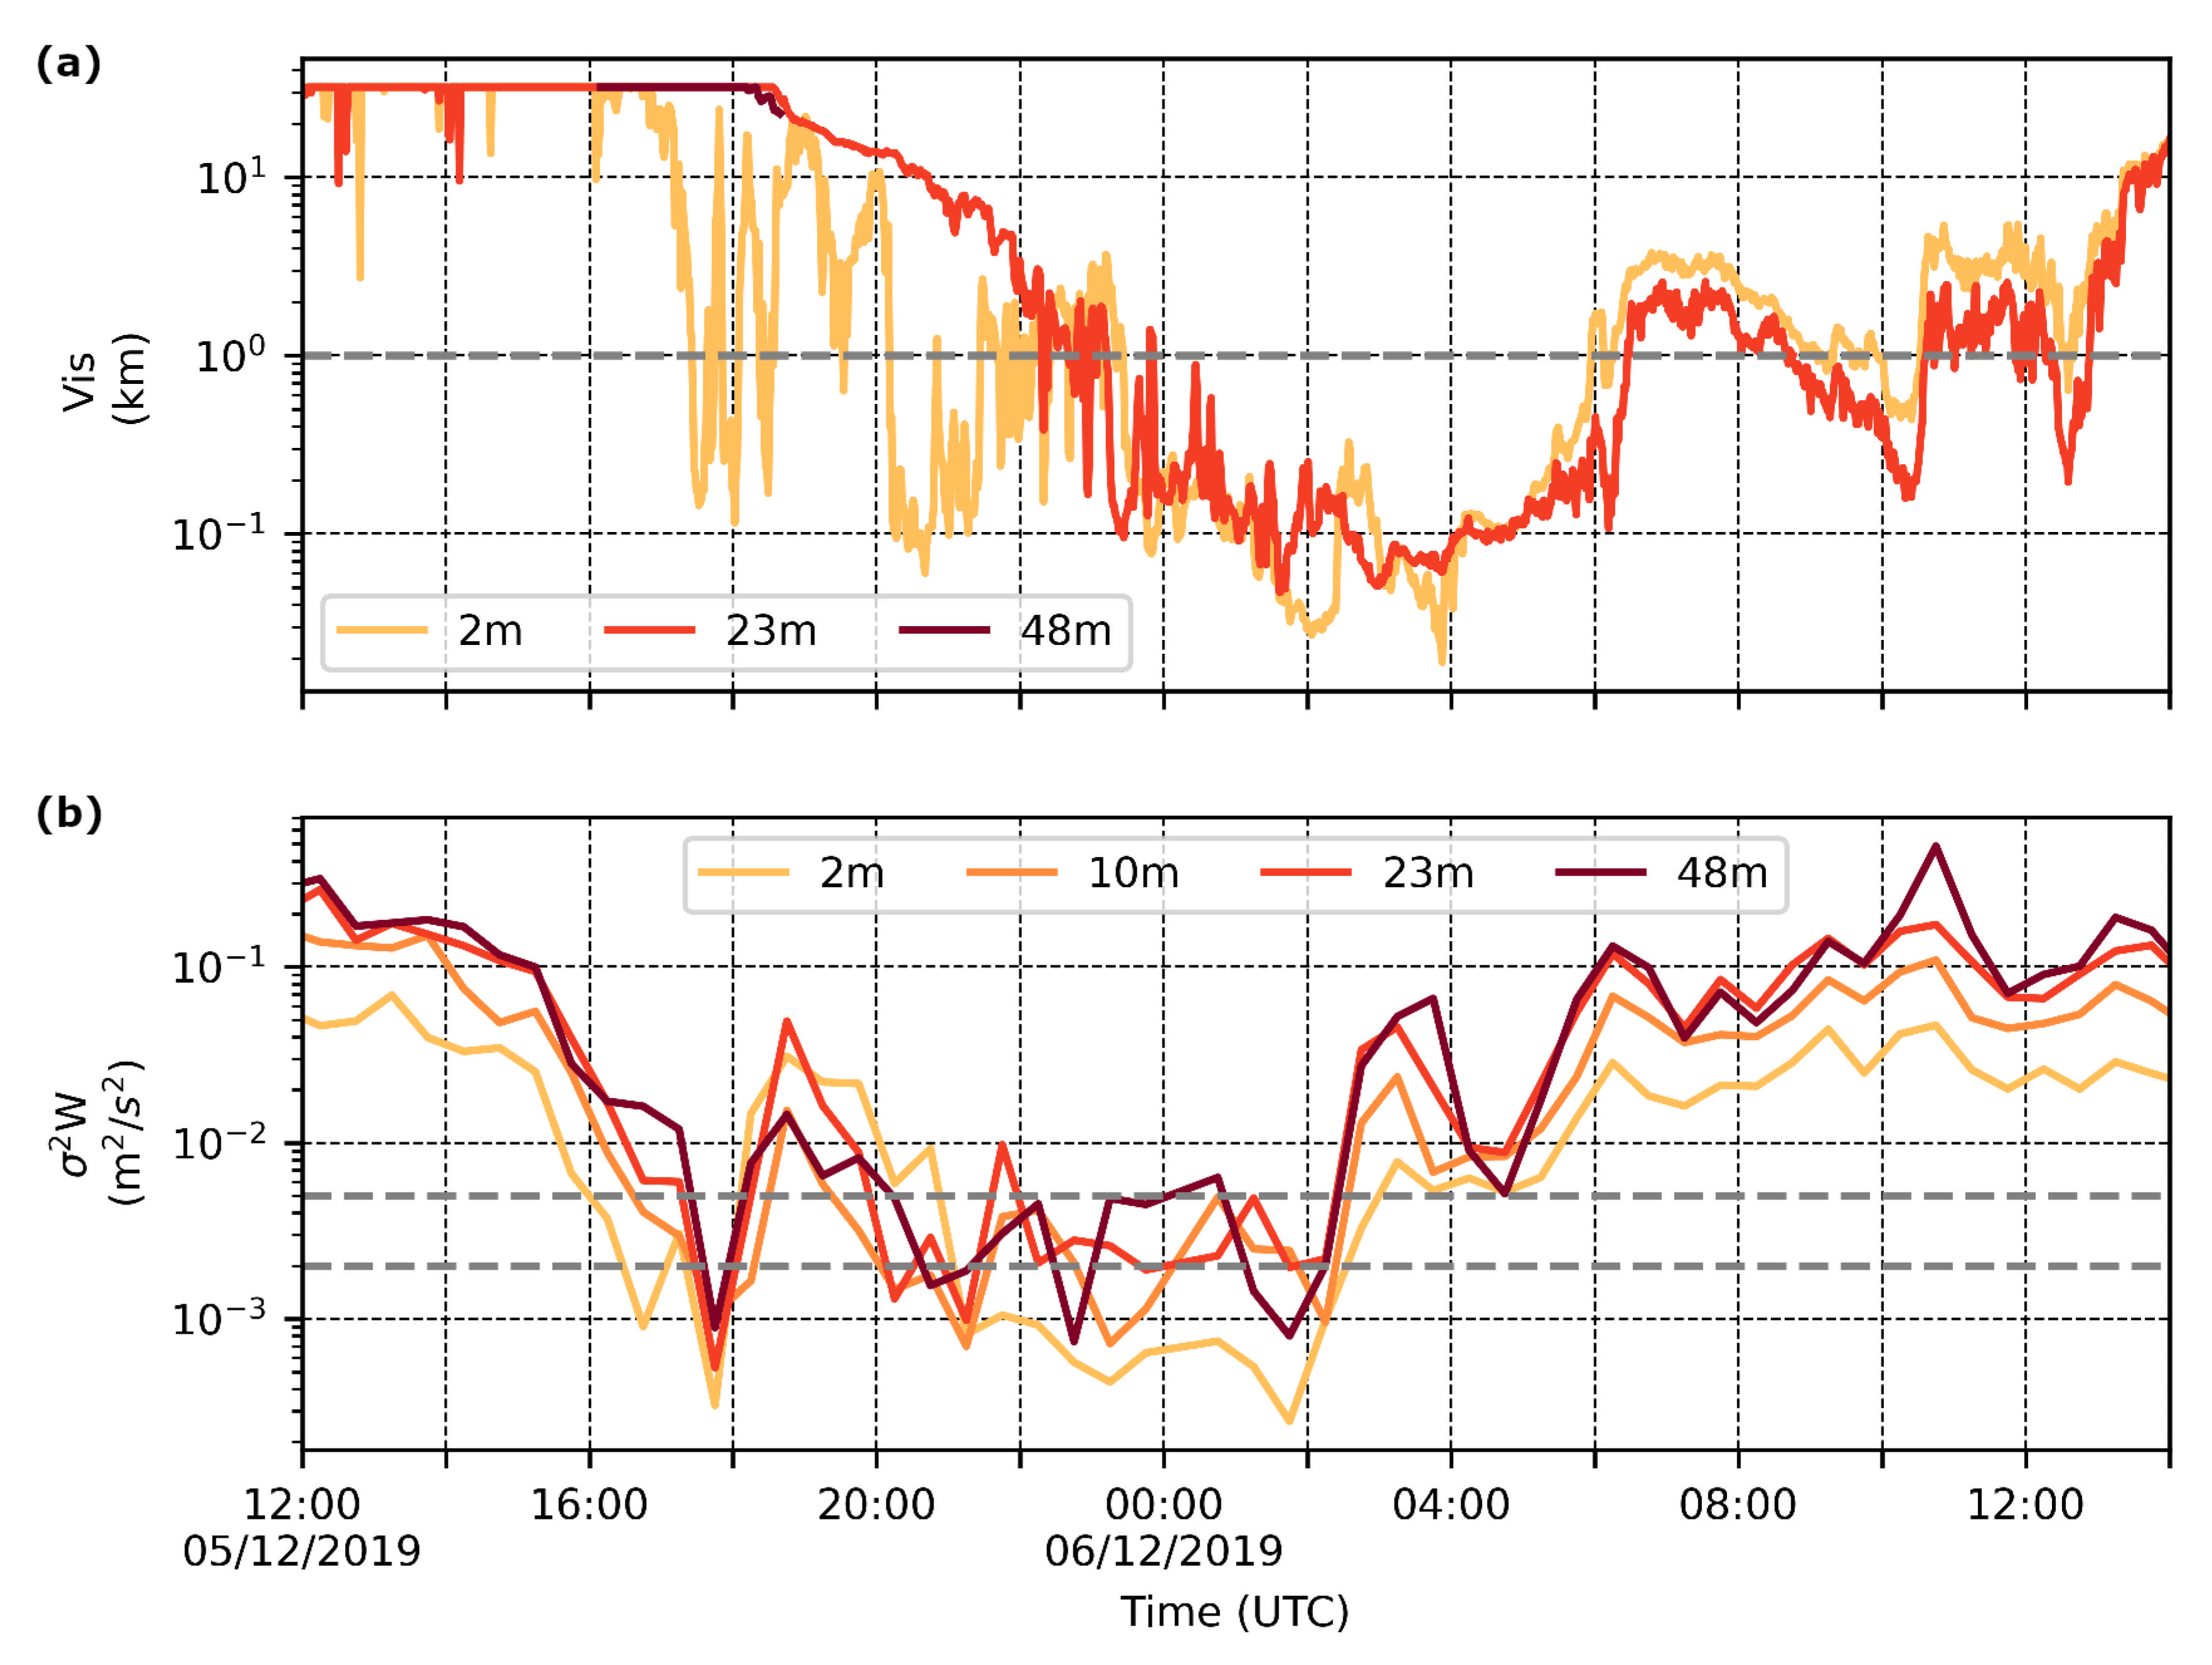
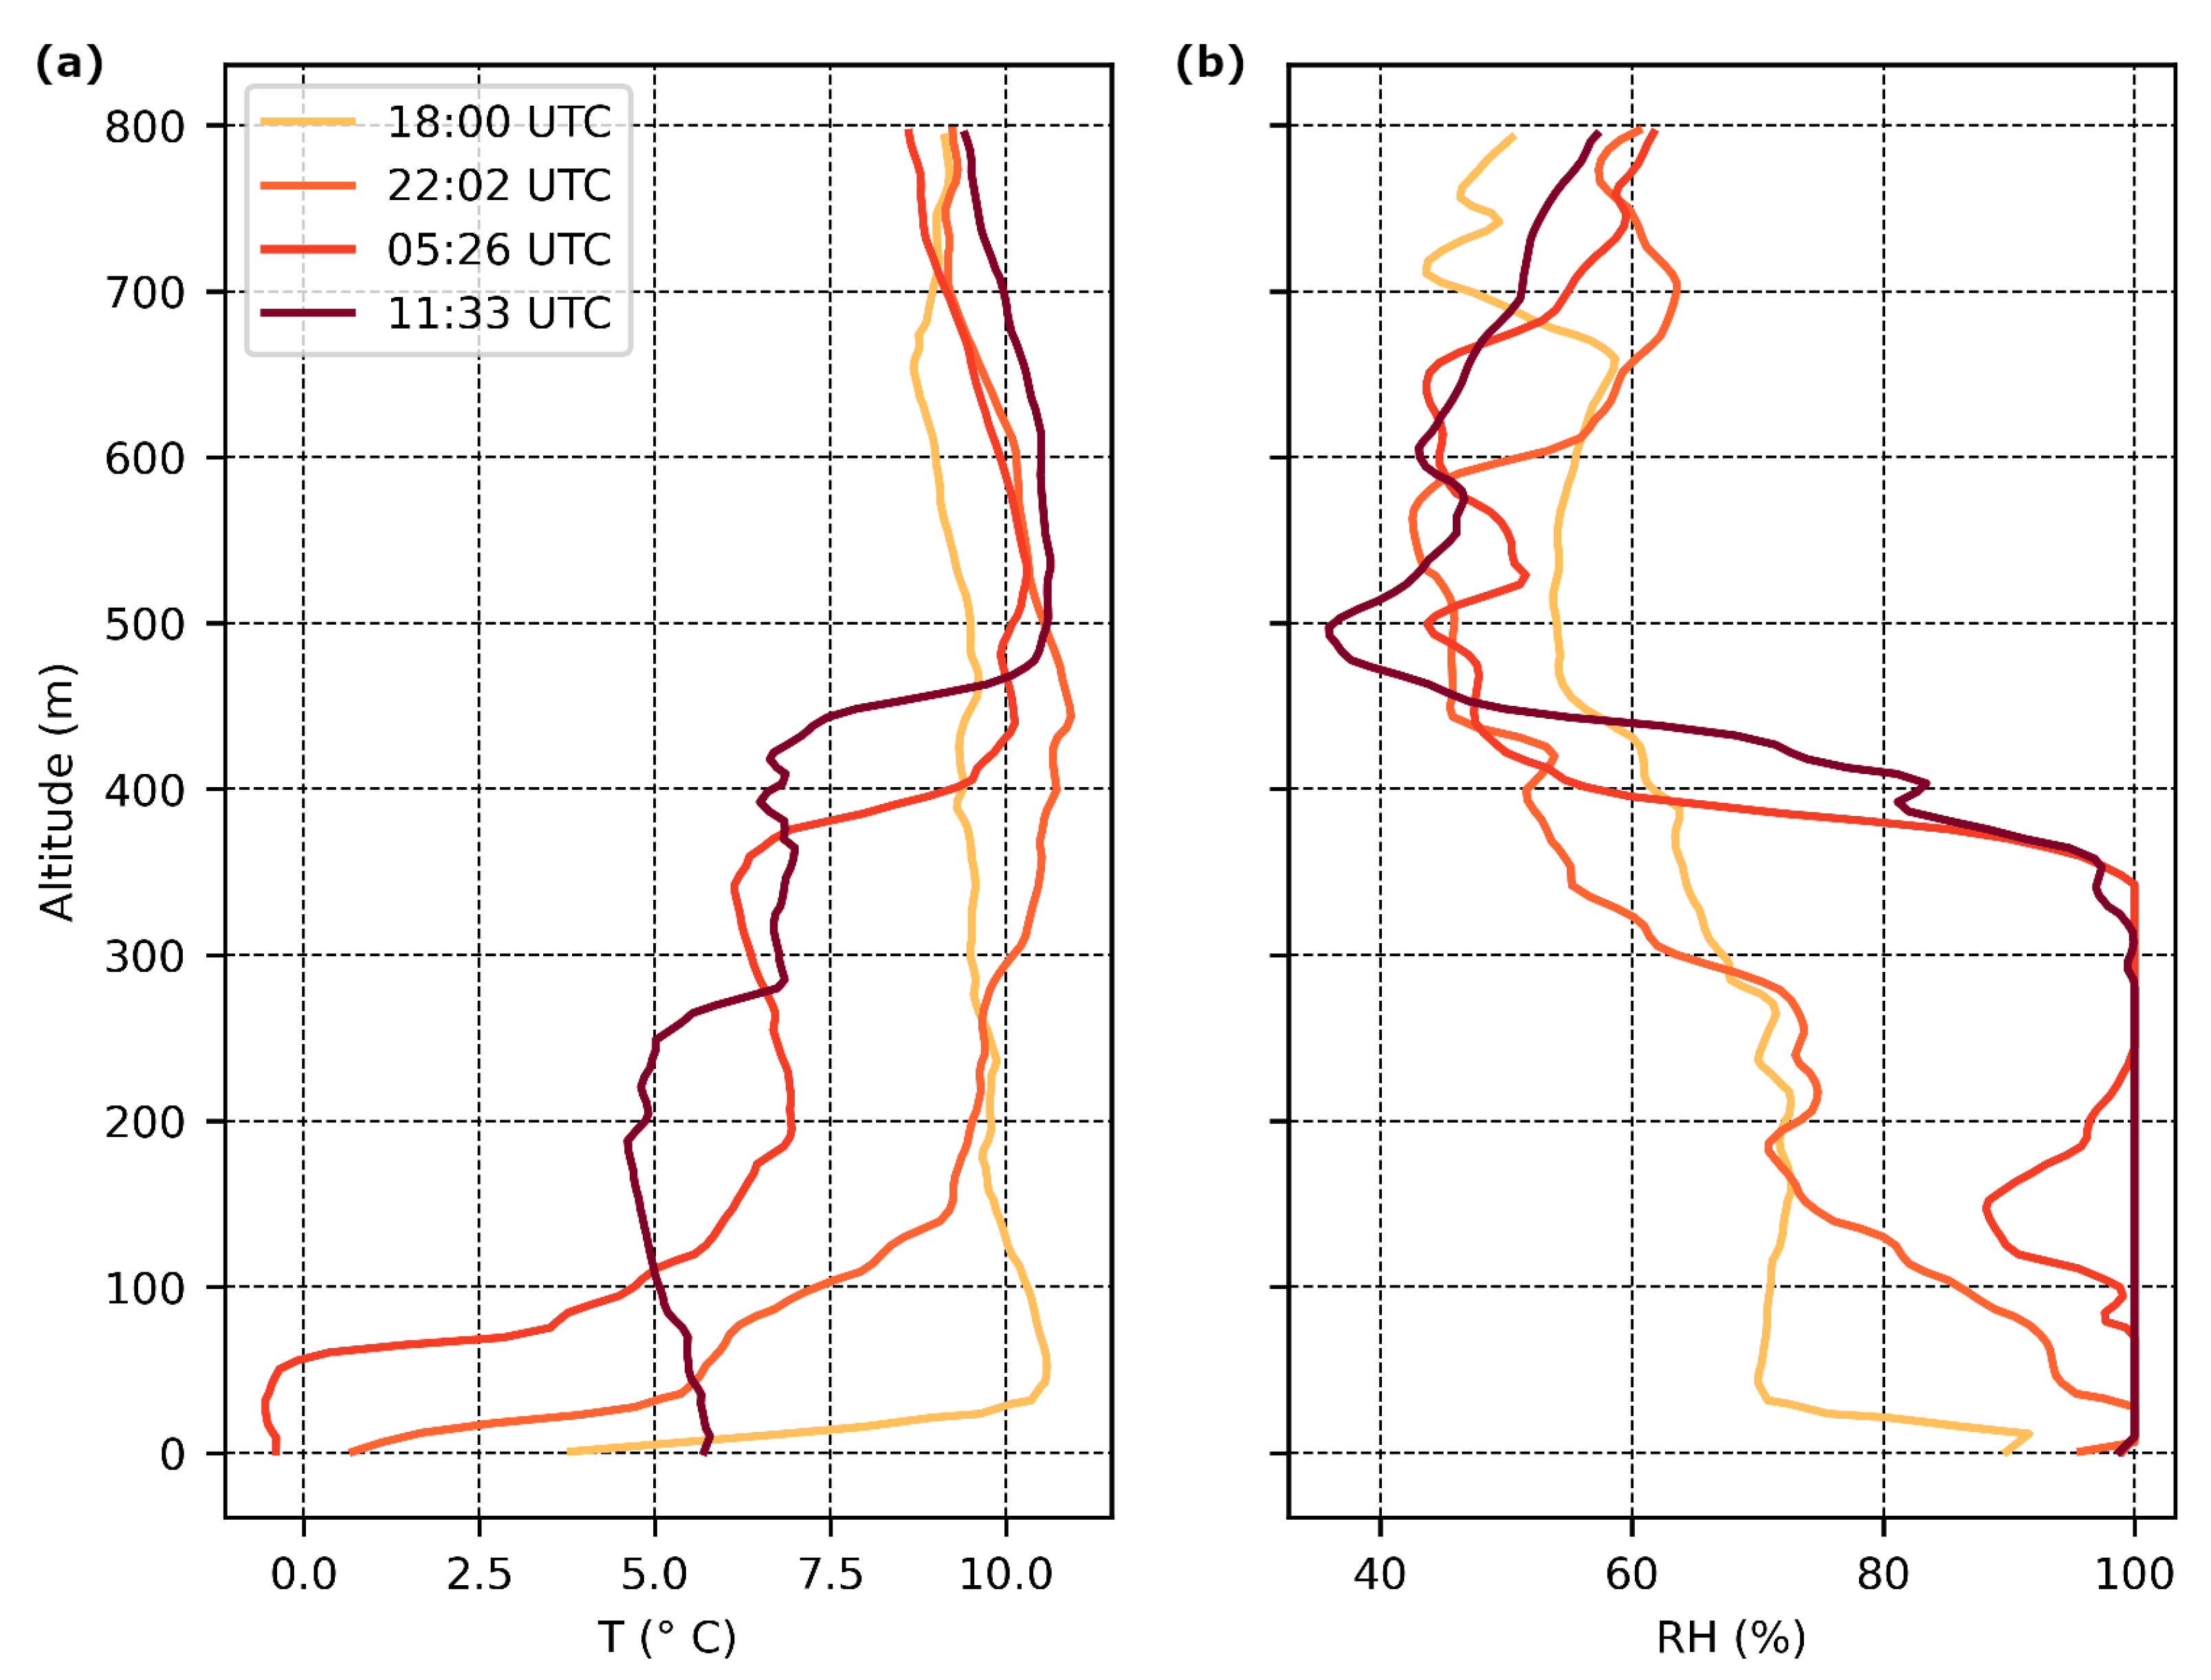
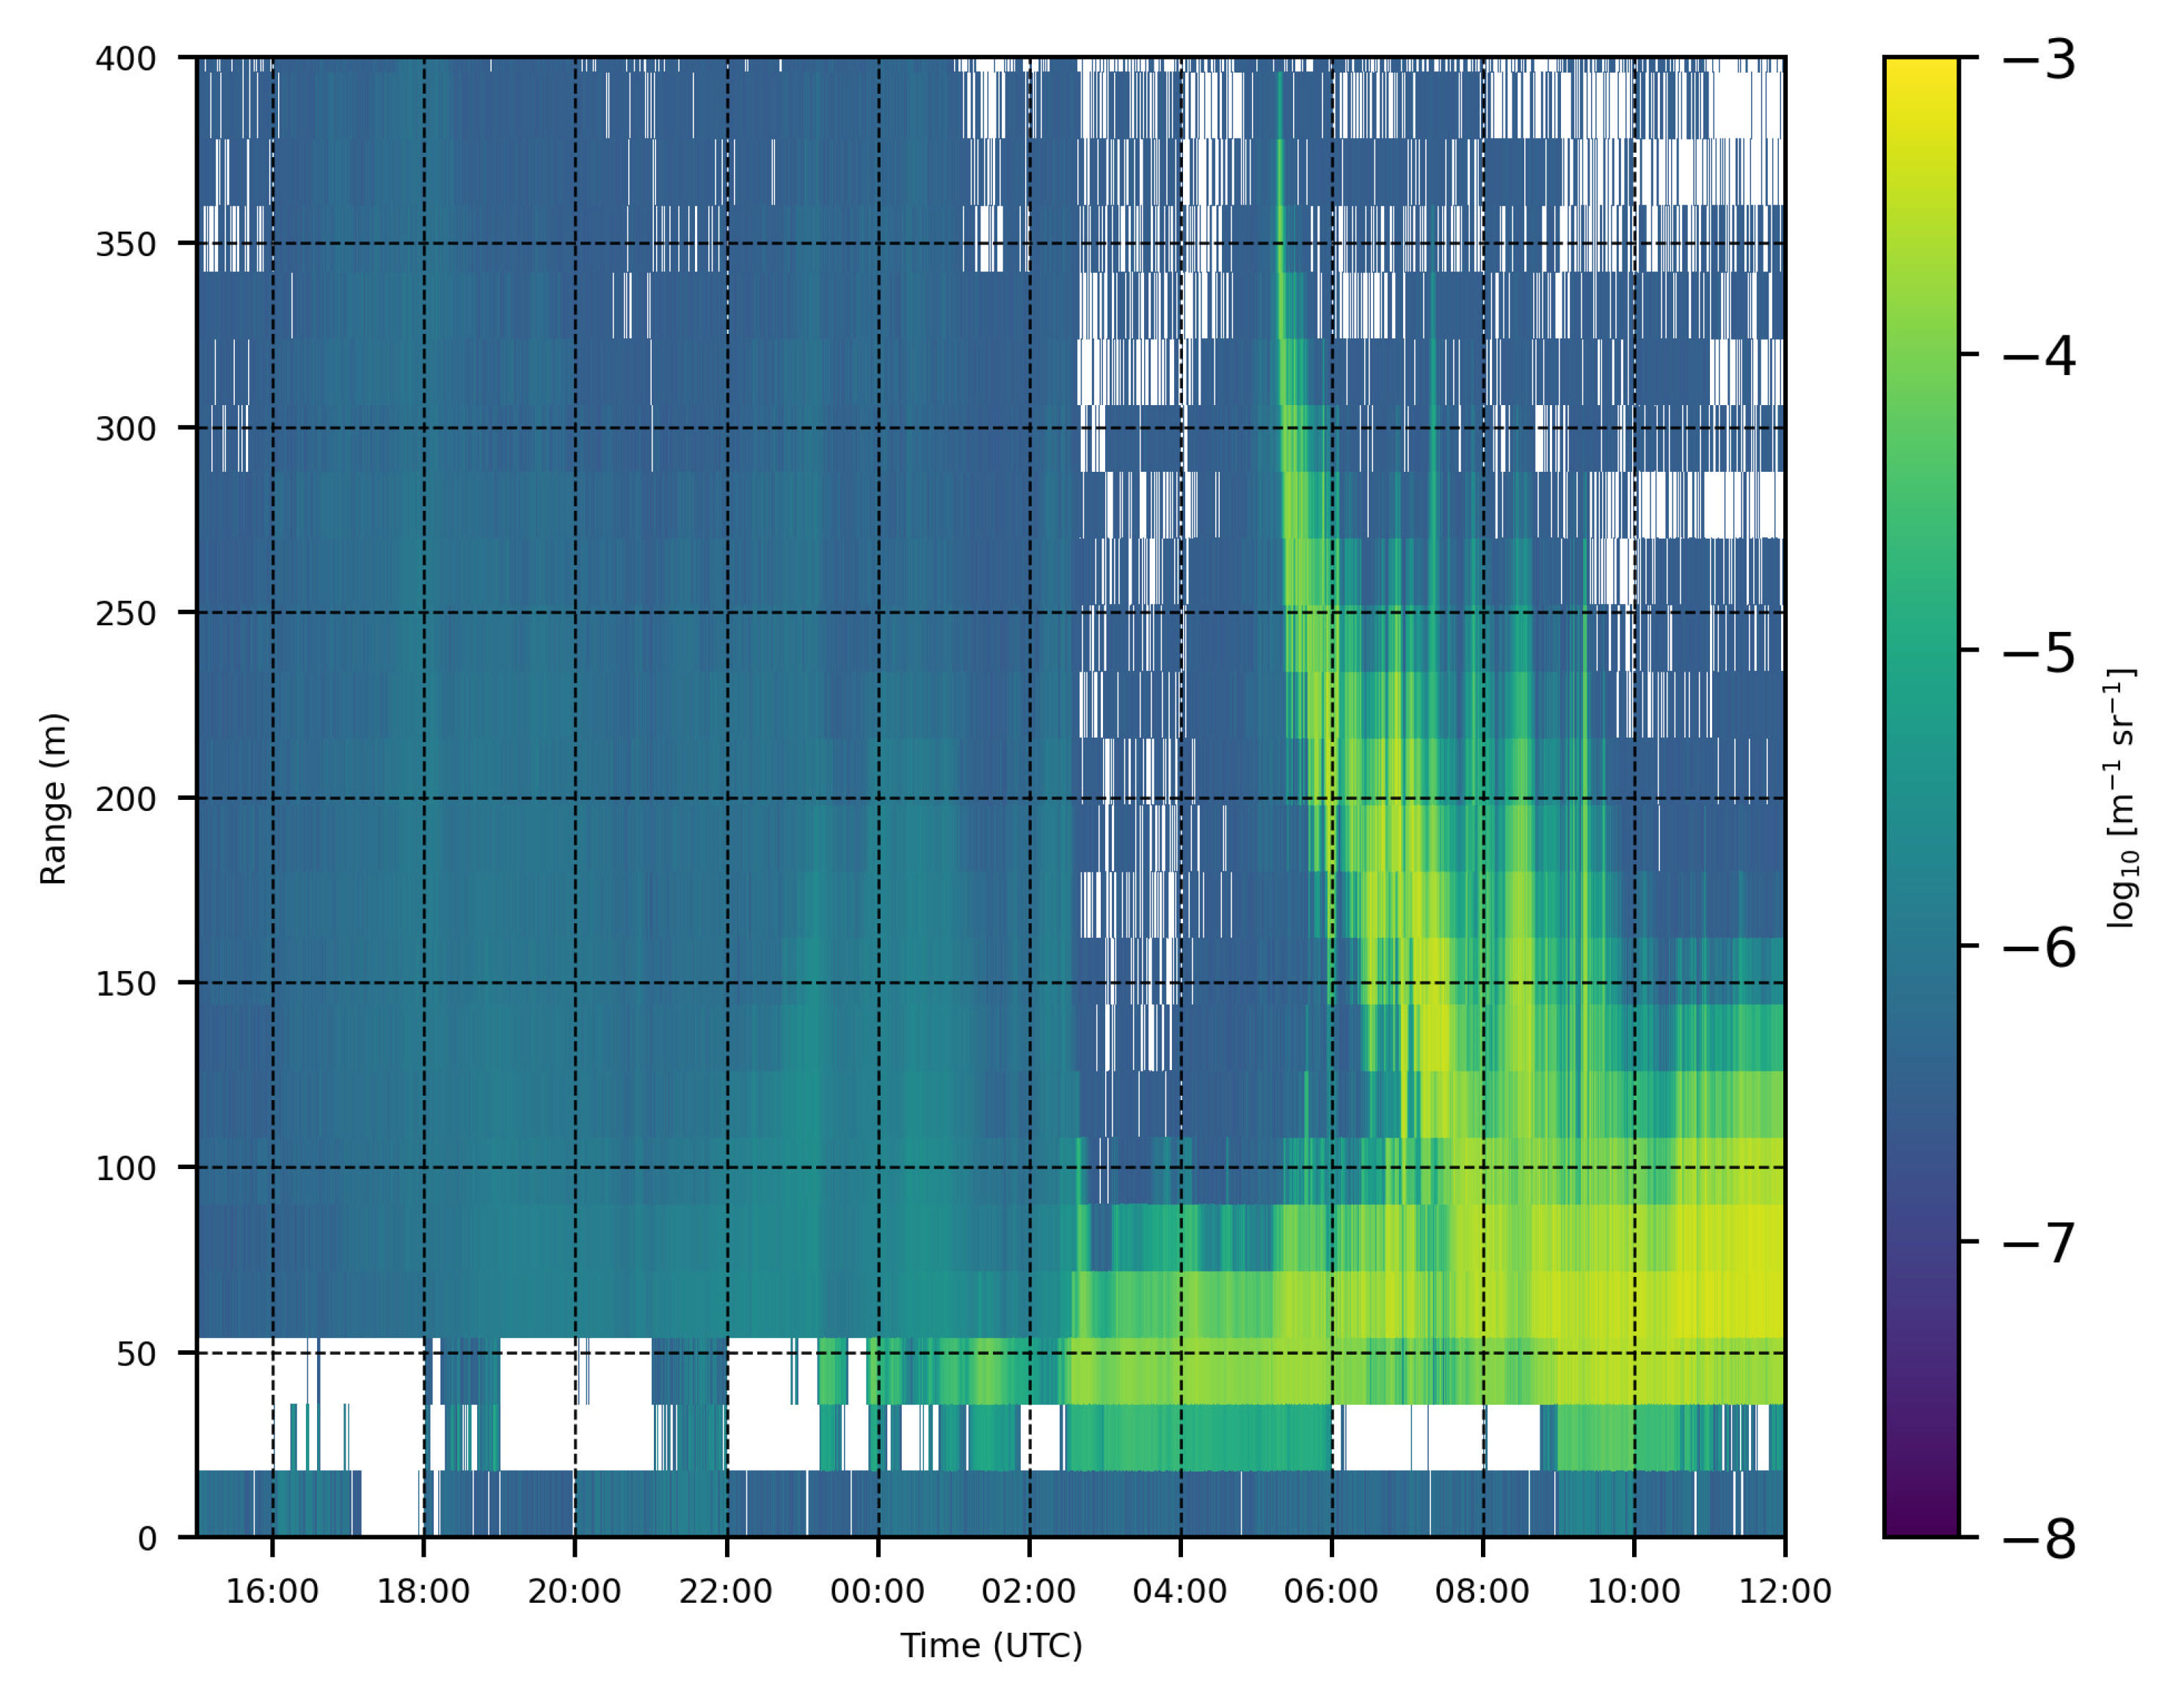
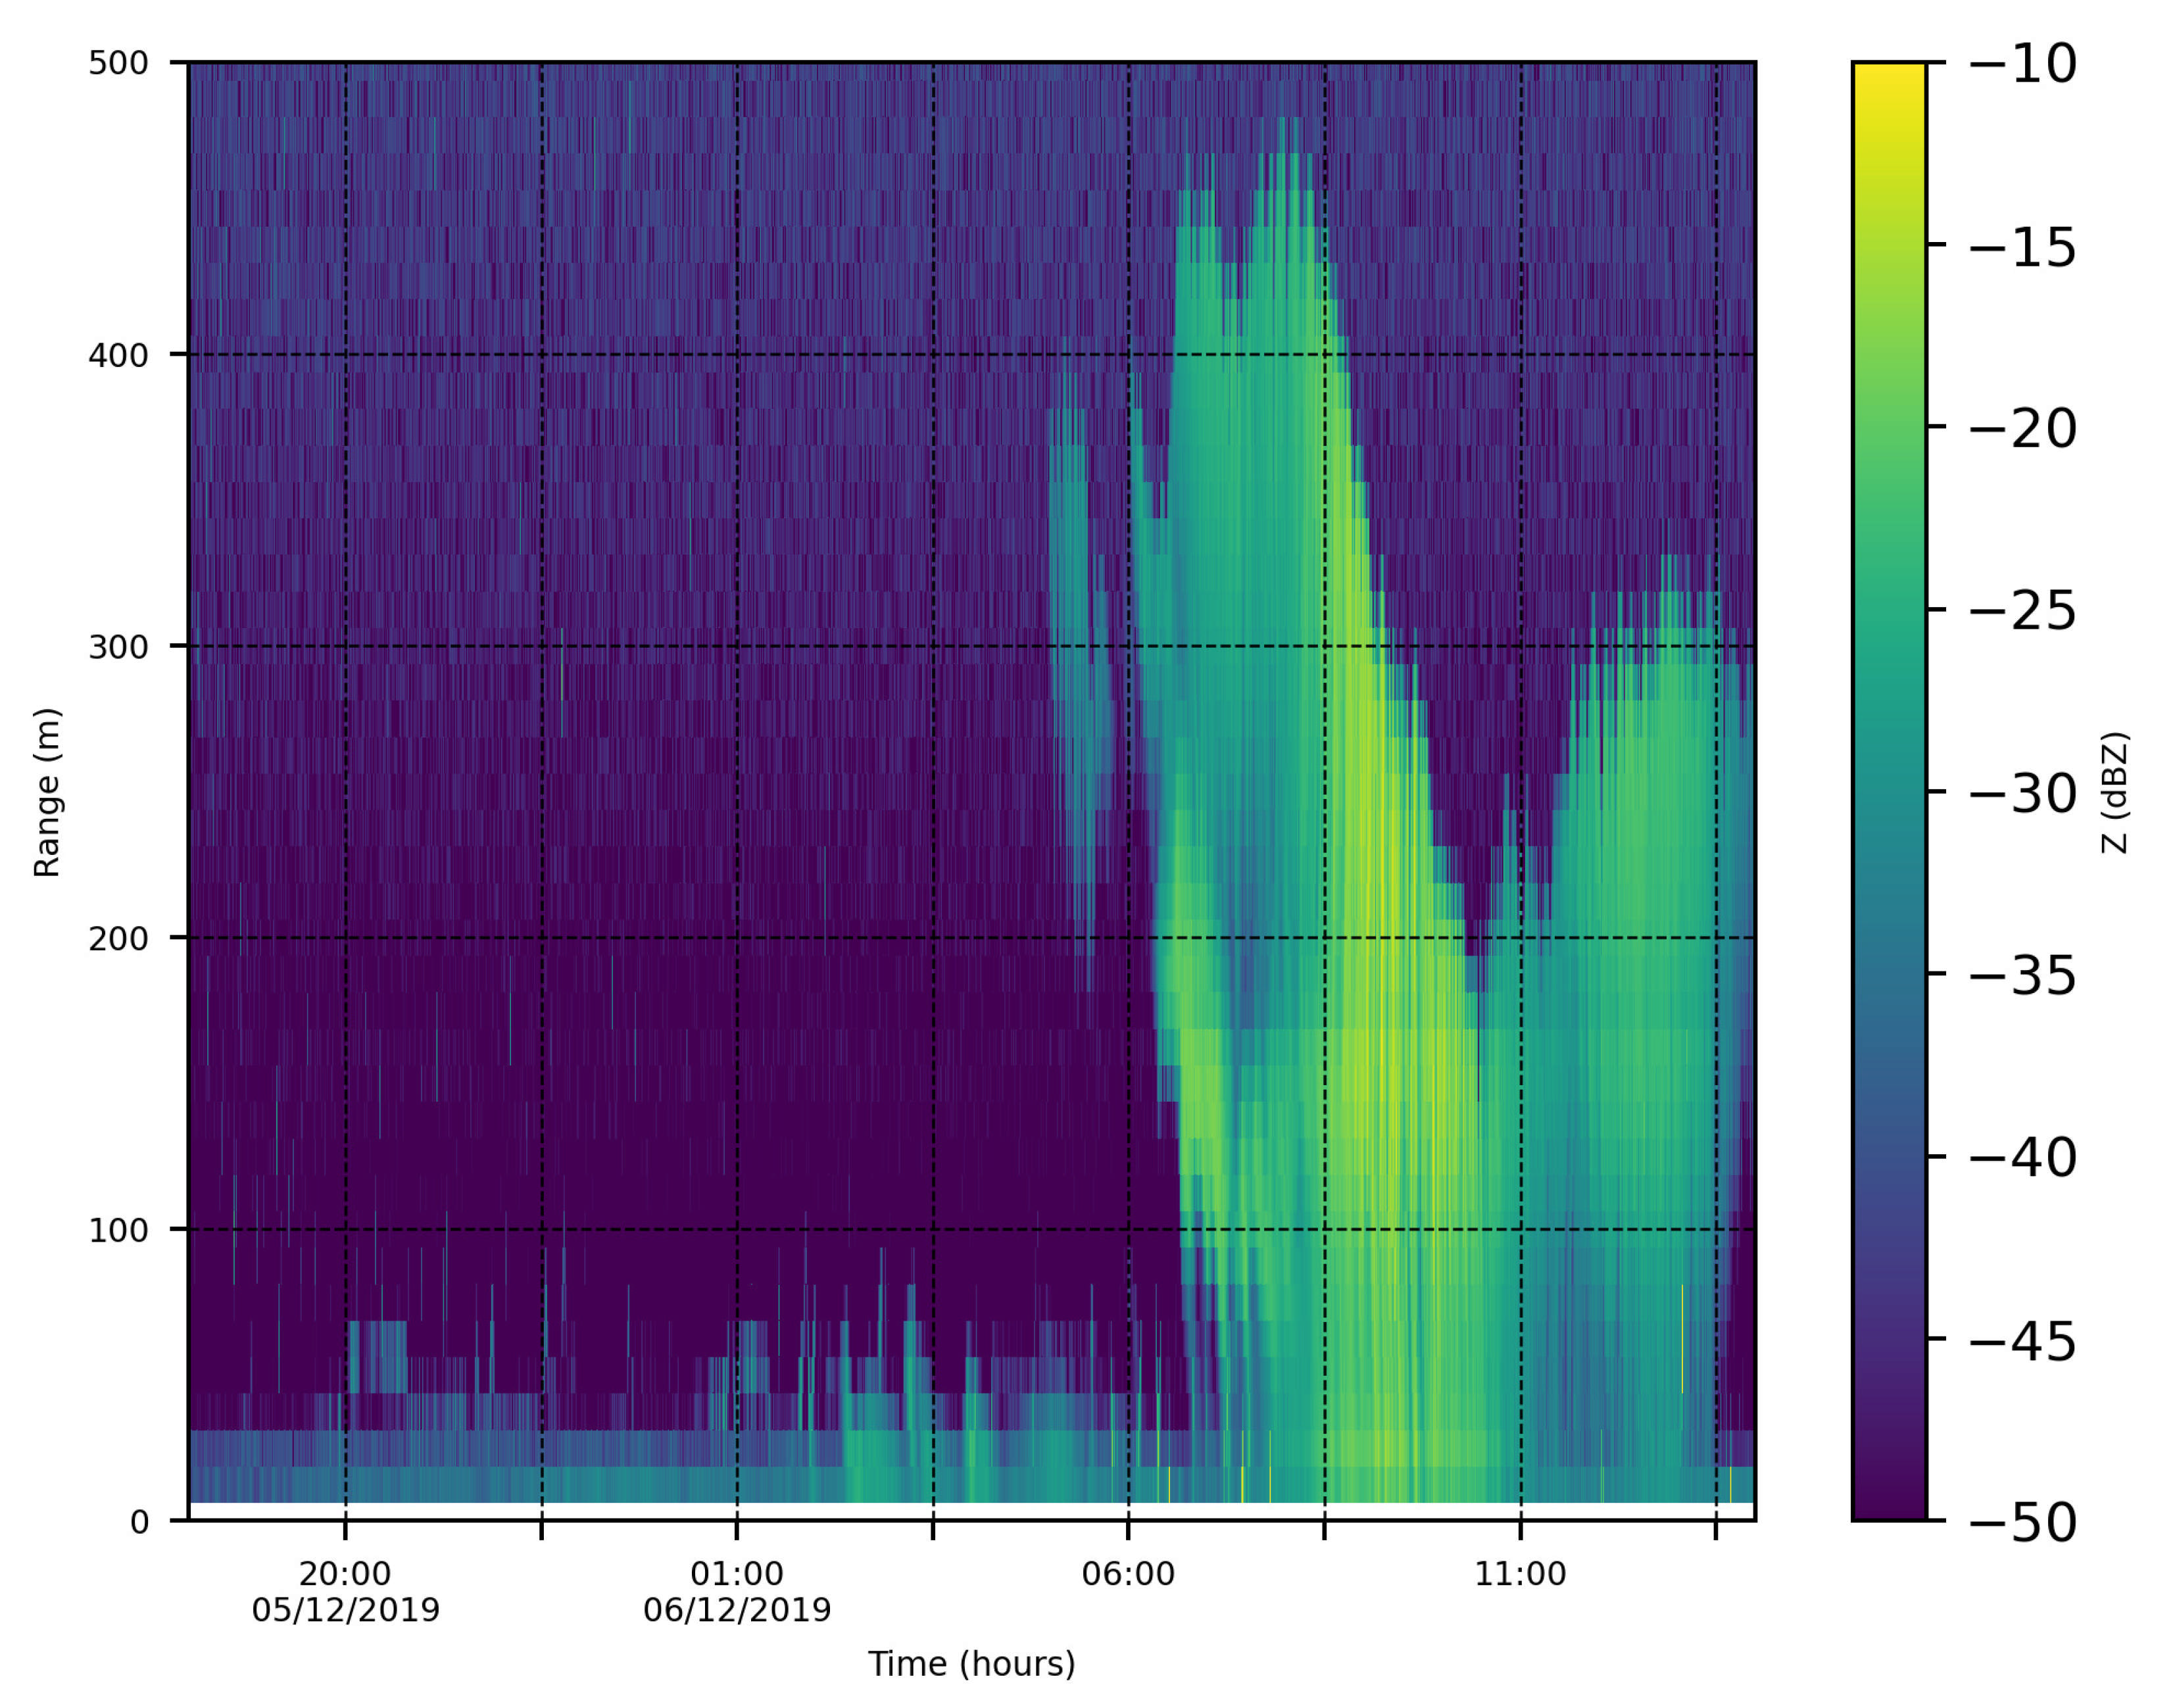
While the fog was observed mixing with the air above, from 01:20 UTC, the vertical turbulence at each height began to increase rapidly, suggesting the presence of increased turbulent mixing (Figure 10b). Within an hour of this occurring, the fog had rapidly developed vertically, covering the camera for the following two and a half hours. Radiosondes were launched from a site approximately 7km to the north-west of where the IR camera was mounted, which provided vertical profiles of temperature and humidity a few hours before and after the mixing was observed, at 22:02 UTC and 05:26 UTC (Figure 12). The data showed that there was cooling up to 500 m and moistening (in RH) from 30 m up to 400 m over the period that included the observed mixing, this being consistent with the notion that the air above the fog layer must contain high relative humidity before it can grow vertically. The lower 30 m (approximately) remained saturated throughout, as radiation fog was consistently present below this. The RH profile from after the mixing had occurred (05:36 UTC) also showed that saturation was present between approximately 230 m and 340 m. The LiDAR at the IR camera site confirmed that at this time, low stratus had appeared over the site (Figure 13). Also at this time, approximately 05:30 UTC, the vertical turbulence at each height began to increase rapidly again, the downwelling longwave increased, and the temperatures at all heights began to increase, most likely as a consequence of the stratus layer. The fog then began to dissipate, becoming mist; this could be seen in both the visibility data and the IR video. In the latter, the fog quickly became less optically dense, and by 06:00 UTC, the camera could resolve some detail on the ground. At the top of the IR images, a persistent layer of stratus was present. An interesting aspect of this case is that this layer appeared to gradually lower to the ground, resulting in a drop in visibility to below 1 km at 2 m and 23 m by 09:00 UTC, which lasted for approximately one and a half hours before the stratus then lifted. We expect that this was a case of stratus lowering, but an alternative explanation to the apparent lowering of stratus is that it may be a region of stratus spawning that advected over the site. This would be possible in the presence of higher winds with increasing altitude whereby the source of the spawning is not stationary but propagates downwind (as seen for the 30 to 31 March 2020 case). The fog and lifting fog would therefore be detected by the LiDAR in order of height with time, which could look like stratus lowering to the ground. However, in this case, the cloud radar data (Figure 14) from Charbonniere suggests that the depth of advecting fog would have been in excess of 350 m; at Le Couye and Charbonniere, the fog that was present before the advection event was between 50 m and 100 m deep. We expect therefore that for this specific case, we observed stratus lowering at the Le Couye site as opposed to stratus lifting from fog which then advected to the site. The reason why these deeper layers of stratus lower and merge with fog remains unexplained.

3.4. Mixing Followed by Apparent Stratus Lowering (31 October to 1 November 2019)

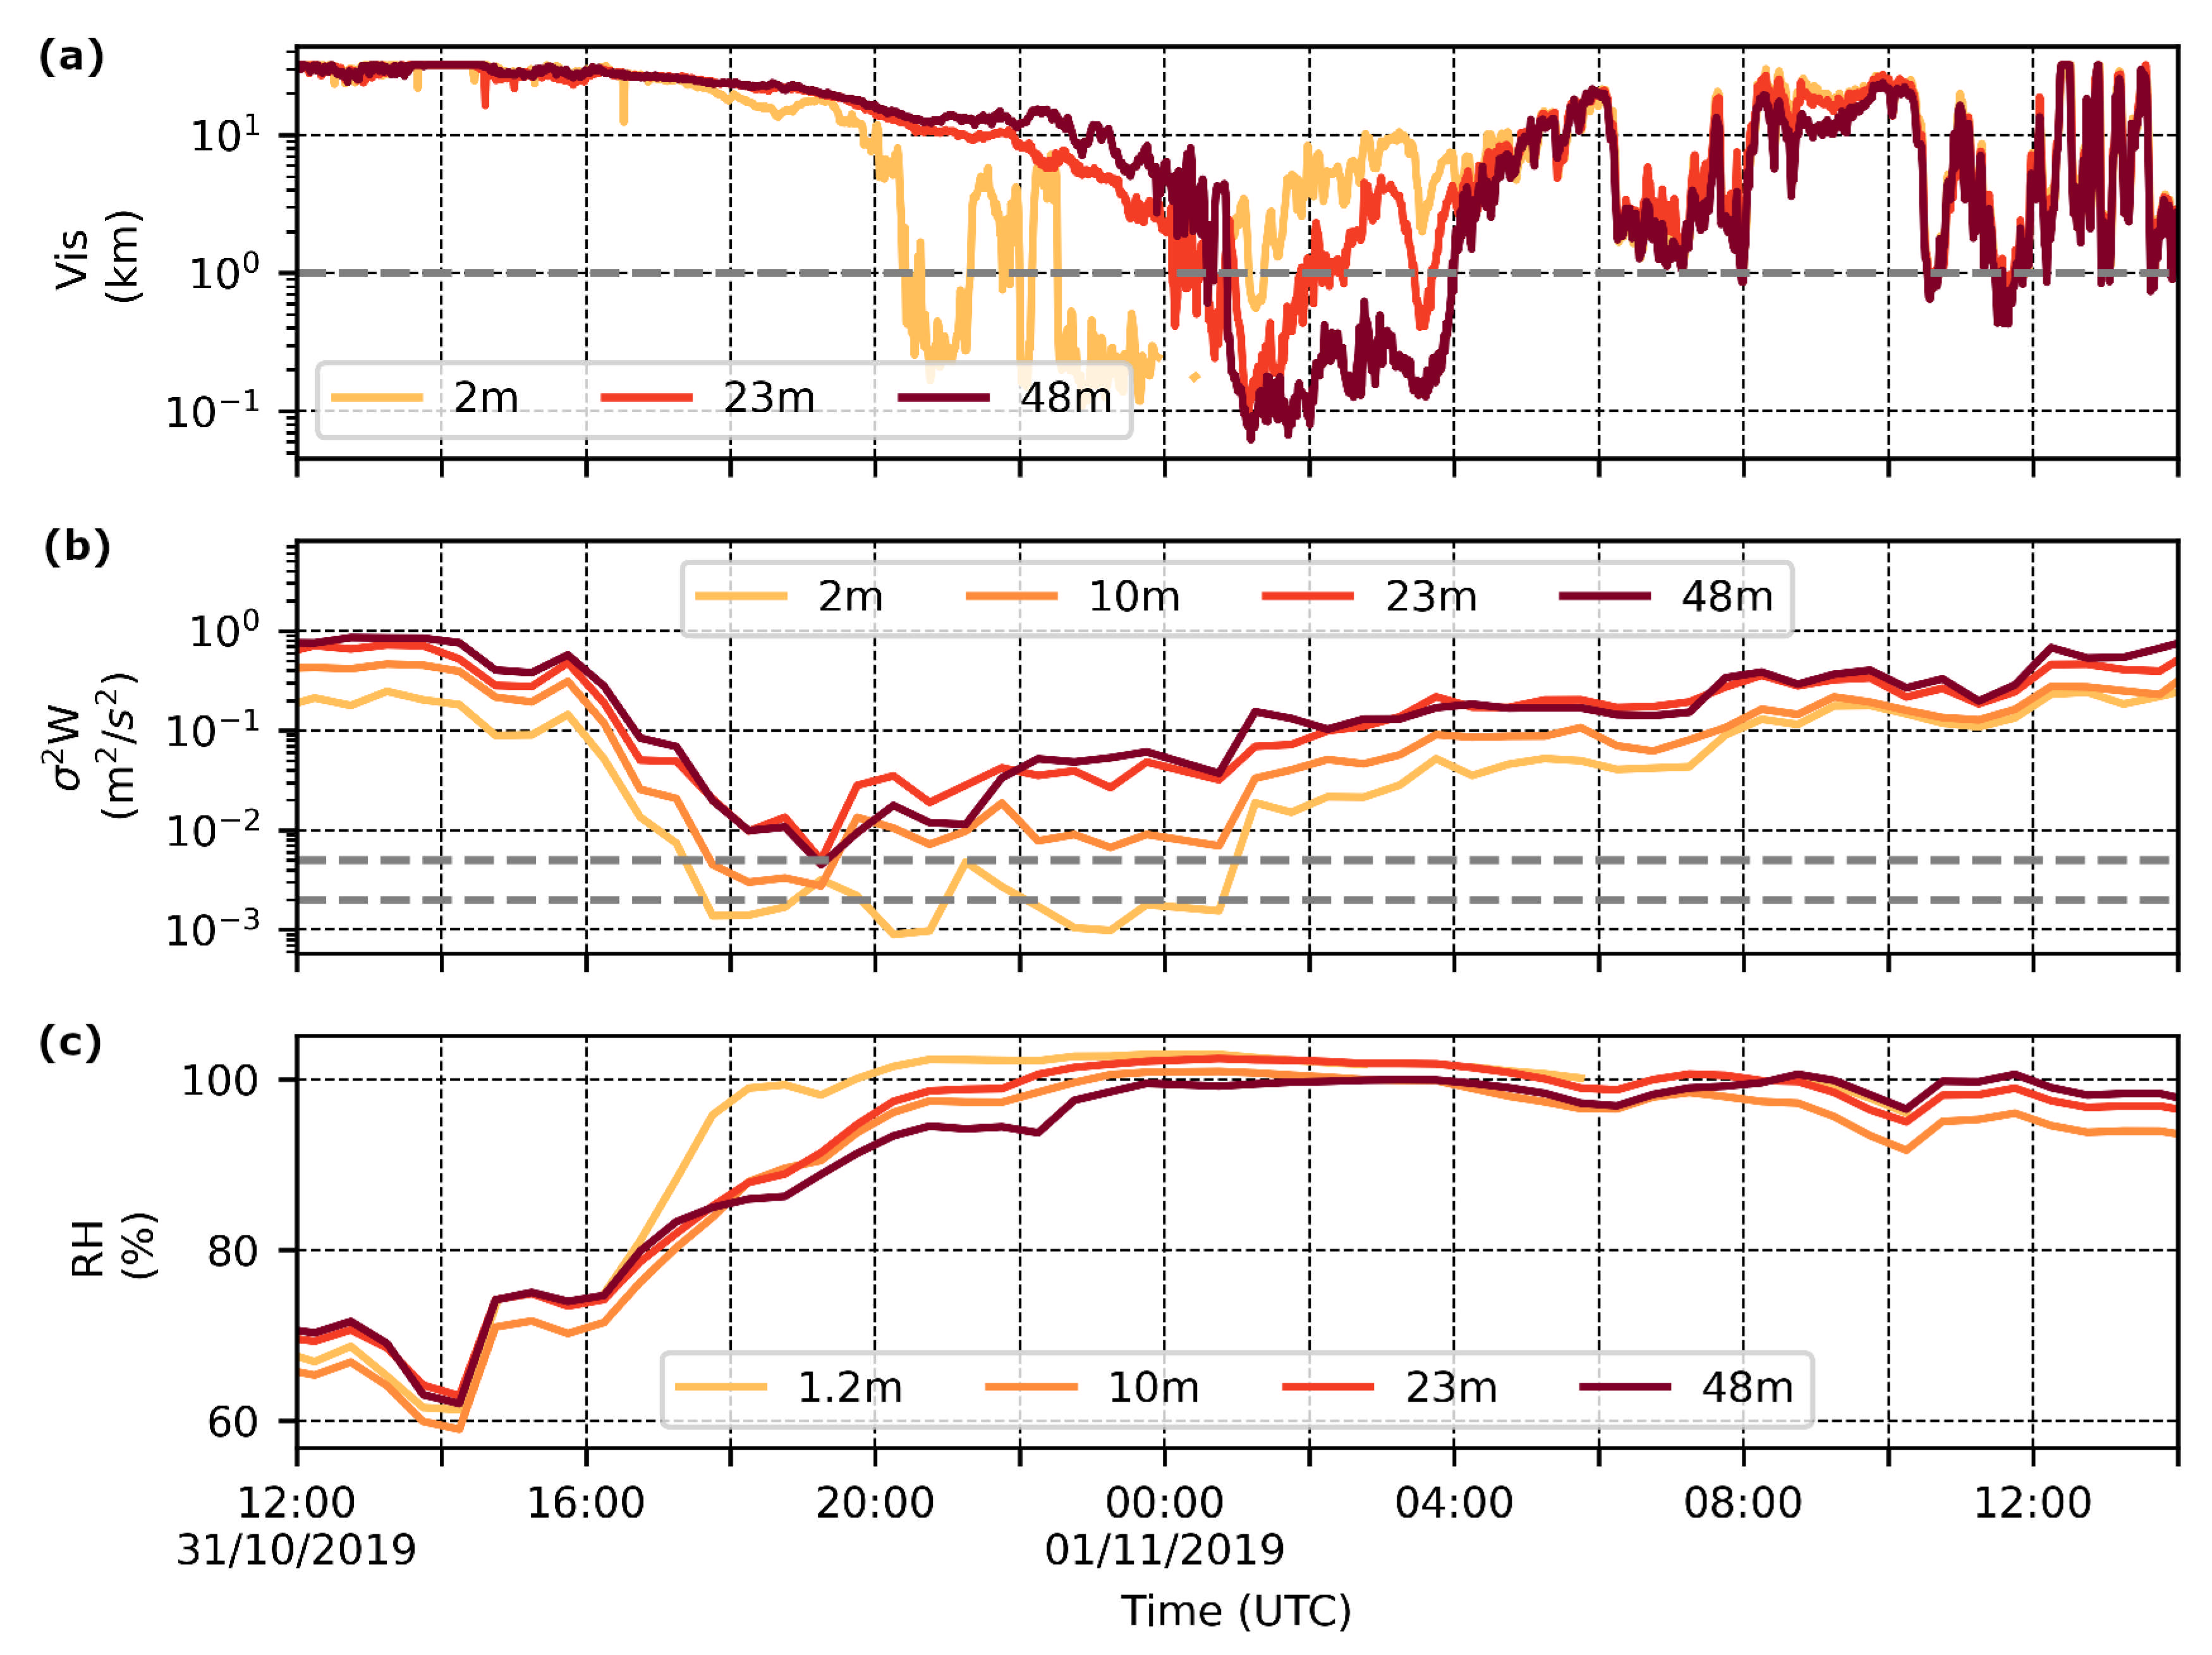
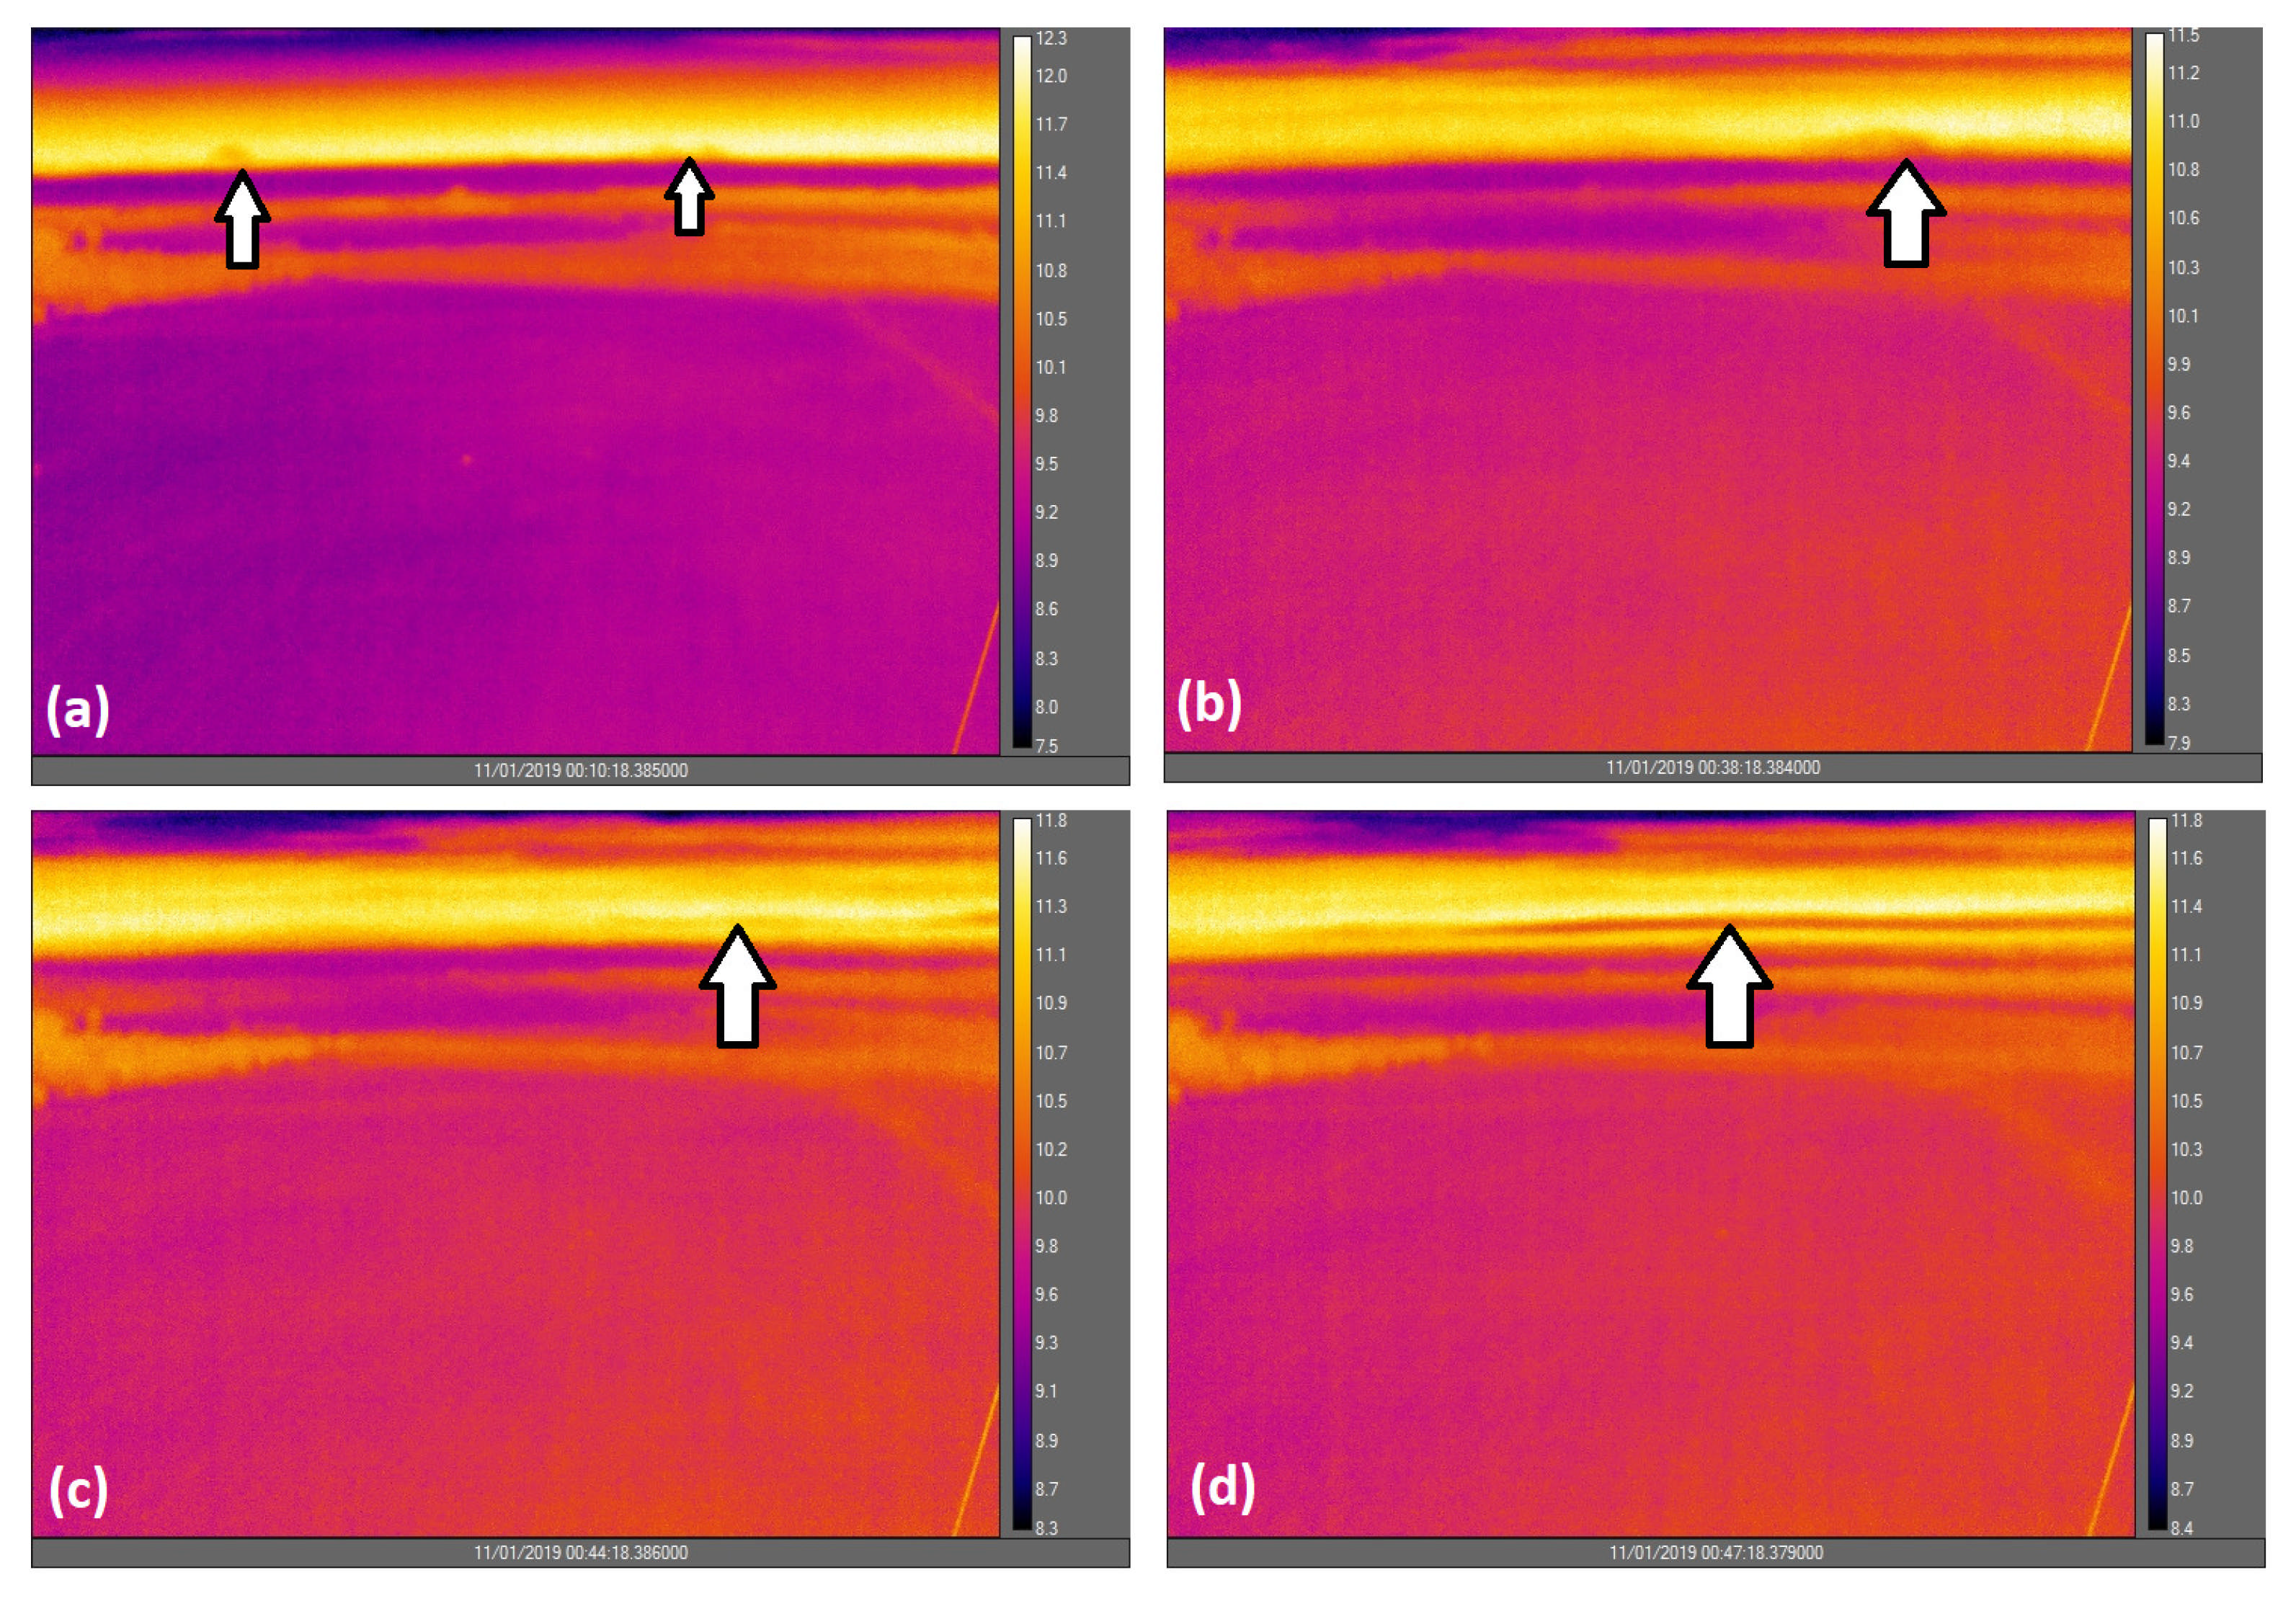
Similarly to previous cases, shallow radiation fog was present during the evening of 31 October 2019. This fog was observed in the IR video (Video S5) and the 2 m visibility from approximately 20:30 UTC (Figure 15a). The fog appeared to dissipate within the hour, after an increase in the vertical turbulence was observed. The vertical turbulence at 2 m subsequently reduced rapidly, and by the time it dropped below the lower threshold for fog formation at 22:30 UTC, shallow fog was once again observed at the site. From approximately 23:50 UTC to 00:45 UTC, mixing of the fog with the air above could be observed in the IR camera footage (camera stills in Figure 16), which showed discrete sections at the top of the fog layer rising higher than the rest of the fog top, with some of these sections breaking away into the layer of air above. Towards the beginning of this ‘mixing phase’, the relative humidity reached saturation at each measurement level up to and including at 48 m (Figure 15c). Therefore, despite the fog not being present at 23 m or above yet, there was a process occurring that was causing moistening at these heights, which may be explained, at least in part, by the mixing between break-away sections of fog and the air above that was observed in the IR camera footage. This is supported by the relatively high vertical turbulence at 23 m and 48 m during this period, much above the threshold below which stable radiation fog can form, suggesting that there was turbulent mixing present at these heights. Therefore, we have observed both an increase in turbulent mixing and an increase in RH before which the fog top appeared to be confined to a height below 23 m.
The vertical turbulence at 2 m increased at the start of this period (Figure 15b) and then remained constant for most of the mixing period; it rapidly increased above the fog threshold at around the end of the ‘mixing’ event. This coincided with the rapid dissipation of the fog at 2 m but also the drop in visibility at 23 m and 48 m to below 1 km as stratus appeared and lowered over the site. This was preceded by the appearance of a strip of low cloud elevated just above the fog on the horizon (00:44 UTC). This was observed during the period of mixing, and although this cloud was not captured lifting from the fog layer by the IR camera, other sections throughout the mixing period were. Directly after this occurrence, a denser layer of stratus advected to the site and again was observed on the horizon; this was quickly followed by more stratus which rapidly covered the site and obscured the view of the camera. Given that we have observed fog lifting to form stratus during other cases, and fog was present at other sites during this case, it is plausible that stratus was ‘spawned’ from fog and advected to the site. However, we do not have enough data to confirm this. The stratus lowered readily in the presence of the already saturated air from at least 48 m and below, which occurred when the mixing between the shallow radiation fog and the air above was observed. The low stratus remained at 48 m for the following three hours, until it dissipated in the presence of higher cloud, which could be observed in the ceilometer data at the site. The higher cloud then began to lower and was the source of precipitation that was observed at the surface from 06:00 UTC.

3.5. Common Occurrences Across All Cases

The cases presented here show some commonality in their evolution, including the apparent method by which the fog may grow vertically. An initial phase may be present whereby the fog and air above are both significantly stable. In this phase, there is apparently limited mixing between the fog and the air above, its vertical growth is limited, and the relative humidity above the fog is at least a few percentage points below saturation. A later ‘mixing’ phase may involve significant mixing at the fog top, possibly driven by the shear instability there. In this phase, the IR footage shows fronds of fog lifting and mixing into the layer above, and also sections of fog breaking off to form shallow layers of stratus that then advect above the fog (’stratus spawning’). This phase appears critical to the vertical growth of the fog, as the air above the fog gradually cools and experiences increasing RH. At the same time, the mixing must not be vigorous enough to reach down into the lowest layers of the fog, as this could cause it to dissipate [25]. Once the RH above fog reaches within approximately a few percentage points of saturation, it appears that the air mixed up from the fog below can remain saturated and therefore the fog may then rapidly grow vertically.
The cases discussed here all display occurrences of mixing between a layer of stable radiation fog and the air or cloud above. In three of the five cases, we observed in the IR camera footage discrete sections of the fog lifting and breaking-off to form cloud above the fog layer. These took the form of low stratus that had a narrow-band-like appearance. We observed similar clouds at other times during all five cases, which appears to be ubiquitous. These may have originated in the same manner as those that were observed breaking-off from the fog-top, but we do not have IR camera footage to confirm this and so it remains speculative.
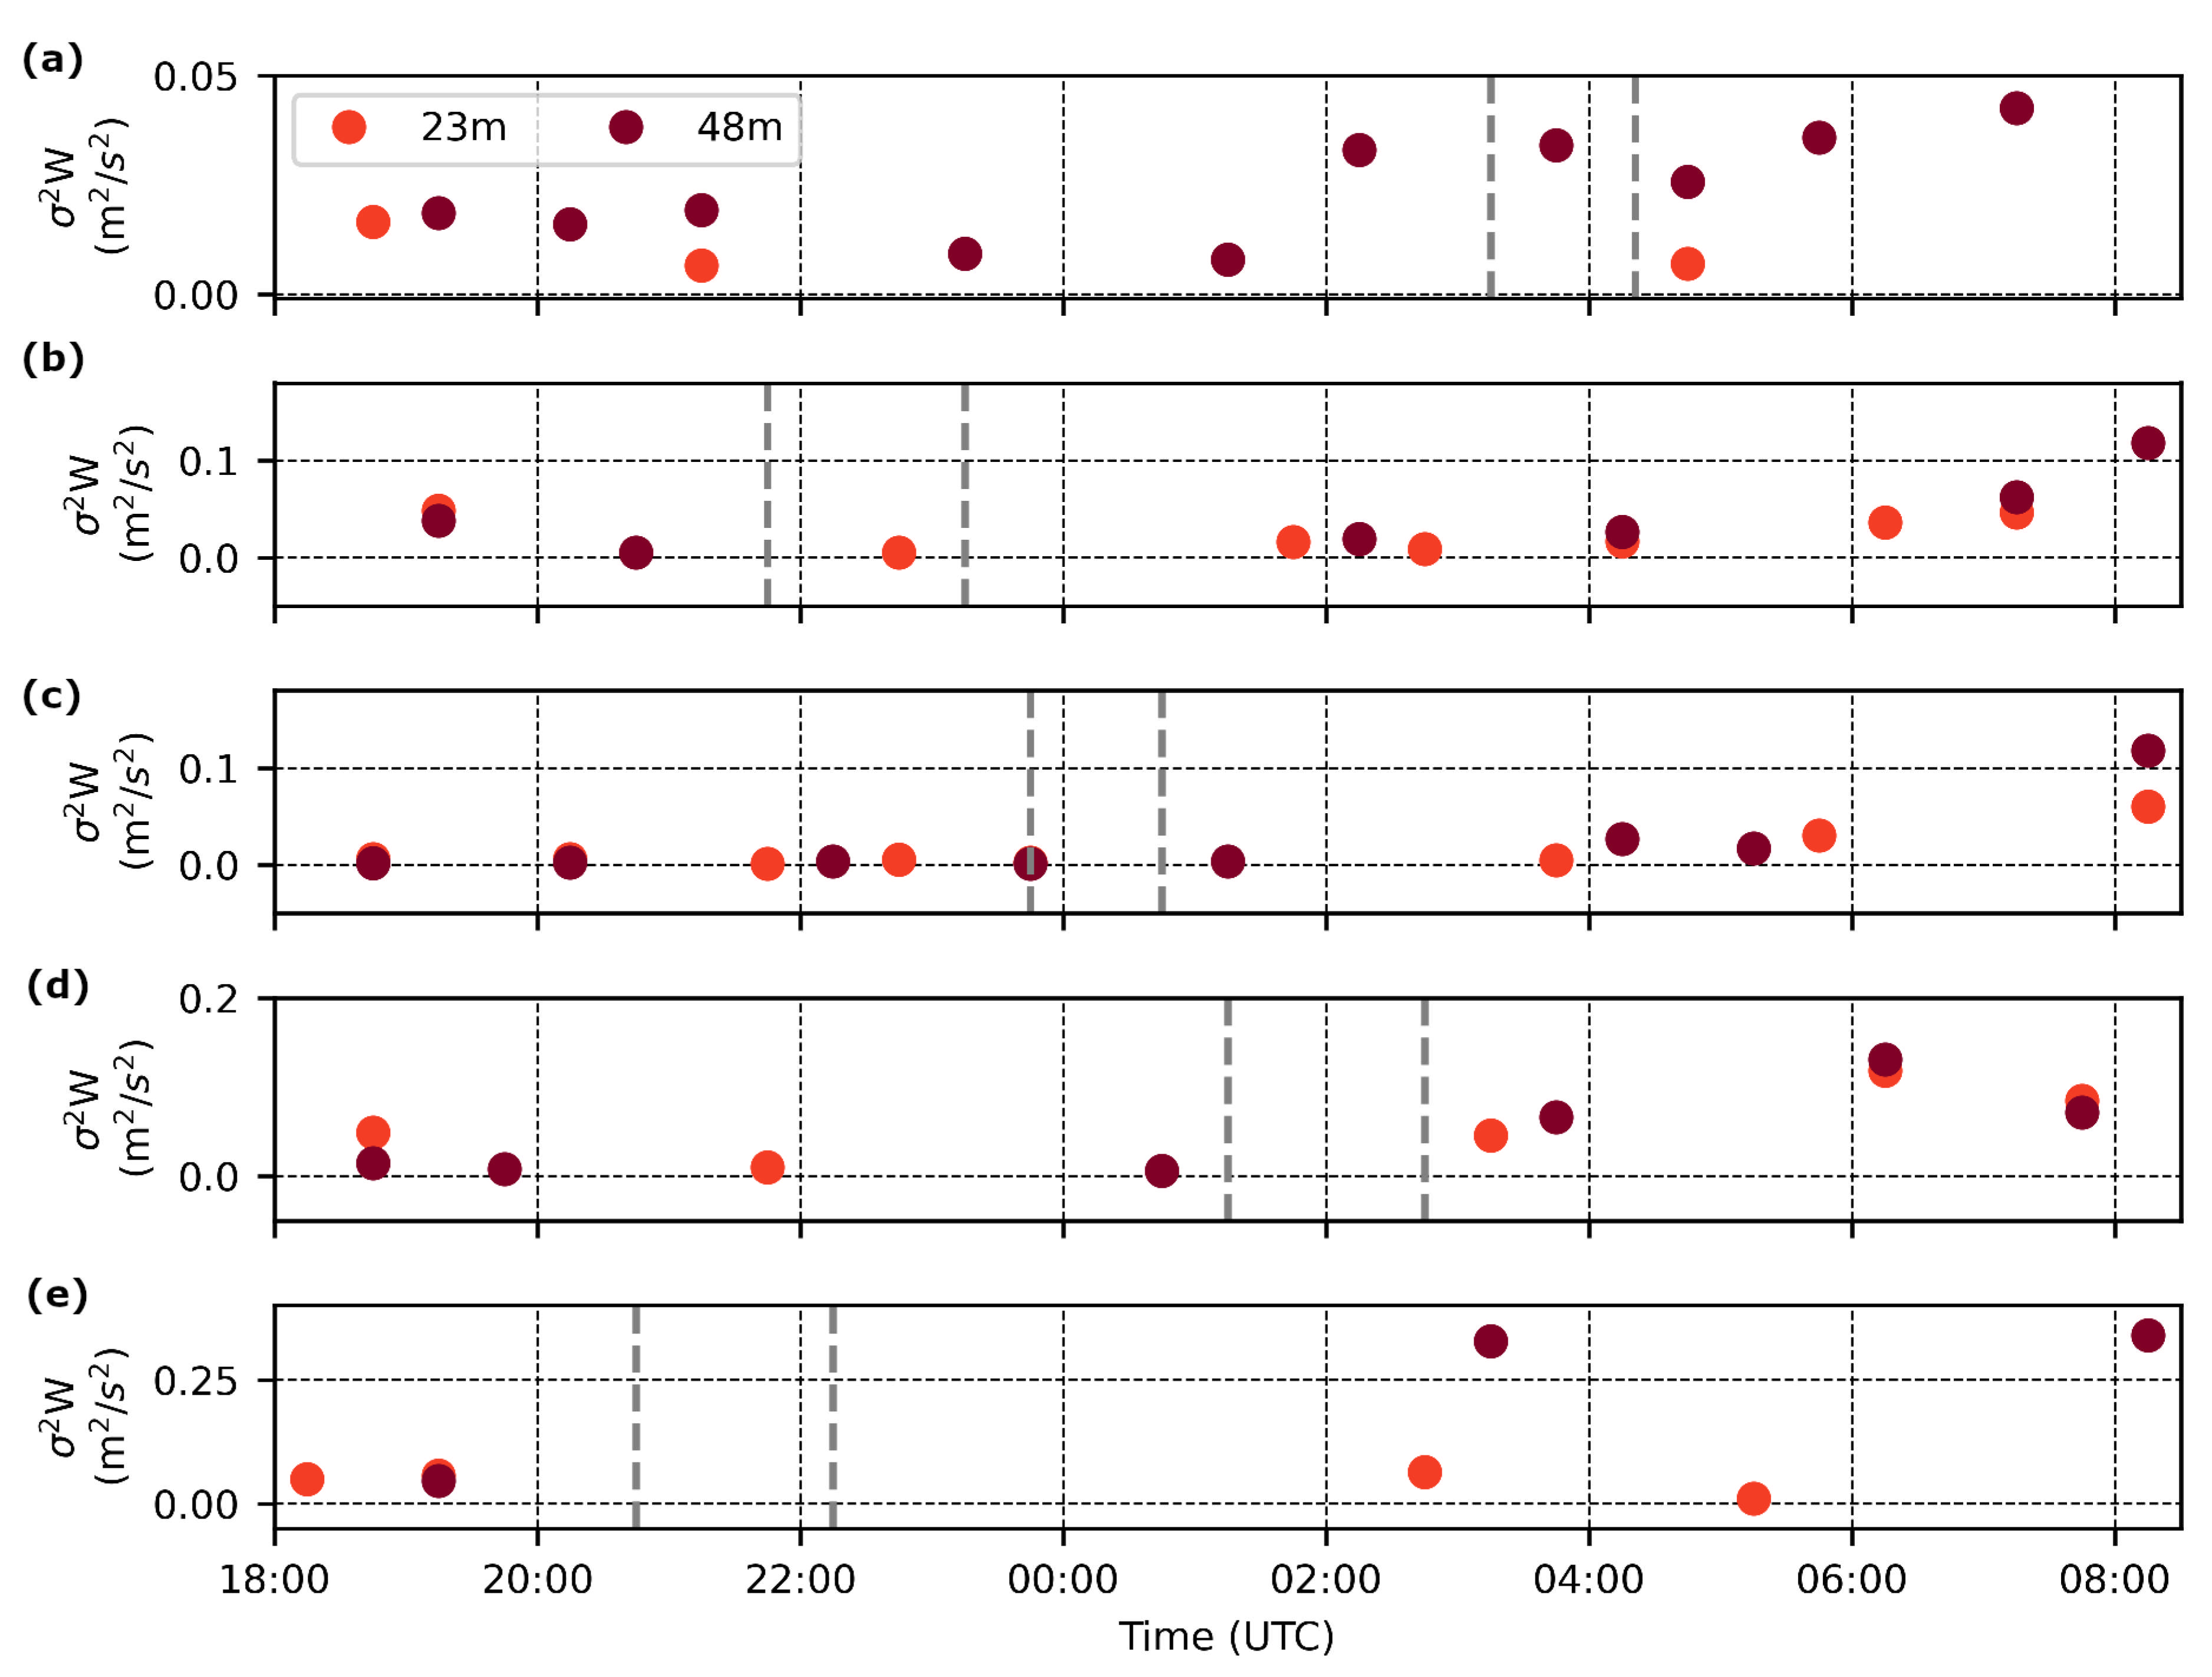
During the ’mixing events’, for each case, we observed some level of moistening (in RH) and cooling above the fog layer at different points during the period. Additionally, in most cases, an increase in the vertical velocity variance ( σ 2 W), i.e., vertical turbulence, was observed before and during the mixing events. This observed increase in turbulence suggested an increase in turbulent mixing at these heights and further supports what was observed in the IR videos. The latter largely showed mixing that occurred on the horizon, but the increases in turbulence were captured by the local observations, suggesting that this type of mixing can be common and widespread. A time-series of the peaks in the vertical velocity variance at 48 m and 23 m have been plotted (Figure 17) and used to determine the time difference between the start of a mixing event and the closest preceding increase in σ 2 W, shown in Table 2. Only peaks where σ 2 W increased beyond the fog threshold have been used; if the σ 2 W is above the threshold, then formation of radiation fog can be prohibited due to excessive vertical turbulence. Therefore, we use it here as a proxy for more turbulent conditions relative to stable nocturnal boundary layer conditions. For the five cases presented here, the increase in vertical turbulence occurred between 0 min and 1.5 h before mixing was observed on the horizon, with an average of 0.8 h. For all cases, we have considered the peaks in σ 2 W measured at 48 m, but for the 31 October case, we also considered the 23 m peak since the fog-top appeared to be lower during the start of the ‘mixing event’. It is important to note here that the vertical velocity variance is only calculated over 30 min intervals and therefore we can only estimate the time difference to the nearest 30 min.
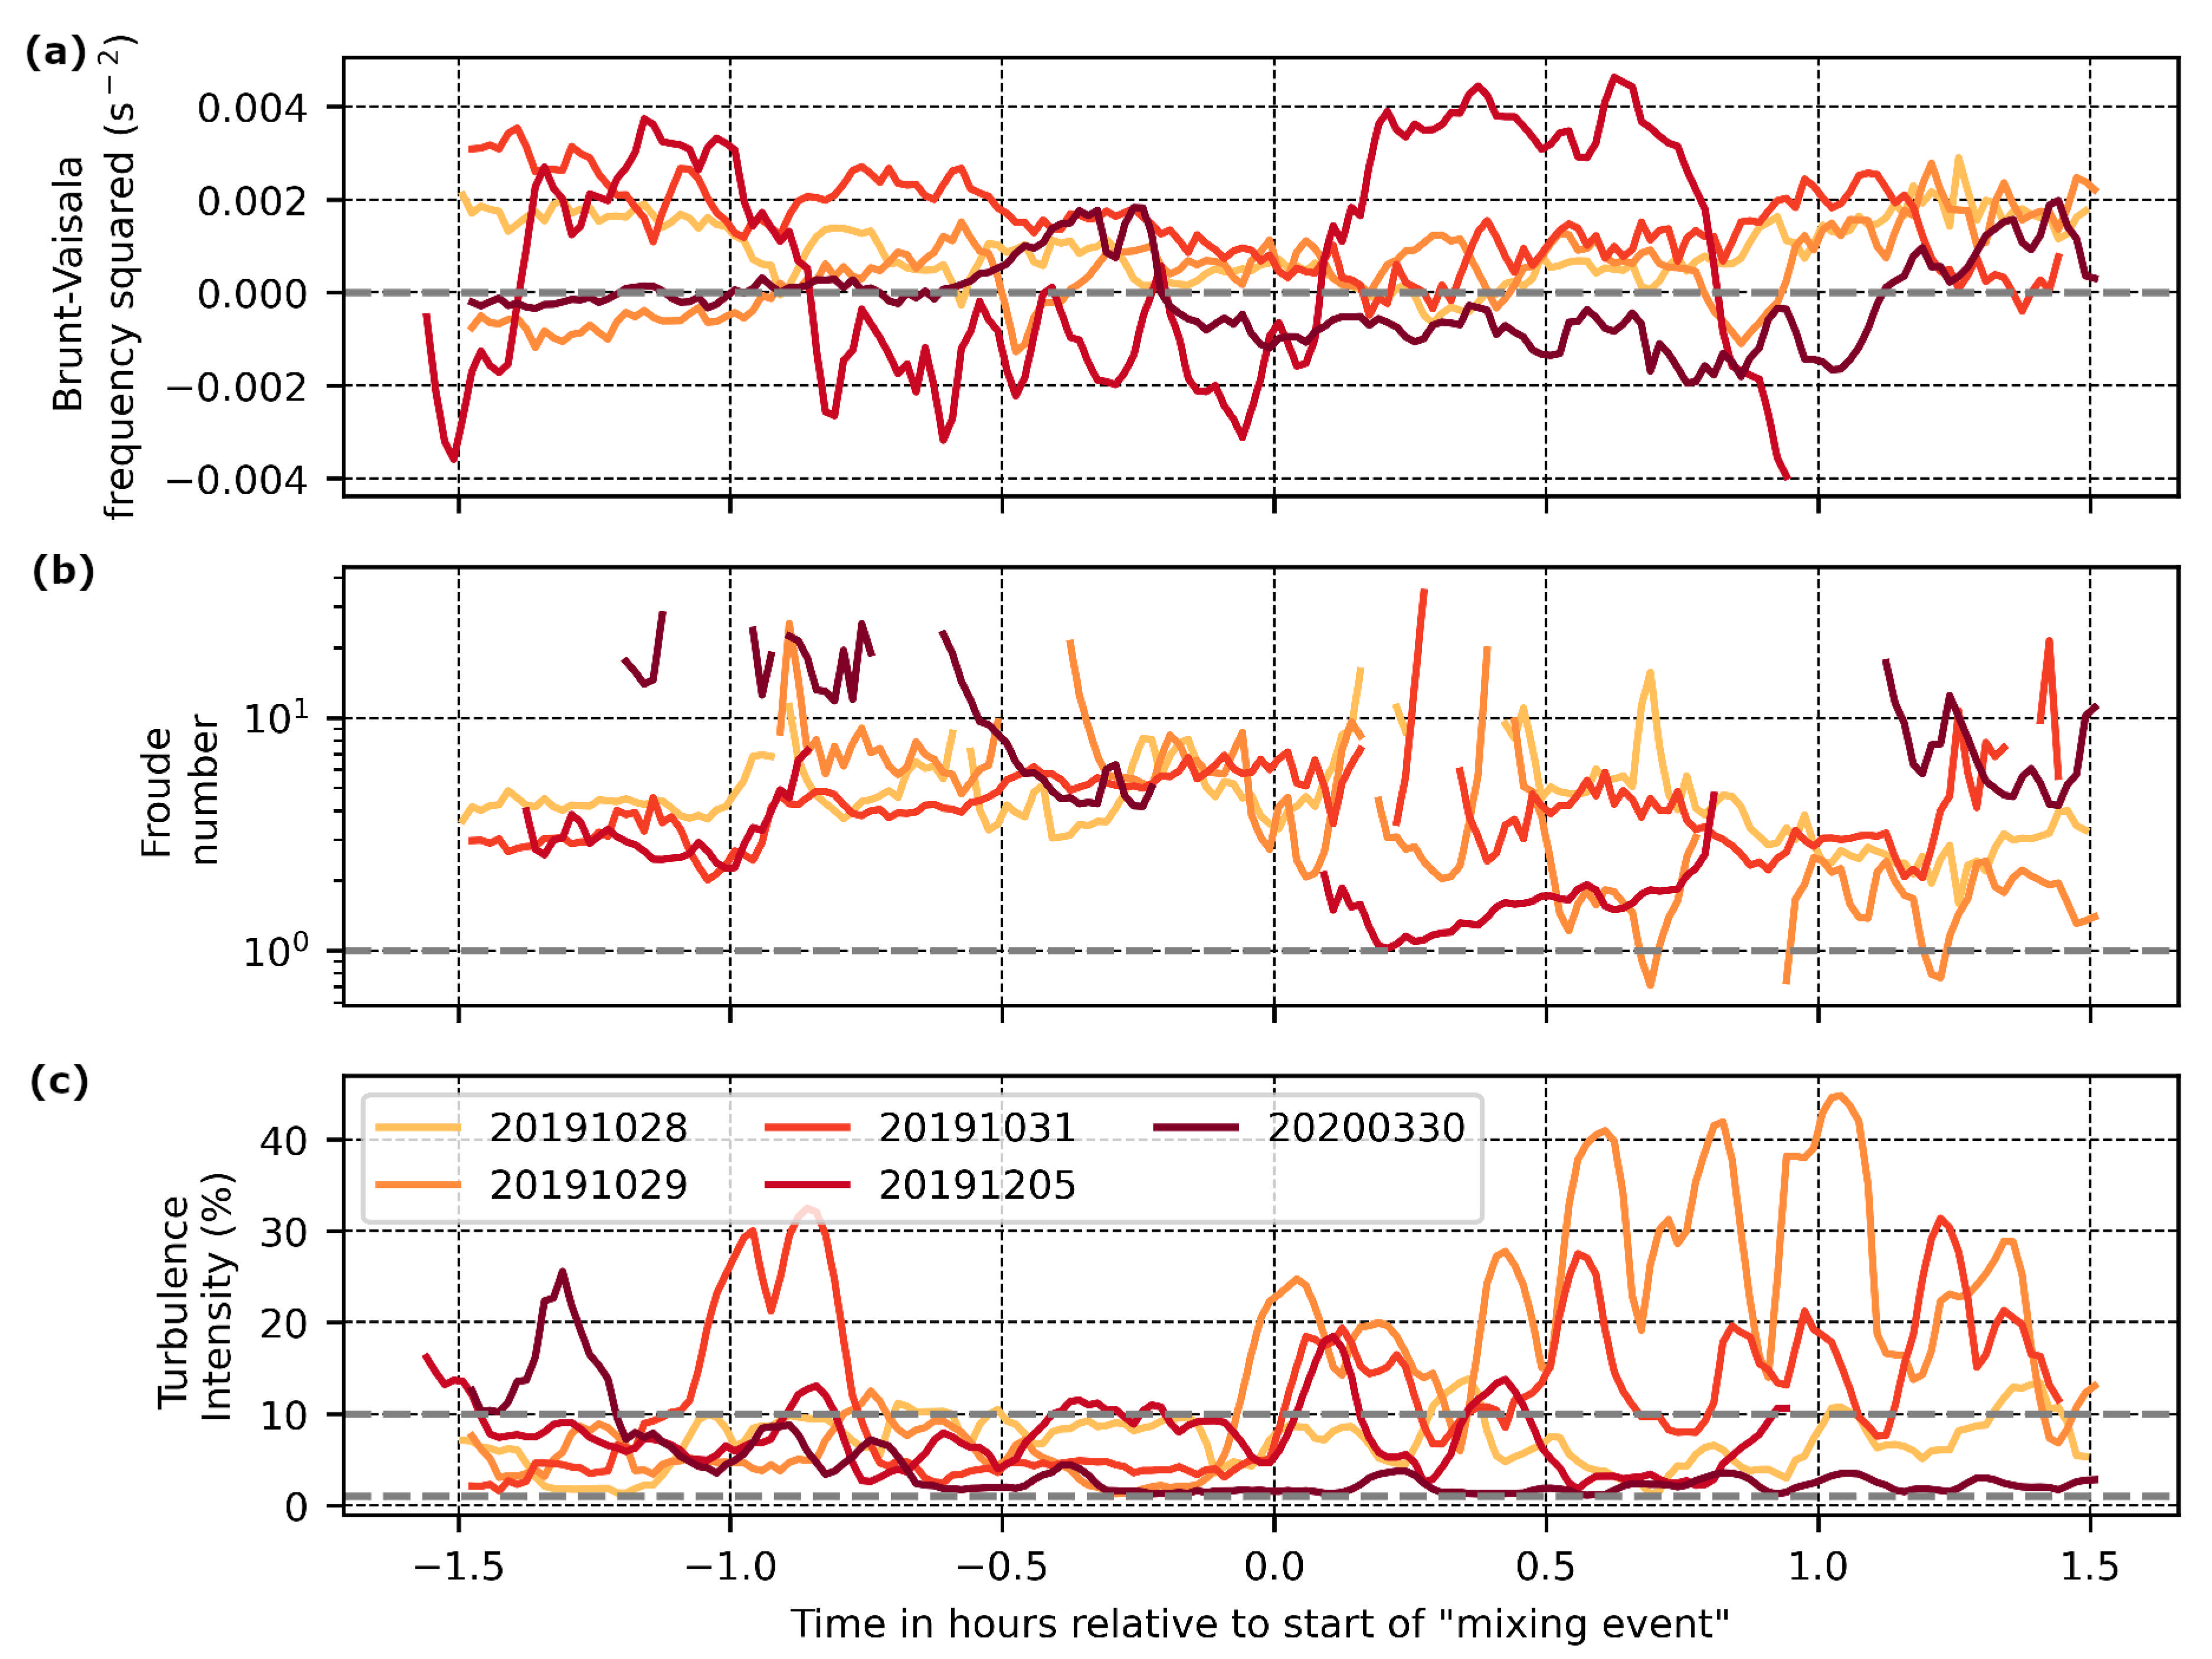
The Froude number, Brunt–Väisälä frequency, and the turbulence intensity at 48 m have been plotted over the period from 1.5 h before the start of the ‘mixing events’ until approximately an hour after the events (Figure 18). During the 1.5 h preceding each event and up until the event itself, the Froude number remained above 1 for all of the cases, indicating that gravity waves (likely to be related to surface roughness over this area) were unlikely to be present and the turbulent transport was instead due to the inertia of the flow. The Froude number remained above 1 for at least an hour after the mixing event in most cases; however, in two cases, we did observe some short-lived reductions in the Froude number to 1 and below (29 October 2019 and 5 December 2019). During the first drop in Froude number on 29 October 2019, approximately 0.65 h after the start of the mixing event (22:35UTC), we observed a temporary change in wind direction at 48 m from approximately north-westerly to easterly. This sudden change in wind direction can be indicative of gravity waves, which is supported by the relatively low Froude number. It appears that these gravity waves passed through quickly and the observed mixing continued when the wind direction reverted to north-westerly, and the Froude number increased above 1. After this increase in Froude number, a parcel of fog was observed lifting-up and forming a higher layer of cloud. It is not clear what caused the drop in Froude number approximately 0.2 h after the start of the mixing event during the December 2019 case, as there were no changes in wind direction at 48 m or increase in turbulence above the fog threshold. For this case, however, the Froude number did remain above 1, and the drop was very short-lived; the mixing was observed before and after.
At the start of the mixing events and/or at periods over the following hour, where mixing was observed, the Brunt–Väisälä frequency dropped below zero, indicating unstable conditions where displaced air could continue to rise, i.e., fog could break-away to form higher layers of stratus. During the 5 December case, the Brunt–Väisälä frequency dropped below zero before and during the start of the event, but then it increased rapidly before returning to negative values. When the values were initially below zero, fog was seen breaking-off from the layer below (Figure 11a), and when the value dropped back to sub-zero, the lifting of another discrete section of fog was observed (Figure 11d). Between these two events, when the Brunt–Väisälä frequency was relatively high, the IR camera footage showed that the fog height remained at around tree-height, with no observed mixing at the fog-top.
Prior to the start of the observed mixing, the turbulence intensity for each of the cases could be classed as moderate, i.e., between 1% and 10%; however, at around the time that the mixing began and over the following 1.5 h, the turbulence intensity in most cases became high, i.e., greater than 10%, indicating an increase in turbulent mixing at 48 m. The exception was during the 30 March 2020 case, where the turbulence intensity remained moderate at 48 m; however, at 23 m, the turbulence intensity became high. The IR images from this case do show the fog at the site as being below tree-top height during the start of the mixing event, which would indicate that mixing at the fog-top at the measurement site would have been closer to 23 m than 48 m. By the time that the fog had covered the trees closet to the site (approximately 00:00UTC), the turbulence intensity at 48 m did increase above 10%.
A divergence in nocturnal wind speed over the different measurement heights at Le Couye has been a common occurrence over the SOFOG3D campaign, and it is expected to be partly a consequence of the surrounding forested area. Thornton et al. [30] reported lower wind speeds after sunset at 23 m and below at Le Couye when compared to the more open site of Jachere, but similar wind speeds were observed between the two sites at approximately 48 m, i.e., above tree height. During the five cases presented here, we observed wind shear from 0.04 s−1 to 0.08 s−1 during the periods where mixing was observed in the IR camera videos. This may have allowed sections of fog to break-off from the layer below; however, these wind shears were present throughout the night and therefore were not necessarily associated with any increases in turbulence that occurred during the mixing period. Furthermore, there does not appear to be a temporal pattern associated with the increased turbulence, i.e., the mixing events occurred at different times. We are therefore unable to elucidate the exact cause of the observed increase in turbulence during the mixing events.
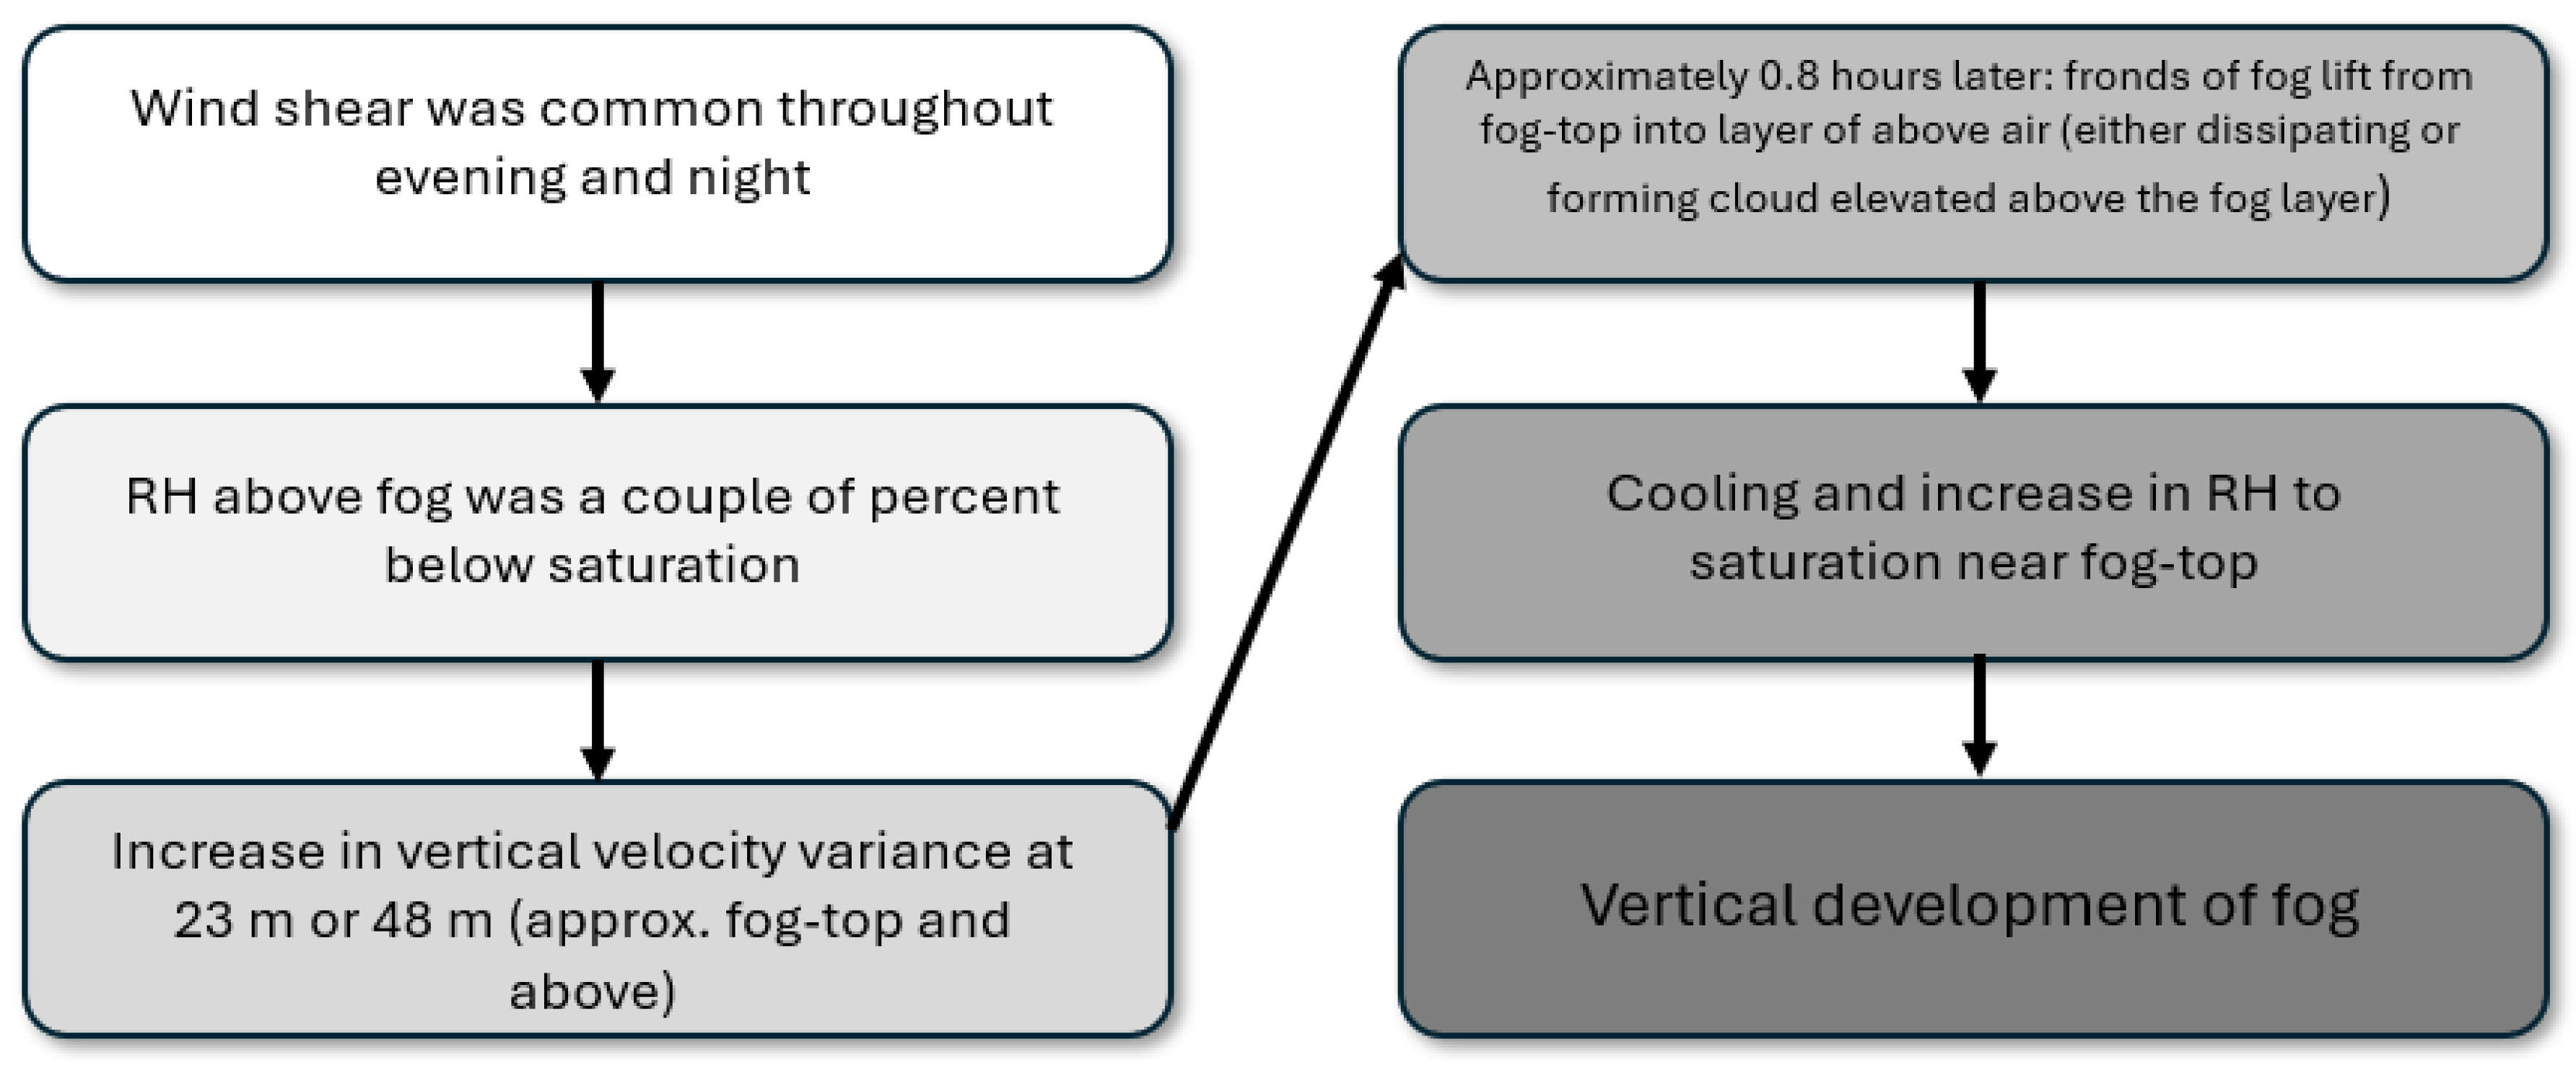
We have summarised the key points presented within this section as a flow chart (Figure 19). The chart runs in chronological order relative to when particular observations were made and therefore presents specific changes in variables before and after mixing was observed, leading to the eventual vertical development of the fog.

4. Summary and Conclusions

A notable characteristic of the boundary layer conditions prevalent during SOFOG3D was the occurrence of very low stratus clouds below approximately 400 m. These occurred commonly and were seen to accompany and interact with fog. The observed interactions appear complex and include periods where stratus lowers to the ground to become fog, periods when fog lifts into very low stratus, and also events (seen in the IR imagery) whereby shallow fog appears to create layers of stratus above it. This latter process appears to occur when instabilities at fog top allow a layer to shear off from the fog to create an independent layer of stratus just above the fog layer. As such, the process appears to contribute to the general increase in cloud cover during nocturnal boundary layer evolution and may also contribute to the vertical development of fog.
We used infra-red imagery, captured during the SOFOG3D campaign, to investigate the evolution of fog in the presence of turbulent mixing between fog and the air immediately above. We have focused on the effect of the mixing on both subsequent vertical development of the fog and the evolution of the fog in the presence of low stratus. We found that the mixing can influence the fog development by cooling and moistening (in terms of RH) of the layer directly above.
What we refer to as mixing of an existing fog layer and the air above has taken the form of isolated sections of fog that have lifted and separated from the fog layer below. These either dissipated in the air above or formed independent layers of low stratus above the fog layer. We found that the former behaviour was common, occurring in more than 80% of the 12 IR videos of radiation fog included in this study. Here, we presented five cases in detail. During three of these cases, we observed discrete sections of fog lifting and breaking-off to form low-stratus cloud above the fog layer. In all five cases, however, the IR camera detected cloud that was very similar in appearance to these break-away layers, but it did not always detect it lifting from the fog. Given the widespread coverage of the fog, it is not unreasonable to assume that these clouds originated in the same manner at a different location and then advected to the site, but this remains speculative.
In most cases, the observed mixing between the fog and air above was accompanied by an increase in vertical turbulence at a range of heights from 2 m up to 48 m. The increase in σ 2 W at 48 m occurred on average 0.8 h before the mixing was observed; during this time, the Froude number remained above 1, indicating that the increase in turbulent motion was driven by the inertia of the air-flow rather than gravity waves. Sub-zero values of Brunt–Väisälä occurred at 48 m across all cases at points during the mixing events, suggesting instability at 48 m, which allowed discrete sections of fog to move upwards (and form very low stratus). After the mixing was observed in the IR camera footage, in three of the five cases, the fog rapidly developed vertically within an hour of the mixing occurring. Additionally, in three of the cases, stratus cloud appeared to lower over the site. During two of these stratus-lowering cases, this occurred in both the presence of radiation fog and within a few hours of the mixing event, whereas with the other case, this occurred directly after the mixing had occurred.
The cooling and increasing RH of the air was a common occurrence amongst these five cases whilst their respective mixing events were happening. This was followed by the rapid vertical development of fog. We therefore conclude that as part of this research, we observed mixing between radiation fog and the air above, which ultimately led to enhanced cloud cover via the creation of independent fronds of stratus and enhanced fog cover due to the vertical growth of existing radiation fog. It is worth noting, however, that the enhanced cloud cover remaining above the fog layer may also lead to an increase in downwelling-longwave radiation and temperatures below and the subsequent dissipation of the fog, therefore affecting the vertical development of the fog in a different way.
Through this work, we have identified the presence of turbulent mixing between fog layers and the air layer above, as well as the effect on the vertical development of the fog. We have quantified the time between the observed increase in vertical turbulence and the start of a mixing event, and we determined that the increases in vertical turbulence are unlikely to be associated with gravity waves. Due to the nature of these observations, i.e., comparison of local in situ measurements with fog events captured a few kilometres away, it is difficult to identify the pre-cursor to the mixing. Therefore, this paper highlights the need for further observational campaigns, including the use of IR imagery, and research into the life-cycle of fog such that we are able to simulate the observed mixing in NWP (Numerical Weather Prediction) models and subsequently improve the representation of fog in NWP, an identified source of error in such models. A future campaign should take advantage of IR cameras, which have been shown through this work and previous studies [26,30] to provide a useful tool for visually observing the fog development. These data should be complimented with in situ observations, preferably at a point on the horizon as viewed through the camera. This could take the form of two or more supersites a few kilometers apart, which would host IR cameras that are pointed towards each other. In addition, the sites would host temperature, humidity, and wind sensors at various heights. This would have the potential to provide unique insight into fog development and potentially link local observations at one site to IR footage captured at another site, enabling more quantitative analysis of the mixing, i.e., the mixing height. Given that the fog appeared to be wide-spread, it may also be appropriate to introduce IR satellite data to further elucidate on the dynamics of the fog; these could then be related to the data over the multiple locations, which could cover many kilometers.

Supplementary Materials

The following supporting information can be downloaded at: https://drive.google.com/file/d/1sE2ttXQ-qryhdp4ipypiwlfnlnkIlLnX/view?usp=drive_link, accessed on 21 November 2025, Video S1: Thornton_Video1.mp4; Video S2: Thornton_Video2.mp4; Video S3: Thornton_Video3.mp4; Video S4: Thornton_Video4.mp4; Video S5: Thornton_Video5.mp4.

Author Contributions

Conceptualization, J.T., J.P. and F.B.; methodology, J.T.; software, J.T.; formal analysis, J.T.; investigation, J.T.; data curation, J.P., F.B. and J.D.; writing—original draft preparation, J.T.; writing—review and editing, J.P., F.B. and J.D. All authors have read and agreed to the published version of the manuscript.

Funding

The SOFOG3D field campaign was supported by MÉTÉO-FRANCE and ANR through grant AAPG 2018-CE01-0004.

Institutional Review Board Statement

Not applicable.

Informed Consent Statement

Not applicable.

Data Availability Statement

The data that support the findings of this study are available on the French National Center for Atmospheric Data and Services (AERIS) website https://www.aeris-data.fr/projects/sofog-3d/ (accessed on 10 November 2025).

Acknowledgments

The authors thank all organisers, hosts, and participants of the SOFOG3D campaign. Additional thanks go to the staff at the Met Office Meteorological Research Unit Cardington, namely Bernard Claxton, Tony Jones, Amanda Kerr-Munslow, James McGregor, Nicola Phillips, Martyn Pickering, and Simon Osborne, for their support in setting up and maintaining the site at Le Couye and preparation of the associated data. Data are managed by the French National Center for Atmospheric Data and Services (AERIS).

Conflicts of Interest

The authors declare no conflicts of interest.

Appendix A

A list of instrumentation located at the UK Met Office and Meteo-France sites, along with their associated uncertainties and sampling and logging frequencies, is provided in Table A1 and Table A2, respectively. Only instrumentation used to make the measurements presented within this work are shown.
Table A1. Specification of instruments used at the Le Couye, Jachere, and Charbonniere field sites during SOFOG3D.
Field SiteMeasurement (Height)InstrumentUncertaintySampling/
Logging Frequency
Le CouyeVisibility (2, 23, and 48 m)Campbell Scientific CS12010%1 Hz/1 min
Le CouyeTemperature (1.2, 23 m, and 48 m)PRTs: PT100 IEC60751 “A”0.1 °C1 Hz/1 min
Le CouyeTemperature (skin)Heitronics KT19 II, KT-15D IRTs1 °C1 Hz/1 min
Le CouyeLongwave radiation (m)Kipp and Zonen, CG4<4 Wm−21 Hz/1 min
Le CouyeWind speed (2, 10, 23, 48 m)Gill HS50 sonic anemometer2%10 Hz
Le CouyeVertical velocity (2, 23, 48 m)Gill HS5020%10 Hz
Le CouyeRelative humidity (1.2 m)Vaisala HMP1551 to 2%1 Hz/1 min
Jachere and
Charbonniere
Visibility (3 m)Vaisala PWD 22/5210%25 s/1 min
JachereVisibility (25 and 48 m)Young Sentry 73,00010%30 s/1 min
JachereLongwave radiation (1 m)Kipp and Zonen, CNR4<4 Wm−210 s/1 min
Table A2. Specification of the FLIR A655s infra-red camera used at the Le Couye field site during SOFOG3D.
FLIR A655s
Accuracy (°C)2%
Sensitivity (°C)0.03
Range (°C)−40 to 150
Image Resolution640 × 480
Spectral Range (μm)7.5 to 14
Acquisition Rate (Hz)50
Angle of View (°)45

References

  1. Times of India. Available online: https://timesofindia.indiatimes.com/india/over-10000-lives-lost-in-fog-related-road-crashes/articleshow/67391588.cms (accessed on 1 December 2022).
  2. Ahmed, M.M.; Abdel-Aty, M.; Lee, J.; Yu, R. Real-time assessment of fog-related crashes using airport weather data: A feasibility analysis. Accid. Anal. Prev. 2014, 72, 309–317. [Google Scholar] [CrossRef]
  3. Gultepe, I.; Sharman, R.; Williams, P.D.; Zhou, B.; Ellrod, G.; Minnis, P.; Trier, S.; Griffin, S.; Yum, S.; Gharabaghi, B.; et al. A review of high impact weather for aviation meteorology. Pure Appl. Geophys. 2019, 176, 1869–1921. [Google Scholar] [CrossRef]
  4. Robinson, P.J. The influence of weather on flight operations at the Atlanta Hartsfield International Airport. Weather Forecast 1989, 4, 461–468. [Google Scholar] [CrossRef]
  5. Gultepe, I.; Tardif, R.; Michaelides, S.; Cermak, J.; Bott, A.; Bendix, J.; Müller, M.D.; Pagowski, M.; Hansen, B.; Ellrod, G.; et al. Fog research: A review of past achievements and future perspectives. Pure Appl. Geophys. 2007, 164, 1121–1159. [Google Scholar] [CrossRef]
  6. Kulkarni, R.; Jenamani, R.K.; Pithani, P.; Konwar, M.; Nigam, N.; Ghude, S.D. Loss to aviation economy due to winter fog in New Delhi during the winter of 2011–2016. Atmosphere 2019, 10, 198. [Google Scholar] [CrossRef]
  7. The Sunday Times. Available online: https://www.thetimes.co.uk/article/airport-dash-as-the-fog-lifts-jtx5j5hxrnz (accessed on 23 August 2024).
  8. Berry, Z.C.; Johnson, D.M.; Reinhardt. Vegetation-zonation patterns across a temperate mountain cloud forest ecotone are not explained by variation in hydraulic functioning or water relations. Tree Physiol. 2015, 35, 925–935. [Google Scholar] [CrossRef] [PubMed]
  9. Gehrig-Downie, C.; Marquardt, J.; Obregón, A.; Bendix, J.; Gradstein, S.R. Diversity and vertical distribution of filmy ferns as a tool for identifying the novel forest type “tropical lowland cloud forest”. Ecotropica 2012, 18, 35–44. [Google Scholar]
  10. Mitchell, D.; Henschel, J.R.; Hetem, R.S.; Wassenaar, T.D.; Strauss, W.M.; Hanrahan, S.A.; Seely, M.K. Fog and fauna of the Namib Desert: Past and future. Ecosphere 2020, 11, 1. [Google Scholar] [CrossRef]
  11. Gottlieb, T.R.; Eckardt, F.D.; Venter, Z.S.; Cramer, M.D. The contribution of fog to water and nutrient supply to Arthraerua leubnitziae in the central Namib Desert, Namibia. J. Arid Environ. 2019, 161, 35–46. [Google Scholar] [CrossRef]
  12. Tudor, M. Impact of horizontal diffusion, radiation and cloudiness parameterization schemes on fog forecasting in valleys. Meteorol. Atmos. Phys. 2010, 108, 57–70. [Google Scholar] [CrossRef]
  13. Pu, Z.; Chachere, C.N.; Hoch, S.W.; Pardyjak, E.; Gultepe, I. Numerical prediction of cold season fog events over complex terrain: The performance of the WRF model during MATERHORN-fog and early evaluation. Pure Appl. Geophys. 2016, 173, 3165–3186. [Google Scholar] [CrossRef]
  14. Charchere, C.N.; Pu, Z. Numerical simulations of an inversion fog event in the salt lake valley during the MATERHORN-fog field campaign. Pure Appl. Geophys. 2019, 176, 2139–2164. [Google Scholar] [CrossRef]
  15. Van der Velde, I.R.; Steeneveld, G.J.; Schreur, B.G.J.; Wichers; Holtslag, A.A.M. Modeling and forecasting the onset and duration of severe radiation fog under frost conditions. Mon. Weather Rev. 2010, 138, 4237–4253. [Google Scholar] [CrossRef]
  16. Steeneveld, G.J.; Ronda, R.J.; Holtslag, A.A.M. The challenge of forecasting the onset and development of radiation fog using mesoscale atmospheric models. Bound. Layer Meteorol. 2015, 154, 265–289. [Google Scholar] [CrossRef]
  17. Steeneveld, G.J.; Wokke, M.J.J.; Groot Zwaaftink, C.D.; Pijlman, S.; Heusinkveld, B.G.; Jacobs, A.F.G.; Holtslag, A.A.M. Observations of the radiation divergence in the surface layer and its implication for its parameterization in numerical weather prediction models. J. Geophys. Res. Atmos. 2010, 115, D6. [Google Scholar] [CrossRef]
  18. Smith, D.K.E.; Renfrew, I.A.; Dorling, S.R.; Price, J.D.; Boutle, I.A. Sub-km scale numerical weather prediction model simulations of radiation fog. Q. J. R. Meteorol. Soc. 2021, 147, 746–763. [Google Scholar] [CrossRef]
  19. Boutle, I.; Angevine, W.; Bao, J.-W.; Bergot, T.; Bhattacharya, R.; Bott, A.; Ducongé, L.; Forbes, R.; Goecke, T.; Grell, E.; et al. Demistify: A large-eddy simulation (LES) and single-column model (SCM) intercomparison of radiation fog. Atmos. Chem. Phys. 2022, 22, 319–333. [Google Scholar] [CrossRef]
  20. Dupont, J.C.; Haeffelin, M.; Protat, A.; Bouniol, D.; Boyouk, N.; Morille, Y. Stratus–fog formation and dissipation: A 6-day case study. Bound. Layer Meteorol. 2012, 143, 207–225. [Google Scholar] [CrossRef]
  21. Haeffelin, M.; Bergot, T.; Elias, T.; Tardif, R.; Carrer, D.; Chazette, P.; Colomb, M.; Drobinski, P.; Dupont, E.; Dupont, J.-C.; et al. PARISFOG: Shedding new light on fog physical processes. Bull. Am. Meteorol. Soc. 2010, 91, 767–783. [Google Scholar] [CrossRef]
  22. Fernando, H.J.; Gultepe, I.; Dorman, C.; Pardyjak, E.; Wang, Q.; Hoch, S.W.; Wauber, B. C-FOG: Life of coastal fog. Bull. Am. Meteorol. Soc. 2021, 102, E244–E272. [Google Scholar] [CrossRef]
  23. Singh, D.K.; Hoch, S.W.; Gultepe, I.; Pardyjak, E.R. A case study of the life cycle of a stratus-lowering coastal-fog event in Newfoundland, Canada. Q. J. R. Meteorol. Soc. 2024, 150, 641–662. [Google Scholar] [CrossRef]
  24. Fathalli, M.; Lac, C.; Burnet, F.; Vié, B. Formation of fog due to stratus lowering: An observational and modelling case study. Q. J. R. Meteorol. Soc. 2022, 148, 2299–2324. [Google Scholar] [CrossRef]
  25. Price, J.D. On the Formation and Development of Radiation Fog: An Observational Study. Bound. Layer Meteorol. 2019, 172, 167–197. [Google Scholar] [CrossRef]
  26. Price, J.; Stokkereit, K. The use of thermal infra-red imagery to elucidate the dynamics and processes occurring in fog. Atmosphere 2020, 11, 240. [Google Scholar] [CrossRef]
  27. Bergot, T. Large-eddy simulation study of the dissipation of radiation fog. Q. J. R. Meteorol. Soc. 2016, 142, 1029–1040. [Google Scholar] [CrossRef]
  28. Cuxart, J.; Jiménez, M.A. Deep radiation fog in a wide closed valley: Study by numerical modeling and remote sensing. Pure Appl. Geophys. 2012, 169, 911–926. [Google Scholar] [CrossRef]
  29. Burnet, F.; Lac, C.; Martinet, P.; Fourrié, N.; Haeffelin, M.; Delanoë, J.; Price, J.; Barrau, S.; Canut, G.; Cayez, G.; et al. The SOuth west FOGs 3D experiment for processes study (SOFOG3D) project. In Proceedings of the EGU General Assembly Conference, Vienna, Austria, 3–8 May 2020; p. 17836. [Google Scholar]
  30. Thornton, J.; Price, J.D.; Burnet, F.; Lac, C. Contrasting the evolution of radiation fog over a heterogeneous region in southwest France during the SOFOG3D campaign. Q. J. R. Meteorol. Soc. 2023, 149, 3323–3341. [Google Scholar] [CrossRef]
  31. Durran, D.R.; Klemp, J.B. On the effects of moisture on the Brunt–Väisälä frequency. J. Atmos. Sci. 1982, 39, 2152–2158. [Google Scholar] [CrossRef]
  32. Klaić, Z.B.; Belusić, D.; Grubisić, V.; Gabela, L.; Ćoso, L. Structure of mesoscale flow over the northern Adriatic during the MAP IOP 15 experiment—The case of a strong bora. Geophysics 2003, 20, 1. [Google Scholar]
  33. Rehman, S. Tower distortion and scatter factors of co-located wind speed sensors and turbulence intensity behaviour. Renew. Sustain. Energy Rev. 2014, 34, 20–29. [Google Scholar] [CrossRef]
  34. Delanoë, J.; Protat, A.; Vinson, J.-P.; Brett, W.; Caudoux, C.; Bertrand, F.; Parent du Chatelet, J.; Hallali, R.; Barthes, L.; Haeffelin, M.; et al. BASTA: A 95-GHz FMCW Doppler radar for cloud and fog studies. J. Atmos. Ocean. Technol. 2016, 33, 1023–1038. [Google Scholar] [CrossRef]
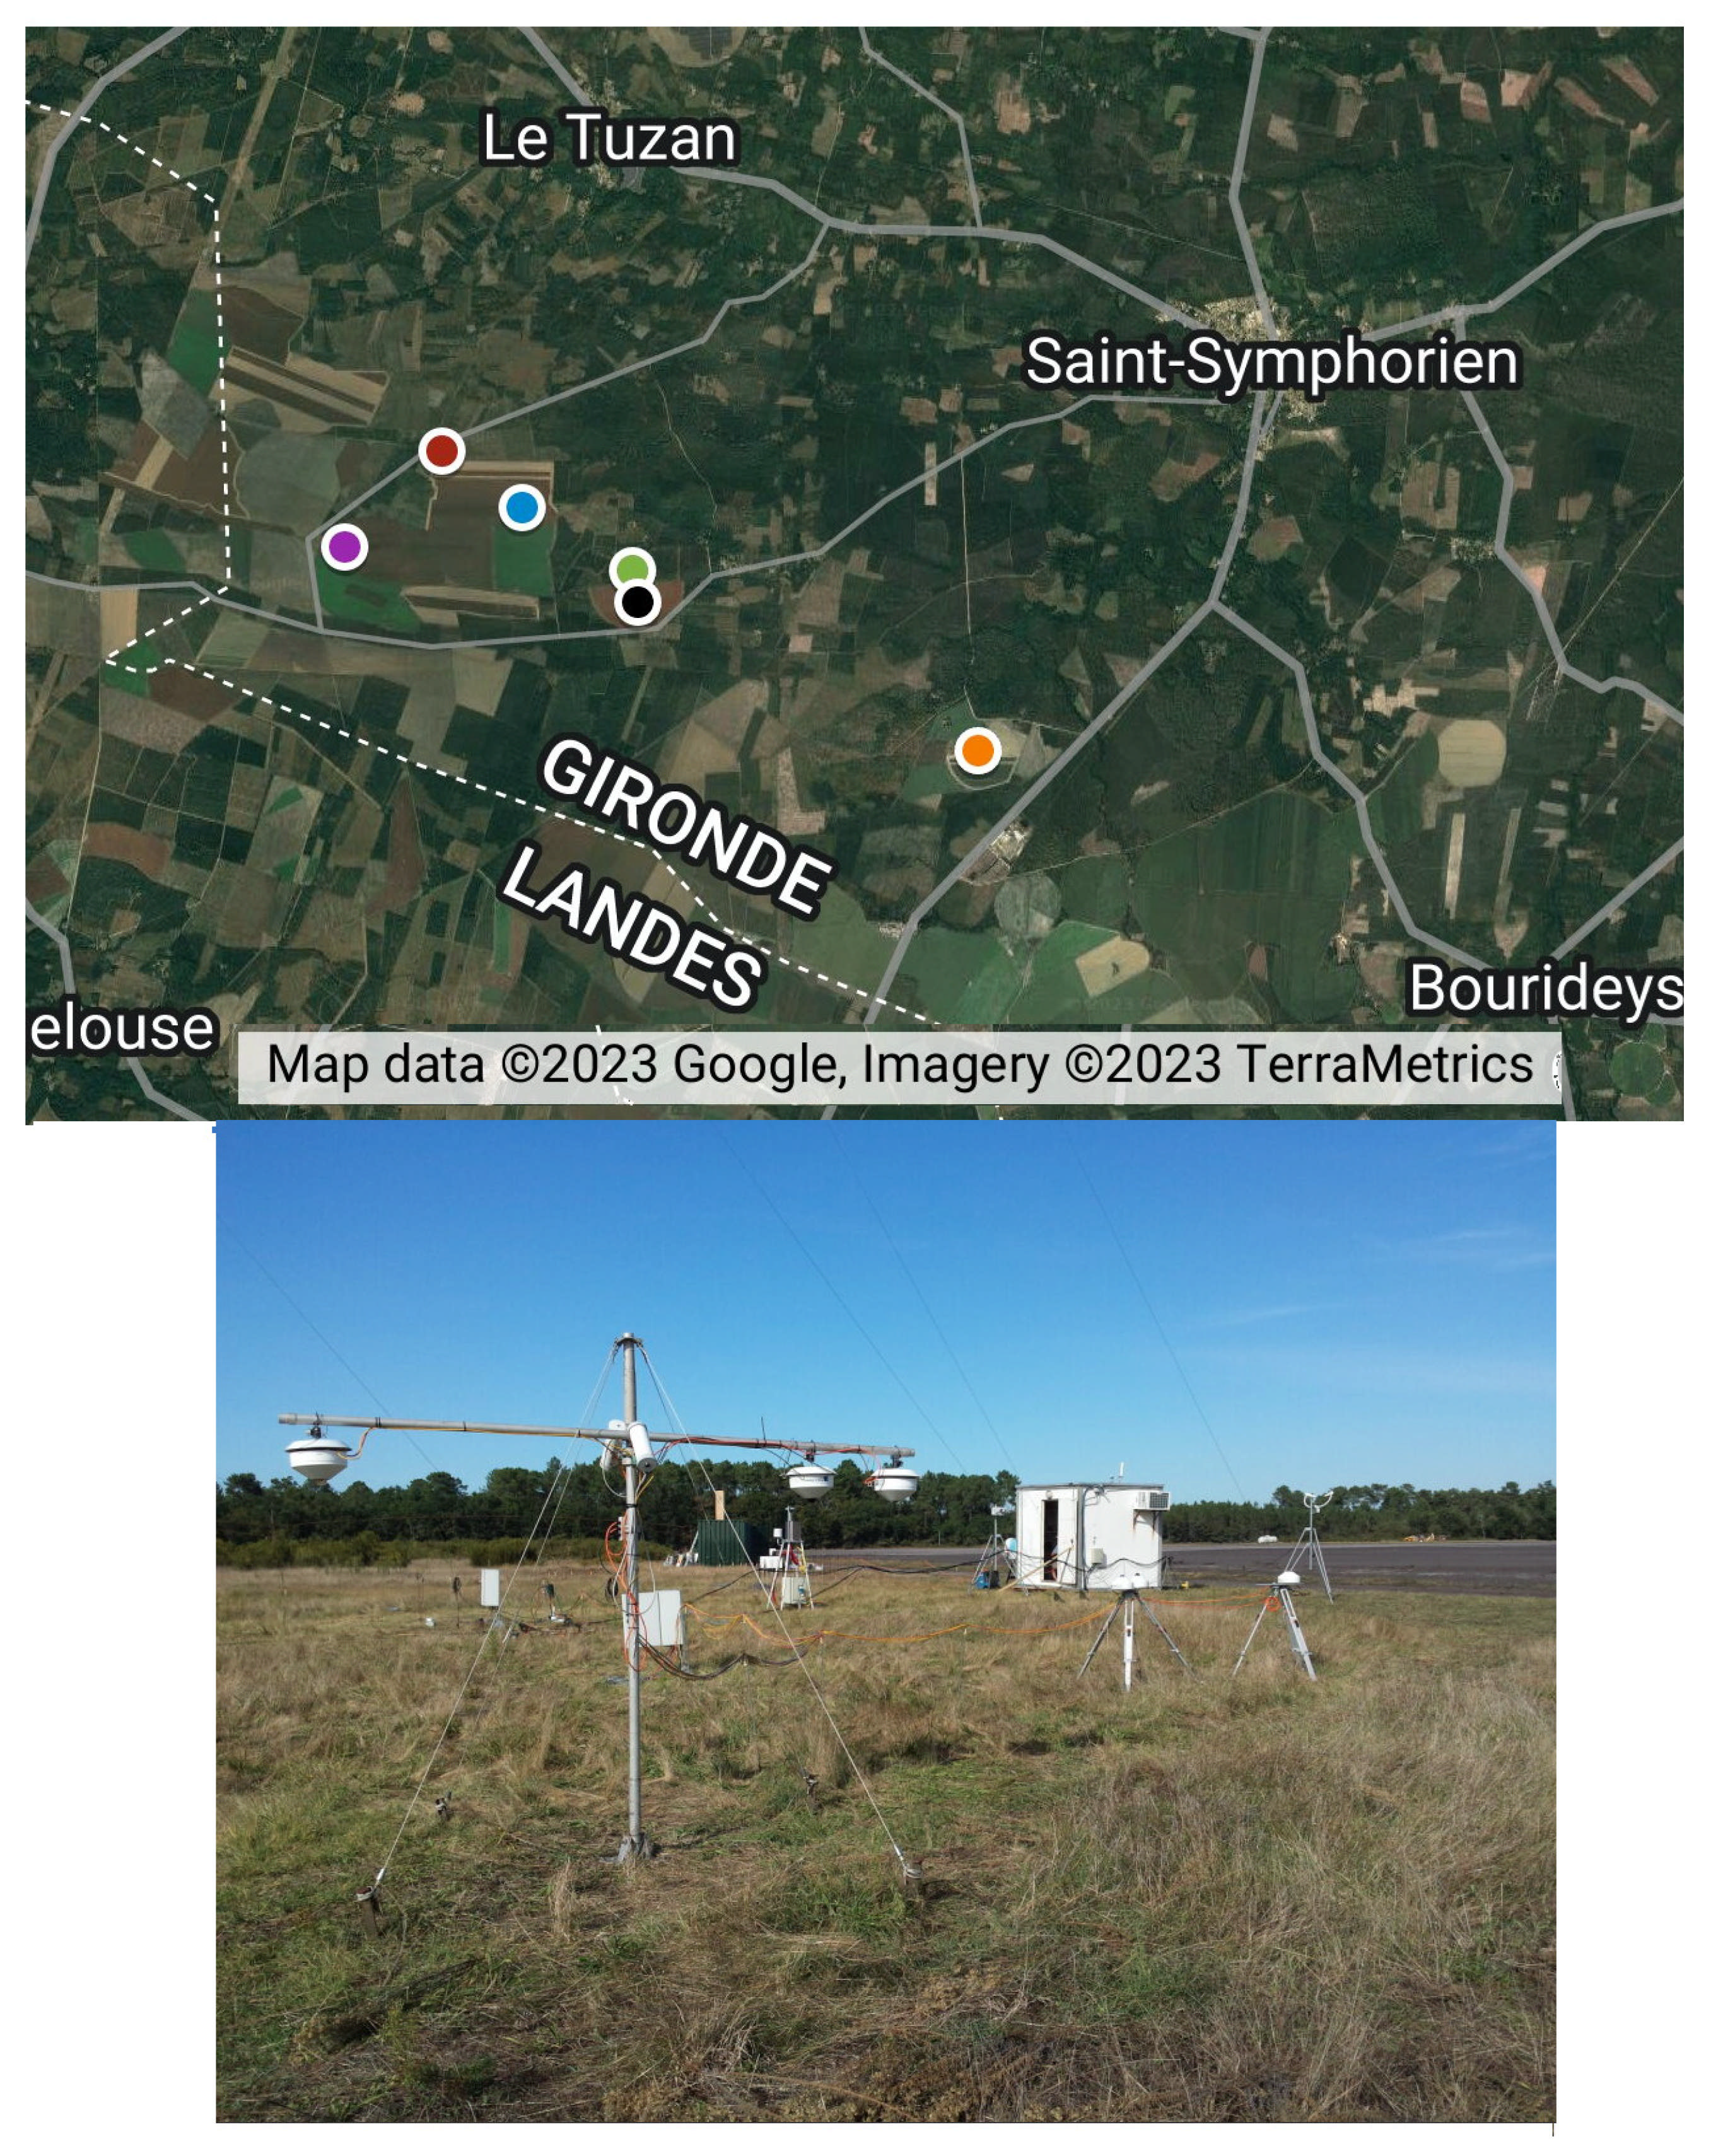
Figure 1. The top panel shows the locations of a selection of SOFOG3D measurement sites that were within a 10 km by 10 km area. The supersite of Le Couye, at which the IR camera was located, is represented by the orange marker. The other two supersites, Jachere and Charbonniere, which are used in this analysis, are represented by the purple and red markers, respectively. The blue, green, and black markers represent other field sites that were not used within this work. The lower panel shows a photo taken looking north-east at Le Couye, the direction in which the IR camera was viewing.
Atmosphere 16 01338 g001
Figure 2. Infra-red images taken using a FLIR A655s camera at the top of the 50 m mast at the Le Couye supersite. The images show the site and towards the north-east during (a) clear conditions and (b) shallow-fog conditions. The green box in (a) highlights the forested area that surrounded the site; the opening in which the site is located can be seen in the lower half of the image; the black box highlights a few bright spots, which were cattle. The features of the forest and the surface could no longer be seen when fog had covered the site in (b); however, a few particularly tall trees are highlighted by the purple box, which were above the fog-top height.
Atmosphere 16 01338 g002
Figure 3. Time-series of (a) visibility at 2 m, 23 m, and 48 m; the visibility of 1 km is marked by the horizontal dashed line; (b) vertical velocity variance at 2 m, 10 m, 23 m, and 48 m; the horizontal dashed lines represent the vertical velocity variance thresholds for fog formation [25]; (c) skin temperature and air temperatures at 1.2 m, 10 m, 23 m, and 48 m; (d) relative humidity at 1.2 m, 10 m, 23 m, and 48 m, all taken at the Le Couye site.
Atmosphere 16 01338 g003
Figure 4. Images from the IR camera captured at Le Couye on 29 October 2019 between 22:00 and 23:00 UTC showing (a) the mixing between sections of the fog layer with the air above (22:14 UTC), (b) an elevated layer of stratus cloud above the fog (22:23 UTC), (c) bands of low stratus moving over the site (22:32 UTC), and (d) stratus being formed from a section of the fog below which has lifted into the air above (22:46 UTC). The colour-bars on the images represent the temperature, with the values marked in degrees Celsius; these are not referred to in this work. The white arrows are used to highlight the events described in the caption.
Atmosphere 16 01338 g004
Figure 5. Time-series of (a) visibility at 2 m, and 23 m at Le Couye, (b) relative humidity at 2 m, 10 m, 23 m, and 48 m at Le Couye, (c) visibility at 3 m at Charbonniere, (d) visibility at 3 m at Jachere.
Atmosphere 16 01338 g005
Figure 6. Images from the IR camera captured at Le Couye on 30 and 31 March 2020 between 21:30 and 01:00 UTC showing (a) the sudden appearance of stratus on the horizon (21:30 UTC), (b) fog lifting from the layer below to form low stratus (arrow on left-hand side), and a section of fog lifting towards the low cloud above (arrow on right-hand side) (21:46 UTC), (c) break-away sections of fog ‘seeding’ the cloud above (21:49 UTC), (d) low stratus on the horizon, which appeared to be elevated just above the fog layer (00:37 UTC). The white arrows are used to highlight the events described in the caption.
Atmosphere 16 01338 g006
Figure 7. Basta cloud radar (fog product) measurements up to 400 m altitude at a site near Charbonniere.
Atmosphere 16 01338 g007
Figure 8. Time-series of (a) visibility at 2 m, 23 m, and 48 m, (b) vertical velocity variance at 2 m, 10 m, 23 m, and 48 m, (c) skin temperature and air temperatures at 1.2 m, 10 m, 23 m, and 48 m, and (d) wind direction at 2 m and 10 m. All measurements were made at Le Couye.
Atmosphere 16 01338 g008
Figure 9. Images from the IR camera captured at Le Couye on 29 October 2019 between 03:00 and 06:30 UTC which show (a,b) the mixing of sections lifting from the fog layer with the air above (03:15 and 04:21 UTC, respectively), (c) low stratus on horizon above the fog layer (04:53 UTC), (d) ‘strips’ of low stratus moving over the site (06:22 UTC). The white arrows are used to highlight the events described in the caption.
Atmosphere 16 01338 g009
Figure 10. Time-series of (a) visibility at 2 m and 23 m, and (b) vertical velocity variance at 2 m, 10 m, 23 m, and 48 m. All measurements were made at Le Couye.
Atmosphere 16 01338 g010
Figure 11. Images from the IR camera captured at Le Couye on 6 December 2019 between 01:00 and 03:00 UTC which show (a,b) the lifting and mixing of sections of fog from the layer below with the air above (01:27 and 01:32 UTC, respectively), (c) an elevated layer of stratus appearing just above the fog on the horizon (01:37 UTC), (d) a discrete section of the fog layer lifting and potentially breaking off to form low stratus (02:37 UTC). The white arrows are used to highlight the events described in the caption.
Atmosphere 16 01338 g011
Figure 12. (a) Temperature and (b) relative humidity vertical profiles measured by four radiosondes launched from Charbonniere during the evening of 5 December 2019 through to the morning of 6 December 2019.
Atmosphere 16 01338 g012
Figure 13. LiDAR backscatter data collected at Le Couye during 5 and 6 December 2019. At lower altitudes (approximately less than 70 m), the signal can become contaminated due to the overlap between outgoing and returning signal; it is therefore advised to ignore data below this. The white gaps below approximately 50 m in the plot are a consequence of this.
Atmosphere 16 01338 g013
Figure 14. Basta cloud radar backscatter data obtained from a site near both Charbonniere and Jachere during 5 and 6 December 2019.
Atmosphere 16 01338 g014
Figure 15. Time-series of (a) visibility at 2 m, 23 m, and 48 m, (b) vertical velocity variance at 2 m, 10 m, 23 m, and 48 m, (c) and the relative humidity at 1.2 m, 10 m, 23 m, and 48 m. All measurements were made at Le Couye.
Atmosphere 16 01338 g015
Figure 16. Images from the IR camera captured at Le Couye on 1 November 2019 between 00:00 and 01:00 UTC which show (a,b) mixing of sections of the fog layer with the air above (00:10 and 00:38 UTC, respectively), (c) layers of low stratus appearing on the horizon just above the fog layer (00:44 UTC), (d) more dense layer of stratus that advected to the area (00:47 UTC). The white arrows are used to highlight the events described in the caption.
Atmosphere 16 01338 g016
Figure 17. Time-series of the occurrence of peaks above the fog threshold in vertical velocity variance at heights of 23 m and 48 m. The vertical dashed lines in each plot represent the approximate time-period over which ’mixing events’ were observed in the IR camera imagery. Each plot represents a different case study; these are (a) 28 October 2019, (b) 29 October 2019, (c) 31 October 2019, (d) 5 December 2019, and (e) 30 March 2020.
Atmosphere 16 01338 g017
Figure 18. The (a) Brunt–Väisälä frequency squared and (b,c) Froude number against the time relative to the start of the ‘mixing event’ for each of the five case studies.
Atmosphere 16 01338 g018
Figure 19. A summary of the key points discussed within this section; the points are presented in the order in which they were observed and highlight the behaviour of specific variables before and after the mixing of the fog with the air above was observed. The observations presented on the left occurred before the mixing event was seen in the IR camera footage, and the observations on the right occurred during or afterwards.
Atmosphere 16 01338 g019
Table 1. Description of each case study briefly detailing the fog evolution relative to the occurrence of the mixing event and the approximate interval over which mixing was observed.
Dates of Fog
Event
Fog DevelopmentApproximate
Mixing Period(s)
28–29
October 2019
Shallow radiation fog which deepened in situ after the mixing was observed;
stratus cloud later appeared to lower and merge with fog
03:00 to 04:00 UTC
(29th)
29–30
October 2019
Shallow radiation fog which deepened in situ after the mixing was observed22:00 to 23:00 UTC
(29th)
31 October to
1 November 2019
Shallow radiation fog initially; after the mixing was observed, stratus cloud
appeared to lower, which caused some dissipation of the radiation fog
23:50 to 00:45 UTC
(30th to the 1st)
5–6
December 2019
Shallow radiation fog which deepened in situ after the mixing was observed;
stratus cloud later appeared to lower, which caused some dissipation of the radiation fog
01:20 to 01:40 UTC
and 02:37 UTC (6th)
30–31
March 2020
Shallow radiation fog advected to the site, and mixing was observed during this
process; fog temporarily dissipated but then reformed and developed vertically
21:00 to 22:00 UTC
(30th)
Table 2. The time interval between the start of the mixing event for each fog case and the increase in vertical velocity variance that directly preceded the event.
Dates of Fog
Event
Time Between the Start of the “Mixing Event” and the Preceding Increase
in Vertical Velocity Variance ( σ 2 W)
28–29
October 2019
1 h ( σ 2 W increase at 48 m)
29–30
October 2019
1 h ( σ 2 W increase at 48 m)
31 October to
1 November 2019
0 h ( σ 2 W increase at 48 m); 1 h ( σ 2 W increase at 48 m)
5–6
December 2019
0.5 h ( σ 2 W increase at 48 m)
30–31
March 2020
1.5 h ( σ 2 W increase at 23 m and 48 m)
Disclaimer/Publisher’s Note: The statements, opinions and data contained in all publications are solely those of the individual author(s) and contributor(s) and not of MDPI and/or the editor(s). MDPI and/or the editor(s) disclaim responsibility for any injury to people or property resulting from any ideas, methods, instructions or products referred to in the content.