Abstract
This study investigates the relationship between exhaust gas composition, particle number (PN) emissions, and soot microstructure of a 1.9 L compression-ignition engine operated under six controlled steady-state load regimes at 2000 min−1. Unlike standardized transient procedures (e.g., WLTP), the steady-state approach enables isolation and quantification of fundamental thermochemical processes governing soot formation and NOx production, providing engine-out data highly relevant for understanding Euro 7 emission behavior at the source. The novel contributions of this study include (i) a combined macroscopic–microscopic analysis linking PN emissions with SEM/EDS-based soot morphology; (ii) distribution-based estimation of soot mass concentration using experimentally derived primary particle sizes; and (iii) an experimental demonstration of the NOx–soot trade-off across increasing load, supported by microstructural evidence of soot oxidation and agglomeration. The results show a clear decrease in PN concentrations with increasing load (from 1.31 × 10⁷ to 6.4 × 106 cm−3), accompanied by a marked rise in NOx emissions and exhaust temperature. SEM analysis confirms a transition from fine, weakly agglomerated soot structures at low load to more compact, oxidized aggregates at high load. Distribution-based particle sizing (20–80 nm, average ~45 nm) yields soot mass estimates that are consistent with theoretical trends and more accurate than fixed-radius approaches. These findings provide experimentally supported insights into engine-out particulate behavior that complements regulatory PN metrics in Euro 7, offering a mechanistic basis for improved emission control strategies and for interpreting PN-focused regulatory thresholds under real-world operating conditions.
1. Introduction
Environmental pollution is one of the most widespread problems today, which progresses with each passing day [1]. The negative impact on nature as a result of social and industrial development directly affects all living beings on Earth, including threatening the life and health of humanity [2]. Pollutants are the result of natural causes or human activity [3]. Nowadays, transport plays a key role in economic development, trade, and people’s daily lives [4]. Transport is one of the major sectors contributing to anthropogenic air pollution [5]. Road transport is defined as the largest polluter of the environment and air, especially in urban areas, and has a significant impact on human health. Every year, the number of cars on roads increases, and with it, the amount of emissions from road transport increases [6,7,8].
Emissions from internal combustion engines (ICEs) are one of the main sources of environmental pollution in cities. These substances are released into the air during the combustion of gasoline and diesel fuel in automobile engines [9]. As a result, they become a threat to human health, especially for those who live and work near roads with intensive traffic [10,11]. Exhaust gases from ICEs contain a significant amount of emissions of various types and compositions. According to various research centers, the composition of these emissions includes a multitude (between 60 and 150) of different components, the dominant of which are nitrogen oxides (NOx); oxygen (O2); carbon dioxide (CO2), the final product of oxidation; carbon monoxide (CO), a product of incomplete combustion of fuel; hydrogen (H2); water (H2O); soot, dangerous not only as a mechanical pollutant for the environment but also as an active carrier of toxic substances; inorganic gases, such as sulfur dioxide (SO2) and hydrogen sulfide (H2S), appearing in the composition of exhaust gases in the presence of sulfur in the fuel; and many other toxic and non-toxic chemical elements [12,13,14,15]. Therefore, the problem of environmental pollution is of particular vital importance and relevance. The effects of these harmful components on nature and humans are an important part of the prerequisites for their reduction. Therefore, specialists from different countries have long been working to minimize harmful emissions from automobile exhaust gases that pollute the environment [16]. In addition to the implementation of various technical solutions to increase the environmental safety of cars, a significant role in the fight to reduce the impact of harmful substances emitted by internal combustion engines is played by modern specialized equipment for measuring and controlling their quantities under different operating modes [17,18].
Regarding air pollution from transport, EU Member States have achieved significant success in reducing the emissions of most air pollutants, due to the introduction of policy measures and technological developments [19]. The largest share of this progress is due to reduced emissions of pollutants in exhaust gases from the road transport sector [20]. The combination of stricter air pollution emission standards and the development of advanced after-treatment systems has made this progress possible [21,22]. Such actions, combined with further ambitious implementation of policies aimed at curbing inefficient transport demand and shifting transport activity towards more sustainable modes, are needed in the coming years to reduce the impact on climate, air quality, and noise [23]. Another important and effective measure in this sector is the development of vehicles with limited emissions of harmful gases [24,25].
Some of the most recent EU policy initiatives for more sustainable mobility are related to road transport [26,27]. It has the largest share of greenhouse gas emissions from transport as a whole [28]. Passenger cars generate around 12% to 16% of the EU’s total carbon dioxide (CO2) emissions, depending on the data source. This figure highlights the significant impact of the road transport sector on the EU’s climate goals [29,30]. In March 2023, the Council adopted new rules to further reduce CO2 emissions from new cars and light commercial vehicles, revising the 2019 EU regulation. The revised rules set progressive emission reduction targets. From 2030 to 2034, emissions will have to be reduced by 55% for new cars and by 50% for new light commercial vehicles compared to the 2021 targets. From 2035, all new cars and light commercial vehicles will have to be zero-emission [31]. Emission standards for cars (Euro 6/7) are another important strategy in improving their environmental performance [32,33]. The aim of the European emission standards is to reduce the levels of NOx, CO, CO2, HC, particulate matter (PM, PN) from brake linings and tires, and noise emitted by cars. These standards have had a positive impact, as a study by the Society of Motor Manufacturers and Traders (SMMT) found that 50 new cars would be needed today to produce the same amount of pollutants as a vehicle produced in the 1970s [34]. The criteria for the European standards themselves are related to the amount of harmful gases and particles emitted per unit of distance traveled. The introduction of particle number (PN) emission limits to standardize diesel vehicles has required the use of a diesel particulate filter (DPF), achieving a reduction of up to 99.99% in particulate emissions in exhaust. Current research consistently shows that particulate matter emissions and particle number (PN) are highly dependent on engine technology, the condition of the diesel particulate filter (DPF), and its regeneration mode, leading to significant variations in particle size distribution and capture efficiency. Recent studies further highlight the need for reliable and standardized PN measurement methods during PTI, as these parameters are critical to achieving Euro 7 requirements and limiting ultrafine particles from diesel vehicles [35,36,37,38,39]. This progress has led to a reassessment of the Periodic Technical Inspection (PTI) tests to detect anomalies among these low emissions. The DPF can break, become clogged, and, in some cases, be illegally removed to increase the vehicle’s power. In such cases, the vehicle may produce higher particulate emissions [40,41]. Several European countries have approved a new PN-based PTI test (PN-PTI) to replace the opacity test to detect removal/tampering or damage to DPFs in vehicles [42]. The regulation entered into force in July 2022 in Belgium and in January 2023 in Germany, the Netherlands, and Switzerland. PN emissions from diesel vehicles with DPFs at low idle speeds are typically below 5000 cm−3 and lower than ambient PN concentrations, making it easier to detect DPF defects. The methods used for particle counting are based on pulsed Diffusion Charging (DC) [43] or on CPC technology—Condensation Particle Counter technology [43].
In recent years, numerous experimental studies have investigated exhaust emissions from diesel engines under both steady-state and transient conditions. Typical studies have focused on regulated gaseous components (CO, CO2, NOx, and HC) and particle-related parameters, such as smoke opacity, particulate matter (PM), and number concentrations (PN) [44,45,46]. However, most of these studies rely on standardized driving cycles (e.g., WLTP, NEDC), which represent real-world driving behavior but do not allow for the isolation of the direct influence of key combustion parameters—such as engine load, speed, and air–fuel ratio—on primary soot formation [47,48].
Several authors have reported correlations between load and particle emissions [49,50], demonstrating that increasing load changes the soot nanostructure and oxidative reactivity. Studies on diesel soot morphology have used advanced microscopy and spectroscopy [51,52], but their results have been affected by the presence of after-treatment systems that obscure the pure effects of combustion. Furthermore, many studies have focused on emission control technologies rather than on the fundamental mechanisms of soot generation during the engine shutdown phase [22,53,54].
Despite these efforts, integrated studies that combine quantitative gas analysis, particle counting, and microscopic characterization of soot (SEM/EDS) under strictly controlled thermodynamic conditions are still lacking. Furthermore, few studies have attempted to analytically estimate the mass concentration of soot by relating measured particle counts to nanoscale morphology and density models of different carbon allotropes (graphene, graphite, and fullerene).
The aim of this work was to determine the harmful effects of exhaust gases from compression-ignition internal combustion engines (diesel engines) and to analyze the influence of engine load on exhaust gas composition and particulate emissions. To achieve this, a combination of measurement techniques was used, including conventional smoke measurement methods (Bosch and Hartridge), a modern particle counter, and a gas analyzer. In addition, filter samples from the Bosch opacimeter were examined using a scanning electron microscope (SEM) to examine the morphology of the soot. This integrated approach aims to provide a comprehensive assessment of the engine emission characteristics and to establish the relationship between load conditions, fuel consumption parameters, and soot formation. Therefore, the present study fills this gap by developing an integrated experimental–analytical framework correlating engine load, exhaust gas composition, and soot microstructure. By examining the morphological and elemental evolution of diesel soot with increasing load, this study provides new insight into the primary soot formation and oxidation mechanisms that contribute to atmospheric particulate pollution. The novelty of this work lies in the integrated evaluation of particle number emissions, gaseous pollutants, and soot microstructure obtained through SEM/EDS analysis under controlled steady-state load regimes, enabling a direct mechanistic interpretation of the NOx–soot trade-off. This combined experimental–morphological approach provides new insight into the formation and evolution of ultrafine particles from a diesel engine without after-treatment devices, offering a relevant baseline for understanding PN behavior in the context of forthcoming Euro 7 regulations.
2. Materials and Methods
The four-cylinder four-stroke diesel engine Volkswagen 1.9 D was chosen for the experiment, with parameters and indexes as follows: engine displacement i.Vh = 1.896 dm3; compression ratio ε = 22.5; and maximum brake power Pemax = 47 kW at speed n = 4400 min−1. This is a swirl chamber engine equipped by the manufacturer with a distributor-type fuel injection pump.
The engine is coupled to a direct-current brake VEM-VEB (VEM-VEB (Starkstrom-Anlagenbau Karl-Marx Stadt))—SAK 50, with a maximum braking power Pb = 50 kW, at a speed of n = 4000 min−1. The brake dynamometer measures the braking force Fb, with an accuracy of 1.96 N. The braking force is used to calculate the engine power indexes: rated power—Pe, kW; effective torque Te, N·m; and mean effective pressure pme, MPa. Figure 1 shows a scheme of the experimental setup of the study.
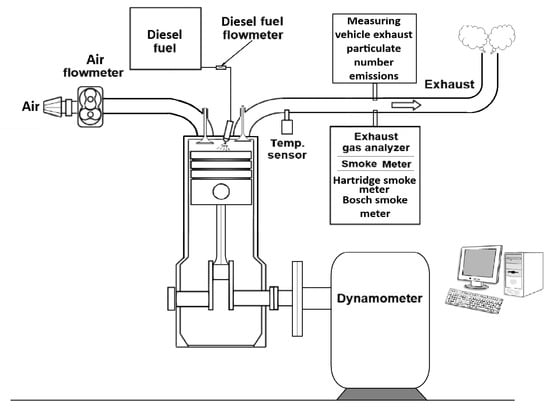
Figure 1.
Scheme of the experimental setup of the study.
The main objective of the study was to determine and analyze, in detail, the exhaust emissions of the compression-ignition engine depending on the operating conditions and loads. To obtain the necessary information during the experiment, the following measuring equipment was used:
- A Hartridge smoke meter (Figure 2), using an optical method for determining the amount of smoke in exhaust gases. The measurement of the smoke of engine exhaust gases by the Hartridge method is continuous. In Hartridge smoke meters, a certain volume of exhaust gases passes through an optical measuring chamber, which is cylindrical in shape (optical cylinder). The temperature and pressure in the measuring chamber are maintained within certain limits. At one end of the optical cylinder is a source of reference light, and at the other—a receiver of the intensity of the light flux. The output signal of the receiver is fed to the input of an electronic measuring system. A light beam passes through a sample of diesel engine exhaust gas. A detector located opposite the light source measures the amount of light that can pass through the gas. The instrument calculates the amount of light that is blocked by the smoke particles. A higher level of light blocking or absorption corresponds to a higher concentration of smoke.
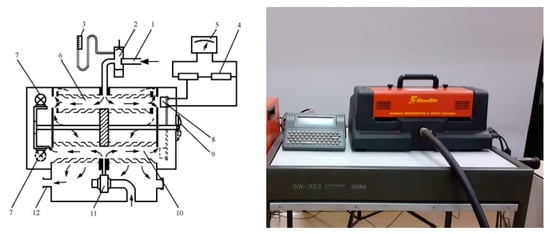 Figure 2. Scheme of the Hartridge smoke meter. 1—exhaust gas inlet, 2—condensation chamber, 3—U-manometer, 4—potentiometer, 5—smoke scale, 6—flue gas chamber, 7—light source, 8—photocell, 9—position switch (zero setting or measurement), 10—clean air chamber, 11—clean air blower, 12—outlet.
- A Bosch smoke meter, as shown in Figure 3, consisting of a sampling pump and a measuring device. The pump is used to extract a sample of the exhaust gases of the internal combustion engine, which has a volume of (330 cm3). During the sampling, the gases pass through filter paper (average pore size 4.5 μm), which is placed at the inlet of the pump. The passage of the exhaust gases through the filter paper causes it to blacken to a certain extent. According to the Bosch method, smoke density is determined by illuminating the sample with a reference light source and measuring the intensity of the light flux reflected by it. The measuring scales of the devices are graduated either in conventional units (from 0 to 10) or in percentages (from 0 to 100%), and their zeroing and taring are performed, respectively, with clean filter paper and a reference template. The measurement of smoke density using the Bosch method is not continuous, which causes some inconveniences in its application for the purposes of diagnostics and control of the technical condition of vehicles. The elements presented in Figure 3 are as follows: 1. Sampling connection—interface for drawing exhaust gas through the filter paper; 2. Filter paper disc—the paper medium on which soot particles are deposited; 3. Piston—drives the pneumatic system that moves the exhaust sample through the filter; 4. Pneumatic pumping device—generates the pressure difference to pull the exhaust through the filter paper; 5. Bellows—part of the pneumatic mechanism ensuring constant volume flow; 6. Setting knob—adjustment mechanism for sampling duration and piston return; 7. 4.5 V power supply—provides power to the measurement circuit; 8. 10 W resistor—part of the electrical circuit stabilizing the illumination; 9. 20 W resistor—regulates current through the photometric system; 10. Micrometer scale (0–10 smoke units)—the optical indicator that measures smoke density based on light attenuation; 11. Lamp (3.8 V/0.07 A)—light source for optical detection; 12. Ammeter photocell—detects the amount of transmitted light through the soot-loaded filter; 13. Filter paper (optical stage)—the same soot-laden filter is placed in the photometric path for measurement.
 Figure 3. Scheme of the Bosch smoke meter and filter papers for sampling.
- The filter paper from the samples taken with the Bosch smoke meter was further examined to analyze and determine the distribution and size of the soot with a scanning electron microscope, as shown in Figure 4, from Carl Zeiss GmbH, Oberkochen, Germany, model EVO 10, ZEISS brand, with magnification in the range of 7×–1,000,000× and resolution up to 3 nm. From the EDS Brand, we used Oxford Instruments (Oxfordshire, UK) Xplore 30, and the EDS software AZtecOne, version 5.0, Halifax Rd, Buckinghamshire, UK, which include capabilities for the detection of elements with atomic number from 4 (Be) to 98 (Cf); acquisition of a spectrum from a point; acquisition of a spectrum from a line; creation of a chemical map (mapping) of the studied sample.
 Figure 4. Scanning electron microscope (SEM).
- For the measurement of particle number concentration (PNC), a Texa device, NP 01, was used with the following technical characteristics: Technology Diffusion Charging (DC), measuring range of 5000–5,000,000 cm−3, particle size of 23–200 nm, resolution of 1000 cm−3, and error (absolute) of 25,000 cm−3—indicating the absolute error of a measuring instrument (Figure 5), developed respecting technical specifications requested by Dutch N-PTI regulation [55] and German PTB-A 12.16 [56].
 Figure 5. Diffusion Charging (DC) particle number (PNC). Note: The values, symbols, and formatting shown in the figure reflect the exact original appearance of the instrument display and have not been modified.
- A five-component gas analyzer from Texa Gasbox was used to measure carbon monoxide (CO), hydrocarbons (HCs), carbon dioxide (CO2), nitrogen oxides (NOx), and oxygen (O2), providing a comprehensive analysis of combustion products and the air–fuel ratio (Figure 6).
 Figure 6. Gas analyzer—Photograph taken by the authors during the experimental setup; no external source.
The 1.9 VW engine, mounted on a dynamometer stand, was free-flowing (without catalysts, DPFs, and mufflers), and all parameters and indicators of the engine and dynamometer brake were monitored during the experiments (Figure 7).
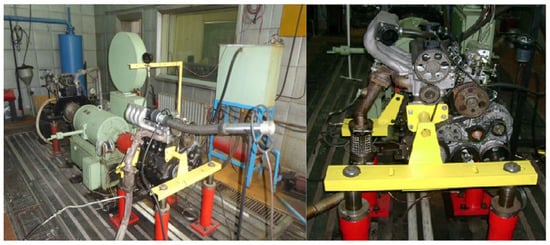
Figure 7.
Test bench with the direct-current SAK 50 brake and VW 1.9 engine—Photograph taken by the authors during the experimental setup; no external source.
The engine was operated in a free-flow configuration (without catalytic converters, DPFs, or mufflers) to allow direct measurement of engine-out emissions. This configuration was selected to investigate the intrinsic processes of soot formation and oxidation without the chemical or physical alterations introduced by after-treatment systems. The removal of exhaust treatment components enabled the collection of raw soot directly representative of in-cylinder combustion, facilitating detailed SEM/EDS characterization and accurate correlation with engine load, the air–fuel ratio, and exhaust temperature. Although not representative of on-road configurations, this approach provides fundamental data essential for understanding primary soot generation mechanisms.
The sequence of the experiments was as follows: The initial experiment was repeated twice in order to prepare, run-in and calibrate the research equipment, and bring it into operating mode, after which five consecutive experiments were performed with a step of 2 kgf load on the dynamometer brake at a controlled 2000 engine revolutions. For each of the six load conditions, data were recorded continuously over 60–90 s of steady-state operation and averaged from multiple successive readings. The standard deviations of CO, CO2, NOx, O2, and particle number concentrations remained within 3–5% of the mean values, confirming good repeatability. For soot morphology, several SEM/EDS scans were performed on different regions of each filter sample, and only consistent microstructural features were considered. This approach ensured reproducibility and minimized instrumental bias across all measured parameters.
The climatic conditions during the study were as follows: ambient temperature of 11 °C, atmospheric pressure of 720 mmHg, air humidity of 93%, and dew point of 4 °C. In each of the experiments, the amount of fuel used was controlled—exactly 30 mL. In the process of burning this amount of fuel, the following indicators were monitored: operating time, indicators of the engine and dynamometer operating mode, exhaust gas temperature, and the composition of the exhaust gases and soot. The total injected fuel mass was fixed at 30 mL per test to ensure comparability of emission results on an equal energy basis. It is acknowledged that the combustion duration varied with load, leading to different residence times and exhaust temperatures. These variations influence soot oxidation dynamics; however, all tests were performed under steady-state thermal conditions with continuous monitoring of exhaust gas temperature and the air–fuel ratio. The observed soot oxidation behavior thus reflects the combined influence of load-dependent temperature and combustion time, and the fixed-fuel protocol provides a consistent energetic reference for cross-load comparison.
3. Results
The engine operating modes and the monitored indicators are presented in Table 1.

Table 1.
ICE operating modes.
The results of the tests carried out regarding the composition of the exhaust gases and the emissions of particulate matter from the tested engine are presented below. Table 2 shows the number of tests carried out.
Table 2.
Internal combustion engine operating modes.
Figure 8 illustrates the inverse dependence between particle number concentration (PN, particles·cm−3) and nitrogen oxides (NOx, ppm) as a function of the engine’s effective power (Ne, kW). The data clearly show that as the brake power increases from approximately 3.9 kW to 17.8 kW and NOx emissions rise steadily, while the particle number concentration decreases sharply, particularly within the low-to-medium load range.
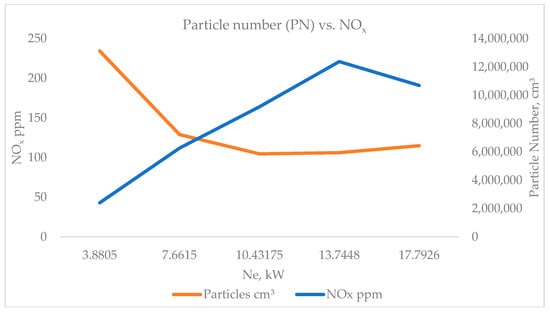
Figure 8.
Particle number, cm3, vs. NOx.
This behavior represents the well-known NOx–soot trade-off characteristic of diesel combustion processes. At low loads, the in-cylinder temperature and oxygen availability are relatively low, leading to incomplete combustion, local fuel-rich zones, and enhanced nucleation of soot precursors. Under these conditions, oxidation of nascent soot is limited, resulting in high PN concentrations and low NOx formation.
As the engine load increases, fuel injection pressure and combustion temperature rise significantly, improving mixture formation and oxidation efficiency. The higher temperature promotes oxidation of soot and hydrocarbons, thereby reducing the number of particles in the exhaust stream. Simultaneously, the elevated thermal conditions accelerate NOx generation through the extended Zeldovich mechanism, which is highly temperature-dependent.
Beyond approximately 10–12 kW, both trends begin to stabilize: PN reduction slows, while NOx levels plateau. This indicates a transition toward more complete combustion with balanced oxidation–reduction dynamics. The slight increase in PN at the highest load (≈17.8 kW) may result from fuel enrichment near full-load conditions, where localized diffusion flames reintroduce limited soot formation despite overall improved efficiency.
Overall, the figure confirms that the combustion temperature governs the competing formation pathways of NOx and soot, and the measured data align with theoretical and literature-reported diesel combustion behavior. The observed trends validate the experimental design and underscore the need for advanced control strategies—such as exhaust gas recirculation (EGR), optimized injection timing, and staged combustion—to mitigate the NOx–soot trade-off in pursuit of Euro 7 emission targets.
The observed trends in Figure 8 highlight the fundamental thermochemical interplay between temperature-dependent oxidation and nitrogen oxide formation in diesel combustion. The increase in NOx with engine load results from elevated in-cylinder temperatures and enhanced oxygen availability, while the simultaneous reduction in particle number (PN) reflects more efficient oxidation of soot precursors and reduced local fuel-rich zones. The turning point near medium load (≈10–12 kW) indicates a regime of optimal combustion efficiency where soot oxidation and NOx generation reach dynamic balance. These findings confirm that even in engine-out conditions—without exhaust after-treatment—the intrinsic NOx–soot trade-off remains a dominant characteristic of diesel operation. The results provide valuable experimental evidence supporting the need for temperature- and EGR-based control strategies to simultaneously minimize NOx and particulate emissions, in alignment with future Euro 7 emission objectives. This also places very high demands on DPF filters for vehicles with diesel engines, as the highest levels of soot concentration are generated in the most common engine operating modes.
From the point of view of the CO2 content to the air ratio (λ), the same trend is observed again. At low loads of the diesel engine and operation with lean fuel–air mixtures, the CO2 content in the exhaust gases is low. This is a direct consequence of the fact that with more air, there is better fuel combustion, which leads to these low CO2 levels. When the load increases and the fuel mixture becomes leaner, the CO2 content increases, which is due to an increase in the amount of fuel burned and a deterioration in the combustion process. Figure 9 shows the relationship between CO2 and the air ratio (λ).
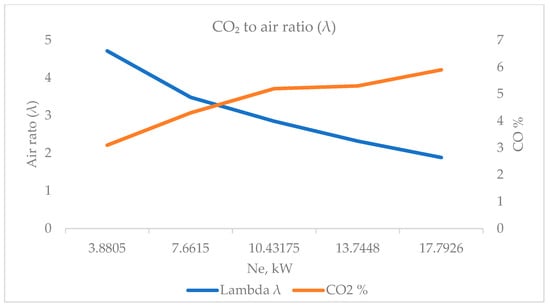
Figure 9.
CO2 to air ratio (λ).
The results obtained in terms of smoke (Figure 10) from the exhaust gases, measured by the Bosch method (Rb), showed that with increasing effective power to medium loads, smoke increases. After that, there is a clearly visible trend of decreasing smoke at high loads. The trend of increasing smoke with increasing load is also maintained by the Hartridge method (Rh), and when reaching the highest loads, it is seen that smoke decreases. This is most likely due to the enrichment of the mixture, the increase in temperature and pressure in the combustion chamber, and the temperature of the exhaust gases. As a result of these engine operating conditions, there are favorable processes of burning smaller soot particles in the combustion chamber and their unification into larger amorphous compounds of carbon atoms, which leads to a decrease in the total smoke and soot concentration. The difference in determining smoke density using the two measurement methods is most likely due to the fact that the Bosch method (Rb) is more sensitive and accurate for the sample and reflects the moment of its collection. The Hartridge method (Rh) for determining smoke density is latent and represents an average value for the time it takes to burn 30 mL of fuel.
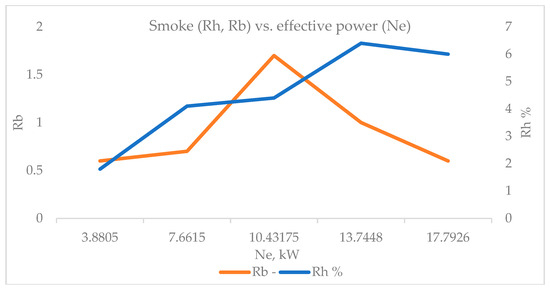
Figure 10.
Smoke (Rh, Rb) versus effective power (Ne).
This is also reflected in the well-known relationship between smoke and nitrogen oxides NOx (Figure 11), related to incomplete combustion processes and high temperatures in the cylinder, with a reduction in one usually leading to an increase in the other, and vice versa. This is the well-known trade-off in managing diesel emissions—measures that reduce soot lead to an increase in NOx, and measures that reduce NOx increase the amount of soot.
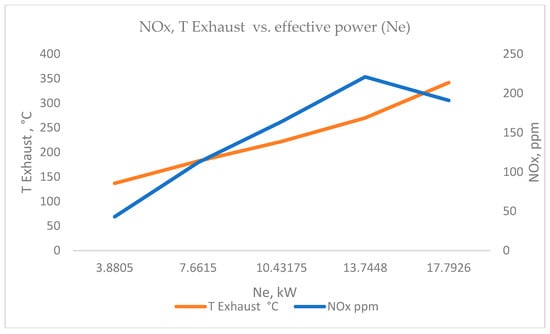
Figure 11.
NOx, TExhaust vs. effective power (Ne).
To analyze the morphology and elemental composition of the exhaust gases, the filter samples taken from the Bosch opacimeter were examined with a ZEISS EVO 10 scanning electron microscope with an energy-dispersive analyzer (EDS). The obtained micrographs reveal a typical morphology of diesel soot—agglomerates of spherical primary particles, with sizes in the range of 20–80 nm, and secondary coagulation structures united into tertiary larger conglomerates of carbon compounds. Figure 12 shows the samples taken from the filter papers from the Bosch opacimeter.
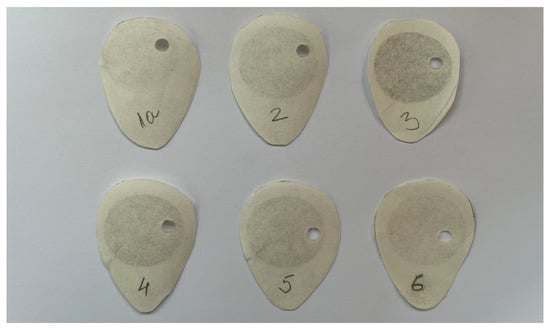
Figure 12.
Filter papers from a Bosch opacimeter—the numbers written on the filter paper discs (1a, 2, 3, 4, 5, 6) represent the sequential numbering of the experimental tests.
The results of the samples taken from the first two experiments under the same operating conditions showed well-formed spherical primary particles, bound in compact agglomerates. The size of the primary particles is in the range of 20–60 nm, which is typical of diesel soot formed at low load and stable combustion. The agglomerates have a relatively uniform structure without distinct grains of inorganic phases or metal impurities. The samples from the initial experiments (Table 3 and Table 4) reflect a stable mode of the engine and laboratory equipment. The morphology and chemical composition indicate the formation of typical diesel soot with a high content of carbon and oxygen, without the presence of inorganic inclusions. The obtained data can be taken as a basic reference value for comparison with subsequent experiments at higher loads.
Table 3.
SEM results from experiment 1.
Table 4.
SEM results from experiment 2.
The purpose of the first experiment was to work out and calibrate the laboratory equipment. The results of the energy-dispersive analysis (EDS) showed the presence of C (carbon), 56.03%; O (oxygen), 43.28%; Al, Si, S, and Ca, below 0.5% in total. The presence of Si, S, and Ca is most likely due to residual contaminants that remained on the laboratory equipment from previous studies. In all subsequent experiments, only C, O, and Al were found (Table 5), indicating that the composition of the particles is mainly C (carbon) and O (oxygen), which is typical for diesel engines and the formation of soot during incomplete combustion of fuel. The presence of Al (aluminum) in all samples is within less than 0.1–0.3% by weight. The lack of a trend of increasing or decreasing Al depending on the engine load excludes the possibility of mechanical wear or destruction of components in the engine. Therefore, we accepted aluminum as a technical background present in all samples, which does not affect the main conclusions regarding the morphology and chemical nature of the soot. Table 5 presents a summarized trend from all six samples in the experiment and the SEM/EDS analysis.
Table 5.
Summary trend from SEM/EDS samples.
The data presented in the table above gave us a clear idea of the tendency for the formation of diesel soot agglomerates from spherical primary particles, secondary coagulation structures, and combined tertiary larger conglomerates of carbon compounds. This fully corresponds to the experimental results from the gas analyzer and the smoke meters, where, at higher loads, a simultaneous increase in NOx and a tendency for a decrease in PN and smoke are observed. At low loads, the structure is finer and more uniform, while at higher loads, more intensive agglomeration and formation of larger, irregular conglomerate structures are observed. This confirms the trend reported by the smoke meters and particle counting measurements—a decrease in the amount with an increase in particle size with increasing engine load. The absence of heavy metals or inorganic phases confirms that the samples contain mainly organic carbon material with minimal inorganic impurities, which also indicates excellent work without wear of the diesel engine. This is also confirmed by the analysis of the wet images in terms of morphological characteristics observed by SEM. Figure 13 shows typical images from the different experiments, captured at different resolutions of the electron microscope. Table 6 presents summarized data and the trend for the experiments considered.
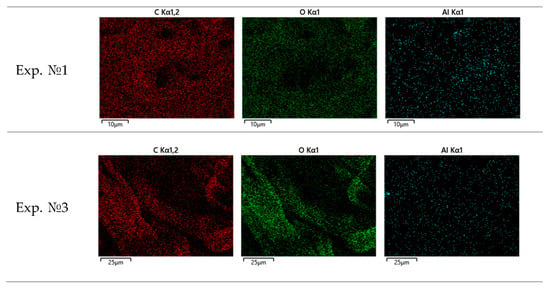
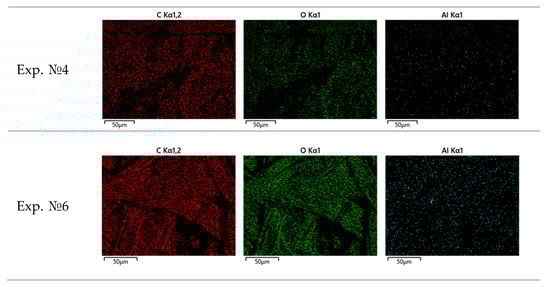
Figure 13.
Elemental distribution of C, O, and Al on Bosch filter paper.
Table 6.
Summary of the trend (experiments 1, 3, 4, and 6).
A series of scanning electron microscopy and energy-dispersive spectroscopy (SEM/EDS) analyses was carried out on Bosch filter papers collected during different engine load conditions. The results clearly demonstrate a systematic evolution of soot morphology and chemical composition with increasing engine load.
The morphological evolution is described as follows:
- At low load (experiment № 1), the soot consists of fine, loosely dispersed nanoparticles with homogeneous carbon distribution and minor surface oxidation;
- At medium load (experiment № 3), the particles begin to agglomerate, forming denser clusters where oxygen enrichment is observed around the carbon cores;
- At high load (experiment № 4), the soot aggregates become larger and more compact, exhibiting pronounced surface oxidation zones;
- At maximum load (experiment № 6), the aggregates are fully developed—dense and homogeneous, with a nearly complete overlap between carbon and oxygen signals, indicating advanced surface oxidation and thermal restructuring.
Chemical behavior:
- Carbon (C) and oxygen (O) are the dominant elements across all tests. Increasing load leads to a higher oxygen content, reflecting progressive oxidation at elevated combustion temperatures.
- Aluminum (Al) appears consistently in trace amounts (<0.3 wt%), evenly but sparsely distributed, confirming its exogenous origin (ambient aerosols or aluminum engine components) and non-participation in combustion processes.
The elemental spatial correlation is described as follows:
- The pixel-wise overlap between C and O increases with load, indicating enhanced surface oxidation.
- Under the highest load (experiment № 6), a nearly full co-localization is observed, revealing a strong chemical interaction between carbonaceous structures and oxygen-bearing surface groups.
The results showed that with increasing load and combustion temperature, the soot transitions from amorphous, finely dispersed, and slightly oxidized nanoparticles to dense, surface-oxidized agglomerates. This trend is fully consistent with the reported changes in emission parameters—an increase in NOx and a decrease in the number of fine particles (PN) at higher modes. Therefore, SEM/EDS analysis confirms that the morphology and chemical composition of the soot are directly related to the load and combustion efficiency in the diesel engine. In all experiments, a high degree of similarity was observed between the distribution of C (carbon) and O (oxygen) on the surface of the filter paper, which is indicative of the nature of soot formation in diesel engines. The results obtained demonstrate a good correlation between optical methods for assessing smoke, particle number, and morphological analysis, confirming the reliability of the experimental methodology used.
4. Calculation of Soot Mass Concentration
The main part of the solid particles contained in the exhaust gases of internal combustion engines (ICEs) is free carbon in a dispersed state, which is in the form of soot. The presence of soot is observed when the ICE operates with inhomogeneous mixtures. Diesel engines operate in all modes with an inhomogeneous fuel mixture. An inhomogeneous fuel mixture is also present in some of the operating modes of gasoline engines with direct fuel injection.
Free carbon in the exhaust gases of ICEs has the ability to absorb polycyclic hydrocarbons, which are extremely dangerous to human health, as they are carcinogenic. In this regard, emissions of solid particles are subject to strict legislative norms.
The formation of free carbon C in the ICE cylinder occurs as a result of thermal decomposition (pyrolysis) and oxidative cracking of fuel molecules in the zones where there is an over-enriched fuel mixture. These processes occur under the condition that the temperature in these zones is sufficiently high. Such conditions are created in the combustion chamber of diesel ICEs, in which diffusion combustion of inhomogeneous fuel mixtures takes place. In the zones where the fuel mixture has a local air ratio of αl ≈ 1 and self-ignites, the temperatures are high. Near the fuel jets, there are zones in which αl ≈ 0 and the conditions for pyrolysis of the fuel are created in them. Therefore, soot begins to form immediately after the start of combustion. Intensive soot formation also occurs during delayed diffusion combustion, in which fuel, in the form of drops, meets on its way not air, but combustion products.
During the expansion process, the soot comes into contact with the remaining oxygen in the combustion chamber, creating conditions for its oxidation. At an average air ratio of α > 1.5 and intense air turbulence, a large part of the formed soot manages to oxidize (burn) in the cylinder during the expansion. An increase in the amount of soot is therefore possible only when the rate of its formation is higher than that of its combustion.
The smoke value R, by which the concentration of soot in the exhaust gases is indirectly estimated, depends on the amount of free carbon—Cb—in the space above the piston at the moment the exhaust valve opens (point b of the indicator diagram), and on the volume of this space—Vb.
Using the Hartridge (RH) and Bosch (RB) methods, the smoke value R of the exhaust gases is determined by the following correlation dependencies:
where Cb is in g/m3.
If the opacity measured by the Bosch method is known, the particulate emissions can be calculated using the empirical formula of Alkidas [57]:
If the number concentration of solid particles—Np, [number/cm3]—is known and the particles are assumed to be spherical carbon particles with an average radius of RC = 45 nm, their mass in cm3 can be calculated using the formula:
where RC = 45 × 10−7 cm = 4.5 × 10⁻⁶ cm.
Note that all carbon exists in several forms: graphite = c = 2.16 g/cm3, fullerene—c = 1.65 g/cm3, and graphene—c = 2.267 g/cm3.
The mean particle radius of R = 45 nm was selected as a representative value for the soot mass concentration calculations based on both experimental and methodological considerations. The particle counter used in this study operates within a nominal detection range of 20–200 nm, which encompasses the dominant size fraction of freshly generated diesel soot. According to previous studies on diesel particulate matter (DPM) and nanoparticle emissions, the majority of primary soot particles produced under medium-load engine operation fall within the 40–60 nm range, while smaller nuclei-mode particles (<30 nm) and larger agglomerates (>100 nm) contribute less to the total number concentration. Thus, a median radius of 45 nm provides a statistically meaningful approximation that minimizes bias toward either extreme of the distribution. From a mass–size scaling perspective, since the particle mass is proportional to P3, the use of a representative median radius ensures a balanced and physically realistic estimation of the total soot mass concentration. Selecting this radius also enables comparability with the results of other experimental studies and standardized emission characterization protocols (e.g., ISO 8178 [58], PMP particle number procedures), which often assume mean diameters in the 40–50 nm range for diesel soot. Moreover, the chosen value aligns well with the morphological observations from SEM/EDS analysis, which revealed primary carbonaceous particles between 20 and 60 nm, forming larger agglomerated structures at elevated loads. Therefore, the assumption of a 45 nm mean radius represents a justified and physically consistent parameter for quantifying soot mass based on particle number concentration in this experimental framework.
We also theoretically determined the approximate mass of the soot particles for all six experiments using Formula (4). The constants and single-particle mass are as follows:
Rc = 45 nm = 4.5 × 10⁻⁶ cm;
Particle volume ≈ 3.8169 × 10⁻¹⁶ cm3.
The mass of a single particle is as follows:
Graphene ( = 2.267 g/cm3): Mp ≈ 8.653 × 10⁻¹⁶ g;
Graphite ( = 2.16 g/cm3): Mp ≈ 8.245 × 10⁻¹⁶ g;
Fullerene ( = 1.65 g/cm3): Mp ≈ 6.298 × 10⁻¹⁶ g.
Table 7, Table 8 and Table 9 present the calculations in terms of the mass of soot for the carbon forms considered.
Table 7.
Graphene density ( = 2.267 g/cm3).
Table 8.
Graphite density ( = 2.16 g/cm3).
Table 9.
Fullerene density ( = 1.65 g/cm3).
Revised Approach: Distribution-Based and Fixed-Radius Comparison.
To assess the influence of particle size on the calculated soot mass concentration, two complementary approaches were employed.
A size-distribution-based estimation was performed using SEM-derived primary particle diameters fitted to a log-normal number distribution n(d), yielding the geometric mean (GM) and geometric standard deviation (GSD). The equivalent volume radius was computed as:
and the corresponding soot mass as:
This approach accounts for the experimentally observed 20–80 nm range and captures the natural evolution of soot particle size with engine load.
In parallel, a fixed-radius model (R = 45 nm) was retained to maintain comparability with previous parametric studies and to serve as a baseline for evaluating size-distribution effects. The 45 nm reference represents the median of the counter’s detection window (20–200 nm) and approximates the mean primary particle size observed at medium engine loads.
Comparison of both methods revealed that while the absolute soot mass concentration (PM) obtained via the size-distribution model was typically 15–30% higher than the fixed-radius estimate, the relative trends across load conditions remained unchanged. This confirms that the simplified fixed-radius approach is sufficient for comparative analysis, while the distribution-based calculation enhances physical accuracy.
Hence, both results are reported as follows: the distribution-based PM as the principal value, and the fixed-radius PM as a reference baseline for consistency with earlier models and for evaluating sensitivity to particle size assumptions.
As summarized in Table 10, the distribution-based soot mass estimates differ by ≤30% from the fixed-radius reference, confirming the validity of the 45 nm assumption for comparative purposes while improving the physical accuracy of absolute PM quantification.
Table 10.
Comparison of soot mass concentrations calculated using distribution-based and fixed-radius approaches. Graphene density ( = 2.267 g/cm3).
Please note the following:
- PMfixed is calculated with R = 45 nm.
- PMdist is derived from the SEM log-normal particle size distribution.
- Δ% expresses the deviation between both models; the relative trends across load points remain consistent.
5. Limitations of This Study
Although the present study provides detailed insights into the relationship between diesel engine load, exhaust emissions, and soot particle morphology under controlled conditions, several limitations should be acknowledged to delineate the scope of interpretation.
First, all experiments were performed under steady-state operation at 2000 rpm using a single-cylinder equivalent configuration of a 1.9 L VW diesel engine without after-treatment systems (catalysts, DPF, SCR). This engine-out configuration was intentionally chosen to isolate the intrinsic combustion mechanisms of soot and NOx formation; however, it does not represent the behavior of a complete emission control system. As a result, the findings primarily describe fundamental processes rather than direct compliance with in-use emission standards.
Second, the fuel dose per test (30 mL) and load step variation (2 kgf) introduced slight differences in combustion duration and residence time, which could influence soot oxidation dynamics. Although the same total fuel mass was used, variations in burning time may affect instantaneous temperature and air–fuel ratio distributions, leading to minor deviations in transient soot formation. Future work should integrate time-resolved in-cylinder pressure and temperature diagnostics to capture these dynamic effects.
Finally, the particle size distribution was characterized from SEM images on post-filter samples. While the use of a log-normal distribution improves the accuracy of mass estimation, the sampling and image resolution limit the number of measured particles, introducing statistical uncertainty. The assumption of spherical soot morphology and constant carbon density (graphene-based, = 2.267 g·cm−3) further simplifies the calculation and may not fully capture the fractal nature of real soot agglomerates.
Despite these limitations, this study provides a systematic, engine-out baseline for understanding the coupled formation of gaseous and particulate emissions and offers a robust foundation for future experimental and modeling extensions under realistic engine and after-treatment conditions.
6. Discussion
The experimental results reveal a clear dependence of gaseous and particulate emissions on engine load under steady-state conditions at 2000 rpm. With increasing brake load, the exhaust temperature rose from 137 °C to 342 °C, accompanied by a steady increase in NOx emissions (from 43 to 221 ppm) and a decrease in particle number concentration (PN) from 1.3 × 10⁷ to approximately 6 × 10⁶ particles cm−3. This inverse trend is consistent with the classical NOx–soot trade-off inherent to diesel combustion. At lower loads, reduced in-cylinder temperature and less efficient mixing promote soot nucleation and hydrocarbon condensation, while NOx formation is limited. As the load increases, higher combustion temperature and oxygen availability enhance oxidation of soot precursors and existing particles, thereby reducing PN but promoting thermal NOx formation via the extended Zeldovich mechanism.
The particle morphology observed in SEM/EDS images supports this mechanism. With rising load, the primary soot particles became larger and more agglomerated (20–80 nm), with an increase in oxygen content on the particle surface, indicating enhanced oxidation. The elemental maps (C–O–Al) confirmed co-localization of carbon and oxygen, particularly at higher loads, reflecting progressive surface functionalization and partial oxidation of soot structures. The consistent presence of aluminum in low quantities across all samples is attributed to trace material transfer from engine components and filter substrates rather than a combustion-related element.
To quantify the effect of particle size on mass concentration, both a distribution-based and a fixed-radius (45 nm) model were evaluated. The distribution-based approach, using SEM-derived log-normal size data, provided 15–30% higher soot mass (PM) estimates compared to the fixed-radius model, due to the cubic dependence on particle diameter. Nevertheless, both models yielded identical load-dependent trends, confirming the validity of the fixed-radius assumption as a comparative benchmark. The use of both methods adds methodological robustness: the fixed value ensures comparability with previous parametric studies, while the distribution-based calculation enhances physical accuracy and captures the effect of agglomeration with load.
Overall, the results demonstrate that increasing load improves combustion efficiency, reducing PN and soot mass but at the cost of higher NOx formation. This trade-off highlights the necessity of coordinated combustion and after-treatment management in modern diesel engines. Understanding the engine-out behavior under controlled steady-state conditions provides an essential reference for optimizing EGR rates, fuel injection timing, and SCR–DPF interactions under future Euro 7 emission regulations. Future work will extend this analysis to transient cycles and model the coupled NOx–soot behavior under variable EGR and after-treatment operation.
7. Conclusions
This study examined the formation, composition, and morphological evolution of diesel soot under controlled steady-state conditions, providing a comprehensive assessment of the relationship between engine load, exhaust emissions, and particle characteristics. A 1.9 L VW diesel engine was operated at 2000 rpm across incremental brake loads, with simultaneous measurements of exhaust gas composition (CO, CO2, NOx, HC, O2), particle number concentration, and soot morphology using a Bosch-type opacimeter, a particle counter, and SEM/EDS analysis.
The results reveal a clear inverse relationship between NOx and particulate emissions. As engine load increased, exhaust gas temperature rose from 137 °C to 342 °C, while NOx emissions rose sharply (from 43 to 221 ppm) and the particle number concentration decreased significantly (from 1.3 × 10⁷ to 6.4 × 10⁶ particles cm−3). This trend confirms the temperature-driven NOx–soot trade-off, where elevated combustion temperatures enhance soot oxidation but intensify thermal NOx formation through the extended Zeldovich mechanism. The findings are consistent with fundamental diesel combustion theory and reinforce the importance of balancing in-cylinder temperature, oxygen availability, and residence time for emission optimization.
SEM/EDS characterization provided microstructural evidence supporting this trade-off. Increasing engine load led to the agglomeration of soot particles, enlargement of primary particle diameter (20–80 nm), and higher oxygen content on particle surfaces, indicating progressive oxidation. The consistent but low aluminum content across all samples was attributed to mechanical transfer from engine or filter materials rather than fuel-derived sources.
The evaluation of soot mass concentration using both a fixed-radius (45 nm) and a SEM-derived distribution-based approach confirmed that absolute mass values differ moderately (by 15–30%), while relative trends remain identical. The dual approach strengthens methodological robustness: the fixed-radius model ensures continuity and comparability with prior studies, whereas the distribution-based method refines physical accuracy and captures the agglomeration effects associated with load. This comparison validates the use of a representative radius within the counter’s sensitivity range as a reliable baseline for engine-out PM estimation.
In summary, this study establishes a quantitative and morphological link between engine load, combustion efficiency, and emission formation. The results provide valuable engine-out reference data for understanding the intrinsic NOx–soot interaction in diesel combustion and form a solid experimental basis for developing advanced emission control strategies and numerical models aimed at improving efficiency and supporting future Euro 7 regulatory compliance. These findings contribute to a deeper understanding of engine-out particulate processes relevant to Euro 7 PN-based regulation, offering mechanistic insight that complements transient test procedures and supports the development of more effective combustion and emission-control strategies.
Author Contributions
Conceptualization, I.D., E.D. and H.K.; methodology, I.D., E.D. and H.K.; software, I.D., E.D., H.K. and I.O.; validation—I.D., E.D., H.K. and I.O.; formal analysis I.D., E.D., H.K. and I.O.; investigation I.D., E.D., H.K. and I.O.; data curation I.D., E.D., H.K. and I.O.; writing original draft preparation, I.D.; writing review and editing I.D., E.D., H.K. and I.O.; funding acquisition, I.D., E.D., H.K. and I.O. All authors have read and agreed to the published version of the manuscript.
Funding
This research received no external funding.
Institutional Review Board Statement
Not applicable.
Informed Consent Statement
Not applicable.
Data Availability Statement
The data are contained within this article.
Acknowledgments
This work was accomplished with financial support from the European Regional Development Fund within the Operational Program “Bulgarian national recovery and resilience plan”, procedure for direct provision of grants “Establishing of a network of research higher education institutions in Bulgaria”, and under Project BG-RRP-2.004-0005 “Improving the research capacity anD quality to achieve intErnAtional recognition and reSilience of TU-Sofia (IDEAS)”.
Conflicts of Interest
The authors declare no conflicts of interest.
Abbreviations
The following abbreviations are used in this manuscript:
| SEM | scanning electron microscope |
| EDS | energy-dispersive spectroscopy |
| PM | particulate matter |
| PN | particulate number |
| PNC | particle number concentration |
| SMMT | Society of Motor Manufacturers and Traders |
| DPF | diesel particulate filter |
| PTI | Periodic Technical Inspection |
| DC | Diffusion Charging |
| CPC | Condensation Particle Counter |
| Rh | smoke density by Hartridge |
| Rb | smoke density by Bosch |
References
- Jain, J. From pollution to progress: Groundbreaking advances in clean technology unveiled. Innov. Green Dev. 2024, 3, 100143. [Google Scholar] [CrossRef]
- Landrigan, P.J.; Fuller, R.; Fisher, S.; Suk, W.A.; Sly, P.; Chiles, T.C.; Bose-O’Reilly, S. Pollution and children’s health. Sci. Total Environ. 2019, 650, 2389–2394. [Google Scholar] [CrossRef] [PubMed]
- Ajibade, F.; Adelodun, B.; Lasisi, K.H.; Fadare, O.O.; Ajibade, T.F.; Nwogwu, N.A.; Sulaymon, I.D.; Ugya, A.Y.; Wang, H.C.; Wang, A. Environmental pollution and their socioeconomic impacts, Technology and Nutrition. In Microbe Mediated Remediation of Environmental Contaminants; Woodhead Publishing: Cambridge, UK, 2021; pp. 321–354. [Google Scholar] [CrossRef]
- Hussain, Z.; Marcel, B.; Majeed, A.; Tsimisaraka, R.S.M. Effects of transport–carbon intensity, transportation, and economic complexity on environmental and health expenditures. Environ. Dev. Sustain. 2024, 26, 16523–16553. [Google Scholar] [CrossRef]
- Herath Bandara, S.J.; Thilakarathne, N. Economic and Public Health Impacts of Transportation-Driven Air Pollution in South Asia. Sustainability 2025, 17, 2306. [Google Scholar] [CrossRef]
- Jedlička, J.; Dostál, I.; Adamec, V. Sustainable Development and Transport. Trans. Transp. Sci. 2011, 4, 151–164. [Google Scholar] [CrossRef]
- Okechukwu, E.; Madonsela, N.; Adetunla, A. The Effect of Transportation Infrastructure on Economic Development. In Proceedings of the 2nd African International Conference on Industrial Engineering and Operations Management Harare, Zimbabwe, South Africa, 7–10 December 2020. [Google Scholar]
- Wu, Y.; Zhang, S.; Hao, J.; Liu, H.; Wu, X.; Hu, J.; Walsh, M.P.; Wallington, T.J.; Zhang, K.M.; Stevanovic, S. On-road vehicle emissions and their control in China: A review and outlook. Sci. Total Environ. 2017, 574, 332–349. [Google Scholar] [CrossRef]
- Wallington, T.J.; Anderson, J.E.; Dolan, R.H.; Winkler, S.L. Vehicle Emissions and Urban Air Quality: 60 Years of Progress. Atmosphere 2022, 13, 650. [Google Scholar] [CrossRef]
- Bai, X.; Chen, H.; Oliver, B.G. The health effects of traffic-related air pollution: A review focused the health effects of going green. Chemosphere 2022, 289, 133082. [Google Scholar] [CrossRef]
- Piracha, A.; Chaudhary, M.T. Urban Air Pollution, Urban Heat Island and Human Health: A Review of the Literature. Sustainability 2022, 14, 9234. [Google Scholar] [CrossRef]
- Slezakova, K.; Pereira, M.C.; Reis, M.A.; Alvim-Ferraz, M.C. Influence of traffic emissions on the composition of atmospheric particles of different sizes—Part 1: Concentrations and elemental characterization. J. Atmos. Chem. 2007, 58, 55–68. [Google Scholar] [CrossRef]
- Harrison, R.M.; Tilling, R.; Romero, M.S.C.; Harrad, S.; Jarvis, K. A study of trace metals and polycyclic aromatic hydrocarbons in the roadside environment. Atmos. Environ. 2003, 37, 2391–2402. [Google Scholar] [CrossRef]
- Allen, A.G.; Nemitz, E.; Shi, J.P.; Harrison, R.M.; Greenwood, J.C. Size distributions of trace metals in atmospheric aerosols in the United Kingdom. Atmos. Environ. 2001, 35, 4581–4591. [Google Scholar] [CrossRef]
- Petrova, T.; Naydenova, I.; Ferreira, R.; Karakirova, Y.; Costa, M. Chemical Characteristics of Flue Gas Particulates: An Experimental Investigation. In Environmental Protection and Disaster Risks. EnviroRISK 2020. Studies in Systems, Decision and Control; Dobrinkova, N., Gadzhev, G., Eds.; Springer: Cham, Switzerland, 2021; Volume 361. [Google Scholar] [CrossRef]
- Kochanek, A.; Janczura, J.; Jurkowski, S.; Zacłona, T.; Gronba-Chyła, A.; Kwaśnicki, P. The Analysis of Exhaust Composition Serves as the Foundation of Sustainable Road Transport Development in the Context of Meeting Emission Standards. Sustainability 2025, 17, 3420. [Google Scholar] [CrossRef]
- Din, A.U.; Ur Rahman, I.; Vega-Muñoz, A.; Elahi, E.; Salazar-Sepúlveda, G.; Contreras-Barraza, N.; Alhrahsheh, R.R. How Sustainable Transportation Can Utilize Climate Change Technologies to Mitigate Climate Change. Sustainability 2023, 15, 9710. [Google Scholar] [CrossRef]
- Fayyazbakhsh, A.; Bell, M.L.; Zhu, X.; Mei, X.; Koutný, M.; Hajinajaf, N.; Zhang, Y. Engine emissions with air pollutants and greenhouse gases and their control technologies. J. Clean. Prod. 2022, 376, 134260. [Google Scholar] [CrossRef]
- Oreggioni, G.; Mahiques, O.; Monforti-Ferrario, F.; Schaaf, E.; Muntean, M.; Guizzardi, D.; Vignati, E.; Crippa, M. The impacts of technological changes and regulatory frameworks on global air pollutant emissions from the energy industry and road transport. Energy Policy 2022, 168, 113021. [Google Scholar] [CrossRef]
- Emissions of Air Pollutants from Transport in Europe, Published 28 October 2024. Available online: https://www.eea.europa.eu/en/analysis/indicators/emissions-of-air-pollutants-from (accessed on 15 October 2025).
- Ravi, S.S.; Osipov, S.; Turner, J.W.G. Impact of Modern Vehicular Technologies and Emission Regulations on Improving Global Air Quality. Atmosphere 2023, 14, 1164. [Google Scholar] [CrossRef]
- Martinovic, F.; Castoldi, L.; Deorsola, F.A. Aftertreatment Technologies for Diesel Engines: An Overview of the Combined Systems. Catalysts 2021, 11, 653. [Google Scholar] [CrossRef]
- Noussan, M.; Hafner, M.; Tagliapietra, S. Policies to Decarbonize the Transport Sector. In The Future of Transport Between Digitalization and Decarbonization; Springer Briefs in Energy; Springer: Cham, Switzerland, 2020. [Google Scholar] [CrossRef]
- Aminzadegan, S.; Shahriari, M.; Mehranfar, F.; Abramović, B. Factors affecting the emission of pollutants in different types of transportation: A literature review. Energy Rep. 2022, 8, 2508–2529. [Google Scholar] [CrossRef]
- Chen, L.; Ma, R. Clean energy synergy with electric vehicles: Insights into carbon footprint. Energy Strategy Rev. 2024, 54, 101394. [Google Scholar] [CrossRef]
- Koralova-Nozharova, P. European Green Deal and transport sector development—Opportunities or restrictions. In Proceedings of the Sixth International Scientific Conference “Business and Regional Development”, Starozagorski bani, Bulgaria, 24–25 June 2021. [Google Scholar] [CrossRef]
- The European Green Deal. Available online: https://commission.europa.eu/strategy-and-policy/priorities-2019-2024/european-green-deal_en (accessed on 30 September 2025).
- Dolge, K.; Barisa, A.; Kirsanovs, V.; Blumberga, D. The status quo of the EU transport sector: Cross-country indicator-based comparison and policy evaluation. Appl. Energy 2023, 334, 120700. [Google Scholar] [CrossRef]
- Cars and Vans. Available online: https://climate.ec.europa.eu/eu-action/transport-decarbonisation/road-transport/cars-and-vans_en (accessed on 15 October 2025).
- Fontaras, G.; Zacharof, N.; Ciuffo, B. Fuel consumption and CO2 emissions from passenger cars in Europe—Laboratory versus real-world emissions. Prog. Energy Combust. Sci. 2017, 60, 97–131. [Google Scholar] [CrossRef]
- The European Parliament and the Council of the European Union. EU Regulation 2019/631, 17 April 2019, setting CO2 emission performance standards for new passenger cars and for new light commercial vehicles, and repealing Regulations (EC) No 443/2009 and (EU) No 510/2011. Off. J. Eur. Union 2019, 111, 13–53. [Google Scholar]
- Emission Standards. Available online: https://dieselnet.com/standards/eu/ld.php (accessed on 15 October 2025).
- The European Parliament and the Council of the European Union. Regulation (EU) 2024/1257 of the european parliament and of the council of 24 April 2024 on type-approval of motor vehicles and engines and of systems, components and separate technical units intended for such vehicles, with respect to their emissions and battery durability (Euro 7), amending Regulation (EU) 2018/858 of the European Parliament and of the Council and repealing Regulations (EC) No 715/2007 and (EC) No 595/2009 of the European Parliament and of the Council, Commission Regulation (EU) No 582/2011, Commission Regulation (EU) 2017/1151, Commission Regulation (EU) 2017/2400 and Commission Implementing Regulation (EU) 2022/1362. Off. J. Eur. Union 2024, 1257. Available online: http://data.europa.eu/eli/reg/2024/1257/oj (accessed on 15 October 2025).
- Society of Motor Manufacturers & Traders. Available online: https://www.smmt.co.uk/auto-makers-can-drive-uks-green-growth-agenda-with-carbon-emissions-halved/#:~:text=Mike%20Hawes%2C%20SMMT%20Chief%20Executive%2C%20said%2C%20Britain’s,and%20skills%20for%20people%20across%20the%20country (accessed on 15 October 2025).
- Botero, M.L.; Londoño, J.; Agudelo, A.F.; Agudelo, J.R. Particle Number Emission for Periodic Technical Inspection in a Bus Rapid Transit System. Emiss. Control Sci. Technol. 2023, 9, 128–139. [Google Scholar] [CrossRef]
- Zhang, Y.; Zhang, Y.; Lin, Y.; Fang, L.; Lou, D. Particle filter performance of soot-loaded diesel particulate filter and the effect of its regeneration on the particle number and size distribution. J. Clean. Prod. 2024, 461, 142651. [Google Scholar] [CrossRef]
- Mamakos, A.; Rose, D.; Melas, A.; Gioria, R.; Suarez-Bertoa, R.; Giechaskiel, B. Diesel Particle Filter Requirements for Euro 7 Technology Continuously Regenerating Heavy-Duty Applications. Vehicles 2023, 5, 1634–1655. [Google Scholar] [CrossRef]
- Fiebig, M.; Wiartalla, A.; Holderbaum, B.; Kiesow, S. Particulate emissions from diesel engines: Correlation between engine technology and emissions. J. Occup. Med. Toxicol. 2014, 9, 6. [Google Scholar] [CrossRef]
- Rossomando, B.; Meloni, E.; De Falco, G.; Sirignano, M.; Arsie, I.; Palma, V. Experimental characterization of ultrafine particle emissions from a light-duty diesel engine equipped with a standard DPF. Proc. Combust. Inst. 2021, 38, 5695–5702. [Google Scholar] [CrossRef]
- Melas, A.; Selleri, T.; Suarez-Bertoa, R.; Giechaskiel, B. Evaluation of Solid Particle Number Sensors for Periodic Technical Inspection of Passenger Cars. Sensors 2021, 21, 8325. [Google Scholar] [CrossRef]
- Park, G.; Park, S.; Hwang, T.; Oh, S.; Lee, S. A Study on the Impact of DPF Failure on Diesel Vehicles Emissions of Particulate Matter. Appl. Sci. 2023, 13, 7592. [Google Scholar] [CrossRef]
- Emission Standards, Periodic Technical Inspections (PTI). Available online: https://dieselnet.com/standards/eu/pti.php (accessed on 15 October 2025).
- Schriefl, M.A.; Nishida, R.T.; Knoll, M.; Boies, A.M.; Bergmann, A. Characterization of particle number counters based on pulsed-mode diffusion charging. Aerosol Sci. Technol. 2020, 54, 772–789. [Google Scholar] [CrossRef]
- Di, Y.; Zhang, J.; Shun, C.; Miao, X.; Zheng, J.; Peng, H.; Tao, W. Comparative study on combustion and particulate emissions for diesel-biodiesel and diesel-diglyme blends. Fuel 2022, 313, 122710. [Google Scholar] [CrossRef]
- Giechaskiel, B.; Melas, A.; Martini, G.; Dilara, P.; Ntziachristos, L. Revisiting Total Particle Number Measurements for Vehicle Exhaust Regulations. Atmosphere 2022, 13, 155. [Google Scholar] [CrossRef]
- Zhu, R.; Wei, Y.; He, L.; Wang, M.; Hu, J.; Li, Z.; Lai, Y.; Su, S. Particulate matter emissions from light-duty gasoline vehicles under different ambient temperatures: Physical properties and chemical compositions. Sci. Total Environ. 2024, 926, 171791. [Google Scholar] [CrossRef]
- Yan, F.; Cai, Z.; Hu, J. The state-of-the-art of soot load estimation in diesel particulate filters: A review. E3S Web Conf. 2021, 268, 01021. [Google Scholar] [CrossRef]
- Commission Implementing Regulation (EU) 2018/2042, 18 December 2018, Amending Implementing Regulation (EU) 2017/1152 to Clarify the WLTP Test Conditions and Provide for the Monitoring of Type Approval Data. Available online: https://eur-lex.europa.eu/legal-content/EN/TXT/PDF/?uri=CELEX:32018R2042 (accessed on 15 October 2025).
- Zhang, Y.; Wang, H.; Both, A.; Ma, L.; Yao, M. Effects of turbulence-chemistry interactions on auto-ignition and flame structure for n-dodecane spray combustion. Combust. Theory Model. 2019, 23, 907–934. [Google Scholar] [CrossRef]
- Wang, X.; Wang, Y.; Bai, Y.; Wang, P.; Wang, D.; Guo, F. Effects of 2,5-dimethylfuran addition on morphology, nanostructure and oxidation reactivity of diesel exhaust particles. Fuel 2019, 253, 731–740. [Google Scholar] [CrossRef]
- Zhou, Q.; Wang, Y.; Wang, X.; Bai, Y. Experimental investigation into the oxidation reactivity, morphology and graphitization of soot particles from diesel/n-octanol mixtures. J. Environ. Sci. 2022, 112, 218–230. [Google Scholar] [CrossRef]
- Wei, J.; Lu, W.; Pan, M.; Liu, Y.; Cheng, X.; Wang, C. Physical properties of exhaust soot from dimethyl carbonate-diesel blends: Characterizations and impact on soot oxidation behavior. Fuel 2020, 279, 118441. [Google Scholar] [CrossRef]
- Yin, Z.; Liu, S.; Tan, D.; Zhang, Z.; Wang, Z.; Wang, B. A review of the development and application of soot modelling for modern diesel engines and the soot modelling for different fuels. Process Saf. Environ. Prot. 2023, 178, 836–859. [Google Scholar] [CrossRef]
- Babamohammadi, S.; Birss, A.; Pouran, H.; Pandhal, J.; Borhani, T. Emission control and carbon capture from diesel generators and engines: A decade-long perspective. Carbon Capture Sci. Technol. 2025, 14, 100379. [Google Scholar] [CrossRef]
- NL. Regeling Nadere Regels PTI (Nadere Regels Voor Niet-Automatische Weeginstrumenten) [Decree on Further Rules for Non-Automatic Weighing Instruments] (NL). Staatsblad, 1 July 2022. [Google Scholar]
- PTB-A 12.16; Requirements for Non-Automatic Weighing Instruments. Physikalisch-Technische Bundesanstalt: Braunschweig, Germany, 2016.
- Alkidas, A. Relationships Between Smoke Measurements and Particulate Measurements; SAE Technical Paper 840412; SAE International: Warrendale, PA, USA, 1984. [Google Scholar] [CrossRef]
- ISO 8178; Reciprocating Internal Combustion Engines—Exhaust Emission Measurement. ISO: Geneva, Switzerland, 1996.


Disclaimer/Publisher’s Note: The statements, opinions and data contained in all publications are solely those of the individual author(s) and contributor(s) and not of MDPI and/or the editor(s). MDPI and/or the editor(s) disclaim responsibility for any injury to people or property resulting from any ideas, methods, instructions or products referred to in the content. |
© 2025 by the authors. Licensee MDPI, Basel, Switzerland. This article is an open access article distributed under the terms and conditions of the Creative Commons Attribution (CC BY) license (https://creativecommons.org/licenses/by/4.0/).