Article

Spatiotemporal Variability of Road Transport Emissions Based on Vehicle Speed Profiles—Impacts on Urban Air Quality: A Case Study for Thessaloniki, Greece

by
Natalia Liora
1,2,*,
Serafim Kontos
1,2,
Dimitrios Tsiaousidis
1,
Josep Maria Salanova Grau
3,
Alexandros Siomos
3 and
Dimitrios Melas
1,2,*
1
Laboratory of Atmospheric Physics, Department of Physics, Aristotle University of Thessaloniki, 54124 Thessaloniki, Greece
2
Center of Interdisciplinary Research and Innovation, Aristotle University of Thessaloniki, 54124 Thermi, Greece
3
Hellenic Institute of Transport, Centre for Research and Technology Hellas, 57001 Thermi, Greece
*
Authors to whom correspondence should be addressed.
Atmosphere 2025, 16(12), 1337; https://doi.org/10.3390/atmos16121337
Submission received: 19 October 2025 / Revised: 17 November 2025 / Accepted: 24 November 2025 / Published: 27 November 2025
(This article belongs to the Section Air Quality)

Abstract

This study investigates the impact of high-resolution spatiotemporal profiles of road transport emissions on urban air quality simulations for Thessaloniki, Greece. Dynamic spatiotemporal emission profiles were developed based on real vehicle speed data and implemented in an integrated air quality modeling system to improve the representation of temporal and spatial traffic activity patterns. The new profiles captured the variability of emissions across hours, days, and months, reflecting differences in congestion intensity and seasonal mobility behavior. Zero-out air quality simulations, in which road transport emissions were entirely removed from the model domain, revealed that road transport is a dominant source of urban air pollution, contributing by up to 47 μg/m3 to daily NO2 and up to 15 μg/m3 to daily PM2.5 concentrations during winter, while remaining significant in summer. The speed-based spatiotemporal profiles affected NO and NO2 concentrations by up to +20 μg/m3 and +3.8 μg/m3, respectively, during the rush hours in winter. The use of dynamic spatiotemporal profiles improved model performance with a maximum daily BIAS reduction of –5 μg/m3 for NO and an increase in the index of agreement of up to 0.13 during the warm period, demonstrating a more accurate representation of traffic-related air pollution dynamics. Improvements for PM2.5 were smaller but consistent across most monitoring sites. Overall, the study demonstrated that incorporating detailed traffic-derived spatiotemporal profiles enhances the accuracy of urban air quality simulations. The proposed approach provides valuable input for municipal action plans, supporting the design of effective traffic management and emission reduction strategies tailored to local conditions.

1. Introduction

Road transport is a major source of air pollutants such as nitrogen oxides (NOx), volatile organic compounds (VOCs), and particulate matter (PM) emissions [1,2,3], contributing significantly to urban air quality deterioration [4] and climate change, posing severe health risks to urban populations [1,5,6]. Due to the increasing urbanization and mobility demand, there is a pressing need for more accurate assessments of transport emissions to support sustainable urban development and effective air quality management.
Chemistry-transport models (CTMs) are widely used by the scientific community to simulate atmospheric processes and investigate the impacts of road traffic on urban air quality [7,8]. Their performance, however, highly depends on the accuracy of their emission inputs. However, emissions inventories are usually based on national or regional annual databases that are temporally disaggregated using static, country-level monthly, weekly, and hourly profiles [3,9,10].
Road transport emissions are directly influenced by traffic conditions, including vehicle flow and speed, which can vary significantly across different types of roads within urban centers, as well as over time [1,11]. Factors such as traffic congestion, rush hours, and the diversity of vehicle types can lead to substantial fluctuations in emission levels [12]. Recent work has demonstrated the advantages of using real-world mobility information to derive dynamic, speed-dependent emission profiles [13,14]. Thus, traffic conditions can substantially modify emission factors and increase emissions during specific hours of the day [15,16]. However, such approaches remain uncommon in research studies for Greece and for Thessaloniki where the current study focus.
Air quality in Thessaloniki is frequently characterized by high concentrations of air pollutants such as NO2 and PM, particularly during winter months due to a combination of traffic emissions, residential heating, and meteorological conditions that limit pollutant dispersion [4,17]. It should be noted that in 2019, the Agia Sofia air quality monitoring station recorded PM10 levels above the EU daily limit of 50 µg/m3 on 67 days (excluding dust transport events), significantly exceeding the maximum permissible 35 days per year [4,18]. Due to these persistent exceedances, the European Commission referred Greece to the Court of Justice of the European Union in December 2020 for failing to comply with PM10 standards in urban areas [18].
In addition, Thessaloniki’s urban road network exhibits distinct temporal and spatial traffic patterns; daily traffic flows are strongly influenced by work commuting and commercial activity [1,19]. As noted in Anagnostopoulou et al. [20], traffic flow and congestion in Thessaloniki show high temporal and spatial variability, especially in central axes connecting port and ring-road and during peak hours and weekends. These factors lead to significant variations in road transport emissions over time and across different areas of the city. Despite the clear importance of road transport for the city’s air quality, existing inventories for Thessaloniki continue to rely on national-level emission data with limited spatial detail and generic temporal profiles [3,10], while the available detailed studies are now outdated [21]. Without incorporating these patterns, road transport emissions inventories risk misrepresenting real-world conditions, leading to inaccuracies in air quality model simulations and in turn, misguided policy interventions.
Importantly, no updated study has produced dynamic spatiotemporal profiles for Thessaloniki based on real vehicle speed measurements for each road segment, even though an improved representation is essential for more accurate urban air quality simulations and effective mitigation planning.
To address this gap, this study aims to develop updated spatiotemporal profiles (on a monthly, weekly, and hourly basis) based on mean vehicle speeds at road level for the urban center of Thessaloniki, Greece for the year 2019. This approach allows for emissions to vary both spatially and temporally, as traffic conditions and consequently vehicle speeds, differ across various road types and time periods within urban centers. The updated profiles are integrated in an air quality modeling system which has been previously used and evaluated in European and regional scale [3,17,22,23] in order to identify their impacts in air quality simulations with an additional goal to support the system’s operational use in urban-scale air quality forecasting and assessment. In addition, this approach enables a more granular understanding of how emissions evolve across different urban road networks and timeframes, offering insights that can lead to more effective air quality management and policy interventions. Finally, the spatiotemporal profiles developed in this study are adaptable and can be updated in the future as new or improved vehicle speed data become available, enhancing their relevance and applicability over time.
The current analysis focuses on NOx and PM2.5 levels because these pollutants have the greatest relevance for urban air quality in cities such as Thessaloniki, where they frequently approach or exceed regulatory limits and are strongly influenced by road-transport emissions [4,24]. Furthermore, most urban mitigation and traffic-management policies explicitly target reductions in NOx and PM due to their strong association with traffic activity and their recurrent exceedances in Greek cities [4].
Section 2 describes the materials and methods, including the study area, the configuration of the air quality modeling system, and the development of the dynamic spatiotemporal emission profiles. Section 3 presents the results and discussion, focusing on the presentation of the new dynamic spatiotemporal profiles, the evaluation of the modeling system, the contribution of road transport emissions to air quality levels, and the impacts of the dynamic profiles on pollutant concentrations and modeling performance. Section 4 summarizes the outcomes of the study.

2. Materials and Methods

2.1. Study Area

Thessaloniki is the second-largest city in Greece, located in the northern part of the country, with a metropolitan population exceeding one million inhabitants. The city is a densely populated urban area characterized by high levels of vehicular activity, particularly during peak hours [19].
Furthermore, the city’s topography—situated between the Thermaic Gulf and surrounding hills—can exacerbate air pollution episodes by trapping pollutants within the urban basin [25,26]. In addition, during winter, the prevailing northwestern winds deteriorate the air quality in urban center due to the transported pollution from the western region of the city where the industrial zone is located [27].
Thessaloniki’s complex traffic behavior and emission profile make it a representative case study for developing and applying refined spatiotemporal emission profiles. Understanding and simulating road transport emissions at high spatial and temporal resolution is essential for supporting effective air quality management in this urban environment.

2.2. Modeling System

2.2.1. Description of the Air Quality Modeling System

An integrating air quality modeling system, combining the Weather Research and Forecasting model (WRFv4.1; [28]), the Natural Emissions Model (NEMO, [29,30]) and the Comprehensive Air Quality Model with Extensions (CAMxv.6.5; [31]), was implemented over a set of three two-way nested domains. The outermost domain (d01) had a horizontal resolution of 18 × 18 km2 and extended over Europe, North Africa, and the Middle East. The second domain (d02), with a finer resolution of 6 × 6 km2, covered the Mediterranean region, while the innermost domain (d03) focused on the wider Thessaloniki area in Greece at a resolution of 2 × 2 km2 (see Figure 1). The WRF meteorological model was initialized using ERA5 reanalysis data [32] while the CAMx chemical transport model utilized boundary conditions derived from the CAMS-IFS global production system [33]. NEMO estimates on-line particulate matter emissions (PM10, PM2.5) from windblown dust and sea salt and Biogenic Volatile Organic Compounds (BVOCs) from vegetation, using the hourly WRF meteorology.
Anthropogenic emissions over the study domains have been estimated for several key air pollutants, including carbon monoxide (CO), nitrogen oxides (NOx), non-methane volatile organic compounds (NMVOCs), ammonia (NH3), sulfur dioxide (SO2), and particulate matter (PM10 and PM2.5).
For European countries, the CAMS-REG-ANTv6.1 [34,35] for year 2019 has been used. The emissions database provides annual, gridded data for each GNFR (Gridded Nomenclature for Reporting) sector across a high-resolution European domain with a spatial resolution of 0.1° × 0.05° (approximately 6 × 6 km2) [36]. These emissions data were further processed to ensure spatial, temporal (monthly, weekly, and hourly), and chemical allocation across the study domains. The distribution was carried out for each emission source using country-specific temporal and chemical split factors provided with the CAMS-REG database. NMVOCs were chemically speciated into 23 individual species (e.g., alcohols, propane, butanes), while PM was disaggregated into five components: elemental carbon (EC), organic carbon (OC), sodium (Na), sulfates (SO4), and other mineral fractions. For non-European countries within the study domains, not covered by the CAMS-REG database, anthropogenic emissions were estimated using the global emission database of EDGARv6.1. This dataset, provided at a spatial resolution of 0.1° × 0.1°, corresponds to the reference year 2018 and was processed accordingly for integration into the modeling framework.
Additional on-line emissions (i.e., driven by WRF meteorological fields), integrated in the air quality modeling system, are air pollutant and particle emissions from heating systems over Greece, as described in detail in Liora et al. [3] as well as anthropogenic dust particle emissions from resuspension due to road traffic over Europe. The latter are based on gridded potential anthropogenic dust emission data provided by TNO [37] in the CAMS-REG-ANT grid. These emissions data have been spatially and temporally analyzed, similarly to the rest CAMS-REG emissions data, considering also meteorological constraints; the hourly WRF meteorological data were used on-line to regulate the hourly anthropogenic dust emissions, which were set to zero during precipitation episodes.
Anthropogenic emissions estimations from road transport over Greece are based on national emissions data and a detailed top-down approach as thoroughly analyzed in Section 2.2.3.

2.2.2. Simulation Scenarios—Base, Zero-Out and Dynamic Cases

To assess the impact of spatiotemporal emission allocation of road transport on air quality simulations, three distinct scenarios were designed and implemented within the WRF-NEMO-CAMx modeling system:
  • The Base Case Scenario (BSCN) represents the reference configuration, where all emission sources are included, and road transport emissions are temporally distributed using standard static profiles from the CAMS-REG inventory. These profiles are applied uniformly across the domains, assuming no spatial variability in traffic-related temporal patterns.
  • The Zero-Out Scenario (ZeroSCN) excludes all road transport emissions (i.e., exhaust, non-exhaust, dust resuspension) entirely, enabling the quantification of their contribution to ambient pollutant concentrations. This scenario offers insight into the sensitivity of air pollution and particle levels to the temporal resolution and spatial allocation of transport emissions. The zero-out approach, also known as the Brute Force Method (BMF), has been widely applied by scientific community in air quality modeling in order to quantify the contribution of specific emissions sources on air quality levels [23,38,39,40,41]. For instance, these studies demonstrated its effectiveness in source apportionment by sequentially removing individual sectors from the model. Although computationally intensive, the method is straightforward to implement and provides intuitive results, making it a commonly used baseline approach despite its limitations in accounting for non-linear chemical interactions, as discussed by Thunis et al. [39].
  • The Dynamic Scenario (DynSCN) incorporates the same total emissions and source categories as the BSCN but replaces the static road transport temporal profiles with the newly developed dynamic spatiotemporal profiles, which account for mean vehicle speeds and therefore traffic patterns within the Thessaloniki urban area (see Section 2.2.5). This scenario allows for a more realistic temporal and spatial distribution of road transport emissions in Thessaloniki.
Note that for Dynamic and Zero-out scenarios, changes in road transport emissions refer only to domain d03. The simulation results of the scenarios are compared with the BSCN.
The WRF-NEMO-CAMx modeling system was applied for two periods (cold/warm) of the year 2019; for January (3–19) and August (4–20) 2019 for all scenarios. The year 2019 was selected as the reference period for this study due to the unavailability of more recent CAMS-REG emissions data (e.g., for 2023) at the time of model setup, and to avoid the atypical conditions of the COVID-19 pandemic years (2020–2022), which were characterized by significantly reduced road transport activity. For example, Politis et al. [42] demonstrated that the number of daily trips per person, in Thessaloniki, decreased by approximately 50% on average during the lockdown period.

2.2.3. Road Transport Emissions

Anthropogenic emissions from road transport over Greece are derived from the official national emission inventories submitted by Greece in compliance with the EU National Emission reduction Commitments (NEC) Directive (2016/2284/EU). The inventory is compiled by the competent national authority and include sector-specific annual emission totals for key pollutants such as NOx, NMVOCs, CO, and PM. The reported data are publicly accessible via the European Environment Agency’s Central Data Repository (CDR) [43].
The aforementioned emissions have been estimated using the Computer Programme to Calculate Emissions from Road Transport 5 (COPERT 5, [44]), in accordance with the EMEP/EEA methodology [45]. This approach includes detailed input data such as energy consumption by fuel type, vehicle type, engine technology, vehicle-km, average speed per road type, and climatic conditions.
The model calculates both exhaust and non-exhaust emissions across all major vehicle categories, including passenger cars, light-duty vehicles, heavy-duty vehicles and buses, as well as mopeds and motorcycles. Exhaust emissions are estimated for different fuel types—gasoline, diesel, and LPG/CNG—and include pollutants such as NOx, CO, NMVOCs and PM. Non—exhaust emissions are also included, covering gasoline evaporation (including NMVOCs emissions), and PM emissions from tire and brake wear, and road surface abrasion. The calculations were performed separately for three distinct road types: urban, rural, and highways.
For 2019, total fuel consumption from road transport, in Greece, amounted to approximately 213,154 TJ—of which 205,147 TJ came from liquid fuels, 627 TJ from gaseous fuels, and 8286 TJ from biomass sources [45].
In the following subsections, the top-down approach used to spatially and temporally distribute the national annual road transport emissions over the study domains is presented.

2.2.4. Spatial Distribution

The annual national emissions from road transport had been provided separately for each road type (rural, urban, highways) [4]. The spatial allocation of national road transport emissions was carried out using a GIS-based approach, utilizing the most recent Greek road network dataset downloaded from OpenStreetMap (OSM) via the National Geoportal [46]. The road network was classified into three main categories (urban, rural, and highways) based on road attributes.
For the urban road transport emissions, the spatial distribution was performed by intersecting the road segments with the municipality boundaries defined as urban areas. According to Eurostat’s definition of urban clusters, these include areas with a minimum total population of 5000 inhabitants [47]. A weighting coefficient was calculated for each road segment based on its relative length within the municipality and the share of the municipality’s population in the national urban population total. This coefficient was used to proportionally allocate the national annual emissions to individual road segments. Emissions per unit road length were then calculated and spatially joined with the road network. Finally, emissions were aggregated within the modeling grid cells by intersecting the road layer with the study domain grids, resulting in gridded emission fields for each pollutant and reference year.
For rural road transport emissions, a complementary spatial allocation method was applied to ensure full coverage of the national road network. The rural network was defined by selecting road segments classified as primary, secondary, or tertiary, with speed limits typically between 30 and 90 km/h, and by incorporating road segments from the urban network that were not included in the urban allocation due to falling outside high-population municipalities. These rural road segments were then intersected with municipal boundaries while a similar weighting approach was adopted, combining population and road length information. After calculating emissions per unit length, rural emissions were mapped to the road segments and subsequently intersected with the modeling grid.
Finally, for the highways, spatial allocation of emissions was based on a detailed classification of the national motorway network using specific road attributes (e.g., motorway) and speed limits of 90 km/h or higher. The highway network was divided into distinct road segments assigned unique road IDs corresponding to major highway corridors. The annual national emissions for 2019 from all highways were allocated to each highway corridor based on the vehicle-kilometers traveled for each corridor, as derived by the HELLASTRON statistics data [48]. Emissions per unit length were then computed for each pollutant and distributed spatially by intersecting the highway network with the modeling grid cells, similarly to a previous method for urban and rural emissions.
For instance, Figure 2 represents the annual NOx emissions per road length (in gr/m) from gasoline vehicles over the urban network of Thessaloniki along with the final gridded NOx emissions over the 2 km resolution grid.

2.2.5. Temporal Distribution

Static Temporal Profiles
The temporal distribution of the annual national road transport emissions was initially performed on a monthly, weekly and hourly basis using temporal profiles provided with CAMS-REG-ANT database. This dataset provides temporal profiles of emissions for each country and each emissions source. For Thessaloniki domain (d03), the hourly distribution of road transport emissions was performed using a local temporal profile derived from traffic flow measurements collected along a main road axis of Thessaloniki within the framework of the REMEDIO project [1]. This approach allowed for a more accurate representation of local diurnal traffic patterns in the urban area. However, it also highlights the need for the development of more detailed spatiotemporal profiles that reflect variations in traffic activity across different road segments and zones of the city, in order to improve the temporal and spatial accuracy of emission inventories and support high-resolution air quality modeling. The aforementioned temporal static profiles were applied for the temporal distribution of road transport emissions in the base scenario (BSCN).
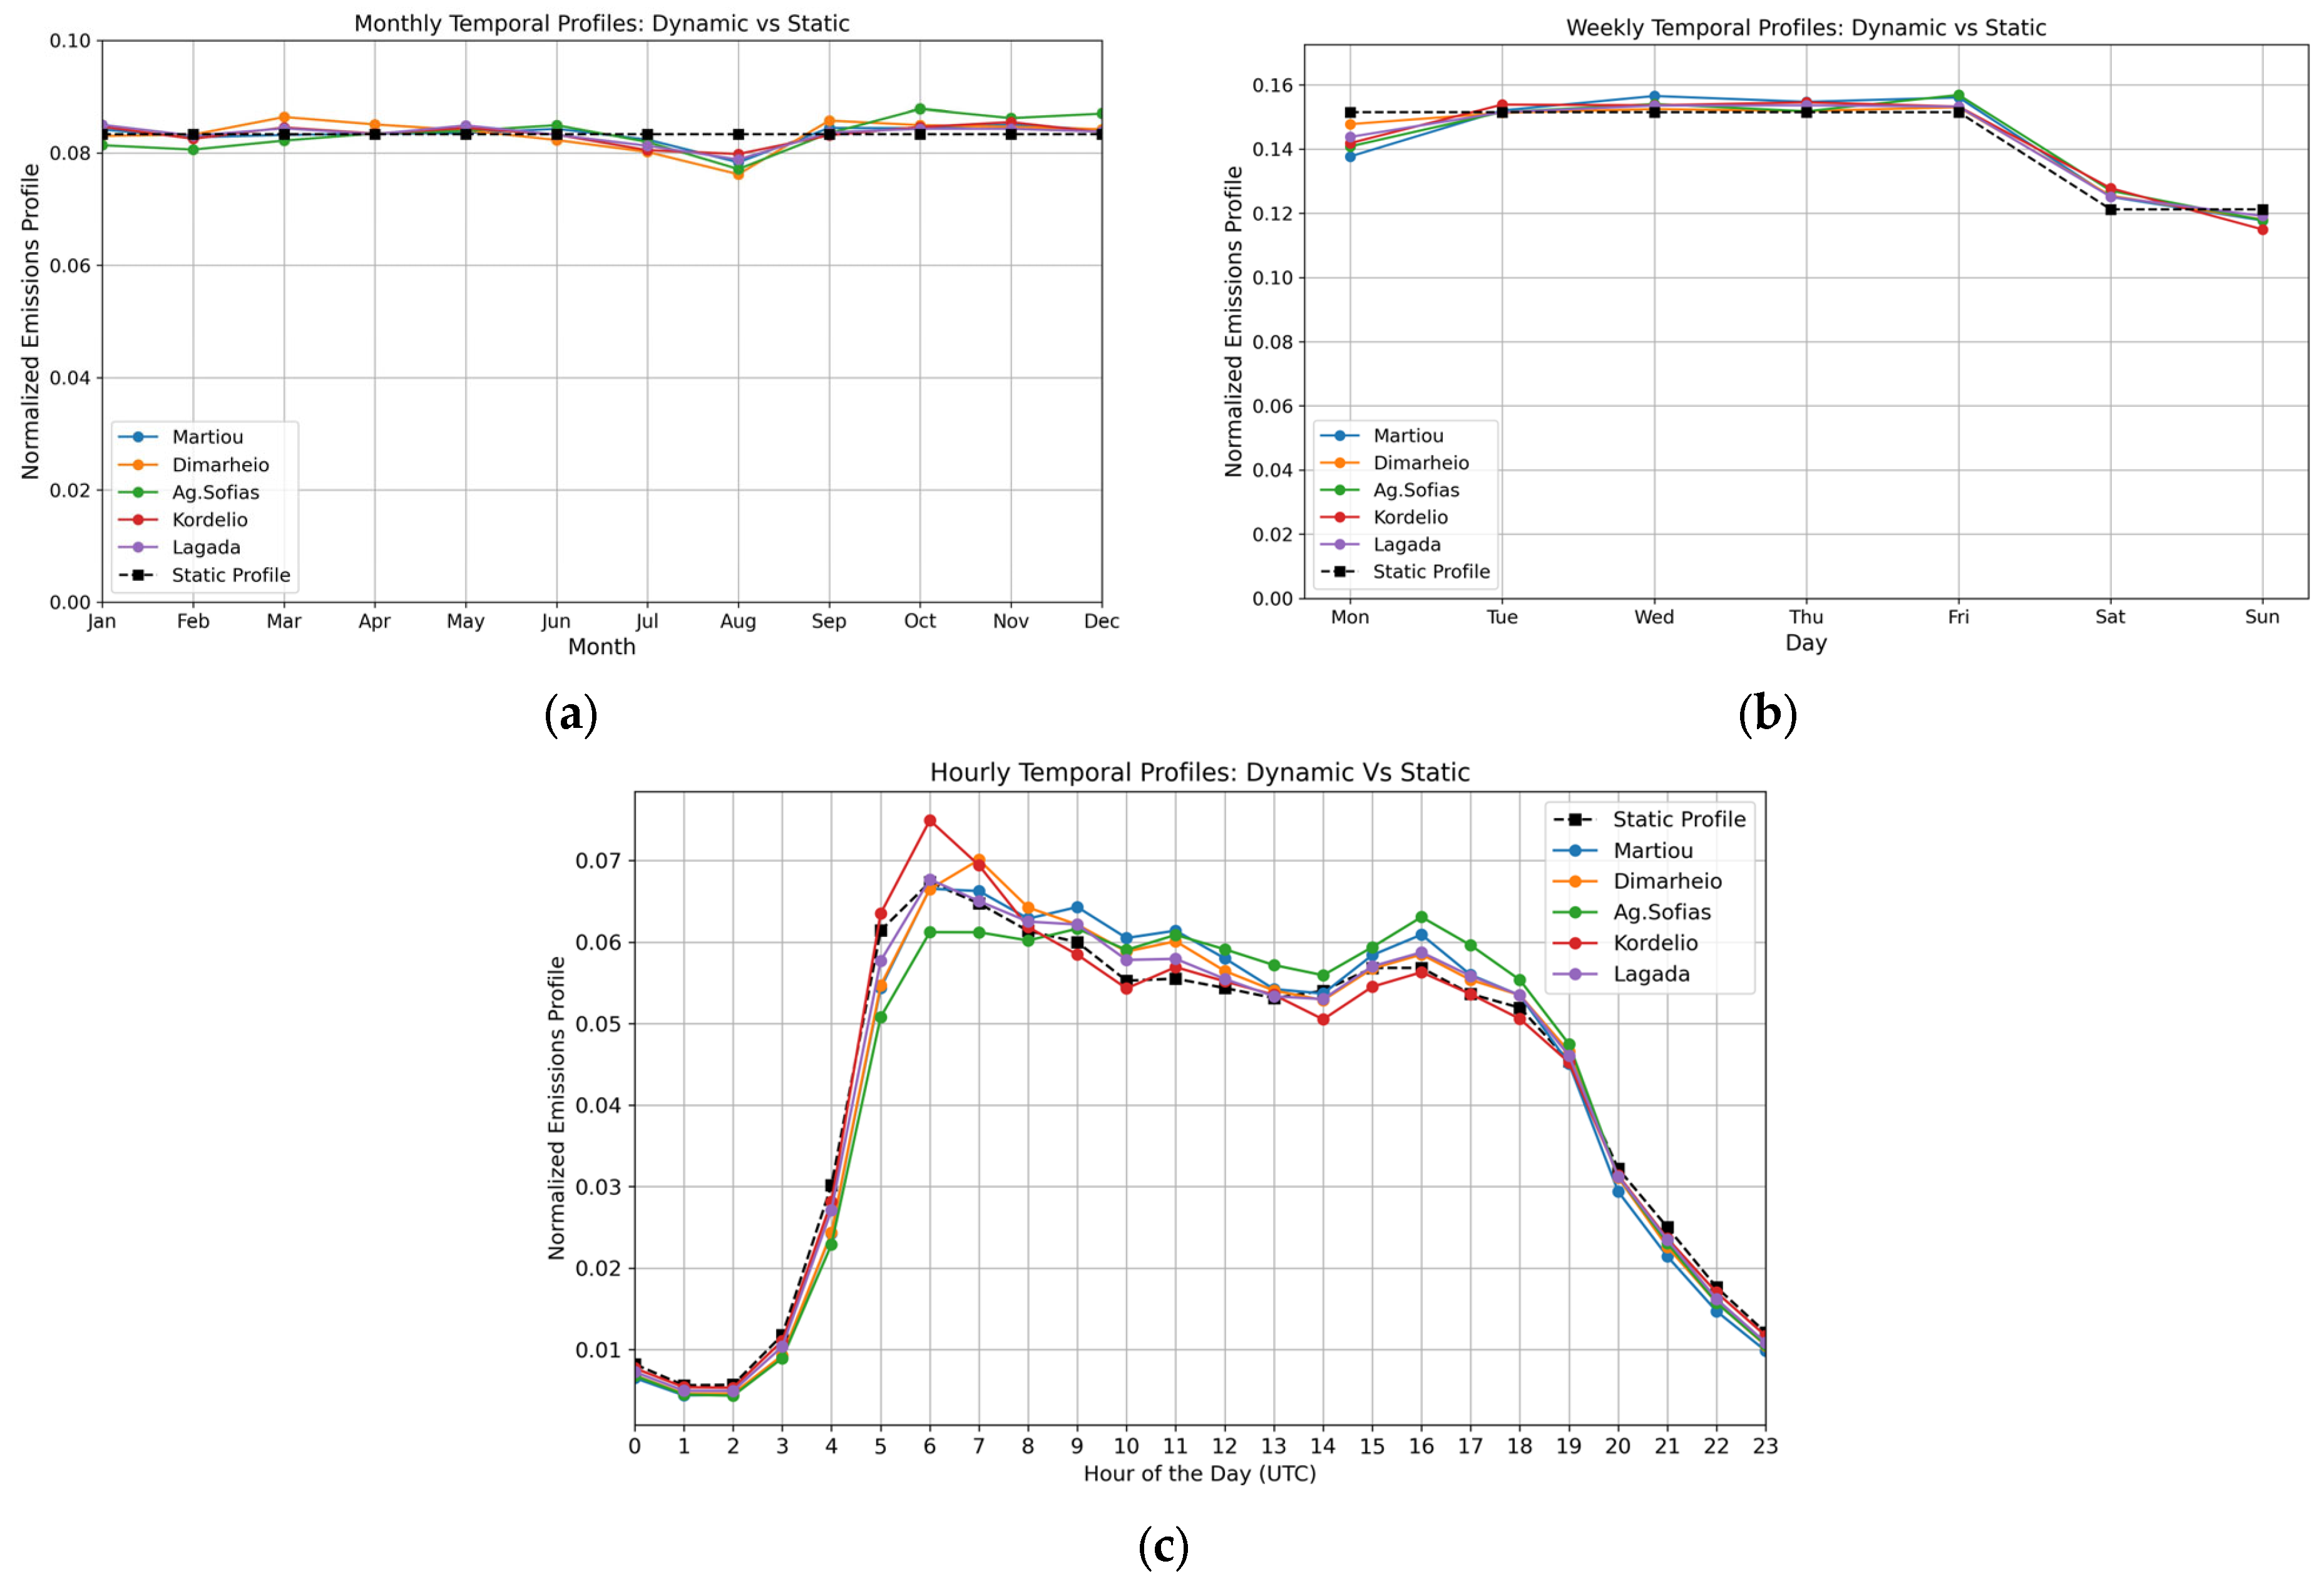
The monthly distribution was based on the CAMS-REG dataset, which provides road transport emission profiles for Greece. According to this dataset, monthly emissions remain stable throughout the year, with no variation on a monthly basis. The weekly profile assigns equal emission shares to all weekdays (Monday to Friday) and a lower, but identical, share to both Saturday and Sunday. The hourly static profile reflects a typical diurnal traffic pattern with pronounced morning (6:00 UTC) and afternoon (16:00 UTC) peaks.
Dynamic Temporal Profiles
High-resolution mean hourly vehicle speed data for the year 2019, provided by the Hellenic Institute of Transport of the Centre for Research and Technology Hellas (CERTH-HIT), were utilized to develop spatiotemporal dynamic emission profiles for the Thessaloniki Road network applied in the dynamic scenario (DynSCN). More specifically, the dataset included vehicle speeds recorded on specific links within the road network of Thessaloniki, as captured by Bluetooth detectors installed at strategically significant locations. The speed data forms part of the Living Lab of CERTH-HIT, which continuously monitors the mobility ecosystem in Thessaloniki, as described in Ayfantopoulou et al. [49]. Specifically, the system records, on an hourly basis, the minimum, maximum, and average speeds of vehicles traversing each monitored link for the year 2019. Utilizing OSM data, these speeds are spatially integrated on the map. For each link, OSM provides attributes such as the link ID, link length, free-flow speed, free-flow travel time, road type (e.g., residential), number of lanes, street name, orientation, and geometry. Furthermore, these data are incorporated into the TrafficThess tool [50], which provides real-time insights into traffic conditions along the city’s major roads. Through this tool, users can select individual links to examine speed fluctuations over the past 24 h.
Figure 3 depicts a part of the modeling domain d03 (at 2 km resolution) covering the urban area of Thessaloniki along with the Level of Service (LOS) categories and the locations of air quality monitoring stations used in the current study.
Regarding LOS, these refer to the LOS categories of the monitored road segments in Thessaloniki, for the year 2019, classified according to the distribution of observed average speeds. Specifically, the classification methodology applies speed thresholds derived from the 33rd and 67th percentiles of the average speed distribution across all links. Road segments with average speeds above the 67th percentile are classified as green, representing high performance. Segments with speeds between the 33rd and 67th percentiles are classified as yellow, indicating moderate performance. Finally, segments with average speeds below the 33rd percentile are classified as red, highlighting lower performance or potential congestion issues.
The air quality monitoring stations depicted in Figure 3 belong to the Municipality of Thessaloniki and the Regional Unit of Thessaloniki (National Air Quality Monitoring Network operated by the Ministry of Environment and Energy), namely Martiou, Dimarheio, Ag. Sofias, Lagada and Kordelio, located in the grid cells of the 2 × 2 km2 resolution grid. Hereafter, the corresponding grid cells will be referred to by the names of the respective monitoring stations. Ag. Sofias is situated in the city center, while Dimarheio and Martiou represent the eastern urban sector within the municipality. Kordelio is located in the western part of the city, near the industrial zone and Lagada is located within one of Thessaloniki’s major arterial roads in the western part of the city.
For the development of spatiotemporal profiles based on the aforementioned vehicle speed data, temporal attributes (hour, weekday, and month) were extracted, and only road segments (link IDs) with complete time series coverage were retained. Mean speeds were aggregated by hour, weekday, and month for each link ID. To estimate relative emission intensity across the network, normalized inverse-speed-based weights (Equation (1)) were calculated under the assumption that lower average speeds—indicative of congestion—are generally associated with higher vehicular emissions. Specifically, the inverse of the mean speed for each time interval was computed and normalized within each link to produce a relative weighting factor that reflects the temporal variability in potential emission intensity. Subsequently, the road-specific temporal profiles (Equation (2)) were adjusted using the national temporal static profiles for hourly, weekly, and monthly scales, resulting in final normalized emission profiles for each road segment.
W i , t = 1 u i , t t 1 u i , t
P i , t = W i , t · N t t W i , t · N t
  • Wi,t is the normalized inverse-speed weight, for link ID i at time step t,
  • ui,t is the mean vehicle speed for link ID i and time step t and
  • Pi,t is the spatiotemporal profile for link ID i and time step t
  • Nt is the national static profile at time step t
where time step t represents the temporal resolution (hour, week, month)
The final profiles for each road segment were subsequently aggregated over the 2 × 2 km2 grid (d03), capturing hourly, weekly, and monthly emission patterns.

3. Results and Discussion

This section presents the developed dynamic spatiotemporal profiles of road transport emissions. The performance evaluation of the modeling system is also provided for the selected simulation periods under the base scenario. Furthermore, the contribution of road transport emissions to air quality levels in Thessaloniki is analyzed, with emphasis on the impact of the dynamic profiles on pollutant and particle concentrations across temporal (monthly, weekly, hourly) and spatial scales. Improvements in model performance resulting from the use of dynamic spatiotemporal profiles are also discussed.

3.1. Dynamic Spatiotemporal Emissions Profiles

Figure 4 illustrates the final spatiotemporal dynamic emission profiles generated for specific grid cells of domain d03 (at 2 km resolution, see Figure 3) within the urban area of Thessaloniki.
On a monthly basis (Figure 4a), the dynamic emissions profiles reveal a slight variation in emissions throughout the year, in contrast to the static profile, which remains constant across all months. In addition, dynamic profiles show a clear reduction in emissions during the summer period, with a distinct dip in August, likely attributed to decreased traffic activity during the holiday season. It is worth noting that in August, the maximum reduction in emissions is observed close to the city center (e.g., Dimarheio, Ag. Sofias), where commercial activity typically decreases during the holiday period. In contrast, the reduction is less pronounced in the western part of the city (e.g., Kordelio), which is located near the industrial zone, where operations remain relatively stable throughout the year.
The dynamic weekly temporal profiles (Figure 4b) show noticeably lower emission values on Mondays compared to the static profiles, reflecting reduced traffic activity typically observed at the start of the work week. Additionally, the dynamic profiles distinguish between Saturday and Sunday, with higher emissions on Saturday, which more accurately represents real traffic patterns—such as increased commercial and personal mobility on Saturdays compared to the generally lower activity levels on Sundays.
On an hourly basis (Figure 4c), the dynamic temporal profiles exhibit significant spatial variability across different grid cells, highlighting the heterogeneity of traffic flows within the urban area. In the western part of the city (Kordelio), a distinct early morning peak is observed around 06:00 UTC, corresponding mainly to the start of commuter traffic. A similar trend is observed in Lagada, though with less pronounced peaks. In contrast, in the city center (e.g., Ag. Sofias), the morning profile is more gradual, with emissions increasing steadily during the early hours and reaching a first peak around 09:00 UTC, likely associated with commercial activity. A more pronounced peak is observed in the afternoon, around 16:00 UTC, reflecting increased vehicular activity during the evening rush hour. Dimarheio and Martiou exhibit similar hourly profiles, characterized by a distinct morning peak around 07:00 UTC, followed by a gradual decline during the remaining morning hours.
These spatial differences underscore the advantage of using dynamic profiles, as they better capture the temporal patterns specific to each area’s land use and traffic characteristics.

3.2. Modeling System Evaluation

The WRF-NEMO-CAMx modeling system has been thoroughly evaluated in previous studies at both regional and urban scales [3,17,22,29]. In the present study, the modeling system is further evaluated for the Base Scenario (BSCN) for the selected simulation periods, focusing on air temperature and air pollutant concentrations (NO, NO2, PM10, PM2.5) within the Thessaloniki study domain (d03).
The quantitative evaluation of the results is based on key statistical metrics, as detailed in the Supplementary Material. These include Pearson’s correlation coefficient (R), mean bias (MB), root mean square error (RMSE) and the Index of Agreement (IOA), which together offer a comprehensive assessment of model performance and accuracy.
Model validation was performed exclusively for the area of Thessaloniki using measurement data from two sources: the air quality monitoring network of the Municipality of Thessaloniki and the monitoring stations (meteorology and air pollution) operated by the Regional Unit of Central Macedonia. The air pollution measurement data of the Air Pollution Monitoring Network (APMN) operated by the Regional Unit of Central Macedonia are available online through the Greek Ministry of the Environment and Energy. Tables S1 and S2 in the Supplementary Material present detailed information on all stations used in the evaluation, including their coordinates and classification by type (e.g., urban traffic, urban background), supporting the interpretation of model performance across different urban environments.
Regarding the validation of the meteorological model WRF, according to Table 1, the model seems to be able to simulate near-surface air temperature across all sites. The BIAS ranges from −0.28 °C to −0.15 °C in January and from −1.32 °C to −0.47 °C in August. The correlation is around 0.8 in January and increases up to 0.94 in August, indicating satisfactory model performance. The IOA values are consistently high (0.87–0.96), while RMSE fluctuate within expected values for the simulated periods. Overall, these results indicate good model performance in reproducing air temperature patterns over the study domain.
In terms of air pollutant concentrations, the model shows satisfactory performance in identifying the patterns of NO2, and PM. For NO2 (Table 2), the model reproduces temporal patterns reaseonable well in both seasons. During winter, correlations range from 0.70 to 0.75 and IOA from 0.80 to 0.85, indicating good agreement across all stations. In summer, performance decreases, with correlations values up to 0.55 and IOA up to 0.63, along with positive biases of up to +22.7 μg/m3 at Ag. Sofias. The summertime overestimation of NO2 is likely linked to uncertainties in the representation of photochemistry as well as the use of national emission profiles that do not fully capture the reduced traffic activity in Thessaloniki during this period, as seen in Section 3.1. Similar performance is found for NO levels (Table S3, in the Supplementary Material).
For PM2.5 (Table 3), the overall agreement is moderate, with mean correlation values of ~0.35 and mean IOA ~0.55 across both periods. Concentrations are generally underestimated, except at Martiou in winter where a positive bias is found. For PM10 (Table S4, in the Supplementary Material), winter performance shows correlations with values up to 0.62 (mean ~0.45) and IOA values range from 0.58 to 0.73, with the best results at Lagada station (R = 0.55, IOA = 0.73). In summer, performance is weaker, with prevailing underestimations across stations.
Overall, the evaluation shows that the modeling system reproduces the temporal variability and relative levels of traffic-related pollutants reasonably well, especially for NO2, while the performance for PM is more variable and source-dependent. These findings confirm that improvements in the temporal and spatial allocation of transport emissions are necessery to enhance the model’s predictive skill, particularly for pollutants strongly driven by road traffic activity.

3.3. Contribution of Road Transport to Air Quality Levels

The WRF-NEMO-CAMx modeling system was applied for the selected simulation periods by zeroing-out all anthropogenic emissions from road transport, including exhaust, non-exhaust and dust resuspension due to road traffic, to quantify their contribution to ambient NOx and PM2.5 concentrations over the urban area of Thessaloniki. The differences in air pollutant and particle concentrations between the dynamic scenario and the zero-out scenario are analyzed in order to assess the total contribution of the developed spatiotemporal road transport emissions to air quality levels.
As shown in Figure 5, according to the differences between the DynSCN and ZeroSCN results, during the cold period, road transport contribute to mean NO2 concentrations in the central and eastern urban districts by up to about 24 μg/m3. During the warm period, the contribution is even higher, with NO2 differences exceeding 30 μg/m3. On the other hand, the contribution of road traffic to NO levels is clearly higher in winter, with mean increases reaching about 20 μg/m3 in several central districts, while in summer the impact is much lower, typically below 10 μg/m3. This seasonal contrast reflects the fact that NO is a primary pollutant directly linked to emissions, and thus more sensitive to the reduction in traffic activity during the summer months, as shown in Section 3.1 due to the implementation of the spatiotemporal profiles which led to reduced emissions during August. Although road traffic emissions are lower in summer compared to winter, the contribution of NO2 appears larger due to the enhanced photochemical conversion of primary NO into NO2. In addition, in contrast to NO, which remains concentrated near the emission sources, NO2 shows a more spatially extended contribution during both winter and summer periods. This is mainly attributed to its longer atmospheric lifetime and the rapid conversion of primary NO into NO2, allowing traffic-related contributions to persist and spread outside the urban area.
For PM2.5 (Figure 6), in January, road transport contributes locally by up to 4.4 μg/m3, mainly in the city center and eastern areas, while in August the contribution remains between 2 and 3.8 μg/m3, with hotspots again in densely trafficked zones. However, it is clearly shown that, in the zoomed-in Thessaloniki subdomain (Figure 6), the road transport contribution to mean PM2.5 levels during the warm period of the year is consistently greater than 2 μg/m3. The consistently high contribution outside the urban area is mainly attributed to the formation of secondary aerosols. The Supplementary Materials (Figure S1) illustrates the spatial distribution of the mean differences in total organic aerosols (OA, including both primary and secondary components), primary elemental carbon (PEC), and fine crustal aerosols (FCRS, associated with dust resuspension) between the DynSCN and ZeroSCN results for the warm period. Road transport contributes between 1.0 and 1.3 μg/m3 to OA levels across the focused area, highlighting the role of secondary aerosol formation. In contrast, PEC, which represents a primary pollutant directly emitted from traffic, shows more localized contributions concentrated in the urban center. Differences in FCRS are attributed exclusively to road dust resuspension emissions, explaining the more extended impact of traffic-related PM2.5 during the dry summer months.
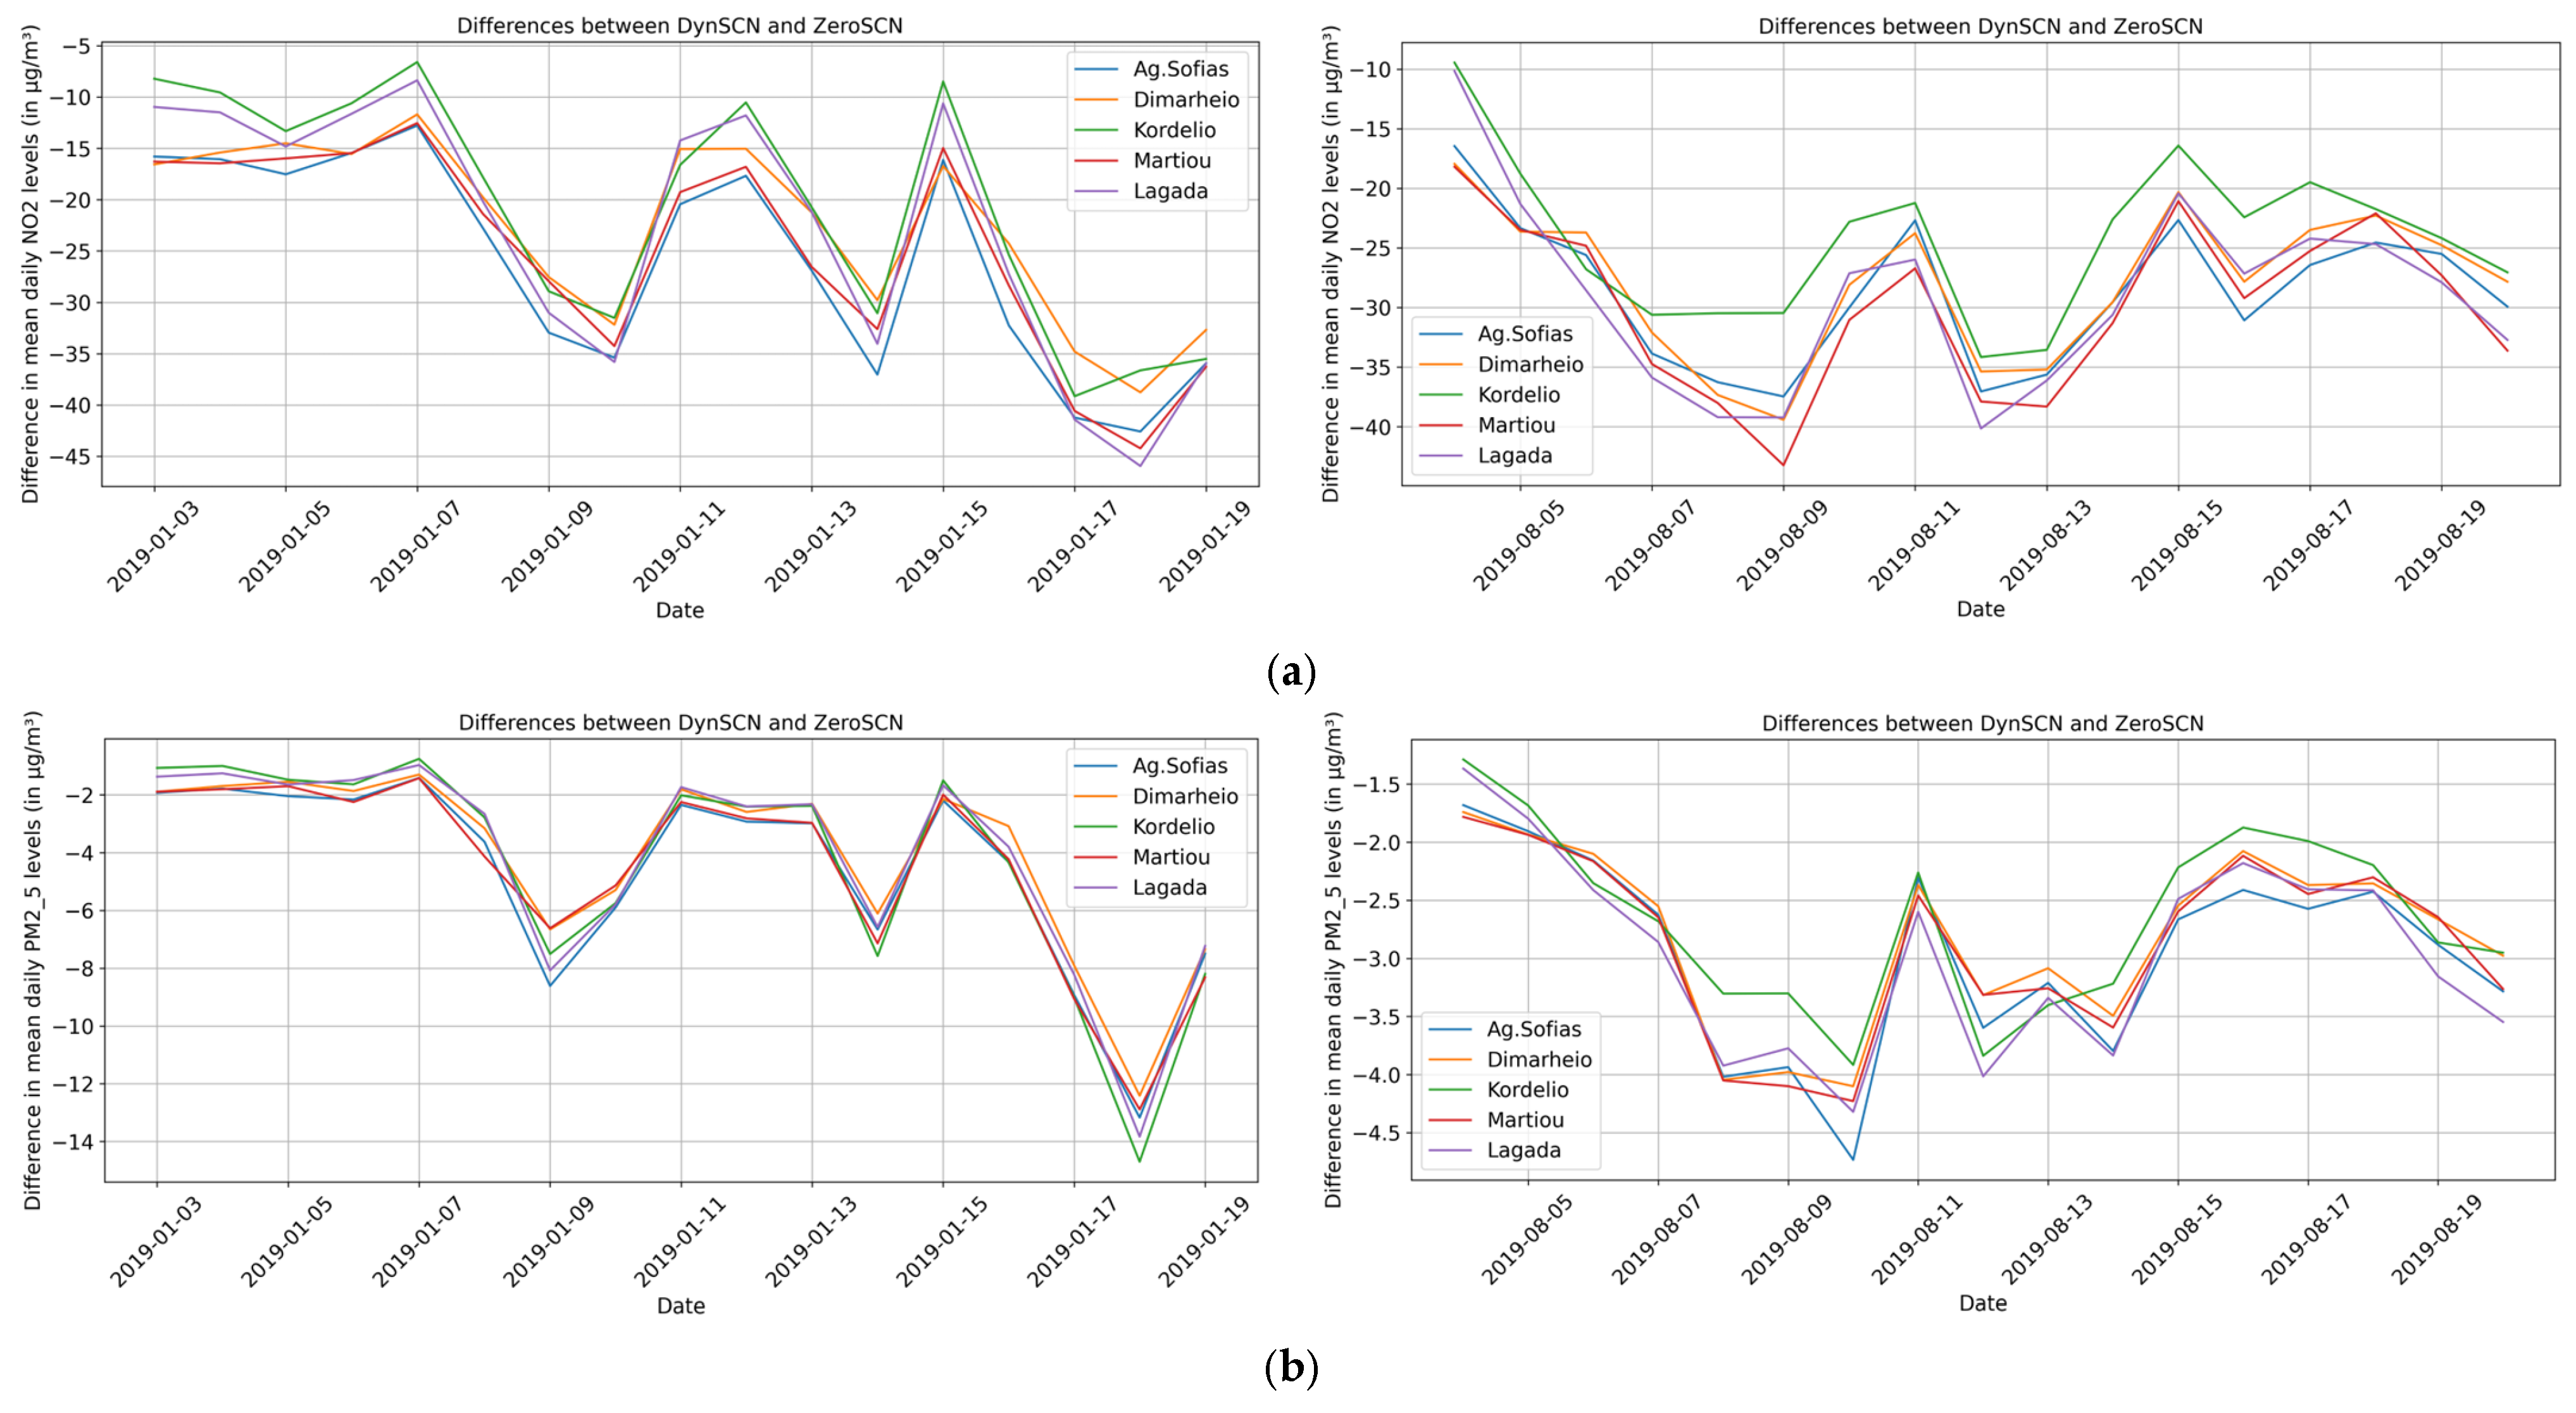
According to Figure 7a, in the cold period, on a daily basis and focusing on the urban area of Thessaloniki, the impact of road transport on NO2 concentrations ranges from approximately −6 μg/m3 to −47 μg/m3, while the corresponding contribution to PM2.5 levels varies between −5 μg/m3 and −15 μg/m3.
During the warm simulation period, clear daily variations in NO2 and PM2.5 concentrations are observed as a result of road transport emissions. As shown in Figure 7b, the largest reductions in NO2 concentrations reach up to around −43 μg/m3 for NO2. Similarly, PM2.5 reductions generally range between −2 and −4.7 μg/m3.
Note that the impact of road transport on NO2 and PM2.5 levels shows notable spatial and temporal variability across Thessaloniki. While the city center (Ag. Sofias) often exhibits strong reductions, peak impacts are not consistent across all days, with some of the highest reductions observed in other areas such as Kordelio and Martiou depending on local emission and meteorology.
Finally, as illustrated in Figure S2 (Supplementary Materials), the maximum percentage contribution of road traffic to mean daily PM2.5 levels is observed on January 18th where the contribution ranges from 22% to 26% while on August 14th ranges from 36% to 38%. The higher percentage contribution of road traffic to PM levels is mainly attributed to the absence of residential heating which is a major contributor to particle emissions during winter.

3.4. Impacts of Spatiotemporal Profiles of Road Transport Emissions on Air Quality Simulations

To further assess the influence of the newly developed spatiotemporal profiles on the air quality simulations, a comparison has been made between the BSCN and the DynSCN results. The analysis focused on the days with the highest percentage contribution of road traffic to PM2.5 levels as identified from the ZeroSCN simulations (18 January for the cold period and 14 August for the warm period), in order to examine the effect of the emission profiles on the diurnal variability of the simulated pollutant concentrations.
As illustrated in Figure 8, the implementation of dynamic profiles substantially modifies the hourly cycle of pollutant concentrations compared to the baseline configuration. On 18 January, DynSCN results show lower concentrations during the late-night and early-morning hours (01:00–05:00 UTC), with reductions of up to 5 μg/m3 for NO, 1–2 μg/m3 for NO2 and up to −1 μg/m3 for PM2.5 across most urban stations, reflecting the reduced traffic activity represented in the new profiles. In contrast, during the morning rush hours (06:00–09:00 UTC), the DynSCN scenario enhances the concentration peaks by up to 6–8 μg/m3 for NO and by up to 1 μg/m3 for PM2.5, while higher increases are seen in the afternoon rush period (17:00–20:00), especially for NO (+20 μg/m3) and PM10 (+4 μg/m3). It should be noted that the increase in air quality levels during the daytime in January is due to the higher emission profile used for month January in the DynSCN compared to the BSCN as it was shown in Figure 4a (Section 3.1).
During the warm period, on 14th August, the implementation of the dynamic profiles modifies the diurnal cycle in a consistent way across all stations (Figure 9). During the early-morning hours (03:00–07:00 UTC), concentrations are lower in DynSCN compared to BSCN, with mean reductions of about 2–9 μg/m3 for NO and 4–8 μg/m3 for NO2, reflecting the lower traffic activity incorporated into the summer profiles due to summer vacations. These reductions are particularly evident at the central urban station of Ag. Sofias. For PM2.5 and PM10 (Figure 9c–d), the dynamic profiles lead to smaller differences, generally between –0.5 and –1.5 μg/m3 during the early morning hours. From midday until the early night (09:00–19:00 UTC), air pollutant concentrations remain relatively stable, with slight increases in DynSCN during the evening (around 19:00 UTC). After 20:00 UTC, concentrations decrease again, and by 21:00–22:00 UTC, DynSCN shows lower values than BSCN across most stations (up to −3.5 μg/m3 for NO2), following the evening decline in vehicle activity represented in the dynamic profiles.
Overall, the August results demonstrate that the new spatiotemporal profiles not only improve the representation of the daily traffic cycle but also incorporate seasonal changes in traffic intensity, such as the reduction in vehicle flows during the summer vacation period. This adjustment may reduce the risk of possible overestimation of pollutant levels in August, particularly during non-peak hours.
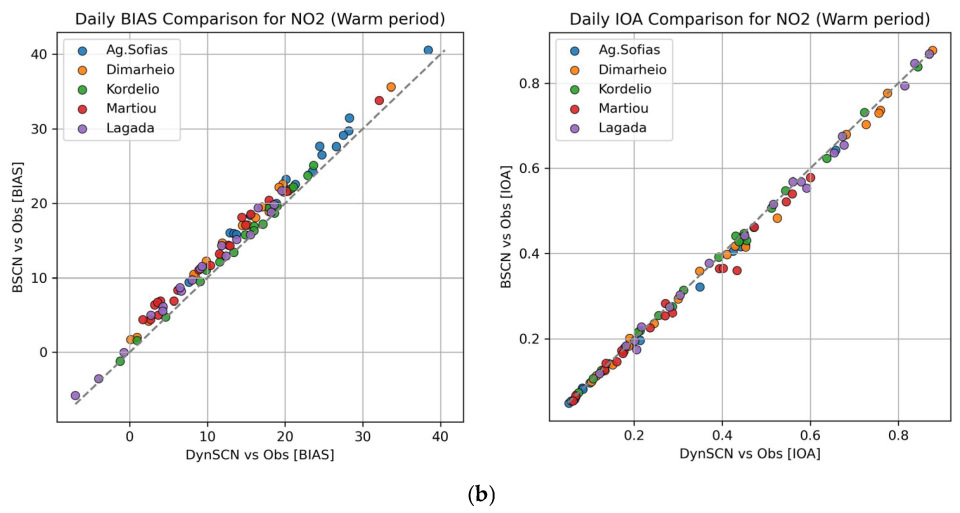
In addition, a comparison of the evaluation of the modeling system for the DynSCN has been performed in order to identify any improvements may arise due to the use of the dynamic spatiotemporal profiles of road transport emissions in the air quality simulations. This analysis focused on the warm period, when road transport represents a major contributor to urban air pollutant concentrations due to the absence of residential heating emission. The scatter plots depicted in Figure 10 show the day-by-day comparisons across multiple urban stations for BIAS and IOA, indicating how DynSCN performs against BSCN. In particular, clear improvements in model performance are shown under the DynSCN configuration compared to BSCN. For NO, which is a primary pollutant directly linked to traffic emissions, the DynSCN scenario systematically reduces the positive daily BIAS values observed in BSCN. In addition, IOA values under DynSCN are consistently higher, reflecting an improved representation of the diurnal variability associated with traffic activity. Specifically, a maximum daily BIAS reduction of –5 μg/m3 for NO and a maximum increase in the IOA of up to 0.13 were found during the warm period. The mean daily NO levels for the warm period confirms. The comparison of daily mean concentrations also supports this finding. During the warm period, the DynSCN scenario reproduces the observed day-to-day variability of NO more closely than BSCN for most days, as illustrated in the supplementary time-series figure (Figure S3). These improvements are particularly notable given that NOx emissions are dominated by road traffic, a sector that benefits directly from the dynamic temporal and spatial allocation of emissions. Similar but lower systematic improvements in BIAS and IOA were found for NO2 levels, with over 90% of points (days over all stations) showing improved BIAS and IOA, indicating a significant reduction in both systematic and total errors.
For PM2.5 (Figure S4, in the Supplementary Materials), although the magnitude of improvement is small, DynSCN consistently performs slightly better across most days and stations (up to 70% of days show better performance). Finally, it should be mentioned that during the cold period the improvement of modeling performance is moderate (Figure S5, in the Supplementary Materials) mainly due to the fact that NOx and PM levels are highly affected by heating emissions.
Overall, the above analysis indicates that the introduction of spatiotemporal dynamic profiles yields substantial improvements in the simulation of traffic-related pollutants, particularly NOx, by enhancing the representation of the hourly variability. For PM2.5, the improvements are weaker but still contribute to a more realistic depiction of urban-scale pollution patterns. These findings highlight the importance of integrating detailed traffic-derived spatiotemporal profiles into air quality modeling systems for cities like Thessaloniki, where road transport is a dominant emission source. Beyond improving model performance, such approaches can also support municipal action plans and policy development by providing more accurate estimates of the timing and spatial distribution of traffic emissions. This information is crucial for designing targeted traffic management measures (e.g., low-emission zones, congestion charges, optimization of public transport) and for evaluating their potential effectiveness in reducing exposure to air pollution at the neighborhood scale.

4. Conclusions

This study developed and applied high-resolution spatiotemporal profiles of road transport emissions based on vehicle speed data for the urban area of Thessaloniki, Greece, and assessed their impact on air quality simulations using the WRF–NEMO–CAMx modeling system. The newly developed profiles captured distinct temporal variations in traffic activity across the city, reflecting the influence of congestion patterns and seasonal mobility behavior. Compared to the static national or/and regional profiles usually used in emission inventories, the dynamic profiles revealed clear reductions in emissions during August due to decreased mobility during summer vacations, as well as differentiated hourly peaks between central and peripheral areas. The most pronounced differences between static and speed-based profiles occur during the morning and afternoon rush hours, when traffic intensity and congestion patterns vary most strongly across the city.
Road transport contributed by up to 47 µg/m3 to daily NO2 and by up to 15 µg/m3 to PM2.5 concentrations in winter. NO2 showed a broader spatial impact than NO due to its longer lifetime and secondary formation, while PM2.5 levels were driven by both direct traffic emissions and secondary aerosol processes, with organic aerosols contributing 1.0–1.3 µg/m3 during the warm period.
The implementation of the dynamic spatiotemporal profiles in the air quality modeling system led to substantial improvements in the modeled diurnal variability of NO and NO2 concentrations, reducing systematic biases and increasing the index of agreement across urban traffic stations. For PM2.5, the improvements were less pronounced but consistent across most stations. By offering a more accurate understanding of when and where transport emissions occur, the approach can support effective municipal measures such as low-emission zones, traffic management, and emission-reduction strategies. The framework is adaptable, allowing future updates to reflect changes in mobility patterns and therefore emissions distributions, such as those expected with the operation of the Thessaloniki metro [51,52], and can be readily applied to other cities as a flexible tool for urban air quality management and sustainable mobility planning.

Supplementary Materials

The following supporting information can be downloaded at: https://www.mdpi.com/article/10.3390/atmos16121337/s1, Figure S1: Mean differences (μg/m3) in (a) Organic Aerosols (OA; including both primary and secondary aerosols), (b) Primary Elemental Carbon (PEC) and (c) Fine Crystal aerosols (FCRS; attributed to dust particles) levels between the DynSCN and the ZeroSCN for the warm (4–20August) period of 2019.; Figure S2: Percentage differences (in %) in mean daily PM2.5 levels between the DynSCN and the ZeroSCN for the cold (3–19 January) (a) and warm (4–20 August) (b) period of 2019.; Figure S3. Mean daily NO levels (in μg/m3) during the warm period (4–20 August 2019) for the DynSCN and BSCN scenarios in comparison with observed (Obs) values at Ag. Sofias monitoring station; Figure S4: Daily BIAS (in μg/m3) (left) and IOA (dimensionless) (right) NO concentrations during the cold period (4–20 August 2019) for the DynSCN and BSCN scenarios at selected urban stations (Ag. Sofias, Dimarheio, Martiou). The 1:1 line is shown for reference; Figure S5: Daily BIAS (in μg/m3) (left) and IOA (dimensionless) (right) PM2.5 concentrations during the warm period (4–20 August 2019) for the DynSCN and BSCN scenarios at selected urban stations (Ag. Sofias, Dimarheio, Martiou). The 1:1 line is shown for reference.; Table S1: Description of the selected monitoring meteorological sites in Thessaloniki, Greece.; Table S2: Description of the selected air quality monitoring sites in Thessaloniki, Greece.; Table S3: Statistical metrics for NO for each monitoring site over the cold (C) (3–19 January) and warm (W) (4–20 August) study periods of 2019.; Table S4: Statistical metrics for PM10 for each monitoring site over the cold (C) (3–19 January) and warm (W) (4–20 August) study periods of 2019.

Author Contributions

Conceptualization, N.L.; methodology, N.L. and S.K.; validation, N.L., S.K. and D.T.; data curation, J.M.S.G. and A.S.; writing—original draft preparation, N.L.; writing—review and editing, N.L., S.K., D.T., J.M.S.G., A.S. and D.M.; supervision, D.M. All authors have read and agreed to the published version of the manuscript.

Funding

This research received no external funding.

Informed Consent Statement

Not applicable.

Data Availability Statement

The raw data supporting the conclusions of this article will be made available by the authors on request.

Acknowledgments

This research was carried out within the framework of the project Environmental digital Twin for smart cities (ENVITWIN) of the National Recovery and Resilience Plan Greece 2.0, funded by the European Union—NextGenerationEU (Implementation body: HFRI). The authors would like to acknowledge the support provided by the Scientific Computing Center at the Aristotle University of Thessaloniki throughout the progress of this research work. The authors acknowledge the ECCAD database (Emissions of atmospheric Compounds and Compilation of Ancillary Data, https://eccad.aeris-data.fr (accessed on 10 January 2025) for providing access to the CAMS-REG dataset used in this study. The authors would like to thank The Netherlands Organization for providing the potential anthropogenic dust resuspension emission data.

Conflicts of Interest

The authors declare no conflicts of interest.

References

  1. Liora, N.; Poupkou, A.; Kontos, S.; Meleti, C.; Chrysostomou, K.; Aifadopoulou, G.; Zountsa, S.; Kalogirou, C.; Chacartegui, R.; Liguori, F.; et al. Estimating Road Transport Pollutant Emissions Under Traffic-Congested Conditions with an Integrated Modelling Tool—Emissions Reduction Scenarios Analysis. Emiss. Control Sci. Technol. 2021, 7, 137–152. [Google Scholar] [CrossRef]
  2. Li, C.; Managi, S. Contribution of On-Road Transportation to PM2.5. Sci. Rep. 2021, 11, 21320. [Google Scholar] [CrossRef] [PubMed]
  3. Liora, N.; Kontos, S.; Parliari, D.; Akritidis, D.; Poupkou, A.; Papanastasiou, D.K.; Melas, D. “On-Line” Heating Emissions Based on WRF Meteorology—Application and Evaluation of a Modeling System over Greece. Atmosphere 2022, 13, 568. [Google Scholar] [CrossRef]
  4. Progiou, A.; Liora, N.; Sebos, I.; Chatzimichail, C.; Melas, D. Measures and Policies for Reducing PM Exceedances through the Use of Air Quality Modeling: The Case of Thessaloniki, Greece. Sustainability 2023, 15, 930. [Google Scholar] [CrossRef]
  5. Piscitelli, P.; Valenzano, B.; Rizzo, E.; Maggiotto, G.; Rivezzi, M.; Esposito Corcione, F.; Miani, A. Air Pollution and Estimated Health Costs Related to Road Transportations of Goods in Italy: A First Healthcare Burden Assessment. Int. J. Environ. Res. Public Health 2019, 16, 2876. [Google Scholar] [CrossRef]
  6. Progiou, A.G.; Ziomas, I.C. Road Traffic Emissions Impact on Air Quality of the Greater Athens Area Based on a 20year Emissions Inventory. Sci. Total Environ. 2011, 410–411, 1–7. [Google Scholar] [CrossRef]
  7. Landolsi, J.; Rehimi, F.; Kalboussi, A. Urban Traffic and Induced Air Quality Modeling and Simulation: Methodology and Illustrative Example. Urban Clim. 2017, 21, 154–172. [Google Scholar] [CrossRef]
  8. Kim, Y.; Wu, Y.; Seigneur, C.; Roustan, Y. Multi-Scale Modeling of Urban Air Pollution: Development and Application of a Street-in-Grid Model (v1.0) by Coupling MUNICH (v1.0) and Polair3D (v1.8.1). Geosci. Model. Dev. 2018, 11, 611–629. [Google Scholar] [CrossRef]
  9. Fameli, K.-M.; Assimakopoulos, V.D. The New Open Flexible Emission Inventory for Greece and the Greater Athens Area (FEI-GREGAA): Account of Pollutant Sources and Their Importance from 2006 to 2012. Atmos. Environ. 2016, 137, 17–37. [Google Scholar] [CrossRef]
  10. Markakis, K.; Katragkou, E.; Poupkou, A.; Melas, D. MOSESS: A New Emission Model for the Compilation of Model-Ready Emission Inventories—Application in a Coal Mining Area in Northern Greece. Environ. Model. Assess. 2013, 18, 509–521. [Google Scholar] [CrossRef]
  11. Rosero, F.; Fonseca, N.; Mera, Z.; López, J.-M. Assessing On-Road Emissions from Urban Buses in Different Traffic Congestion Scenarios by Integrating Real-World Driving, Traffic, and Emissions Data. Sci. Total Environ. 2023, 863, 161002. [Google Scholar] [CrossRef]
  12. Gately, C.K.; Hutyra, L.R.; Peterson, S.; Sue Wing, I. Urban Emissions Hotspots: Quantifying Vehicle Congestion and Air Pollution Using Mobile Phone GPS Data. Environ. Pollut. 2017, 229, 496–504. [Google Scholar] [CrossRef]
  13. Russo, F.; Villani, M.G.; D’Elia, I.; D’Isidoro, M.; Liberto, C.; Piersanti, A.; Tinarelli, G.; Valenti, G.; Ciancarella, L. A Study of Traffic Emissions Based on Floating Car Data for Urban Scale Air Quality Applications. Atmosphere 2021, 12, 1064. [Google Scholar] [CrossRef]
  14. Yu, C.; Yang, X.; Mu, J.; Liu, S. A Systematic Review of Urban Road Traffic CO2 Emission Models. Carbon Footpr. 2025, 4, 17. [Google Scholar] [CrossRef]
  15. Int Panis, L.; Broekx, S.; Liu, R. Modelling Instantaneous Traffic Emission and the Influence of Traffic Speed Limits. Sci. Total Environ. 2006, 371, 270–285. [Google Scholar] [CrossRef] [PubMed]
  16. Kühbacher, D.; Chen, J.; Aigner, P.; Ilic, M.; Super, I.; Van Der Gon, H.D. DRIVE v1.0: A Data-Driven Framework to Estimate Road Transport Emissions and Temporal Profiles. EGUsphere 2025, preprint. [Google Scholar] [CrossRef]
  17. Tsiaousidis, D.T.; Liora, N.; Kontos, S.; Poupkou, A.; Akritidis, D.; Melas, D. Evaluation of PM Chemical Composition in Thessaloniki, Greece Based on Air Quality Simulations. Sustainability 2023, 15, 10034. [Google Scholar] [CrossRef]
  18. European Comission Air Quality: Commission Decides to Refer GREECE to the Court of Justice over Poor Air Quality. 2020. Available online: https://ec.europa.eu/commission/presscorner/detail/en/ip_20_2151 (accessed on 10 November 2022).
  19. Chatzopoulou, A.; Mavroidis, I. Spatiotemporal Analysis of Air Pollutants in Thessaloniki, Greece. Atmosphere 2025, 16, 1057. [Google Scholar] [CrossRef]
  20. Anagnostopoulou, A.; Papargyri, E.; Boile, M. Innovative Scheme for Efficient Freight Movement and Sustainable Emissions Management. Transp. Telecommun. J. 2019, 20, 242–250. [Google Scholar] [CrossRef]
  21. Tsilingiridis, G.; Zachariadis, T.; Samaras, Z. Spatial and Temporal Characteristics of Air Pollutant Emissions in Thessaloniki, Greece: Investigation of Emission Abatement Measures. Sci. Total Environ. 2002, 300, 99–113. [Google Scholar] [CrossRef]
  22. Marécal, V.; Peuch, V.-H.; Andersson, C.; Andersson, S.; Arteta, J.; Beekmann, M.; Benedictow, A.; Bergström, R.; Bessagnet, B.; Cansado, A.; et al. A Regional Air Quality Forecasting System over Europe: The MACC-II Daily Ensemble Production. Geosci. Model Dev. 2015, 8, 2777–2813. [Google Scholar] [CrossRef]
  23. Liora, N.; Poupkou, A.; Giannaros, T.M.; Kakosimos, K.E.; Stein, O.; Melas, D. Impacts of Natural Emission Sources on Particle Pollution Levels in Europe. Atmos. Environ. 2016, 137, 171–185. [Google Scholar] [CrossRef]
  24. Koukouli, M.-E.; Pseftogkas, A.; Karagkiozidis, D.; Skoulidou, I.; Drosoglou, T.; Balis, D.; Bais, A.; Melas, D.; Hatzianastassiou, N. Air Quality in Two Northern Greek Cities Revealed by Their Tropospheric NO2 Levels. Atmosphere 2022, 13, 840. [Google Scholar] [CrossRef]
  25. Flocas, H.; Kelessis, A.; Helmis, C.; Petrakakis, M.; Zoumakis, M.; Pappas, K. Synoptic and Local Scale Atmospheric Circulation Associated with Air Pollution Episodes in an Urban Mediterranean Area. Theor. Appl. Climatol. 2009, 95, 265–277. [Google Scholar] [CrossRef]
  26. Kassomenos, P.A.; Kelessis, A.; Paschalidou, A.K.; Petrakakis, M. Identification of Sources and Processes Affecting Particulate Pollution in Thessaloniki, Greece. Atmos. Environ. 2011, 45, 7293–7300. [Google Scholar] [CrossRef]
  27. Moussiopoulos, Ν.; Vlachokostas, C.; Tsilingiridis, G.; Douros, I.; Hourdakis, E.; Naneris, C.; Sidiropoulos, C. Air Quality Status in Greater Thessaloniki Area and the Emission Reductions Needed for Attaining the EU Air Quality Legislation. Sci. Total Environ. 2009, 407, 1268–1285. [Google Scholar] [CrossRef]
  28. Skamarock, W.C.; Klemp, J.B.; Dudhia, J.; Gill, D.O.; Liu, Z.; Berner, J.; Wang, W.; Powers, J.G.; Duda, M.G.; Barker, D.M.; et al. A Description of the Advanced Research WRF Model Version 4; UCAR/NCAR: Boulder, CO, USA, 2019. [Google Scholar]
  29. Liora, N.; Markakis, K.; Poupkou, A.; Giannaros, T.M.; Melas, D. The Natural Emissions Model (NEMO): Description, Application and Model Evaluation. Atmos. Environ. 2015, 122, 493–504. [Google Scholar] [CrossRef]
  30. Kontos, S.; Liora, N.; Giannaros, C.; Kakosimos, K.; Poupkou, A.; Melas, D. Modeling Natural Dust Emissions in the Central Middle East: Parameterizations and Sensitivity. Atmos. Environ. 2018, 190, 294–307. [Google Scholar] [CrossRef]
  31. ENVIRON. User’s Guide CAMx Comprehensive Air Quality Model with Extensions, 6.5th ed.; Ramboll US Corporation: Novato, CA, USA, 2018. [Google Scholar]
  32. Soci, C.; Hersbach, H.; Simmons, A.; Poli, P.; Bell, B.; Berrisford, P.; Horányi, A.; Muñoz-Sabater, J.; Nicolas, J.; Radu, R.; et al. The ERA5 Global Reanalysis from 1940 to 2022. Q. J. R. Meteorol. Soc. 2024, 150, 4014–4048. [Google Scholar] [CrossRef]
  33. Peuch, V.-H.; Engelen, R.; Rixen, M.; Dee, D.; Flemming, J.; Suttie, M.; Ades, M.; Agustí-Panareda, A.; Ananasso, C.; Andersson, E.; et al. The Copernicus Atmosphere Monitoring Service: From Research to Operations. Bull. Am. Meteorol. Soc. 2022, 103, E2650–E2668. [Google Scholar] [CrossRef]
  34. Kuenen, J.; van der Gon, H.D.; Super, I.; Dellaert, S.; Visschedijk, A.; Guevara, M.; Jalkanen, J.-P.; Majamäki, E.; Schindlbacher, S.; Matthews, B. Recent Developments in the CAMS European Regional Emissions Data (CAMS-REG); CAMS: Karachi, Pakistan, 2021; Available online: https://atmosphere.copernicus.eu/sites/default/files/custom-uploads/CAMS-5thPUW/5.%20Kuenen_CAMS_emissions_PUW_Remote_20210629.pdf (accessed on 14 December 2024).
  35. Kuenen, J.; Dellaert, S.; Visschedijk, A.; Jalkanen, J.-P.; Super, I.; Van Der Gon, H.D. CAMS-REG-v4: A State-of-the-Art High-Resolution European Emission Inventory for Air Quality Modelling. Earth Syst. Sci. Data 2022, 14, 491–515. [Google Scholar] [CrossRef]
  36. Copernicus Atmosphere Monitoring Service (CAMS). CAMS v6.2 Global and European Emission Inventories: Documentation of CAMS v6.2 Global and European Emission Inventories; Deliverable D6.1.2—202306, CAMS261_2021SC1; ECMWF: Reading, UK, 2023; Available online: https://atmosphere.copernicus.eu/sites/default/files/publications/CAMS261_2021SC1_D6.1.2-2022_202306_Docu_v1_APPROVED_Ver1.pdf (accessed on 12 November 2025).
  37. Schaap, Μ.; Manders, A.M.M.; Hendriks, E.C.J.; Cnossen, J.M.; Segers, A.J.S.; van der Gon, H.A.C.D.; Jozwicka, M. Regional Modelling of Particulate Matter for the Netherlands; Research Program on Particulate Matter; PBL: Bilthoven, The Netherlands, 2009. [Google Scholar]
  38. Šedivá, T.; Štefánik, D. Combined Brute Force Method for Source Apportionment Purposes. Atmos. Pollut. Res. 2025, 16, 102394. [Google Scholar] [CrossRef]
  39. Thunis, P.; Clappier, A.; Tarrason, L.; Cuvelier, C.; Monteiro, A.; Pisoni, E.; Wesseling, J.; Belis, C.A.; Pirovano, G.; Janssen, S.; et al. Source Apportionment to Support Air Quality Planning: Strengths and Weaknesses of Existing Approaches. Environ. Int. 2019, 130, 104825. [Google Scholar] [CrossRef] [PubMed]
  40. Nguyen, T.H.; Nagashima, T.; Doan, Q.-V. Air Quality Modeling Study on the Controlling Factors of Fine Particulate Matter (PM2.5) in Hanoi: A Case Study in December 2010. Atmosphere 2020, 11, 733. [Google Scholar] [CrossRef]
  41. Uranishi, K.; Ikemori, F.; Nakatsubo, R.; Shimadera, H.; Kondo, A.; Kikutani, Y.; Asano, K.; Sugata, S. Identification of Biased Sectors in Emission Data Using a Combination of Chemical Transport Model and Receptor Model. Atmos. Environ. 2017, 166, 166–181. [Google Scholar] [CrossRef]
  42. Politis, I.; Georgiadis, G.; Papadopoulos, E.; Fyrogenis, I.; Nikolaidou, A.; Kopsacheilis, A.; Sdoukopoulos, A.; Verani, E. COVID-19 Lockdown Measures and Travel Behavior: The Case of Thessaloniki, Greece. Transp. Res. Interdiscip. Perspect. 2021, 10, 100345. [Google Scholar] [CrossRef]
  43. EEA European Environment Agency. National Emission Reduction Commitments Directive (NECD)—National Emission Inventories: Greece Submission. 2023. Available online: https://cdr.eionet.europa.eu/gr/eu/nec_revised/inventories (accessed on 30 June 2025).
  44. EMISIA SA COPERT 5: Computer Programme to Calculate Emissions from Road Transport. Thessaloniki, Greece: EMISIA SA. 2023. Available online: https://www.emisia.com/utilities/copert/ (accessed on 30 June 2025).
  45. YPEN Greek Ministry of Environment and Energy. Greece’s Informative Inventory Report (IIR) 2024. Athens: Ministry of Environment and Energy. 2024. Available online: https://ypen.gov.gr/wp-content/uploads/2024/04/2024_IIR_gr_.pdf (accessed on 30 June 2025).
  46. NAP National Geospatial Data Infrastructure (Geoportal). Greek Road Network, OpenStreetMap Data in Layered GIS Format. 2022. Available online: http://data.nap.gov.gr/dataset/latest-open-street-map-objects-for-greece/resource/8de9d8dc-9d5d-4a59-af72-b8052b1ddc9b (accessed on 29 April 2022).
  47. Eurostat Territorial Typologies Manual—Urban-Rural Typology. 2021. Available online: https://ec.europa.eu/eurostat/statistics-explained/index.php?title=territorial_typologies_manual_-_urban-rural_typology (accessed on 30 June 2025).
  48. HELLASTRON Hellenic Association of Toll Road Network. Statistics. 2019. Available online: https://hellastronin.eu/statistics/statistics_show.php (accessed on 30 June 2025).
  49. Ayfantopoulou, G.; Salanova Grau, J.M.; Tzenos, P.; Tolikas, A. Open Data from Taxis and Bluetooth Detectors to Extract Congestion and Mobility Patterns in Thessaloniki. Data Brief 2023, 47, 108899. [Google Scholar] [CrossRef]
  50. TrafficThess Centre for Research and Technology Hellas—Hellenic Institute of Transport (CERTH/HIT). Traffic Monitoring System of Thessaloniki. Available online: https://www.trafficthess.imet.gr (accessed on 7 July 2025).
  51. International Tunnelling and Underground Space Association (ITA-AITES). Activity Report 2024; ITA-AITES: Lausanne, Switzerland, 2024. Available online: https://about.ita-aites.org/files/RapportNM/2024/Switzerland.pdf (accessed on 1 September 2025).
  52. European Commission. Stop Holding Your Breath: Thessaloniki Metro Is Open; Panorama Magazine, 12 November 2024. Available online: https://ec.europa.eu/regional_policy/whats-new/panorama/2024/12/12-11-2024-stop-holding-your-breath-thessaloniki-metro-is-open_en (accessed on 1 September 2025).
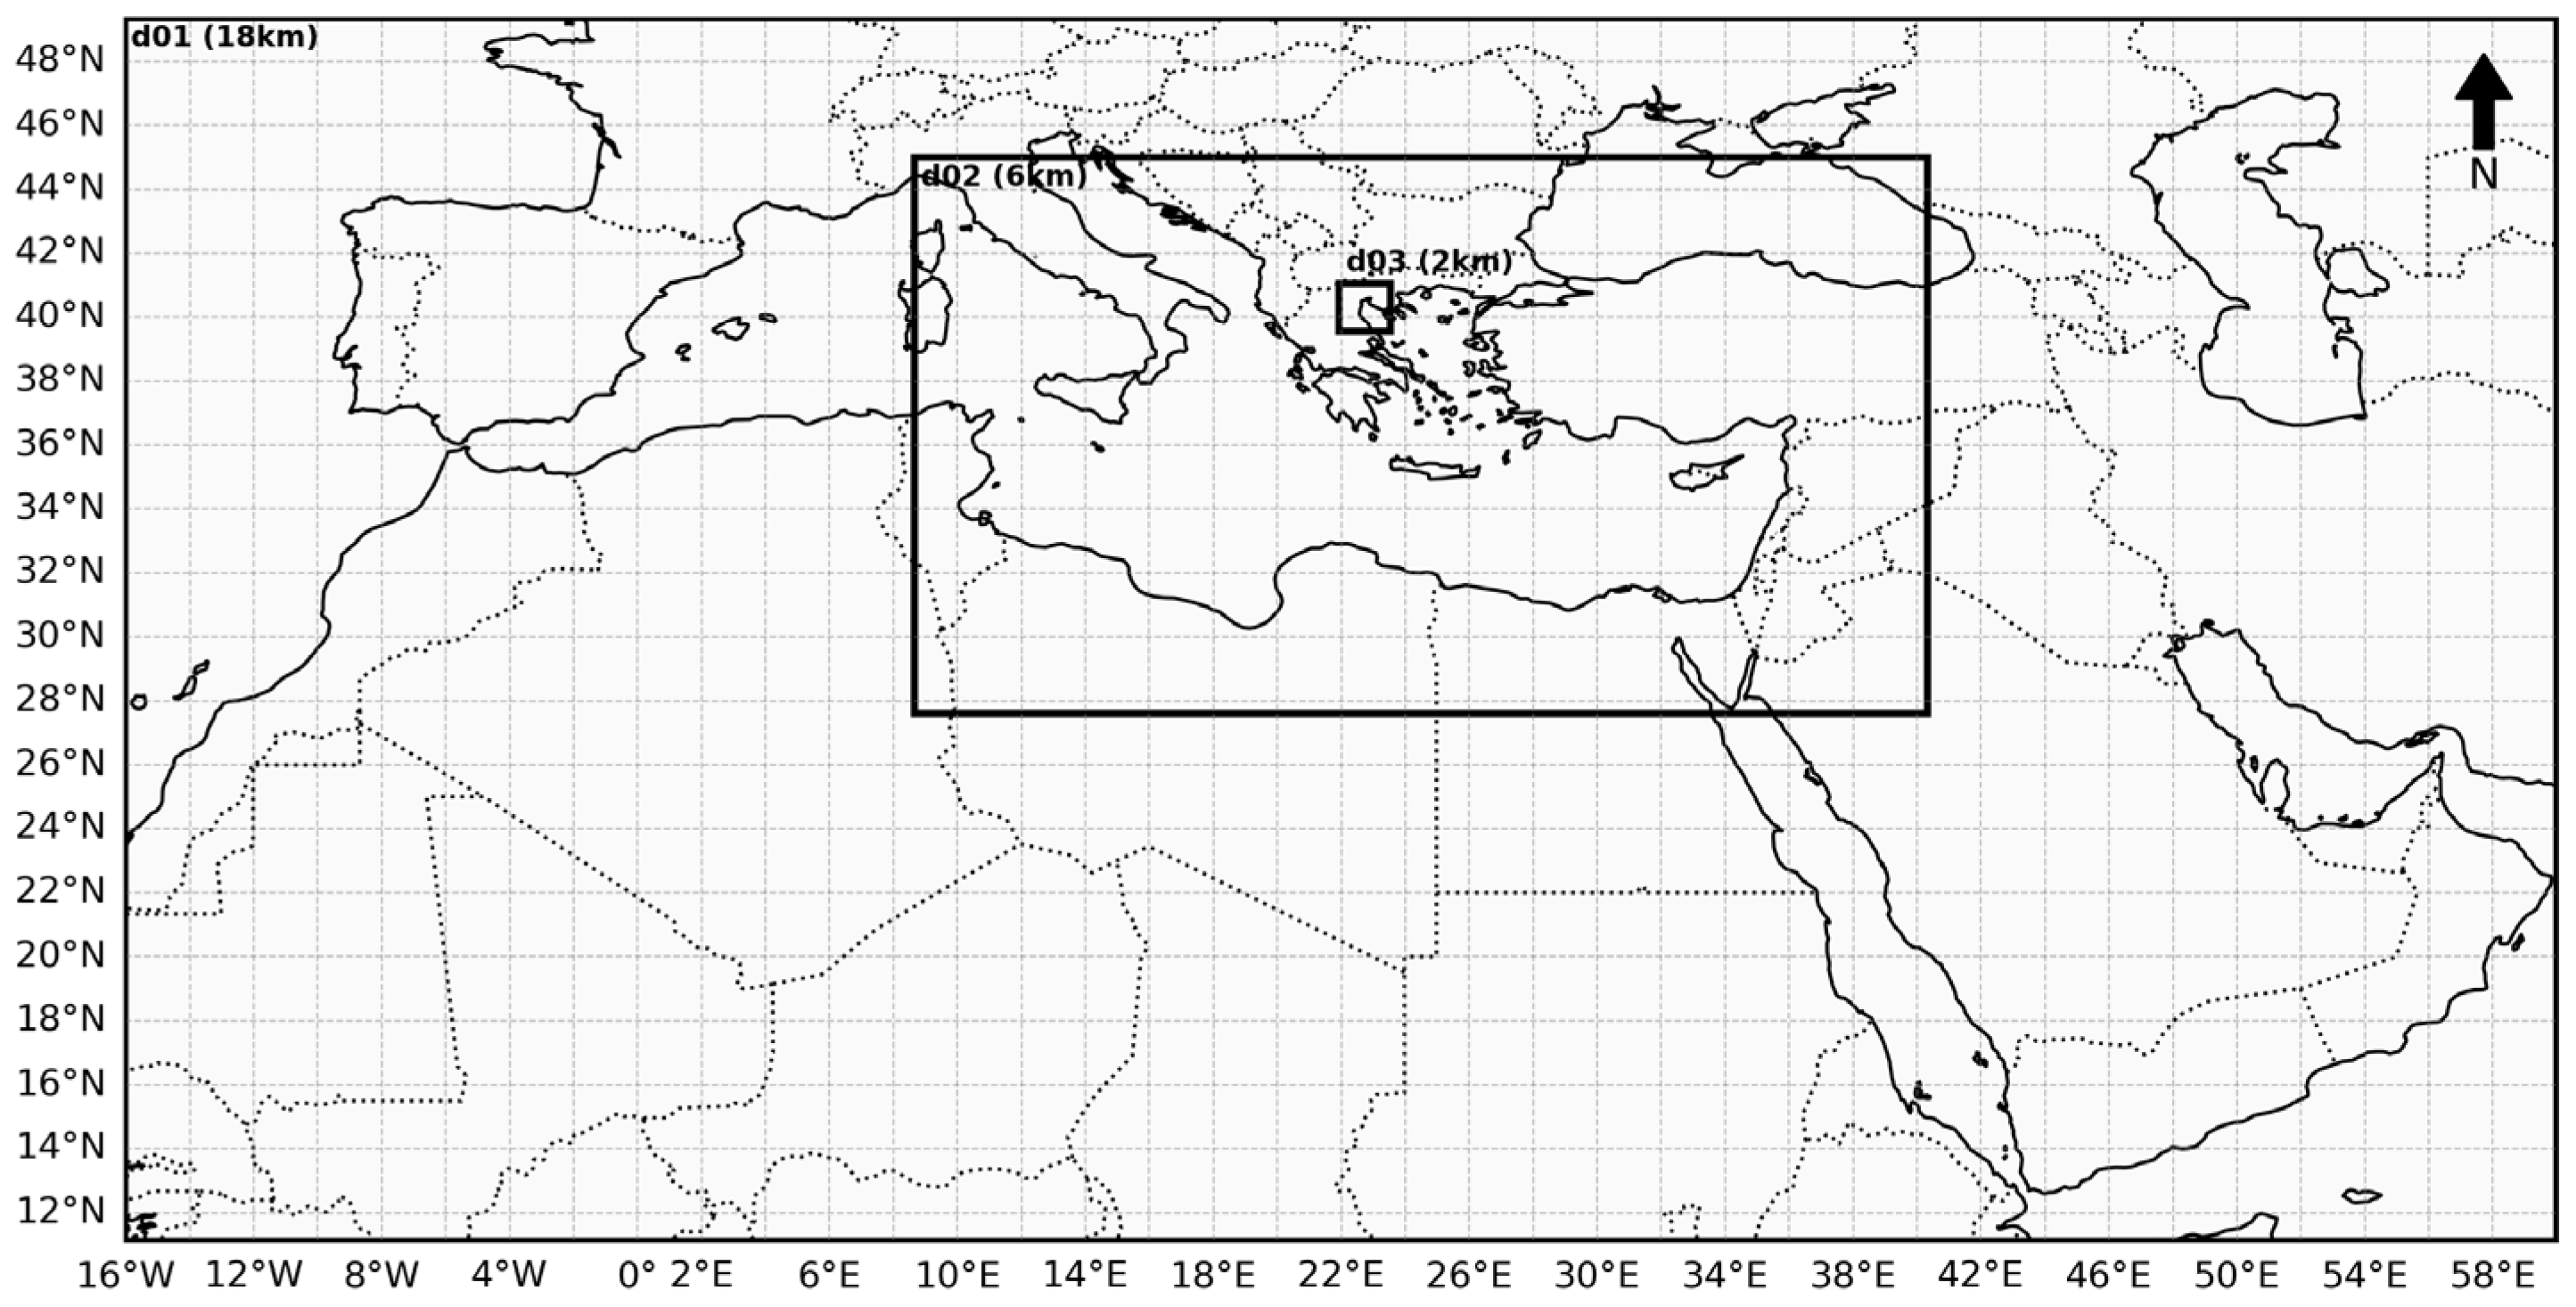
Figure 1. Study domains of WRF-NEMO-CAMx modeling system (d01): Europe and North Africa, d02: Eastern Mediterranean, d03: greater area of Thessaloniki.
Atmosphere 16 01337 g001
Figure 2. Urban annual NOx emissions (a) per road length from gasoline vehicles (in gr/m/year) over Thessaloniki urban network and (b) per grid cell (in tn/cell/year) over the domain d03 focused on Thessaloniki.
Atmosphere 16 01337 g002
Figure 3. Level of Service categories of the monitored road segments for the year 2019, over a part of modeling domain d03 (at 2 km resolution) covering the urban area of Thessaloniki and locations of the air quality monitoring stations (Martiou, Dimarheio, Ag.Sofias, Lagada and Kordelio).
Atmosphere 16 01337 g003
Figure 4. Spatiotemporal dynamic profiles of road transport emissions in specific grid cells of domain d03 (Martiou, Dimarheio, Ag. Sofias, Lagada and Kordelio) over the urban area of Thessaloniki on a (a) monthly, (b), weekly and (c) hourly basis in comparison with the static profiles.
Atmosphere 16 01337 g004
Figure 5. Mean differences (μg/m3) in (a) NO and (b) NO2 levels between the DynSCN and the ZeroSCN for the cold (3–19 January) (left) and the warm (4–20 August) (right) period of 2019.
Atmosphere 16 01337 g005
Figure 6. Mean differences (μg/m3) in PM2.5 levels between the DynSCN and the ZeroSCN for the cold (3–19 January) (left) and the warm (4–20 August) (right) period of 2019.
Atmosphere 16 01337 g006
Figure 7. Differences (in μg/m3) in mean daily NO2 (a) and PM2.5 (b) levels between the DynSCN and the ZeroSCN for the cold (3–19 January) (left) and warm (4–20 August) (right) period of 2019.
Atmosphere 16 01337 g007
Figure 8. Differences (in μg/m3) in mean hourly (a) NO, (b) NO2, (c) PM2.5 and (d) PM10 levels between the DynSCN and the BSCN for 18 January 2019.
Atmosphere 16 01337 g008aAtmosphere 16 01337 g008b
Figure 9. Differences (in μg/m3) in mean hourly (a) NO, (b) NO2, (c) PM2.5 and (d) PM10 levels between the DynSCN and the BSCN for 14th August, 2019.
Atmosphere 16 01337 g009
Figure 10. Daily BIAS (in μg/m3) (left) and IOA (dimensionless) (right) of (a) NO and (b) NO2 concentrations during the warm period (4–20 August 2019) for the DynSCN and BSCN scenarios at selected urban stations (Ag. Sofias, Dimarheio, Martiou).
Atmosphere 16 01337 g010aAtmosphere 16 01337 g010b
Table 1. Statistical metrics for the near-surface mean hourly air temperature (in °C) for each monitoring site over the cold (C) (3–19 January) and warm (W) (4–20 August) study periods of 2019 for the BSCN.
Site NameBiasRIOARMSE
CWCWCWCW
Kordelio−0.15−1.320.810.940.900.942.321.82
Dimarheio−0.28−1.050.780.880.870.892.542.3
Martiou−0.22−0.470.800.940.890.962.351.24
Table 2. Statistical metrics for mean hourly NO2 concentrations for each monitoring site over the cold (C) (3–19 January) and warm (W) (4–20 August) study periods of 2019 for the BSCN.
Site NameBIASRIOARMSE
CWCWCWCW
Kordelio−6.9815.180.750.360.850.4622.9833.72
DimarheioNA15.49NA0.55NA0.60NA30.23
Martiou−13.5712.810.700.300.800.4028.5832.54
Ag.Sofias−22.1122.740.700.300.590.3232.7538.83
Lagada−5.9810.260.730.510.840.6323.9429.02
Table 3. Statistical metrics for mean hourly PM2.5 concentrations for each monitoring site over the cold (C) (3–19 January) and warm (W) (4–20 August) study periods of 2019 for the BSCN.
Site NameBIASRIOARMSE
CWCWCWCW
Dimarheio−3.15−5.910.370.410.580.5822.379.74
Martiou9.03−0.650.360.370.480.6019.295.46
Ag.Sofias−5.89−5.430.380.250.590.4927.458.41
Lagada1.05NA0.56NA0.73NA18.66NA
Disclaimer/Publisher’s Note: The statements, opinions and data contained in all publications are solely those of the individual author(s) and contributor(s) and not of MDPI and/or the editor(s). MDPI and/or the editor(s) disclaim responsibility for any injury to people or property resulting from any ideas, methods, instructions or products referred to in the content.