Article

Assessment of Lightning Activity and Early Warning Capability Using Near-Real-Time Monitoring Data in Hanoi, Vietnam

1
Institute of Earth Sciences, Vietnam Academy of Science and Technology, Hanoi 100000, Vietnam
2
Vietnam National Center for Hydro-Meteorological Forecasting, Hanoi 100000, Vietnam
*
Author to whom correspondence should be addressed.
Atmosphere 2025, 16(12), 1335; https://doi.org/10.3390/atmos16121335
Submission received: 13 October 2025 / Revised: 20 November 2025 / Accepted: 24 November 2025 / Published: 26 November 2025
(This article belongs to the Section Meteorology)

Abstract

This study investigates lightning activity and evaluates a near-real-time lightning warning system for the inner Hanoi area, using data collected during 2020–2024 from the Strike Guard (SG) and EFM-100C instruments located in Chuong My, Hanoi, Vietnam. Lightning detection data were incorporated with rainfall and lightning location information from the Vietnam Meteorological and Hydrological Administration (VNMHA) for quality checking. The SG data over the research area revealed clear diurnal and seasonal variations, with lightning most frequent in the late afternoon and two major peaks in June and September corresponding to the summer monsoon. A combined warning method using EFM-100C electric field measurements and SG alert states achieved an average lead time of 15 min, a Probability of Detection (POD) of 82.22%, a Critical Success Index (CSI) of 76.55%, an F1 score of 86.72%, and a False Alarm Ratio (FAR) of 8.26%. These results demonstrate that integrating electric field and optical–electromagnetic measurements can provide effective localized lightning warnings for the urban areas. The approach is cost-efficient, operationally feasible, and particularly valuable for protecting critical infrastructure regions, supporting enhanced lightning safety and disaster mitigation in northern Vietnam.

1. Introduction

Vietnam, located in Asia and within one of the three global lightning hotspots, is characterized by intense thunderstorm activity [1,2,3]. Lightning activity directly influences the process of industrialization and modernization of the country. Although thunderstorms occur throughout Vietnam, their occurrence exhibits local characteristics influenced by climatic conditions, as reflected in lightning density, stroke current intensity, and the number of thunderstorm days and hours [1,2,3,4,5,6,7,8,9]. Hanoi, the capital of Vietnam, serves as the country’s cultural, economic, and political hub, with one of the highest population densities nationwide. The city contains numerous critical infrastructures essential for socioeconomic development, national security, and defense, including Noi Bai, Gia Lam, and Mieu Mon airports; the Hoa Lac Hi-Tech Park; the My Dinh and Hang Day stadiums; as well as various industrial zones and recreational areas. Chuong My, situated near the city center, is particularly vulnerable to lightning-related damage. In recent years, fatal lightning incidents have been reported in Chuong My.
To mitigate the damages caused by thunderstorms and lightning activity, it is essential to conduct studies on lightning characteristics as well as on lightning warning and forecasting. These topics have received increasing research attention both worldwide and in Vietnam. In Vietnam, assessments of thunderstorm activity are based primarily on manual observations of thunderstorms at meteorological stations [1,4,5,6]. Statistical analyses have quantified the number of thunderstorm days, thunderstorm hours, and the duration of thunderstorm activity across different climatic regions of Vietnam. In addition, assessments of thunderstorm activity in Vietnam have been conducted using both manual observations at meteorological stations and automated ground-based instruments [1,2,3,4,6,8,9]. In studies [8,9], the authors constructed lightning density maps for Vietnam and adjacent regions. The maps revealed several high-density lightning centers that coincide with thunderstorm centers identified from manual observations across the three main regions of Vietnam. Furthermore, in [8], the research team calculated the monthly total number of lightning flashes for northern and southern Vietnam, as well as for the entire country; determined the annual mean number of thunderstorm days over Vietnam and surrounding areas; and analyzed the distribution of peak lightning currents using GLD-360 data for the period 2015–2019. In studies [1,2], the authors developed ground lightning density maps by integrating meteorological station observations with automatic lightning detection data. They further presented the diurnal and monthly frequency distributions of lightning discharges derived from data collected at eight lightning detection stations in 2004. These findings demonstrate that it is feasible to assess thunderstorm and lightning activity in Vietnam. Nevertheless, both satellite-based and ground-based lightning location systems are expensive to develop and operate, and their deployment frequently necessitates international collaboration. Furthermore, many ground-based lightning location systems are subject to considerable uncertainties, as lightning detection antennas can be influenced by multiple secondary sources, resulting in an overestimation of the actual number of lightning flashes. In certain instances, inappropriate threshold settings for electromagnetic field detection may lead to the misclassification of intra-cloud discharges as cloud-to-ground strokes. Consequently, the derived lightning density or frequency can be considerably higher than values reported in previous studies [10,11,12,13,14,15].
Cecil et al. [16] used lightning data from the TRMM satellite to assess thunderstorm activity through annual mean flash rates in tropical and subtropical regions. The study showed that the flash rate within 0.5° × 0.5° grid cells over Vietnam ranged from 8 to 40 flashes/km2/year, while the mean flash rate in stormy grid cells varied from 1.5 to 8 flashes/min. It also indicated that about 40% of lightning activity in Southeast Asia occurs in the late afternoon. Qie et al. [17] evaluated lightning activity trends in tropical and subtropical regions using satellite-based observations (OTD and LIS). The results revealed that lightning flash density (LFD) in Vietnam tends to increase in the North and decrease in the South. Positive correlations were identified between lightning density and CAPE, surface air temperature (SAT), aerosol optical depth (AOD), and surface specific humidity (SH), with the strongest correlation observed between lightning density and CAPE. Study [18], which examined increasing lightning activity in South Asia (mainly India), reported a rising trend of 0.096 flashes/km2 per decade over the past two decades. Lightning activity in Vietnam and surrounding areas has also been shown to be associated with ENSO [19,20], with a positive correlation to the Niño 3.4 index in northern Vietnam and a negative correlation in the South. Overall, lightning counts in Southeast Asia were above normal during El Niño months and below normal during La Niña months.
In the field of lightning nowcasting and forecasting, global studies with different approaches can be categorized into several groups. The first group focuses on lightning warning based on electric field measurements and related data sources [21,22,23,24,25,26,27,28,29,30,31]. The second group employs combined datasets from radar or satellites together with other relevant observations to develop lightning forecast and warning methods [32,33,34]. The third group relies solely on lightning location system data for lightning warnings [35,36], while other studies have applied numerical models to forecast lightning activity [37,38,39,40]. These studies have employed different lightning location systems, some of which are very costly and therefore difficult to implement in developing countries with limited economic capacity. Other systems are less expensive but often have limited accuracy, low detection efficiency, large uncertainties, and require further data calibration. Research findings indicate that lightning warning capability depends on multiple factors, including the quality of the data source, the measurement environment, data processing and analysis methods, lightning warning evaluation techniques, local thunderstorm characteristics, infrastructure conditions, and public awareness of lightning safety. The lightning lead time (LT) varies from a few minutes to about 60 min, and both shorter and longer lead times have important scientific and practical implications. Shorter lead times are particularly important for the operation and control of continuously running machinery and technical systems, whereas longer lead times are critical for outdoor activities such as production, transportation, recreation, and sports.
In Vietnam, lightning-related studies have so far mainly focused on thunderstorm forecasting and warning at mesoscale or over broad forecast regions using integrated datasets that include electric field measurements, lightning location data, satellite, radar, synoptic, and aerological observations [1,2,3,41,42,43]. The use of electric field intensity data is essential for performing real-time lightning warnings at specific locations.
In this study, near-real-time lightning warning instruments (Strike Guard by Wxline LLC, Tucson, AZ, USA and EFM-100C by Boltek, Port Colborne, ON, Canada), similar to those used in international studies [22,23,30], are employed to evaluate lightning activity and provide lightning warnings for Chuong My, Hanoi, Vietnam. This research contributes to a better understanding of lightning activity and to the assessment of lightning warning capabilities using advanced location-specific datasets for a particular area in Vietnam.

2. Data and Methods

2.1. Data

The data used in this study were collected from two lightning warning instruments (Strike Guard and EFM-100C) installed at an automatic observation station in Chuong My, Hanoi, managed by the Institute of Earth Sciences (IES). Table 1 summarizes the station location, instruments, and data collection period. Figure 1 illustrates the layout of the Strike Guard (SG) and EFM-100C lightning warning stations, as well as the Ha Dong meteorological station.
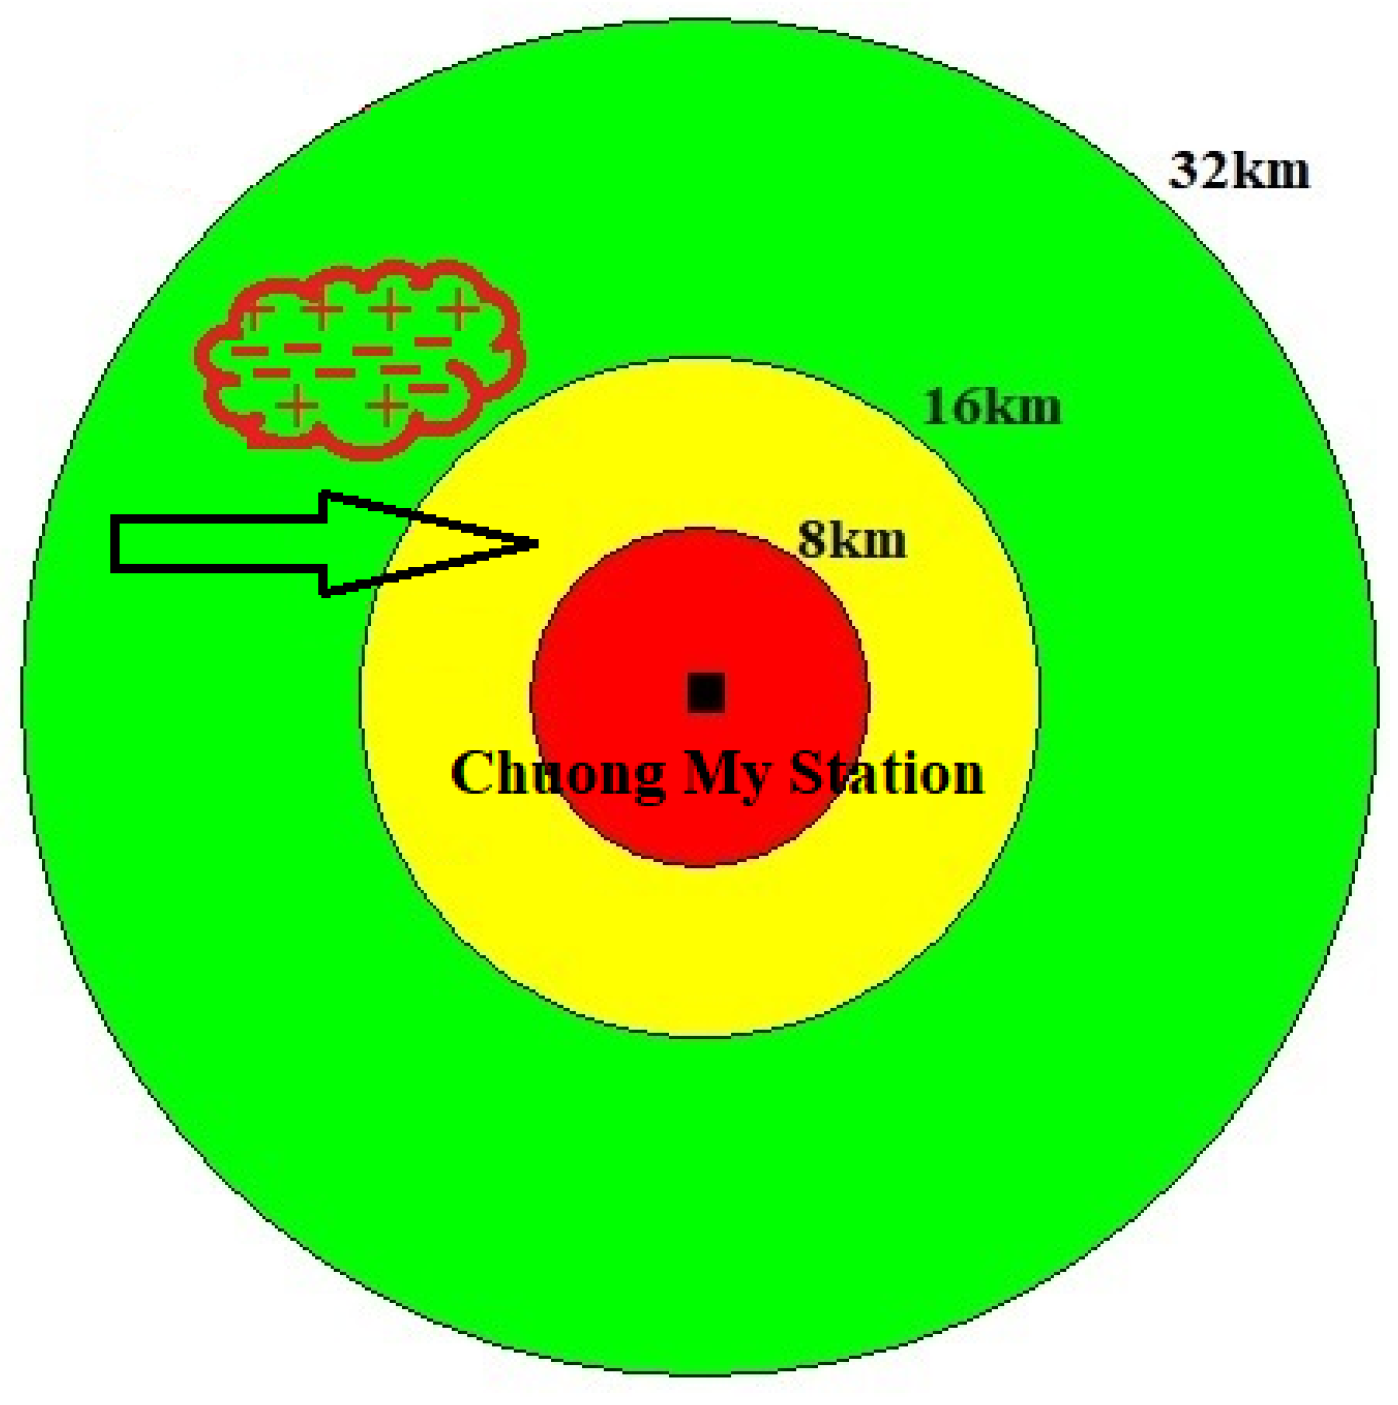
The Strike Guard device detects lightning by sensing optical signals and electromagnetic waves emitted from lightning discharges. Upon detection, it activates and issues status alerts as follows: Caution (green circle, 32 km radius), Warning (yellow circle, 16 km radius), and Alarm (red circle, 8 km radius) [44]. These status messages are continuously recorded and automatically transmitted via email, including the detection time and corresponding alert status. This dataset is comparable to lightning location data from detection networks in Vietnam and worldwide, which also provide information within a fixed radius.
Another dataset used in this study is obtained from the electric field mill (EFM-100C). The EFM-100C has an accuracy of 10 V/m, a measurement range from +20 kV/m to −20 kV/m, and a response time of 0.1 s [45]. This instrument detects lightning, as well as variations in atmospheric electric charge under fair-weather conditions, beneath convective clouds, or thunderclouds, at distances within 20 km from the station.
The lightning data consist of all lightning strokes, with a total of 10,958 occurrences recorded during the 2020–2024 period. Among these, 3539 strokes occurred during 145 thunderstorm events in the 2022–2023 period. We analyzed these 145 thunderstorm events to evaluate the performance of lightning warnings. The dataset includes all thunderstorm events recorded during the two summer seasons (May–September) of 2022 and 2023. These events encompass a wide range of lightning occurrences and meteorological conditions, ensuring statistical representativeness.
To perform an independent validation of the SG instrument data, we used a secondary dataset from the Vietnam Meteorological and Hydrological Administration (VNMHA) for the 2022–2023 period. The VNMHA dataset represents the operational lightning detection data currently used in Vietnam and is considered the most reliable source for the region. Specifically, the operational lightning location data from VNMHA are collected from a network of 18 domestic detection stations (Vaisala sensors funded by the Finnish Government’s ODA program) combined with international lightning detection networks. Additionally, we utilized rainfall observations from the Ha Dong meteorological station, operated by VNMHA, for the same 2022–2023 period to investigate the coincidence between lightning activity and rainfall occurrences.

2.2. Method for Evaluation of Lightning-Stroke Data

Since the SG instrument can detect the timing of lightning occurrences within a specific observation radius, the dataset collected over a sufficiently long period can be used to analyze the temporal characteristics of thunderstorm activity in the study area. The lightning detection data from the SG instrument were evaluated by comparing them with rainfall data and lightning location data provided by the VNMHA. All three datasets including rainfall data, VNMHA lightning location data, and SG lightning detection data were aggregated on an hourly basis. The correlation between the two lightning datasets within the alarm area (also referred to as the Area of Concern, with a radius of 8 km) was determined using the following formula:
R X Y = X i X ¯ Y i Y ¯ X i X ¯ 2 Y i Y ¯ 2
Here, X and X ¯ denote the hourly total and the mean number of lightning strokes detected by the SG instrument, respectively. Similarly, Y and Y ¯ represent the hourly total and the mean number of lightning strokes detected by the VNMHA lightning location network.

2.3. Methodology for Evaluation of Lightning Warning and Performance

In this study, we applied a lightning warning method tailored to the observational datasets available for the study area. The warning is issued for a circular region with a radius of 8 km, marked in red (the Area of Concern, AOC, or alarm area; Figure 2). As illustrated in Figure 2, thunderstorms may either move into the red area from outside or develop within it. The processes of charge accumulation, dissipation, and lightning discharges occurring in these regions are recorded by the EFM-100C and SG instruments.
Lightning warnings are activated based on the electric field intensity data from the EFM-100C and the Caution or Warning states reported by the SG at the Chuong My station. The Alarm state within the AOC is subsequently used to evaluate the warning performance. The objective of this study is to provide warnings for the first lightning strokes occurring in the AOC using the combined EFM-100C and SG data. However, in cases where thunderstorms develop within the AOC and the first lightning strokes occur inside this region, the method is adapted to provide warnings of lightning expected in the area during the upcoming period.
The electric field data were averaged over 72 s to minimize short-term fluctuations. In a previous study conducted in the Quang Nam area (Vietnam) [43], local optimization and sensitivity analyses were performed to confirm that an optimal warning threshold of ±1000 V/m performs well for the Vietnam region. In that study [43], applying the ±1000 V/m threshold yielded a Probability of Detection (POD) exceeding 80%. This warning threshold (±1000 V/m) has also been widely adopted in many regions worldwide as well as in Vietnam [22,23,29,41,43]. In the present study, the EFM-100C electric field data were collected in Chuong My, a rural area of Hanoi far from industrial zones. The relatively clean environment helps minimize the influence of air pollution on the EFM-100C measurements. Because the measurements were taken close to the ground surface, at an elevation of less than 20 m above sea level, the potential errors due to elevation differences were also minimized. Therefore, in this work, the threshold index for lightning warning, defined as the Electrostatic Field Amplitude Index (EFAI), was initially set to 1000 V/m, consistent with previous studies, and we also further explored optimal thresholds by evaluating multiple values ±500, ±1000, ±1500, ±2000, ±2500, and ±3000 V/m (more details in Section 3.3).
When the EFAI value derived from the EFM-100C exceeds this threshold, a lightning warning for the AOC is activated if a Caution or Warning state from the SG instrument has been reported within the preceding 30 min. If the Caution or Warning state from the SG appears only after the threshold is exceeded, the warning activation time is adjusted to the occurrence of that state. If the EFAI value remains above the threshold for 30 min and the SG continues to indicate a Caution or Warning state, the warning remains active. However, if no lightning occurs within the AOC during the 60 min following the threshold exceedance, the warning is canceled.
Based on the numbers of correct warnings, false warnings, and missed warnings, the lightning warning method for the Chuong My area in Hanoi was evaluated. The statistical indices, including the Probability of Detection (POD), the False Alarm Ratio (FAR), the Critical Success Index (CSI), the Pre (Precision), and the F1 score were determined as follows:
P O D = A A + B
F A R = C A + C
C S I = A A + B + C
P r e = A A + C
F 1 = 2 × P r e × P O D P r e + P O D
The definitions of the quantities A, B, and C are provided in Table 2.

3. Results

Based on a five-year dataset (2020–2024) collected from the real-time lightning warning device (Strike Guard) at the Chuong My area, we analyzed and evaluated the characteristics of lightning activity. In addition, datasets from both the electric field sensor (EFM-100C) and the SG system during 2022–2023 were used to develop and assess a lightning warning method for this area.

3.1. Data Evaluation

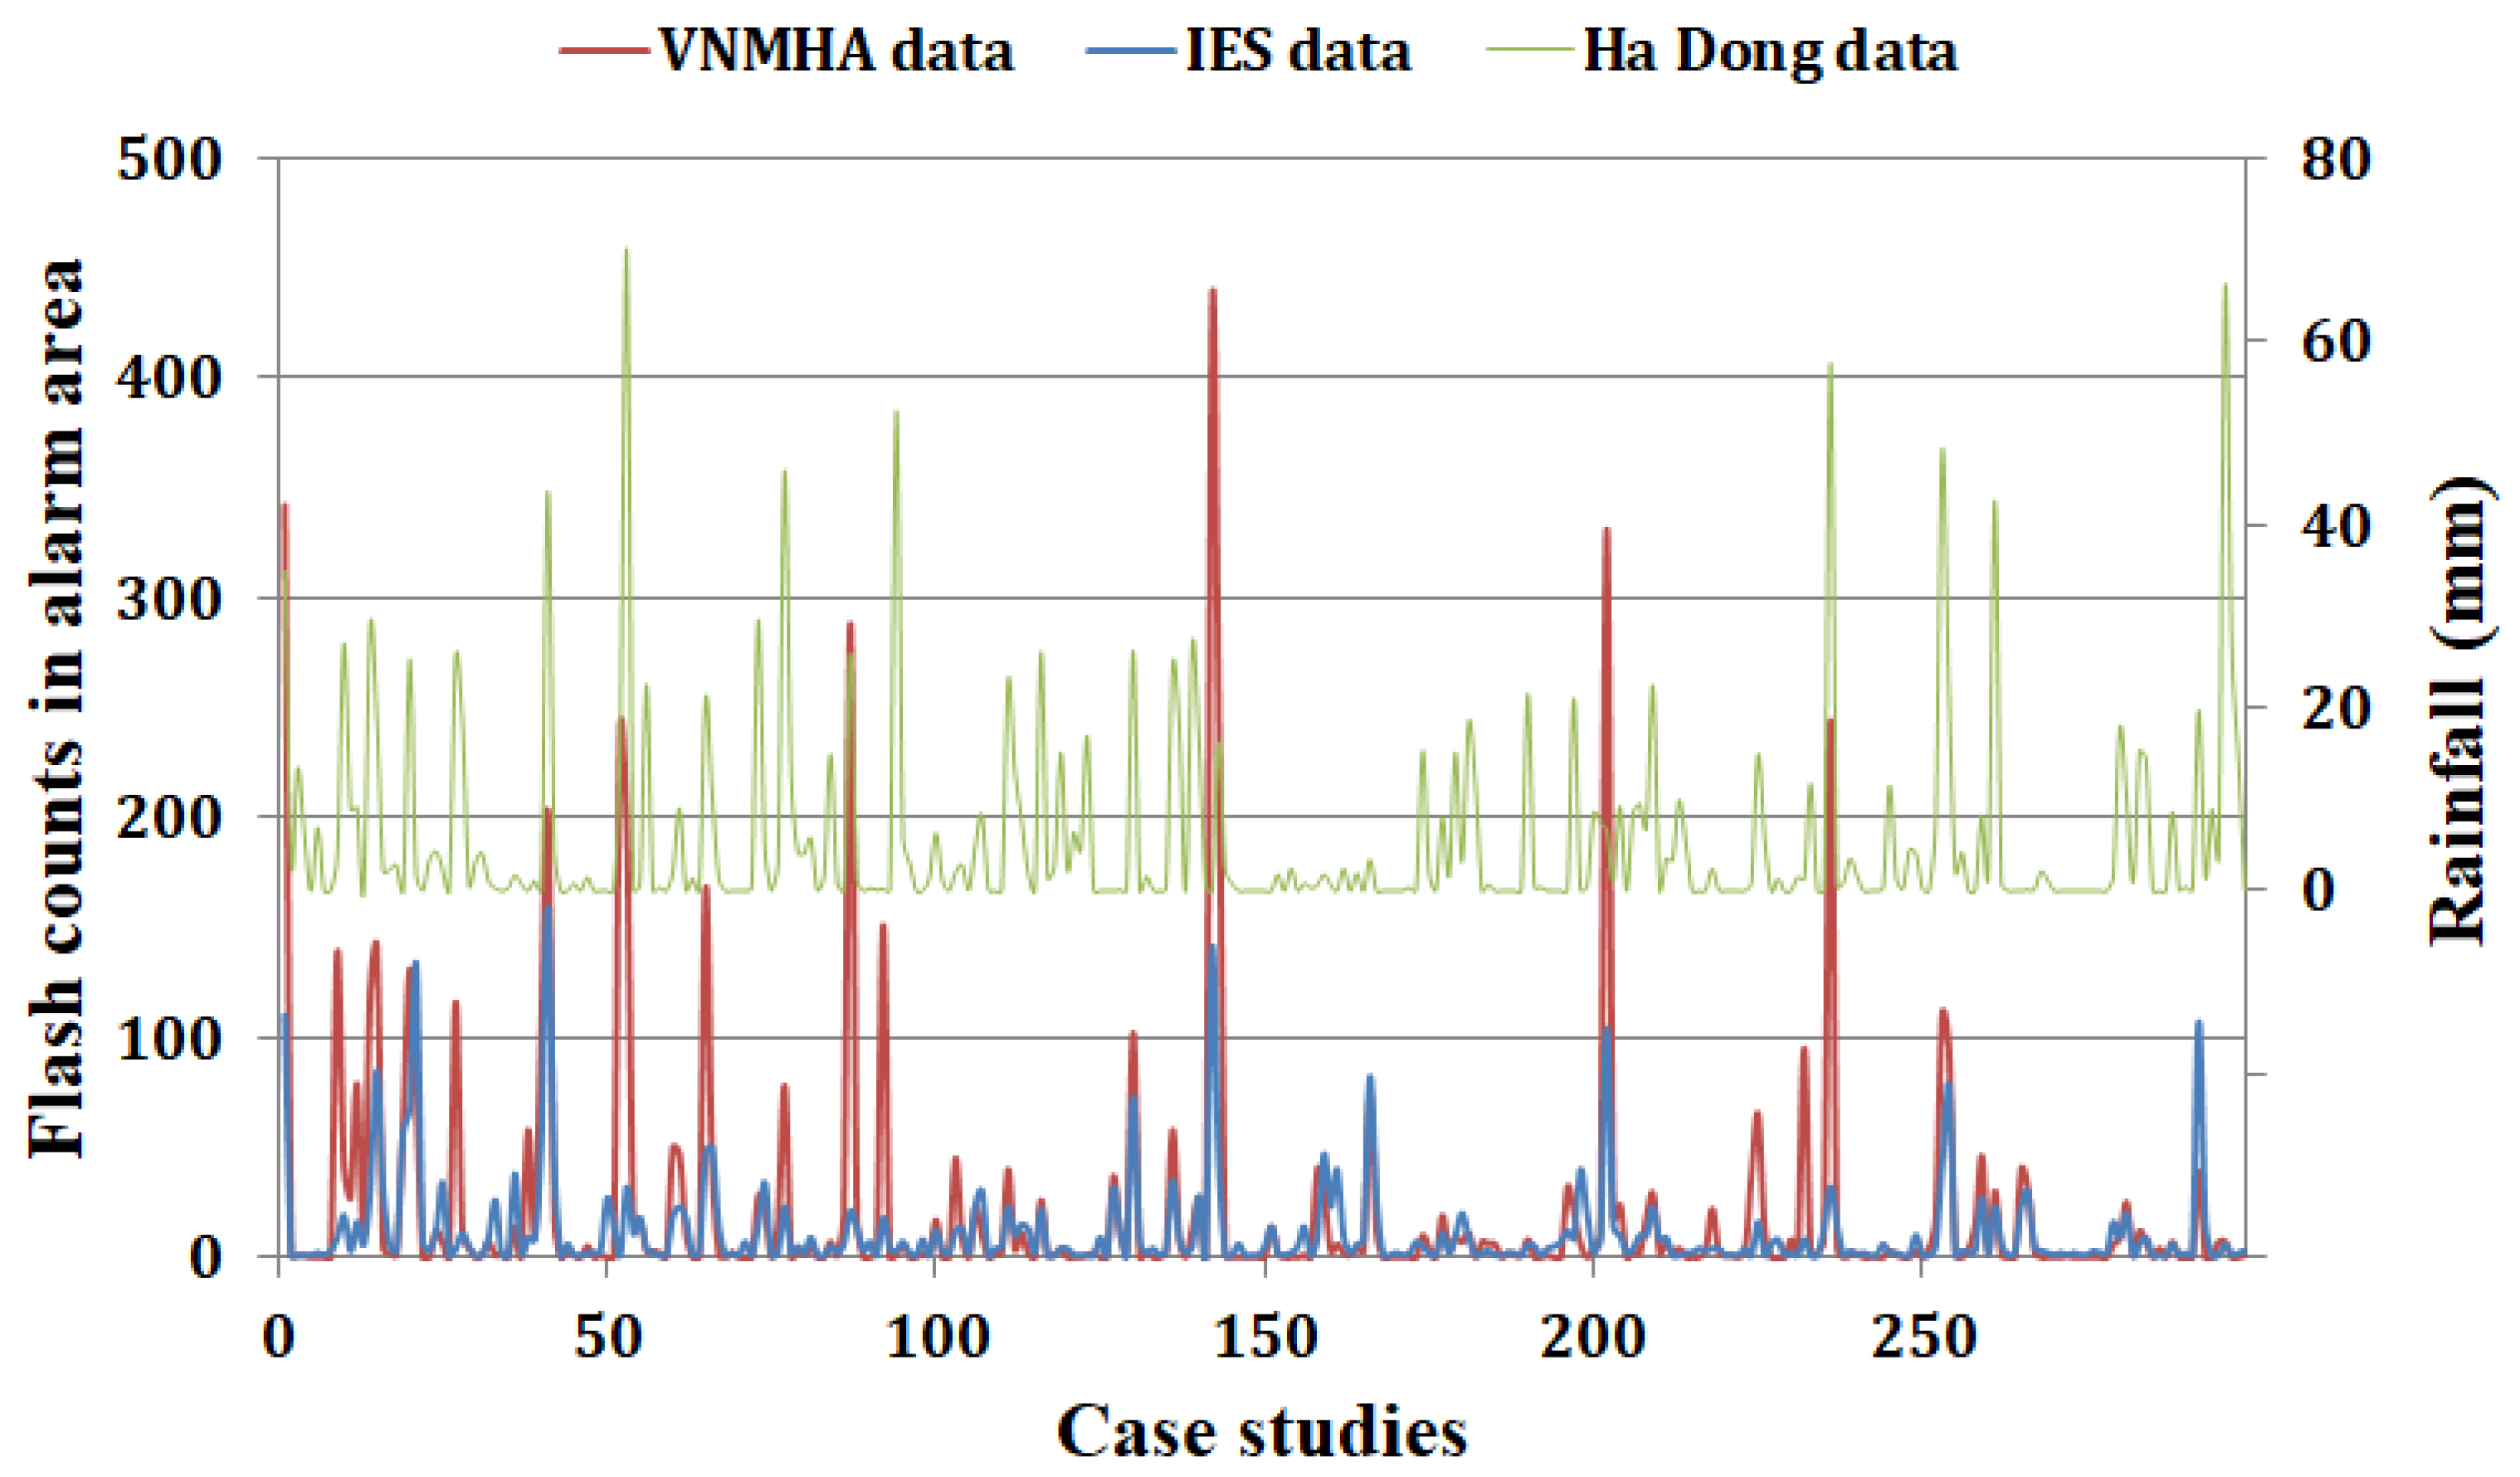
Figure 3 illustrates the hourly variations in rainfall and the total number of lightning strokes detected within the alarm area (radius of 8 km) during the summer seasons (May–September) of 2022 and 2023 in the Chuong My region. Based on 299 observation hours (across the two summer seasons) from both lightning datasets and rainfall measurements, it can be seen that the temporal variations in the two lightning datasets are fairly consistent. The correlation between lightning detected by the SG instrument and that detected by the VNMHA lightning location network is represented by a correlation coefficient of R = 0.74. In most of the time intervals examined, lightning detected by the SG instrument was also detected by the VNMHA network. During most of these extreme lightning stroke events, significant rainfall was also recorded within the alarm area, with several peaks in total rainfall and total lightning coinciding. Therefore, the SG dataset can be considered suitable for studies on the climatological characteristics of thunderstorms as well as for near–real-time lightning warning applications.
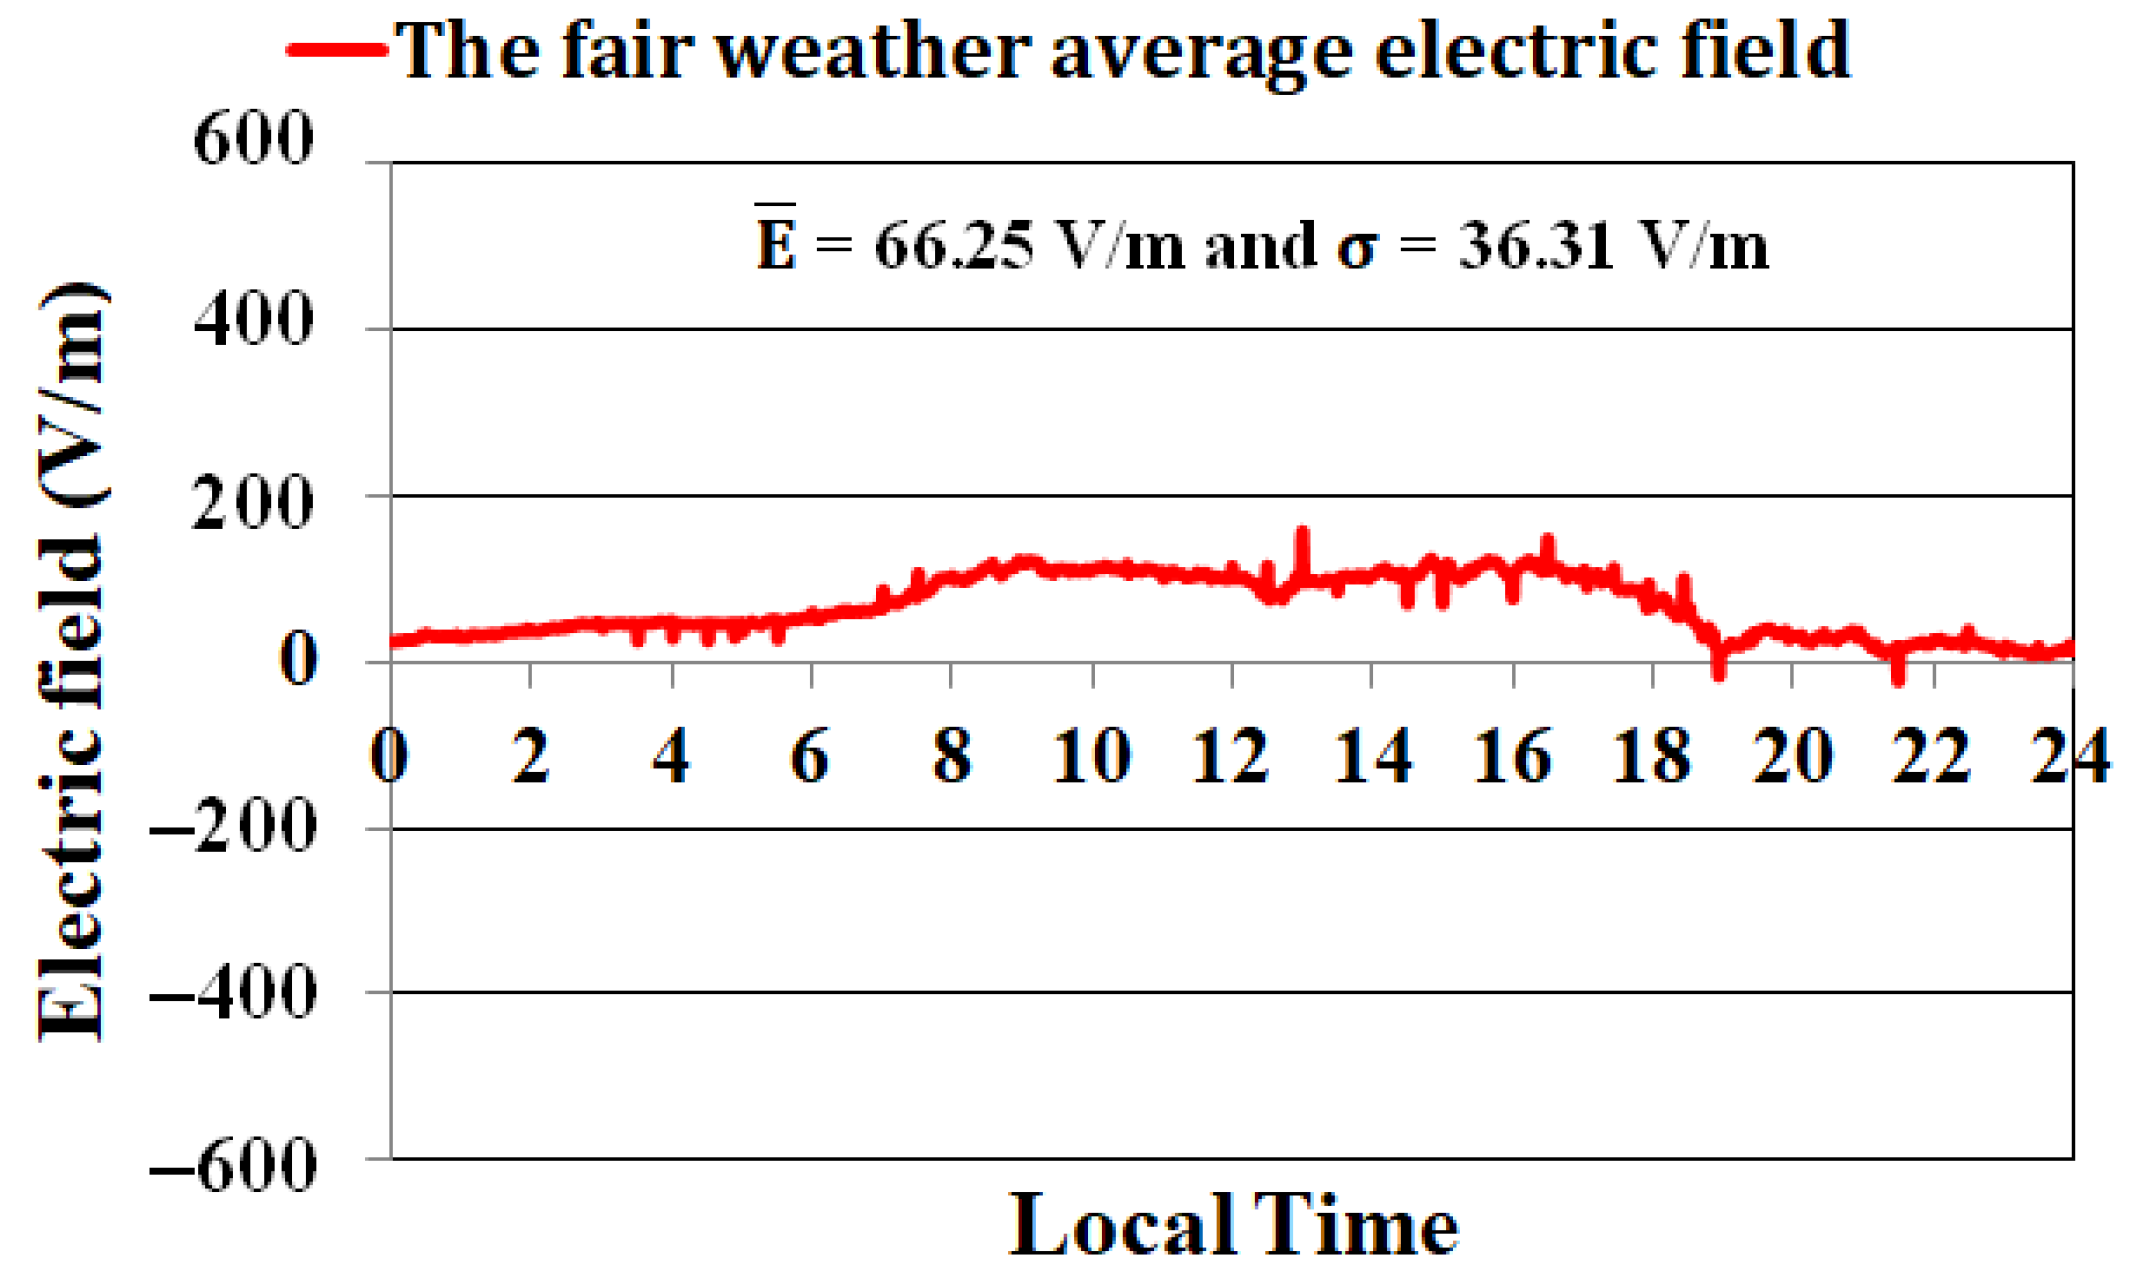
The EFM-100C dataset has been employed in several studies conducted in Vietnam and in various regions worldwide [30,41,42,43,46]. According to studies [5,7], during the summer months in the Hanoi area, on days without rainfall, other criteria related to cloud cover and wind speed for determining fair-weather conditions, as defined in study [47], are almost always satisfied. Therefore, we used only the “no rainfall” criterion to identify fair-weather conditions and its relationship to electric field variation. The electric field data collected at Chuong My were found to be minimally influenced by environmental noise, as indicated by the variations in the mean fair-weather electric field shown in Figure 4. Figure 4 presents the diurnal variation averaged over 119 rain-free days in the Chuong My area during May–September of 2022 and 2023. Most of the mean electric field values fall within the range of 0 to nearly 200 V/m, with a daily mean of 66.25 V/m. This is consistent with a relatively clean observational environment and suggests that the data are only slightly affected by noise [4,26]. Therefore, this dataset is suitable for use in lightning warning studies, as demonstrated in several investigations conducted both in Vietnam and globally.

3.2. Results of Lightning Activity Assessment Using the Strike Guard System

The Chuong My area of Hanoi is located within the Red River Delta in northern Vietnam. Most of the area lies on the deltaic plain of the Red River, with an average elevation ranging from approximately 5 to 20 m above sea level. The terrain gradually slopes downward from west to east and from north to south. As part of the Red River Delta climate zone, Hanoi experiences a tropical monsoon climate characterized by hot, rainy summers and cool, dry winters. Rainfall occurs mainly from May to September, while April and October serve as transitional months between winter and summer [5,6,7,8].
Thunderstorms in the Red River Delta in general, and in the Hanoi area in particular, are typically associated with several synoptic-scale weather systems, such as the intertropical convergence zone (ITCZ), the westward extension of the continental low, cold fronts, the peripheries of tropical cyclones, and upper-level troughs. These systems usually occur from March to October, with peak thunderstorm activity observed in June, July, and August. Two main types of thunderstorms are commonly observed in this region: thermal (air-mass) thunderstorms and system-related thunderstorms. Thermal thunderstorms generally develop within mesoscale or smaller air masses and occur mainly in the afternoons and evenings during May, June, and July [6,8]. In contrast, system-related thunderstorms prevail during the other months of the thunderstorm season, affecting larger areas and being associated with cold fronts, the ITCZ, the peripheries of tropical cyclones, or low-level troughs.
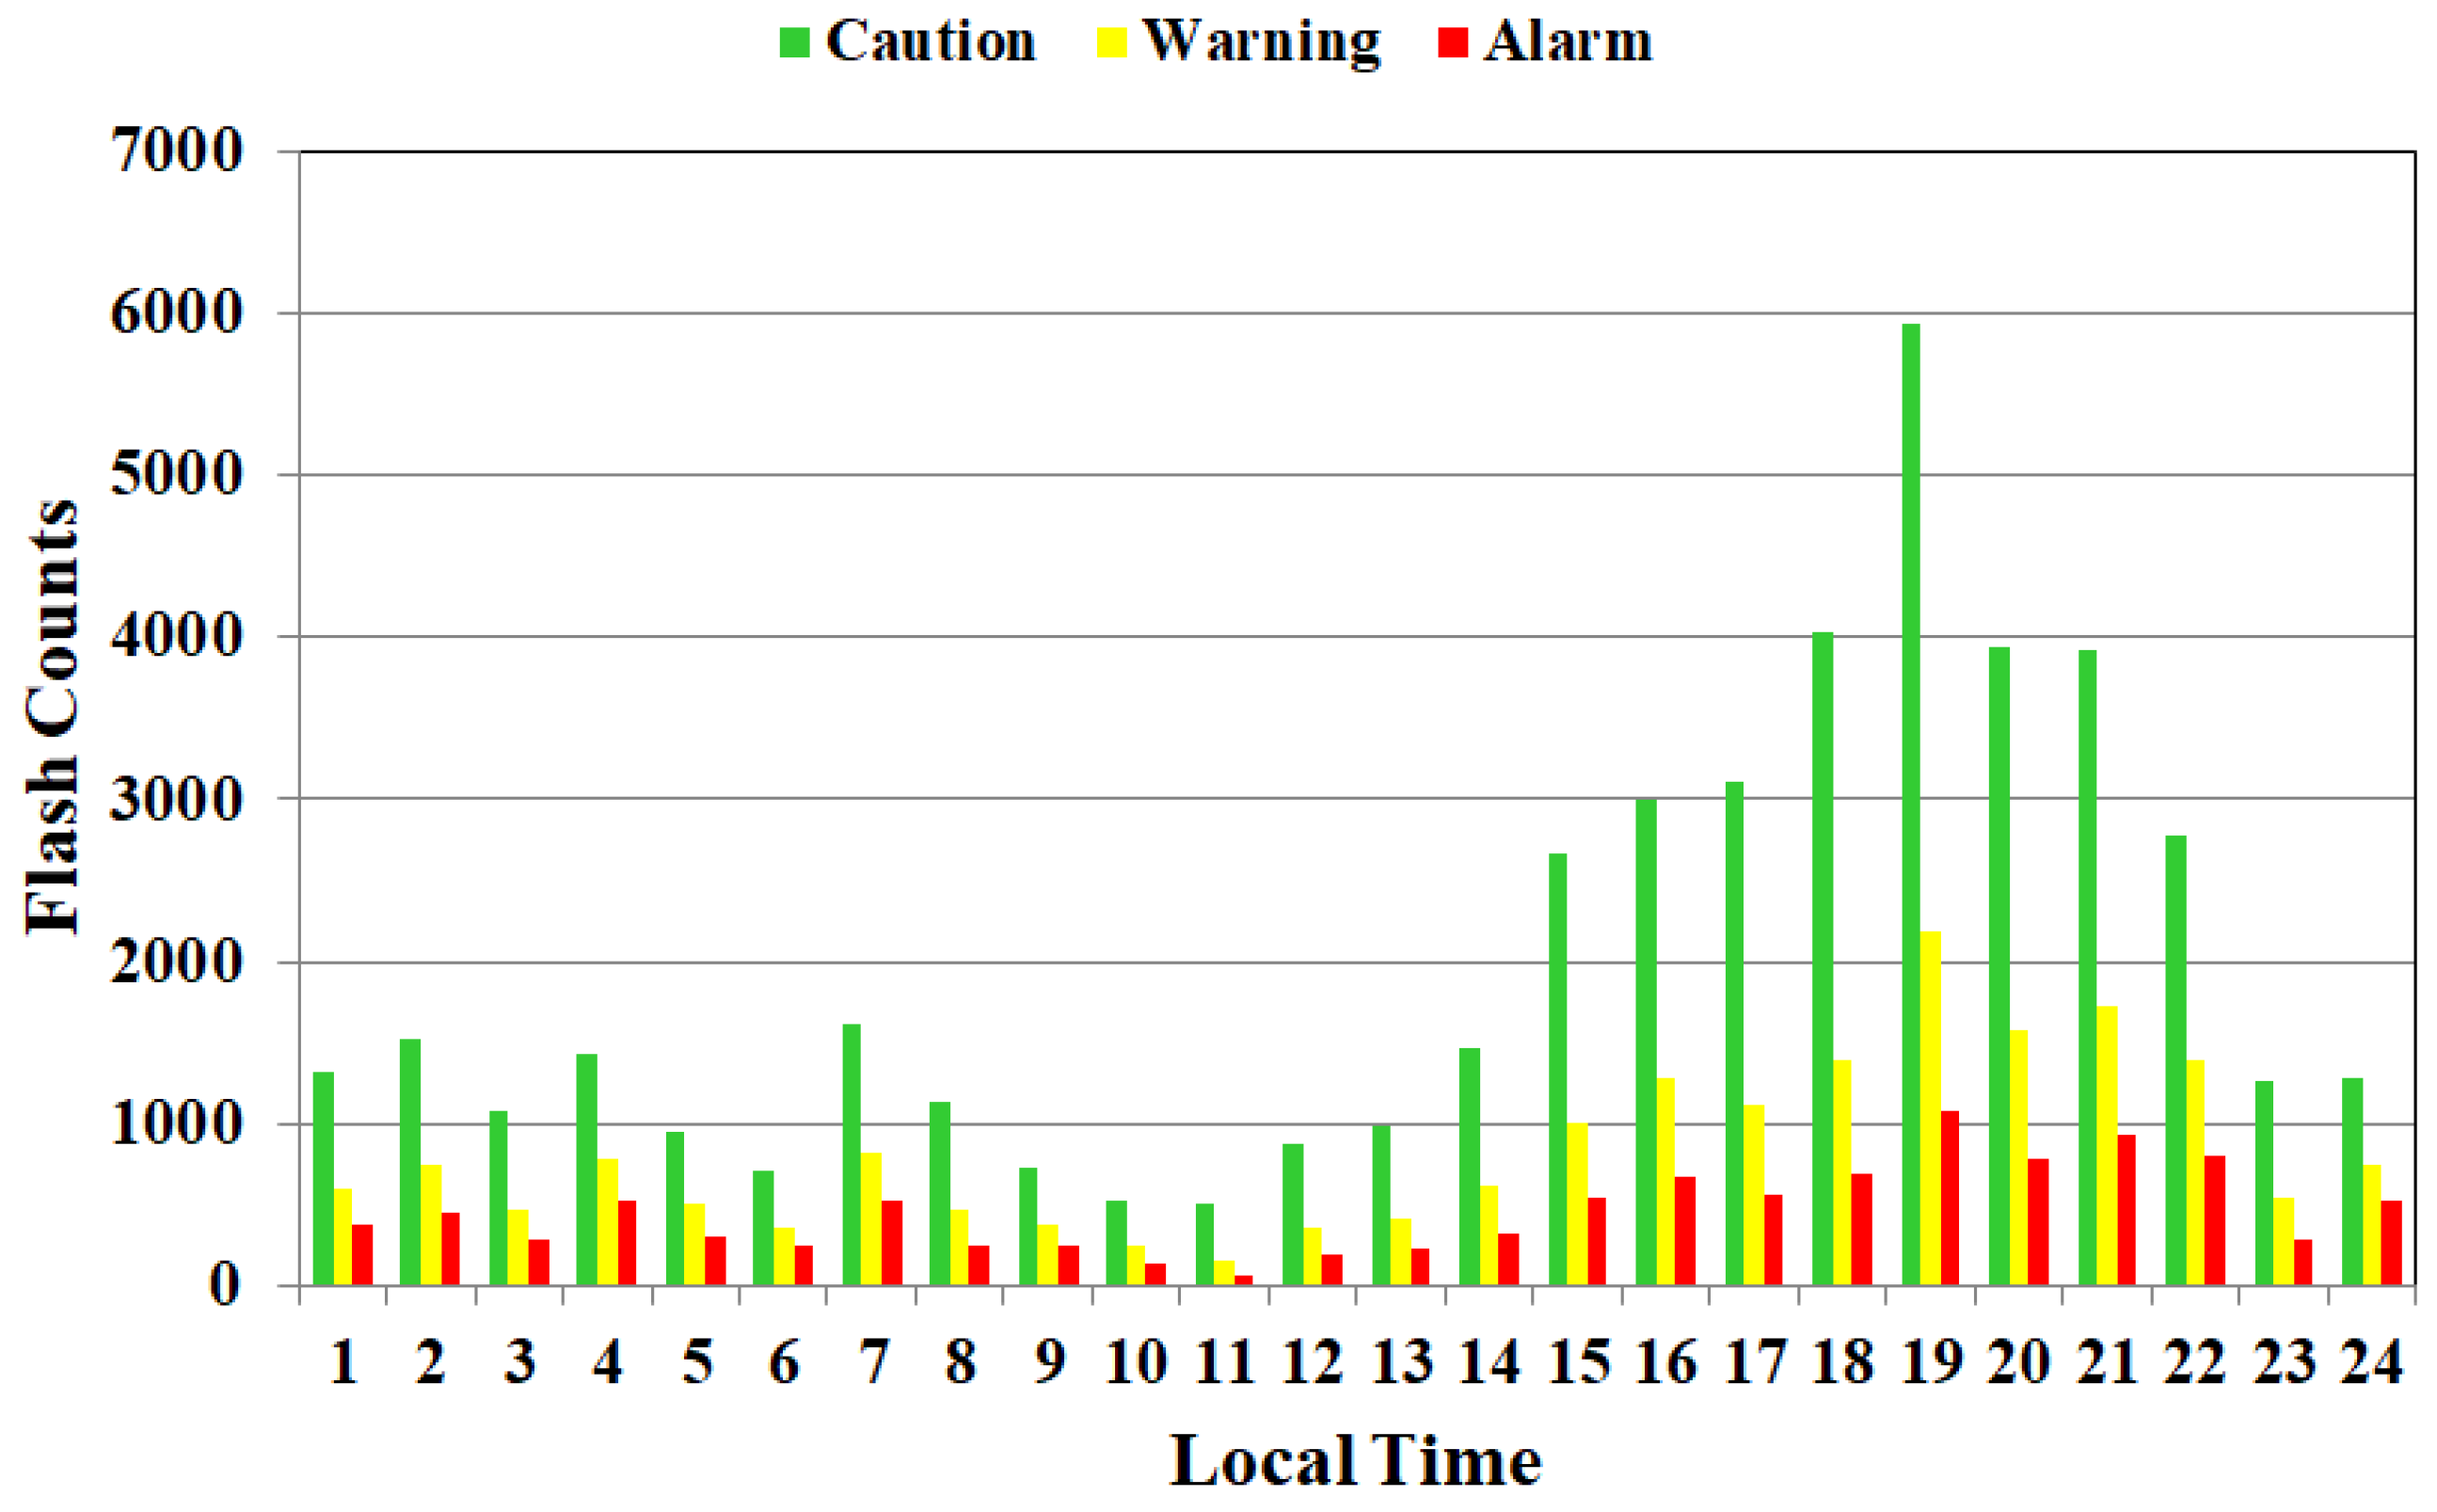
The characteristics of thunderstorm activity in Chuong My, based on Strike Guard data across the three detection states (Caution, Warning, and Alarm), are analyzed through variations in activity on diurnal, monthly, and interannual timescales, as well as by the number of thunderstorm days and hours. Figure 5 shows the hourly variation in the total number of lightning flashes during 2020–2024 for the three detection states. As illustrated, lightning activity in the Chuong My area (red zone in Figure 4) and its surrounding regions is most pronounced in the afternoon, peaking between 18:00 and 19:00 local time. A total of 1076 flashes were recorded over the five-year period. The weakest activity occurs between 09:00 and 12:00, with a minimum between 10:00 and 11:00, during which only 64 flashes were detected (Figure 5). When the observational range was expanded to 16 km (Warning) and 32 km (Caution), the maximum hourly lightning counts also occur between 18:00 and 19:00, with totals of 2194 and 5943 flashes, respectively, over the same period. Conversely, the minimum activity was observed between 10:00 and 11:00, with 152 and 495 flashes, respectively (Figure 5). These results indicate that the hourly lightning counts derived from Strike Guard data effectively capture the diurnal pattern of thunderstorm activity in the study area, consistent with previous climatological studies conducted in this region [5,7,8].
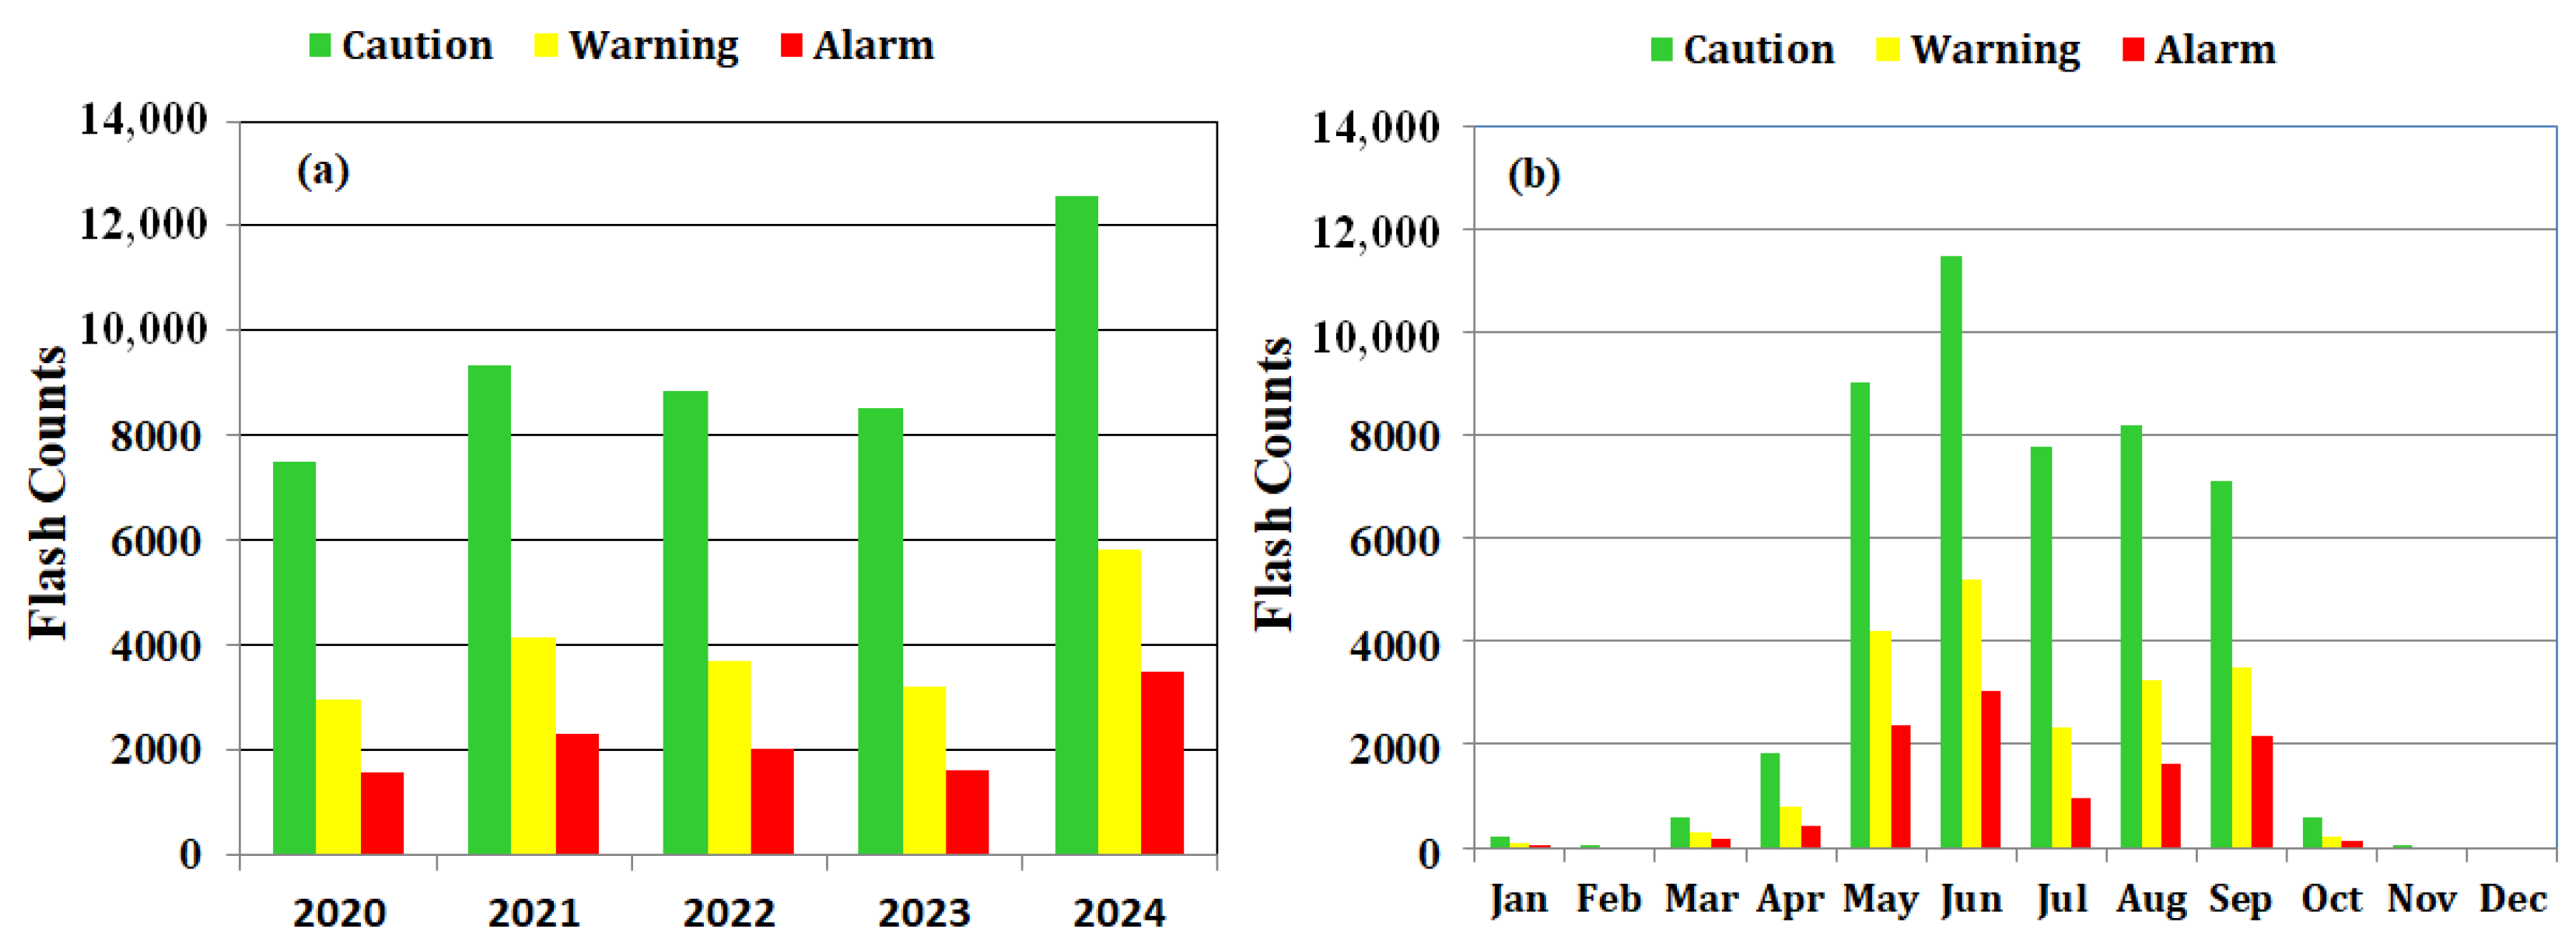
Figure 6 illustrates the total number of lightning flashes recorded annually and monthly, categorized by detection states (Caution, Warning, Alarm). Figure 6a shows that the lowest number of flashes within the Alarm area occurred in 2020, with 1556 flashes, while the highest was observed in 2024, with 3481 flashes. In the intervening years, the total number of flashes in the Alarm area exceeded that of 2020, with 2304, 2023, and 1594 flashes detected in 2021, 2022, and 2023, respectively. Although 2020 was a La Niña year, typically associated with increased rainfall and lightning activity in Vietnam, the total number of flashes was notably lower. This reduction may be attributed to the global and national COVID-19 pandemic, during which industrial activities, transportation, and human mobility were significantly curtailed due to lockdown measures. Consequently, the decrease in aerosol particles, an important factor influencing thunderstorm electrification, likely contributed to the reduced lightning activity observed in 2020 [48,49,50,51,52,53,54]. Figure 6b presents the monthly distribution of lightning flashes recorded over the five-year period (2020–2024) for the three detection states (Caution, Warning, Alarm). As shown in Figure 6b, lightning activity in northern Vietnam predominantly occurs between March and October, with substantial numbers of flashes detected, while the remaining months exhibit either negligible or no lightning activity.
The monthly distribution further shows that lightning occurs most frequently during the early summer months (May and June) and late summer (September), with two distinct peaks observed in June (3054 flashes) and September (2181 flashes). In addition to lightning associated with organized mesoscale convective systems, the enhanced lightning activity in early summer is closely related to the strong influence of the southwest monsoon, which transports substantial moisture to northern Vietnam. Combined with high summer temperatures, these conditions favor the frequent development and advection of convective thunderstorms over the Chuong My area, Hanoi [6], explaining why May and June consistently record higher lightning counts across the five-year period. In contrast, July and August are often dominated by the hot and dry continental low-pressure system over western Indochina, which is less conducive to the development of deep convection, resulting in fewer lightning flashes. By September, interactions between cold and warm air masses over northern Vietnam create favorable conditions for organized thunderstorms, leading to the second lightning peak. From October to March of the following year, thunderstorm activity gradually diminishes or ceases entirely as the region enters its winter and early spring periods, characterized by lower temperatures and relatively dry air masses that are unfavorable for thunderstorm development. These findings are generally consistent with those of [8], which analyzed lightning activity over northern Vietnam using GLD-360 data.
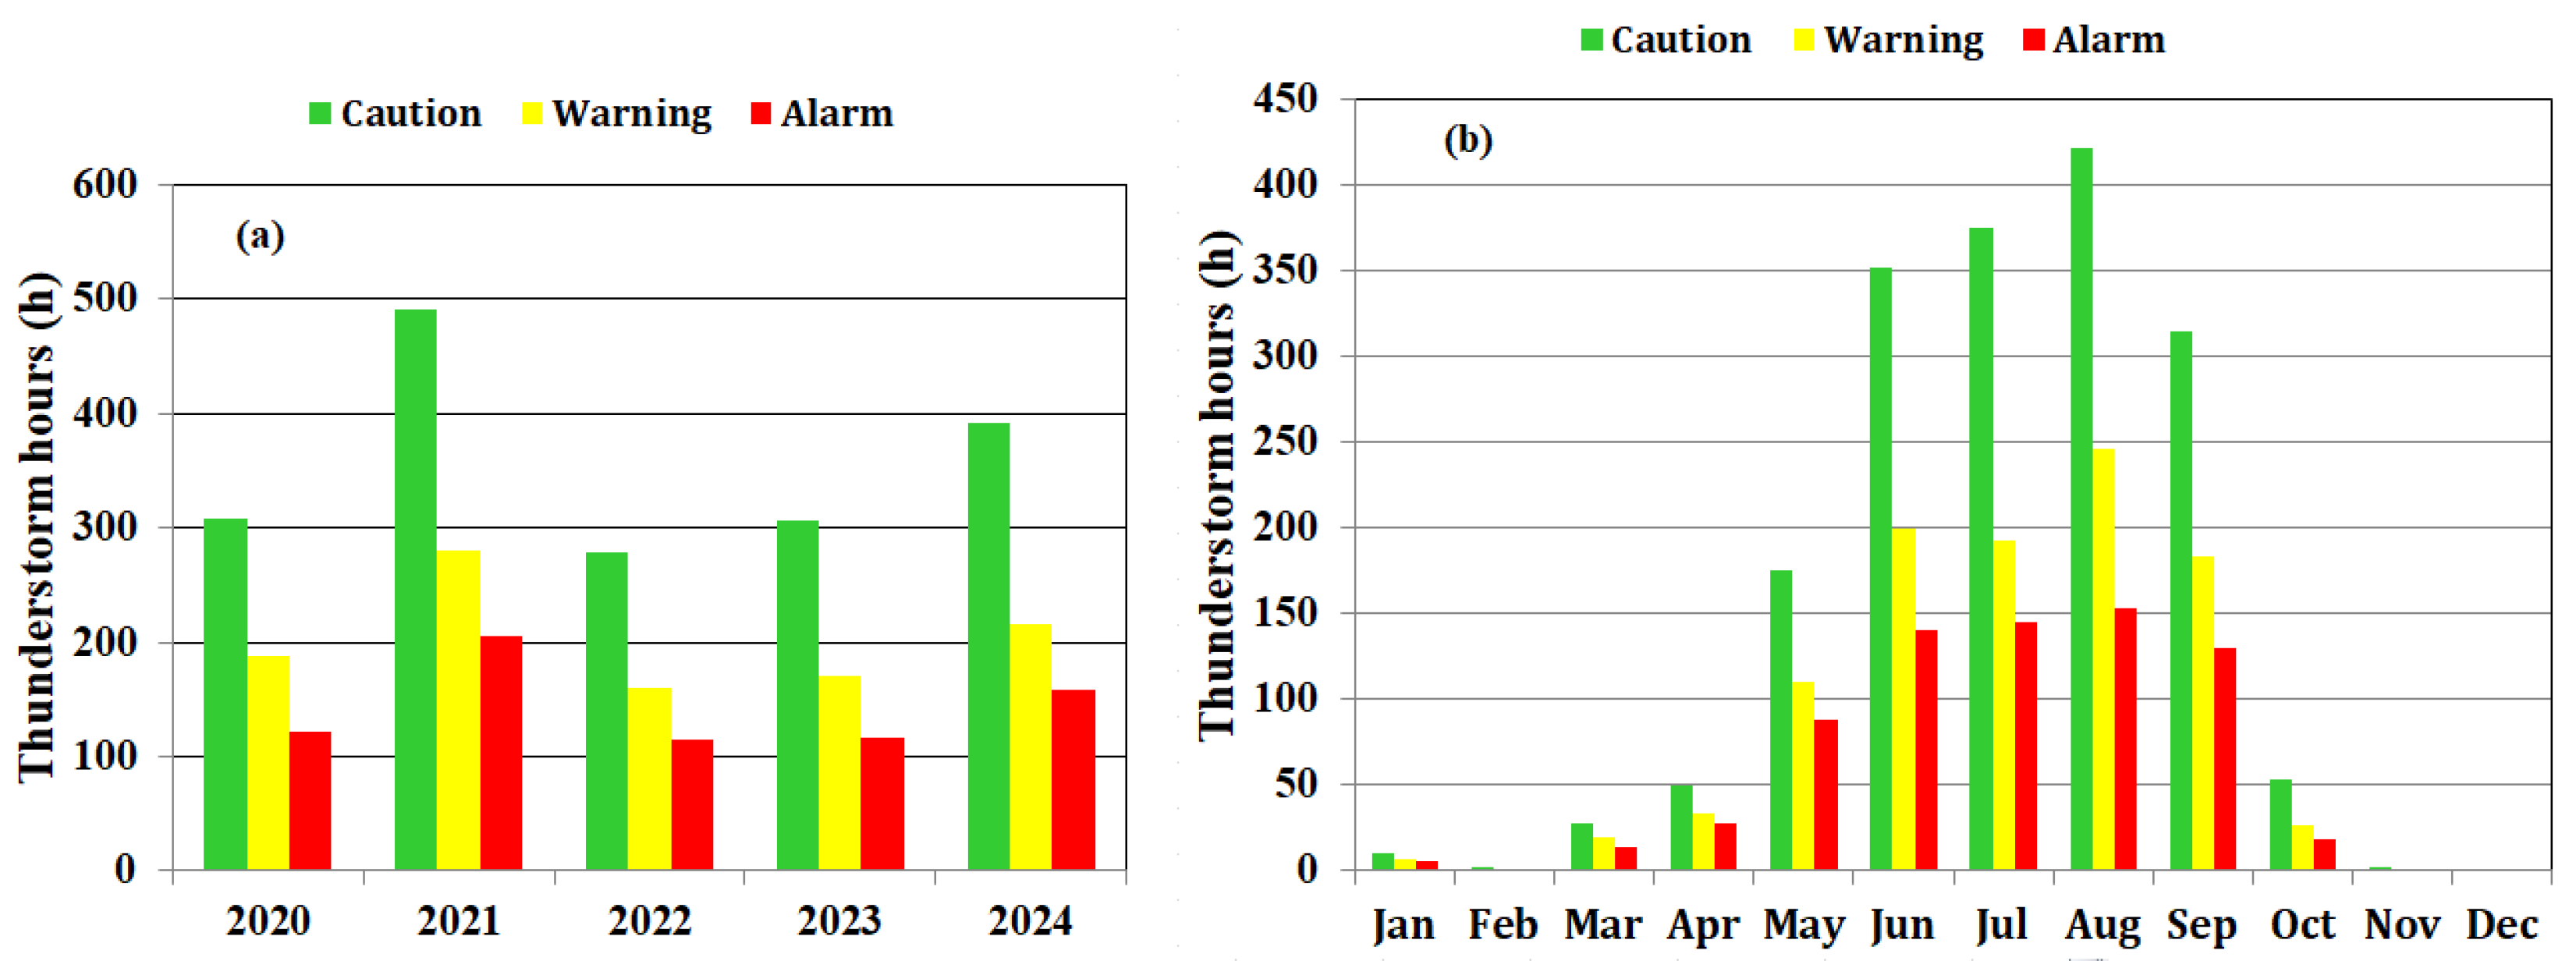
Figure 7a illustrates the annual total thunderstorm hours. The number of thunderstorm hours recorded within the Alarm state (8 km radius) in 2020, 2022, and 2023 was relatively similar, with 2022 showing the lowest value (114.5 h). In contrast, 2021 and 2024 exhibited substantially higher thunderstorm hours within the Alarm state, reaching 206 h and 159 h, respectively. For the Warning state (16 km radius), which approximates the ~20 km distance at which thunder can typically be heard by humans [1,4], the annual variation followed a similar pattern to that of the 8 km radius. From 2020 to 2024, thunderstorm hours in this state were 189, 281, 160, 170, and 216 h, respectively. Although the total number of lightning flashes in 2021 did not peak due to the impacts of the COVID-19 pandemic, that year still recorded the highest number of thunderstorm hours, likely influenced by the persistence of La Niña conditions over Vietnam. The El Niño phenomenon only intensified in late 2023 and early 2024; therefore, the summer months of northern Vietnam in 2024 were not significantly affected. Consequently, thunderstorm activity returned to near-neutral levels, resulting in an increase in thunderstorm hours compared with 2020, 2022, and 2023.
Figure 7b shows the monthly distribution of thunderstorm hours over five years (2020–2024) for the three states: Caution, Warning, and Alarm. The monthly values indicate that the maximum thunderstorm hours for all three states occurred in August. Specifically, in August, the thunderstorm hours reached 153 within the Alarm area (8 km), 246 within the Warning area (16 km), and 422 within the Caution area (32 km). Although August recorded the highest total thunderstorm hours in Chuong My across the five years as detected by the SG system, the monthly lightning flash counts peaked in June (Figure 6b). This suggests that thunderstorms during the early summer months (May–June) tend to be more intense than those occurring in mid to late summer in this region.
Figure 8 illustrates the annual total thunderstorm days and the monthly averages for the three detection states (Caution, Warning, Alarm). According to Figure 8b, for the Alarm state, the minimum number of thunderstorm days is 58 days (2022), the maximum is 82 days (2024), with an average of 66.8 days. For the Warning state, the minimum is 68 days (2022), the maximum is 91 days (2024), with an average of 77.4 days. For the Caution state, the minimum is 83 days (2022), the maximum is 112 days (2024), with an average of 97.8 days, which is close to the annual thunderstorm day value of 94 days for Hanoi reported in [5]. Figure 8b shows the monthly average thunderstorm days over the five-year period determined from the SG device at Chuong My. In the Alarm state, the monthly average ranges from 0 to nearly 15 days, peaking in August (14.8 days). In the Warning state, the peak occurs also in August (17.8 days). In the Caution state, the maximum monthly average occurs in July (20.4 days), which is close to the value of 19 days in July for Hanoi reported in the climate reference [5]. The temporal pattern of total thunderstorm hours per month over the five-year period in Chuong My is similar to the monthly average thunderstorm days for northern Vietnam, as reported in [8], with a peak in August exceeding 12 days.

3.3. Results of Lightning Warning Using EFM-100C and Strike Guard Devices

One of the important applications of atmospheric electric field measurement devices and lightning warning systems is their use for real-time or near-real-time lightning warnings for specific areas. In this study, we applied a method, as described in Section 2, using a combination of these two data sources to investigate lightning warning for the Chuong My area, Hanoi. The electric field threshold for lightning warning was determined based on previous studies and observations. According to [4,26], the Earth carries a negative charge of approximately 5 × 10⁵ C; under fair weather conditions, typically dry with a relatively clean atmosphere, the measured electric field is around 130 V/m. However, when charged convective or thunderstorm clouds move to a point or develop locally, the electric field beneath or near the clouds can fluctuate or reach values exceeding ±1.0 kV/m. To further verify the ±1000 V/m threshold, which was successfully applied in a similar study [43] that also focused on this region, based on a dataset of 145 cases investigated during the period from May to September in 2022 and 2023 for lightning warning using EFM-100C and SG data, we evaluated the optimal lightning warning threshold according to statistical indices. The results, presented in Table 3, indicate that a threshold of ±1000 V/m yields the best performance, with the highest POD, CSI, and F1 values and the lowest FAR. Therefore, the threshold, defined as the Electrostatic Field Amplitude Index (EFAI), was set as 1000 V/m.
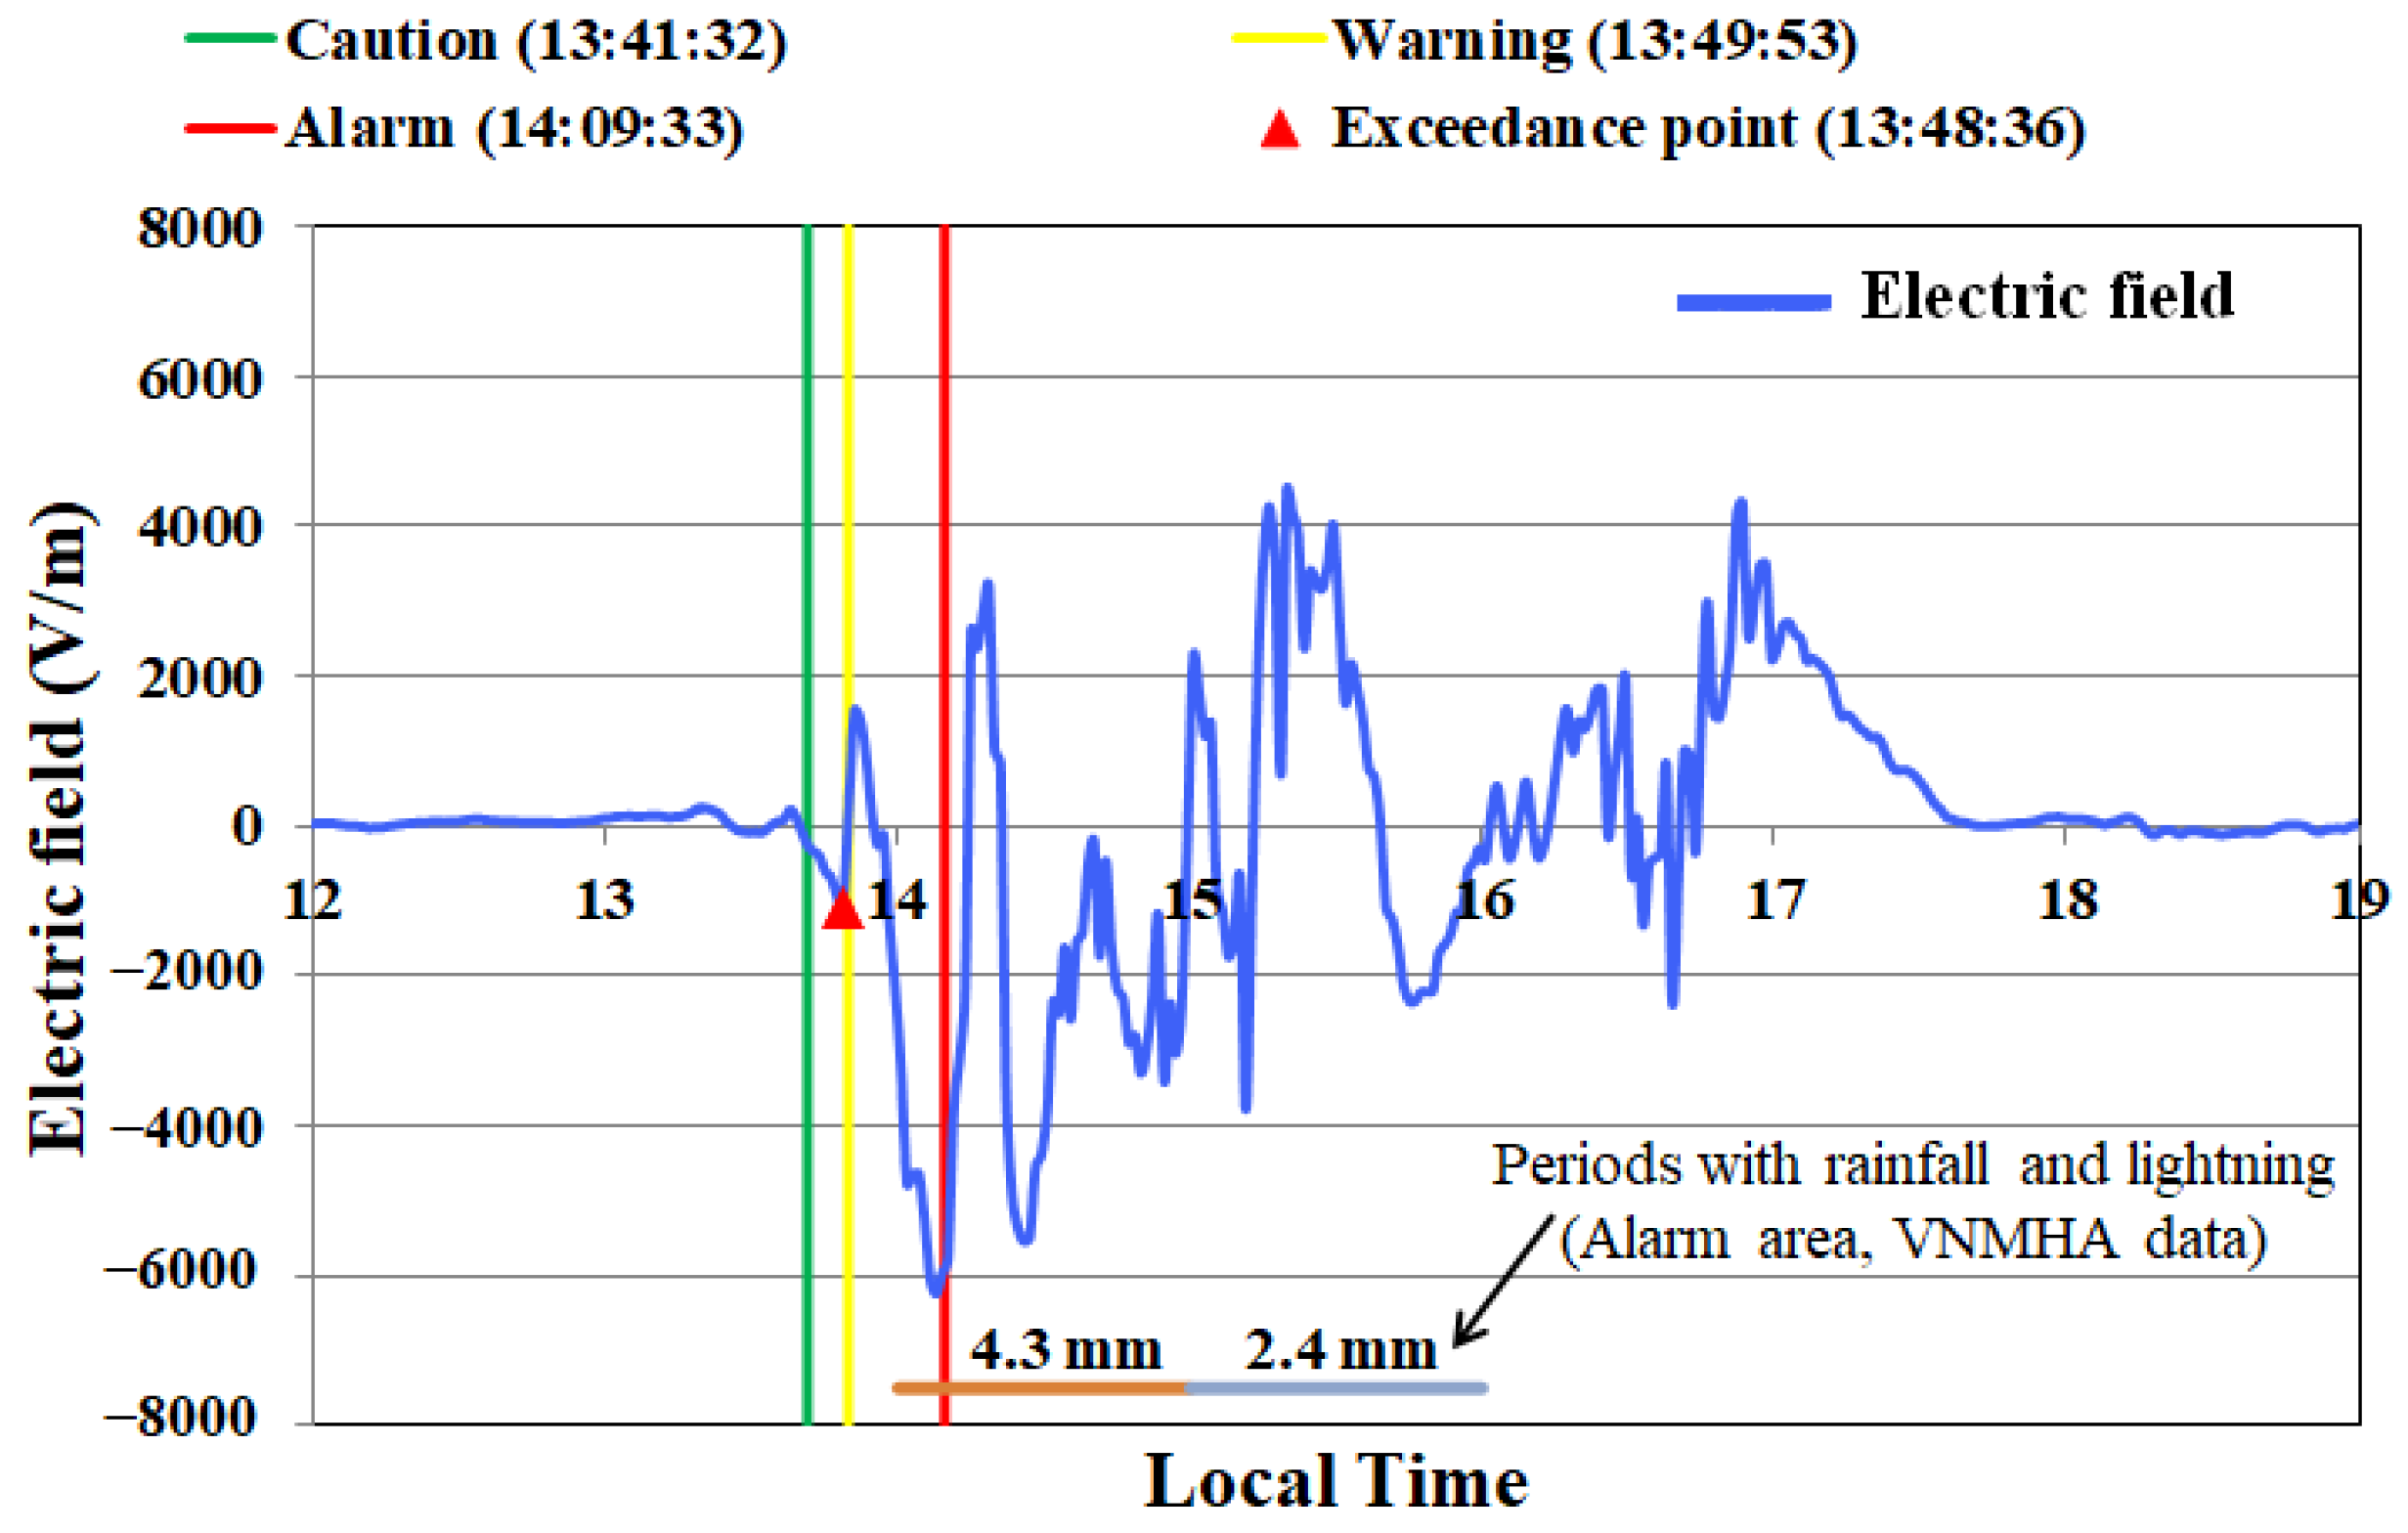
Figure 9, Figure 10, Figure 11, Figure 12, Figure 13 and Figure 14 illustrate several cases among 145 cases investigated during the period from May to September in 2022 and 2023 for lightning warning based on EFM-100C and SG data. This study focuses on issuing warnings for the first lightning strike within the Alarm Area or, in cases where lightning has already occurred in this area, for subsequent strikes, following the criteria of the applied method for activation timing. In Figure 9, the lightning warning case on 8 June 2022 is presented. The electric field measured at the Chuong My station began to vary significantly between 13:30 and nearly 18:00. The SG device issued a Caution alert at 13:41:32, at which time the field had not yet reached the warning threshold. This indicates that the thunderstorm cloud had not yet moved into or developed within the Alarm Area to generate lightning. Subsequently, the electric field became more negative and approached the warning threshold; this decrease in the electric field compared to normal values is due to the approach of charged clouds [4,10,21,26]. The electric field crossed the threshold (≤−1000 V/m) at 13:48:36, triggering the lightning alert, and at 13:49:53 the Warning state (16 km) was activated. By 14:09:33, lightning was detected by the SG device within the Alarm Area (AOC), indicating that the warning was correct, with a lead time of 00:21:59. Furthermore, VNHMA data also confirmed lightning activity within the Alarm Area, along with significant hourly rainfall at Ha Dong station (4.3 mm and 2.4 mm) during the period from 14:00 to 16:00.
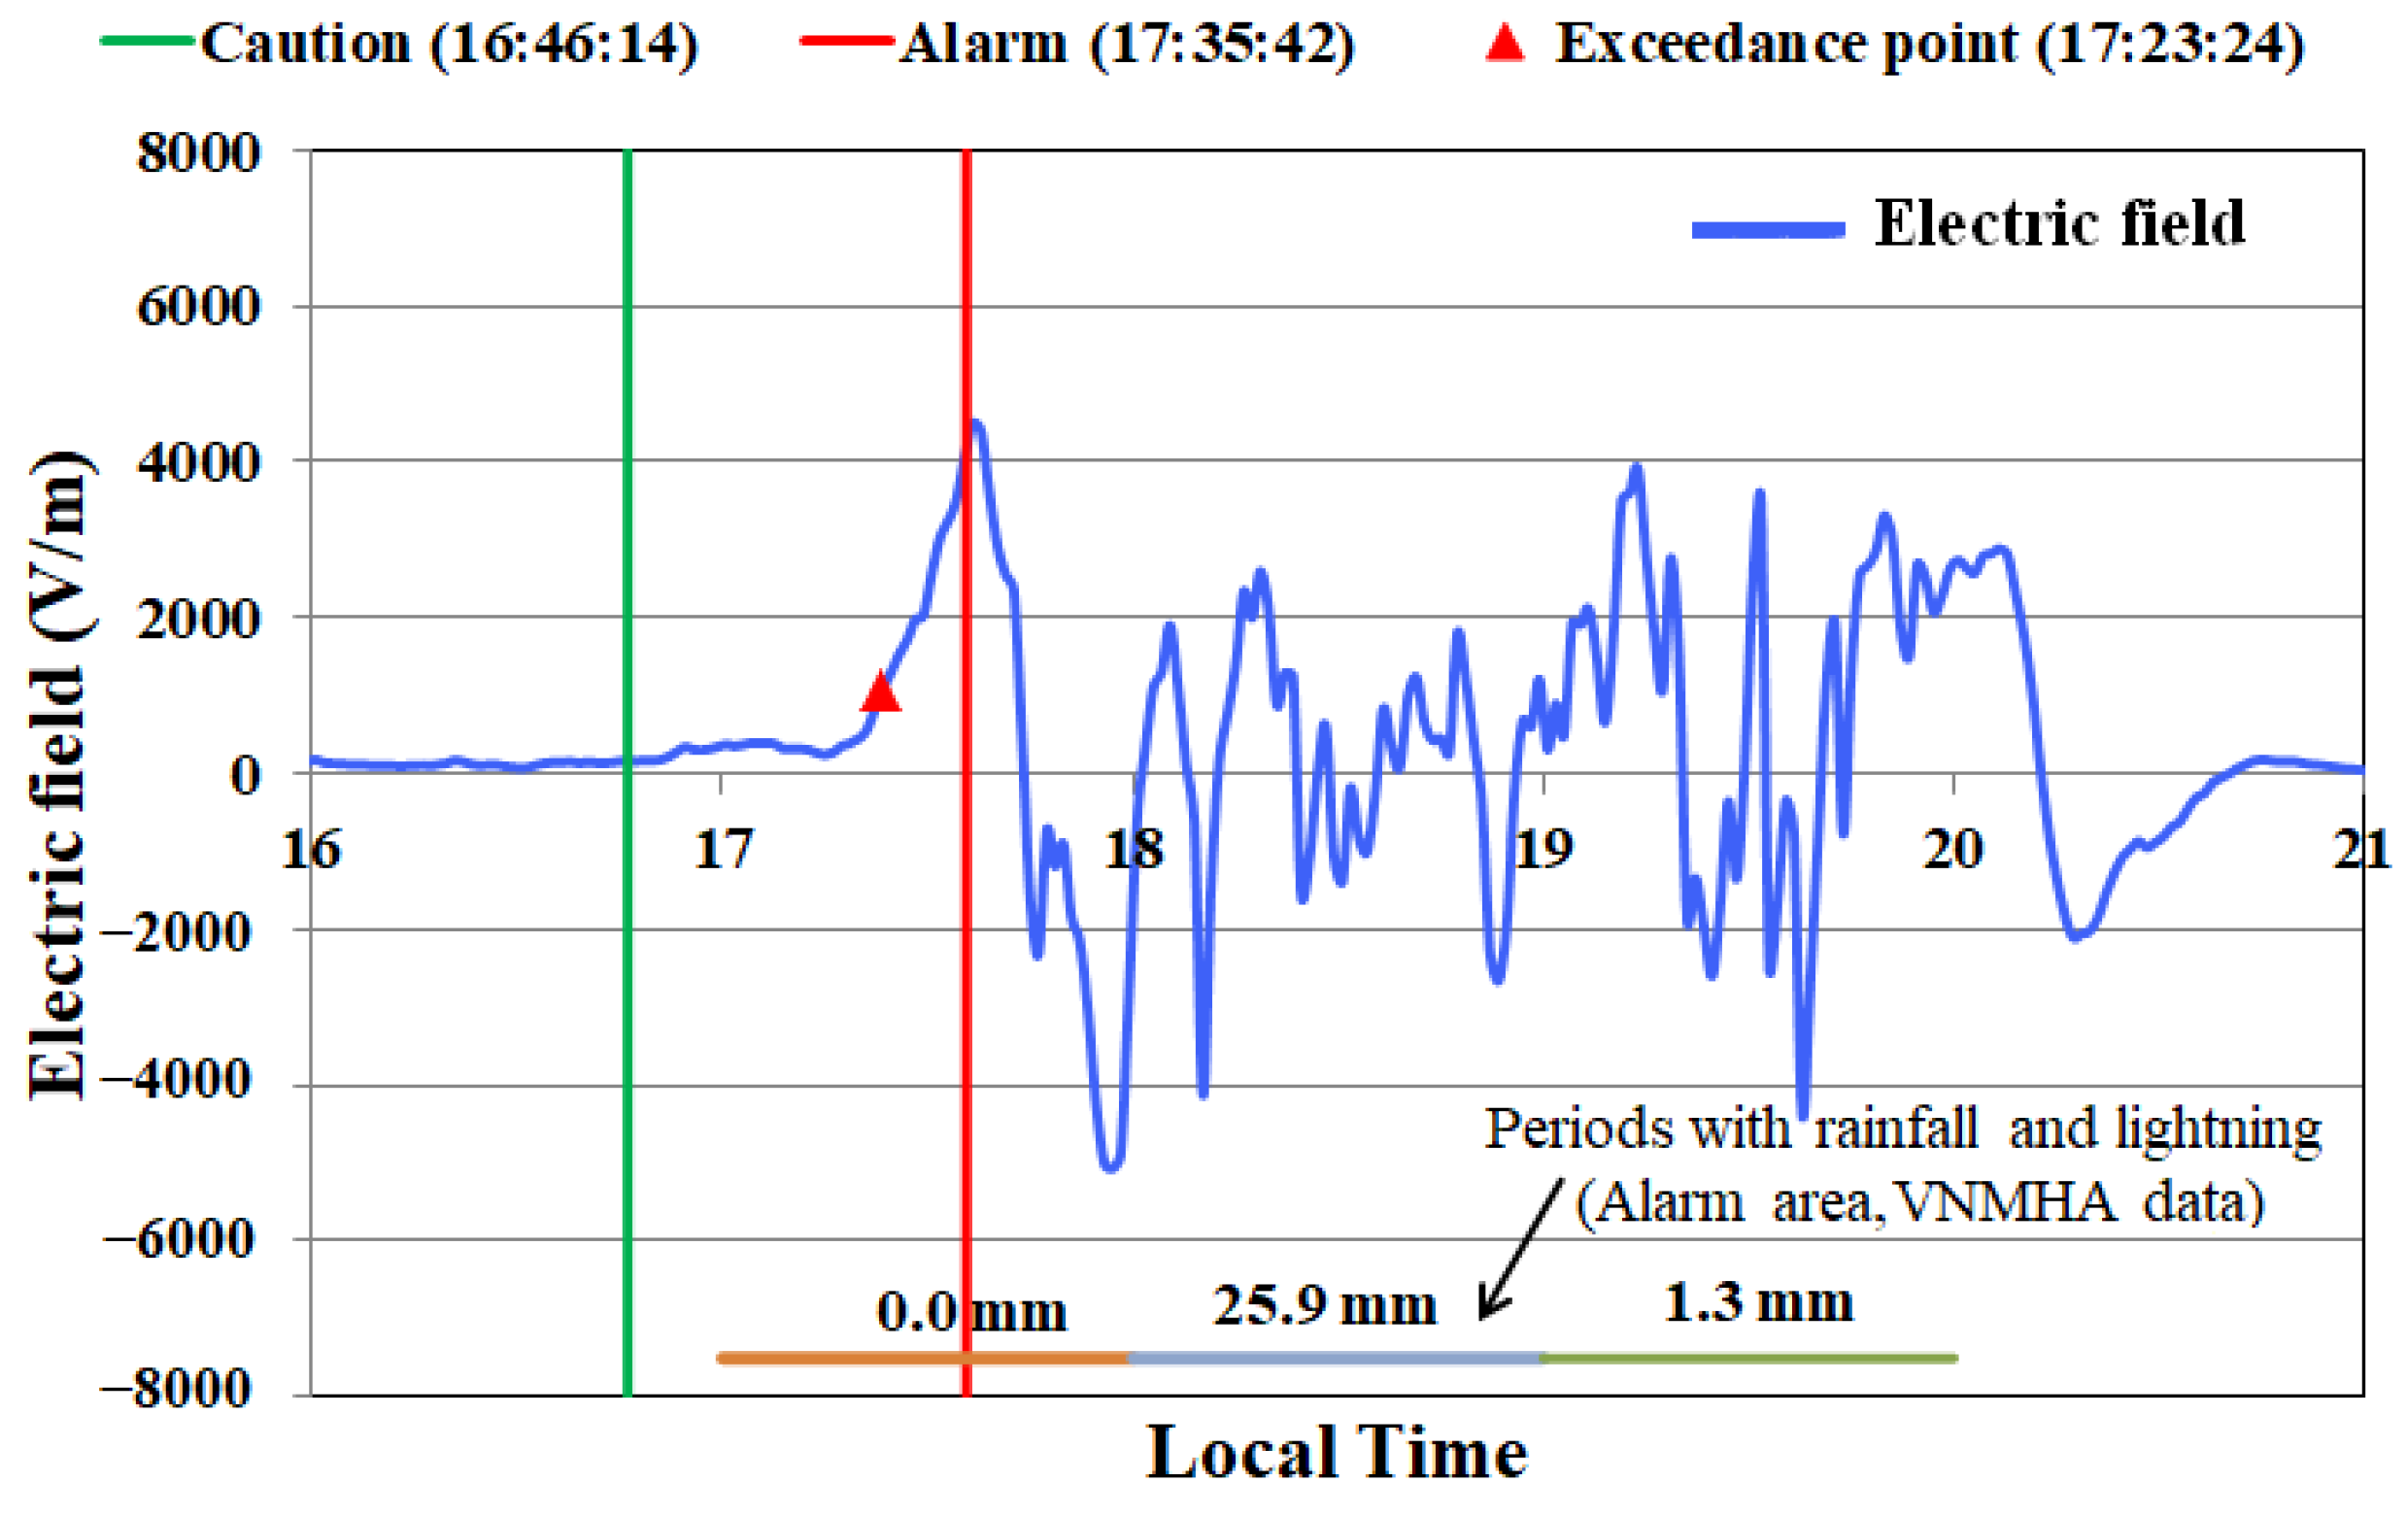
Figure 10 illustrates the lightning warning case on 30 July 2022. In this event, the Caution state was issued at 16:46:14, more than 30 min before the electric field exceeded the threshold, and the lightning alert was activated at 17:23:24. After the alert activation, the Warning state did not appear, while the Alarm state was recorded at 17:35:42. Therefore, the lightning warning in this case was correct, with a lead time of 00:12:18. Prior to lightning occurrence within the Alarm Area, the electric field became more positive, and rainfall was not yet significant, indicating that the main thundercloud had not moved close to the station and carried more positive charges [4,10]. According to VNHMA lightning detection data, lightning activity was observed in the period from 17:00 to 20:00.
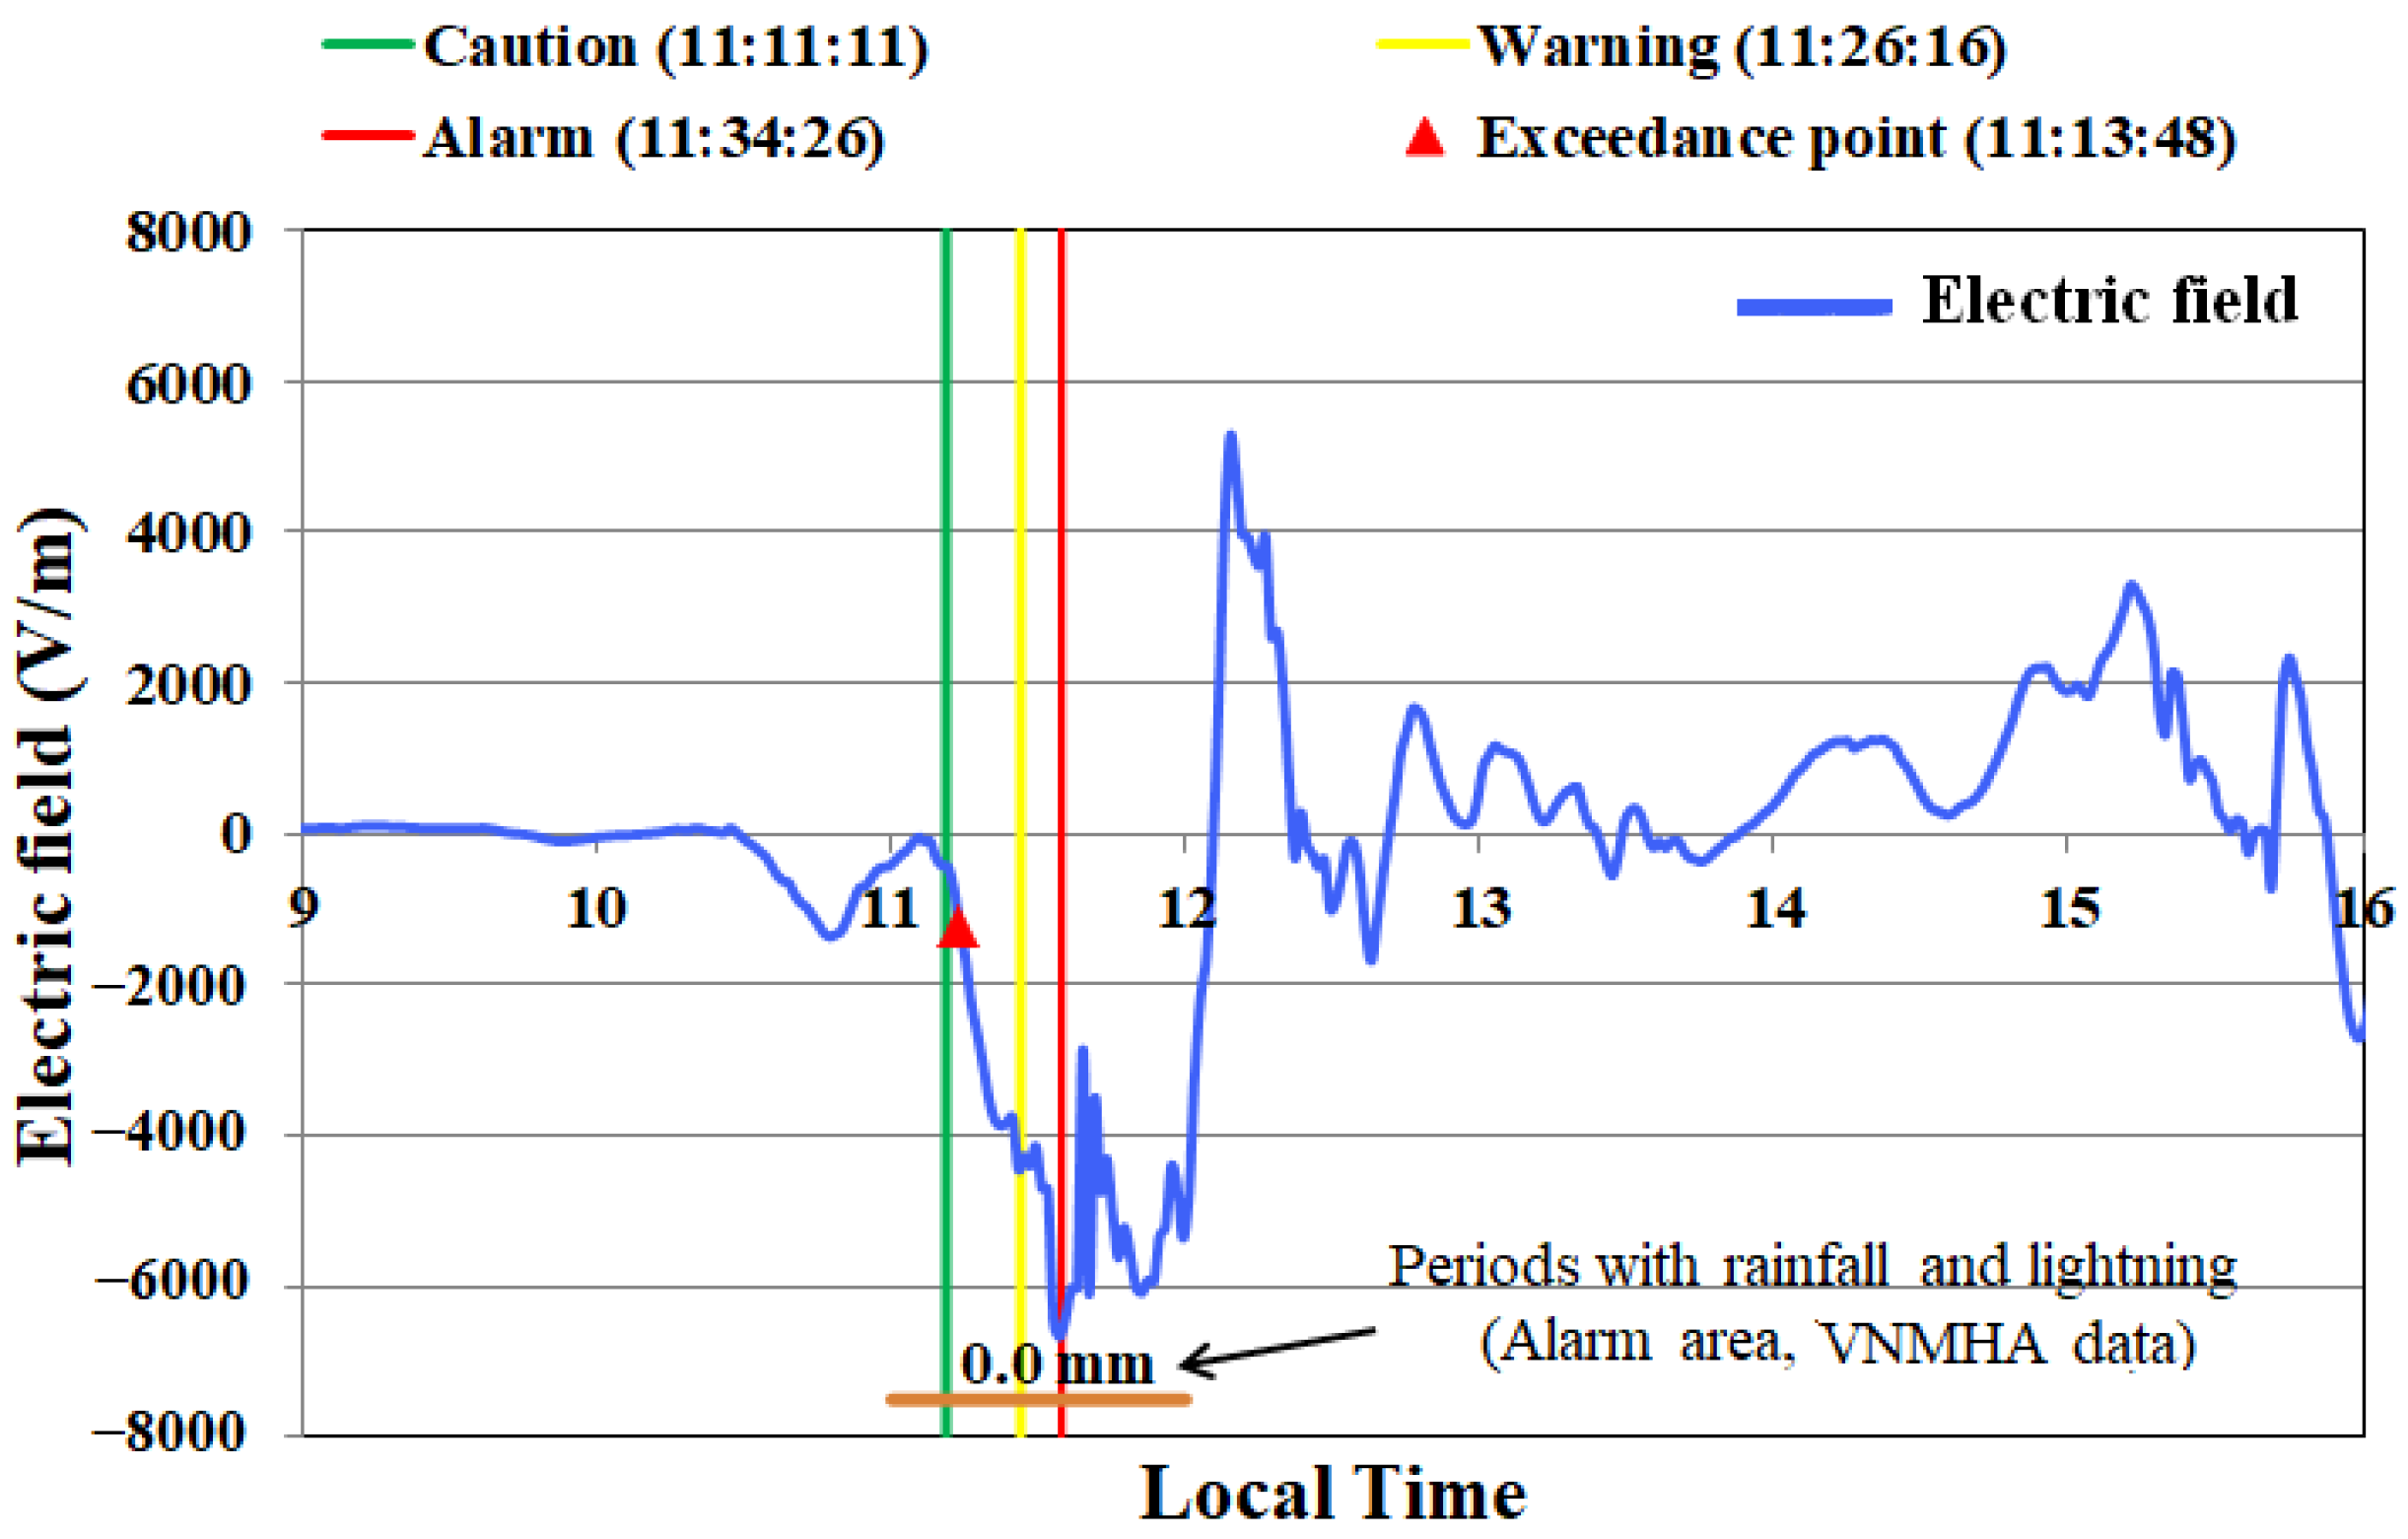
Figure 11 shows the variation in the electric field and SG alert states on 23 August 2022 at Chuong My, Hanoi. In this case, the electric field reached the threshold for triggering a lightning alert at 10:43:49. However, since the SG device had not yet reported a Caution or Warning state prior to this time, according to the applied alert method, the alert was not activated. At 11:11:11, the SG device triggered the Caution state, and the lightning alert was then activated. The lightning strike within the alert area was detected at 11:34:26, resulting in a lead time of 00:23:15 from the Caution state to the Alarm state. The electric field measured subsequently showed an increasing trend due to the dissipation of charge following the lightning discharge. Between 11:00 and 12:00, lightning was also detected within the alarm area, with negligible rainfall recorded by VNHMA.
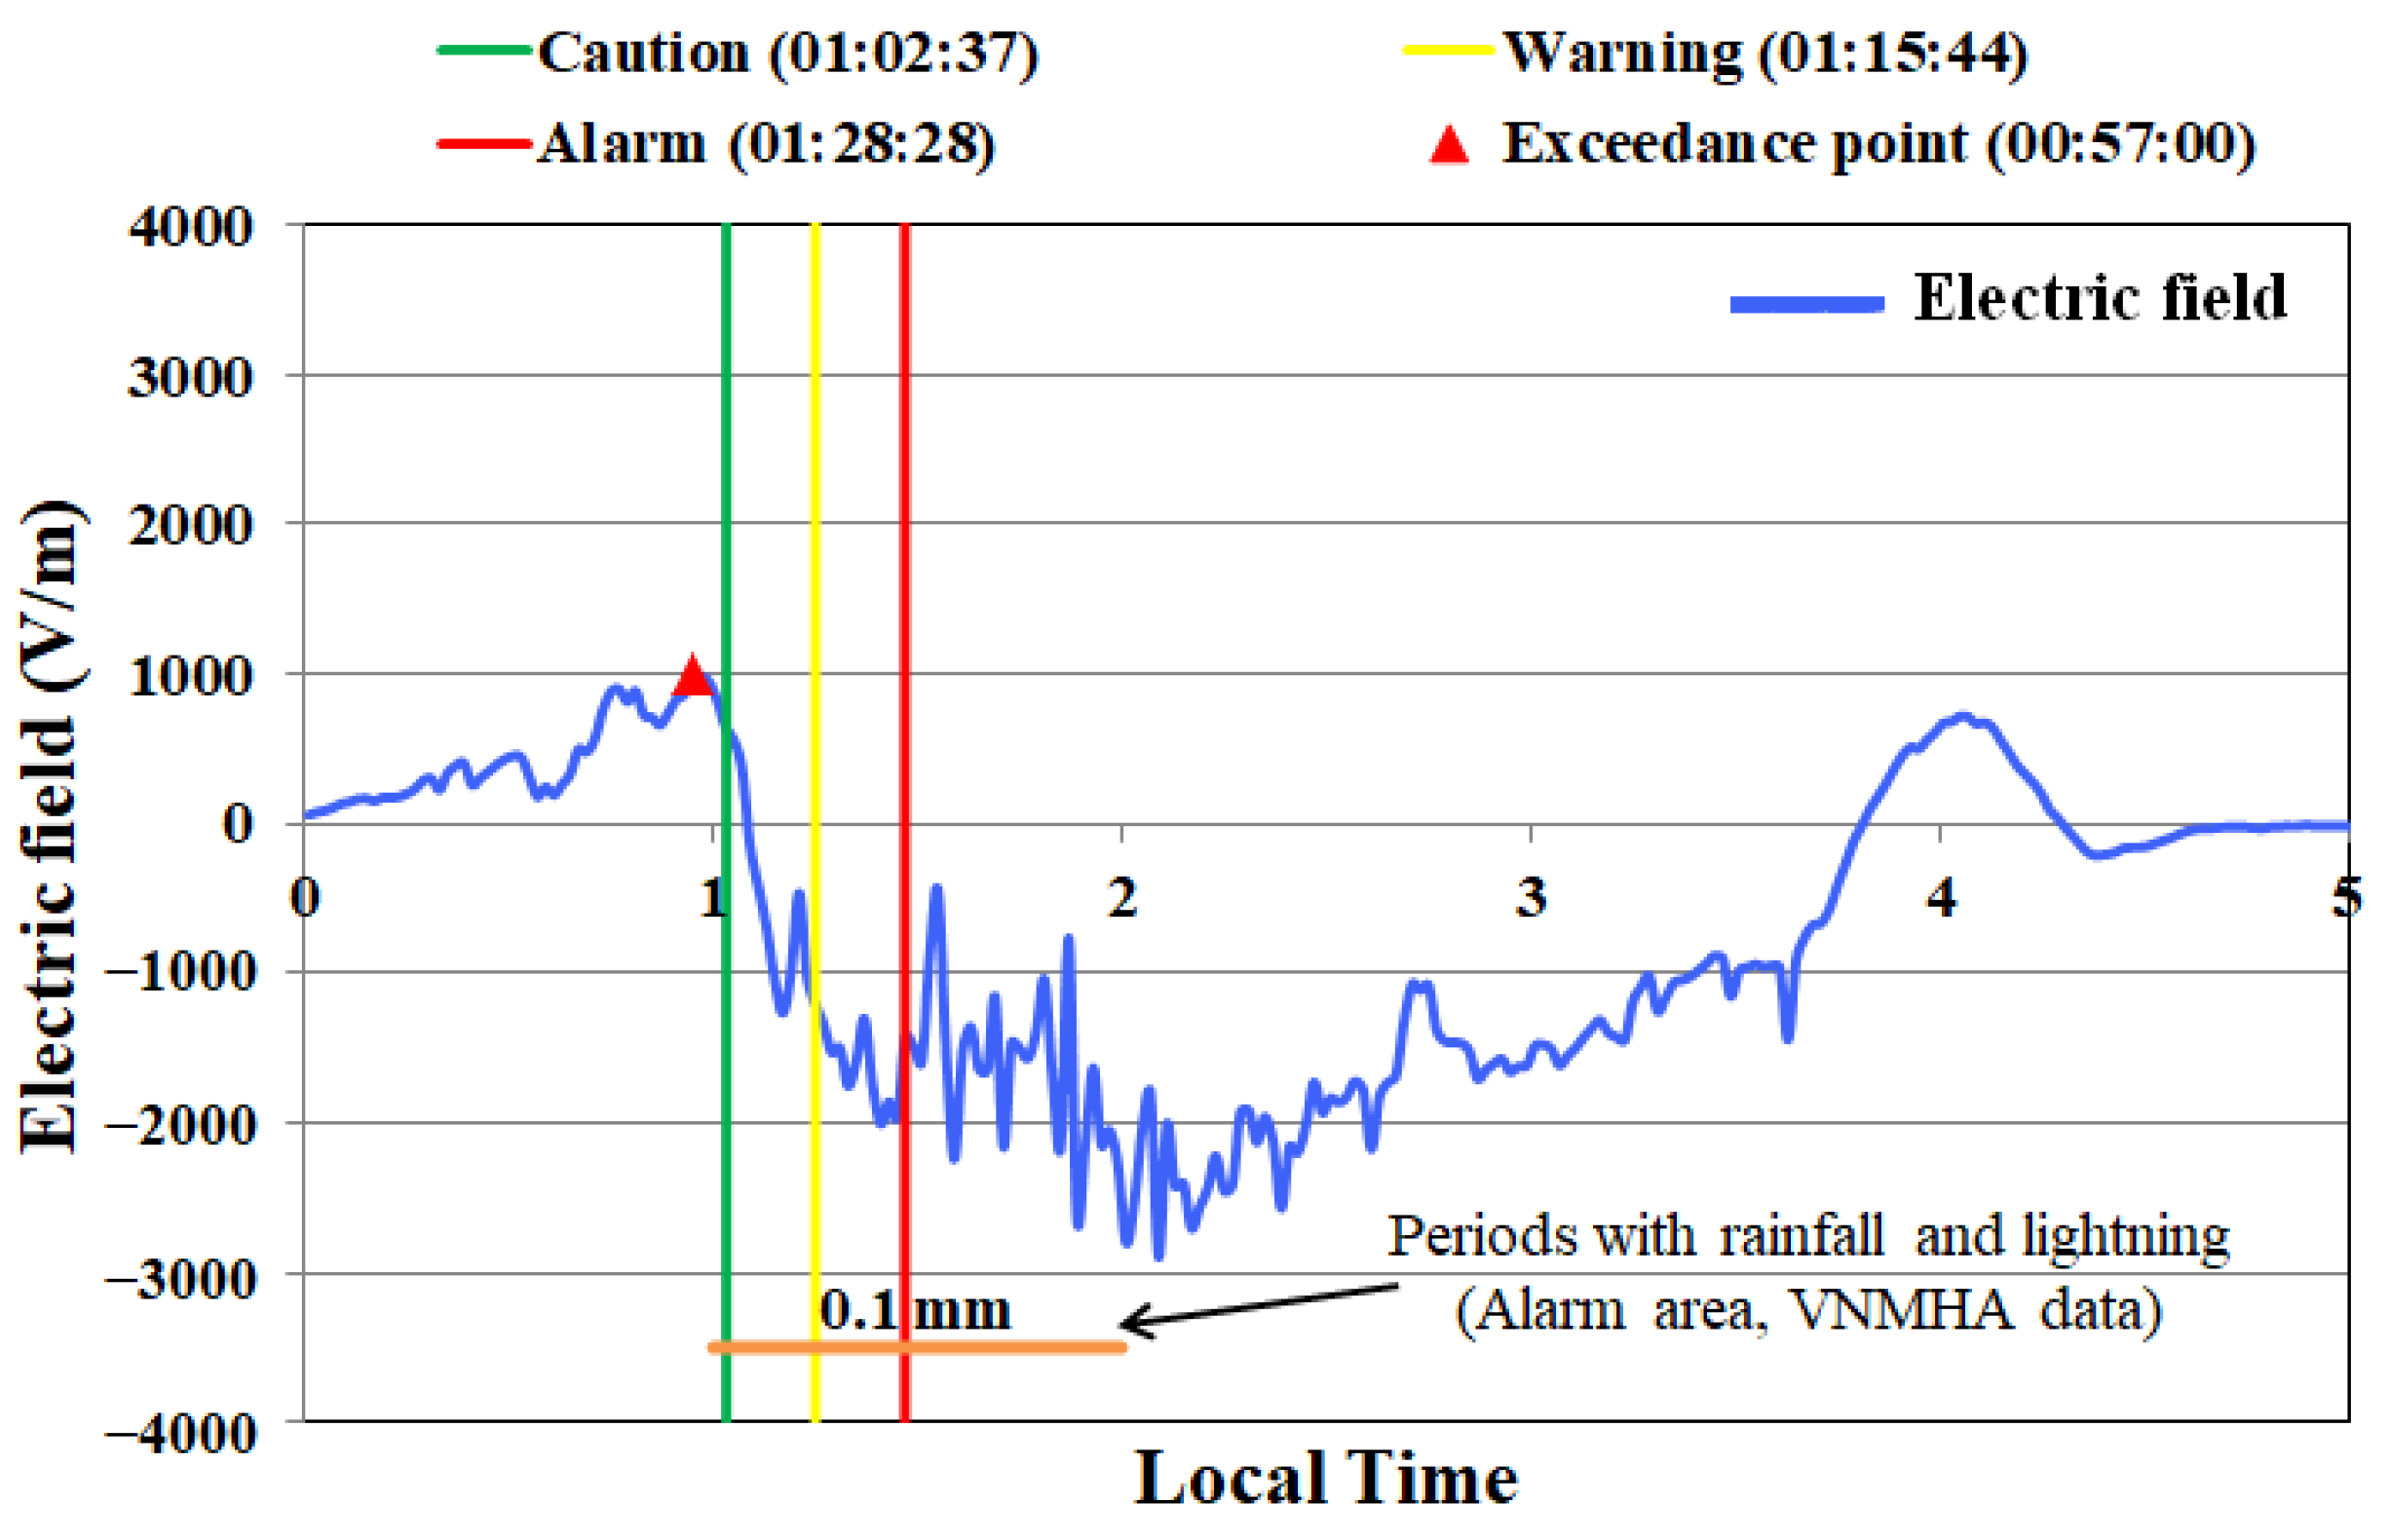
Figure 12 presents the case of lightning alert on 18 June 2023. In this event, VNHMA data indicated the occurrence of lightning and recorded measurable rainfall at Ha Dong station (0.1 mm). The electric field varied from 1000 V/m to over −3000 V/m, suggesting that this thunderstorm exhibited weaker lightning activity compared to the previous analyzed cases. The electric field reached the alert threshold at 00:57:00. Similarly to the previous case (Figure 11), the SG device triggered the Caution state slightly later at 01:02:37, which was used to activate the lightning alert. The Warning state occurred at 01:15:44, and the Alarm state at 01:28:28, resulting in a lead time of 00:25:51. The subsequent electric field decreased as the cloud charge changed during the lightning activity.
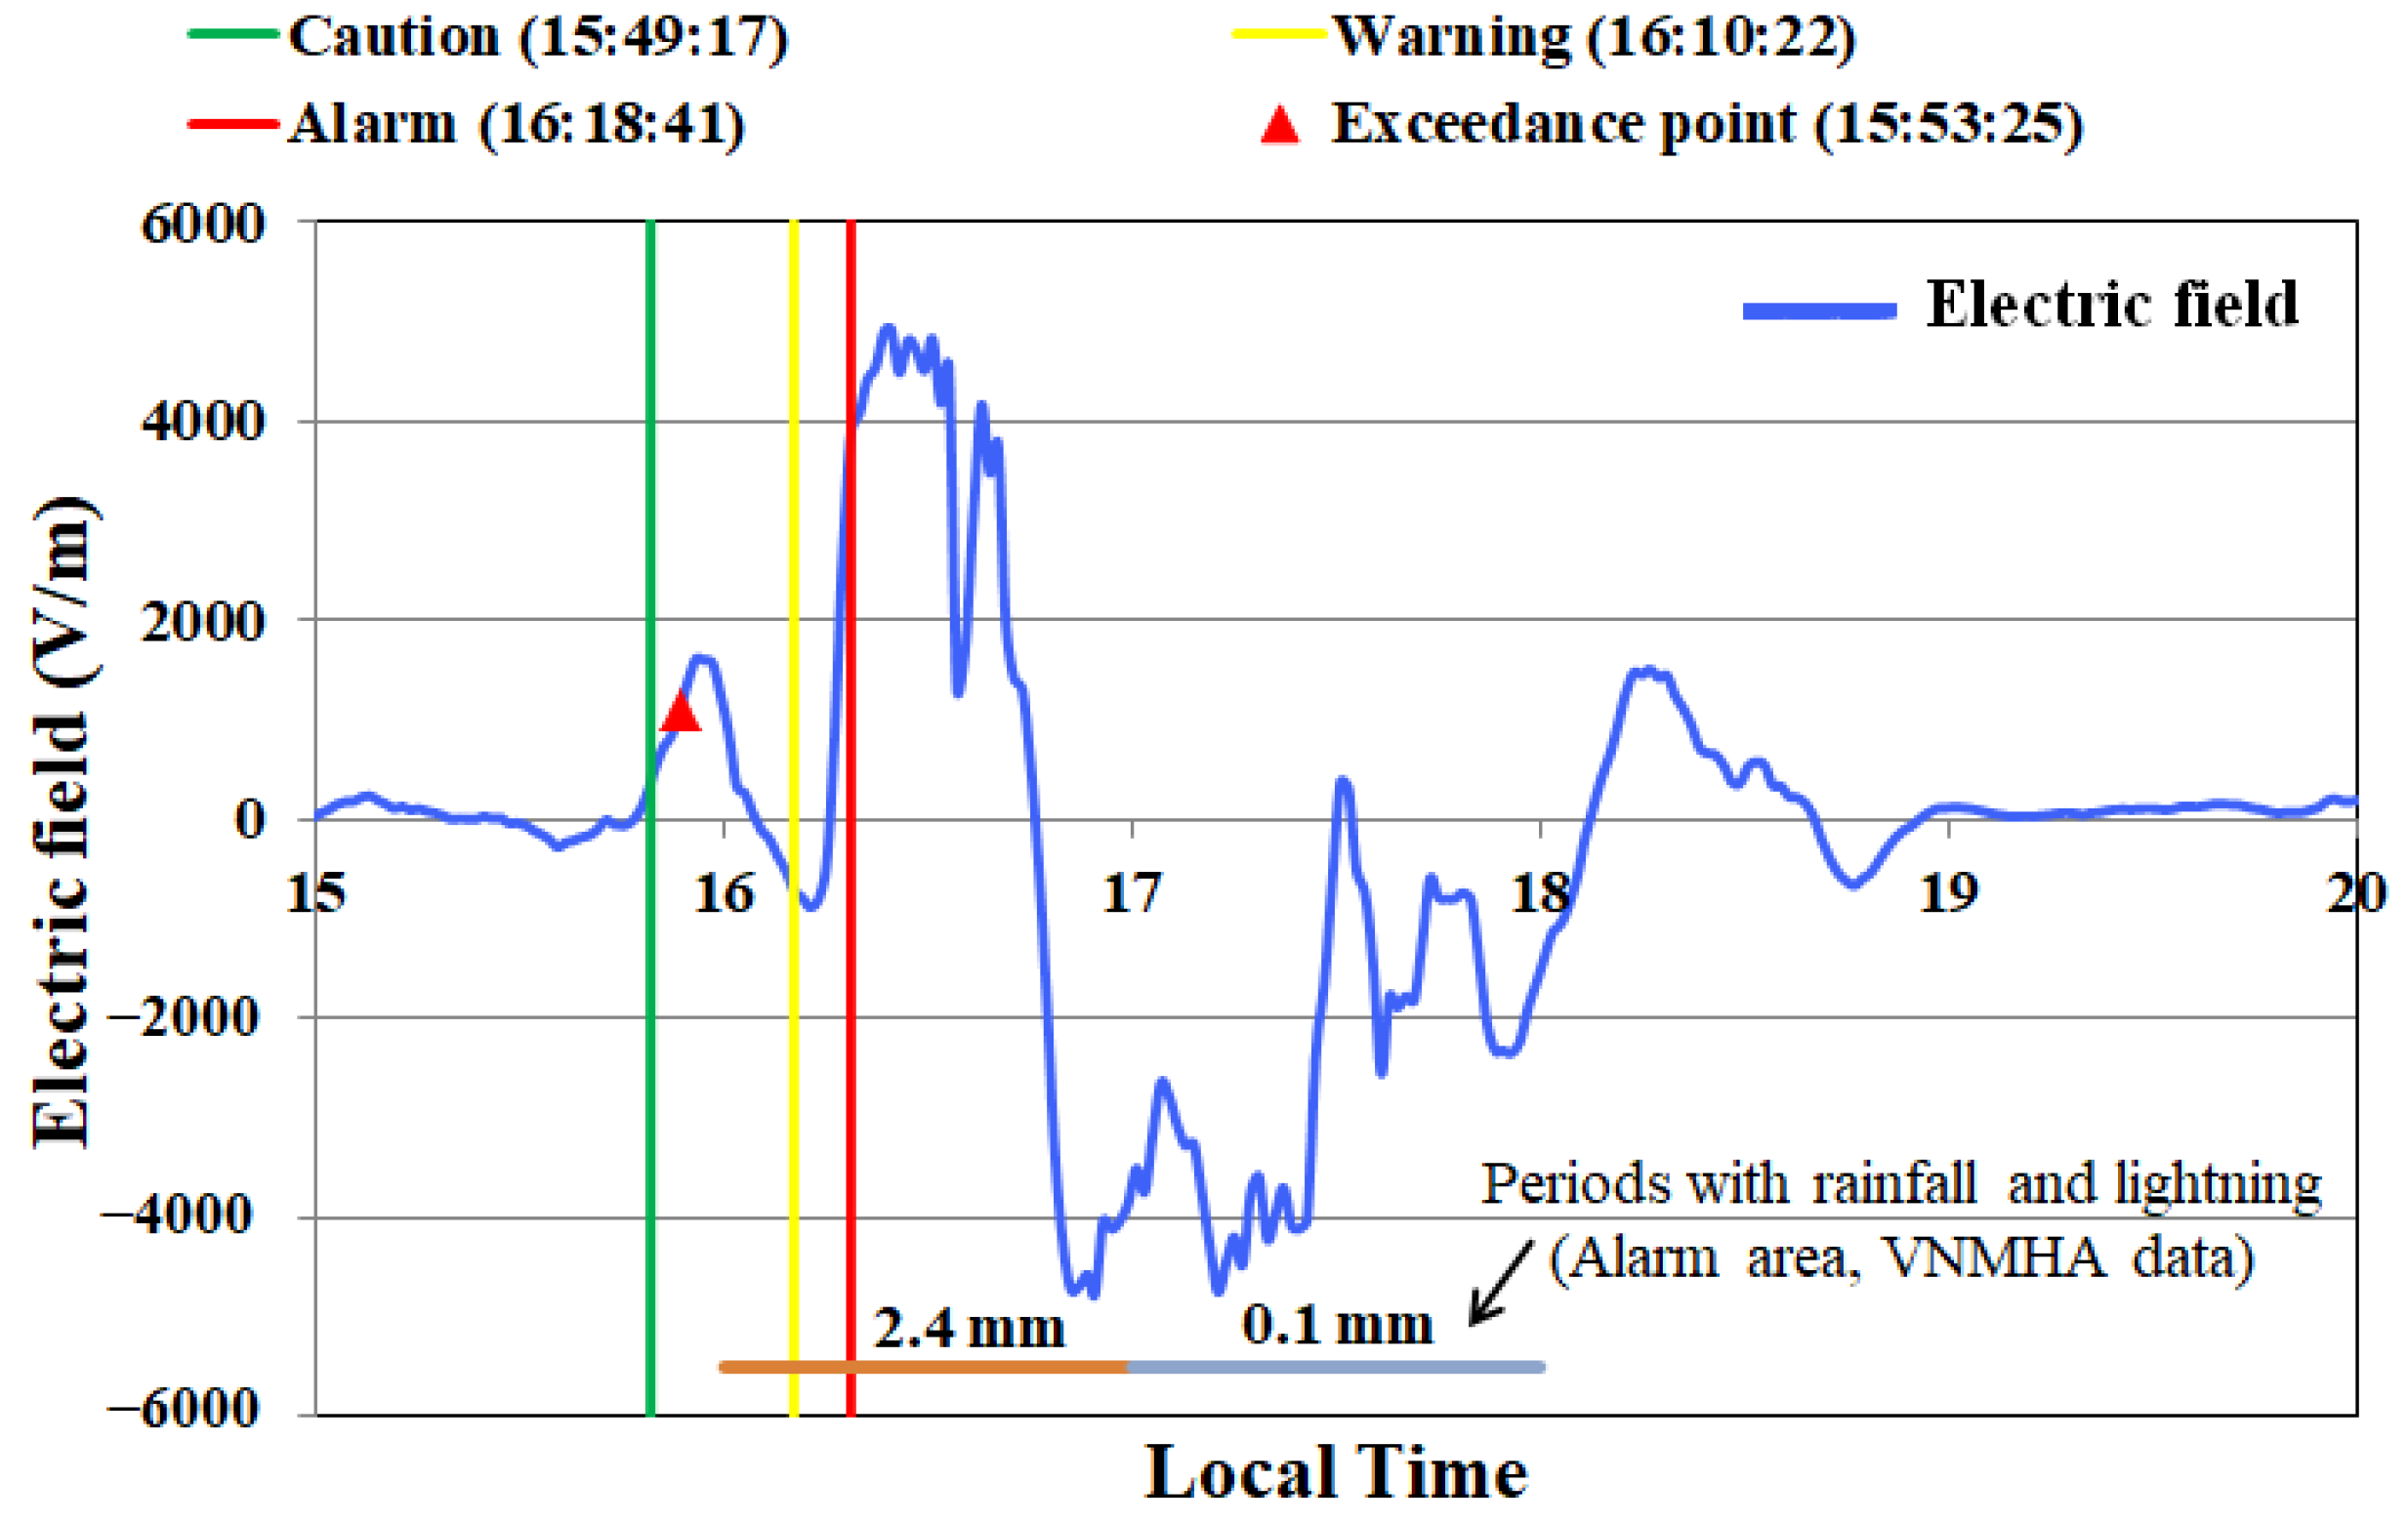
Figure 13 illustrates the thunderstorm event on 5 July 2023, which was relatively strong, as indicated by the large electric field fluctuations ranging from approximately +5000 V/m to −5000 V/m. Rainfall recorded at Ha Dong meteorological station between 16:00 and 17:00 was 2.4 mm, and the VNHMA lightning detection network also recorded lightning in the Alarm Area (around the EFM-100C station, 8 km radius) during this period. From the figure, the lightning warning was triggered at 15:53:25, occurring about 4 min after the Caution state was activated, followed by the Warning state at 16:10:22 and the Alarm state at 16:18:41. The first lightning strike within the area of concern was detected at 00:25:16 before the Alarm state. The electric field returned to normal after 19:00. Outside the period from 16:00 to 17:00, rainfall was minimal (0.1 mm) or absent. These observations demonstrate the consistency between the different data sources and indicate the accuracy of the lightning warning method developed in this study.
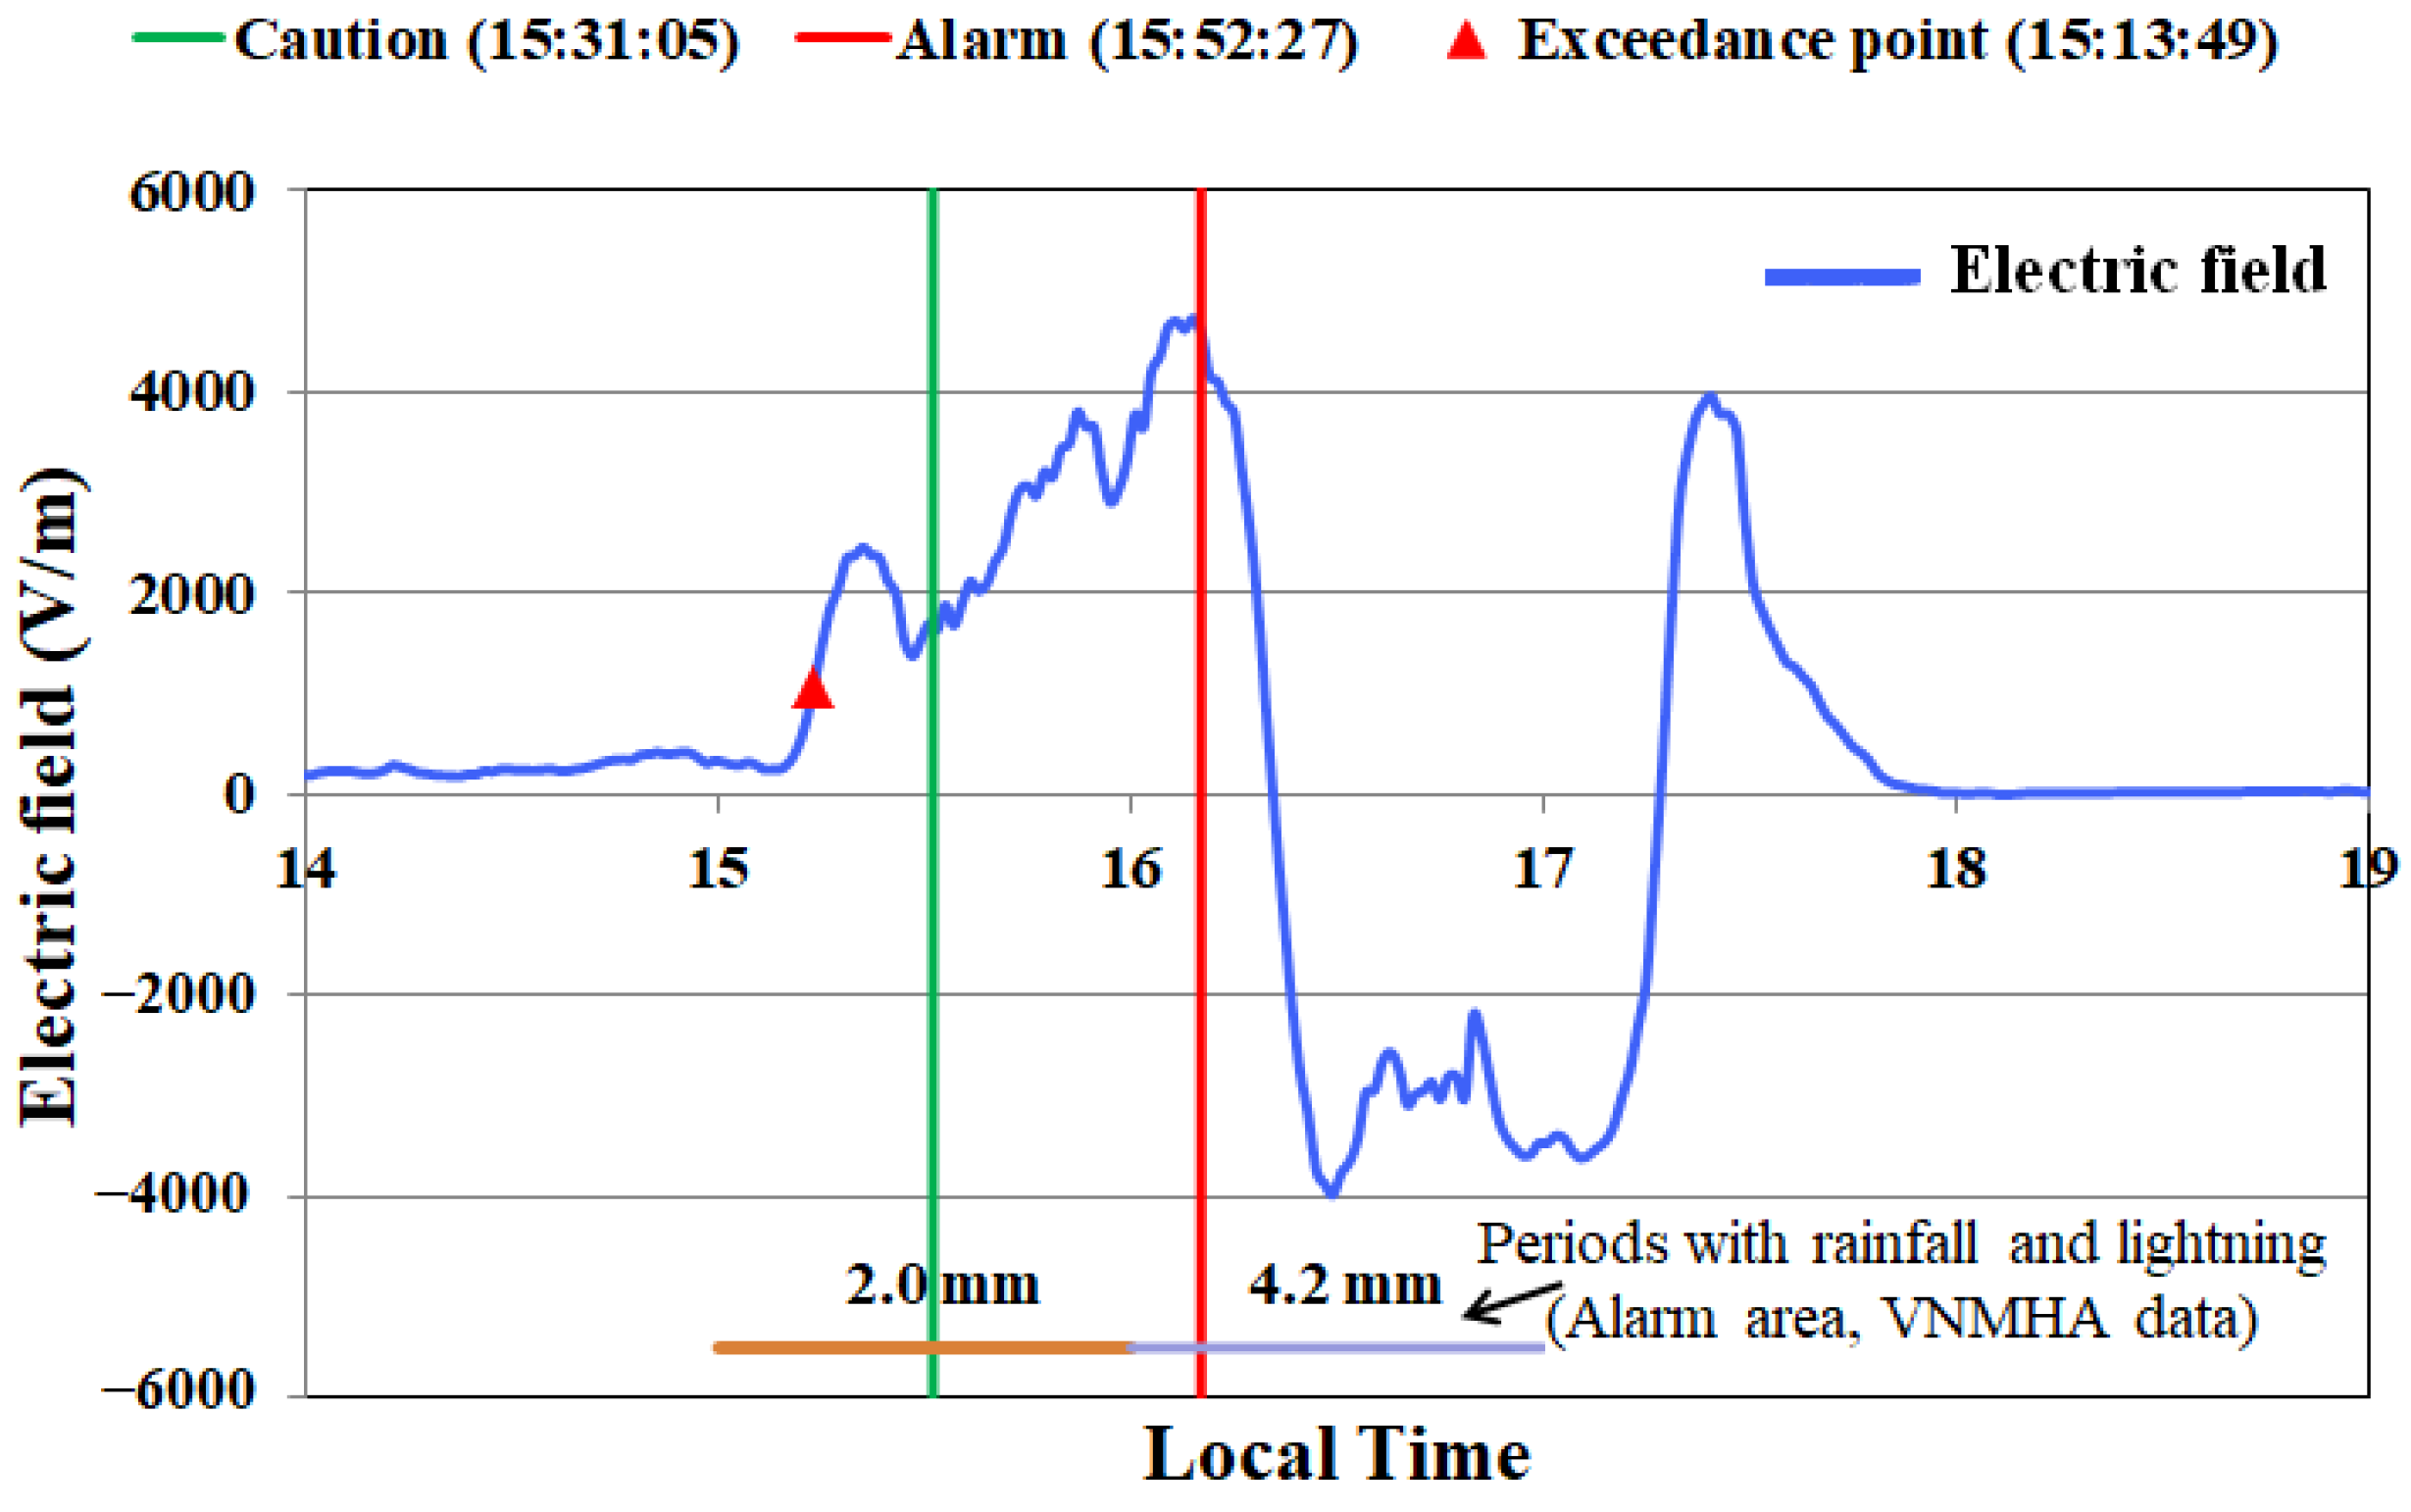
Figure 14 presents another case showing an electric field trend with a more positive tendency before lightning occurred in the Alarm Area. The SG device triggered only two states (Caution and Alarm). The electric field exceeded the threshold prior to the Caution state activation at 15:31:05, and the lightning was detected in the Alarm state at 15:52:27. The lead time of the lightning warning in this case was 00:22:21. After this point, the electric field gradually shifted toward negative values. During the periods from 15:00 to 16:00 and from 16:00 to 17:00, rainfall measured 2.0 mm and 4.2 mm, respectively, and lightning was detected within the 8 km Alarm Area around the Chuong My station.
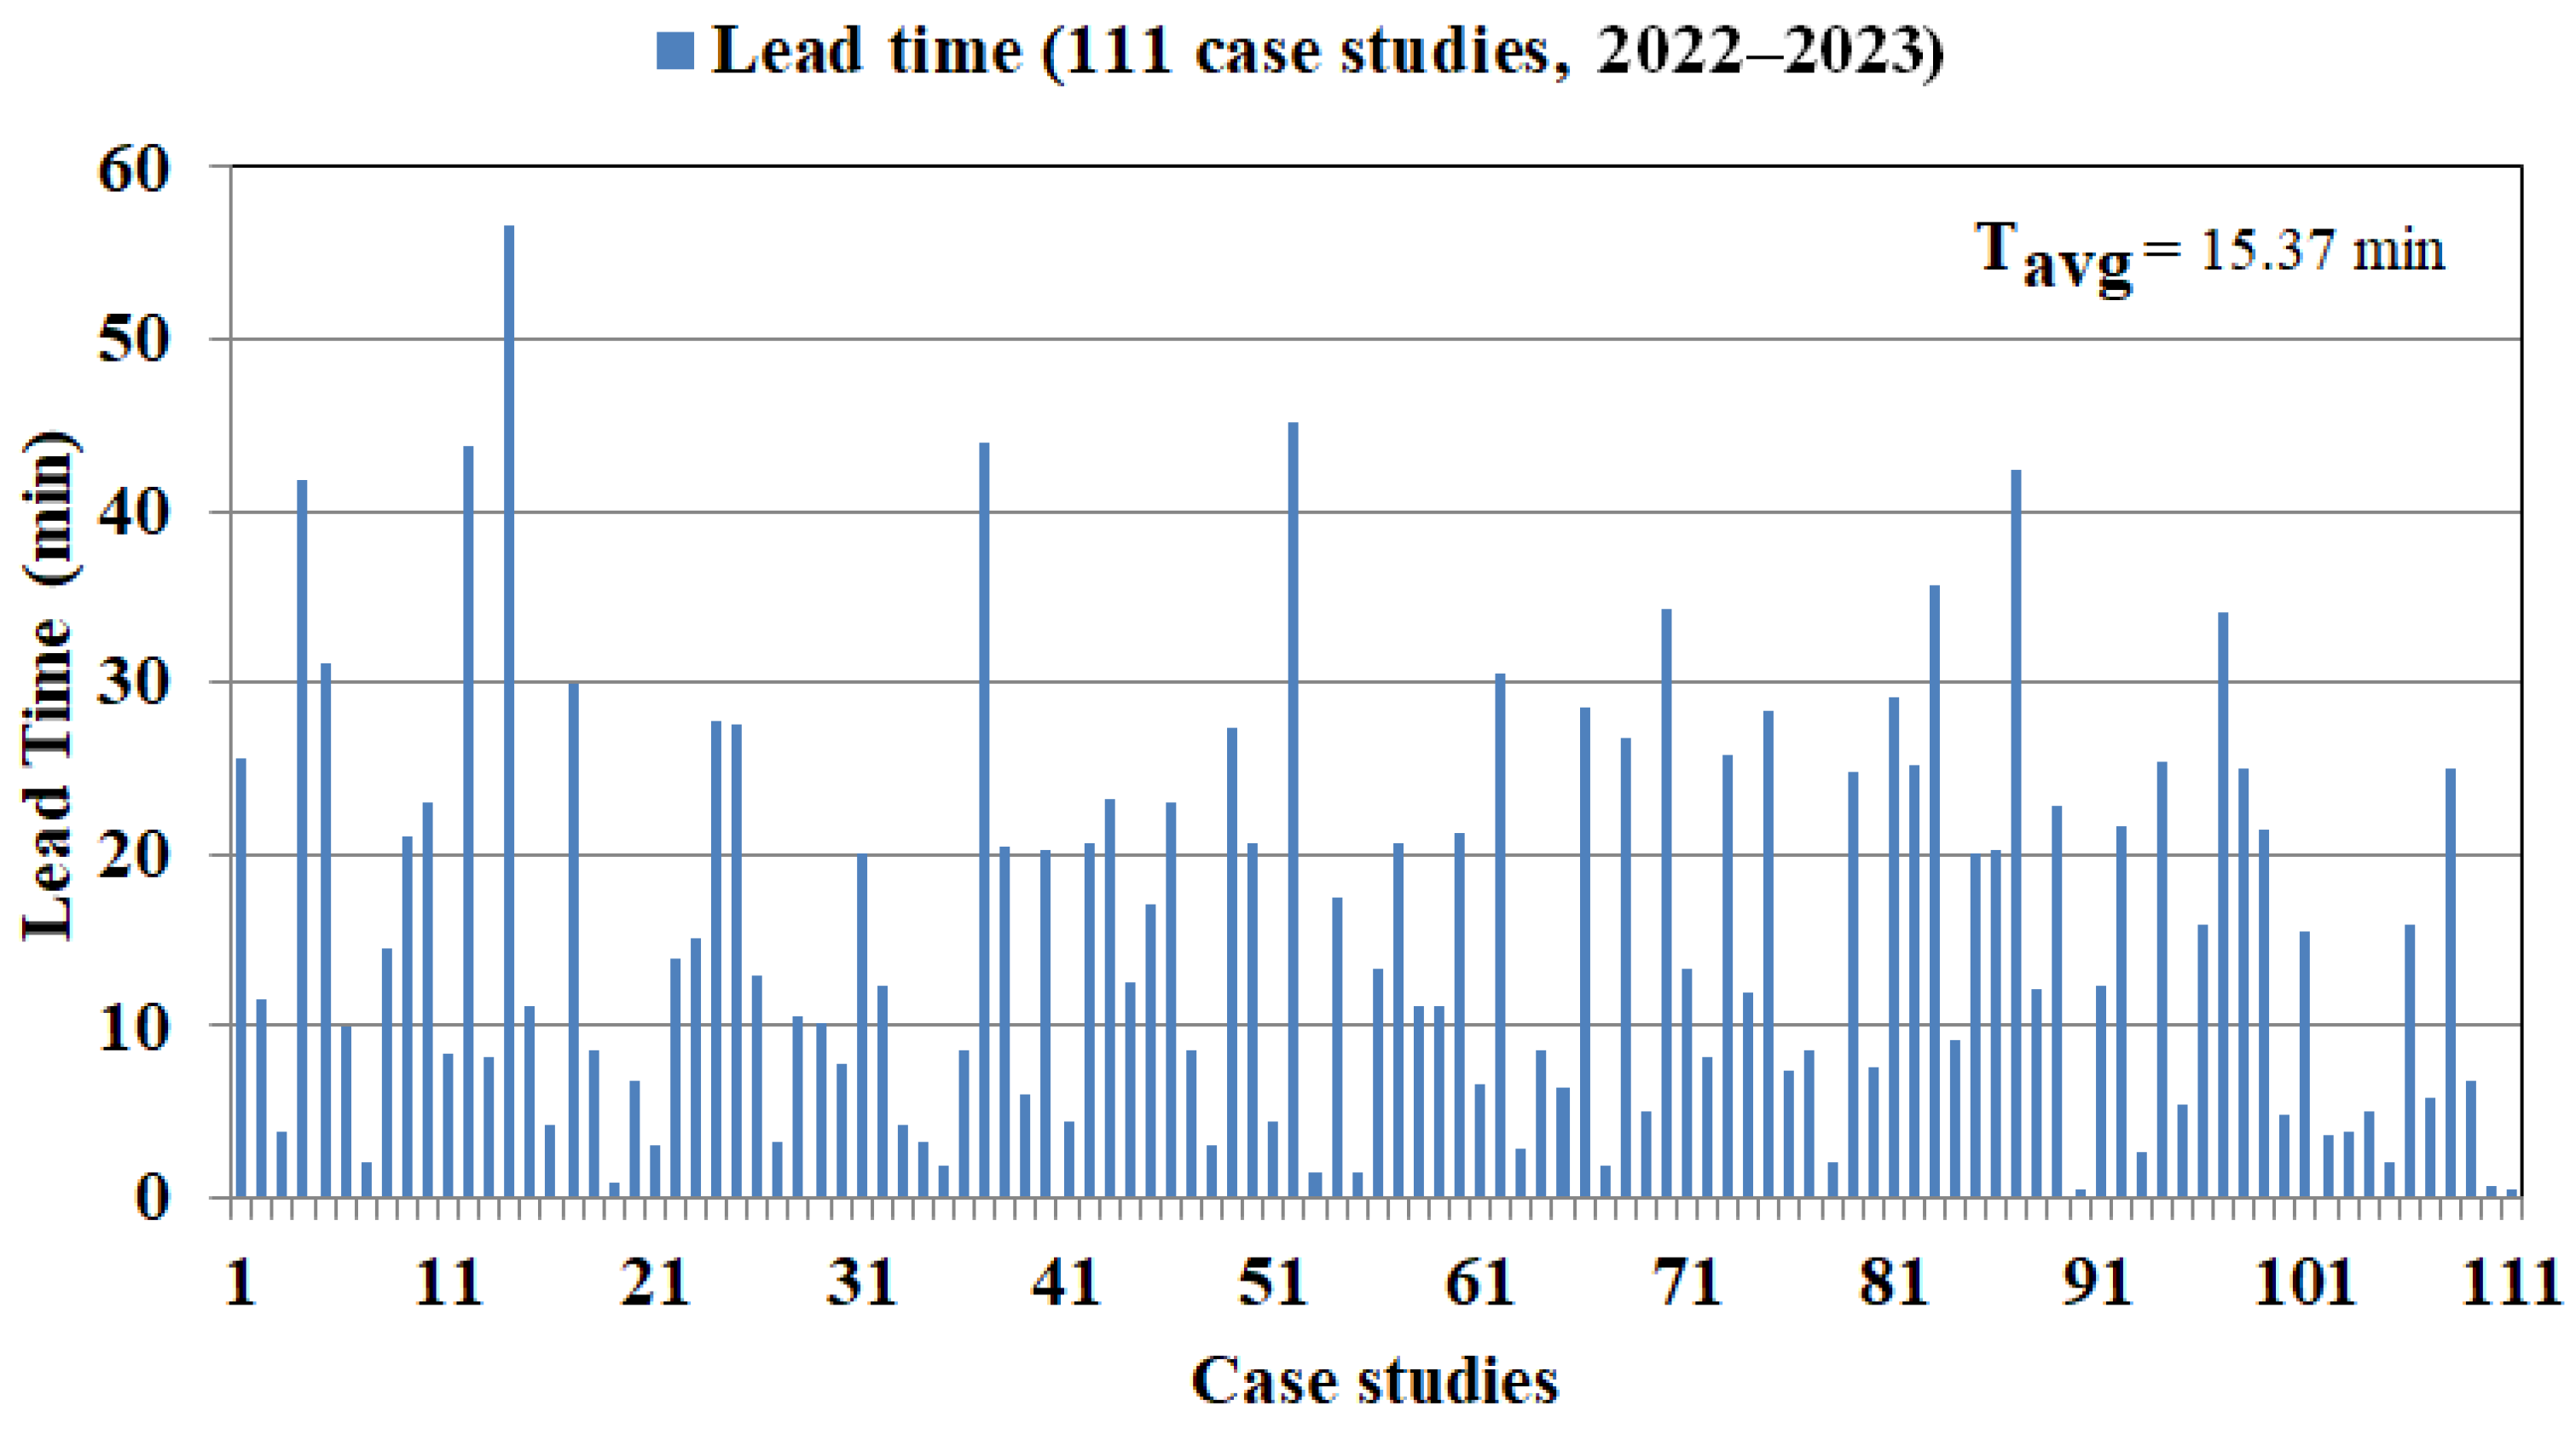
Based on a dataset of 145 cases from the years 2022 and 2023, we conducted lightning warning analyses and identified 111 correctly predicted cases, as presented in Figure 15. From this figure, it can be seen that the lead time of lightning warnings varied from nearly one minute to almost 60 min, with an average of 15.37 min. The evaluation results of the lightning warning method for the Chuong My–Hanoi area, using both the electric field data (EFM-100C) and the near-real-time Strike Guard system, are shown in Figure 16. For the analysis of 145 cases, the results indicate a Probability of Detection (POD) of 82.22%, a Critical Success Index (CSI) of 76.55%, False Alarm Ratio (FAR) of 8.26%, a Pre (Precision) of 91.74 and an F1 score of 86.72% These results are consistent with previous studies in the field of lightning warning research, as reported in several works [28,29,31,32,33,34,35,36], an F1 score of nearly 90% indicates that the warning method is highly effective. Specifically, in study [29], the results showed LT = 20.8 min, POD = 82.7%, FAR = 14.6%, and CSI = 72%, which are quite consistent with the results of our study. However, the method developed by the authors for their study area required very high equipment and operational costs, as the research team used two radars and four electric field meters. In study [33], lightning location data and satellite data were used for very short-term lightning activity forecasting, yielding a POD of nearly 80%, similar to our results; however, the FAR index of about 40% was significantly higher, and the equipment and operational costs were also very high. In study [28], an LWS device similar to the one used in this study and an ANN-based method were applied for lightning warning, achieving a correct lightning warning rate of up to 93.9% for a lead time of 2 min. Nevertheless, the LWS system had an excessively large amplification antenna (two copper plates with a diameter of 1 m), which would be disadvantageous for product commercialization and device operation.

4. Summary and Discussion

This study analyzed lightning activity and evaluated the performance of a near-real-time lightning warning system for the inner Hanoi area, using data collected from 2020 to 2024 by the Strike Guard and EFM-100C instruments located in Chuong My, Hanoi, Vietnam. The study represents a significant advancement in understanding and operationalizing lightning monitoring and early warning in northern Vietnam, specifically in the Chuong My–Hanoi area. A major strength of this work lies in the integration of near-real-time lightning data from two complementary instruments, the Strike Guard (SG) and EFM-100C, which together enable both monitoring and timely warning of thunderstorms within the inner Hanoi region.
The five-year dataset (2020–2024) from the SG system provides an extensive and continuous record of lightning activity, capturing clear diurnal, monthly, and interannual variations. The study demonstrates that the SG data correlate well with the operational VNMHA lightning location network (R = 0.74), confirming that the device provides reliable and robust measurements suitable for both climatological studies and operational warning applications. The electric field measurements from the EFM-100C also exhibited stable fair-weather values (mean ≈ 66.25 V/m) with minimal noise interference, validating the station’s capability to measure local atmospheric electricity accurately. Together, these results indicate that the Chuong My station provides high-quality, dependable data for lightning monitoring in northern Vietnam.
The empirical lightning warning method developed in this study, which combines electric field measurements from EFM-100C with SG Caution and Warning states, demonstrates both timeliness and accuracy. Analysis of 145 thunderstorm events during 2022–2023 reveals an average lead time of approximately 15 min, with some warnings extending up to nearly 60 min. The statistical performance of the system is notable: POD of 82.22%, CSI of 76.55%, F1 score of 86.72%, and a remarkably low FAR of 8.26%. These metrics indicate that the combined approach successfully balances high detection rates with minimal false alarms, outperforming or matching similar studies in other regions, often with significantly higher operational costs. This highlights the practical feasibility of the system for real-time lightning warning in an urban setting with critical infrastructure.
The study effectively demonstrates the advantages of integrating multiple observational modalities. The EFM-100C captures the initial charge buildup in thunderclouds, serving as an early indicator of potential lightning activity, while the SG system provides confirmation and spatial localization of actual strikes. This dual approach enhances both accuracy and lead time, especially in regions with complex topography and limited radar coverage. The clear case studies presented in the paper show consistent performance across different thunderstorm intensities and patterns, highlighting the robustness of the system under diverse meteorological conditions.
Another positive outcome is the operational simplicity and cost-effectiveness of the proposed system. Unlike radar- or satellite-based warning systems, which require extensive infrastructure and high operational costs, the combined SG–EFM system is compact, scalable, and suitable for deployment in developing regions. The use of physically interpretable thresholds (±1000 V/m for EFM-100C) grounded in atmospheric physics ensures transparency and ease of operational adoption without sacrificing accuracy. This makes it particularly suitable for protecting critical infrastructure such as airports, industrial zones, and urban centers where timely warnings are essential for public safety.
Beyond operational applications, the study also provides valuable climatological insights. The temporal patterns of lightning activity revealed clear late-afternoon peaks, early and late summer maxima corresponding to monsoonal influences, and interannual variations influenced by broader climatic phenomena such as La Niña and anthropogenic factors (e.g., reduced aerosols during COVID-19 lockdowns). These findings reinforce and extend previous climatological studies for northern Vietnam, providing both a scientific basis for understanding regional lightning activity and practical context for designing warning systems.
The study sets a strong foundation for future work in lightning monitoring and forecasting. The demonstrated success of the combined near-real-time system encourages further deployment of similar stations across northern Vietnam to create a comprehensive, cost-effective lightning warning network. Moreover, the study provides a scalable methodology that can be adapted to other urban regions with similar environmental conditions, offering a template for improving lightning safety and disaster mitigation on a broader scale.
Although the proposed method is primarily empirical and based on deterministic threshold rules, its design emphasizes operational simplicity, transparency, and real-time applicability. This approach is particularly suitable for field deployment in regions where computational resources and large training datasets are limited. The empirical thresholds were derived from physically interpretable relationships between electric-field variations, lightning occurrence, and local meteorological conditions, ensuring that the method remains grounded in atmospheric physics rather than statistical fitting. While modern predictive modeling and machine learning approaches hold great potential to optimize lightning prediction and reduce false alarms, their implementation requires extensive, high-quality datasets and more complex computational infrastructure. Therefore, such advanced techniques will be considered in future work, as more long-term and comprehensive datasets become available to support model training and validation.
Future work should also extend this analysis by incorporating longer datasets, additional observation sites, Unmanned Aerial Vehicle (UAV)-based atmospheric measurements, which can provide real-time lower-atmosphere profiles using sensor-equipped unmanned aerial platforms [55], and numerical weather prediction outputs to further improve lightning forecasting capabilities. In particular, integrating satellite-derived convection indices, radar reflectivity, and atmospheric instability parameters could enhance spatial coverage and extend predictive lead times. Continued deployment of combined electric-field and optical–electromagnetic detection systems across northern Vietnam will contribute to a more comprehensive lightning monitoring network, supporting disaster prevention and early-warning operations nationwide.

Author Contributions

Conceptualization, H.H.S., N.X.A., P.X.T., P.L.K. and H.V.N.; methodology, H.H.S., N.X.A., T.H.T., P.X.T., P.L.K. and H.V.N.; validation, N.X.A., P.L.K. and H.V.N.; formal analysis, H.H.S. and N.X.A.; investigation, H.V.N., N.X.A. and T.D.D.; resources, H.H.S., P.L.K., D.N.T. and B.N.M.; data curation, H.H.S., P.L.K., T.D.D., D.N.T., B.N.M., N.N.V., D.Q.V., H.M.K. and D.D.Q.; writing—original draft preparation, H.H.S., P.X.T., P.L.K. and H.V.N.; writing—review and editing, H.H.S., N.X.A., P.X.T., T.H.T., P.L.K. and H.V.N.; visualization, H.H.S., P.L.K., D.N.T., B.N.M., D.Q.V. and N.N.V.; supervision, N.X.A., P.X.T., P.L.K. and H.V.N.; project administration, H.H.S., N.X.A., H.V.N. All authors have read and agreed to the published version of the manuscript.

Funding

This research was funded by the project titled: “Study on the evaluation of lightning warning in several areas of Hanoi City”, grant number CSCL12.01/24-25. This research was also funded by some projects grant number: TĐCBSS.00/24-26, QTBY02.01/23-24 and Work No. T23BA-005 dated 22 May 2023, NCVCC12.01/25-25, and TNMT.2023.06.15.

Institutional Review Board Statement

Not applicable.

Informed Consent Statement

Not applicable.

Data Availability Statement

The original contributions presented in this study are included in the article. Further inquiries can be directed to the corresponding author.

Conflicts of Interest

The authors declare no conflicts of interest.

References

  1. Anh, N.X.; Bazelyan, E.M.; Hieu, N.T.; Loan, D.V.; Huy, L.V.; Thanh, N.T.T.; Ap, T.V.; Nhan, L.D. Investigation of thunderstorm, lightning activities in Vietnam and protective solution recommendation. In The National Project Report; Institute of Geophysics, VAST: Hanoi, Vietnam, 2005; p. 252. (In Vietnamese) [Google Scholar]
  2. Anh, N.X.; Huy, L.V.; Son, H.H. Some results in thunderstorm and lightning study in Vietnam using lightning detection network. In Proceedings of the 5th Conference Geophysics Scientific, Hochiminh City, Vietnam, 25 August 2007; Science and Technics Publishing House: Hanoi, Vietnam, 2007; pp. 11–20. (In Vietnamese). [Google Scholar]
  3. Huy, L.V.; Anh, N.X.; Thanh, P.X.; Son, H.H.; Khuong, P.L.; Hop, D.T.B. Study and proposed of the lightning preventive solution in Quangnam. In The Mission Report of the Committee for Local Science and Technology; Institute of Geophysics, VAST: Hanoi, Vietnam, 2013; p. 188. (In Vietnamese) [Google Scholar]
  4. Duc, N.M. An Overview of Atmospheric Electricity Issues; Vietnam National Committee for the International Geophysics: Hanoi, Vietnam, 1960; p. 135. (In Vietnamese) [Google Scholar]
  5. Toan, P.N.; Dac, P.T. Vietnam Climate; Science and Technics Publishing House: Hanoi, Vietnam, 1993; p. 312. (In Vietnamese) [Google Scholar]
  6. Lanh, N.V. Studying the Airmass Thunderstorm Forecast in the Northern Delta in the First Half of Summer. Ph.D. Thesis, Institute of Hydrology and Meteorology, Sofia, Bulgaria, 2001; p. 148. (In Vietnamese). [Google Scholar]
  7. Ngu, N.D.; Hieu, N.T. Vietnam’s Climate and Climate Resources; Science and Technics Publishing House: Hanoi, Vietnam, 2013; p. 296. (In Vietnamese) [Google Scholar]
  8. Van Mai, K.; Laurila, T.K.; Hoang, L.P.; Duc Du, T.; Mäkelä, A.; Kiesiläinen, S. Thunderstorm Activity and Extremes in Vietnam for the Period 2015–2019. Climate 2022, 10, 141. [Google Scholar] [CrossRef]
  9. Amory-Mazaudier, C.; Le Huy, M.; Cohen, Y.; Doumbia, V.; Bourdillon, A.; Fleury, R.; Fontaine, B.; Duyen, C.H.; Kobea, A.; Laroche, P.; et al. Sun-Earth System Interaction studies over Vietnam: An international cooperative project. Ann. Geophys. 2006, 24, 3313–3327. [Google Scholar] [CrossRef]
  10. Uman, M.A. The Lightning Discharge; Academic Press: Cambridge, MA, USA, 1987; p. 377. [Google Scholar]
  11. Christian, H.J.; Blakeslee, R.J.; Boccippio, D.J.; Boeck, W.L.; Buechler, D.E.; Driscoll, K.T.; Goodman, S.J.; Hall, J.M.; Koshak, W.J.; Mach, D.M.; et al. Global frequency and distribution of lightning as observed from space by the Optical Transient Detector. J. Geophys. Res. 2003, 108, 4005. [Google Scholar] [CrossRef]
  12. Cooray, V. The Lightning Flash; The Institution of Engineering and Technology: London, UK, 2008; p. 574. [Google Scholar]
  13. Uman, M.A. The Art and Science of Lightning Protection; Cambridge University Press: Cambridge, UK, 2008; p. 240. [Google Scholar]
  14. Albrecht, R.I.; Goodman, S.J.; Buechler, D.E.; Blakeslee, R.J.; Christian, H.J. Where are the lightning hotspots on Earth? Bull. Am. Meteorol. Soc. 2016, 97, 2051–2068. [Google Scholar] [CrossRef]
  15. Betz, H.D.; Schumann, U.; Laroche, P. Lightning: Principles, Instruments and Applications; Springer: Berlin/Heidelberg, Germany, 2009; p. 641. [Google Scholar]
  16. Cecil, D.; Buechler, D.; Blakeslee, R. TRMM-LIS climatology of thunderstorm occurrence and conditional lightning flash rates. J. Clim. 2015, 28, 6536–6547. [Google Scholar] [CrossRef]
  17. Qie, K.; Tian, W.; Wang, W.; Wu, X.; Yuan, T.; Tian, H.; Luo, J.; Zhang, R.; Wang, T. Regional trends of lightning activity in the tropics and subtropics. Atmos. Res. 2020, 242, 104960. [Google Scholar] [CrossRef]
  18. Qie, K.; Qie, X.; Tian, W. Increasing trend of lightning activity in the South Asia region. Sci. Bull. 2021, 66, 78–84. [Google Scholar] [CrossRef]
  19. Chronis, T.G.; Goodman, S.J.; Cecil, D.; Buechler, D.; Robertson, F.J.; Pittman, J.; Blakeslee, R.J. Global lightning activity from the ENSO perspective. Geophys. Res. Lett. 2008, 35, L19804. [Google Scholar] [CrossRef]
  20. Kumar, P.R.; Kamra, A.K. Variability of lightning activity in South/Southeast Asia during 1997–98 and 2002–03 El Nino/La Nina events. Atmos. Res. 2012, 118, 84–102. [Google Scholar] [CrossRef]
  21. Aranguren, D.; Montanya, J.; Solá, G.; March, V.; Romero, D.; Torres, H. On the lightning hazard warning using electrostatic field: Analysis of summer thunderstorms in Spain. J. Electrost. 2009, 67, 507–512. [Google Scholar] [CrossRef]
  22. Clulow, A.D.; Strydom, S.; Grant, B.; Savage, M.J.; Everson, C.S. Integration of a Ground-Based Lightning Warning System into a Mining Operation in the Democratic Republic of the Congo. Weather Clim. Soc. 2018, 10, 899–912. [Google Scholar] [CrossRef]
  23. Mahomed, M.; Clulow, A.D.; Strydom, S.; Mabhaudhi, T.; Savage, M.J. Assessment of a Ground-Based Lightning Detection and Near-Real-Time Warning System in the Rural Community of Swayimane, KwaZulu Natal, South Africa. Weather Clim. Soc. 2021, 13, 605–621. [Google Scholar] [CrossRef]
  24. Ferro, M.A.d.S.; Yamasaki, J.; Pimentel, D.R.d.M.; Naccarato, K.P.; Saba, M.M.F. Lightning risk warnings based on atmospheric electric field measurements in Brazil. J. Aerosp. Technol. 2011, 3, 301–310. [Google Scholar] [CrossRef]
  25. Junchi, Z.; Qingfeng, Z.; Shah, A.B.; Xue, J.; Ye, Z. A Lightning Warning Algorithm Using a EFMs Network and LPS. Pak. J. Meteorol. 2015, 12, 49–55. [Google Scholar]
  26. Montanya, J.; Bergas, J.; Hermoso, B. Electric field measurements at ground level as a basis for lightning hazard warning. J. Electrost. 2004, 60, 241–246. [Google Scholar] [CrossRef]
  27. Srivastava, A.; Mishra, M.; Kumar, M. Lightning alarm system using stochastic modelling. Nat. Hazards 2015, 75, 1–11. [Google Scholar] [CrossRef]
  28. Wang, G.; Kim, W.H.; Kil, G.S.; Park, D.W.; Kim, S.W. An Intelligent Lightning Warning System Based on Electromagnetic Field and Neural Network. Energies 2019, 12, 1275. [Google Scholar] [CrossRef]
  29. Zeng, Q.; Wang, Z.; Guo, F.; Feng, M.; Zhou, S.; Wang, H.; Xu, D. The application of lightning forecasting based on surface electrostatic field observations and radar data. J. Electrost. 2013, 71, 6–13. [Google Scholar] [CrossRef]
  30. Mkrtchyan, H. Study of Atmospheric Discharges by Near Surface Electric Field Measurements. Open Atmos. Sci. J. 2018, 12, 21–32. [Google Scholar] [CrossRef]
  31. Li, X.; Yang, L.; Yin, Q.; Yang, Z.; Zhou, F. Lightning Risk Warning Method Using Atmospheric Electric Field Based on EEWT-AS Gand Morpho. Atmosphere 2023, 14, 1002. [Google Scholar] [CrossRef]
  32. Gremillion, M.S.; Orville, R.E. Thunderstorm Characteristics of Cloud-to-Ground Lightning at the Kennedy Space Center, Florida: A Study of Lightning Initiation Signatures as Indicated by the WSR-88D. Weather Forecast. 1999, 14, 640–649. [Google Scholar] [CrossRef]
  33. Karagiannidis, A.; Lagouvardos, K.; Kotroni, V. The use of lightning data and Meteosat infrared imagery for the nowcasting of lightning activity. Atmos. Res. 2016, 168, 57–69. [Google Scholar] [CrossRef]
  34. Mosier, R.M.; Schumacher, C.; Orville, R.E.; Carey, L.D. Radar Nowcasting of Cloud–to–Ground Lightning over Houston, Texas. Weather Forecast. 2011, 26, 199–212. [Google Scholar] [CrossRef]
  35. Kohn, M.; Galanti, E.; Price, C.; Lagouvardos, K.; Kotroni, V. Nowcasting thunderstorms in the Mediterranean region using lightning data. Atmos. Res. 2011, 100, 489–502. [Google Scholar] [CrossRef]
  36. Holle, R.L.; Nicholas Demetriades, W.S.; Nag, A. Objective Airport Warnings over Small Areas Using NLDN Cloud and Cloud–to–Ground Lightning Data. Weather Forecast. 2016, 31, 1061–1069. [Google Scholar] [CrossRef]
  37. Paramanik, M.M.R.; Rabbani, K.M.G.; Imran, A.; Islam, J.; Syed, I.M. Prediction of lightning activity over Bangladesh using diagnostic and explicit lightning parameterizations of WRF model. Nat. Hazards 2024, 120, 4399–4422. [Google Scholar] [CrossRef]
  38. Rabbani, K.M.G.; Islam, M.J.; Fierro, A.O.; Mansell, E.R.; Paul, P. Lightning forecasting in Bangladesh based on the lightning potential index and the electric potential. Atmos. Res. 2022, 267, 105973. [Google Scholar] [CrossRef]
  39. Lynn, B.H.; Yair, Y.; Price, C.; Kelman, G.; Clark, A.J. Predicting Cloud-to-Ground and Intracloud Lightning in Weather Forecast Models. Weather Forecast. 2012, 27, 1470–1488. [Google Scholar] [CrossRef]
  40. Giannaros, T.M.; Kotroni, V.; Lagouvardos, K. Predicting lightning activity in Greece with the Weather Research and Forecasting (WRF) model. Atmos. Res. 2015, 156, 1–13. [Google Scholar] [CrossRef]
  41. Son, H.H.; Anh, N.X.; Thanh, P.X.; Hiep, N.V. A research on lightning warning by integrated data: A case study for Gialam area, Hanoi city. Vietnam J. Hydrol. 2020, 720, 32–48. (In Vietnamese) [Google Scholar]
  42. Son, H.H.; Anh, N.X.; Thanh, P.X.; Hiep, N.V. Evaluation of lightning warning technique with multi source data for Vung Tau coastal. Vietnam J. Mar. Sci. Technol. 2023, 23, 209–222. [Google Scholar]
  43. Son, H.H.; Anh, N.X.; Thanh, P.X.; Khuong, P.L.; Hiep, N.V. Research to improve lightning warning methods based on a combination of multiple data sources applied to some areas in Quang Nam province. Vietnam J. Hydrol. 2024, 766, 29–42. (In Vietnamese) [Google Scholar]
  44. Wxline, LLC. Strike Guard Lightning Warning System. In User’s Guide; Wxline, LLC: Tucson, AZ, USA, 2012; p. 38. [Google Scholar]
  45. Boltek Corporation. EFM-100 Atmospheric Electric Field Monitor. In Installation/Operators Guide for Model EFM-100C; Boltek Corporation: Port Colborne, ON, Canada, 2016; p. 50.Monitor. [Google Scholar]
  46. Chum, J.; Langer, R.; Baše, J.; Kollárik, M.; Strhárský, I.; Diendorfer, G.; Rusz, J. Significant enhancements of secondary cosmic rays and electric field at the high mountain peak of Lomnický Štít in High Tatras during thunderstorms. Earth Planets Space 2020, 72, 28. [Google Scholar] [CrossRef]
  47. Harrison, R.G.; Nicoll, K.A. Fair weather criteria for atmospheric electricity measurements. J. Atmos. Sol.-Terr. Phys. 2018, 179, 239–250. [Google Scholar] [CrossRef]
  48. Westcott, N.E. Summertime cloud-to-ground lightning activity around major Midwestern urban areas. J. Appl. Meteorol. 1995, 34, 1633–1642. [Google Scholar] [CrossRef]
  49. Orville, R.E.; Huffines, G.R.; Nielsen-Gammon, J.; Zhang, R.; Ely, B.; Steiger, S.; Phillips, S.; Allen, S.; Read, W. Enhancement of cloud-to-ground lightning over Houston, Texas. Geophys. Res. Lett. 2001, 28, 2597–2600. [Google Scholar] [CrossRef]
  50. Feudale, L.; Manzato, A. Cloud-to-ground lightning distribution and its relationship with orography and anthropogenic emissions in the Po Valley. J. Appl. Meteorol. Climatol. 2014, 53, 2651–2670. [Google Scholar] [CrossRef]
  51. Thornton, J.A.; Virts, K.S.; Holzworth, R.H.; Mitchell, T.P. Lightning enhancement over major oceanic shipping lanes. Geophys. Res. Lett. 2017, 44, 9102–9111. [Google Scholar] [CrossRef]
  52. Li, Z.; Lau, W.K.-M.; Ramanathan, V.; Wu, G.; Ding, Y.; Manoj, M.G.; Liu, J.; Qian, Y.; Li, J.; Zhou, T. Aerosol and monsoon interactions in Asia. Rev. Geophys. 2016, 54, 866–929. [Google Scholar] [CrossRef]
  53. Hu, J.; Rosenfeld, D.; Ryzhkov, A.; Zrnic, D.; Williams, E.; Zhang, P.; Snyder, J.C.; Zhang, R.; Weitz, R. Polarimetric radar convective cell tracking reveals large sensitivity of cloud precipitation and electrification properties to CCN. J. Geophys. Res. Atmos. 2019, 124, 12194–12205. [Google Scholar] [CrossRef]
  54. Sun, M.; Li, Z.; Wang, T.; Mansell, E.R.; Qie, X.; Shan, S.; Liu, D.; Cribb, M. Understanding the Effects of Aerosols on Electrification and Lightning Polarity in an Idealized Supercell Thunderstorm via Model Emulation. J. Geophys. Res. Atmos. 2023, 129, 1–23. [Google Scholar] [CrossRef]
  55. Shchavlev, A.; Aniskov, I.; Semak, Y.; Markova, I.; Anh, N.X. The concept of an atmospheric observation subsystem in the planetary boundary layer based on a small-sized unmanned aerial platform of an aircraft type with a payload an atmospheric parameter meter. Sci. Innov. Natl. Acad. Sci. Belarus 2025, accepted. (In Russian) [Google Scholar]
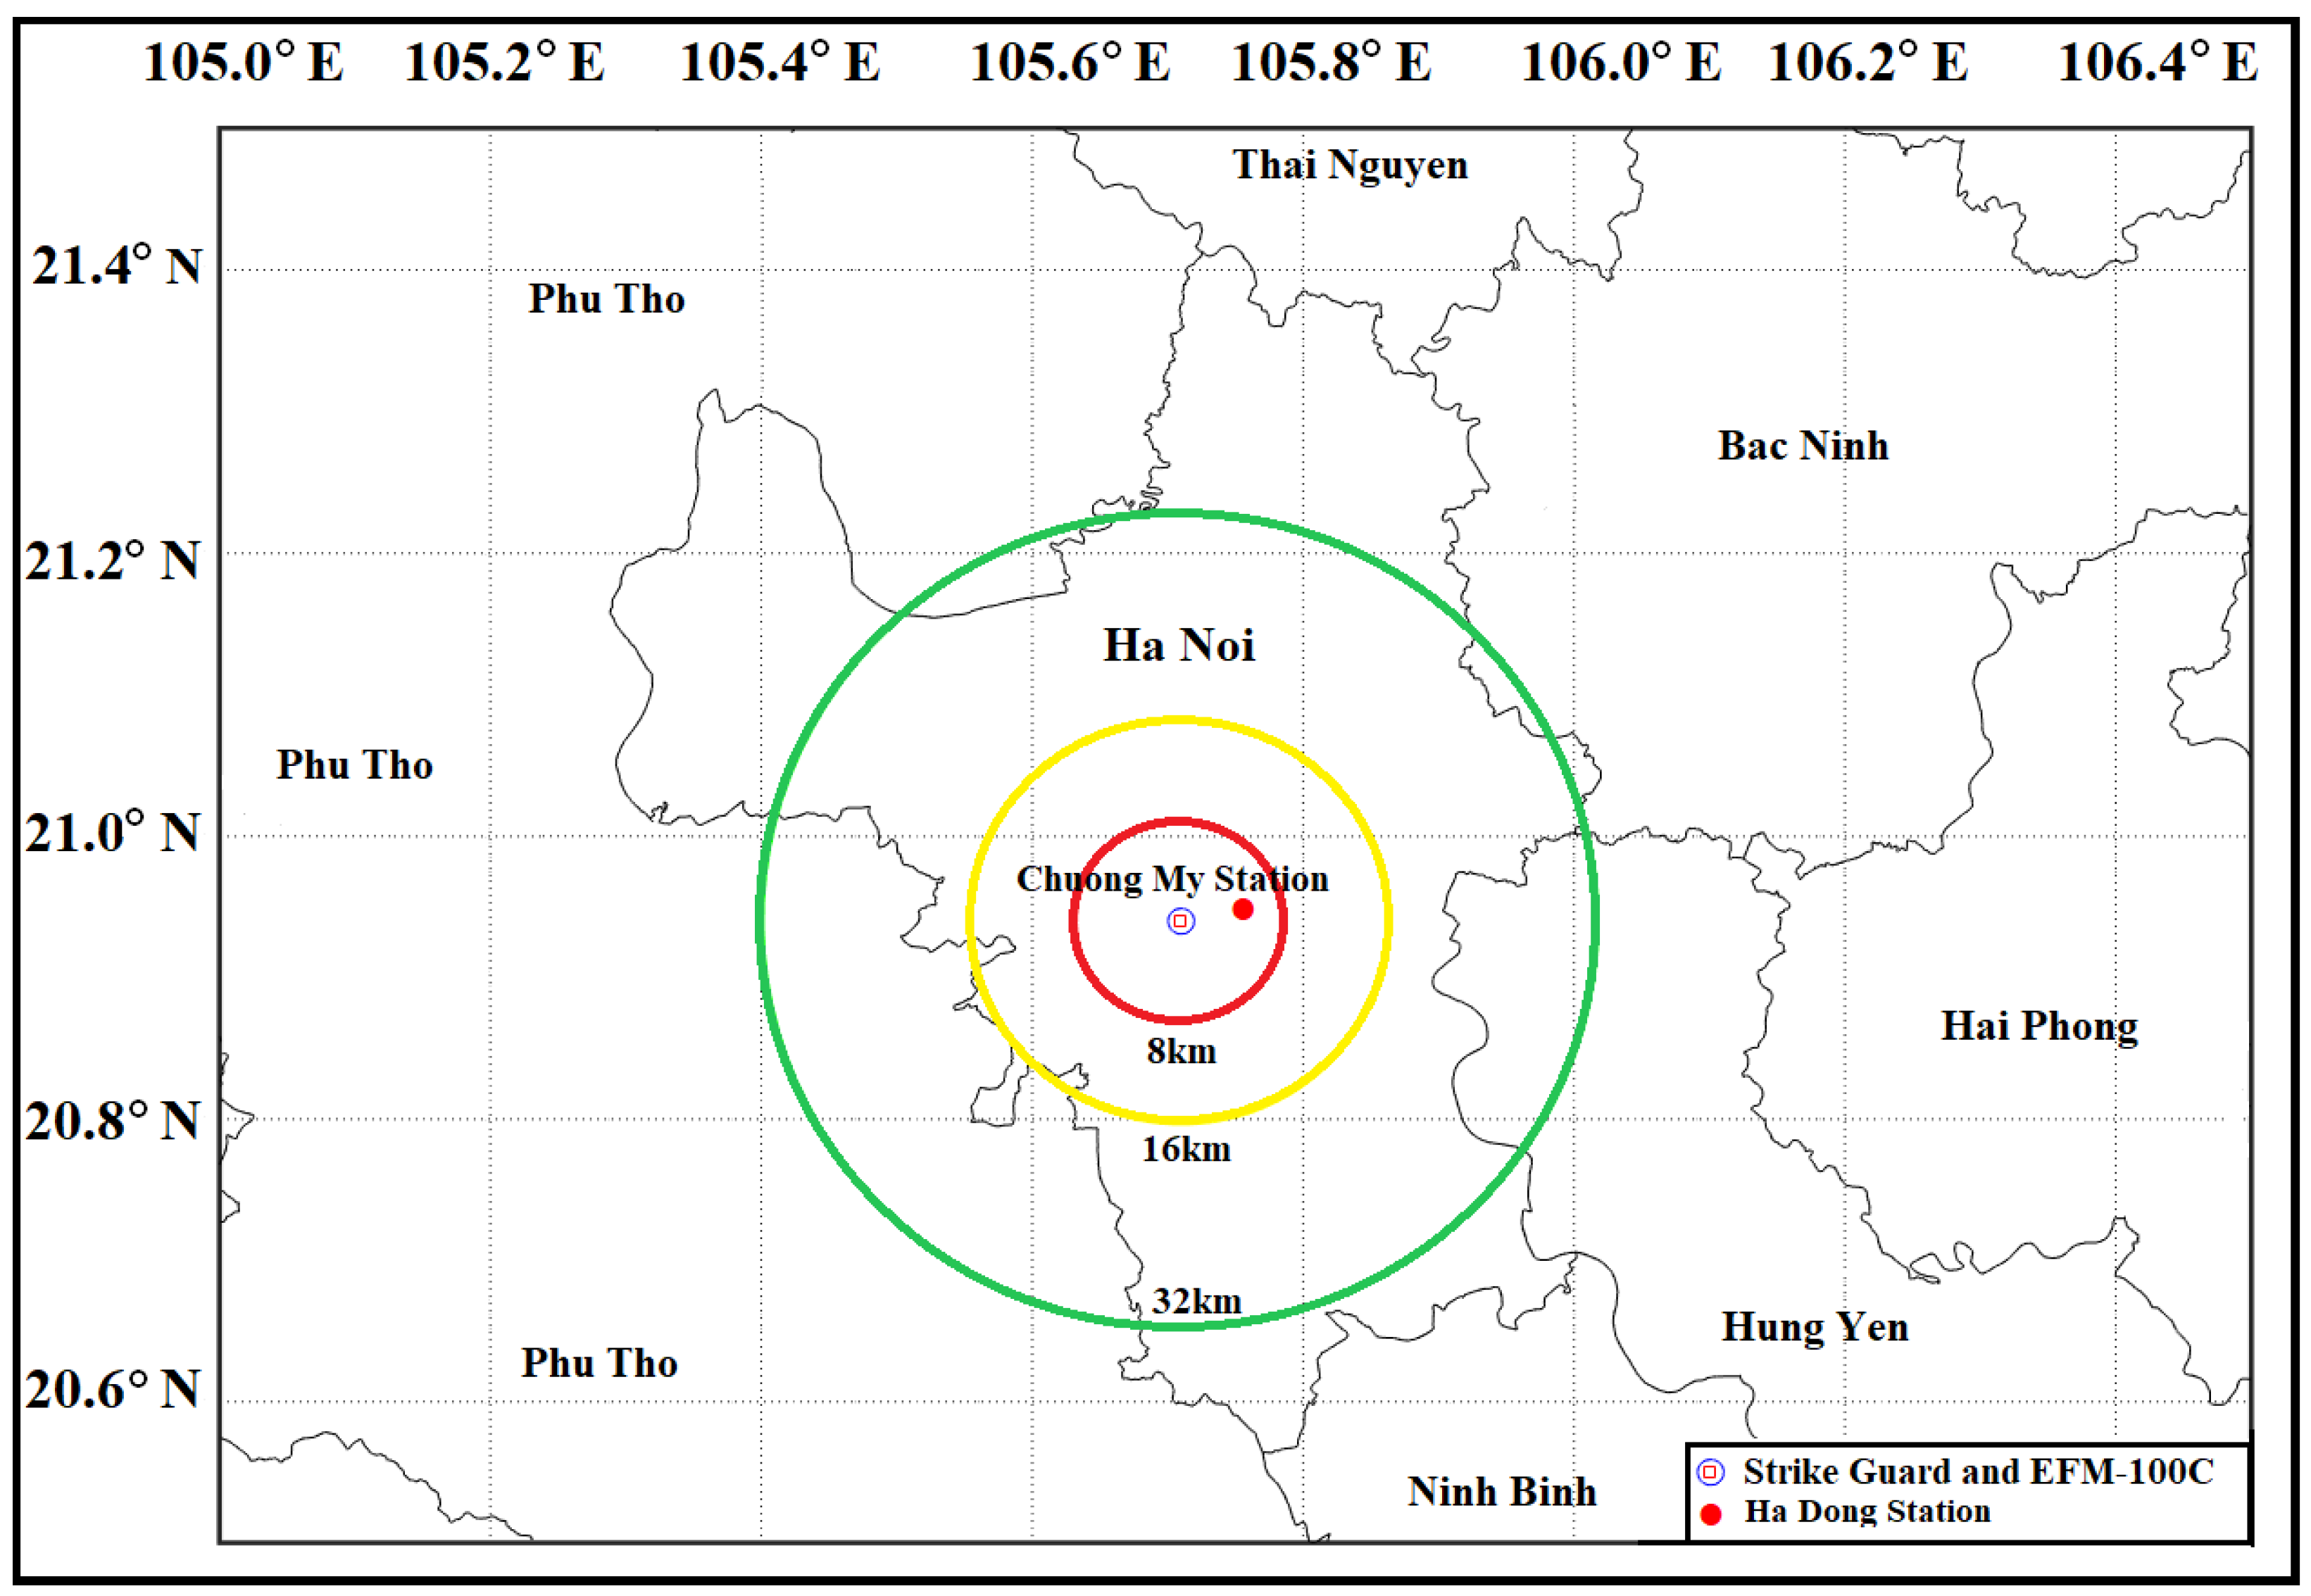
Figure 1. Study site showing the locations of the Strike Guard and EFM-100C lightning warning stations, and the Ha Dong meteorological station (red dot). The red circle indicates the Alarm zone (8 km); the yellow circle indicates the Warning zone (16 km); and the green circle indicates the Caution zone (32 km).
Atmosphere 16 01335 g001
Figure 2. Lightning warning zones defined by radial distance from the station. The red area represents the Alarm area (8 km), the yellow area (including the red area) represents the Warning area (16 km), and the green area (including the red area and green area) represents the Caution area (32 km). The red area (cloud shape) denotes the thunderstorm clouds, and the arrow indicates their direction of movement.
Atmosphere 16 01335 g002
Figure 3. Hourly variations in total lightning strokes within the Alarm area and the corresponding rainfall during the period from May to September (2022–2023) in the Chuong My area, Hanoi. The blue line represents the total hourly lightning detected by the SG instrument; the red line represents the total hourly lightning detected by the VNMHA lightning location system; and the green line represents the total hourly rainfall measured at the Ha Dong station.
Atmosphere 16 01335 g003
Figure 4. Diurnal variation in the mean electric field under fair-weather conditions (119 rain-free days) during May–September of 2022 and 2023 at Chuong My, Hanoi.
Atmosphere 16 01335 g004
Figure 5. Hourly distribution of total lightning flashes during the period 2020–2024, derived from Strike Guard observations at Chuong My, Hanoi.
Atmosphere 16 01335 g005
Figure 6. Total number of lightning flashes in the alarm area (red), warning area (yellow), and caution area (green) for (a) yearly and (b) monthly periods during 2020–2024, derived from Strike Guard observations at Chuong My, Hanoi.
Atmosphere 16 01335 g006
Figure 7. Similar to Figure 6 but for annual (a) and monthly (b) total thunderstorm hours.
Atmosphere 16 01335 g007
Figure 8. Similar to Figure 6 but for annual (a) and monthly (b) total thunderstorm days.
Atmosphere 16 01335 g008
Figure 9. Variation in electric field and SG alert states on 8 June 2022 in Chuong My, Hanoi.
Atmosphere 16 01335 g009
Figure 10. Variation in the electric field and SG alert states on 30 July 2022 at Chuong My, Hanoi.
Atmosphere 16 01335 g010
Figure 11. Variation in the electric field and SG alert states on 23 August 2022 at Chuong My, Hanoi.
Atmosphere 16 01335 g011
Figure 12. Variation in the electric field and SG alert states on 18 June 2023 at Chuong My, Hanoi.
Atmosphere 16 01335 g012
Figure 13. Variation in the electric field and SG alert states on 5 July 2023 at Chuong My, Hanoi.
Atmosphere 16 01335 g013
Figure 14. Variation in the electric field and SG alert states on 12 August 2023 at Chuong My, Hanoi.
Atmosphere 16 01335 g014
Figure 15. Lead time of lightning warnings in Chuong My, Hanoi.
Atmosphere 16 01335 g015
Figure 16. Statistical indices evaluating the performance of lightning warnings in Chuong My, Hanoi.
Atmosphere 16 01335 g016
Table 1. Station locations, instruments, and data periods used.
StationLongitudeLatitudeInstrumentData Period
Chuong My105.7095° E20.9386° NStrike Guard,
Wxline LLC, Tucson, Arizona, USA
2020–2024
Chuong My105.7095° E20.9386° NEFM-100C,
Boltek, Port Colborne, ON, Canada
2022–2023
Ha Dong (VNHMA)105.7531° E20.9569° NRain gauge
Hyquest Solutions PTY, New South Wales, Australia
2022–2023
Table 2. Contingency table for warning and observations.
Observations
Warning YesNo
YesAC
NoBD
Table 3. Performance parameters for various threshold values.
3000 (V/m)2500 (V/m)2000 (V/m)1500 (V/m)1000 (V/m)500 (V/m)
POD (%)65.2271.0876.7078.3882.2281.54
FAR (%)18.1814.4911.2410.318.268.62
CSI (%)56.9663.4469.9171.9076.5575.71
Pre (%)81.8285.5188.7689.6991.7491.38
F1 (%)72.5877.682.2983.786.7286.2
Disclaimer/Publisher’s Note: The statements, opinions and data contained in all publications are solely those of the individual author(s) and contributor(s) and not of MDPI and/or the editor(s). MDPI and/or the editor(s) disclaim responsibility for any injury to people or property resulting from any ideas, methods, instructions or products referred to in the content.