Article

Hydro-Climatic and Multi-Temporal Remote Analysis of Glacier and Moraine Lake Changes in the Ile-Alatau Mountains (1955–2024), Northern Tien Shan

by
Gulnara Iskaliyeva
1,2,
Aibek Merekeyev
1,3,*,
Nurmakhambet Sydyk
1,
Alima Azamatkyzy Amangeldi
1,
Bauyrzhan Abishev
3,4 and
Zhaksybek Baygurin
1,5
1
Institute of Ionosphere, Almaty 050000, Kazakhstan
2
Faculty of Water Resources and IT Technologies, Kazakh National Agrarian Research University, Almaty 050010, Kazakhstan
3
Faculty of Geography and Environmental Sciences, Al-Farabi Kazakh National University, Almaty 050040, Kazakhstan
4
State Institution “Kazselezashchita”, Ministry for Emergency Situations of the Republic of Kazakhstan, Almaty 050000, Kazakhstan
5
Department of Surveying and Geodesy, Satbayev University, Almaty 050000, Kazakhstan
*
Author to whom correspondence should be addressed.
Atmosphere 2025, 16(12), 1333; https://doi.org/10.3390/atmos16121333
Submission received: 6 October 2025 / Revised: 12 November 2025 / Accepted: 21 November 2025 / Published: 25 November 2025
(This article belongs to the Special Issue Glacier Mass Balance and Variability)

Abstract

High-mountain regions such as the Ile-Alatau range of the Northern Tien Shan are highly sensitive to climatic fluctuations, where even minor variations in temperature and precipitation significantly influence glacier mass balance and hydrology. Despite this sensitivity, few long-term studies have examined the links between hydro-climatic trends, glacier retreat, and moraine lake development. This study investigates multi-decadal glacier and lake dynamics (1955–2024) in relation to observed climate variability, using an integrated hydro-climatic and remote-sensing approach. Temperature and precipitation records from four high-altitude meteorological stations were assessed using linear regression and the Mann–Kendall test, while glacier and lake extents were derived from aerial photographs and Landsat, Sentinel-2, and PlanetScope imagery across ten river basins. Results show statistically significant warming at all stations, with mean annual temperatures increasing by 0.14–0.28 °C per decade and summer temperatures by 0.15–0.30 °C, while precipitation remained stable or slightly decreased. Glacierized area decreased from approximately 269.6 km2 in 1955 to 141.7 km2 in 2021, representing a 47.4% reduction (≈−0.72% yr−1) over six decades and underscoring the rapid regional cryospheric response to sustained climatic warming. Simultaneously, moraine-dammed lakes increased by 16–18% between 2017 and 2024. These trends highlight the dominant climatic control on glacier loss and lake evolution, emphasizing growing glacial lake outburst floods (GLOFs) and the need for adaptive water-resource management in Central Asia.

1. Introduction

High mountain areas are particularly susceptible to climate change and extreme weather events, experiencing amplified effects such as rising temperatures, thawing permafrost, and retreating glaciers. Studies consistently highlight that contemporary global warming and climate change are responsible for these dramatic effects in high mountain environments [1,2,3]. Within these regions, glaciers are particularly sensitive to climatic fluctuations, serving as critical sources of freshwater, and indicators of local and regional climatic shifts [4]. The accelerated melting of glaciers observed in recent decades has become a widespread phenomenon, particularly pronounced across High Mountain Asia, raising significant concerns about water security and food production [5,6]. Retreating glaciers can lead to the formation and expansion of glacial lakes, particularly moraine-dammed lakes, which are prone to GLOFs, posing substantial risks to downstream communities and infrastructure [7]. Therefore, it becomes increasingly important to understand the dynamics of climate change and its implications on glaciers, especially in regions where communities depend on them for water resources [8].
Northern Tien Shan mountains, like other high mountain areas, are highly vulnerable to climate change, with observed impacts including glacier retreat and changes in water availability [9,10]. These mountains are called the “Water tower of Central Asia” as they serve as a critical water resource for the surrounding arid and semi-arid regions [11,12]. Several studies have reported that the Northern Tien Shan mountains are experiencing active glacier shrinkage due to changes in seasonal and annual air temperature and precipitation [13,14]. The rate of glacial retreat in these mountains is alarmingly high, with recent data indicating rates close to or even exceeding 1% per year. However, the rates of glacial retreat are not uniform across the entire Tien Shan range, with some areas experiencing more dramatic changes than others [15]. As per a study conducted by Zhang et al. [16], the reduction in total glacier area in the Tien Shan mountains between 1990 and 2015 stands at 0.60% to 0.71% annually. This shrinkage is primarily driven by a significant increase in temperature since 1998, at a rate of 0.36–0.42 °C/10 a, which is notably higher than global rate of 0.12 °C/10 a. Additionally, precipitation patterns have shifted, with an increasing proportion falling as rain instead of snow, further contributing to glacier loss. Another study conducted by Aizen et al. [17] revealed a reduction of 14.2% in glacier area during the period (1943–2003) for Akshiirak and Ala Archa glaciers situated in Tien Shan mountains. Che et al. [18] indicated a mean glacier area decrease of 0.7% ± 0.6% per year in the Chinese Tien Shan from the 1960s to 2010, further emphasizing the severity of glacier loss in this region. Thus, it can be observed that this region is highly susceptible to climate change, and temperature increases might cause glacier recession by the end of the century [19,20]. Moreover, the differential responses of glaciers to climate change across the Tien Shan range highlight the need for local and regional scale studies to understand the specific impacts and develop targeted adaptation strategies [21].
The growth of glacial lakes has been a direct consequence of glacial retreat, as glacier ice melts, it leaves behind depressions that fill with meltwater, forming lakes dammed by moraines [22]. Tien Shan mountains have also witnessed a substantial growth of glacial lakes, with potentially hazardous implications for downstream areas. The number and size of glacial lakes have increased significantly over the past several decades, posing an increased risk of GLOFs in the region. Zhang et al. [23] observed the increasing trend in the number and area of glacial lakes in the eastern Tien Shan mountains, with an increase of 64% and 48%, respectively, from 1990 to 2015. Another study conducted by Daiyrov et al. [24] investigated the number of glacial lakes from 1968 to 2021 using a suite of remote sensing imagery and observed an increase in the number of lakes by 30% from the base period. This expansion of glacial lakes has primarily been attributed to rapid glacier melting, influenced by temperature increases and associated feedback mechanisms. This could further cause hydrological crises, and more frequent and intense natural disasters such as GLOFs, flash floods, soil erosion, and landslides [19]. A recent example of a GLOF causing significant damage occurred in 2019, originating from the Toguz-Baluk glacial lake in the Tosor River basin of the Northern Tien Shan region [24]. Therefore, understanding the pattern, and magnitude of glacial lake growth, especially moraine-dammed lakes, is crucial to improve risk assessment and mitigation strategies, for downstream communities.
Ile Alatau, situated in the northern part of the Tien Shan, plays a crucial role in regional water resources, making the study of its glaciers particularly important [25]. Rapid depletion of glaciers in this region is alarming because it poses a threat to local water supplies that are essential for agriculture, domestic use, and sustaining ecological balance [26,27]. Severskiy et al. [28] highlighted that the rate of glacier retreat in the region is among the highest recorded globally, with some glaciers losing more than 1% of their mass annually. Another study by Bolch et al. [27] has reported a significant reduction of about 32% in glacier area in the Zailiyskiy and Kungey Alatau mountains between the 1950s and 1990s. Thus, understanding the spatiotemporal variations in glaciers lying in these regions and their driving forces are critical under the changing climatic conditions [25].
Moreover, Ille Alatau mountains have been experiencing deglaciation and witnessing an increase in the number and size of glacial lakes [29]. Recent studies highlight that the region has become susceptible to GLOFs, and subsequent debris flows, particularly since the mid-20th century [30]. A study conducted by Mussina et al. [31] observed an increase in the number of moraine lakes from 20 in 1978 to 77 in 2021 in five river basins of Ulken Almaty, Kishi Almaty, Talgar, and Esik, located in southeastern Kazakhstan. This study underscores the urgent necessity of investigating and understanding the formation mechanisms, temporal dynamics, and future trajectories of glacial moraine lakes. Such knowledge is critical for mitigating the risks associated with hazardous exogenous processes. Therefore, a detailed analysis of changes in glacial lakes, is essential to assess the current state and future trends of these water bodies, and to develop suitable strategies to manage these risks.
Despite these alarming trends, a significant gap remains in the comprehensive and systematic understanding of trends of glacial retreat and the growth of glacial lakes in the Ile-Alatau region. Quantitative records of glacier and lake evolution are sparse, and existing studies have often focused on selective basins or short time periods, lacking the broader spatiotemporal analysis required for robust hazard assessment and climate change adaptation [32,33]. No comprehensive analysis has yet integrated decades of satellite data with local climate records to link glacier and lake dynamics to warming. The responses of individual glaciers also vary across the Tien Shan, so local factors in Ile-Alatau may differ from other subranges. Thus, there is a critical need for basin-scale, integrated research on Ile-Alatau glacier and lake systems that can account for climatic drivers, cryospheric changes, and hydrological hazards together.
Therefore, this study aims to provide an integrated assessment of cryospheric changes in the Ile Alatau region of the Tien Shan mountains. Specifically, we analyzed long-term trends in key meteorological parameters (temperature and precipitation) to establish the climatic context of glacier change. Furthermore, we investigated spatio-temporal variations in glacier extent across individual basins to quantify patterns of retreat under these evolving climatic conditions. Lastly, we examine the evolution of glacial lakes in terms of their number, area, and distribution, linking their growth to both glacier recession and hydro-climatic drivers. This study contributes to the existing body of knowledge by providing an updated assessment of climate change and its impact on glaciers and glacial lakes in the Ile Alatau region. The integrated approach, combining multi-decadal remote sensing datasets with in situ climate observations, fills critical knowledge gaps regarding the coupled dynamics of meteorological variability, glacier recession, and glacial lake development in the Ile-Alatau. The findings provide updated evidence for forecasting future trajectories of glaciers and glacial lakes, while also informing sustainable water resource management and hazard mitigation strategies in Central Asia’s vulnerable mountain regions.

2. Study Area

Ile Alatau is situated in the Northern Tien Shan, forming a natural border between Kazakhstan and Kyrgyzstan [34]. It is the northernmost ridge of the Tien Shan mountain system, extending approximately 280 km in length and 40 km in width [35]. Its geographical coordinates range from 42°49′ to 43°20′ N latitude and from 76°10′ to 78°00′ E longitude. The elevation in the area varies significantly, ranging from about 600 m in the plains to over 4973 meters at the highest peak, Talgar Peak [36].
The climate of the Ile Alatau is continental, characterized by warm summers and cold winters, with significant variations in temperature and precipitation depending on altitude and aspect [37]. The Ile-Alatau mountain range is influenced by a mix of arctic, polar and tropical air masses. In winter, the region is predominantly exposed to the Siberian anticyclone, resulting in cold and dry weather. While, cyclonic activity increases in spring, bringing in humid air masses from the Atlantic regions.
Snow accumulation on Ile-Alatau glaciers, particularly at altitudes of 3300–3500 m, typically lasts for about nine months, from mid-September to mid-June, extending to ten months or longer at 3800–4000 m. During this period, 700 to 800 mm of snow falls in the glaciers, with most of it falling at the end of the accumulation season, namely in April and May. The least amount of precipitation falls in January—only 20–30 mm (2–3 percent of the annual volume). The relief and lower surface contribute to the formation of a complex wind system in mountainous areas. In the winter season, southern and south-western winds prevail, their frequency reaching 70%. The average wind speed is around 2–3 m/s. The average air temperature recorded during the accumulation period fluctuates between −8 and −10 °C. The coldest months on average are January and February, with average monthly temperatures between −14 and −16 °C, and the lowest temperatures can fall to −32 °C and even lower. Winter thaws are rare, and by the end of May there is a gradual increase in average daily temperatures to positive values. In winter, the vertical temperature gradient is usually minimal (0.45 °C per 100 m above sea level) from the lower regions to the glacier zone. Temperature inversions generally remain below 2500 m and are virtually absent in the glacier areas [38,39,40].The Ile Alatau mountain range consists of a significant number of glaciers that are crucial for regional water resources and ecological balance [29]. These glaciers feed numerous rivers and streams, supplying water to both Kazakhstan and Kyrgyzstan [41]. The glaciers within the Ile-Alatau mountain range are typically categorized and studied based on their distribution across the river basins they feed, which include the Ile, Turgen, Kaskelen, Issyk, Talgar, Aksai, Chamalgan, Ulken and Kishi Almaty rivers (Figure 1). These waterways originate in the glaciated zones of the mountain range and play an indispensable role in maintaining the hydrological balance and water availability for the surrounding arid and semi-arid regions.

3. Materials and Methods

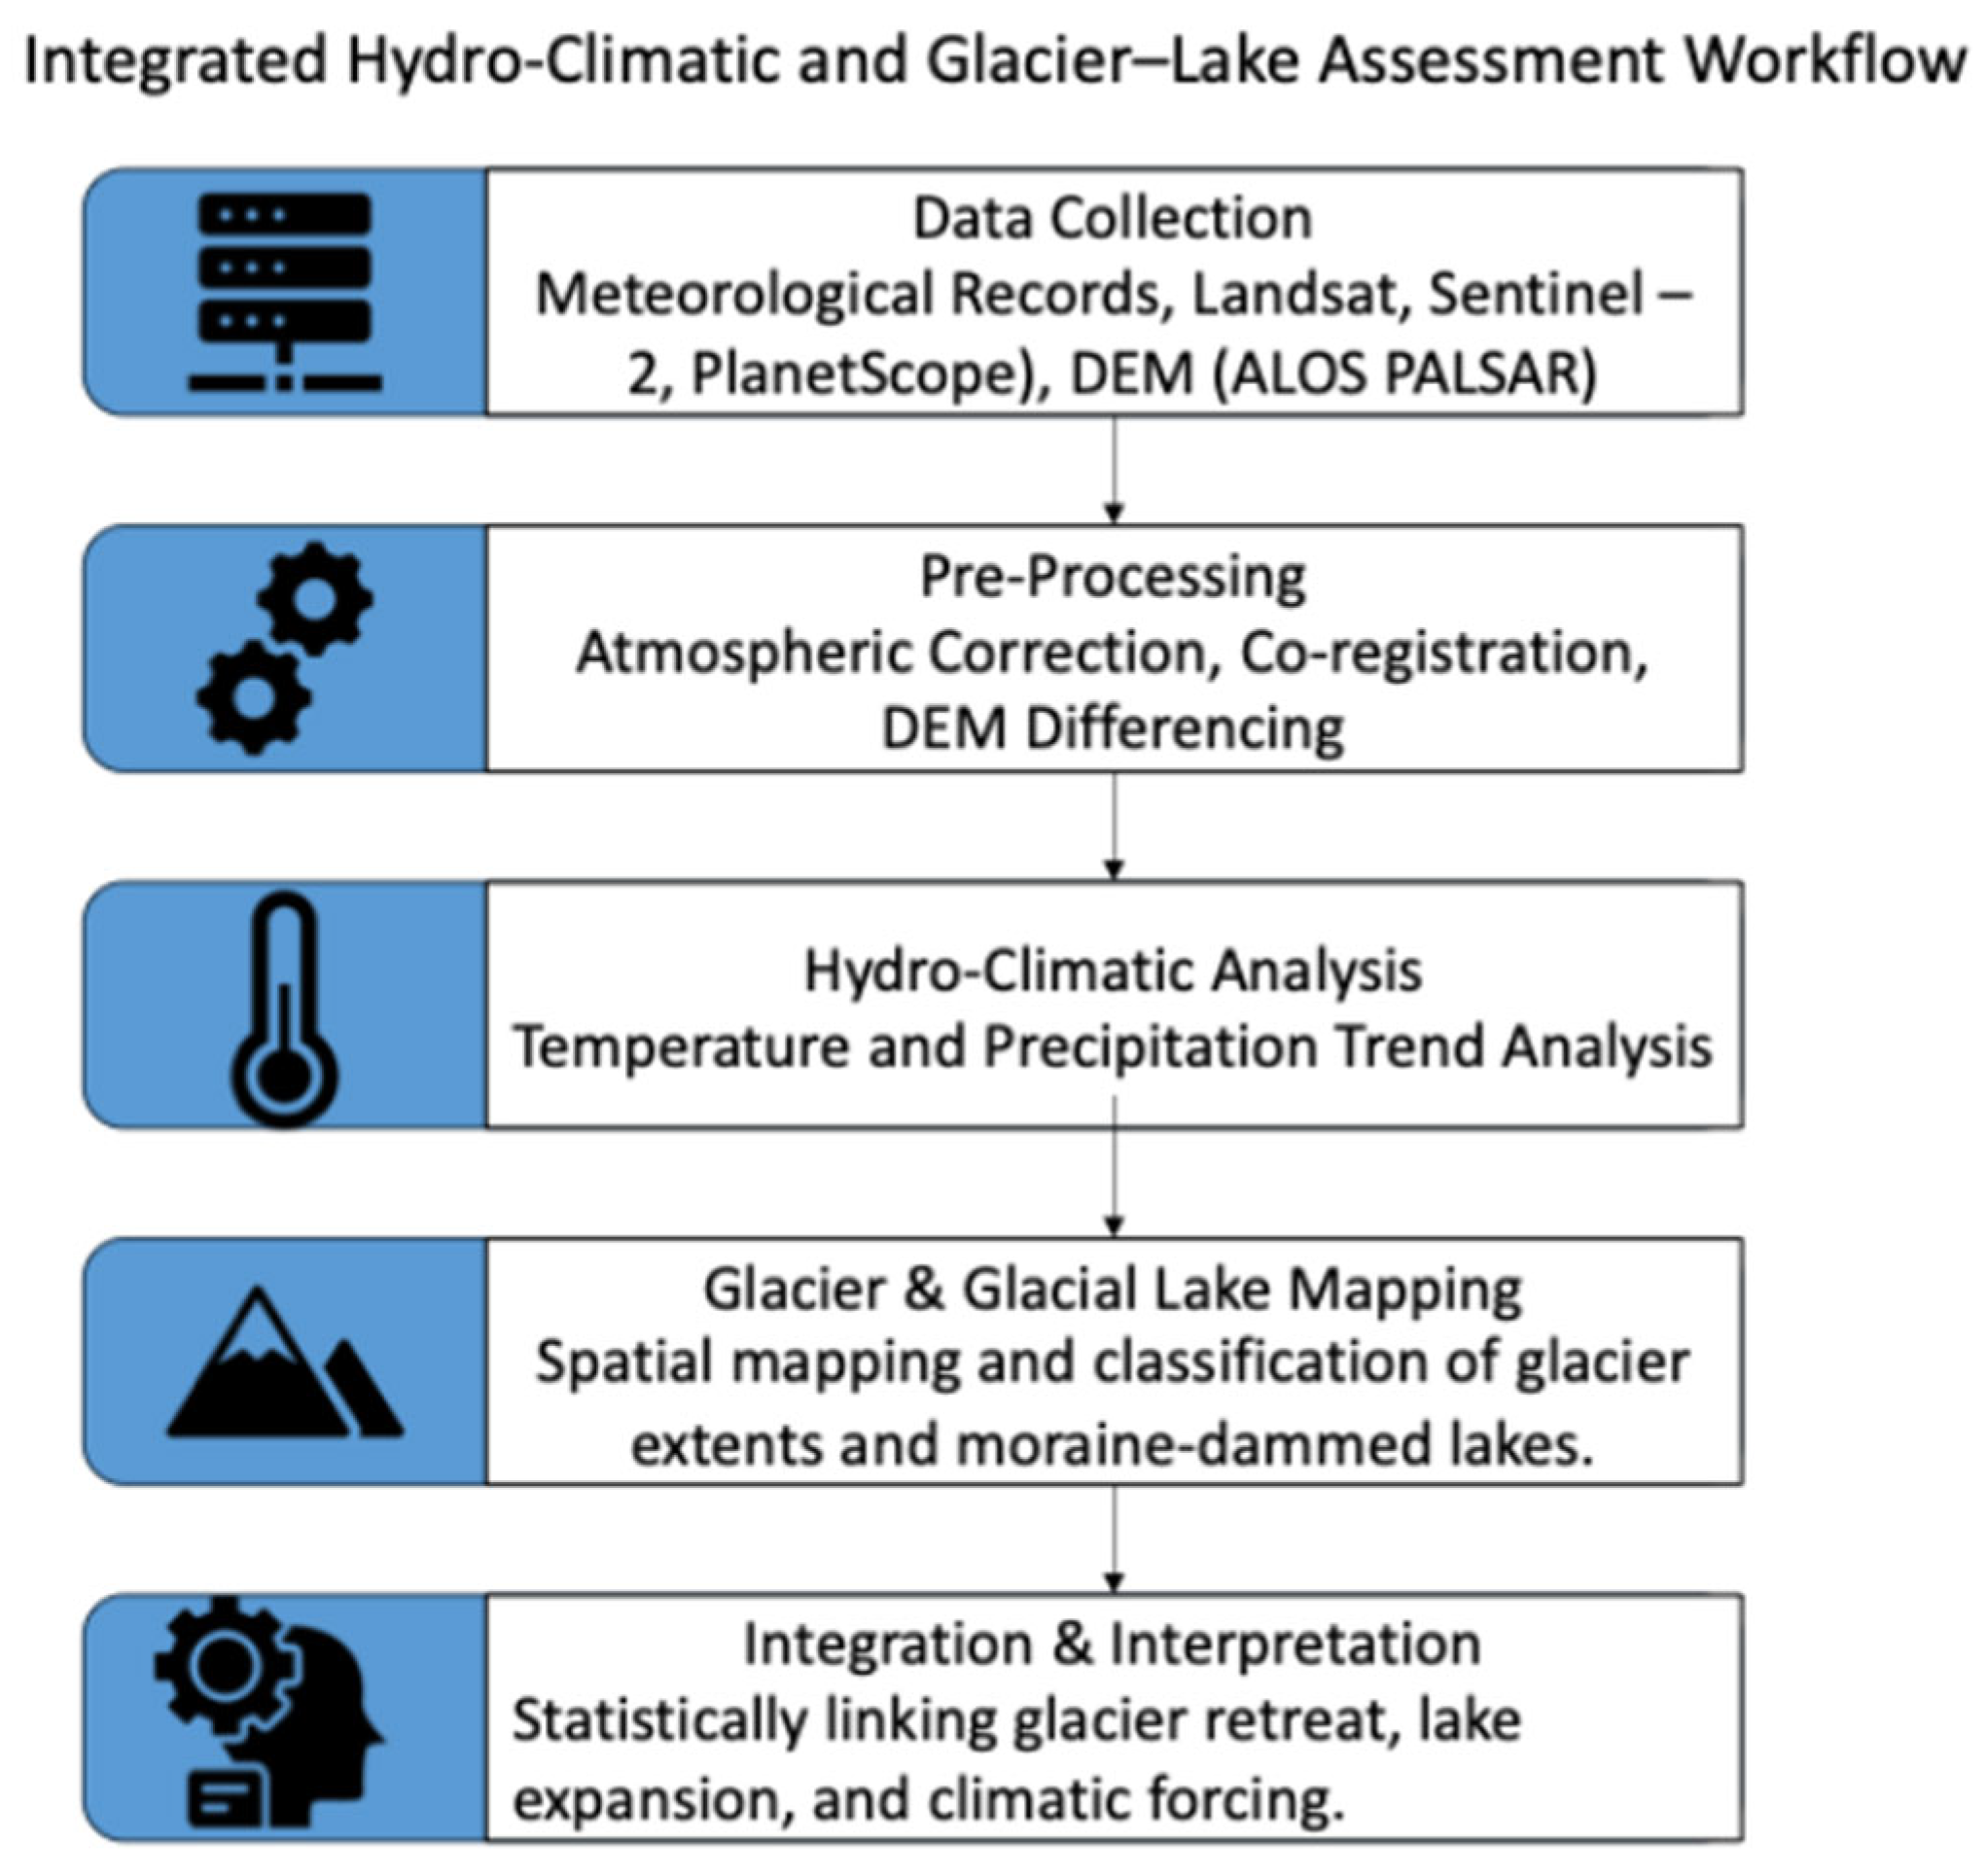
This study integrates long-term hydro-climatic data with multi-decadal glacier inventories and high-resolution lake records to assess cryospheric change in the Ile-Alatau. First, meteorological station data (1950s–2020s) were processed and analyzed using the Mann–Kendall test and Sen’s slope estimator to detect significant trends in temperature and precipitation. Second, glacier extent was reconstructed from aerial photos, USSR Glacier Catalog outlines, and multi-temporal satellite imagery (Landsat ETM+ (NASA/USGS, USA), Landsat OLI (NASA/USGS, USA), Sentinel-2 (European Space Agency, France)), delineated using band ratio indices and refined manually. Area change uncertainty was estimated as ±1 pixel, cross-validated against previous inventories. Third, moraine-dammed lakes were mapped using Sentinel-2 and PlanetScope (CA, USA) imagery, with Normalized Difference Water Index (NDWI) thresholds and visual editing, applying a minimum mapping unit of 0.001 km2. Lake mapping errors were reduced through manual correction and uncertainty assessed as ±1 pixel. Finally, glacier changes were associated with hydro-climatic anomalies, and the synchrony between lake expansion and glacier retreat was analysed at basin scale. This chronological workflow (climate → glacier → lake) described in Figure 2, ensures an integrated assessment of climate–cryosphere interactions in Ile-Alatau.

3.1. Data Acquisition

3.1.1. Hydro-Climatic Data

To understand the climatic context of glacier changes, we incorporated hydro-climatic data from meteorological stations located in and around the Ile-Alatau region. These data, including temperature and precipitation records, were analysed to identify trends and anomalies that may correlate with glacier fluctuations [42]. Four meteorological stations namely, Kamenskoe plateau, Ulken Almaty Lake, Mynzhylky, and Aces, were selected based on their proximity to the study glaciers and the availability of long-term records. These stations are located at an altitude of 1300 to 3200 m above sea level and have been conducting daily long-term observations of temperature and precipitation since 1935. Table 1 provides information on the geographical location of the meteorological stations covering the study area. These data are crucial for assessing the impact of climate variability on glacier dynamics in the region [43]. The data is provided by the Republican Hydrometeorological Enterprise, “Kazhydromet” which is responsible for providing official hydrometeorological information across the country.
Long-term (1950s–2020s) temperature and precipitation data were analyzed to examine seasonal and annual trends potentially linked with glacier fluctuations. These data are essential for correlating climatic trends with observed glacier changes, providing insights into the driving forces behind glacier dynamics [43,44]. The data were processed to calculate annual and seasonal averages, identify trends, and detect any significant shifts in temperature and precipitation patterns that may influence glacier mass balance [45]. Analyzing such climatic data is critical for understanding the factors influencing changes in glacier mass balance and meltwater production [46].

3.1.2. Glacier Outlines and Lake Delineation

Glacier changes in the Ile Alatau Mountains were assessed using available aerial photographs, and multi-temporal satellite imagery, enabling the quantification of variations in glacier extent from 1950s to 2020s. The analysis of glacier area changes involves delineating glacier boundaries from remote sensing imagery and comparing their extents over time [47]. This allows for the calculation of area changes, which are then used to determine rates of glacier retreat or advance [48].
The remote sensing data were acquired from various sources to ensure comprehensive coverage and temporal resolution [28]. The data spanned from 1950s to 2020s, enabling the quantification of long-term glacier dynamics over several decades. The primary data sources were selected for optimal glacier delineation during the late ablation season (end of summer) to minimize snow cover and atmospheric interferences (clouds and fog). Baseline glacier extents for 1950s were derived from aerial photographs, compiled and provided by 13th volume of USSR glacier catalog [49]. Two Landsat 7 ETM+ images from 1999, one Landsat 8 OLI image from 2014, and ultimately, two Sentinel 2 MSI images from 2021 were used to provide higher resolution contemporary glacier outlines. Table 2 highlights the information regarding the acquisition of satellite data. Furthermore, ALOS PALSAR Digital Elevation Model (DEM) (JAXA, Japan) data were used to extract watersheds and topographic information for the glacier inventory. These datasets facilitate a detailed examination of decadal and interannual glacier dynamics [50,51].
The temporal baselines were selected based on the availability of consistent optical imagery, corresponding glacier inventories, and cloud-free scenes. Varying these windows would alter the magnitude of observed changes; however, our chosen periods represent the longest reliable datasets available for this region and allow comparison with previous cryosphere studies. Table 3 provides the information regarding the acquisition of satellite data for the glacial lake inventory. These datasets enable detailed mapping and monitoring of lake evolution over time.

3.2. Data Processing and Analysis

3.2.1. Hydro-Climatic Data Analysis

The long-term hydro-climatic data acquired from the four selected meteorological stations (Kamenskoe plateau, Ulken Almaty Lake, Mynzhylky, and Aces) underwent a rigorous processing and analysis workflow to identify climatic trends and their potential impact on glacier dynamics. Initially, the daily raw data from each station were quality controlled to remove any erroneous or missing values, ensuring data integrity and accuracy. We flagged the outliers and inconsistent values using Z-score method, and corrected the missing values by interpolating the mean of the adjacent values to maintain the continuity of the dataset. After cleaning, the daily temperature and precipitation data were aggregated into seasonal and annual time series to reduce noise and highlight long-term trends.
To identify the long-term climatic trends, the aggregated annual and seasonal averages for temperature and precipitation were then utilized to analyze any statistically significant trends. The nonparametric statistical Mann–Kendall method, widely used in hydrological and meteorological studies, was applied to assess the overall trend in changes in air temperature and precipitation. This method is often used in conjunction with the Sen’s slope estimator to determine the magnitude of trends [52]. In the present study, the calculations were performed in R using the Mann–Kendall trend test methodology for time series data without modifications. The null hypothesis of the test assumes the absence of a trend in the data, while the alternative hypothesis states that the data exhibit a monotonic trend. This approach enables the robust identification of significant long-term shifts in climatic variables, even in the presence of non-normal data or outliers, which are common in environmental time series. This analysis was particularly helpful in determining the rate of change in temperature and precipitation over the study period, offering quantitative insights into climate variability [53].

3.2.2. Glacier Delineation and Area Change Analysis

The analysis of glacier area changes involves delineating glacier boundaries from remote sensing imagery and comparing their extents over time [54]. This allows for the calculation of area changes, which are then used to determine rates of glacier retreat or advance.
We utilized a combination of automated band ratio techniques, and manual digitization to delineate glacier boundaries from satellite imagery. Automated methods, such as Normalized Difference Snow Index (NDSI), can be employed to initially identify snow and ice cover, which was then refined through visual inspection and manual editing to remove non-glacier features like snow-covered terrain and debris. Studies by Zhang et al. and Guo et al. [23,55] have demonstrated the reliability, simplicity, and effectiveness of employing band ratio methods for glacier boundary extraction. This can further be augmented by manual revision, especially in regions with debris-covered glaciers [56]. Thus, combining automated and manual approaches ensures effective glacier mapping and monitoring over time.
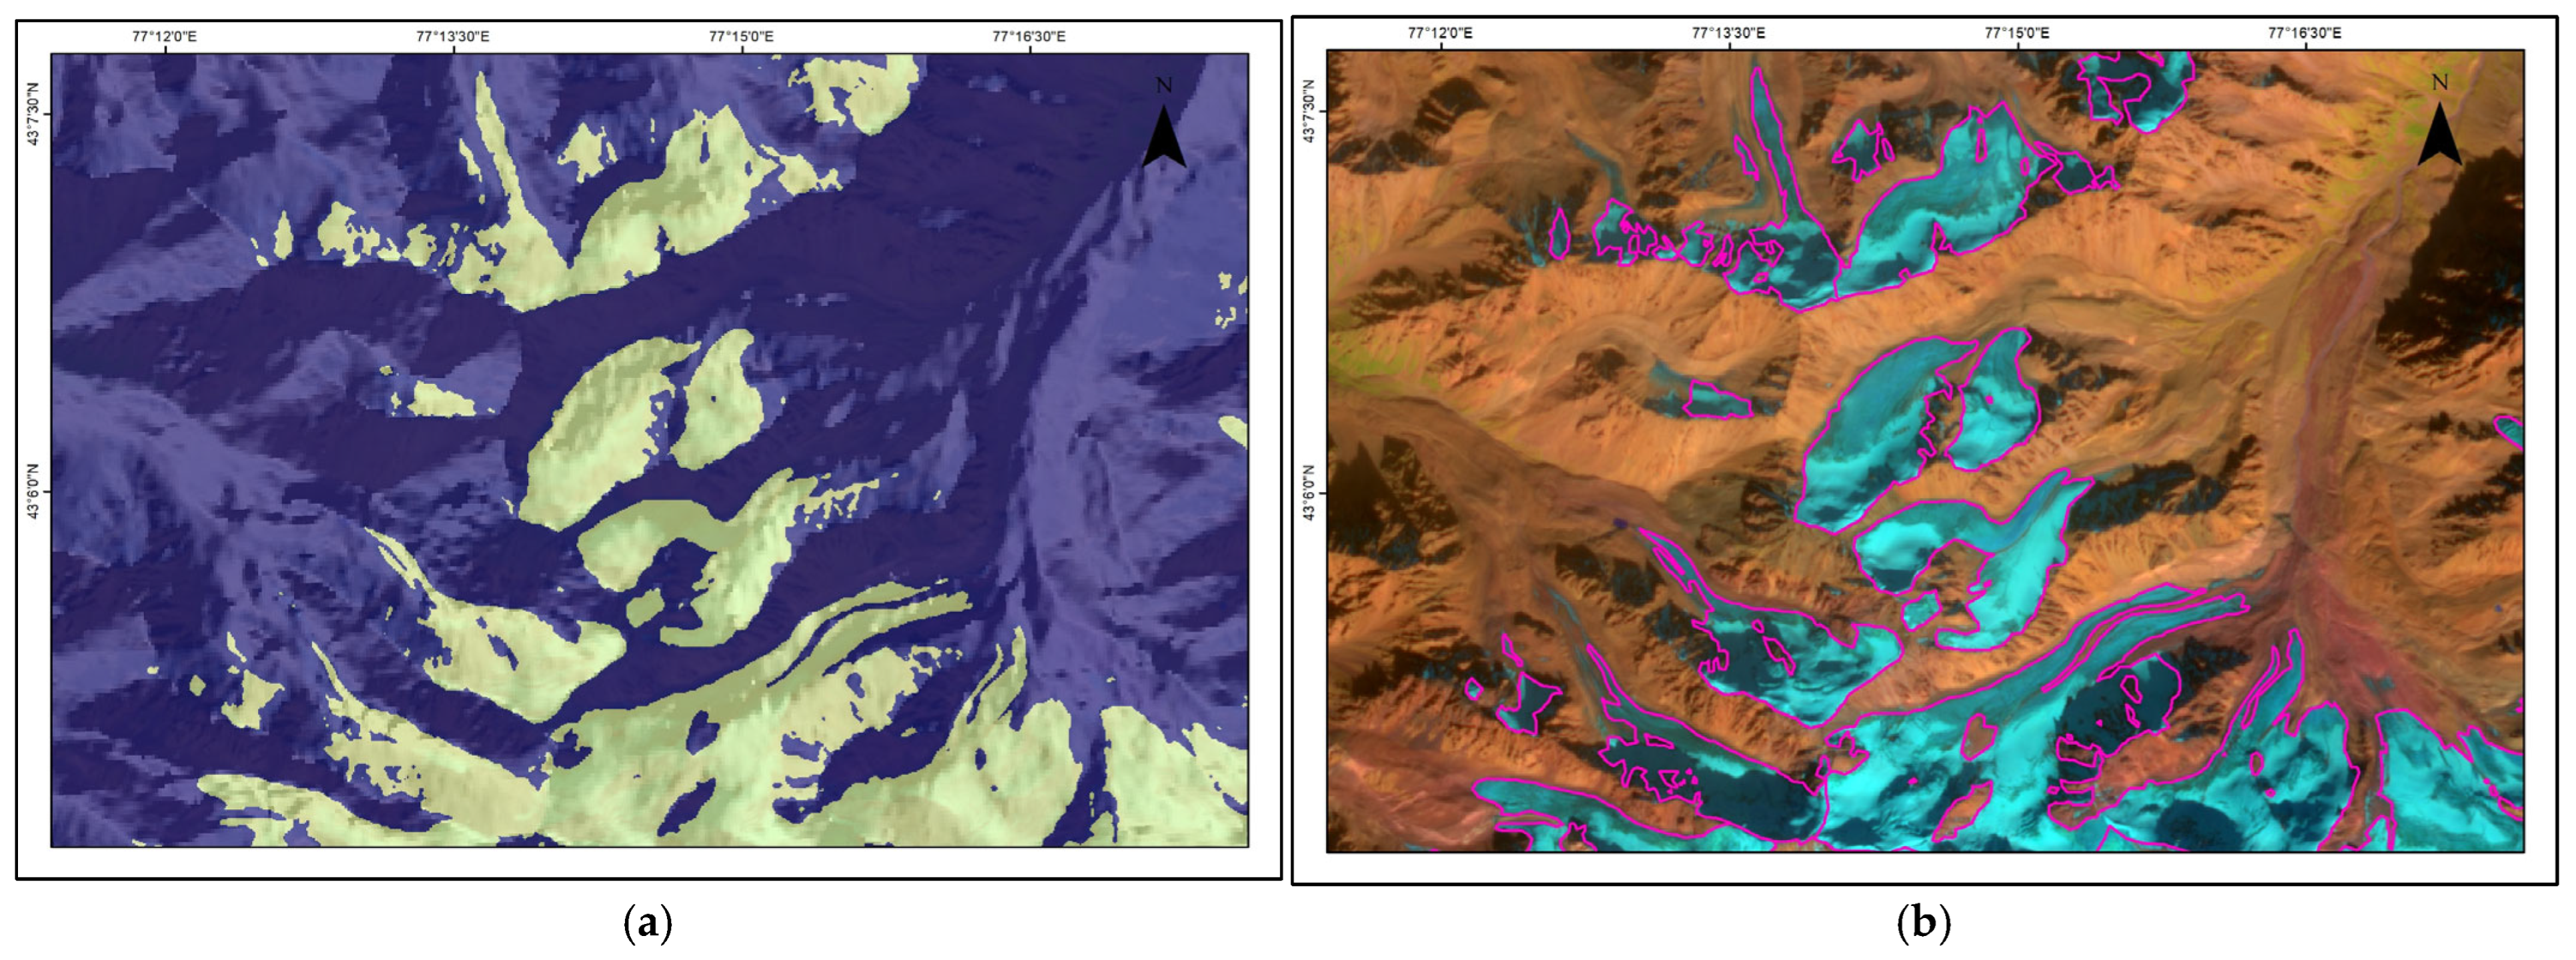
Therefore, for this study, glacier boundaries were refined using band ratio techniques applied to spectral data from Landsat ETM+, Landsat 8 OLI, and Sentinel-2 imagery. The selected ratios—3/5 (0.63–0.69 µm/1.55–1.75 µm) for Landsat ETM+, 4/6 (0.64–0.67 µm/1.57–1.65 µm) for Landsat 8 OLI, and 4/11 (0.665 µm/1.61 µm) for Sentinel-2—were chosen to maximize the spectral contrast between glacier ice and the surrounding landscape in the near-infrared (NIR) and shortwave infrared (SWIR) ranges (Figure 3a). Optimal threshold values for image binarization were empirically determined through iterative testing, with a range of 1.5–2.7 found to yield the most reliable separation of glacier ice from adjacent terrain. A 3 × 3 median filter was then applied to reduce noise and remove small, misclassified features.
Following this automated processing, the resulting raster datasets were converted to vector format and subjected to detailed manual refinement using high-resolution imagery (Figure 3b). This stage involved correcting errors arising from shadows, debris cover, and cloud contamination. This method has been widely tested and successfully applied in previous glacier mapping studies [57,58]. The combined application of spectral classification and targeted manual editing proved particularly effective for the complex topography and heterogeneous glacier cover of the study area, producing high-accuracy glacier outlines suitable for robust temporal change analysis and long-term monitoring.
Further, the area calculation of each glacier was done using ArcGIS Desktop software (version 10.8.2) to observe the changes between different periods. Ultimately, the percentage change for each glacier was calculated to observe the variability in the glacier area for the study period.

3.2.3. Glacial Lake Mapping and Change Analysis

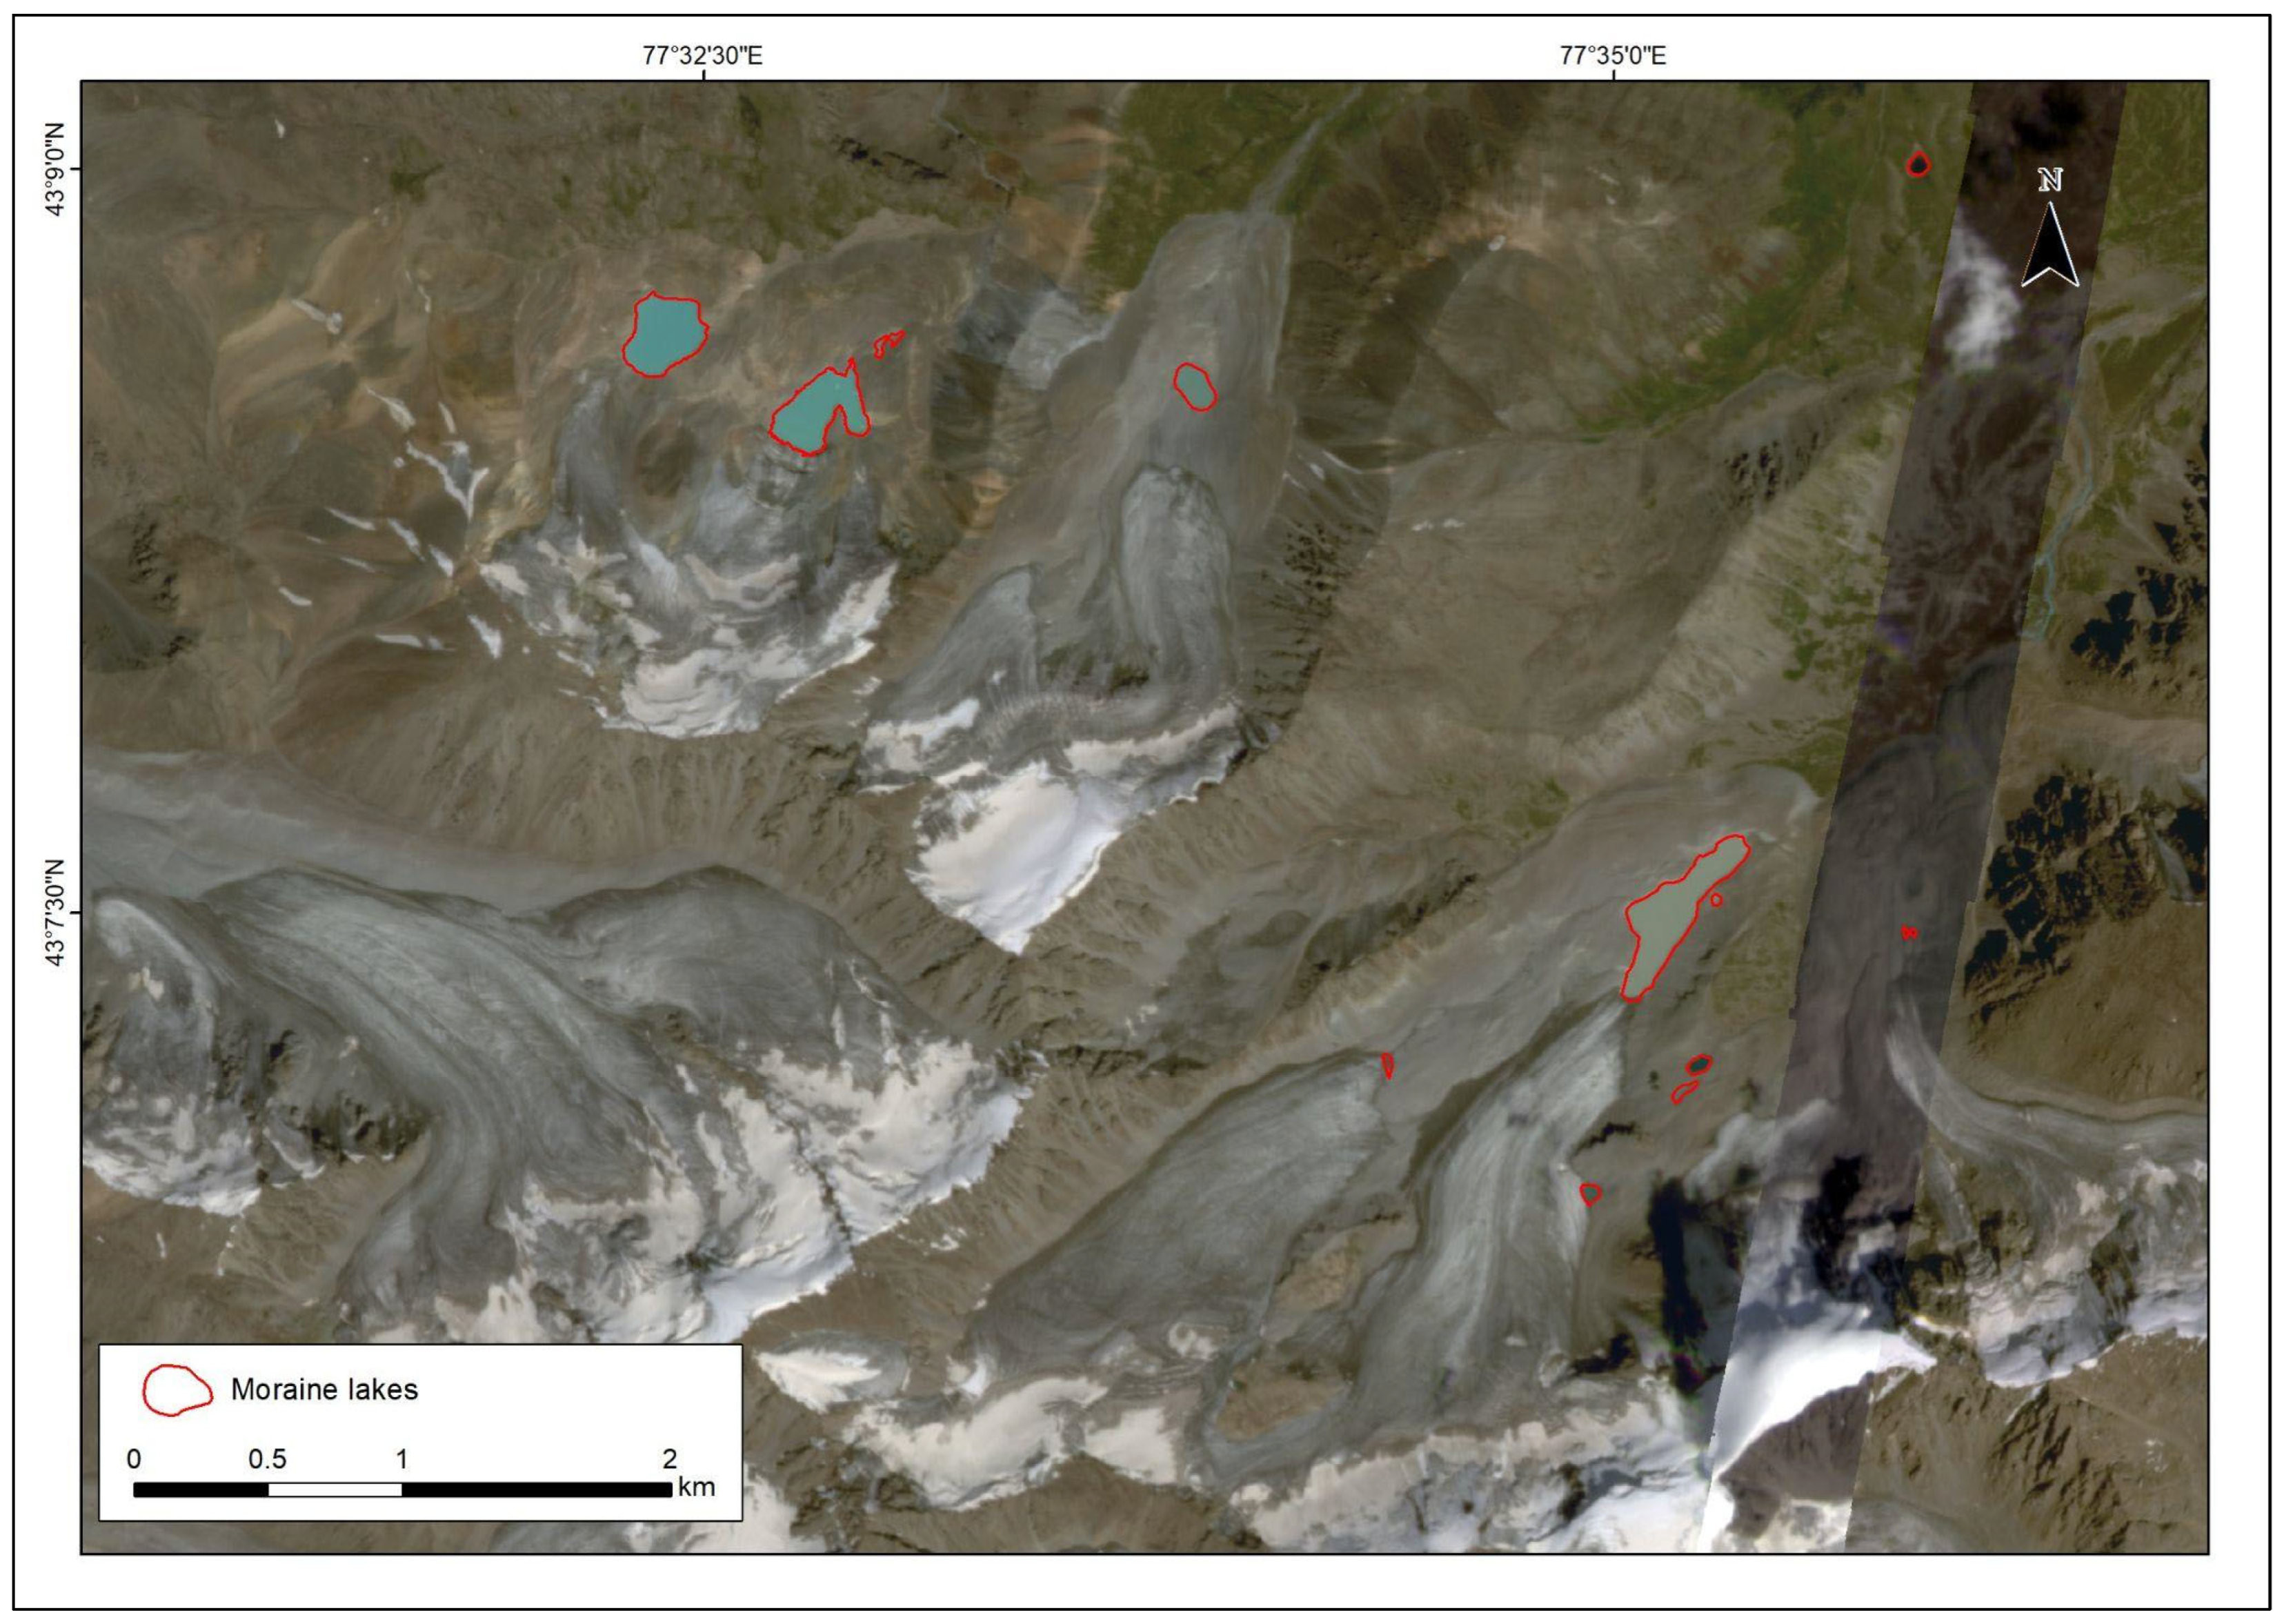
Glacial lakes were identified and mapped using high-resolution satellite imagery from PlanetScope and Sentinel-2. To ensure accurate delineation of lake boundaries, a combination of band ratios, spectral indices, and visual interpretation techniques was applied. The NDWI was primarily used to distinguish water bodies from the surrounding landscape, owing to its proven effectiveness in identifying surface water in satellite imagery (Figure 4).
To identify the optimal threshold for NDWI, we performed an iterative process comparing the spectral signature of known water bodies with various NDWI thresholds [59]. Furthermore, the NDWI threshold for each lake and each year was further refined using the Otsu method [60], implemented in Google Earth Engine. This automated approach minimises within-class variance, removes subjectivity from threshold selection, and adapts to interannual and seasonal spectral variability [61]. The resulting thresholds ranged from 0.10 to 0.30, consistent with values previously reported for high-resolution datasets, including SPOT-5 and WorldView [62,63].
After thresholding, raster outlines of the water bodies were converted to vector polygons, enabling the calculation of lake areas. These polygons were then carefully reviewed and manually edited to eliminate misclassified regions, such as terrain shadows and non-lake features [64]. Additionally, a minimum area threshold of 10,000 m2 was set, whereby only water bodies exceeding this value were classified as potential moraine lakes, effectively excluding small, ephemeral, or unstable water features from the inventory. After the initial identification and delineation of glacial lakes, subsequent steps involved rigorous quality control and change analysis to ensure accuracy and track changes over time. After digitization of glacial lake boundaries, their numbers and areas were computed, and a comparative analysis was conducted to quantify changes in lake area over the study period.
The methodology outlined above ensures the derivation of three outputs, (i) hydro-climatic trends, (ii) glacier retreat rates, and (iii) glacial lake evolution, which together allow an integrated assessment of cryosphere–climate interactions in Ile-Alatau.

3.2.4. Assessment of the Accuracy of Determining the Boundaries of Glaciers and Moraine Lakes

To ensure correct interpretation of the results and a well-grounded assessment of their scientific significance, we performed a quantitative verification of glacier-mapping accuracy by combining two complementary approaches. First, we applied the buffer method [65,66,67], previously used in our work [32]. The buffer width was set to half of the estimated root mean square error (7.5 m on each side), which yielded an integral error estimate for the entire study region of ±5%.
Secondly, we carried out an independent uncertainty assessment using repeated manual delineation by a single analyst following the recommendations of [68]. This involved digitization of four representative glaciers manually five times (one session per day) from high-resolution reference data. This labour-intensive yet methodologically preferable approach provides a realistic, operator-specific quality estimate and reduces reliance on assumptions from the literature. The resulting mean areas from the manual delineation were compared with the values derived from automated processing of TM data (Table 4). The comparison showed a standard deviation ranging from 3.3–6.0%, with an average difference of 4.2%.
To assess the uncertainty in the determination of moraine lake areas, the method proposed by [62] was applied. This approach is based on the assumption of a Gaussian distribution of measurement errors. The number of pixels forming the lake boundary was calculated as the ratio of its perimeter (P) to the grid cell size (G) corresponding to the highest spatial resolution among the spectral bands used. The resulting value was then multiplied by a coefficient of 0.6872 (1σ) (Equation (1)), reflecting the probability that approximately 69% of pixels contain errors, and further multiplied by half of the pixel area (Equation (2)), assuming that the uncertainty of one pixel equals 0.5 of its area. The total uncertainty was obtained by summing these values. The formulas for the calculation are as follows:
Error(1σ) = P/G × G2/2 × 0.6872,
[Error]relative (%) = (Error (1σ))/A × 100,
In this study, to assess the uncertainty of moraine lake areas, 15 reference lakes identified from Sentinel-2 and PlanetScope data were selected. Based on the calculations, the average uncertainty values were 7.5% for Sentinel-2 and 2.1% for PlanetScope. The final results are presented in Table 5.
The conducted assessment showed that the level of moraine lake area uncertainty depends on the spatial resolution of the satellite data. The higher resolution of PlanetScope provides a lower error (2.1%) compared to Sentinel-2 (7.5%), confirming its advantage for detailed mapping of small and medium-sized lakes.

4. Results

4.1. Temporal Dynamics of Hydro-Climatic Variables

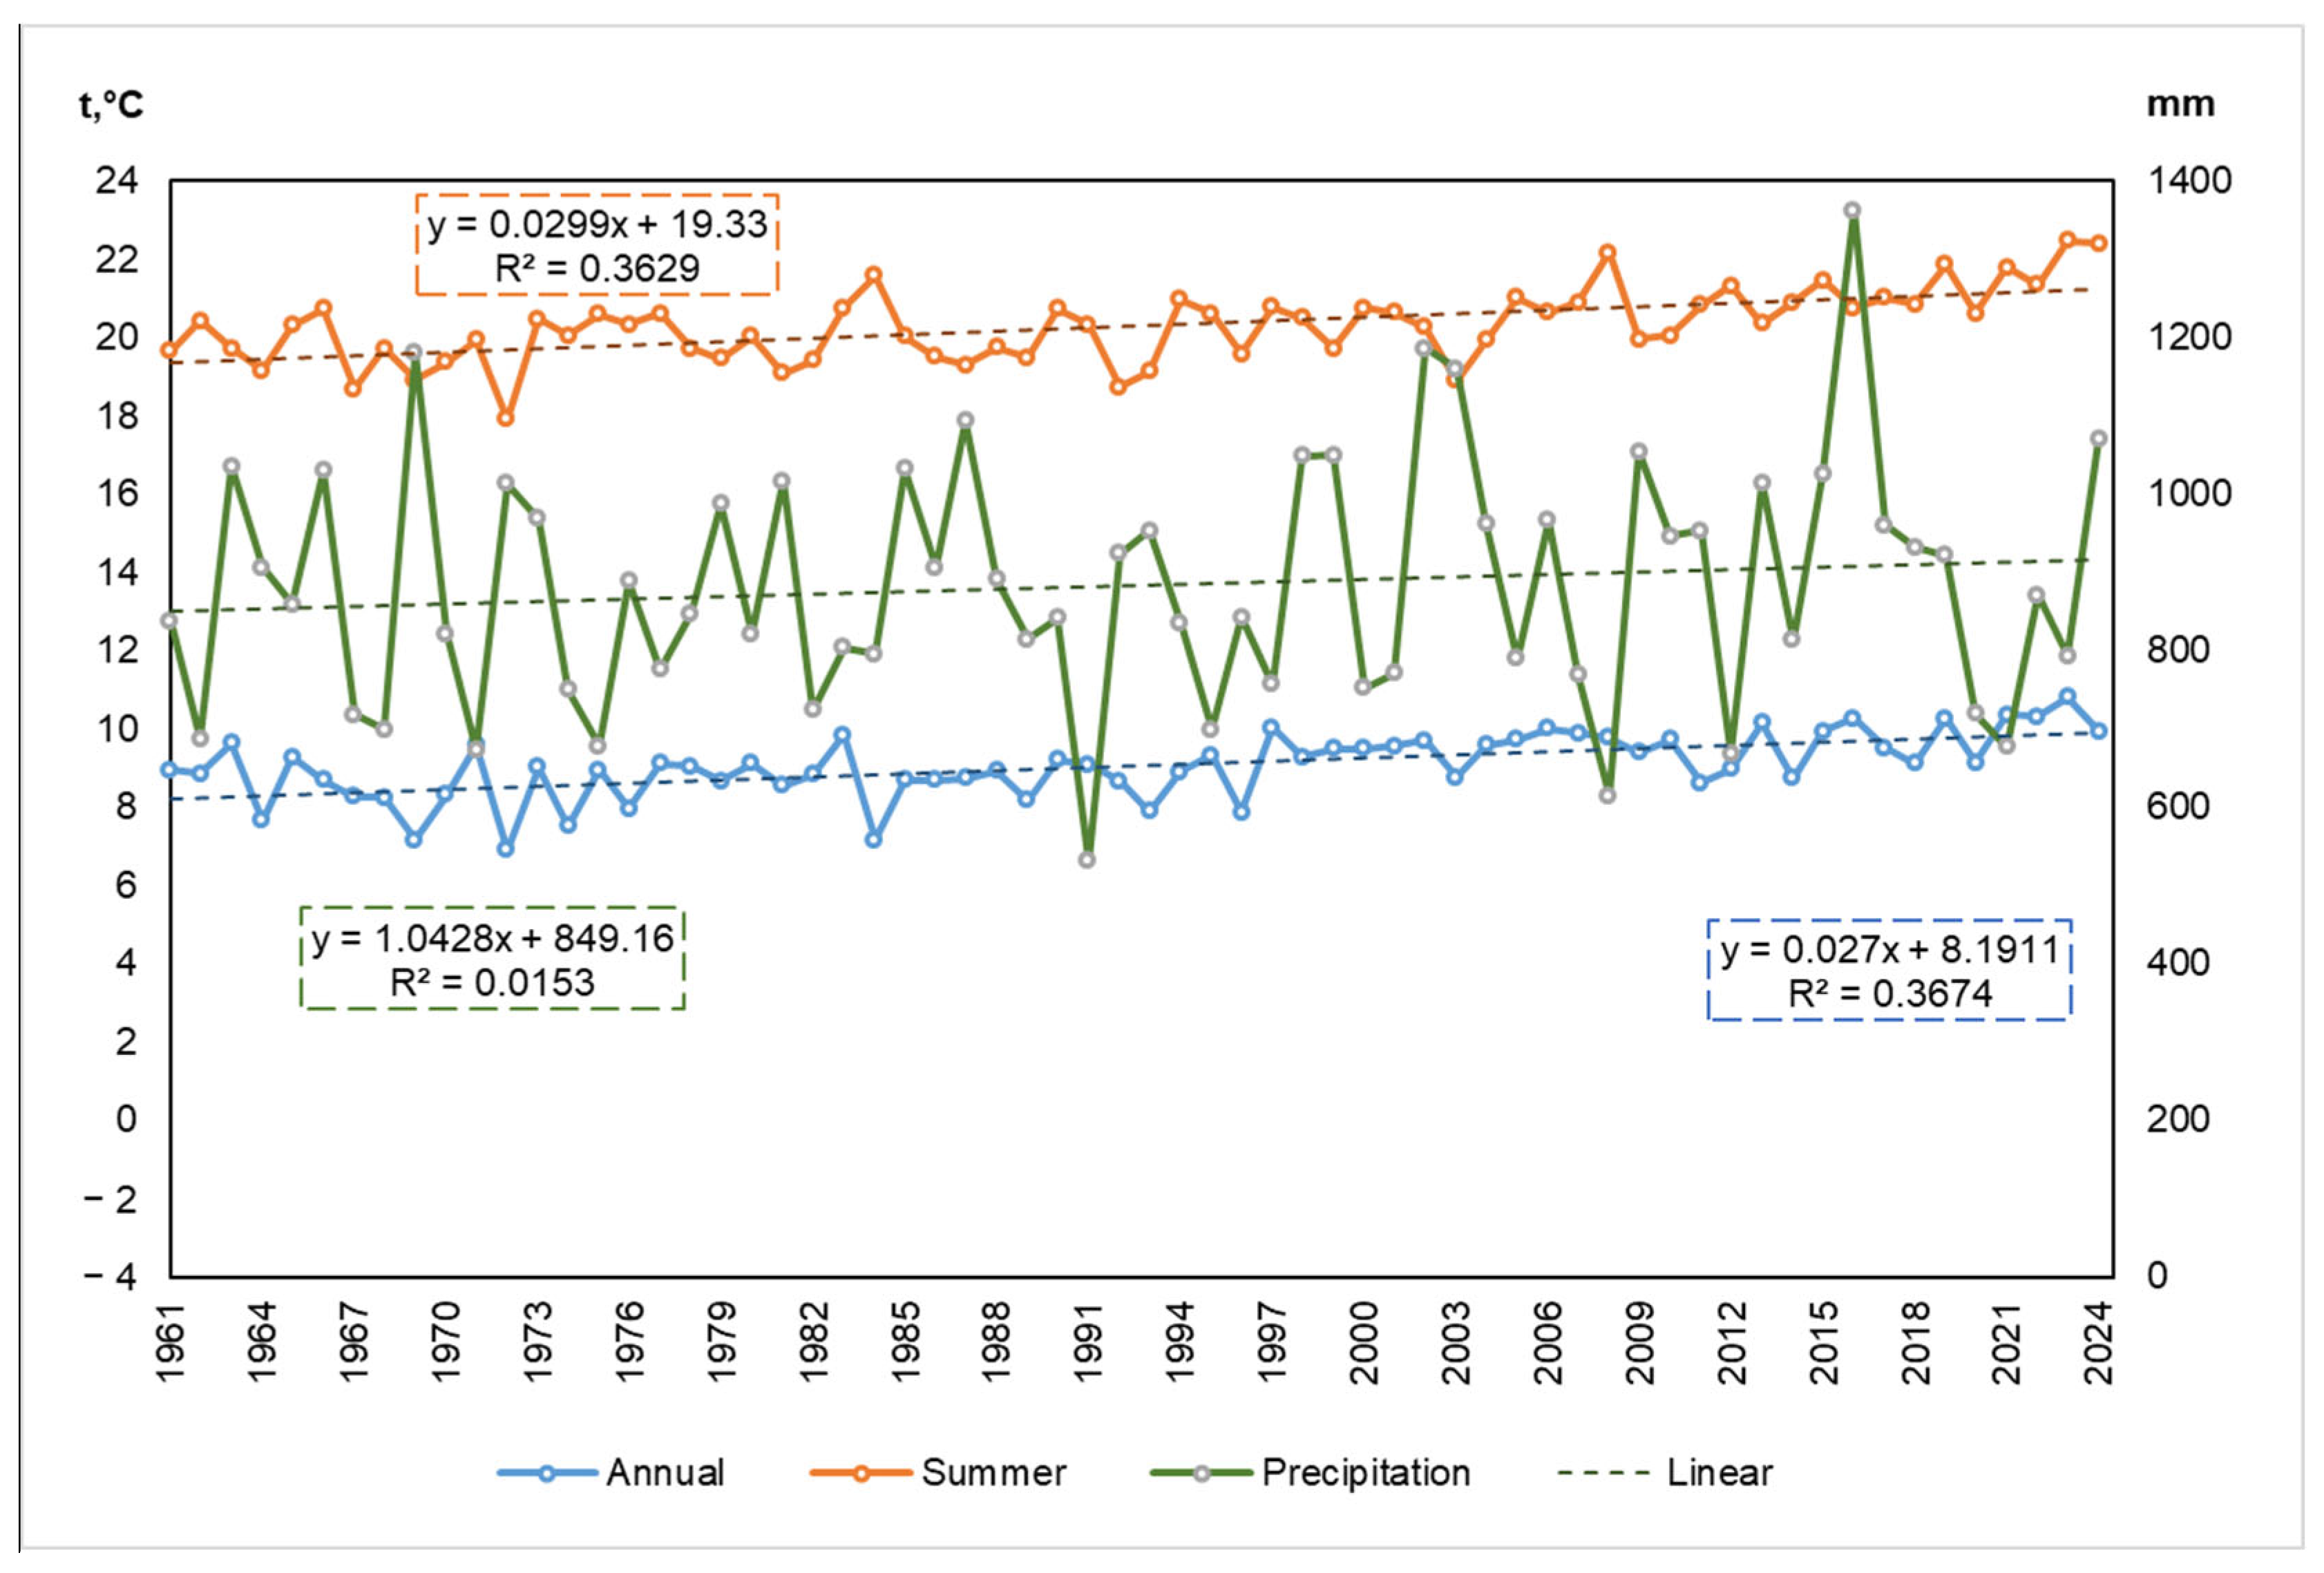
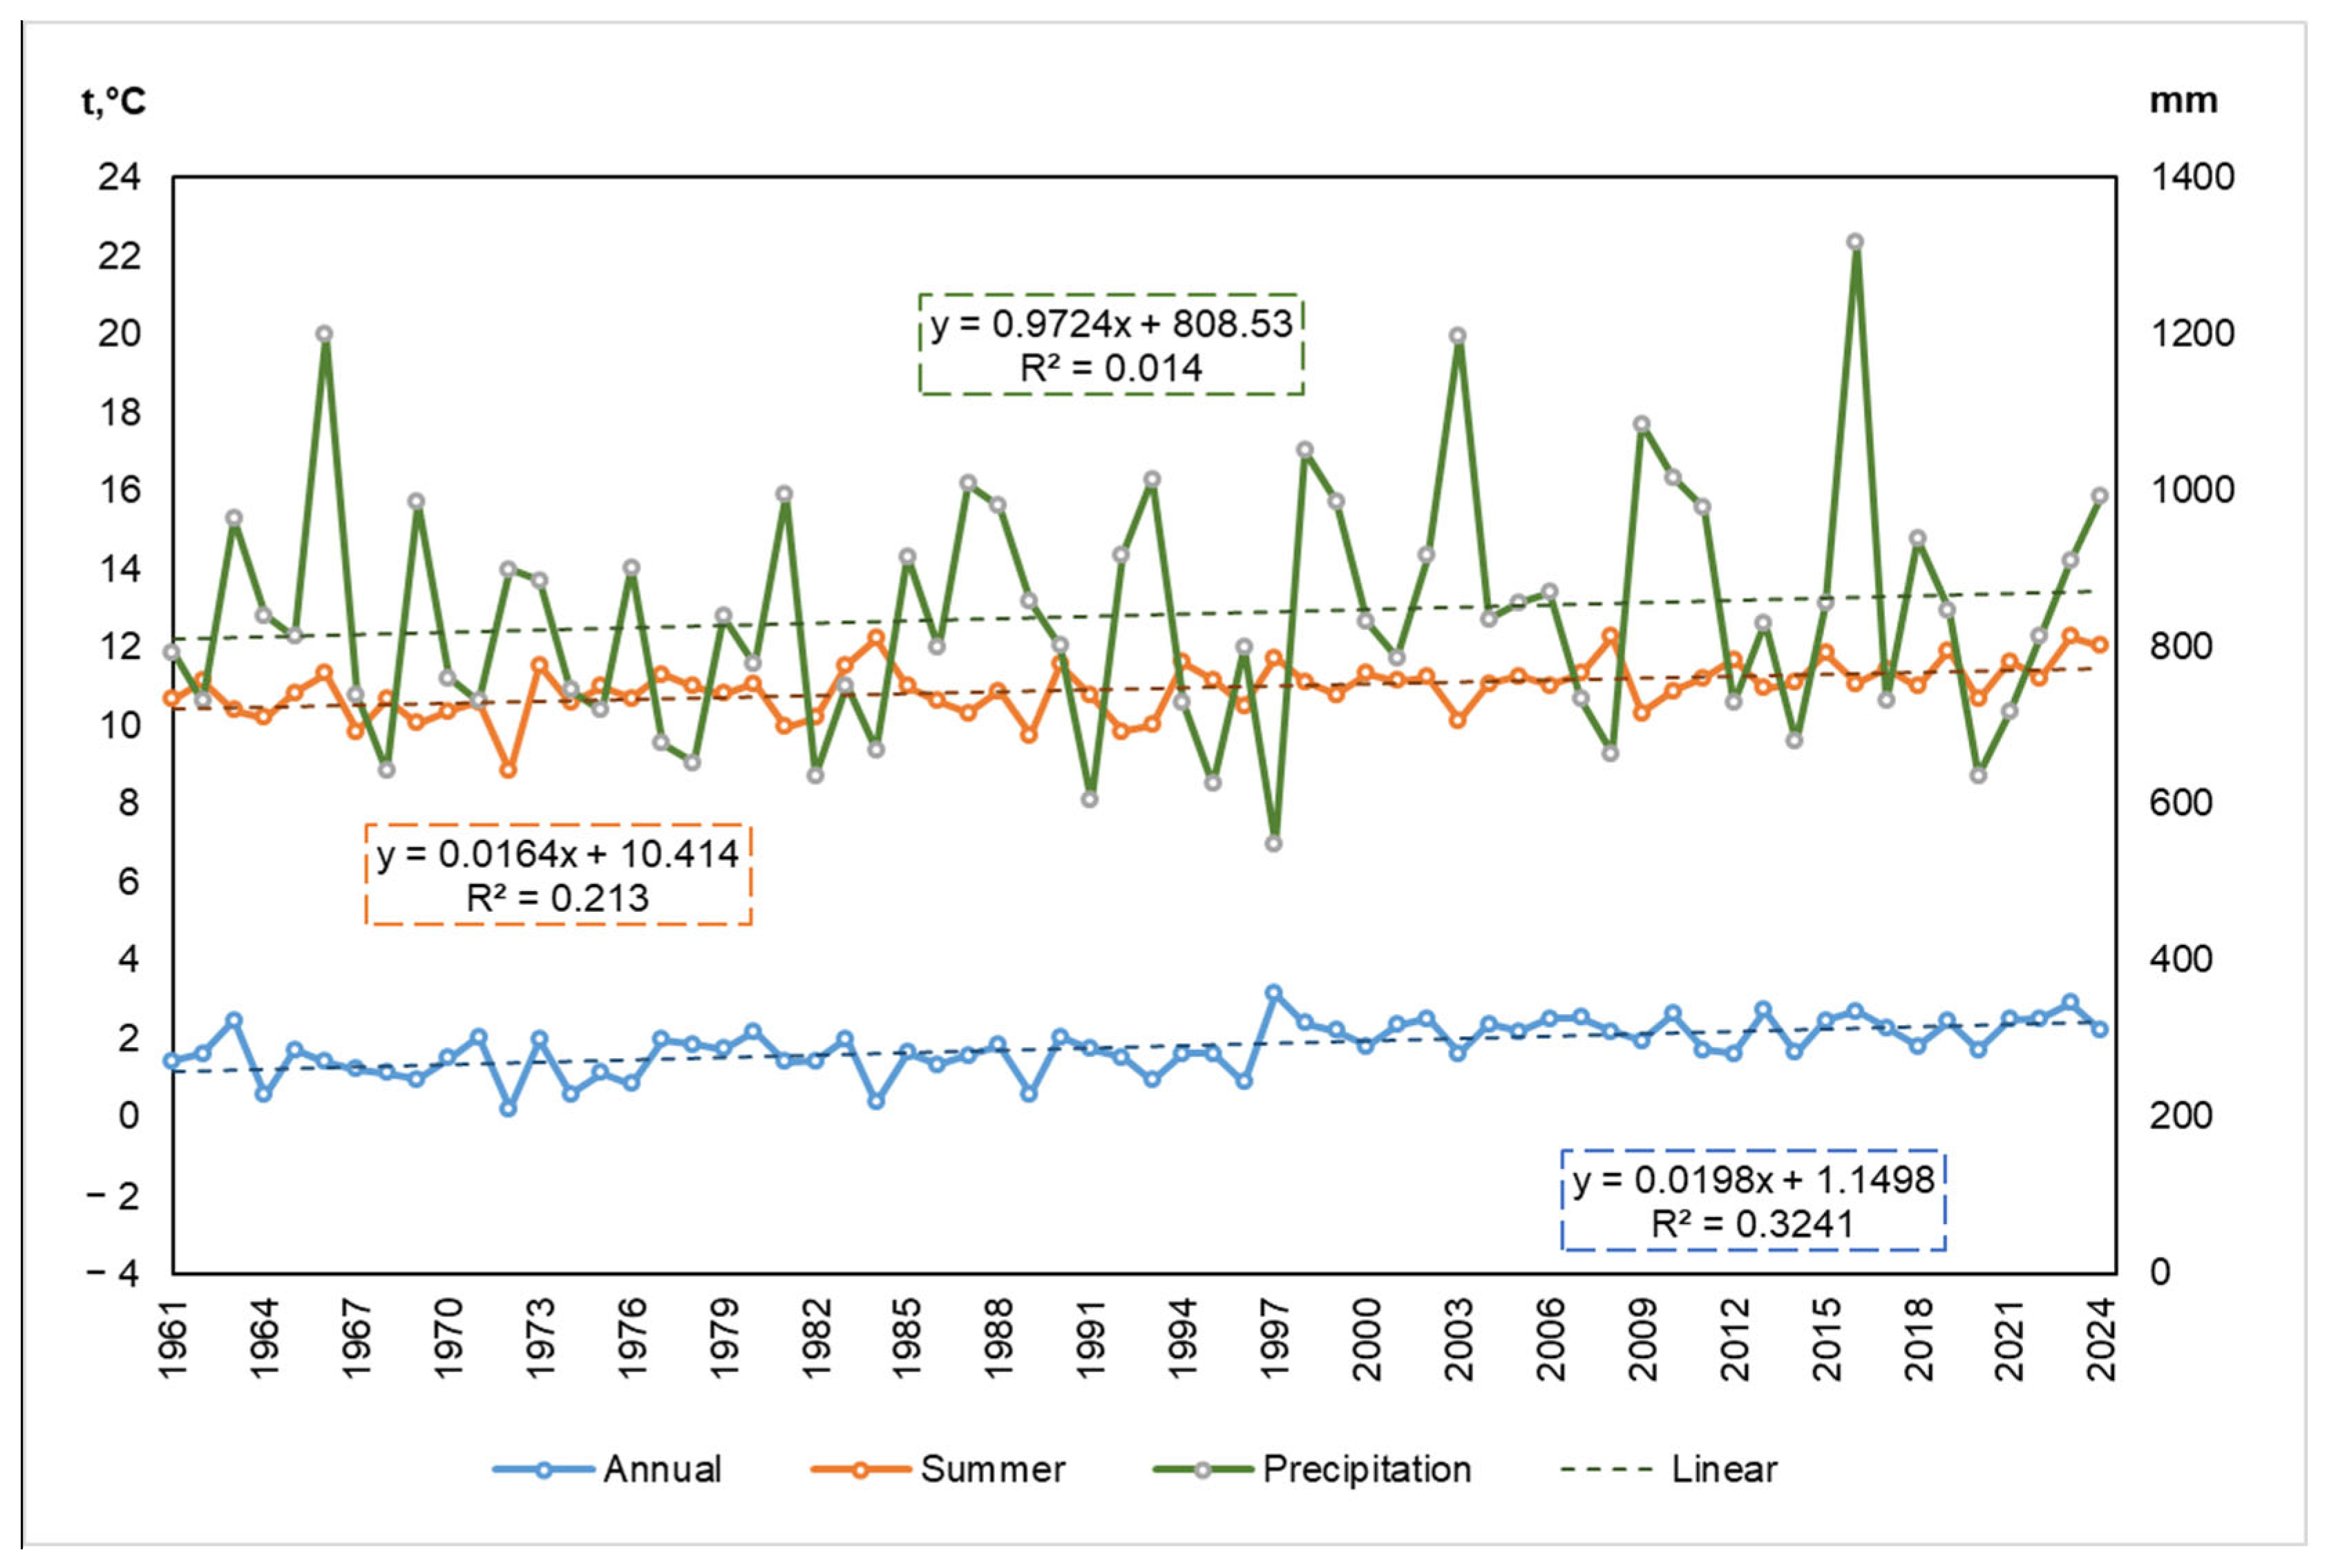
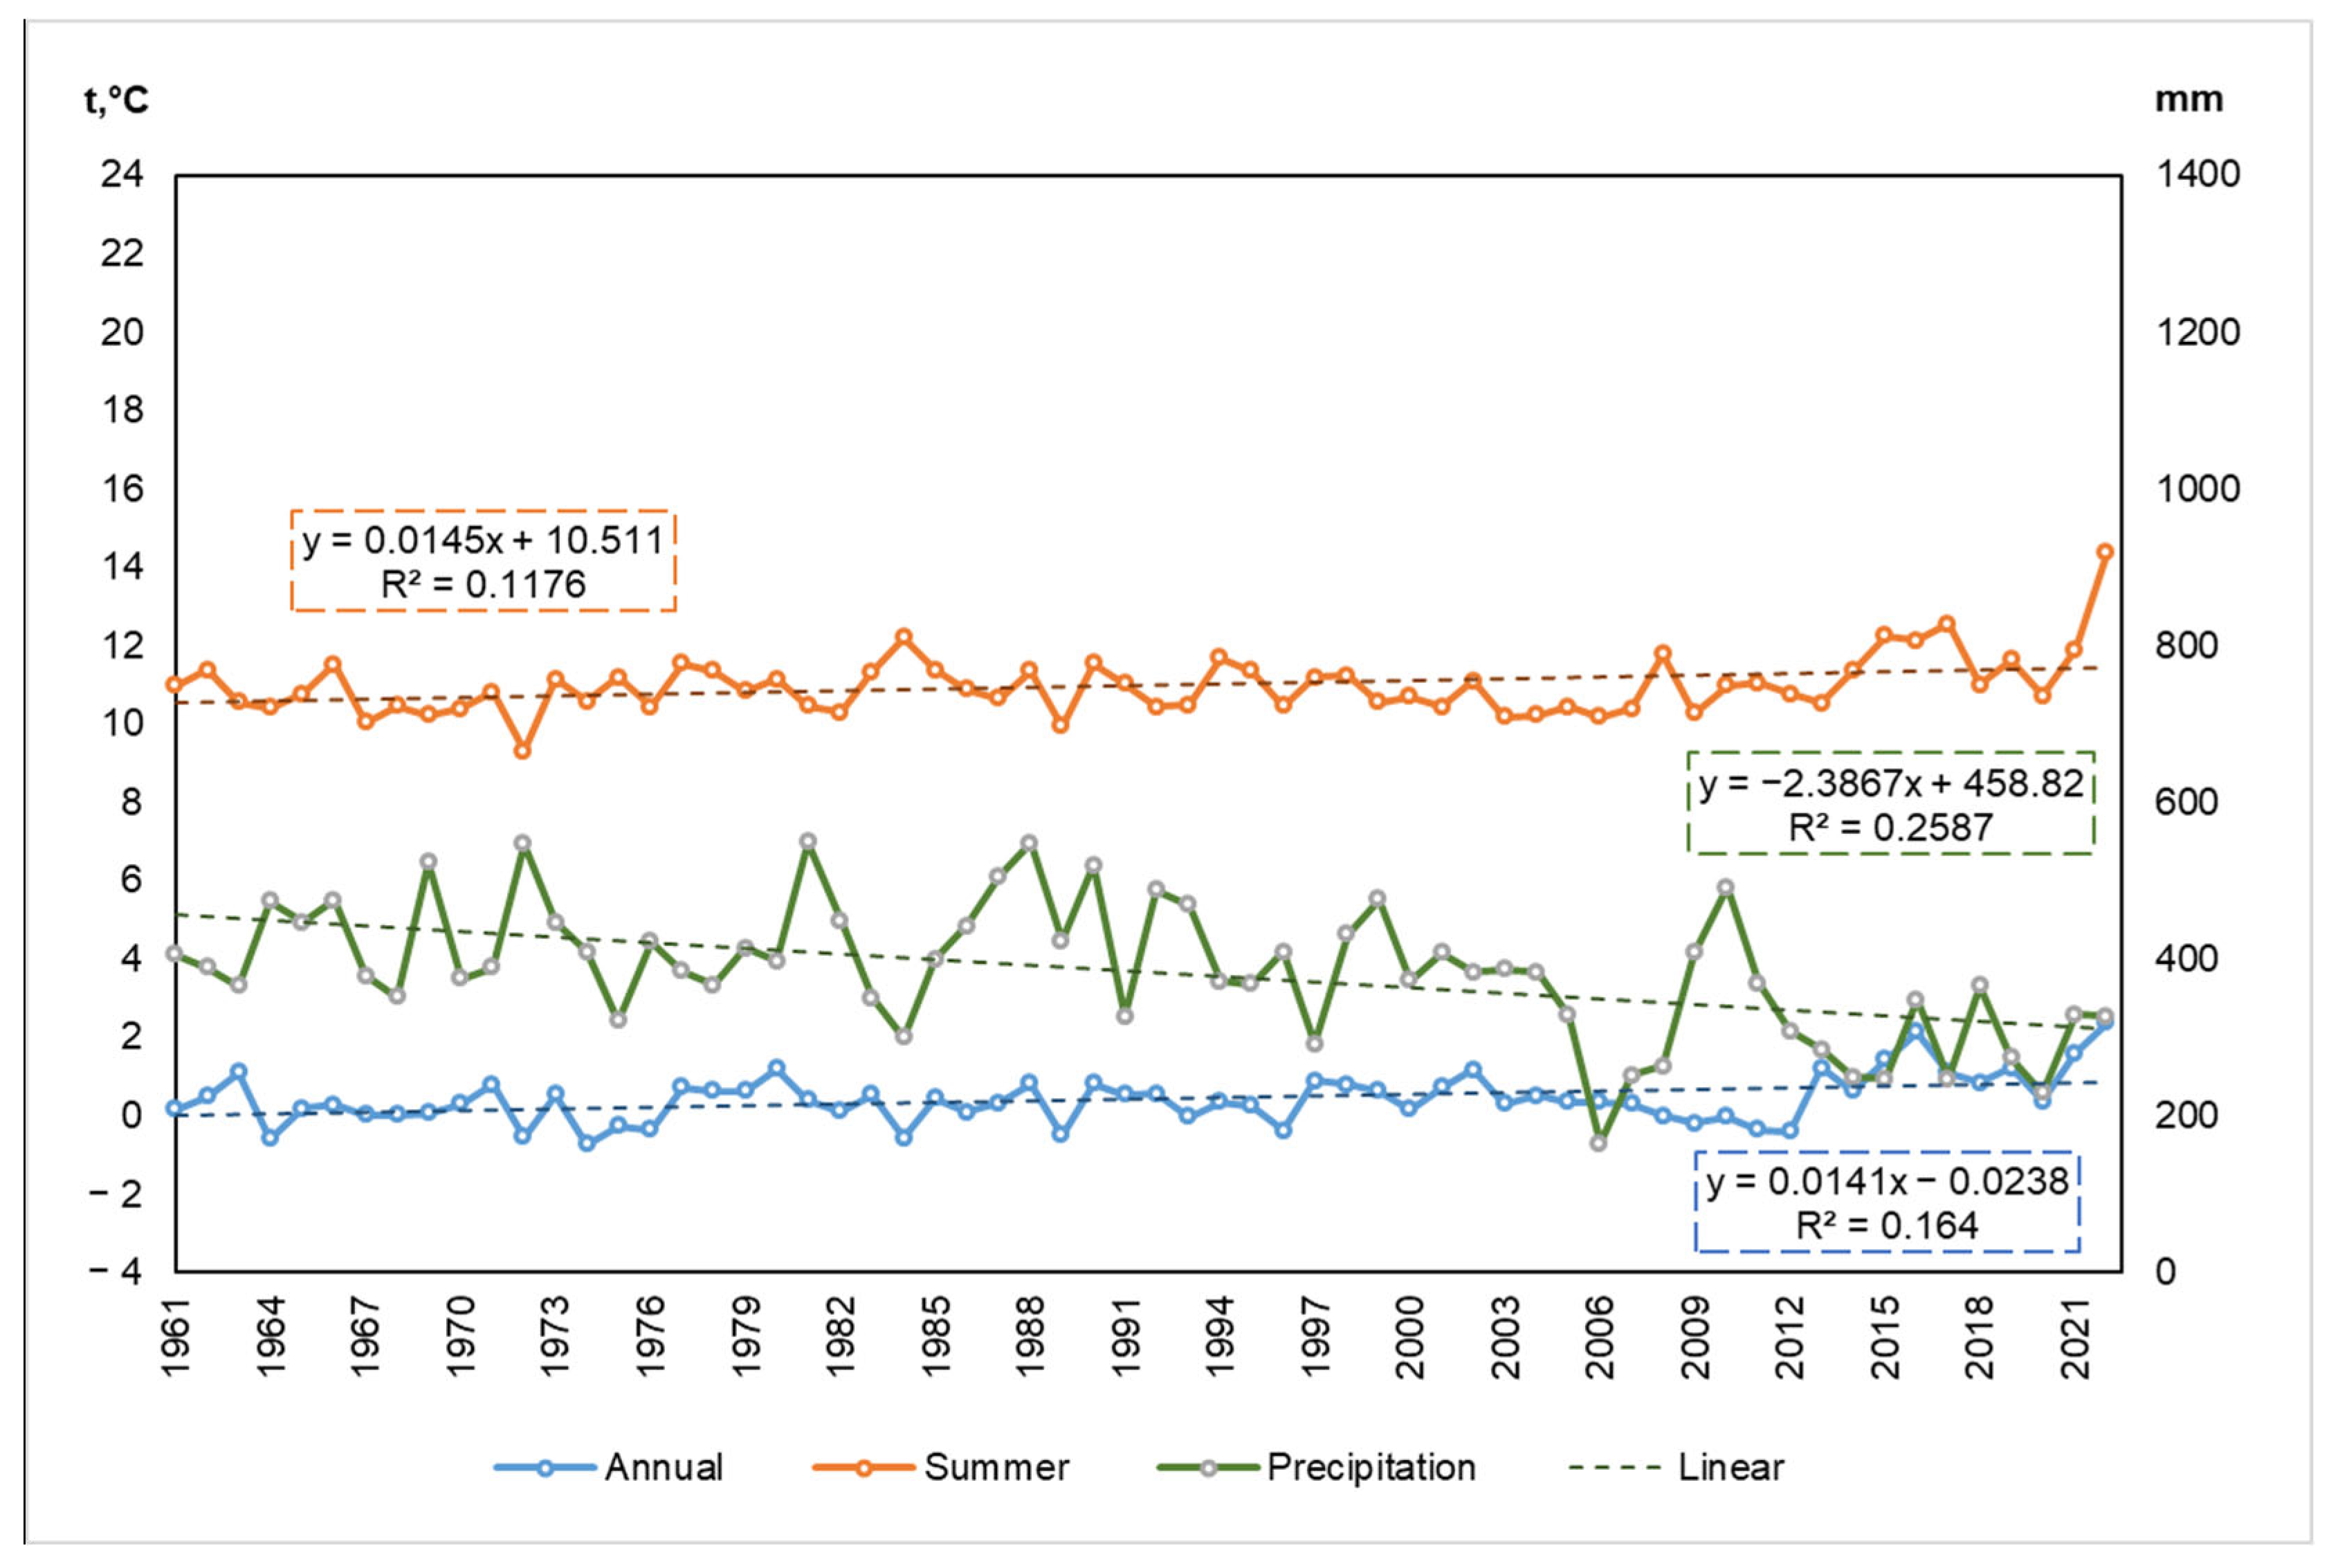
Long-term hydro-climatic records from four meteorological stations, Kamenskoe Plateau, Ulken Almaty Lake, Mynzhylky, and Assy were analyzed to evaluate temperature and precipitation dynamics in the Ile-Alatau region for the period 1961–2024. Linear regression and non-parametric Mann–Kendall trend tests were applied to annual, summer (June, July, August and September), and monthly time series to identify significant changes. Figure 5, Figure 6, Figure 7 and Figure 8 illustrate station-wise temporal variability, while Table 6 and Table 7 summarize statistical significance for temperature and precipitation trends, showcasing changes in annual temperature and variability in precipitation patterns, which are critical factors influencing glacier dynamics in the region.
A general warming trend was observed across all the meteorological stations installed in the region, with the most pronounced increase observed during the summer months, directly impacting glacier melt rates. Data from the Kamenskoe Plateau station reveal a consistent increase in both average 0.27 °C per decade annual and summer temperatures at a rate of 0.30 °C per decade for the period 1961–2023 (Figure 5). Similarly, the Ulken Almaty Lake station recorded an increase in summer temperatures by 0.16 °C per decade and average annual temperatures by 0.20 °C per decade between 1961 and 2023 (Figure 6). A more significant warming trend was observed at Mynzhylky station, where the average annual temperature increased by 0.28 °C per decade and the summer temperature by 0.27 °C per decade over the same period (Figure 7). In contrast, the Assy station showed a relatively slight increase, with average annual temperature rising by 0.14 °C per decade and summer temperature by 0.15 °C per decade (Figure 8). Overall, the analysis of long-term meteorological data consistently indicates a general increase in average annual and summer temperatures across the study area since 1961.
To objectively quantify these temperature changes, the non-parametric Mann–Kendall test was applied to monthly, seasonal, and annual series. The results revealed statistically significant warming at all stations, most pronounced during summer and in the annual temperature data. September, a key month for late-season glacier ablation, also showed significant warming (Z-statistic > 3.0, p < 0.01), indicating a likely extension of the melt season and an acceleration of glacier mass loss. For instance, the Z-statistics for summer temperatures exceeded 3.0 at all stations, with associated p-values well below 0.01, indicating robust significance. The strongest trend was observed at Mynzhylky, where annual temperature trends showed Z = 5.98 (p < 0.00001), followed closely by Kamenskoye Plateau and Ulken Almaty Lake (Table 6). These results underscore a clear extension of the melt season, with direct implications for accelerated glacier mass loss.
In contrast to temperature, precipitation generally showed stable or slightly decreasing trends, characterized by substantial inter—annual variability. Despite significant year-to-year fluctuations in annual precipitation amounts at Kamenskoe Plateau, the linear trend remained virtually unchanged, indicating no statistically significant changes in annual precipitation levels over the study period (Figure 5). At the Ulken Almaty Lake station, annual precipitation varied greatly, but the overall trend indicated a very slight increase (Figure 6). Similarly, annual precipitation at Mynzhylky varied considerably by year, yet the overall trend remained relatively stable, showing no significant changes (Figure 7). Conversely, the Assy station recorded a downward trend in annual precipitation of 0.25 mm per decade, with its precipitation record displaying high variability and a clear decrease since the 2000s (Figure 8). Thus, across the stations, annual precipitation generally demonstrated either a stable trend or a slight decrease, coupled with considerable inter-annual variability.
These precipitation patterns stand in clear contrast to the temperature records, which exhibited more consistent and statistically robust trends. The Mann–Kendall analysis of precipitation (Table 6) confirmed these observations. At Kamenskoye Plateau, Ulken Almaty Lake, and Mynzhylky, the test indicated no statistically significant changes, consistent with the visual analysis of linear trends. In contrast, the Assy station exhibited significant negative trends in both summer and annual precipitation. Z-statistics for June and July were −2.84 and −2.76, respectively (p < 0.01), while the annual precipitation trend demonstrated even stronger significance (Z = −3.97; p < 0.001), confirming a pronounced drying tendency in recent decades (see Table 6).
The observed temperature and precipitation trends indicate an asymmetric climatic change in the region, with pronounced warming at all stations, most intense at higher elevations (Mynzhylky) and in late summer (September). While precipitation trends had high variability, however, they were generally stable, except for significant decline at Assy meteorological station. This imbalance between sustained warming and relatively unchanged (or declining) precipitation has critical implications for glacier dynamics. Enhanced summer and September warming likely prolongs the melt season, while the lack of compensating increases in precipitation reduces the potential for glacier mass replenishment. Together, these trends create conditions that accelerate glacier recession and favor the formation and expansion of glacial lakes in the Ile-Alatau range.

4.2. Glacier Area Change

Changes in glacier area serve as a critical indicator of climate change, with significant impacts on regional ecological and hydrological systems. Analysis of these changes provides a deeper understanding of processes occurring under changing climatic conditions and their environmental consequences.
Multi-epoch glacier inventories derived from aerial photographs (1955), Landsat (1999, 2014) and Sentinel-2 imagery (2021) reveal a consistent and accelerating reduction in glacierized area over the past seven decades. Table 8 highlights the aggregate size of glaciers observed in the different river basins of Ile Alatau mountain range during the study period. The same table also mentions the overall change from the baseline year of 1995, as well as the percentage change by period. According to the aerial photography-based glacier inventory conducted in 1955, the region had 307 glaciers, covering a total area of 269.6 km2. By 1999, the number of glaciers had decreased to 282, and their total area was 202.7 ± 8.51 km2. The trend intensified between 1999 and 2014, when glacierized area decreased to 152.9 ± 6.42 km2 (−24.6%), and by 2021 only 219 glaciers remained, occupying 141.7 ± 5.95 km2, a cumulative loss of 47.4% since 1955. The mean annual rate of reduction increased from roughly 0.6% yr−1 (1955–1999) to 1.6% yr−1 (1999–2014), confirming an acceleration of ice loss in the early twenty-first century.
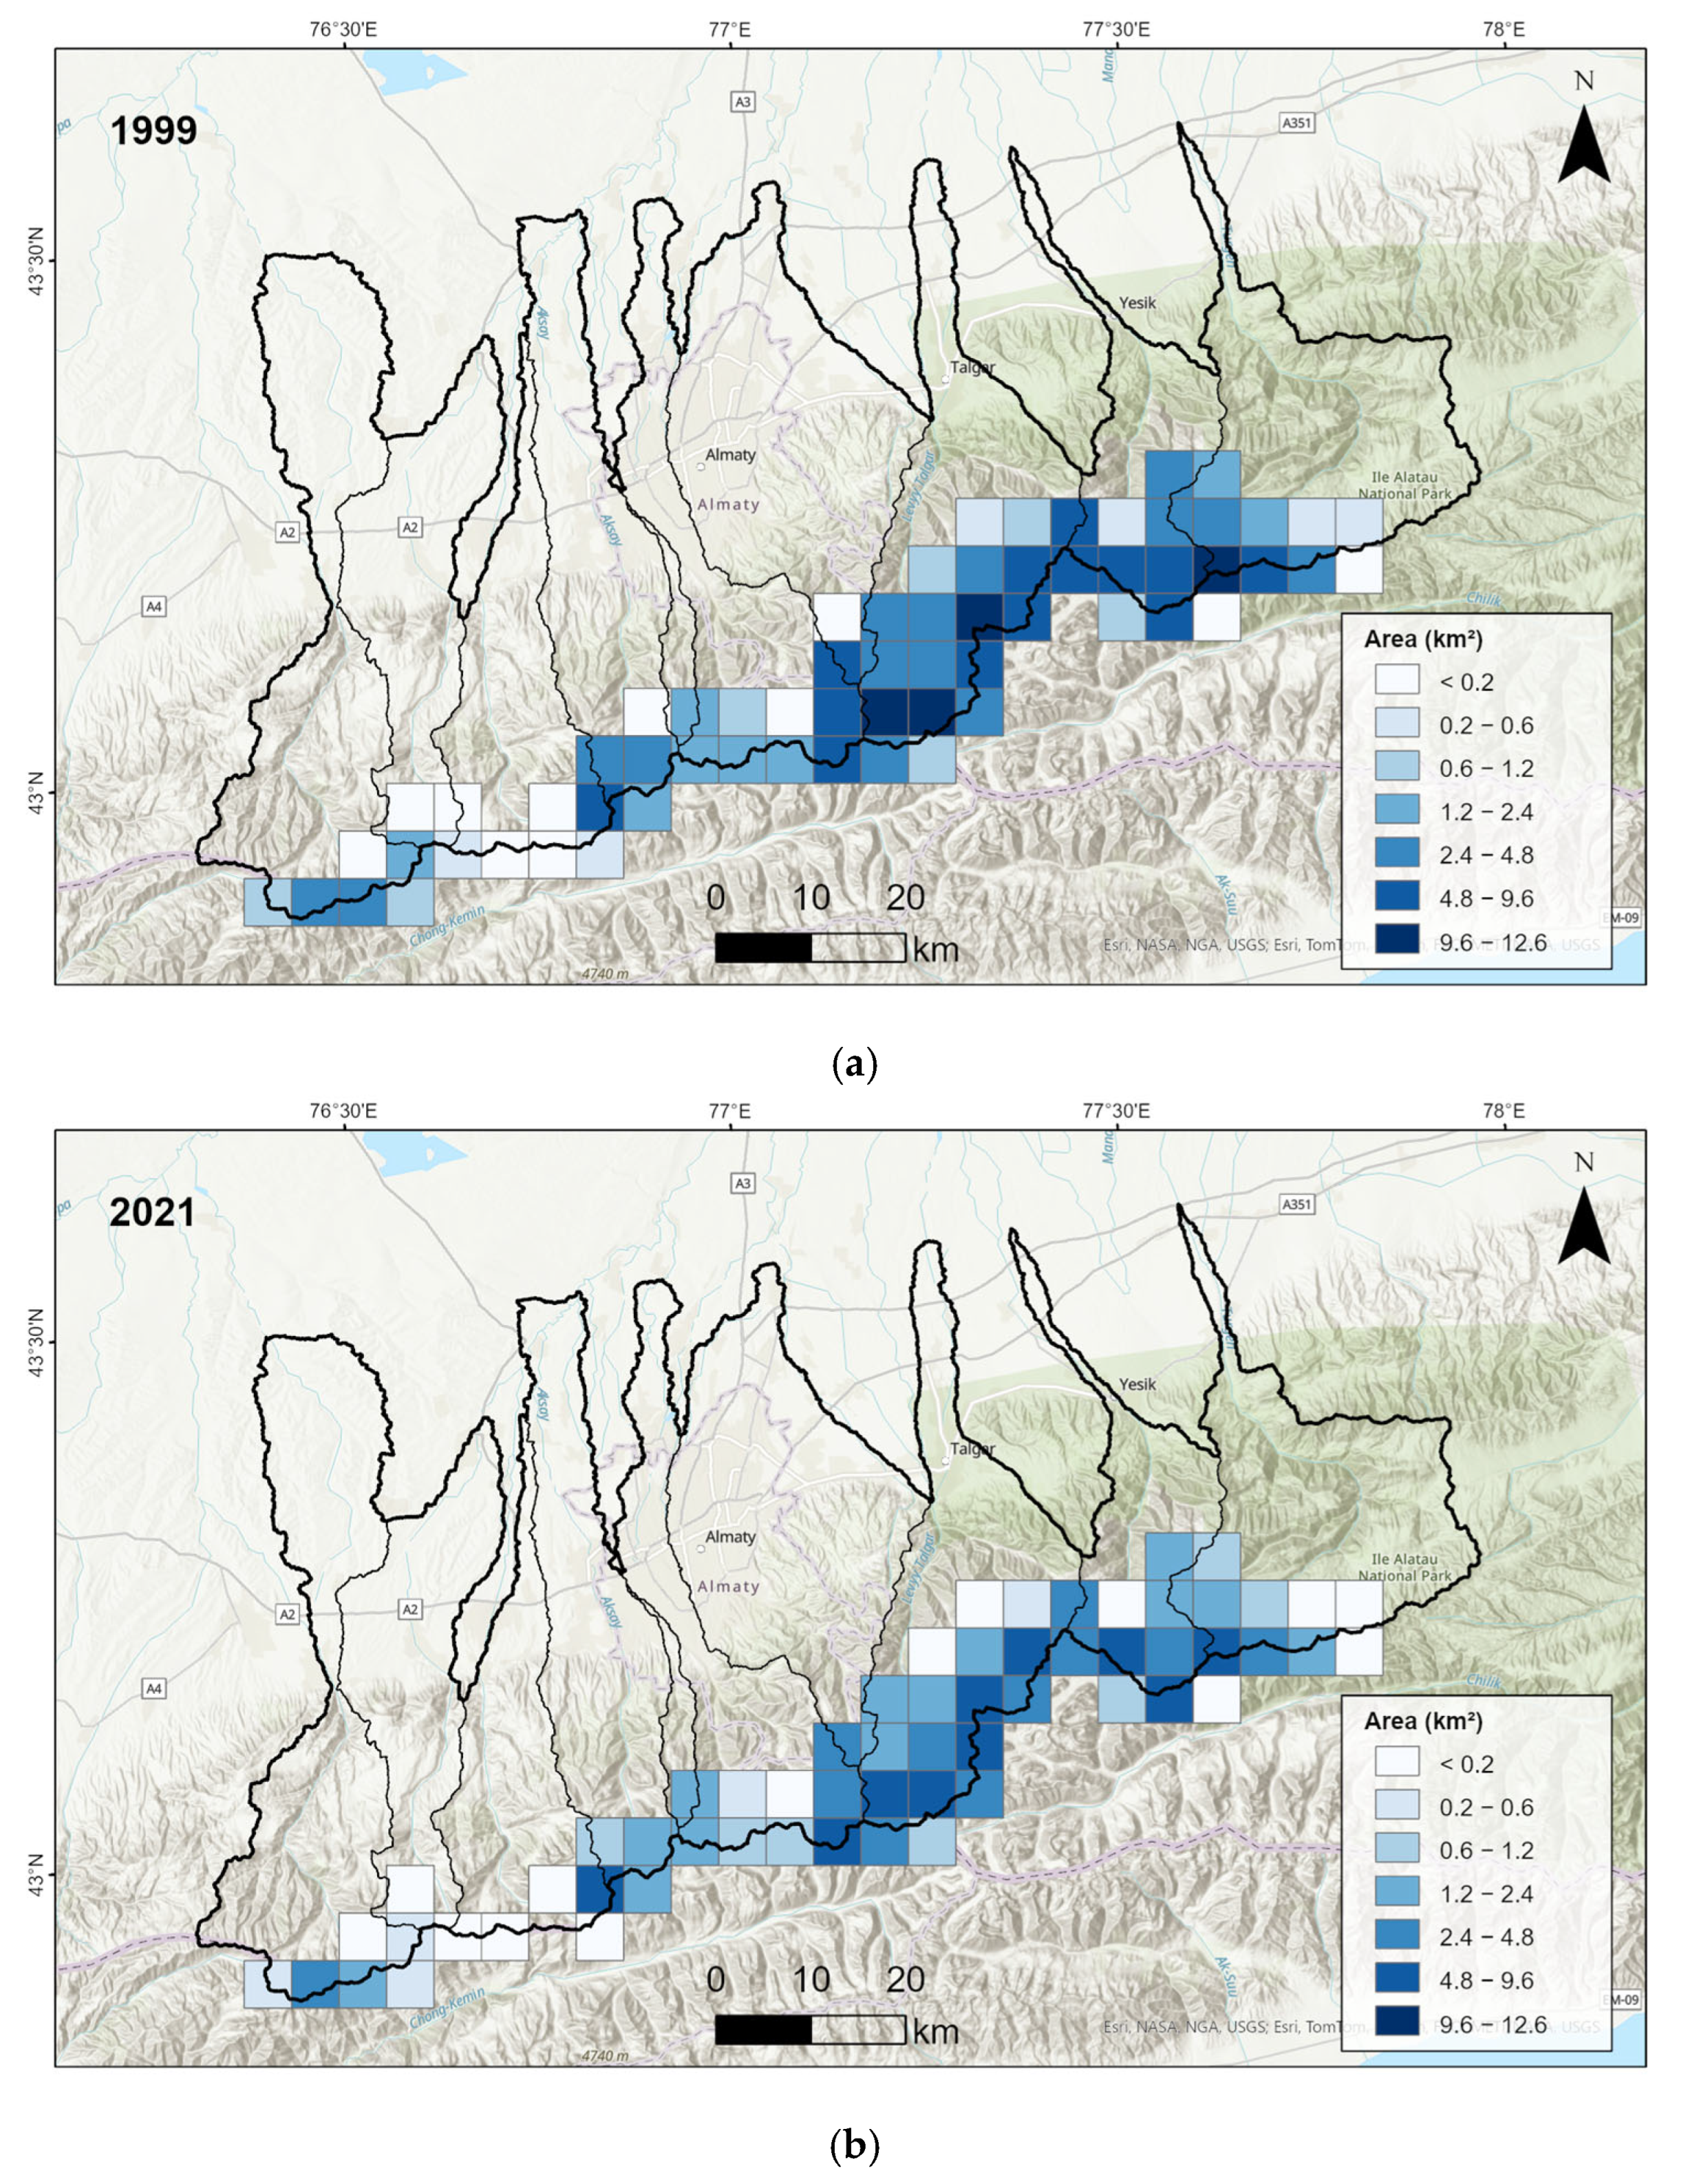
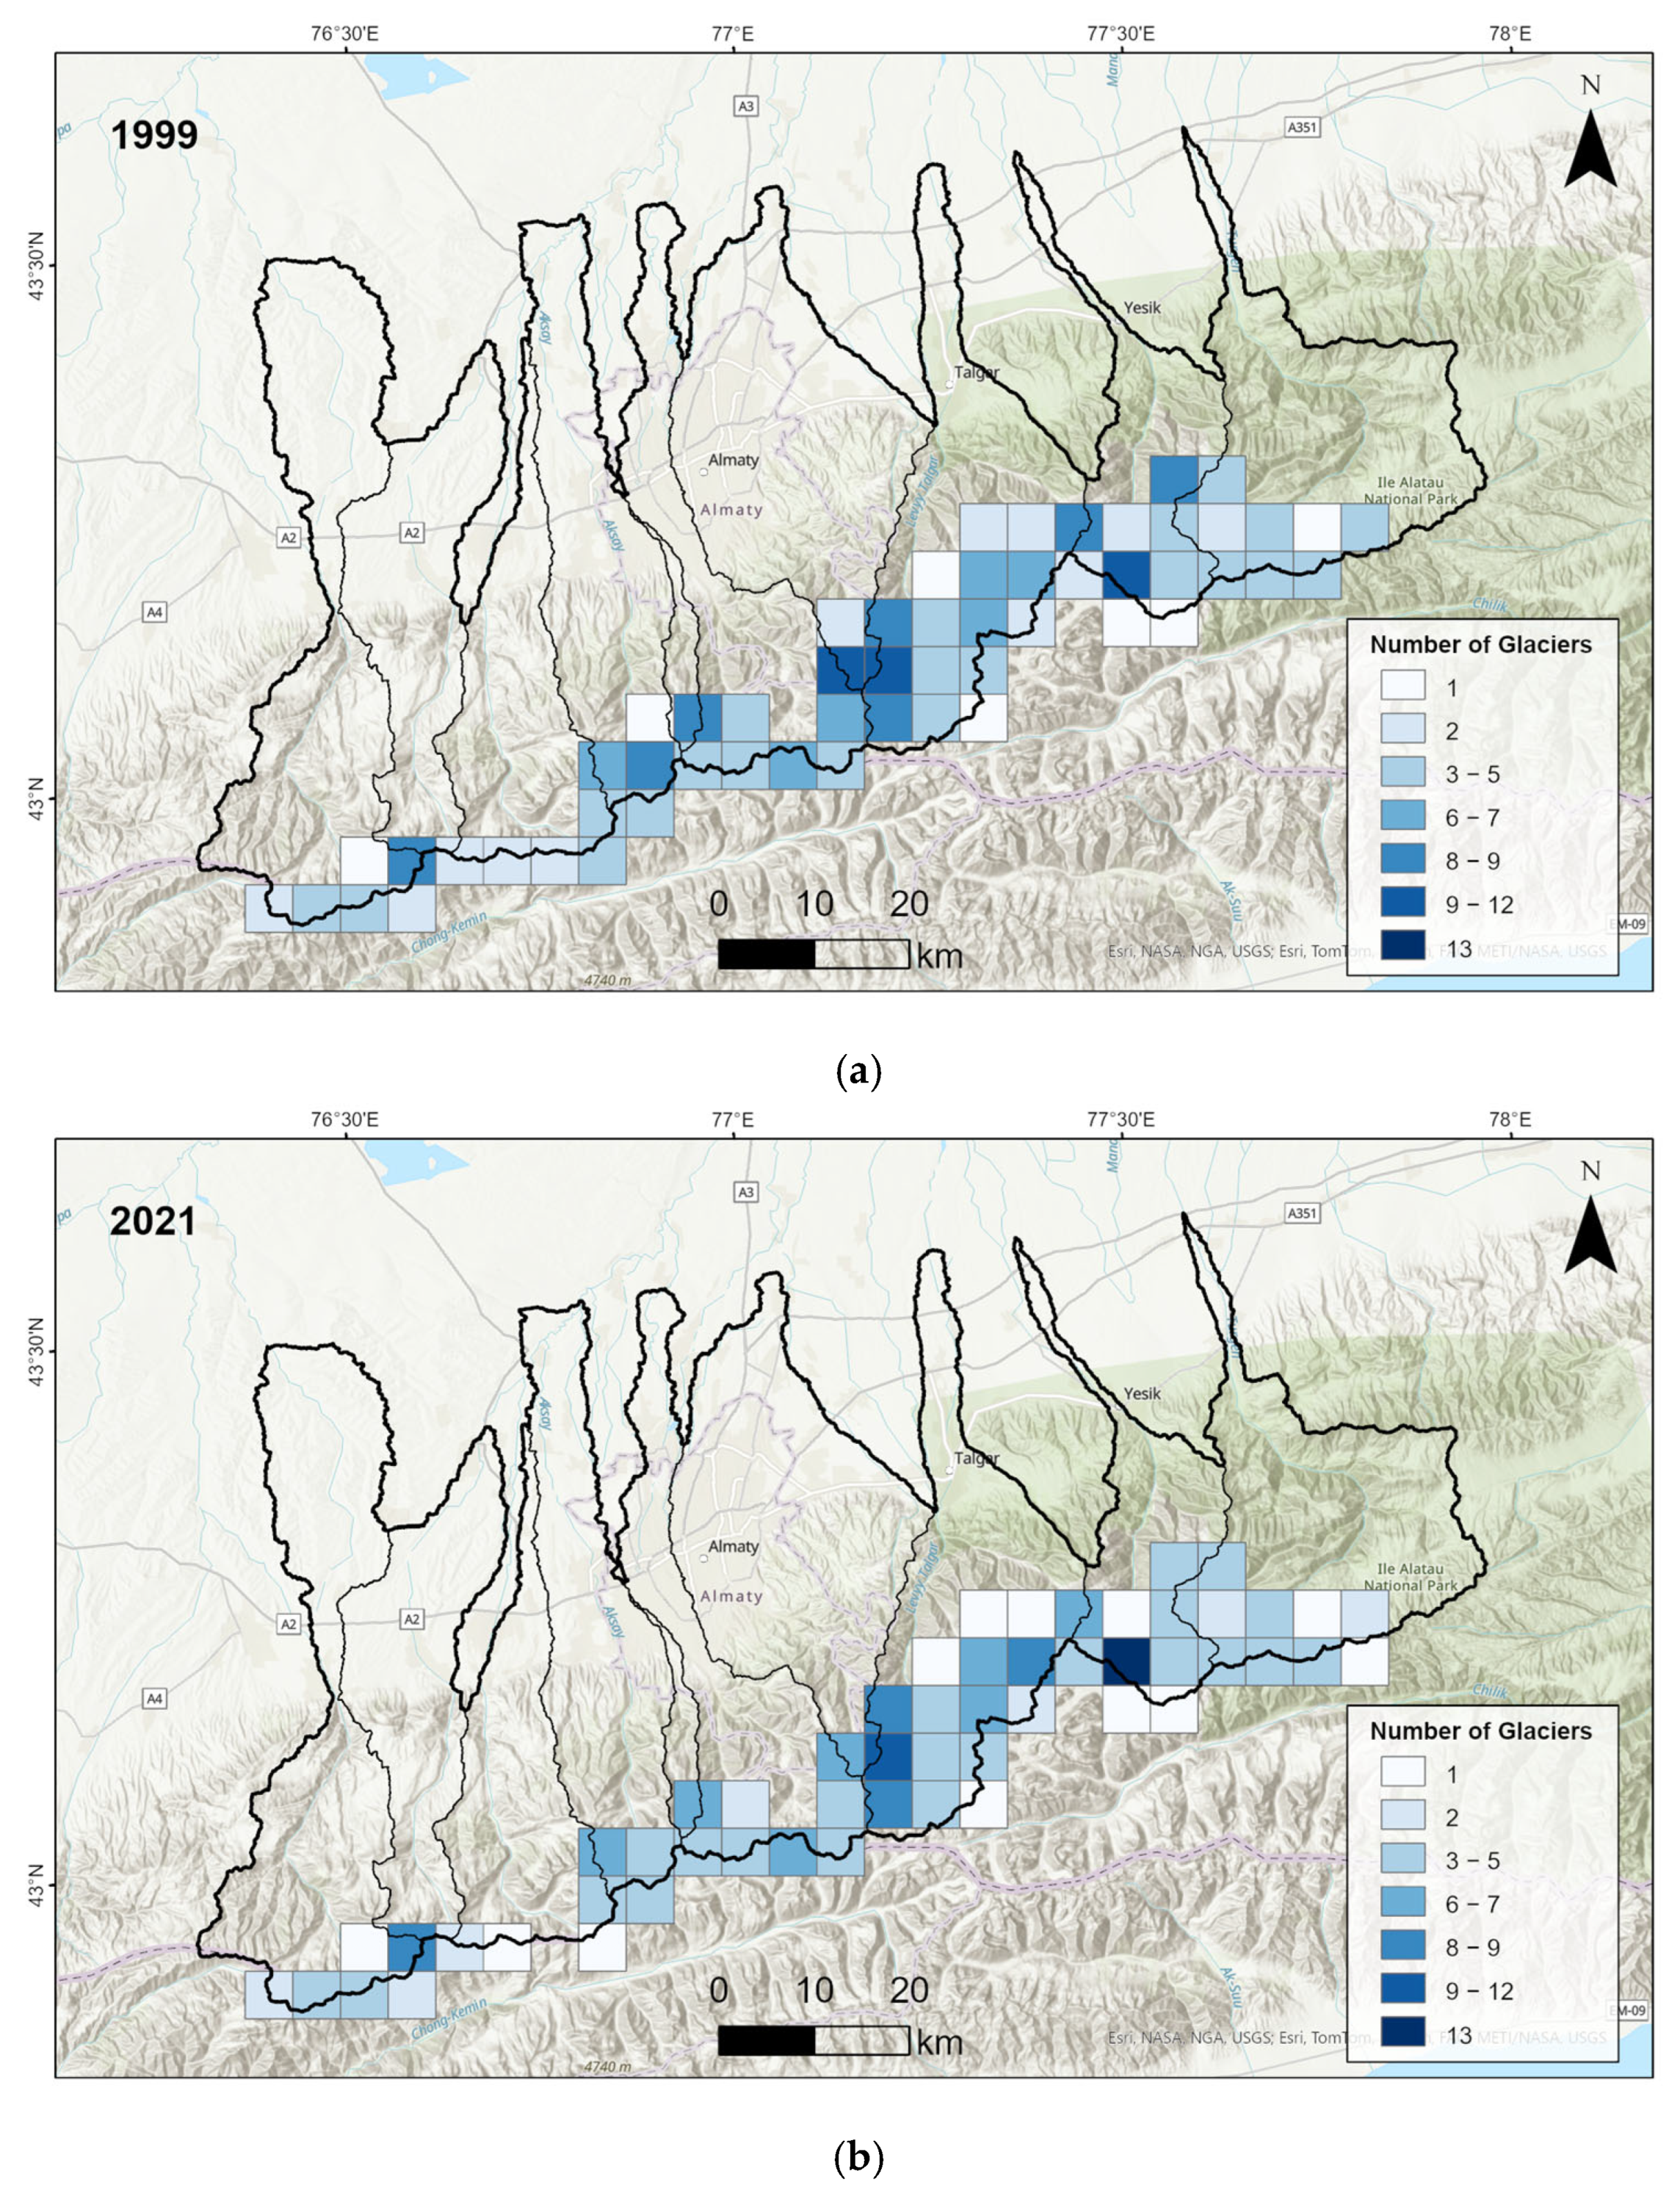
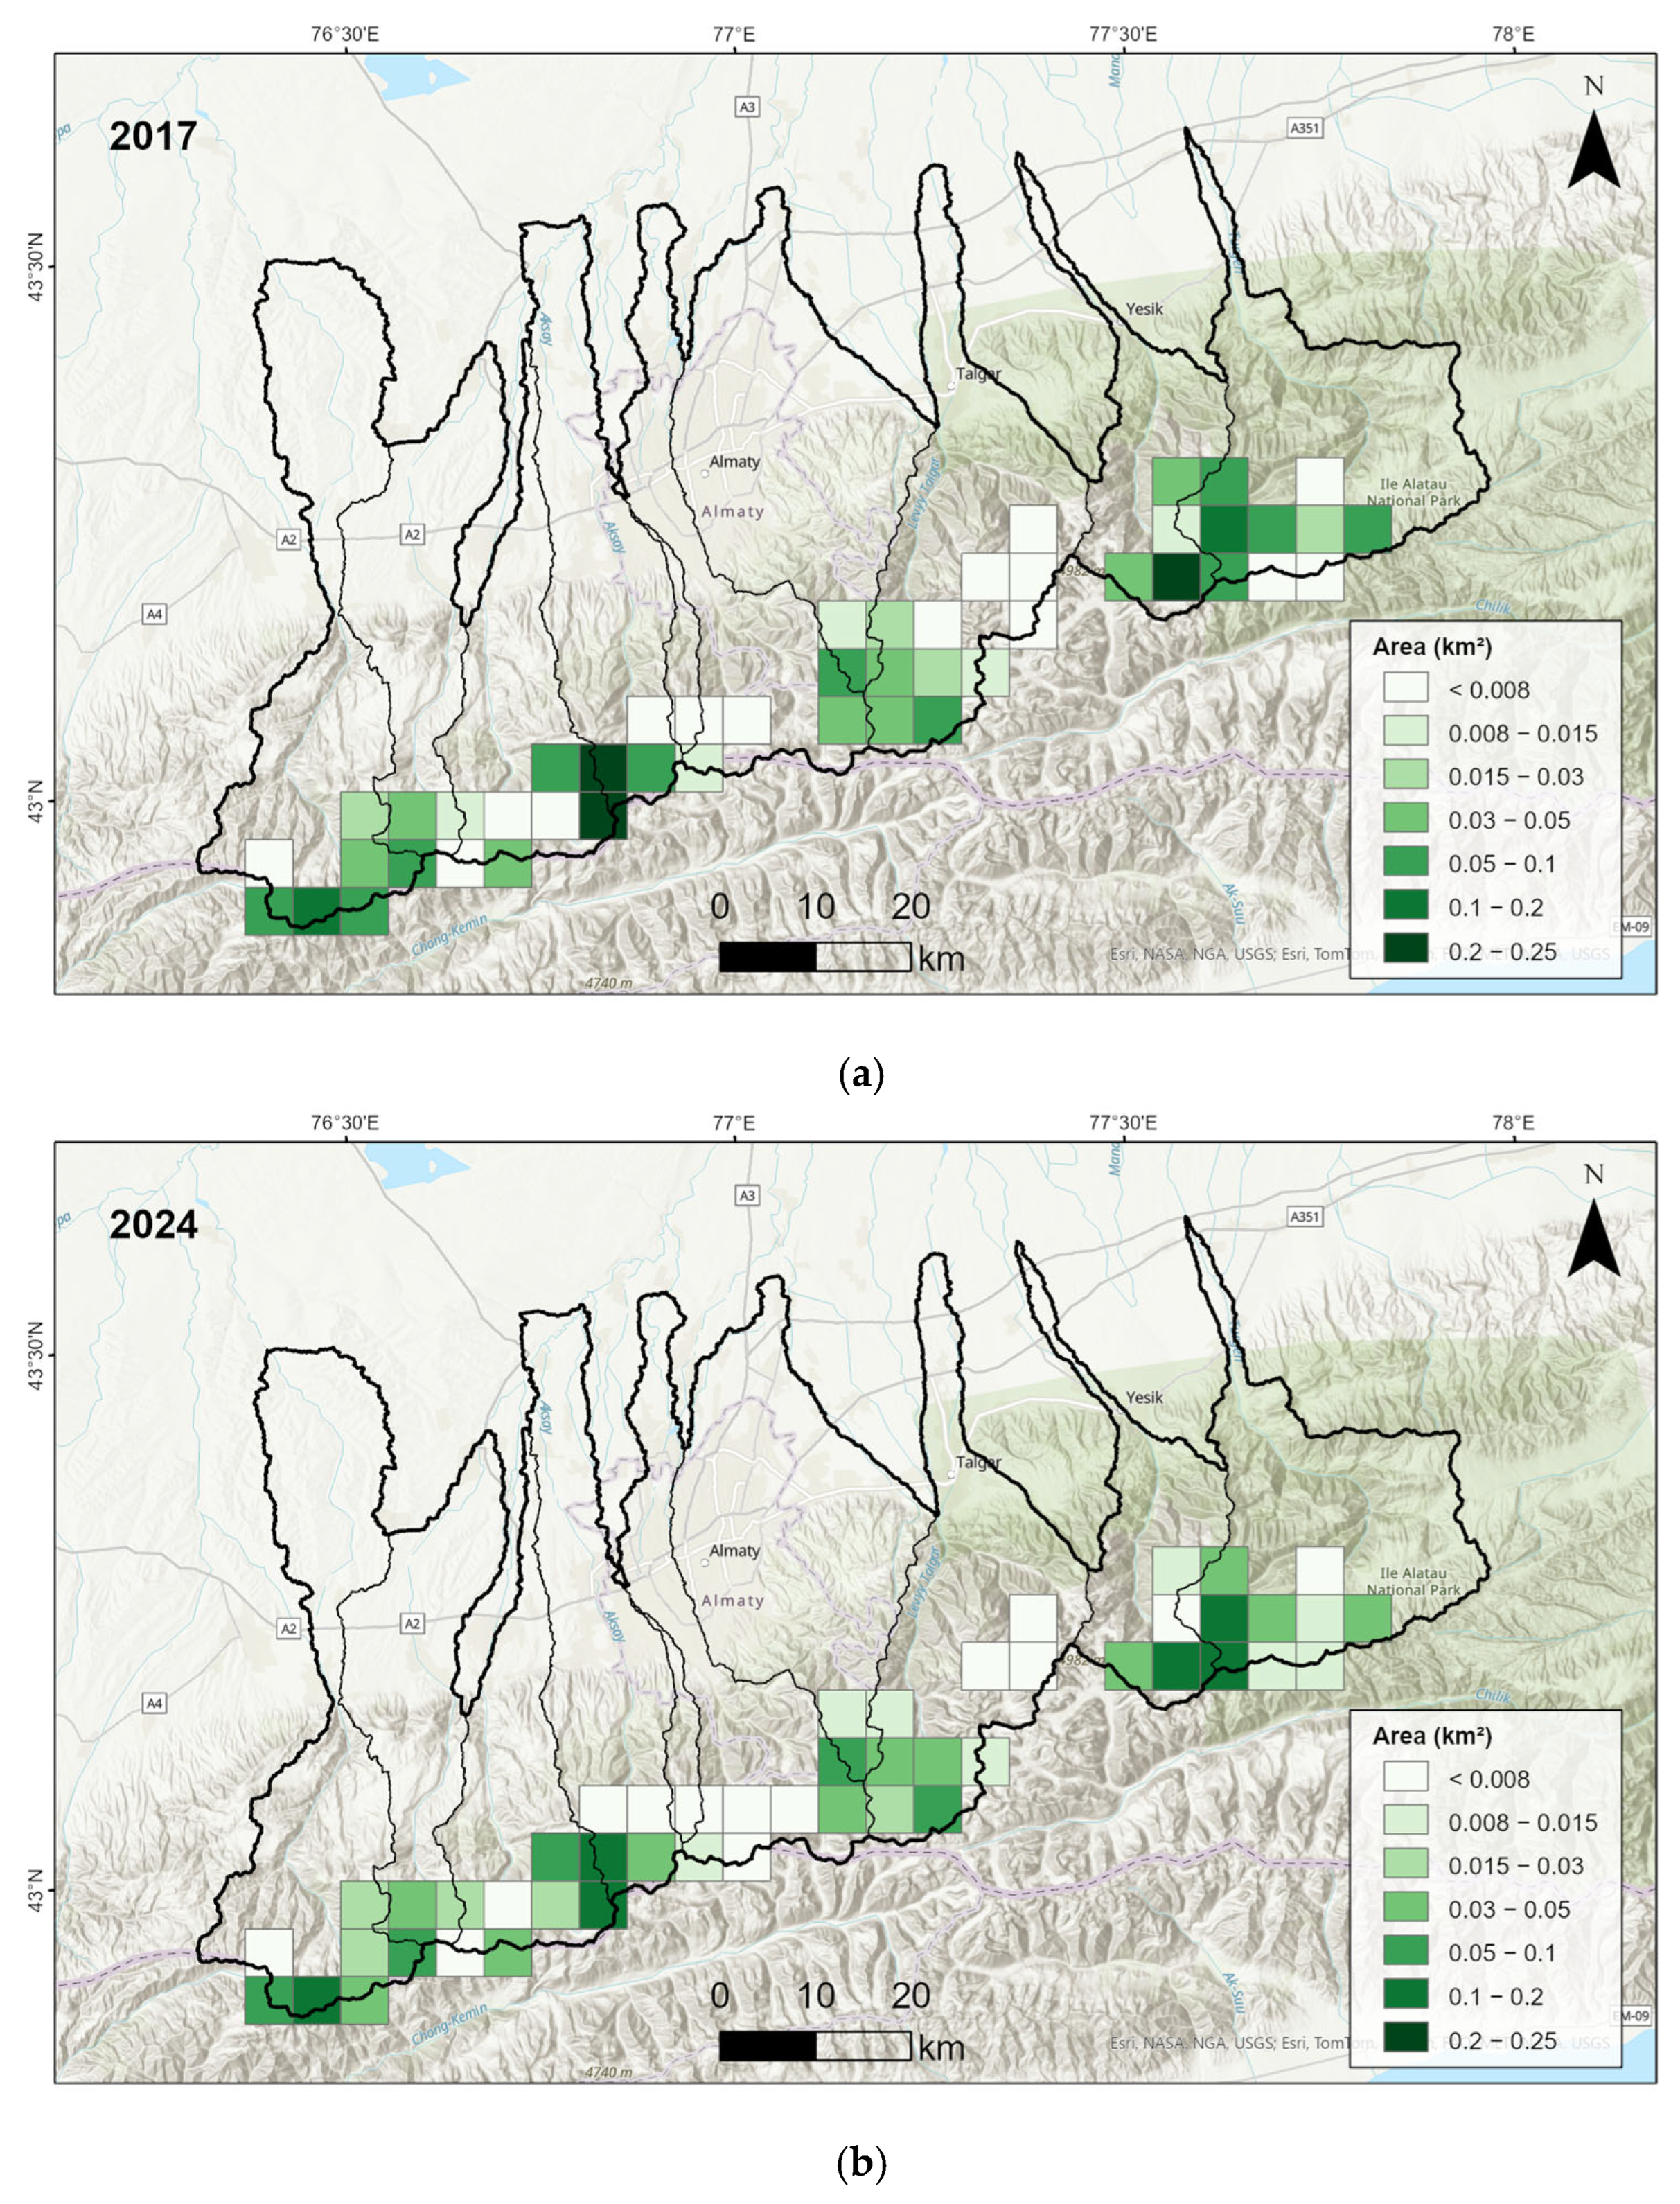
The spatial analysis showed that the rates of glacier area reduction vary among the river basins of the Ile Alatau Range. Using 1955 as the baseline year, the greatest reduction over 1955–2021 was observed in the Chemolgan River basin—about 81.9% (0.9% yr−1) due to the small number of glaciers—whereas the smallest reduction occurred in the Issyk River basin—about 43.3% (0.7% yr−1). Between 1999 and 2021, the highest rates of glacier area reduction were observed in the Chemolgan and Kishi Almaty basins. The glacier area in the Chemolgan River basin decreased from 1.2 ± 0.05 km2 in 1999 to 0.29 ± 0.01 km2 in 2021, representing a 75.9% reduction. Similarly, the Kishi Almaty River basin experienced a 44.1% reduction, with its glacier area shrinking from 6.8 ± 0.28 km2 to 3.78 ± 0.16 km2 over the same period. Other basins also showed substantial losses: Uzunkargaly glaciers reduced from 9.5 ± 0.4 km2 to 5.38 ± 0.22 km2 a—km2 in 1999 to (−2.0% yr−1) decrease, Kaskelen glaciers from 8.8 ± 0.37 km2 to 5.02 ± 0.2 km2 a −43.1% (−2.0% yr−1) decrease, and the Ulken Almaty basin from 21.0 ± 0.88 km2 to 12.48 ± 0.5 km2 a 40.6% (−1.8% yr−1) reduction between 1999 and 2021. Conversely, relatively lower rates of glacier area reduction were observed in the larger Talgar, Issyk, and Turgen river basins during the 1999–2021 period. The Turgen River basin’s glaciers decreased by −23.6% (−1.1% yr−1) from 24.7 ± 1.04 km2 to 18.9 ± 0.79 km2, and the Talgar rivers showed a −26.8% (−1.2% yr−1) decrease from 82.5 ± 3.47 km2 to 60.41 ± 2.5 km2. The lowest rate of glacier area reduction among the larger basins was noted for the glaciers of the Issyk River basin, which decreased by 22.3% (−1.0% yr−1) from 35.4 ± 1.49 km2 to 27.48 ± 1.1 km2. Notably, small glaciers (< 0.005 km2) experienced a particularly high rate of loss, with their combined area reducing by 72.5% between 1955 and 2021, from 2.6 km2 to 0.71 ± 0.02 km2. These smaller ice bodies, which respond quickly to thermal forcing and seasonal snow-cover changes, account for much of the overall count reduction, whereas larger valley glaciers dominate total area loss. The spatial distribution maps showing glacier area and glacier count for the years 1999 and 2021 (Figure 9 and Figure 10) highlight pronounced spatial contrasts across the Ile-Alatau range. Between 1999 and 2021, grid cells corresponding to the Uzunkargaly, Chamalgan–Kaskelen, Aksai, and Ulken Almaty basins exhibited the most conspicuous reductions in both glacier area and number. In contrast, the central and eastern sectors (Talgar–Issyk–Turgen) retained relatively greater glacierized coverage, though they still display progressive contraction along glacier tongues. The comparison of the 1999 and 2021 glacier distribution maps thus reveals an eastward gradient of decreasing retreat intensity, consistent with altitudinal and precipitation differences across the range.
Overall, the Ile-Alatau has experienced an almost continuous decline in glacier area since the mid-twentieth century, with a clear acceleration after the late 1990s. Moreover, smaller glaciers are more sensitive and are disappearing rapidly, while larger glaciers, although receding at a slower pace, contribute significantly to river runoff.

4.3. Evolution of Glacial Lakes

The genesis, expansion, and characteristics of glacial lakes are intricately connected to glacier dynamics and climate change, serving as essential indicators for environmental monitoring and risk assessment in high-mountain regions. As sustained temperature rise and altered precipitation regimes accelerate ice mass loss, meltwater accumulates within newly deglaciated depressions, forming moraine-dammed lakes that act as sensitive indicators of cryospheric response to climate forcing. These evolving water bodies not only reflect the pace of glacier degradation but also represent emerging hydrological and geomorphological hazards in the region.
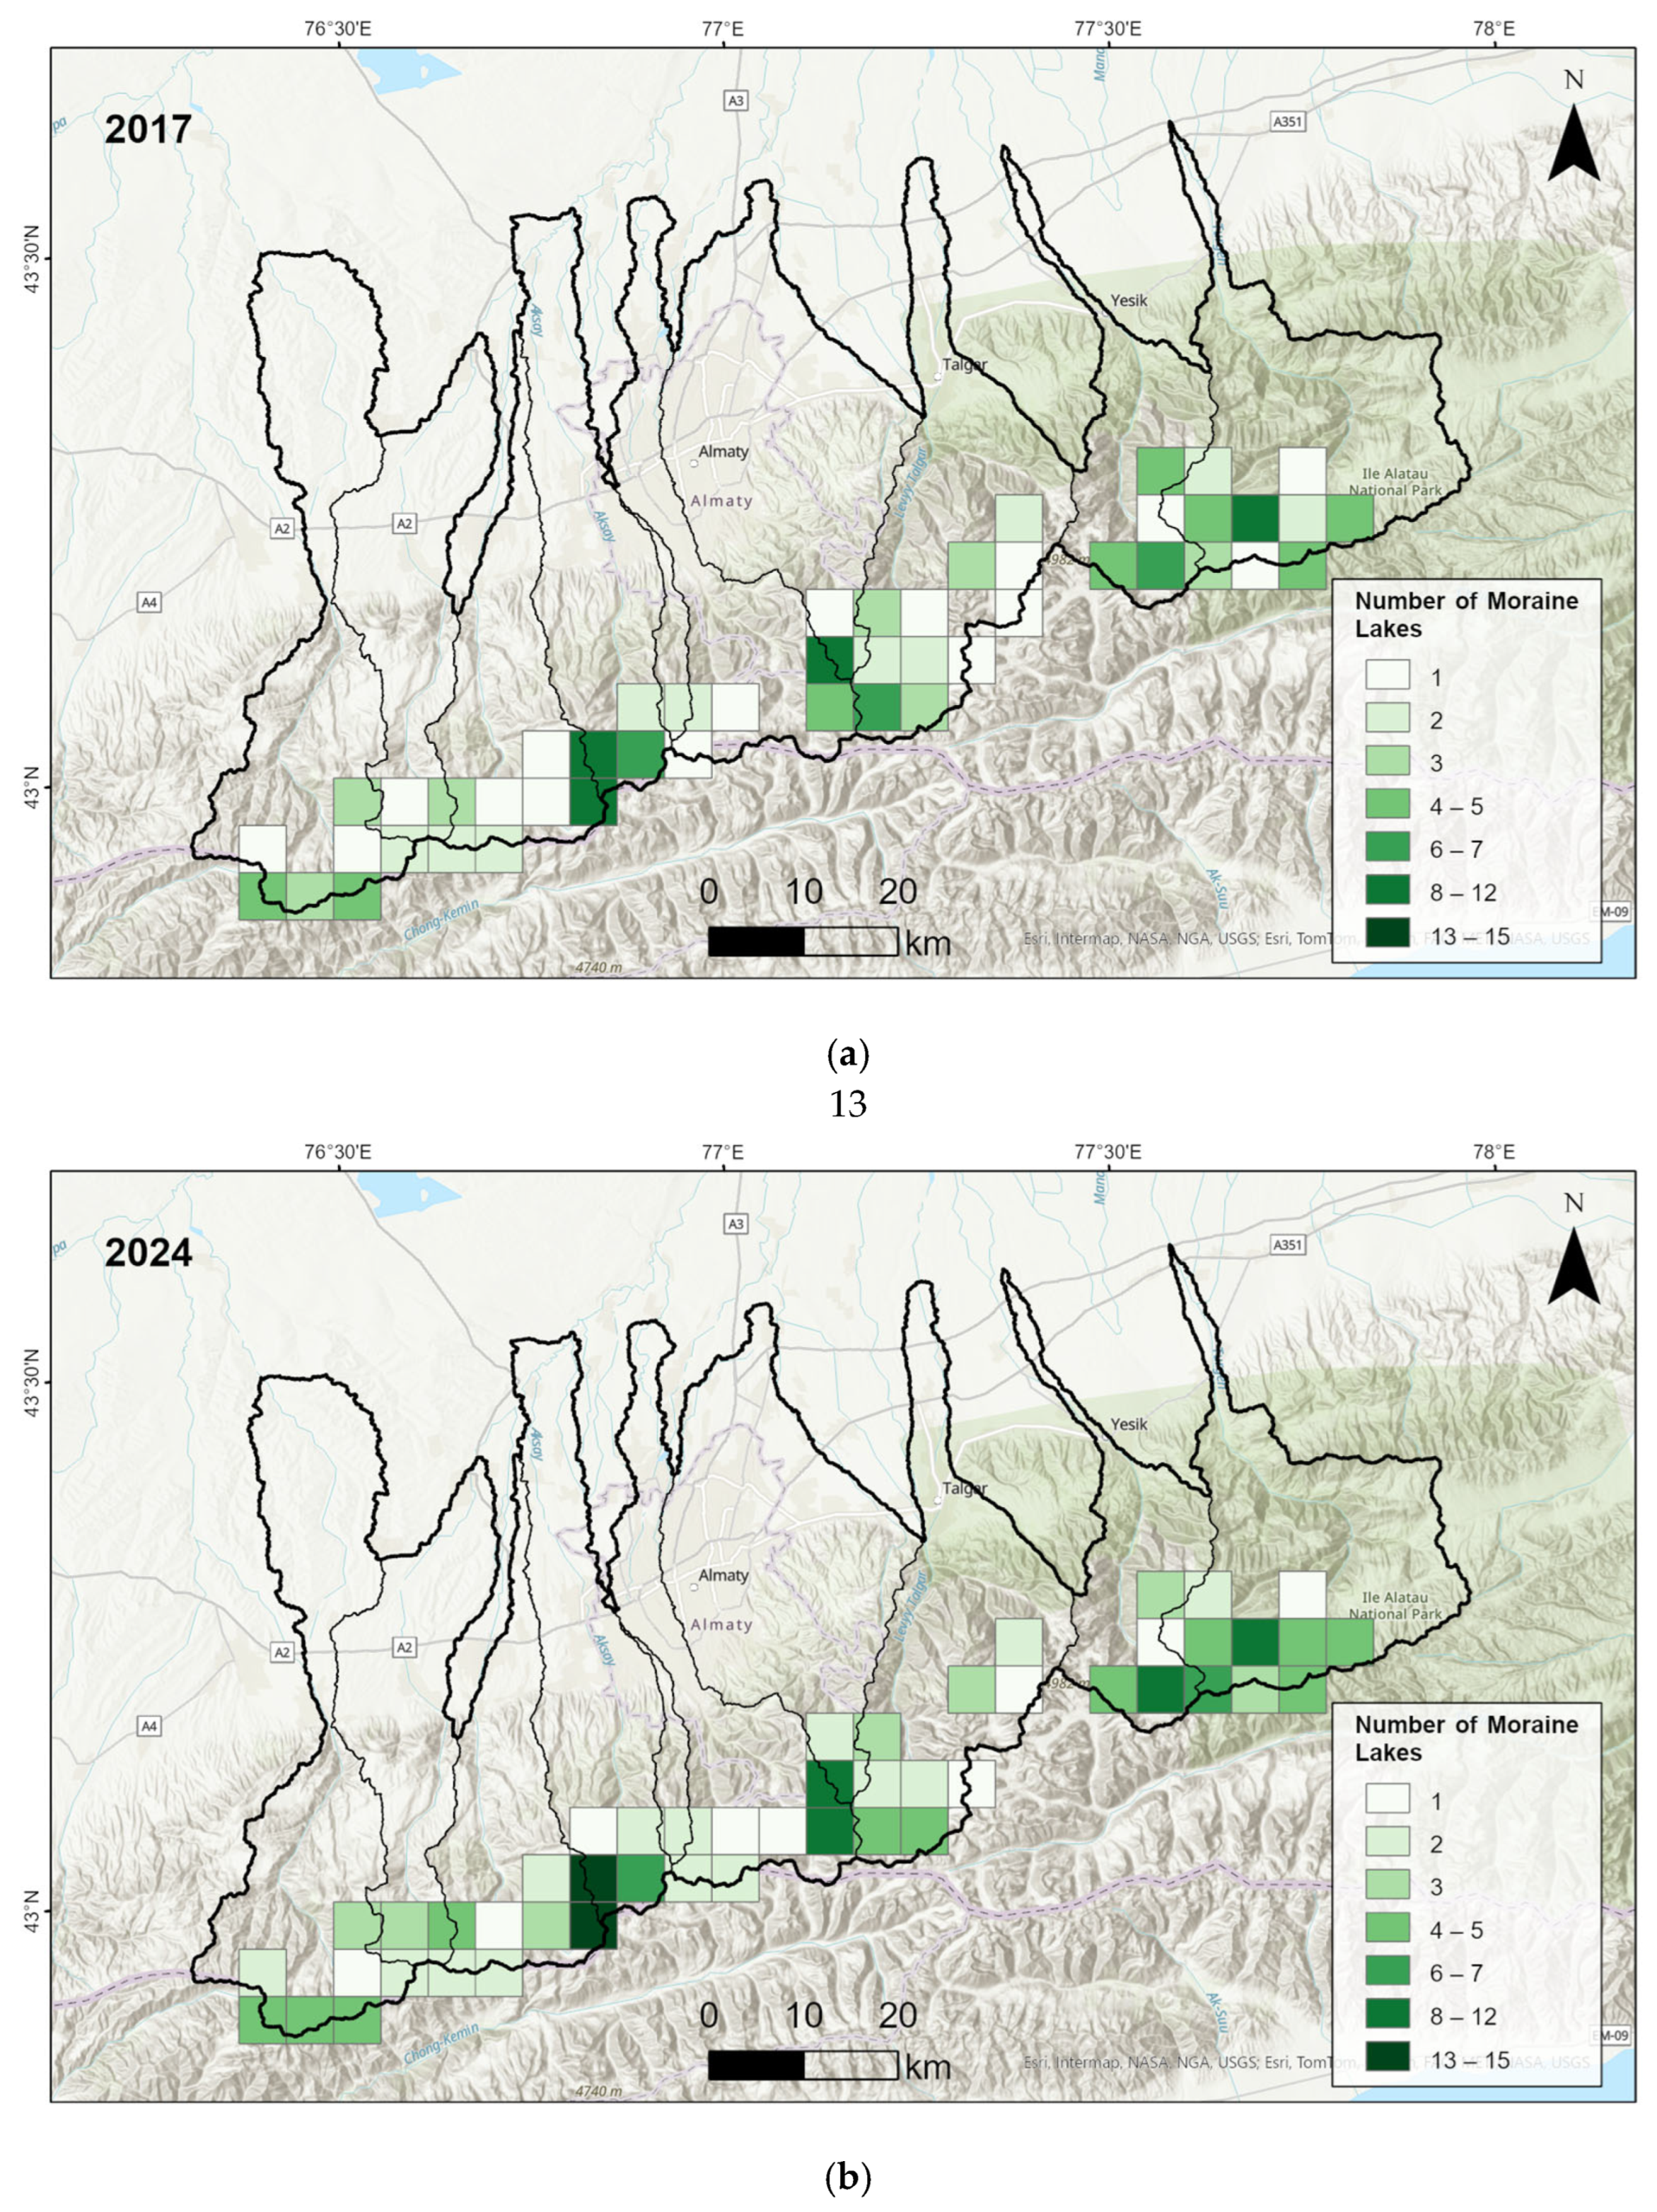
Using Sentinel-2 (10 m) and PlanetScope (3 m) imagery, we analyzed spatio-temporal changes in the number and area of moraine-dammed lakes between 2017 and 2024 across the principal river basins. The results, summarized in Table 9 and visualized through the 5 × 5 km grid maps (Figure 11 and Figure 12), reveal a marked increase in surface area and lake frequency, particularly in the western and central sectors of the range.
Between 2017 and 2024, the total number of moraine-dammed lakes increased notably, while total surface area exhibited only modest changes. Using Sentinel-2 (10 m) imagery, the number of lakes rose from 154 to 178 (≈16% increase), with total surface area increasing slightly from 2.28 × 10⁶ m2 to 2.32 × 10⁶ m2 (≈1.8%). The finer-resolution PlanetScope (≈3 m) data revealed 182 lakes, indicating an ≈18% increase relative to 2017, though the total lake area was somewhat smaller (−8%) due to the detection of numerous newly formed micro-lakes (<0.01 km2) that remain unresolved in Sentinel-2 images. In total, 40–44 new lakes were identified between 2017 and 2024, adding ~154,000–177,000 m2 of lake area across the range.
These results demonstrate a non-linear and scale-dependent expansion pattern: while the number of glacial lakes is rising rapidly, the total area growth is relatively subdued. This suggests that lake proliferation now occurs mainly through the formation of small, shallow ponds, rather than the rapid enlargement of pre-existing basins. Such dynamics typically mark the transition from active glacial retreat to post-deglacial geomorphic adjustment, when the landscape becomes increasingly fragmented by small meltwater features.
The western basins (Uzunkargaly, Chamalgan–Kaskelen, Aksai, and Ulken Almaty) exhibit the strongest increases in lake number and area (Figure 11 and Figure 12), closely mirroring the zones of highest glacier retreat identified in Figure 9 and Figure 10. In particular, the Kaskelen and Chamalgan basins show proportional gains of +38% and +50%, respectively, accompanied by small but positive surface area changes (~7% and ~1%). The Ulken Almaty basin also exhibits a clear upward trend in both count and area (+28% in lake number; ~10% in area). These findings highlight the close spatial correspondence between glacier mass loss and subsequent meltwater impoundment in moraine depressions.
In contrast, central and eastern basins (Talgar, Issyk, and Turgen) display more mixed behavior. The Talgar basin shows a net decline in lake number (8%) and a significant reduction in total area (19%), likely reflecting lake drainage, sediment infilling, or reduced meltwater supply as glaciers retreat to higher elevations. The Issyk and Turgen basins exhibit relatively stable lake numbers but a slight decrease in surface area (~10% and 8%, respectively), suggesting a mature hydrological regime with limited formation of new basins. Overall, this spatial contrast indicates an eastward decline in the intensity of lake development, consistent with the decreasing magnitude of glacier retreat and slightly higher precipitation in the eastern sectors of the range.
In summary, the evolution of moraine-dammed lakes between 2017 and 2024 reflects a lagged but accelerating hydrological response to the multi-decadal glacier recession described earlier. The increase in lake number especially of small, recently formed water bodies demonstrates how ongoing ice loss continues to reshape the high-mountain landscape of Ile- Alatau range.

4.4. Linkages Between Hydro-Climatic Trends and Glacier–Lake Response

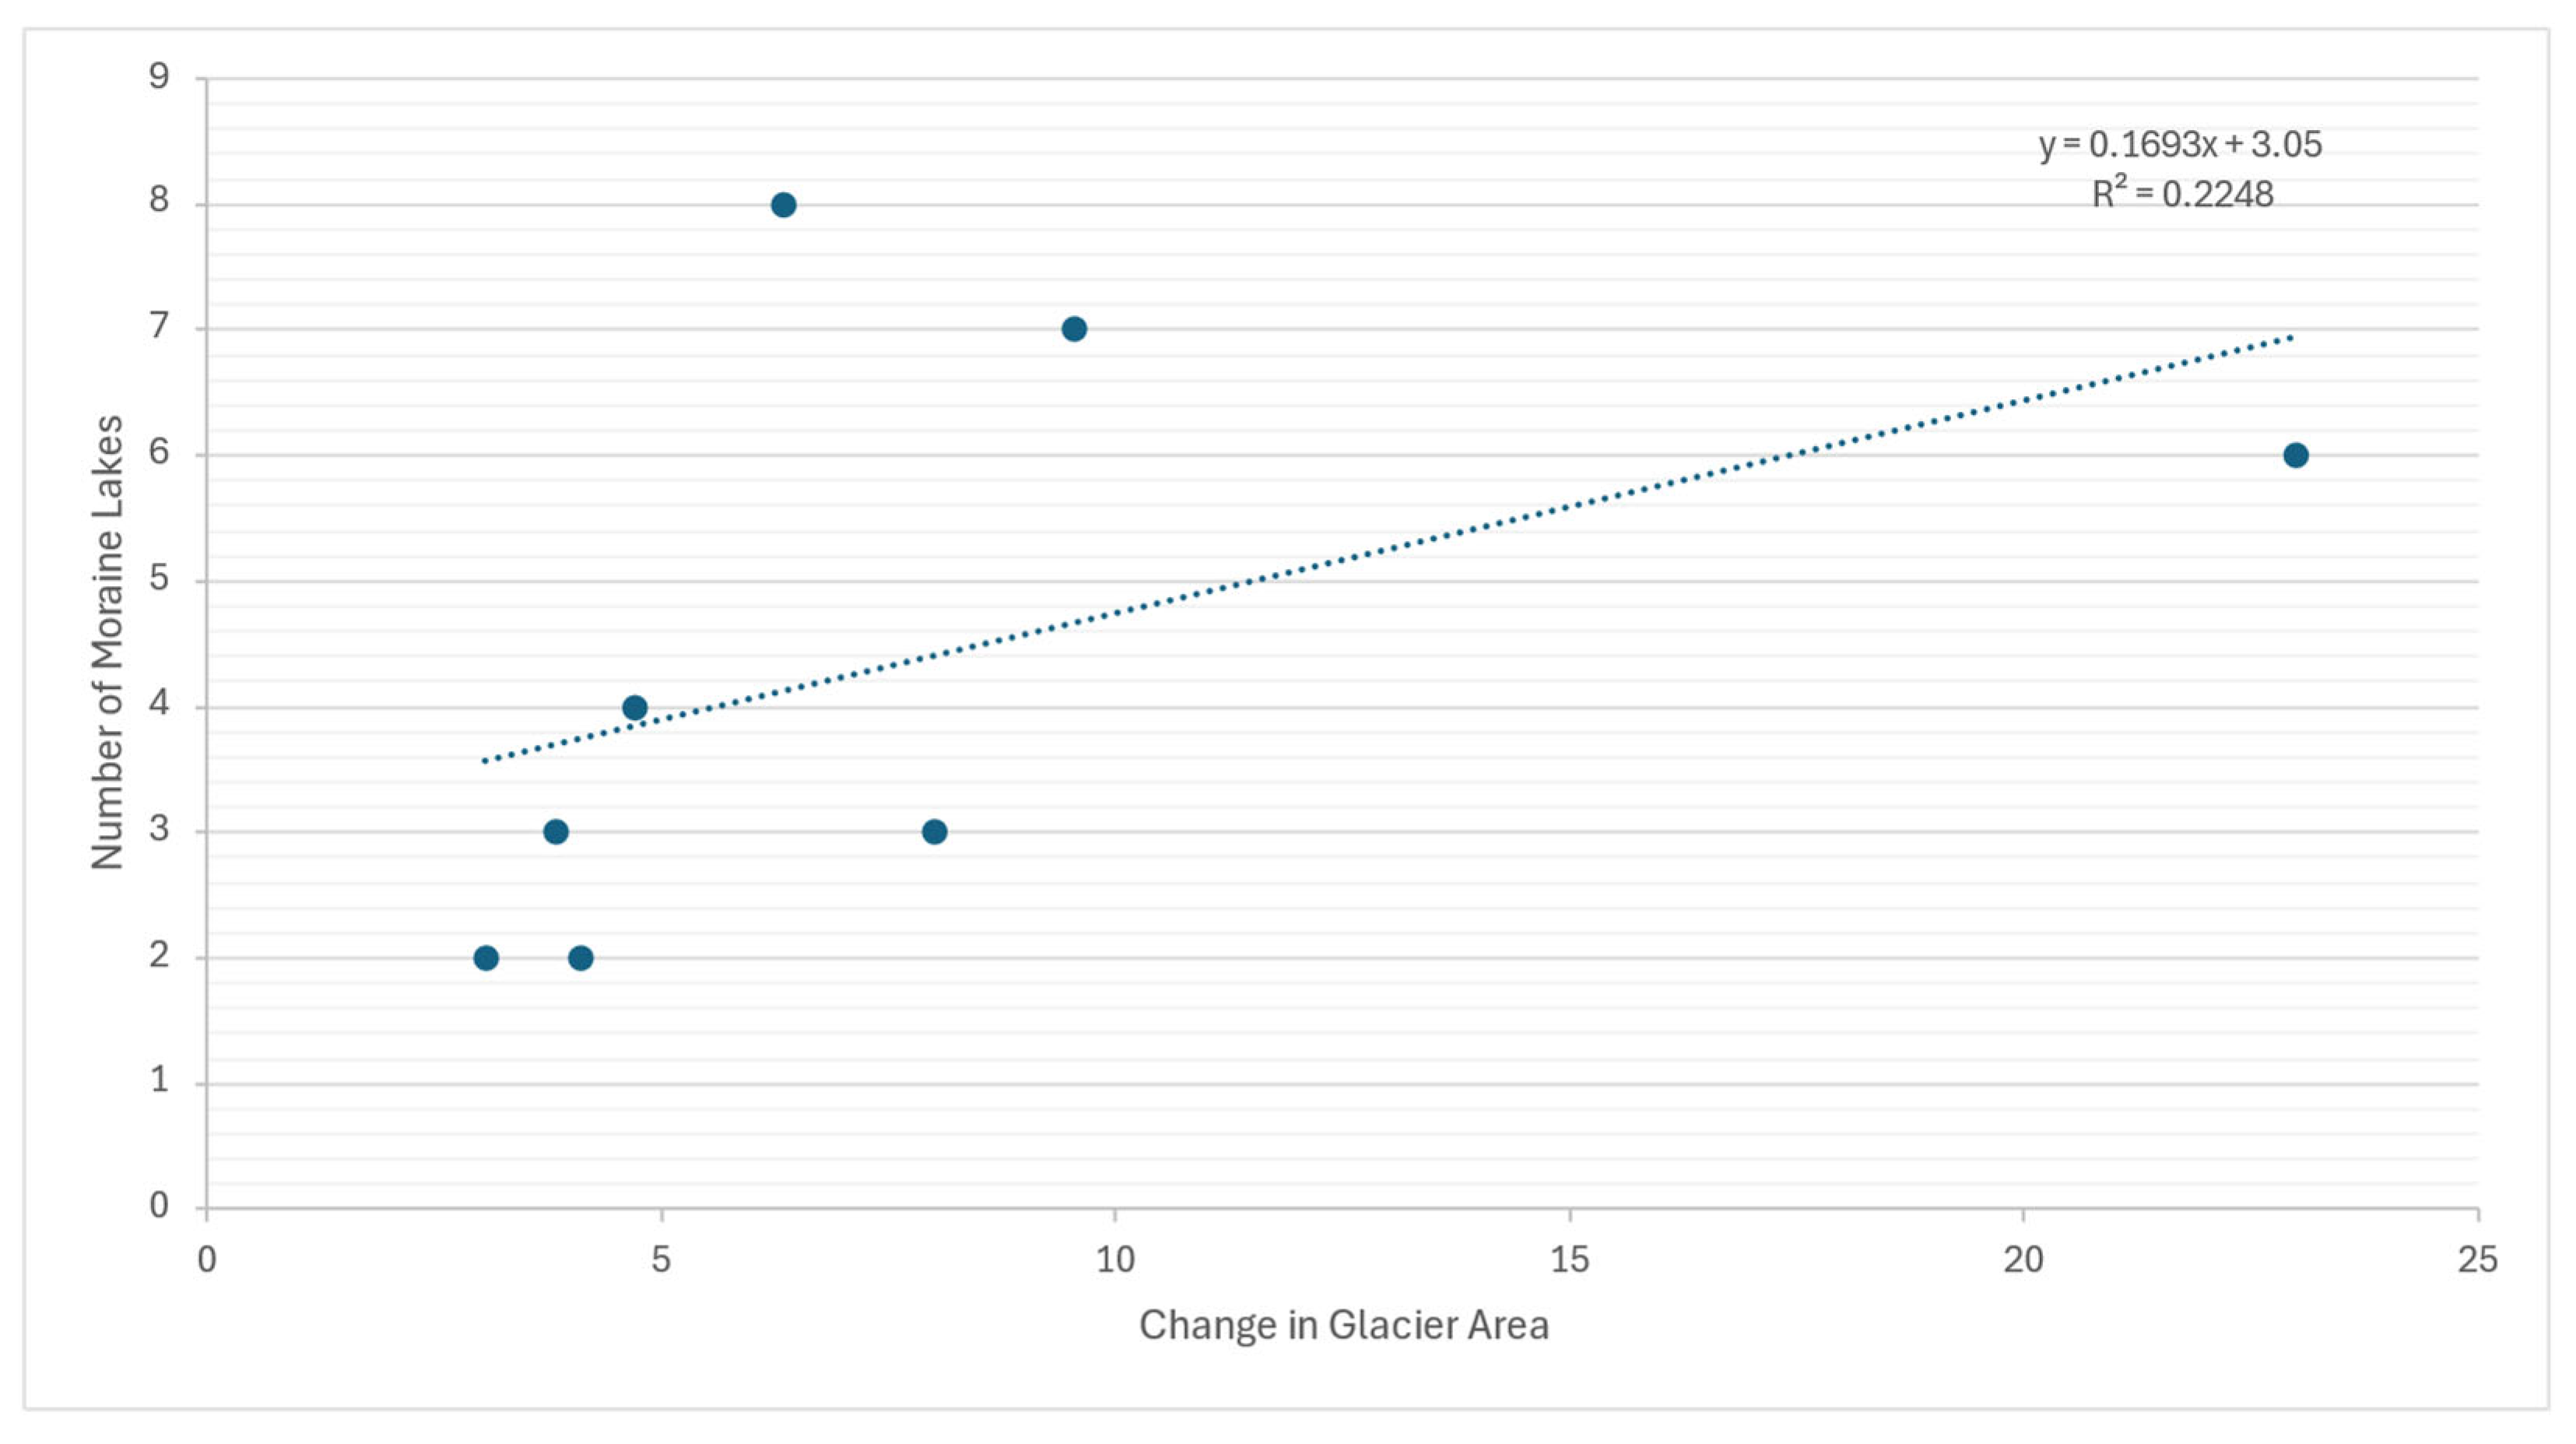
The comparative analysis of glacier area loss (1999–2021) and moraine lake formation (2017–2024) across the Ile-Alatau basins reveals a weak but observable relationship between the two processes (Figure 13). While glacier retreat supplies meltwater necessary for lake development, the regression analysis (R2 = 0.22) indicates that glacier area loss alone does not fully explain the spatial variability in moraine lake formation. For example, the Talgar basin experienced the highest glacier area reduction (~22 km2) but only six new moraine lakes were recorded. In contrast, the Kaskelen and Turgen basins, which lost comparatively smaller glacier areas (3.8 km2 and 5.8 km2, respectively), exhibited the greatest number of new lakes (eight each).
These patterns highlight the complex interplay between glaciological, geomorphological, and hydrological factors in governing post-deglaciation lake development. The formation of moraine-dammed lakes is not solely a function of ice loss, but also depends on local topography, valley orientation, debris cover, and subsurface permafrost conditions that influence meltwater accumulation and drainage stability. Consequently, while glacier retreat sets the hydrological preconditions for lake initiation, basin-specific geomorphic configurations ultimately determine the number and size of new moraine lakes formed during the study period.

5. Discussion

This study presents an integrated assessment of long-term hydro-climatic variability, glacier dynamics, and moraine-dammed lake evolution within the Ile-Alatau Mountains, Northern Tien Shan. Using multi-decadal meteorological observations (1961–2024) from four high-altitude stations, coupled with multi-epoch glacier inventories (1955, 1999, 2014, 2021) and recent high-resolution satellite mapping of moraine lakes (2017–2024; Sentinel-2 and PlanetScope), we quantitatively examined the cascading impacts of regional warming on the cryosphere and hydrological regime. Our research elucidates the intricate dynamics between climatic variables and glacial dynamics, thereby advancing our understanding of regional hydrological responses to climate change. Furthermore, it contributes to the existing body of literature on understanding the consequences of regional warming and glacier retreat in the Tian Shan and other Central Asian mountain ranges. The findings of this study provide crucial insights into the long-term hydro-climatic changes and their profound impact on glacier dynamics within the Ile-Alatau Mountains, a critical headwater region of the Tien Shan.
The consistent warming trend observed across all meteorological stations in the Ile-Alatau Mountains from 1961 to 2024 stands as a primary climatic driver of the documented glacier retreat. Specifically, the average annual temperature increases ranging from 0.14 °C to 0.28 °C per decade, with similar or even more pronounced warming in summer temperatures (0.15 °C to 0.30 °C per decade), directly contribute to accelerated glacier melt. This temperature increase exacerbates glacier ablation, causing a reduction in glacier mass and area [69]. This warming is particularly critical during the ablation season, leading to increased ice loss and a shift in the equilibrium line altitude upwards [70]. Such temperature increases in the Ile-Alatau region are consistent with broader regional and global climate change patterns, where mountain regions are experiencing amplified warming, often exceeding global averages (0.12 °C per decade). These findings are consistent with observations in other High Mountain Asia (HMA) regions, and highlight the vulnerability of glacier systems to rising temperatures [69,71].
Comparable trends have been documented across the Hindu Kush–Himalaya, where seasonal snow-cover declines during the accumulation season and strong negative SCA–temperature correlations underscore the sensitivity of snowlines to warming (e.g., −0.2385% yr−1 in the Brahmaputra and −0.0901% yr−1 in the Ganga basins [72]). Studies also highlight an increasing shift from snowfall to rainfall and rising rain-on-snow events, which further shorten effective accumulation periods [73]. Dendroclimatic reconstructions from the central Himalaya show that recent warming has weakened cold limitation in summer and increased dependence on autumn moisture, illustrating elevation-dependent amplification [74,75].
In contrast to the clear warming, precipitation patterns across the Ile-Alatau stations exhibited greater inter-annual variability and generally showed stable or slightly decreasing trends. While the Kamenskoe Plateau and Mynzhylky stations showed no statistically significant change in annual precipitation, and Ulken Almaty Lake noted a very slight increase, the Assy station recorded a downward trend of 0.25 mm per decade, particularly since the 2000s. This relative stability or slight decrease in precipitation, combined with rising temperatures, has significant implications for glacier mass balance [18]. Decreased precipitation reduces snow accumulation, which is vital for replenishing glacier mass, and the lack of increased snowfall to offset the accelerated melting further exacerbates glacial retreat [69,72,73]. Similar precipitation-phase shifts have been reported across the Indus–Ganga–Brahmaputra basins, where rising temperatures have altered the balance between snowfall and rainfall. The timing and phase of precipitation—with more rain and less snow during key accumulation periods—reduce accumulation efficiency even when annual totals show little change, thereby reinforcing regional mass-balance losses [72]. Therefore, the observed hydro-climatic context of consistent warming coupled with largely stable or decreasing precipitation creates an unfavorable energy and mass balance for glaciers in the Ile-Alatau, making them highly vulnerable to continued reduction.
Building upon the observed hydro-climatic trends, the recorded climate warming and variable precipitation patterns directly translate into the accelerated glacial melt and subsequent changes in glacier characteristics within the Ile-Alatau Mountains. Analyzing the dynamics of glacier size and spatial distribution has provided a deeper understanding of their specific response to these ongoing climatic shifts. The substantial glacier area loss observed in the Ile-Alatau Mountains, amounting to a 47.4% reduction between 1955 and 2021, directly reflects the adverse impact of the regional warming trends. This significant rate of retreat aligns with accelerated glacier recession observed across the broader Tien Shan region and other mountain ranges globally. The pronounced increase in average annual and particularly summer temperatures plays the primary role in driving this contraction by enhancing surface melt and raising the equilibrium line altitude. While precipitation patterns generally remained stable or slightly increased at some stations, and decreased at others like Assy, this limited or negative change in precipitation input means that accumulation is insufficient to offset the increased ablation caused by warming. Consequently, the observed glacier shrinkage is predominantly driven by temperature-induced melt, exacerbated by a lack of compensatory snowfall.
The spatial variability in glacier retreat rates, with higher losses in basins like Chemolgan-Kaskelen and Kishi Almaty, and lower rates in Talgar, Issyk, and Turgen, can be attributed to several factors. These may include differences in glacier size (smaller glaciers tend to be more sensitive to climatic shifts and often exhibit higher percentage losses), topographic characteristics such as elevation and aspect, and potentially the presence of debris cover, which can insulate glacier ice (though not explicitly analyzed in this study’s methods, it’s a known factor in glacier dynamics). The disproportionately high reduction observed in very small glaciers (<0.005 km2) further underscores their vulnerability to warming temperatures, as their limited ice volume offers less resilience to sustained melt. The spatial distribution maps (Figure 9 and Figure 10) further confirm an eastward gradient of decreasing retreat intensity, broadly consistent with elevation and precipitation patterns across the range.
A study conducted by Romshoo et al. [72] in HMA demonstrated that debris thickness exerts a strong control on glacier ablation patterns. Their study reported that degree-day factors decreased from approximately 4.8 mm w.e. °C−1 d−1 under thin or dirty debris to about 0.4 mm w.e. °C−1 d−1 beneath ≈ 30 cm of debris, with a cumulative melt of around 21.5 cm recorded over 11 days. These results illustrate how variations in debris thickness re-pattern melt intensity and can lead to spatially divergent retreat rates among basins experiencing similar climatic forcing. More generally, thin debris tends to enhance melt, whereas thicker debris insulates the underlying ice, and the critical threshold depends on the debris’ optical and thermal properties.
The observed rapid glacier retreat in the Ile-Alatau Mountains carries significant implications for regional water resources, natural hazard management, and underscores the urgent need for informed policy interventions. The consistent and accelerated ice melt, driven primarily by rising temperatures, directly impacts the hydrological regimes of rivers and streams originating from these glaciated zones. As these glaciers are a vital source of freshwater for both Kazakhstan and Kyrgyzstan, their continued shrinkage threatens long-term water availability for agriculture, urban supply, and hydropower, particularly in arid and semi-arid downstream regions. This highlights the vulnerability of the current water balance to ongoing climate change.
Furthermore, the accelerated melt significantly contributes to the formation and expansion of proglacial and moraine lakes. The increased influx of meltwater into moraine-dammed basins elevates the risk of GLOFs, which pose substantial threats to lives, infrastructure, and ecosystems in the valleys below. The proliferation and enlargement of these lakes, as a direct consequence of glacier shrinkage, necessitate enhanced monitoring and risk assessment strategies for these natural hazards.
Our investigation of glacier lakes revealed great variability in both their number and surface area evolution across the Ille-Alatau Basins. Between 2017 and 2024 the total number of moraine-dammed lakes increased from 154 to 178 in the Sentinel-2 record and to 182 in the higher-resolution PlanetScope record equivalent to ≈16% and ≈18% gains, respectively. Yet these additional water bodies contributed only a 1.8% rise in aggregate area in the Sentinel-2 inventory and an 8% decrease in the PlanetScope tally (Table 9). The discrepancy underscores how PlanetScope’s 3 m pixels detect numerous micro-lakes that remain sub-pixel in 10 m imagery. This shows that Sentinel-2 generally measures larger and better-established lakes while PlanetScope records the proliferation of tiny glacial ponds.
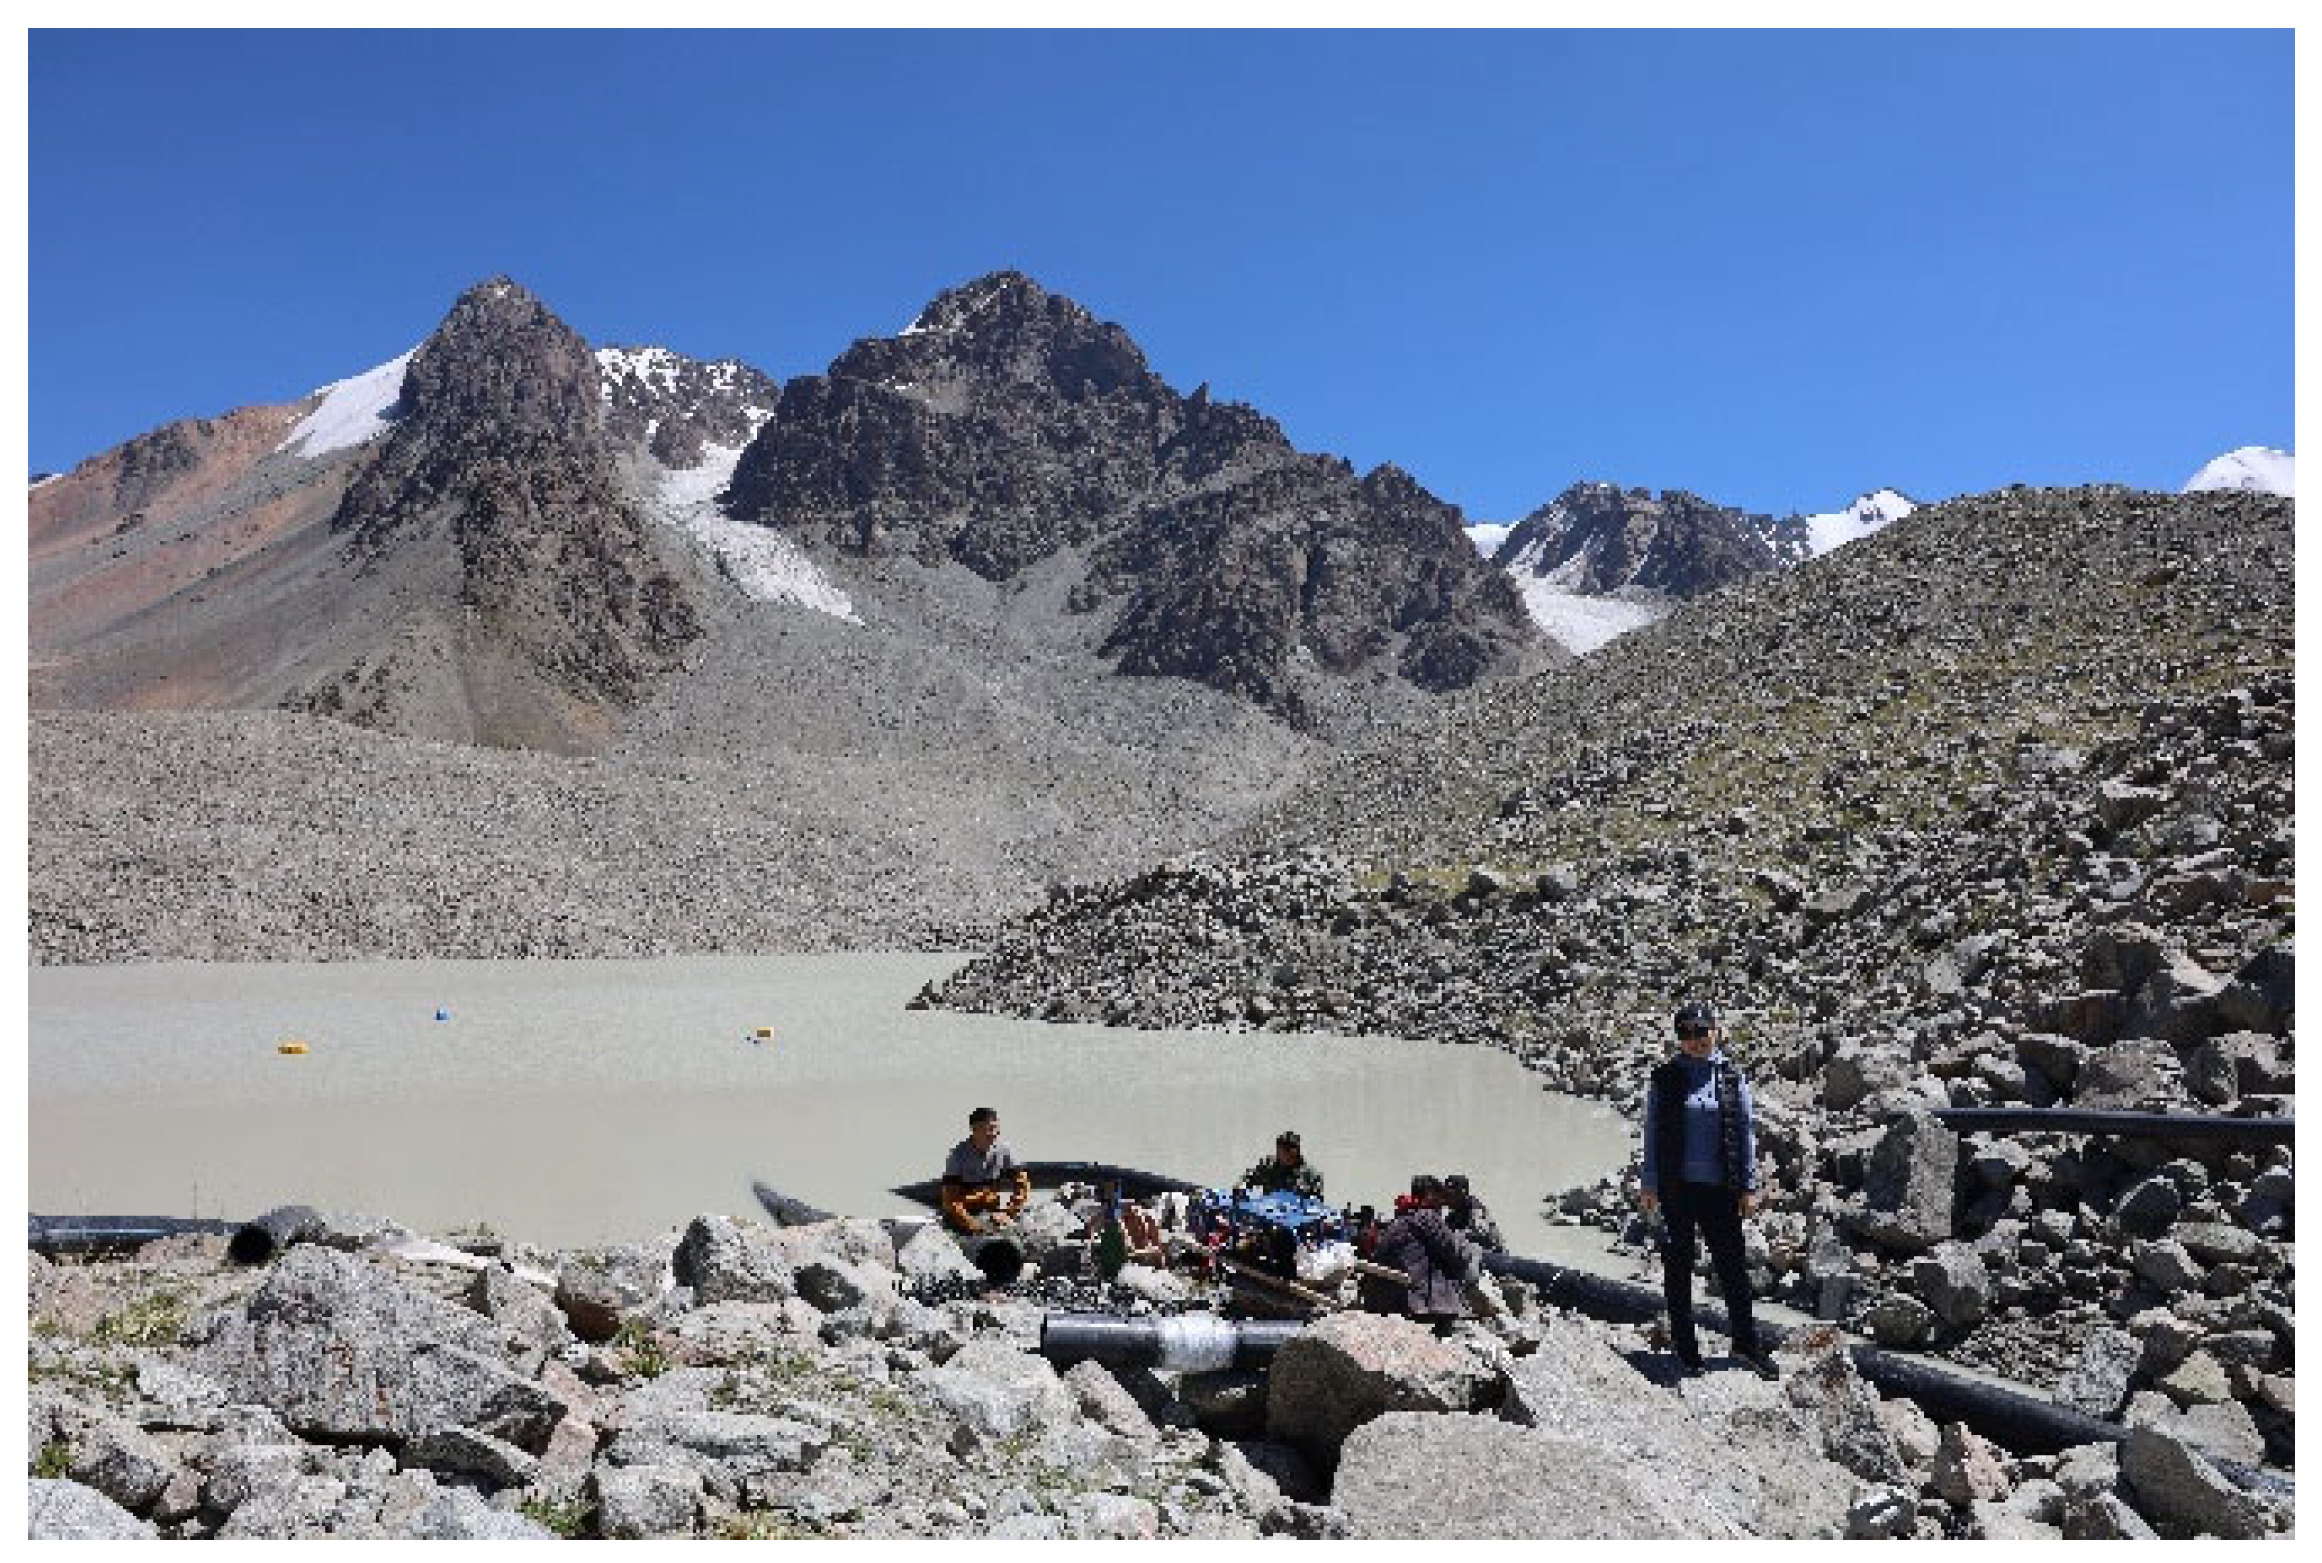
As documented in Table 9, the total number of moraine-dammed lakes has risen markedly since 2017, whereas the aggregate lake-surface area has increased only modestly. This divergence reflects ongoing risk-mitigation work by specialists of the State Institution “Kazselezashchita” (Kazakh Mudflow Protection) under the Ministry for Emergency Situations of the Republic of Kazakhstan, who routinely install siphon pipes and partially drain hazardous lakes to keep water levels below critical thresholds. By removing excess water, these interventions curb further area growth even as new, small water bodies continue to appear in recently deglaciated terrain. Figure 14 photographs one such operation and underscores how active engineering measures modulate the otherwise strong positive relationship between glacier shrinkage and lake expansion. Consequently, the lake inventory now contains more and generally smaller water bodies, illustrating how human management can partially decouple lake number from total stored volume and, in turn, from the overall GLOF threat.
When compared with glacier-area losses between 1999 and 2021, the relationship between glacier retreat and new lake formation appears nonlinear. Basins such as Kaskelen and Turgen, which experienced only moderate glacier loss (≈3.8–5.8 km2), recorded the highest number of new lakes (eight each). In contrast, the Talgar basin, despite the largest glacier loss (≈22 km2), saw relatively fewer new lakes (six). This weak association (R2 ≈ 0.22) suggests that lake genesis is controlled not merely by the magnitude of glacier loss but also by topographic confinement, moraine stability, hydrological connectivity, and permafrost degradation. High-resolution surveys at Pasterze Glacier show debris-free ice lowering at −7.0 ± 2.7 m yr−1 versus −5.0 ± 4.6 m yr−1 for debris-covered ice, with an expanding proglacial lake implicated via thermal undercutting and calving processes, illustrating how lake–ice feedbacks can accelerate thinning and partly decouple glacier dynamics from direct climatic forcing [74].
In our study area, the weak glacier–lake correlation can similarly be viewed as the net outcome of multiple controls. First, topographic confinement and over-deepening determine where meltwater ponds can stabilize into moraine- or proglacial lakes. Second, debris-cover heterogeneity alters melt patterns—thin debris enhances, while thick debris suppresses ablation—thus modulating water supply at glacier termini. Third, precipitation seasonality and phase affect accumulation efficiency, with reduced winter snowfall or increased warm-season rainfall shifting the timing and magnitude of meltwater delivery, a pattern consistent with monsoon-linked mass-balance sensitivity observed elsewhere in High Mountain Asia. Finally, human interventions such as siphoning and partial drainage of hazardous lakes by Kazselezashchita reduce surface-area expansion even as numerous micro-ponds appear in newly deglaciated terrain. Collectively, these processes explain why basins with moderate glacier loss can host many small, newly formed lakes, whereas basins with greater retreat may exhibit fewer but more stable or managed water bodies.
The findings of this study provide critical scientific evidence for various stakeholders, including water-resource managers, disaster-preparedness agencies, environmental authorities, and policymakers in both Kazakhstan and Kyrgyzstan. The detailed quantification of multi-decadal glacier area loss, the identification of regional warming trends, and the recent, management-modulated proliferation of moraine-dammed lakes offer a robust basis for developing strategies for sustainable water management and for guiding the prioritization of moraine lake monitoring, early warning systems, and mitigation measures in high-risk areas. Given that meltwater from the Ile-Alatau glaciers contributes significantly to downstream supply for Almaty and the transboundary Chon–Kemin and Chilik basins, continued glacier retreat could exacerbate seasonal water shortages, particularly during dry summers. Strengthening joint monitoring and data-sharing frameworks between Kazakhstan and Kyrgyzstan would therefore support coordinated adaptation and hazard-response strategies. Moreover, integrating glacier- and lake-change indicators into regional climate-resilience programs such as early-warning networks, catchment-scale flood-risk zoning, and sustainable-irrigation planning would enhance preparedness for future GLOF and water-stress scenarios. Furthermore, these results could inform the formulation of regional and national adaptation plans to address hydrological shifts and increased hazard risks. These results also support phase-aware (snow vs. rain) diagnostics, combined with debris-cover mapping and proglacial-lake monitoring, as more informative risk indicators than glacier-area loss alone.
Given the current climatic trends and the projections of continued warming, it is clear that the shrinkage of Ile-Alatau glaciers and the expansion of moraine lakes will persist. This study therefore serves as a vital call to action for integrating climate science into robust policy frameworks, ensuring the resilience of water resources and the safety of communities in the face of escalating environmental challenges.

6. Limitations and Future Research

While this study provides a comprehensive assessment of glacier dynamics and hydro-climatic trends in the Ile-Alatau Mountains, it is important to acknowledge certain limitations. One such limitation stems from the varying spatial resolutions and temporal gaps inherent in the historical remote sensing datasets; although efforts were made to select optimal imagery and minimize snow cover, older aerial photographs and early Landsat missions inherently offer less detail than contemporary Sentinel-2 data, which may introduce some uncertainty in the delineation of very small or complex glacier features over the entire study period. Additionally, while this study focused on areal changes in glaciers and moraine-dammed lakes, integrating DEM differencing or satellite altimetry in future analyses could help quantify volumetric changes and refine estimates of glacier mass balance and lake storage dynamics. Furthermore, the reliance on a limited number of meteorological stations, while strategically located, may not fully capture the microclimatic variability across the entire diverse topography of the Ile-Alatau range, particularly at very high altitudes where in situ data is scarce. While linear trends provide a valuable overview, they may not fully capture non-linear or abrupt shifts in climatic patterns. Building upon these findings, future research could focus on several key areas including implementing sophisticated glaciological models to estimate glacier mass balance for more accurate projections of future meltwater contributions, utilizing newer high-resolution Digital Elevation Models (DEMs) to assess glacier volume changes through differencing methods, and integrating glacier change data with regional hydrological models to forecast future runoff regimes and assess water availability scenarios under different climate projections. Further work could also investigate the role of supraglacial debris cover, which significantly influences melt rates, conduct more detailed studies on the evolution of moraine-dammed lakes including bathymetry and dam stability analysis to enhance disaster risk reduction, and integrate paleo-climatic reconstructions to extend the climatic and glaciological history beyond instrumental records. Addressing these limitations and pursuing these research directions will further enhance our understanding of cryosphere changes in the Ile-Alatau Mountains and improve regional climate change adaptation strategies.

7. Conclusions

This study presents a comprehensive evaluation of long-term hydro-climatic trends, glacier retreat, and moraine-lake evolution in the Ile-Alatau Mountains of the Northern Tien Shan. Integrating six decades of meteorological observations with multi-temporal satellite data reveals persistent regional warming and substantial glacier recession. Average annual temperatures increased by 0.16–0.53 °C per decade since 1961, while precipitation remained largely stable or declined slightly—producing an unfavourable mass-balance regime that caused a 47.4% loss in glacierized area between 1955 and 2021. Retreat was most pronounced in the Ulken Almaty and Talgar basins, with smaller glaciers (0.005 km2) showing the greatest proportional losses.
Simultaneously, the number of moraine-dammed lakes has increased by 16–18% between 2017 and 2024, with PlanetScope imagery revealing a proliferation of small, newly formed lakes in recently deglaciated terrain. While total lake area has remained nearly constant due to mitigation measures such as controlled drainage, these expanding water bodies signify ongoing permafrost degradation and enhanced meltwater storage. The weak spatial correlation between glacier loss and lake formation highlights the importance of local geomorphology and hydrological conditions in controlling post-glacial lake development.
The findings underscore that accelerated glacier melt coupled with stable precipitation is reshaping the hydrological and geomorphological systems of the Ile-Alatau. This transformation threatens long-term water availability for downstream users and increases the risk of GLOFs. Strengthened monitoring using satellite-based time series, in situ climate stations, and automated early-warning systems is essential.

Author Contributions

Conceptualization, G.I. and A.M.; methodology, G.I., A.M. and Z.B.; software, A.M. and N.S.; validation, G.I. and A.A.A.; formal analysis, Z.B. and N.S.; investigation, G.I.; resources, B.A. and A.A.A.; data curation, A.M. and N.S.; writing—original draft preparation, A.M. and A.A.A.; writing—review and editing, G.I. and N.S.; visualization, A.A.A. and B.A.; supervision, N.S. All authors have read and agreed to the published version of the manuscript.

Funding

This research was funded by Committee of Science of the Ministry of Science and Higher Education of the Republic of Kazakhstan, grant number BR21882365. This research was implemented with a focus on the partial requirements of Ph.D. candidates Gulnara Iskaliyeva’s and Aibek Merekeyev’s doctoral dissertations.

Data Availability Statement

Data are contained within this article.

Acknowledgments

We are grateful to all the authors of the articles that were discussed in this article.

Conflicts of Interest

The authors declare no conflicts of interest.

References

  1. Borodavko, P.S.; Volkova, E.S.; Mel`nik, M.A.; Litvinov, A.S.; Demberel, O. Climate Change Impact on High-Altitude Geomorphological Systems. IOP Conf. Ser. Earth Environ. Sci. 2018, 211, 012004. [Google Scholar] [CrossRef]
  2. Munroe, J.S.; Handwerger, A.L. Contribution of Rock Glacier Discharge to Late Summer and Fall Streamflow in the Uinta Mountains, Utah, USA. Hydrol. Earth Syst. Sci. 2023, 27, 543–557. [Google Scholar] [CrossRef]
  3. Pepin, N.C.; Arnone, E.; Gobiet, A.; Haslinger, K.; Kotlarski, S.; Notarnicola, C.; Palazzi, E.; Seibert, P.; Serafin, S.; Schöner, W.; et al. Climate Changes and Their Elevational Patterns in the Mountains of the World. Rev. Geophys. 2022, 60, e2020RG000730. [Google Scholar] [CrossRef]
  4. Qureshi, M.A.; Yi, C.; Xu, X.; Li, Y. Glacier Status during the Period 1973–2014 in the Hunza Basin, Western Karakoram. Quat. Int. 2017, 444, 125–136. [Google Scholar] [CrossRef]
  5. Kraaijenbrink, P.D.A.; Stigter, E.E.; Yao, T.; Immerzeel, W.W. Climate Change Decisive for Asia’s Snow Meltwater Supply. Nat. Clim. Change 2021, 11, 591–597. [Google Scholar] [CrossRef]
  6. Romshoo, S.A.; Abdullah, T.; Rashid, I.; Bahuguna, I.M. Explaining the Differential Response of Glaciers across Different Mountain Ranges in the North-Western Himalaya, India. Cold Reg. Sci. Technol. 2022, 196, 103515. [Google Scholar] [CrossRef]
  7. Mukhtar, K. The Impact of Climate Change on the Seismic Vulnerability of the Megalopolis of Almaty. Int. J. Hydrol. 2019, 3, 52–56. [Google Scholar] [CrossRef]
  8. Zhang, Q.; Shen, Z.; Pokhrel, Y.; Farinotti, D.; Singh, V.P.; Xu, C.Y.; Wu, W.; Wang, G. Oceanic Climate Changes Threaten the Sustainability of Asia’s Water Tower. Nature 2023, 615, 87–93. [Google Scholar] [CrossRef]
  9. Palomo, I. Climate Change Impacts on Ecosystem Services in High Mountain Areas: A Literature Review. Mt. Res. Dev. 2017, 37, 179–187. [Google Scholar] [CrossRef]
  10. Li, J.; Sun, M.; Yao, X.; Duan, H.; Zhang, C.; Wang, S.; Niu, S.; Yan, X. A Review of Karakoram Glacier Anomalies in High Mountains Asia. Water 2023, 15, 3215. [Google Scholar] [CrossRef]
  11. Wu, F.; Zhan, J.; Wang, Z.; Zhang, Q. Streamflow Variation Due to Glacier Melting and Climate Change in Upstream Heihe River Basin, Northwest China. Phys. Chem. Earth Parts A/B/C 2015, 79–82, 11–19. [Google Scholar] [CrossRef]
  12. Huss, M.; Hock, R. Global-Scale Hydrological Response to Future Glacier Mass Loss. Nat. Clim. Change 2018, 8, 135–140. [Google Scholar] [CrossRef]
  13. Azam, M.F.; Wagnon, P.; Vincent, C.; Ramanathan, A.L.; Kumar, N.; Srivastava, S.; Pottakkal, J.G.; Chevallier, P. Snow and Ice Melt Contributions in a Highly Glacierized Catchment of Chhota Shigri Glacier (India) over the Last Five Decades. J. Hydrol. 2019, 574, 760–773. [Google Scholar] [CrossRef]
  14. You, Q.-L.; Ren, G.-Y.; Zhang, Y.-Q.; Ren, Y.-Y.; Sun, X.-B.; Zhan, Y.-J.; Shrestha, A.B.; Krishnan, R. An Overview of Studies of Observed Climate Change in the Hindu Kush Himalayan (HKH) Region. Adv. Clim. Change Res. 2017, 8, 141–147. [Google Scholar] [CrossRef]
  15. He, Y.; Yang, T.; Ji, Q.; Chen, J.; Zhao, G.; Shao, W. Glacier Variation in Response to Climate Change in Chinese Tianshan Mountains from 1989 to 2012. J. Mt. Sci. 2015, 12, 1189–1202. [Google Scholar] [CrossRef]
  16. Zhang, Q.; Chen, Y.; Li, Z.; Xiang, Y.; Li, Y.; Sun, C. Recent Changes in Glaciers in the Northern Tien Shan, Central Asia. Remote Sens. 2022, 14, 2878. [Google Scholar] [CrossRef]
  17. Aizen, V.B.; Kuzmichenok, V.A.; Surazakov, A.B.; Aizen, E.M. Glacier Changes in the Central and Northern Tien Shan during the Last 140 Years Based on Surface and Remote-Sensing Data. Ann. Glaciol. 2006, 43, 202–213. [Google Scholar] [CrossRef]
  18. Che, Y.; Zhang, M.; Li, Z.; Wang, S.; Du, M.; Wang, P.; Wang, J.; Zhou, P. Quantitative Evaluation of Glacier Change and Its Response to Climate Change in the Chinese Tien Shan. Cold Reg. Sci. Technol. 2018, 153, 144–155. [Google Scholar] [CrossRef]
  19. Ahmad, Z.; Altaf, F.; Kamp, U.; Rahman, F.; Malik, S.M. Glacier Recession and Climate Change in Chitral, Eastern Hindu Kush Mountains of Pakistan, Between 1992 and 2022. Geosciences 2025, 15, 167. [Google Scholar] [CrossRef]
  20. Bhattacharya, A.; Bolch, T.; Mukherjee, K.; King, O.; Menounos, B.; Kapitsa, V.; Neckel, N.; Yang, W.; Yao, T. High Mountain Asian Glacier Response to Climate Revealed by Multi-Temporal Satellite Observations since the 1960s. Nat. Commun. 2021, 12, 4133. [Google Scholar] [CrossRef] [PubMed]
  21. Du, W.; Li, J.; Bao, A.; Wang, B. Mapping Changes in the Glaciers of the Eastern Tienshan Mountains during 1977–2013 Using Multitemporal Remote Sensing. J. Appl. Remote Sens. 2014, 8, 084683. [Google Scholar] [CrossRef]
  22. Baig, S.U.; Khan, H.; Muneeb, F.; Dad, K. Formation of a Hazardous Ice-Dammed Glacier Lake: A Case Study of Anomalous Behavior of Hassanabad Glacier System in the Karakoram. SN Appl. Sci. 2020, 2, 1285. [Google Scholar] [CrossRef]
  23. Zhang, Z.; Zhao, J.; Liu, S.; Zhang, Q.; Jiang, Z.; Xu, Y.; Su, H. Characterization of Three Surges of the Kyagar Glacier, Karakoram. Remote Sens. 2023, 15, 2113. [Google Scholar] [CrossRef]
  24. Daiyrov, M.; Narama, C.; Kääb, A.; Tadono, T. Formation and Outburst of the Toguz-Bulak Glacial Lake in the Northern Teskey Range, Tien Shan, Kyrgyzstan. Geosciences 2020, 10, 468. [Google Scholar] [CrossRef]
  25. Zhou, P.; Zhang, H.; Li, Z. Impact of Climate Change on the Glacier and Runoff of a Glacierized Basin in Harlik Mountain, Eastern Tianshan Mountains. Remote Sens. 2022, 14, 3497. [Google Scholar] [CrossRef]
  26. Petrakov, D.; Shpuntova, A.; Aleinikov, A.; Kääb, A.; Kutuzov, S.; Lavrentiev, I.; Stoffel, M.; Tutubalina, O.; Usubaliev, R. Accelerated Glacier Shrinkage in the Ak-Shyirak Massif, Inner Tien Shan, during 2003–2013. Sci. Total Environ. 2016, 562, 364–378. [Google Scholar] [CrossRef]
  27. Bolch, T. Climate Change and Glacier Retreat in Northern Tien Shan (Kazakhstan/Kyrgyzstan) Using Remote Sensing Data. Glob. Planet. Change 2007, 56, 1–12. [Google Scholar] [CrossRef]
  28. Severskiy, I.; Vilesov, E.; Armstrong, R.; Kokarev, A.; Kogutenko, L.; Usmanova, Z.; Morozova, V.; Raup, B. Changes in Glaciation of the Balkhash–Alakol Basin, Central Asia, over Recent Decades. Ann. Glaciol. 2016, 57, 382–394. [Google Scholar] [CrossRef]
  29. Blagovechshenskiy, V.; Kapitsa, V.; Kasatkin, N. Danger of GLOFs in the Mountain Areas of Kazakhstan. J. Earth Sci. Eng. 2015, 5, 182–187. [Google Scholar] [CrossRef]
  30. Medeu, A.R.; Popov, N.V.; Blagovechshenskiy, V.P.; Askarova, M.A.; Medeu, A.A.; Ranova, S.U.; Kamalbekova, A.; Bolch, T. Moraine-Dammed Glacial Lakes and Threat of Glacial Debris Flows in South-East Kazakhstan. Earth-Sci. Rev. 2022, 229, 103999. [Google Scholar] [CrossRef]
  31. Mussina, A.; Abdullayeva, A.; Barandun, M.; Cicoira, A.; Tursyngali, M. Assessment of the current state and temporal changes of glacial-moraine lakes in the Central and Eastern part of the northern slope of the Ile Alatau, Kazakhstan. J. Water Land Dev. 2024, 63 (X–XII), 19–24. [Google Scholar] [CrossRef]
  32. Nurakynov, S.; Kaldybayev, A.; Zulpykharov, K.; Sydyk, N.; Merekeyev, A.; Chepashev, D.; Nyssanbayeva, A.; Issanova, G.; Fang, G. Accelerated Glacier Area Loss in the Zhetysu (Dzhungar) Alatau Range (Tien Shan) for the Period of 1956–2016. Remote Sens. 2023, 15, 2133. [Google Scholar] [CrossRef]
  33. Kapitsa, V.; Shahgedanova, M.; Machguth, H.; Severskiy, I.; Medeu, A. Assessment of Evolution and Risks of Glacier Lake Outbursts in the Djungarskiy Alatau, Central Asia, Using Landsat Imagery and Glacier Bed Topography Modelling. Nat. Hazards Earth Syst. Sci. 2017, 17, 1837–1856. [Google Scholar] [CrossRef]
  34. Zhao, Q.; Zhang, S.; Ding, Y.J.; Wang, J.; Han, H.; Xu, J.; Zhao, C.; Guo, W.; Shangguan, D. Modeling Hydrologic Response to Climate Change and Shrinking Glaciers in the Highly Glacierized Kunma Like River Catchment, Central Tian Shan. J. Hydrometeorol. 2015, 16, 2383–2402. [Google Scholar] [CrossRef]
  35. Liu, J.; Lawson, D.E.; Hawley, R.L.; Chipman, J.; Tracy, B.; Shi, X.; Chen, Y. Estimating the Longevity of Glaciers in the Xinjiang Region of the Tian Shan through Observations of Glacier Area Change since the Little Ice Age Using High-Resolution Imagery. J. Glaciol. 2020, 66, 471–484. [Google Scholar] [CrossRef]
  36. Sun, M.; Li, Z.; Yao, X.; Zhang, M.; Jin, S. Modeling the Hydrological Response to Climate Change in a Glacierized High Mountain Region, Northwest China. J. Glaciol. 2015, 61, 127–136. [Google Scholar] [CrossRef]
  37. Gao, J.; Du, J.; Bai, Y.; Chen, T.; Zhuoma, Y. The Impact of Climate Change on Glacial Lake Outburst Floods. Water 2024, 16, 1742. [Google Scholar] [CrossRef]
  38. Vilesov, E.N.; Khonin, R.V. Central and Southern Kazakhstan, Lake Balkhash Basin. Basins of the Left Tributaries of the Ili River from the Mouth of the Kurty River to the Mouth of the Turgen River, Part 1. In Catalogue of Glaciers of the USSR; Hydrometeoizdat: Leningrad, Russia, 1967; Volume 13, Issue 2. [Google Scholar]
  39. Sydyk, N.; Iskaliyeva, G.; Sagat, M.; Merekeyev, A.; Balakay, L.; Kaldybayev, A.; Baygurin, Z.; Abishev, B. The Impact of Climate Change on the State of Moraine Lakes in Northern Tian Shan: Case Study on Four Moraine Lakes. Water 2025, 17, 2533. [Google Scholar] [CrossRef]
  40. Chigrinets, A.G.; Duskayev, K.K.; Mazur, L.P.; Chigrinets, L.; Akhmetova, S.T.; Mussina, A.K. Evaluation and Dynamics of the Glacial Runoff of the Rivers of the Ile Alatau Northern Slope in the Context of Global Warming. Int. J. Eng. Res. Technol. 2020, 13, 419. [Google Scholar] [CrossRef]
  41. Gul, J.; Muhammad, S.; Liu, S.; Ullah, S.; Ahmad, S.; Hayat, H.; Tahir, A.A. Spatio-Temporal Changes in the Six Major Glaciers of the Chitral River Basin (Hindukush Region of Pakistan) between 2001 and 2018. J. Mt. Sci. 2020, 17, 572–587. [Google Scholar] [CrossRef]
  42. Liu, Q.; Huang, C. Spatiotemporal Change of Water Balance Components in the Inland Region of Northwest China, 1998–2017. Resour. Sci. 2020, 42, 1175–1187. [Google Scholar] [CrossRef]
  43. Huang, Z.; Xu, J.; Zheng, L. Long-Term Change of Lake Water Storage and Its Response to Climate Change for Typical Lakes in Arid Xinjiang, China. Water 2023, 15, 1444. [Google Scholar] [CrossRef]
  44. Singh, V.; Jain, S.K.; Shukla, S. Glacier Change and Glacier Runoff Variation in the Himalayan Baspa River Basin. J. Hydrol. 2021, 593, 125918. [Google Scholar] [CrossRef]
  45. Yue, X.; Li, Z.; Li, H.; Wang, P.; Wang, L.; Zhao, J. Changes in the End-of-Summer Snow Line Altitude of Summer-Accumulation-Type Glaciers in the Eastern Tien Shan Mountains from 1994 to 2016. Remote Sens. 2021, 13, 1080. [Google Scholar] [CrossRef]
  46. He, Q.; Yang, J.; Zhao, Q.; Chen, H.; Wang, Y.; Wang, H.; Wang, X. Assessment of Water Resource Sustainability and Glacier Runoff Impact on the Northern and Southern Slopes of the Tianshan Mountains. Sustainability 2025, 17, 4812. [Google Scholar] [CrossRef]
  47. Kaldybayev, A.; Chen, Y.; Vilesov, E. Glacier Change in the Karatal River Basin, Zhetysu (Dzhungar) Alatau, Kazakhstan. Ann. Glaciol. 2016, 57, 11–19. [Google Scholar] [CrossRef]
  48. Zhang, Q.; Chen, Y.; Li, Z.; Li, Y.; Xiang, Y.; Bian, W. Glacier Changes from 1975 to 2016 in the Aksu River Basin, Central Tianshan Mountains. J. Geogr. Sci. 2019, 29, 984–1000. [Google Scholar] [CrossRef]
  49. Central and Southern Kazakhstan. Balkhash Lake Basin, Part 2. In Hydrometeoizdat Surface Water Resources of the USSR; Hydrometeoizdat: Leningrad, Russia, 1970; Volume 13, p. 114.
  50. Qureshi, M.A.; Li, Y.; Yi, C.; Xu, X. Glacial Changes in the Hunza Basin, Western Karakoram, since the Little Ice Age. Palaeogeogr. Palaeoclimatol. Palaeoecol. 2021, 562, 110086. [Google Scholar] [CrossRef]
  51. Li, Y.; Li, Y. Topographic and Geometric Controls on Glacier Changes in the Central Tien Shan, China, since the Little Ice Age. Ann. Glaciol. 2014, 55, 177–186. [Google Scholar] [CrossRef]
  52. Gholami, H.; Moradi, Y.; Lotfirad, M.; Gandomi, M.A.; Bazgir, N.; Shokrian Hajibehzad, M. Detection of Abrupt Shift and Non-Parametric Analyses of Trends in Runoff Time Series in the Dez River Basin. Water Supply 2022, 22, 1216–1230. [Google Scholar] [CrossRef]
  53. Jawak, S.D.; Wankhede, S.F.; Luis, A.J.; Balakrishna, K. Impact of Image-Processing Routines on Mapping Glacier Surface Facies from Svalbard and the Himalayas Using Pixel-Based Methods. Remote Sens. 2022, 14, 1414. [Google Scholar] [CrossRef]
  54. Li, X.; Wang, L.; Hu, B.; Chen, D.; Liu, R. Contribution of Vanishing Mountain Glaciers to Global and Regional Terrestrial Water Storage Changes. Front. Earth Sci. 2023, 11, 1134910. [Google Scholar] [CrossRef]
  55. Guo, W.; Liu, S.; Xu, J.; Wu, L.; Shangguan, D.; Yao, X.; Wei, J.; Bao, W.; Yu, P.; Liu, Q.; et al. The Second Chinese Glacier Inventory: Data, Methods and Results. J. Glaciol. 2015, 61, 357–372. [Google Scholar] [CrossRef]
  56. Wang, H.; Yang, R.; Li, X.; Cao, S. Glacier Parameter Extraction Using Landsat 8 Images in the Eastern Karakorum. IOP Conf. Ser. Earth Environ. Sci. 2017, 57, 012004. [Google Scholar] [CrossRef]
  57. Racoviteanu, A.E.; Paul, F.; Raup, B.; Khalsa, S.J.S.; Armstrong, R. Challenges and Recommendations in Mapping of Glacier Parameters from Space: Results of the 2008 Global Land Ice Measurements from Space (GLIMS) Workshop, Boulder, Colorado, USA. Ann. Glaciol. 2009, 50, 53–69. [Google Scholar] [CrossRef]
  58. Paul, F.; Kääb, A. Perspectives on the Production of a Glacier Inventory from Multispectral Satellite Data in Arctic Canada: Cumberland Peninsula, Baffin Island. Ann. Glaciol. 2005, 42, 59–66. [Google Scholar] [CrossRef]
  59. Tak, S.; Keshari, A.K. Investigating Mass Balance of Parvati Glacier in Himalaya Using Satellite Imagery Based Model. Sci. Rep. 2020, 10, 12211. [Google Scholar] [CrossRef] [PubMed]
  60. Otsu, N. A Threshold Selection Method from Gray-Level Histograms. IEEE Trans. Syst. Man Cybern. 1979, 9, 62–66. [Google Scholar] [CrossRef]
  61. Zhou, N.; Dixon, S.; Zhu, Z.; Dong, L.; Weiner, M. Spectrotemporal Modulation Sensitivity in Cochlear-Implant and Normal-Hearing Listeners: Is the Performance Driven by Temporal or Spectral Modulation Sensitivity? Trends Hear. 2020, 24, 2331216520948385. [Google Scholar] [CrossRef]
  62. Hanshaw, M.N.; Bookhagen, B. Glacial Areas, Lake Areas, and Snowlines from 1975 to 2012: Status of the Cordillera Vilcanota, Including the Quelccaya Ice Cap, Northern Central Andes, Peru. Cryosphere 2013, 8, 359–376. [Google Scholar] [CrossRef]
  63. Ji, L.; Zhang, L.; Wylie, B. Analysis of Dynamic Thresholds for the Normalized Difference Water Index. Photogramm. Eng. Remote Sens. 2009, 75, 1307–1317. [Google Scholar] [CrossRef]
  64. Deng, J.; Long, Y.; Zhang, J.; Gao, H.; Liu, S. A Water Body Boundary Search Method Combining Chemotaxis Mechanism and High-Resolution Grid Based on Unmanned Surface Vehicles. J. Mar. Sci. Eng. 2025, 13, 958. [Google Scholar] [CrossRef]
  65. Tielidze, L.G.; Nosenko, G.A.; Khromova, T.E.; Paul, F. Strong Acceleration of Glacier Area Loss in the Greater Caucasus between 2000 and 2020. Cryosphere 2022, 16, 489–504. [Google Scholar] [CrossRef]
  66. Paul, F.; Bolch, T.; Briggs, K.; Kääb, A.; McMillan, M.; McNabb, R.; Nagler, T.; Nuth, C.; Rastner, P.; Strozzi, T.; et al. Error Sources and Guidelines for Quality Assessment of Glacier Area, Elevation Change, and Velocity Products Derived from Satellite Data in the Glaciers_cci Project. Remote Sens. Environ. 2017, 203, 256–275. [Google Scholar] [CrossRef]
  67. Bolch, T.; Yao, T.; Kang, S.; Buchroithner, M.F.; Scherer, D.; Maussion, F.; Huintjes, E.; Schneider, C. A Glacier Inventory for the Western Nyainqentanglha Range and the Nam Co Basin, Tibet, and Glacier Changes 1976–2009. Cryosphere 2010, 4, 419–433. [Google Scholar] [CrossRef]
  68. Paul, F.; Barrand, N.E.; Baumann, S.; Berthier, E.; Bolch, T.; Casey, K.; Frey, H.; Joshi, S.P.; Konovalov, V.; Le Bris, R.; et al. On the Accuracy of Glacier Outlines Derived from Remote-Sensing Data. Ann. Glaciol. 2013, 54, 171–182. [Google Scholar] [CrossRef]
  69. Singh, S.; Kumar, R.; Bhardwaj, A.; Kumar, R.; Singh, A. Changing Climate and Glacio-Hydrology: A Case Study of Shaune Garang Basin, Himachal Pradesh. Int. J. Hydrol. Sci. Technol. 2018, 8, 258–272. [Google Scholar] [CrossRef]
  70. Luo, J.; Ke, C.Q.; Seehaus, T. The West Kunlun Glacier Anomaly and Its Response to Climate Forcing during 2002–2020. Remote Sens. 2022, 14, 3465. [Google Scholar] [CrossRef]
  71. Pelto, B.M.; Browning, B.; Bird, L.; Moyer, A.N.; Moore, R.D. Lake Surface and Downstream River Temperature Response to the Retreat of a Lake-Terminating Glacier. Hydrol. Process. 2024, 38, e15150. [Google Scholar] [CrossRef]
  72. Romshoo, S.A.; Nabi, B.; Dar, R.A. Influence of Debris Cover on the Glacier Melting in the Himalaya. Cold Reg. Sci. Technol. 2024, 222, 104204. [Google Scholar] [CrossRef]
  73. Seier, G.; Abermann, J.; Wecht, M.; Neureiter, A.; Sulzer, W.; Kellerer-Pirklbauer, A. Thinning and Dynamics of the Glacier Terminus at the Pasterze Glacier (Austria), 2016–2021. Cold Reg. Sci. Technol. 2024, 222, 104198. [Google Scholar] [CrossRef]
  74. Rai, S.; Altman, J.; Kopecký, M.; Pejcha, V.; Svoboda, M.; Doležal, J. Global Warming Alters Himalayan Hemlock’s Climate Sensitivity and Growth Dynamics. Clim. Dyn. 2024, 62, 2333–2347. [Google Scholar] [CrossRef]
  75. Dixit, A.; Goswami, A.; Jain, S.K.; Das, P. Remote Sensing of Snow Cover Dynamics and Climate Implications in the Indus, Ganga, and Brahmaputra River Basins. Clim. Dyn. 2024, 62, 7309–7327. [Google Scholar] [CrossRef]
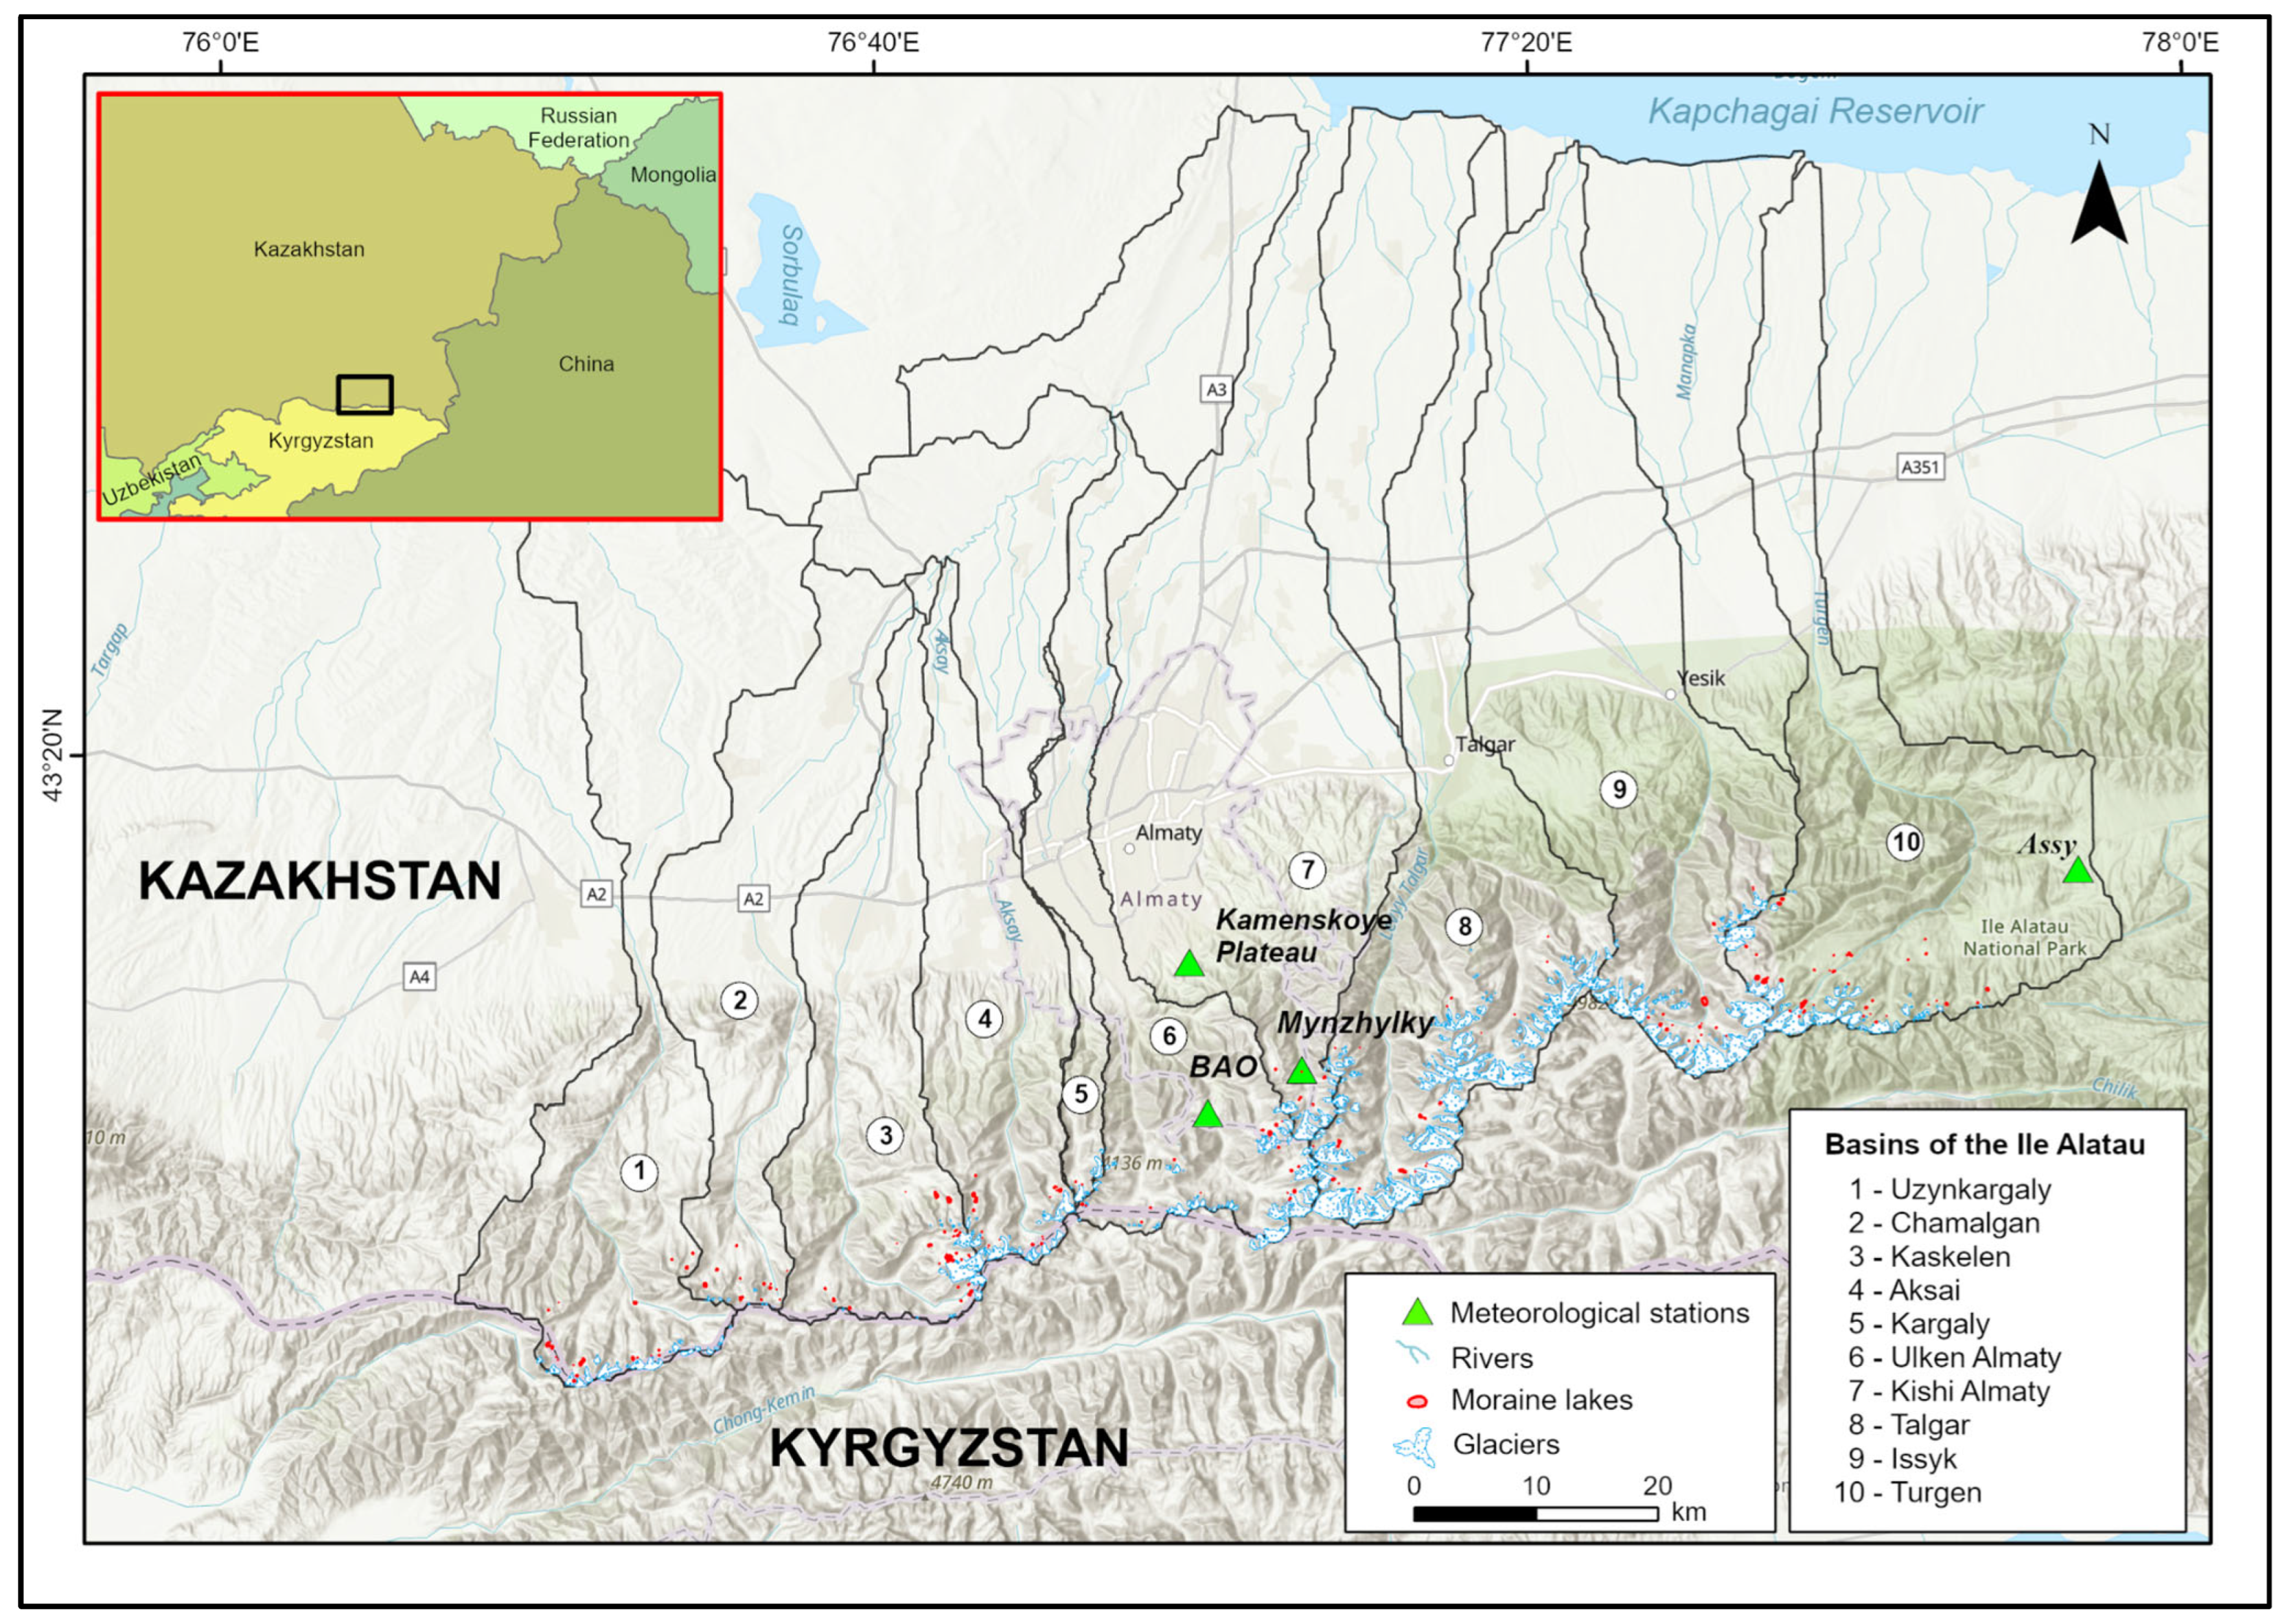
Figure 1. Geographical location of the Ile-Alatau Mountain range in the Northern Tien Shan, illustrating the spatial distribution of glaciers across its key river basins.
Atmosphere 16 01333 g001
Figure 2. Workflow of the methodology for assessing climate–glacier–lake dynamics in the Ile-Alatau region.
Atmosphere 16 01333 g002
Figure 3. Glacier mapping using semi-automated band ratio technique: (a) TM3/TM5, OLI4/OLI6 (glaciers are highlighted in light color); (b) Raster to Vector format conversion.
Atmosphere 16 01333 g003
Figure 4. High-resolution PlanetScope imagery used for visual verification and manual correction of glacial lake boundaries.
Atmosphere 16 01333 g004
Figure 5. Hydro-climatic dynamics at Kamenskoye Plateau meteorological station (1961–2023), illustrating trends in annual and summer air temperature, and annual total precipitation.
Atmosphere 16 01333 g005
Figure 6. Hydro-climatic dynamics at Ulken Almaty Lake meteorological station (1961–2024), illustrating trends in annual and summer air temperature, and annual total precipitation.
Atmosphere 16 01333 g006
Figure 7. Hydro-climatic dynamics at Mynzhylky meteorological station (1961–2023), illustrating trends in annual and summer air temperature, and annual total precipitation.
Atmosphere 16 01333 g007
Figure 8. Hydro-climatic dynamics at Assy meteorological station (1961–2022), illustrating trends in annual and summer air temperature, and annual total precipitation.
Atmosphere 16 01333 g008
Figure 9. Area of glaciers summarized in 5 × 5 km grid cells for period: (a) 1999; (b) 2021.
Atmosphere 16 01333 g009
Figure 10. Number of glaciers summarized in 5 × 5 km grid cells for period: (a) 1999; (b) 2021.
Atmosphere 16 01333 g010
Figure 11. Area of moraine lakes summarized in 5 × 5 km grid cells for period: (a) 2017; (b) 2024.
Atmosphere 16 01333 g011
Figure 12. Number of moraine summarized in 5 × 5 km grid cells for period: (a) 2017; (b) 2024.
Atmosphere 16 01333 g012
Figure 13. Relationship between change in glacier area (1999–2021) and number of new moraine lakes formed (2017–2024) across the Ile-Alatau basins.
Atmosphere 16 01333 g013
Figure 14. Field operations by the State Institution “Kazselezashchita” specialists.
Atmosphere 16 01333 g014
Table 1. Geographical location of selected meteorological stations.
Meteorological Station (MS)AltitudeCoordinatesDescription
Kamenskoe plateau131743°10.896′ N,
76°57.942′ E
Situated in the mountainous region of Zailiysky Alatau, closer to the city
Ulken Almaty Lake251743°03′ N,
76°59′ E
Situated in a mountainous region in the south-eastern part of Kazakhstan, near the city of Almaty.
Mynzhylky301743°5.1′ N,
77°4.65’ E
Situated along the northern slopes of the Zailiyskiy Alatau mountain range, in particular at the source of the Kishi Almaty River
Aces221642°15′ N,
70°08′ E
The station is located on the high-mountain plateau Assy-Turgen
Table 2. Details of acquisition of satellite data from multi-satellite earth observation data for mapping glaciers.
Scene SuitabilityMainAdditional InformationMainMainMain
WRS2 path-row149–030150–030149–030
Date8 August 199916 September 19999 August 201427 September 20217 September 2021
Satellite/sensorLandsat ETM+Landsat ETM+Landsat OLISentinel-2Sentinel-2
Resolution (m)15/30/6015/30/6015/30/6010/20/6010/20/60
Scene suitabilityMainAdditional informationMainMainMain
Table 3. Acquisition dates of satellite images for mapping glacial lakes and assessing changes.
No.PlanetScope Acquisition DateSentinel-2 Acquisition Date
18 August 20249 August 20249 August 2017
29 August 202427 August 202431 August 2017
327 August 202428 August 20243 September 2017
431 August 20243 September 202418 September 2017
Table 4. Benchmarking glacier area estimates.
Glaciers1 Day2 Day3 Day 4 Day5 DayMean. km2Mean-Koef., km2Automated with 2021 TM, km2STD, %
No. 460.420.430.440.430.430.430.420.413.3
No. 860.910.910.950.910.910.920.900.893.5
No. 1651.301.601.311.381.381.401.361.316.0
No. 2391.000.930.940.960.960.960.930.923.9
Average Standard Deviation4.2
Table 5. Results of moraine lake area uncertainty calculations.
BasinNamePlanetScopeSentinel-2
Area
(m2)
Perimeter
(m)
Uncertainty
(%)
Area
(m2)
Perimeter
(m)
Uncertainty
(%)
Ulken Almaty550,30012808.750,452.310802.2
Aksai1456,30015609.544,928.912852.9
1549,50011407.940,411.99182.3
Issyk6 (Akkol)184,50022204.1185,415.020771.2
Kaskelen184,60014806.075,789.913021.8
285,40020008.073,026.516902.4
8165,36234057.1138,381.024231.8
Talgar1362,19613287.363,420.213462.2
Turgen128,2008009.724,837.66332.6
1396,03419206.997,399.717551.9
1577,00018008.068,771.315742.4
1670,07711905.867,138.010421.6
Uzunkargaly799,80022007.687,842.818432.2
1453,50012207.849,818.39321.9
Chamalgan756,00012807.954,150.39911.9
Mean 2.1 7.5
Table 6. Mann–Kendall test results for monthly, summer, and annual air temperature trends at meteorological stations in the Ile-Alatau Mountains (1961–2024).
StationMann–Kendall StatsJuneJulyAugustSeptember Mean Summer
Period
Annual Mean
Kamenskoye PlateauZ-statistic3.91083.07063.53993.18065.18525.2316
p-value 0.0000910.002130.000400.00140.000000210.000000168
Significance****************
Ulken Almaty LakeZ-statistic2.89102.06831.74972.33483.76004.8029
p-value 0.00380.03860.08010.01950.0001690.0000015
Significance***********
MynzhylkyZ-statistic4.34523.85273.34873.44725.5905.9848
p-value 0.00001390.000116790.00081170.0005660.000000022590.000000002166
Significance******************
AssyZ-statistic2.02271.02041.98623.46221.88292.7211
p-value 0.04310.30750.0470040.00053570.05970.006504
Significance*(N.S.)*******
Statistically significant trends are marked based on p-values: p < 0.05 (*), p < 0.01 (**), and p < 0.001 (***). (N.S.) indicates non-significant trends.
Table 7. Mann–Kendall test results for monthly, summer, and annual precipitation trends at meteorological stations in the Ile-Alatau Mountains (1961–2024).
StationMann–Kendall StatsJuneJulyAugustSeptember Mean Summer
Period
Annual Mean
Kamenskoye PlateauZ-statistic−0.50980.8458−0.4519−0.2954−0.15640.7821
p-value 0.61010.39760.65130.76760.87560.4341
Significance(N.S.)(N.S.)(N.S.)(N.S.)(N.S.)(N.S.)
Ulken Almaty LakeZ-statistic−0.45760.30700.03470.57937−0.02890.7937
p-value 0.64710.75870.97220.56230.97680.4273
Significance(N.S.)(N.S.)(N.S.)(N.S.)(N.S.)(N.S.)
MynzhylkyZ-statistic−0.3070−0.80530.08690.4924−0.35920.3534
p-value 0.75870.42060.93070.62230.71940.7237
Significance(N.S.)(N.S.)(N.S.)(N.S.)(N.S.)(N.S.)
AssyZ-statistic−2.836−2.7576−1.5854−2.3446−3.3893−3.9724
p-value 0.00450.00580.112870.019040.00070.000071
Significance****(N.S.)******
Statistically significant trends are marked based on p-values: p < 0.05 (*), p < 0.01 (**), and p < 0.001 (***). (N.S.) indicates non-significant trends.
Table 8. Overall changes in glacier areas for the period 1955–2021.
Basins of the Ile Alatau19551999201420211955–19991955–20211999–20141999–20212014–2021
Area km2Area Decrease % (yr−1%)
Uzunkargaly10.69.5 ± 0.46.41± 0.265.38 ± 0.22−10.3%
(−0.2)
−49.3%
(−0.7)
−32.5%
(−2.2)
−43.4%
(−2.0)
−16.1%
(−2.3)
Chamalgan1.61.2 ± 0.050.38 ± 0.020.29 ± 0.01−24.6%
(−0.6)
−81.9%
(−0.2)
−68.4%
(−4.6)
−75.9%
(−3.5)
−23.8%
(−3.4)
Kaskelen9.68.8 ± 0.375.95 ± 0.255.02 ± 0.21−8.2%
(−0.2)
−47.7%
(−0.7)
−32.5%
(−2.2)
−43.1%
(−2.0)
−15.7%
(−2.2)
Aksai12.710.2 ± 0.437.06 ± 0.36.39 ± 0.26−19.5%
(−0.4)
−49.6%
(−0.8)
−30.9%
(−2.1)
−37.4%
(−1.7)
−9.4%
(−1.3)
Kargaly3.92.5 ± 0.111.57 ± 0.071.52 ± 0.06−35.0%
(−0.8)
−61.0%
(−0.9)
−38.2%
(−2.5)
−40.0%
(−1.8)
−3.0%
(0.4)
Ulken Almaty30.921.0 ± 0.8814.24 ± 0.612.48 ± 0.52−32.0%
(−0.7)
−59.6%
(−0.9)
−32.3%
(−2.2)
−40.6%
(−1.8)
−12.3%
(−1.8)
Kishi Almaty9.16.8 ± 0.284.64 ± 0.193.78 ± 0.16−25.5%
(−0.6)
−58.4%
(−0.9)
−31.5%
(−2.1)
−44.1%
(−1.8)
−18.3%
(−2.6)
Talgar107.982.5 ± 3.4764.96 ± 2.7360.41 ± 2.54−23.5%
(−0.5)
−44.0%
(−0.7)
−21.3%
(−1.4)
−26.8%
(−1.2)
−7.0%
(−1.0)
Issyk48.535.4 ± 1.4928.22 ± 1.1927.48 ± 1.15−27.1%
(−0.6)
−43.3%
(−0.7)
−20.2%
(−1.3)
−22.3%
(−1.0)
−2.6%
(−0.4)
Turgen34.824.7 ± 1.0419.49 ± 0.8218.9 ± 0.79−28.9%
(−0.7)
−45.7%
(−0.7)
−21.2%
(−1.4)
−23.6%
(−1.1)
−3.0%
(−0.4)
Glaciers < 0.005 km22.6
(56)
1.1 ± 0.05 (43)0.82 ± 0.03 (20)0.71 ± 0.02 (12)−41.5%
(−0.9)
−72.5%
(−1.1)
−46.2%
(−3.1)
−53.0%
(−2.4)
−12.6%
(−1.8)
General indicators269.6 (307)202.7 ± 8.51
(282)
152.9 ± 6.42
(230)
141.7 ± 5.95
(219)
−24.8%
(−0.6)
−47.4%
(−0.7)
−24.6%
(−1.6)
−30.1%
(−2.4)
−7.4%
(−1.1)
Table 9. Changes (and comparisons) in the number and area of moraine lakes for 2017–2024 with different spatial data.
Basins2017 Sentinel-22024 Sentinel-22024 PlanetScope
NumberArea,
m2
According to the 2017New in
Comparison with 2017
Area,
m2
Percentage Change in Comparison with 2017, %According to the 2017New in Comparison with 2017Area,
m2
Percentage Change in Comparison with 2017, %
Uzunkaragaly18329,127.4172307,101.3
± 23,032.6
−6.7172280,194.1−14.9
Chamalgan8119,600.582125,672.6
± 9425.4
+5.184127,822.2+6.9
Kaskelen21446,008.1218505,943.6
± 37,945.8
+13.4218447,680.7+0.4
Aksai15192,781.1152192,147.7
± 14,411.1
−0.3153157,158.3−18.5
Kargaly25973.3116290.0
± 471.8
+5.3114527.0−24.2
Ulken Almaty 13127,800.1117166,040.3
± 12,453.0
+29.9117139,036.7+8.8
Kishi Almaty 435,878.24240,844.3
± 3063.3
+13.84232,010.7−10.8
Talgar25230,325.1176235,357.7
± 17,651.8
+2.2176186,982.0−18.8
Issyk16294,623.5132269,541.2
± 20,215.6
−8.5133262,557.1−10.9
Turgen32495,825.2317512,792.8
± 38,459.5
+3.4318458,321.3−7.6
13840 13844
Total1542,277,943.01782,361,731.5
± 177,129.86
+3.71822,096,289.9−8.0
Disclaimer/Publisher’s Note: The statements, opinions and data contained in all publications are solely those of the individual author(s) and contributor(s) and not of MDPI and/or the editor(s). MDPI and/or the editor(s) disclaim responsibility for any injury to people or property resulting from any ideas, methods, instructions or products referred to in the content.