Article

Modulation of the Semi-Annual Oscillation by Stratospheric Sudden Warmings as Seen in the High-Altitude JAWARA Re-analyses

1
Department of Physics, Utah State University, Logan, UT 84322, USA
2
NILU—The Climate and Environmental Research Institute, 2007 Kjeller, Norway
3
Department of Earth and Planetary Science, The University of Tokyo, Tokyo 113-0033, Japan
*
Author to whom correspondence should be addressed.
Atmosphere 2025, 16(12), 1320; https://doi.org/10.3390/atmos16121320 (registering DOI)
Submission received: 25 October 2025 / Revised: 18 November 2025 / Accepted: 20 November 2025 / Published: 23 November 2025
(This article belongs to the Special Issue Observations and Analysis of Upper Atmosphere (2nd Edition))

Abstract

The semi-annual oscillation (SAO) dominates seasonal variability in the equatorial stratosphere and mesosphere. However, the seasonally dependent modulation of the SAO in the stratosphere (SSAO) and mesosphere (MSAO) by sudden stratospheric warmings (SSWs) in the Arctic has not been investigated in detail. In this study, we examine the seasonal evolution of the SAO during 16 major SSW events spanning 2004 to 2024 using the Japanese Atmospheric General Circulation Model for Upper Atmosphere Research Data Assimilation System Whole Neutral Atmosphere Re-analysis (JAWARA). Basic features of the SAO are well captured by JAWARA, as evidenced by the SSAO and MSAO appearing at around 50 km and 85 km, respectively. The different responses of the SAO to early and late winter SSWs are particularly strong during the Northern Hemisphere winter of 2023/24. Early winter SSWs tend to significantly intensify the westward SSAO, while late winter SSWs tend to weaken the eastward SSAO. Similarly, the eastward MSAO is amplified during early winter SSWs, whereas the westward MSAO is slightly weakened during late winter SSWs. The weak MSAO response is probably due to its smaller climatological magnitude. Modulation of the SAO by SSWs is related to meridional temperature changes during SSWs through the thermal wind balance. Our findings contribute to the understanding of coupling between the tropics and high latitudes, as well as interhemispheric coupling.

1. Introduction

The stratospheric semi-annual oscillation (SSAO) is a dominant mode of variability in zonal-mean zonal wind and temperature at low latitudes, extending from the mid- to the upper stratosphere. Locked with the seasonal cycle, it comprises a westward phase around solstices and an eastward phase around equinoxes. Near the stratopause, the zonal-mean zonal equatorial winds are climatologically westward from November to March before reversing to eastward until June, when the second, generally weaker cycle begins. These wind variations are not confined to the equatorial stratopause but are part of descending patterns from the mesosphere and span a latitude range. Indeed, the SSAO is accompanied by an out-of-phase oscillation throughout the mesosphere (the MSAO), and the two are collectively known as the SAO.
While the SSAO was first detected in rocket sonde data in the sixties [1], ample evidence for both components of the SAO has been acquired through different instruments such as satellite, ground-based, and in situ observations [2,3,4,5,6,7,8]. These include rocketsonde observations of winds and temperature, medium-frequency radar wind observations, and observations made from space by the High-Resolution Doppler Imager (HRDI), the Sounding of the Atmosphere using Broadband Emission Radiometry (SABER), or the Aura Microwave Limb Sounder (MLS).
The variability of the Northern Hemisphere (NH) polar stratosphere was remarkable during the winter of 2023/24, characterized by several major stratospheric sudden warmings (SSWs) spanning the early to late winter period [9,10,11,12]. Two SSWs occurred in mid-January and early March, which can be classified as major, according to the reversal of the eastward zonal-mean zonal winds at 60° N and 10 hPa [13]. Other weaker stratospheric warmings occurred in early January and mid-February but did not meet the above criterion for major warmings, with zonal-mean winds failing to either reverse to westward or to extend equatorward to 60° N [9]. This unusually disturbed stratosphere might have resulted from the conjunction of several external factors increasing the likelihood of an SSW occurrence, namely an easterly phase of the Quasi-Biennial Oscillation (QBO), El Niño conditions in the tropical Pacific Ocean, and the proximity to the solar maximum [10]. It provided an opportunity to examine, during a single winter, the complex way by which SSWs modulate the SAO during its seasonal cycle.
To this end, we examine the stratospheric and mesospheric dynamical variability in the newly developed Whole Neutral Atmosphere Re-analysis (JAWARA) data [14]. We examine the SAO seasonal evolution during the NH winter of 2023/24, as well as its mean evolution during a series of SSWs spanning the last two decades. We find that, near the stratopause, early winter SSWs tend to intensify the SSAO (then in its westward phase), while late winter SSWs tend to weaken the SSAO (then in its eastward phase). Similarly, the eastward MSAO is amplified during early winter SSWs, whereas the westward MSAO is slightly weakened during late winter SSWs.
The SSAO is understood to be driven by dissipation or absorption of equatorial Kelvin waves and gravity waves (GWs), especially during solstices, and by cross-equatorial advection of momentum and remote driving from extratropical quasi-stationary planetary waves (PWs), especially during equinoxes [4,15,16,17,18,19,20]. Selective filtering of upward-propagating waves by the SSAO plays a key role in driving the out-of-phase MSAO [20,21]. It had long been realized that an enhancement of PWs, in particular during SSWs, could generate an anomalously strong poleward stratospheric residual mean meridional circulation, advecting the zonal-mean westward flow from the summer hemisphere across the equator and into the winter hemisphere [22]. Yet, neither the seasonally dependent modulation of the SSAO by SSWs nor the implications for the MSAO had been investigated in detail using high-altitude re-analyses.
The issue is relevant for a better understanding of the coupling between the tropics and the high latitudes, as well as interhemispheric coupling.

2. Materials and Methods

The JAWARA re-analyses are produced through data assimilation using the Japanese Atmospheric General Circulation Model for Upper Atmosphere Research (JAGUAR) run at a horizontal resolution of T42 with 124 levels ranging from 0 to about 150 km, with a vertical resolution of about 1 km in the middle atmosphere, in the framework of the Interhemispheric Coupling Study by Observations and Modeling (ICSOM) [23]. A 4D local ensemble transform Kalman filter technique is used to assimilate conventional meteorological observations (U, V, and T from the National Center for Environmental Prediction re-analyses) below 30 km, as well as satellite temperatures from MLS (over 10–100 km), SABER (over 15–110 km), and the Defense Meteorological Satellite Program Special Sensor Microwave Imager/Sounder (DMSP SSMIS) (over 30–80 km). The model includes physical parameterizations necessary for the MLT region and two parameterizations of orographic and non-orographic gravity waves; more details can be found in recent papers [14]. The JAWARA data consists of hourly outputs, though daily means are used in this study, over a period spanning nearly two decades, namely from August 2004 to December 2024. JAWARA is a 50-member ensemble re-analysis, but only the ensemble mean is used in this study.
The JAWARA re-analyses have been found to reproduce the basic vertical structure of the SAO [14]: two maxima of the filtered semi-annual component of the zonal-mean equatorial winds are found near 50 km and near 85 km, corresponding to the peak altitudes of the SSAO and MSAO, respectively. JAWARA was also shown to capture the strong westward wind burst (up to −80 m/s in the zonal mean) observed in March 2023 by meteor radars at low latitudes in the upper mesosphere, part of an enhanced MSAO cycle [21].
In JAWARA, as in other re-analyses, the temperature satellite observations in the middle atmosphere are assimilated, not direct wind measurements. Hence, there are still discrepancies in the representation of the SAO among existing re-analyses and among satellite-based datasets [7,24]. In the latter, these may stem from the precise wind balance used to infer wind from temperature at low latitudes, where the geostrophic balance breaks down, but the assimilation methods and parametrizations used in the underlying model may play a role in the former. This is even true for the SSAO in re-analyses that do not extend into the realm of the MSAO. In the upper mesosphere, where the eddy flux terms associated with the migrating diurnal tide become non-negligible, the issue of tidal contamination of mean winds arises, as these eddy fluxes are often neglected in the gradient wind approximation [7].
In this study, major SSWs are defined as events when the zonal-mean zonal wind at 60° N and 10 hPa switches from eastward to westward. As the wind might fluctuate between westward and eastward following the onset, once a warming is identified, no day within 20 days can be defined as a new SSW onset to prevent the same event from being counted twice [13]. There is no restriction regarding the duration of the reversal, but final warmings (when the zonal-mean zonal wind fails to recover to eastward for at least 10 consecutive days before 30 April) are excluded. This led to the selection of 16 major SSW events over the period 2004–2024. As we are interested in the modulation of the SAO during its seasonal cycle, we divided these events into two categories: those occurring in January when the SSAO is at its maximum westward phase (6 events) and those occurring in February or March when the SSAO is in transition (10 events) (Table 1). There were no events in December, which explains why the first category is restricted to one month only. Note that two SSWs occurred in 2008, 2010, 2018, 2021, and 2024. A composite analysis, in which each SSW event is aligned in time such that Day 0 corresponds to the onset of the SSW, was performed separately for each category. Anomalies are defined with respect to the 30-day running mean of the daily climatology across all years. Note that 2020/21 and 2023/24 are the winters with events in both categories. Figure S1 compares the zonal-mean zonal wind during the 2023/24 winter across three datasets: the Modern-Era Retrospective analysis for Research and Applications, Version 2 (MERRA-2); the fifth-generation European Center for Medium-Range Weather Forecasts atmospheric re-analysis (ERA5); and JAWARA. The evolution of the polar vortex is nearly identical across the three datasets (panel a). On the other hand, SSAO shows some differences among the datasets during late December and early January, before its maximum, with westward winds stronger in JAWARA (panel b). The subsequent evolution is largely similar between the 3 datasets.
The meridional ( v ¯ * ) and vertical component ( w ¯ * ) of the residual mean meridional circulation (MMC) are defined as follows [25]:
v ¯ * = v ¯ ρ 1 ( ρ v θ ¯ / θ ¯ z ) z
w ¯ * = w ¯ + ( a cos ϕ ) 1 ( cos ϕ v θ ¯ / θ ¯ z ) ϕ
where a is the Earth radius; ϕ is the latitude; z is the log-pressure altitude; ρ is the atmospheric density; θ is the potential temperature; and v and w are the meridional and vertical components of the wind. The overbars denote the zonal-mean values, while the primes indicate the deviations from these zonal-mean values.
The zonal-mean zonal momentum equation in the Transformed Eulerian Mean (TEM) primitive equations is given as follows [25]:
u ¯ t = v ¯ * f ( a cos ϕ ) 1 ( u ¯ cos ϕ ) ϕ w ¯ * u ¯ z + ( ρ a cos ϕ ) 1 · F + X ¯
where f is the Coriolis parameter; u is the zonal wind; and F is the Eliassen–Palm (EP) flux. The first and second terms of the right-hand side represent the meridional and vertical advection of the zonal momentum, respectively. The third term of the right-hand side is the resolved wave forcing expressed as E-P flux divergence (EPFD). Resolved waves comprises all waves that the horizontal resolution can resolve (>twice grid spacing). X ¯ is other unresolved external forcings, primarily due to sub-grid scale processes such as GWs, which are approximately represented by GW parameterizations.

3. Results

Figure 1 shows the zonal-mean zonal wind at 60° N and 10 hPa during that 2023/24 winter in the JAWARA re-analyses, with the two major SSW onsets indicated by vertical lines (a). It also shows the equatorial zonal-mean zonal winds, averaged in latitude over 5° S–5° N, throughout the winter of 2023/24 at the altitudes of 50 km for the SAO (red solid line) and 85 km for the MSAO (blue solid line) (b). Also indicated are the mean interannual spreads of the two SAO components, measured as +/−1 standard deviation from the all-years climatological value. At 50 km, the equatorial winds are anomalously strong, i.e., more westward than climatology, at the onset of the mid-January SSW, and anomalously weak (eastward) at the onset of the March SSW. At 85 km, the eastward zonal winds are anomalously strong in early December but then weaken and even turn briefly westward before reaching their seasonal maximum in January (Figure 1b and Figure S2). This brief westward regime marks an interrupted descent of the eastward flow, analogous to a “hiccup of the QBO” [26], albeit of much shorter duration. The equatorial winds are anomalously weak (westward) at the onset of the March SSW. Additionally, the SAO is also significantly influenced by minor warmings occurring in early January and mid-February.
For our purpose, basic features of the SAO are well captured by JAWARA. Figure 2 shows the time–altitude evolution of equatorial zonal-mean zonal wind (averaged over 5° S–5° N) throughout the entire period 2004 to 2024. Alternating eastward (red) and westward (blue) wind, consistent with the SSAO and MSAO, are evident at about 50 km and 85 km, respectively (see also [14]). The strength, transition start, and duration of SSAO exhibit interannual variability. The 16 major SSW events from 2004 to 2024 are marked by arrows, colored according to whether they occur during the SSAO’s maximum phase (January) or during the transition phase (February–March).
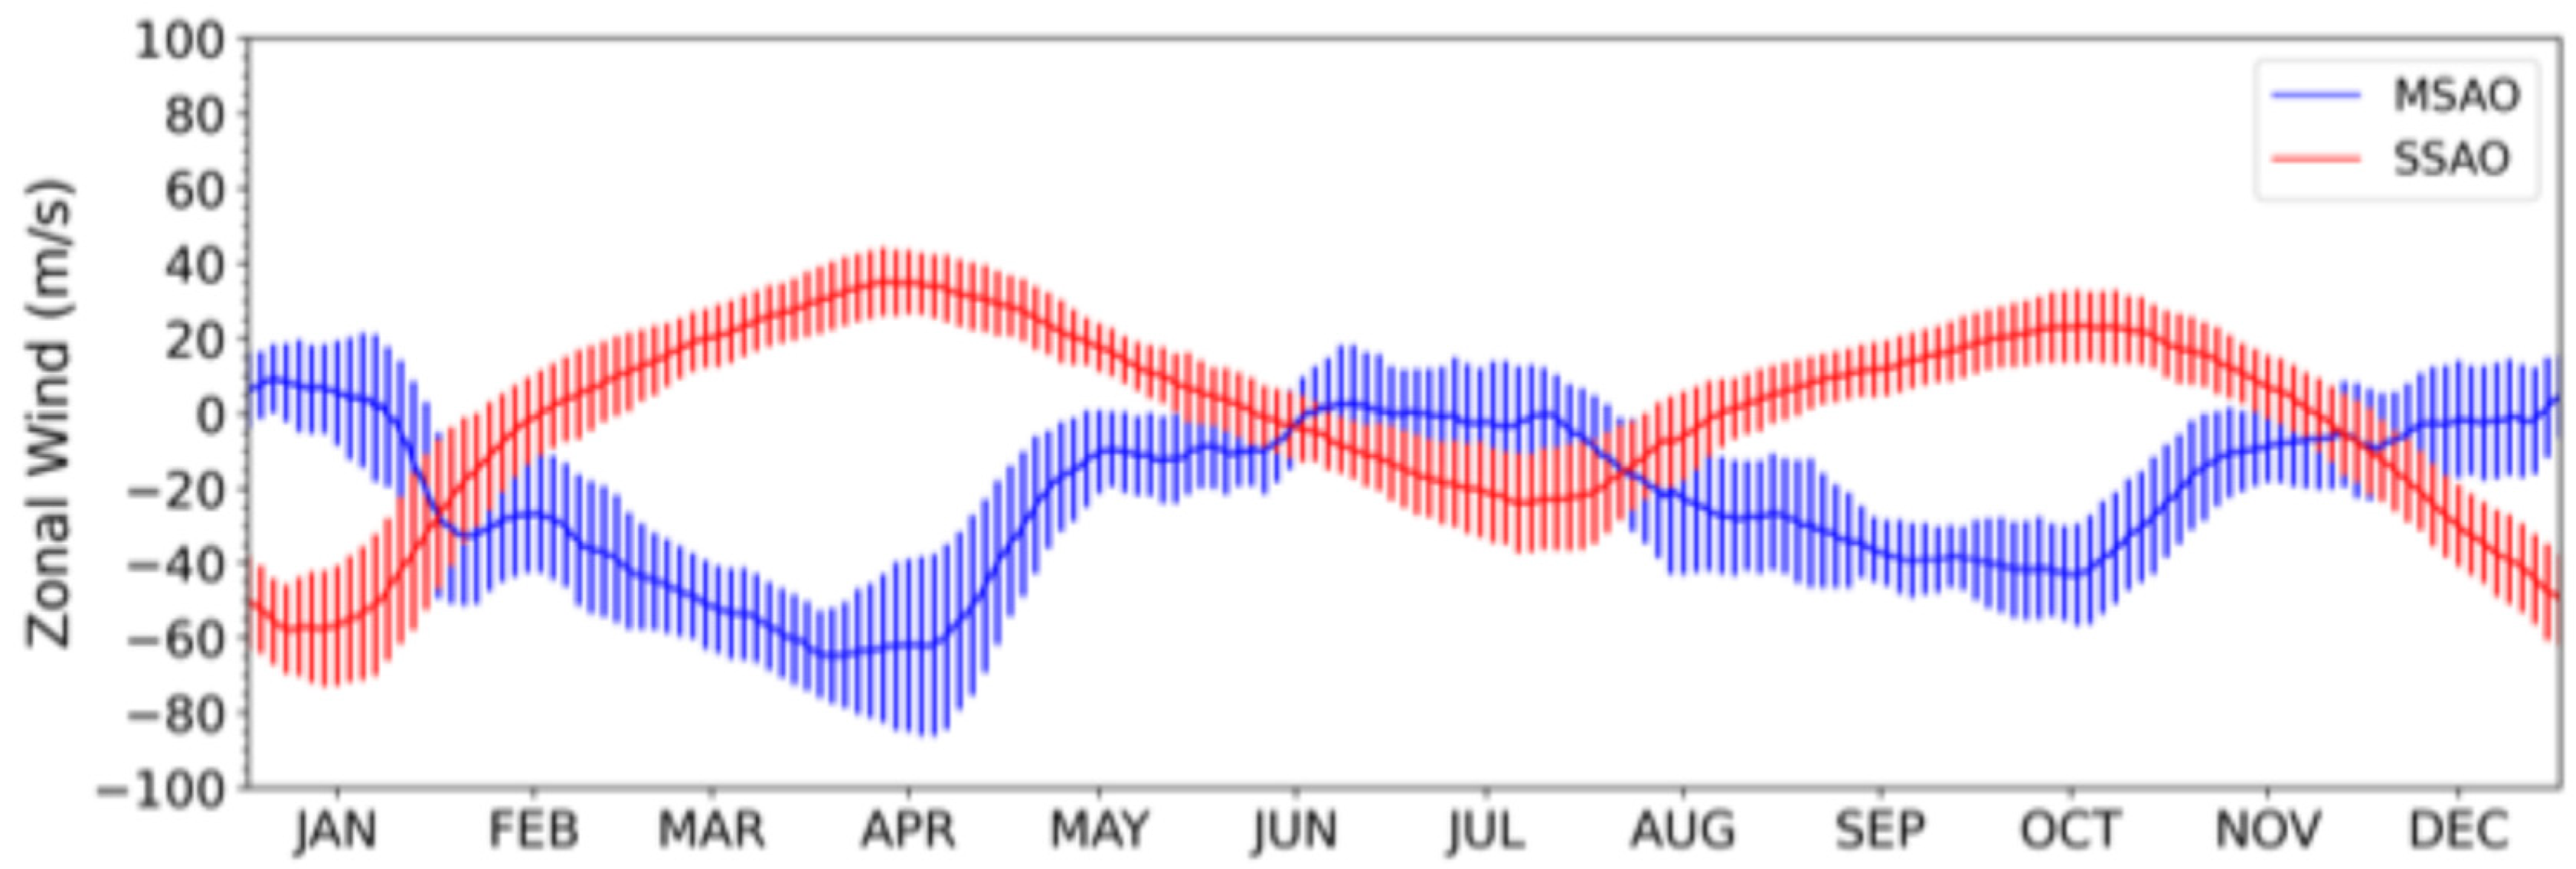
Figure 3 shows the mean climatological seasonal cycles of the SAO over the whole period at the altitudes of 50 and 85 km, with the same latitudinal averaging. The first cycle for both components is stronger than the second cycle: note the stronger westward winds of the SSAO (MSAO) in January (April) than in July (October), for example. The asymmetry is linked to the stronger extratropical PW forcing and Brewer–Dobson circulation during NH winter [27]. The first SSAO westward cycle peaks in January and transitions during February. This provides the rationale for dividing the 16 major SSW events into two categories according to whether they occur during the SSAO’s maximum phase (January) or during the transition phase (February–March) (see Section 2).
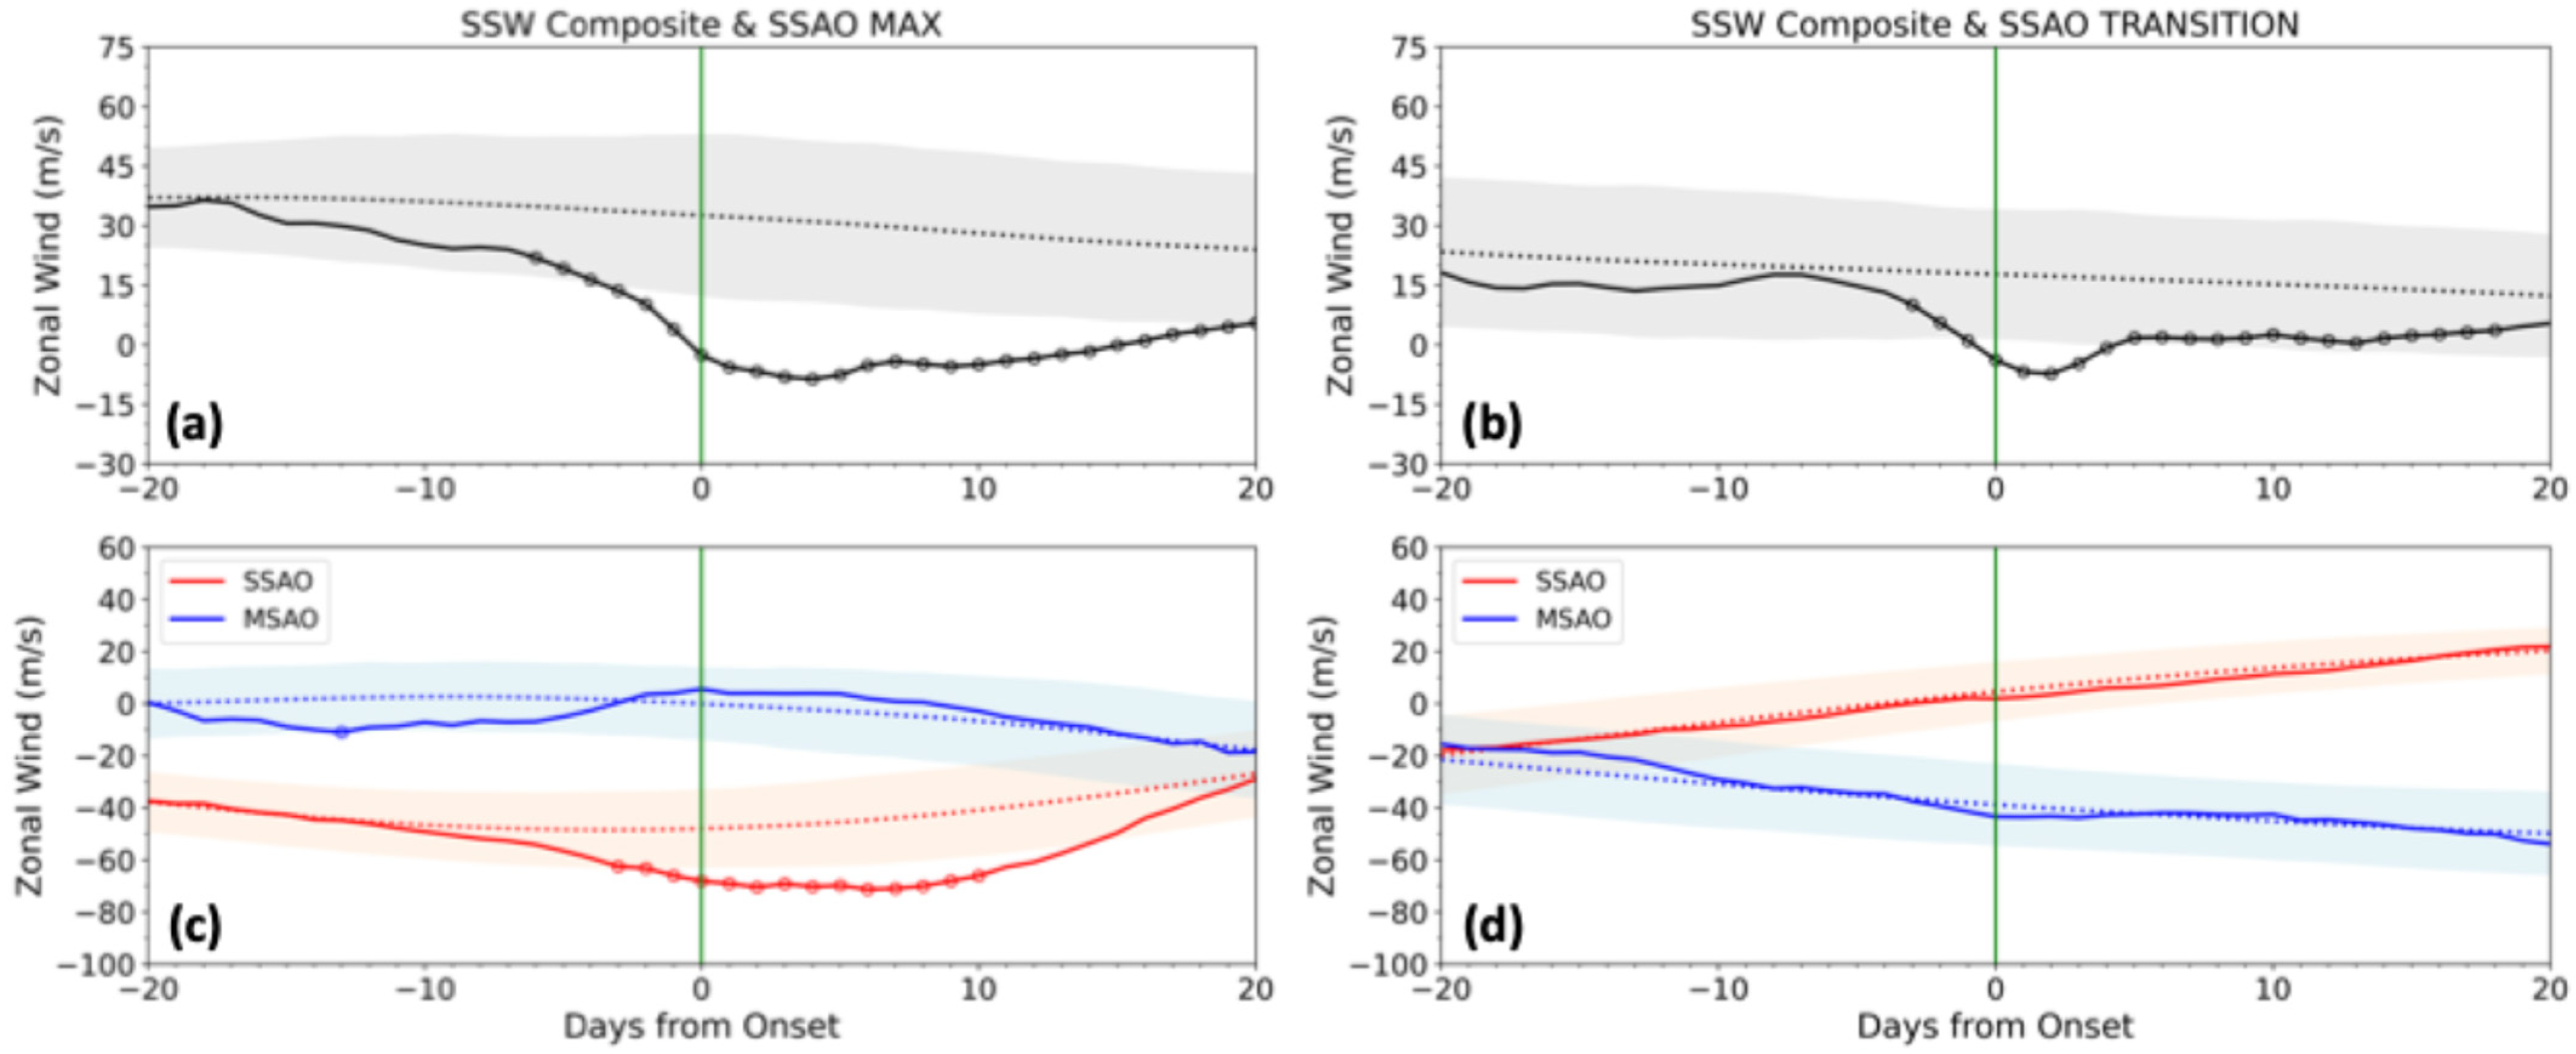
Figure 4 illustrates the time evolution of SSW composite zonal-mean zonal wind at 60° N (a and b) and over 5° S–5° N (c and d) during the SSAO maximum and the transition phase. Over the polar region, the eastward wind at 10 hPa starts to weaken around Day 10 and switches to westward after Day 0. The eastward wind returns around Day 15 and Day 5 during the SSAO maximum and transition phase, respectively (a and b). Near the stratopause, early winter SSWs tend to significantly intensify the westward SSAO (red solid and dotted lines in panel c), while late winter SSWs tend to weaken the eastward SSAO, albeit not significantly (red solid and dotted lines in panel d). On the other hand, the MSAO tends to slightly accelerate eastward during early winter SSWs, albeit again not significantly. Note that the climatological magnitude of the MSAO is small then, with weak eastward winds (dotted blue line in Figure 4c and blue line in Figure 3). The MSAO also shows a non-significant eastward acceleration to late winter SSWs in the composite (blue solid line in Figure 4d), which is in fact more pronounced during the March 2024 event (Figure 1b). The opposite response of the MSAO to SSWs, compared to the SSAO, is consistent with the selective filtering of GWs of the increased or decreased upper stratospheric zonal winds [21]. Given its significant response, we focus on the SSAO during early winter SSWs in the following paragraphs.
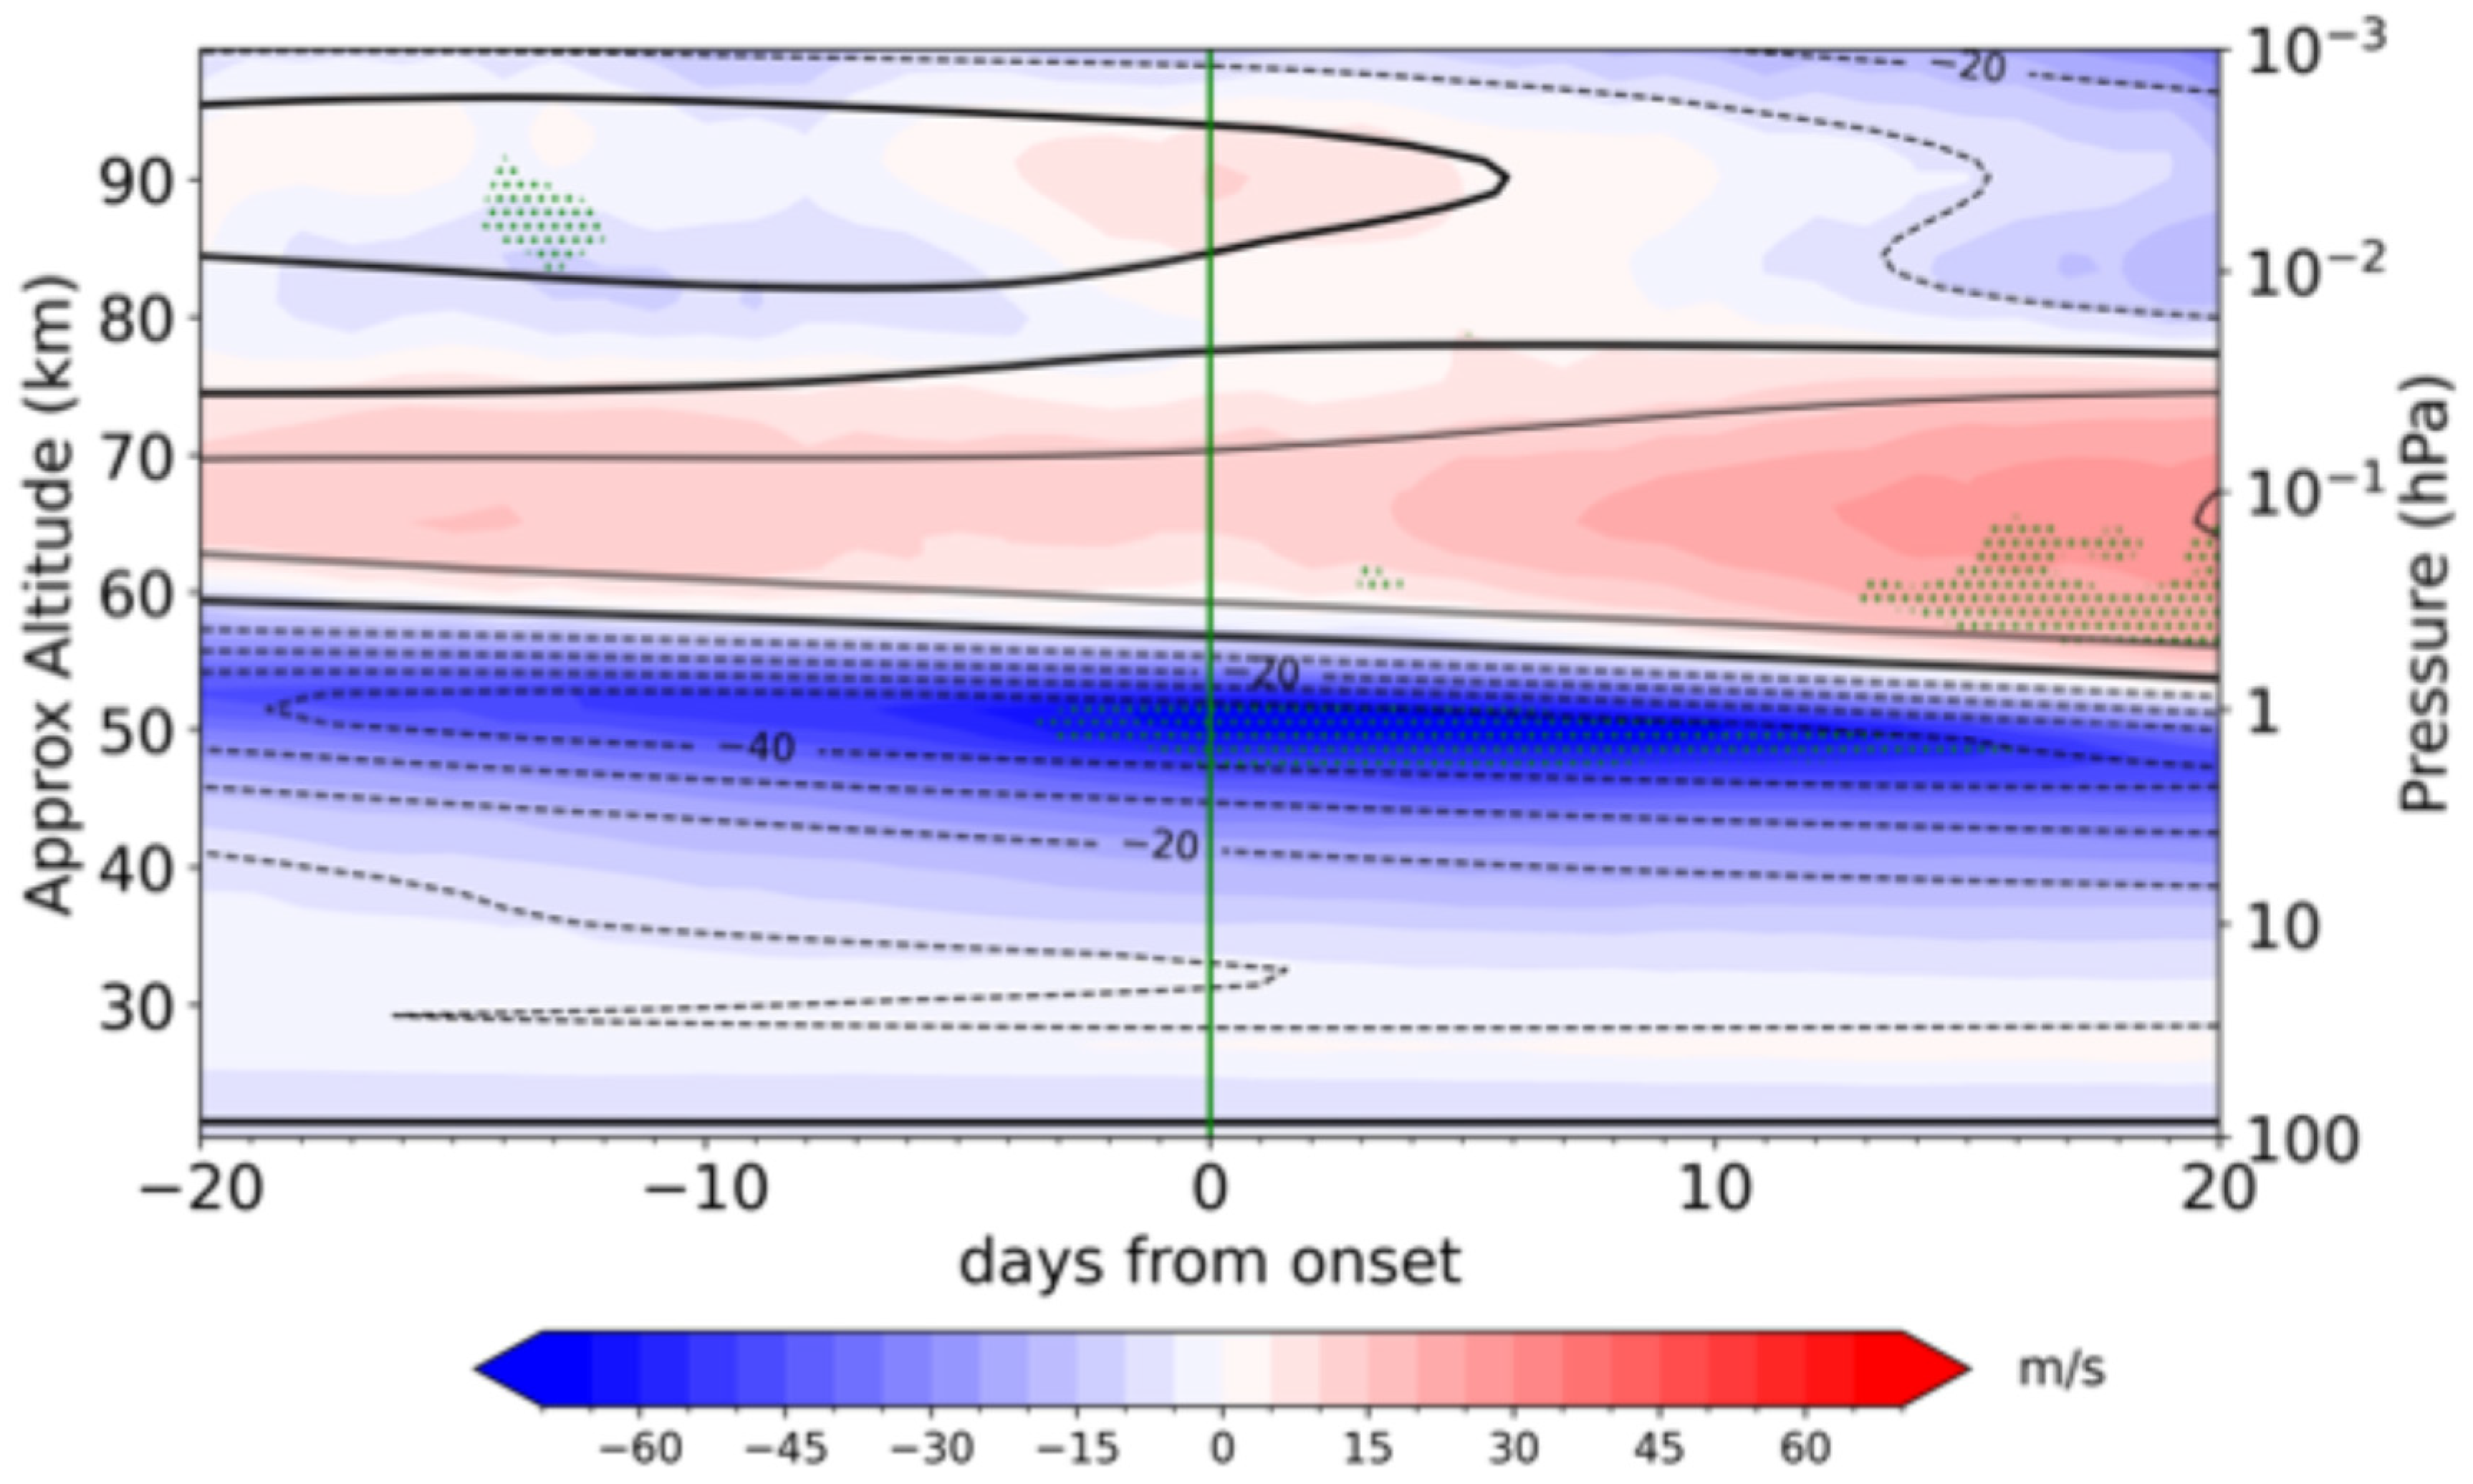
Drastic changes in the SSAO during early winter SSWs occur within 5 days before and 15 days after the SSW onset (Figure 5). During this period, the climatological westward SSAO (dashed lines) is significantly amplified between 45 km and 55 km (filled contours) in the composite, consistent with Figure 4c. The eastward MSAO also strengthens slightly between 80 km and 90 km, and the anomalies appear to be descending rapidly during this period. These changes in wind structures may modify GW and PW propagation. To investigate the underlying dynamical mechanisms, we further examine the period from Day 0 to Day 5.
Figure 6 shows time-averaged meridional cross sections of early winter SSW composites for zonal-mean zonal wind (a), temperature (b), meridional component of the residual MMC (c), vertical component of the residual MMC (d), resolved wave forcing (e), and GW forcing (f). Coinciding with the polar night jet deceleration (a), we see a vertically oriented dipole of temperature anomalies in the high latitudes of the upper stratosphere and mesosphere (b), with a vertically tilted warm anomaly into the Southern Hemisphere (SH) reminiscent of interhemispheric coupling. In the NH, total wave drag is mainly westward below 55 km, contributed mainly by resolved waves, and eastward above 55 km, contributed mainly by GWs. The eastward GW drag is due largely to the filtering effect of the underlying polar westward wind. The total wave forcing (panels e and f) drives a pair of residual circulation cells, with a lower hemispheric stratospheric cell characterized by poleward motions and downward (upward) motions at high (low) latitudes below 1 hPa, and an opposite cell aloft (panels c and d). The residual circulation induces a quadrupolar structure in temperature: cooling at the equator and warming over the polar region below 1 hPa, and the opposite pattern above (panel b). We expect that a thermal wind balance approximately holds at the equator, with the second derivative of temperature with respect to latitude proportional to vertical zonal wind shear. Over a local cooling (warming) at the equator, the curvature is positive (negative), leading to a negative (positive) vertical wind shear and a westward (eastward) acceleration. These structures appear for the SSAO (MSAO) region in the composite (panels a and b).

4. Discussion

Previous studies have demonstrated that the relationship between the SSAO and SSW is two-way; that is, capturing the SSAO equinoctial transition has been deemed important to correctly reproduce an SSW occurrence and downward progression in model case studies using a nudging approach [28,29]. This suggests that the background subtropical winds at altitudes where the SSAO prevails are important in setting up the flanks of the waveguide through which transient or quasi-stationary PWs propagate or reflect and in pre-conditioning SSW development [29,30]. Note that climate and forecasting models tend to have a westward bias in the SSAO region, e.g., [31], which may alter the waveguide shape and wave-mean flow interaction [28]. It is likely that a westward bias in the JAGUAR model in the SSAO altitude range would not be compensated entirely by the data assimilation method in JAWARA. In Figure S3, we show daily time series of such radar winds throughout the winter of 2023/24 from two sites within 20 degrees of the equator (panel a), along with corresponding winds in JAWARA (panel b) and their averages (panel c). At 85 km, the average bias is within 10 m/s in early winter 2023/24 but then exceeds 20 m/s in late winter (panel c).
The modulation of the SAO by SSWs could be part of a two-way process and feedback loop whereby subtle zonal wind variations in the subtropics pre-condition the occurrences of an SSW [28,29], which later modulates the subtropical winds around its onset, as demonstrated here. However, we cannot pursue this two-way issue further, as we examined re-analyses, not model sensitivity experiments to different realizations of the SSAO. Furthermore, we have focused on the SAO modulation surrounding the onset of SSWs and not on remote (i.e., 1–2 months) precursory conditions or wave driving [32]. Nevertheless, further understanding of the origin of the interannual variability of the SSAO equinoctial and solstitial transitions, climatologically in November and February (Figure 3), respectively, or of the SSAO wind maximum, would be desirable [8,28]. The same applies to the MSAO interannual variability for which the GW filtering role of the QBO and the interaction with the migrating diurnal tide have been highlighted [33].
GWs play a significant role in driving the SAO in the tropics. However, detailed knowledge of GW forcing is missing, and direct estimates from global observations of GWs are sparse [20]. NASA’s Atmospheric Waves Experiment (AWE) mission provides the first global characterization of GWs that originate in Earth’s lower atmosphere. The role of GWs in driving the MSAO could be further investigated in a follow-up study.

5. Conclusions

In this study, we examine the seasonal evolution of the SAO during the NH winter of 2023/24, as well as its mean evolution during a series of SSWs spanning the last two decades, using the newly developed JAWARA re-analyses. In total, 16 major SSW events occurred between 2004 and 2024, identified using the reversal of the eastward zonal-mean zonal winds at 60° N and 10 hPa. As we are interested in the modulation of the SAO during its seasonal cycle, 16 major SSW events are divided into two categories: those occurring in January when the SSAO is at its maximum westward phase (6 events) and those occurring in February or March when the SSAO is in transition (10 events). Key findings are summarized below:
  • The basic features of the SAO are well captured by JAWARA. Throughout the entire period from 2004 to 2024, SSAO and MSAO are evident at about 50 km and 85 km, respectively. As expected, the first cycle for both components is stronger than the second cycle.
  • A strong response in SAO is identified during the NH winter of 2023/24. At 50 km, the equatorial zonal-mean zonal winds are anomalously strong, i.e., more westward than climatology, at the onset of the mid-January SSW and anomalously weak (eastward) at the onset of the March SSW. At 85 km, the eastward zonal winds are anomalously stronger than climatology in December and January, in agreement with the composite, except for a brief reversal “hiccup” period (Figures S2 and S3). Following the early March SSW, zonal winds are westward and slightly weaker than climatology, in agreement with the composite.
  • The SSW composite shows that early winter SSWs tend to significantly intensify the westward SSAO, while late winter SSWs tend to weaken the eastward SSAO. On the other hand, the eastward MSAO is amplified during early winter SSWs, while the westward MSAO is slightly weakened during late winter SSWs. The weak MSAO response is probably due to its smaller climatological magnitude.
  • The residual mean meridional circulation changes associated with SSWs explain how early winter SSWs modulate the SAO. Resolved and GW forcings drive a pair of residual circulation cells, with a lower stratospheric cell characterized by poleward and upward motions and an opposite cell aloft. The anomalous upward (downward) motion in the stratosphere (mesosphere) induces cooling below 50 km (warming above 50 km) at the equator. The meridional temperature curvature induces westward (eastward) acceleration in the SSAO (MSAO) through thermal wind balance, thereby amplifying the SSAO and MSAO.
Our findings contribute to the understanding of coupling between the tropics and high latitudes, as well as interhemispheric coupling.

Supplementary Materials

The following supporting information can be downloaded at https://www.mdpi.com/article/10.3390/atmos16121320/s1, Figure S1: Time evolution of 2023/24 winter zonal-mean zonal wind at 10 hPa 60 ° N (a) and 50 km over 5 ° S–5 ° N (b). The red dashed, blue dotted, and black solid lines represent MERRA2, ERA5, and JAWARA, respectively; Figure S2: Time–height cross section of zonal-mean zonal wind over 5 ° S–5 ° N during the winter 2023/24; Figure S3: Time evolution of 2023/24 winter zonal wind at about 85 km in meteor radar and JAWARA. (a) Meteor radar zonal wind at Jicamarca (orange; 11.9 ° S 78.6 ° W) and Piura (cyan; 5.17 ° S 80.6 ° W), (b) JAWARA zonal wind sampled at these two meteor radar stations. Meteor radar zonal wind and JAWARA zonal wind averaged over these two stations (c). Latitudes and longitudes of the radar sites are indicated in parentheses.

Author Contributions

Conceptualization, J.Z. and Y.O.; methodology, J.Z. and Y.O.; software, J.Z.; validation, J.Z., Y.O. and K.S.; formal analysis, J.Z. and Y.O.; investigation, J.Z. and Y.O.; resources, J.Z. and Y.O.; data curation, J.Z.; writing—original draft preparation, J.Z. and Y.O.; writing—review and editing, J.Z., Y.O. and K.S.; visualization, J.Z.; supervision, Y.O.; project administration, Y.O.; funding acquisition, Y.O. All authors have read and agreed to the published version of the manuscript.

Funding

Y.O. and K.S. were partially supported by the International Space Science Institute (ISSI) in Bern and Beijing through the ISSI/ISSI-BJ International Team project “The mesosphere and lower thermosphere at low latitudes (MLTLoLa): its day-to-day variability and its contributions to thermospheric/ionospheric weather” (ISSI Team project #23-571; ISSI-BJ Team project #59).

Institutional Review Board Statement

Not applicable.

Informed Consent Statement

Not applicable.

Data Availability Statement

The JAWARA Re-analyses data was accessed through https://jawara.nipr.ac.jp/download (accessed on 1 September 2025).

Acknowledgments

We thank Jorge L. Chau, Mani Sivakandan, Danny Scipion, and Rodolfo Rodríguez for providing the radar data. The authors thank Toshihiko Hirooka for sharing his previous work on this topic (unpublished but presented at the 15th European Meteorological Society annual meeting in 2015).

Conflicts of Interest

The authors declare no conflicts of interest.

References

  1. Reed, R.J. Zonal wind behavior in the equatorial stratosphere and lower mesosphere. J. Geophys. Res. 1966, 71, 4223–4233. [Google Scholar] [CrossRef]
  2. Venkateswara Rao, N.; Tsuda, T.; Riggin, D.M.; Gurubaran, S.; Reid, I.M.; Vincent, R.A. Long-term variability of mean winds in the mesosphere and lower thermosphere at low latitudes. J. Geophys. Res. Space Phys. 2012, 117, A10312. [Google Scholar] [CrossRef]
  3. Ray, E.A.; Alexander, M.J.; Holton, J.R. An analysis of the structure and forcing of the equatorial semiannual oscillation in zonal wind. J. Geophys. Res. Atmos. 1998, 103, 1759–1774. [Google Scholar] [CrossRef]
  4. Hirota, I. Equatorial waves in the upper stratosphere and mesosphere in relation to the semiannual oscillation of the zonal wind. J. Atmos. Sci. 1978, 35, 714–722. [Google Scholar] [CrossRef]
  5. Hirota, I. Observational evidence of the semiannual oscillation in the tropical middle atmosphere—A review. Pure Appl. Geophys. 1980, 118, 217–238. [Google Scholar] [CrossRef]
  6. Garcia, R.R.; Dunkerton, T.J.; Lieberman, R.S.; Vincent, R.A. Climatology of the semiannual oscillation of the tropical middle atmosphere. J. Geophys. Res. Atmos. 1997, 102, 26019–26032. [Google Scholar] [CrossRef]
  7. Smith, A.K.; Garcia, R.R.; Moss, A.C.; Mitchell, N.J. The semiannual oscillation of the tropical zonal wind in the middle atmosphere derived from satellite geopotential height retrievals. J. Atmos. Sci. 2017, 74, 2413–2425. [Google Scholar] [CrossRef]
  8. Smith, A.K.; Gray, L.J.; Garcia, R.R. Evidence for the influence of the quasi-biennial oscillation on the semiannual oscillation in the tropical middle atmosphere. J. Atmos. Sci. 2023, 80, 1755–1769. [Google Scholar] [CrossRef]
  9. Vorobeva, E.; Orsolini, Y. The impact of tropospheric blocking on the duration of the sudden stratospheric warmings in boreal winter 2023/24. Weather Clim. Dyn. 2025, 6, 1015–1026. [Google Scholar] [CrossRef]
  10. Qian, L.; Rao, J.; Ren, R.; Shi, C.; Liu, S. Enhanced stratosphere-troposphere and tropics-Arctic couplings in the 2023/24 winter. Commun. Earth Environ. 2024, 5, 631. [Google Scholar] [CrossRef]
  11. Zhang, J.; Zhao, Y.; Pautet, P.D.; Scherliess, L.; Taylor, M.J.; Liu, H. Gravity wave activity during the 2024 sudden stratospheric warmings observed by atmospheric waves experiment (AWE). Geophys. Res. Lett. 2025, 52, e2024GL114187. [Google Scholar] [CrossRef]
  12. Zorkaltseva, O.S.; Antokhina, O.Y.; Gochakov, A.V.; Artamonov, M.F. Evolution of the stratospheric polar vortex as evidenced by the winters 2022–2024. Sol.-Terr. Phys. 2025, 11, 78–87. [Google Scholar]
  13. Charlton, A.J.; Polvani, L.M. A new look at stratospheric sudden warmings. Part I: Climatology and modeling benchmarks. J. Clim. 2007, 20, 449–469. [Google Scholar] [CrossRef]
  14. Koshin, D.; Sato, K.; Watanabe, S.; Miyazaki, K. The JAGUAR-DAS whole neutral atmosphere reanalysis: JAWARA. Prog. Earth Planet. Sci. 2025, 12, 1. [Google Scholar] [CrossRef]
  15. Dunkerton, T. On the role of the Kelvin wave in the westerly phase of the semiannual zonal wind oscillation. J. Atmos. Sci. 1979, 36, 32–41. [Google Scholar] [CrossRef]
  16. Holton, J.R.; Wehrbein, W.M. A numerical model of the zonal mean circulation of the middle atmosphere. Pure Appl. Geophys. 1980, 118, 284–306. [Google Scholar] [CrossRef]
  17. Hamilton, K.; Mahlman, J.D. General circulation model simulation of the semiannual oscillation of the tropical middle atmosphere. J. Atmos. Sci. 1988, 45, 3212–3235. [Google Scholar] [CrossRef]
  18. Hitchman, M.H.; Leovy, C.B. Estimation of the Kelvin wave contribution to the semiannual oscillation. J. Atmos. Sci. 1988, 45, 1462–1475. [Google Scholar] [CrossRef]
  19. Garcia, R.R. The role of equatorial waves in the semiannual oscillation of the middle atmosphere. Geophys. Monogr. Ser. 2000, 123, 161–176. [Google Scholar]
  20. Ern, M.; Diallo, M.; Preusse, P.; Mlynczak, M.G.; Schwartz, M.J.; Wu, Q.; Riese, M. The semiannual oscillation (SAO) in the tropical middle atmosphere and its gravity wave driving in reanalyses and satellite observations. Atmos. Chem. Phys. Discuss. 2021, 2021, 13763–13795. [Google Scholar] [CrossRef]
  21. Sato, K.; Koshin, D.; Suclupe, J.; Chau, J.L.; Lima, L.M.; Li, G.; Rao, S.V.B.; Ratnam, M.V.; Rodriguez, R.; Scipion, D. Causes of the abnormally strong easterly phase of the mesopause semiannual oscillation during the March equinox of 2023 revealed by a new reanalysis data covering the entire middle atmosphere. Geophys. Res. Lett. 2025, 52, e2025GL114658. [Google Scholar] [CrossRef]
  22. Limpasuvan, V.; Thompson, D.W.; Hartmann, D.L. The life cycle of the Northern Hemisphere sudden stratospheric warmings. J. Clim. 2004, 17, 2584–2596. [Google Scholar] [CrossRef]
  23. Sato, K.; Tomikawa, Y.; Kohma, M.; Yasui, R.; Koshin, D.; Okui, H.; Watanabe, S.; Miyazaki, K.; Tsutsumi, M.; Murphy, D.; et al. Interhemispheric Coupling Study by Observations and Modelling (ICSOM): Concept, campaigns, and initial results. J. Geophys. Res. Atmos. 2023, 128, e2022JD038249. [Google Scholar] [CrossRef]
  24. Kawatani, Y.; Hamilton, K.; Miyazaki, K.; Fujiwara, M.; Anstey, J.A. Representation of the tropical stratospheric zonal wind in global atmospheric reanalyses. Atmos. Chem. Phys. 2016, 16, 6681–6699. [Google Scholar] [CrossRef]
  25. Andrews, D.G.; Leovy, C.B.; Holton, J.R. Middle Atmosphere Dynamics; Academic Press: Cambridge, MA, USA, 1987; Volume 40. [Google Scholar]
  26. Newman, P.A.; Coy, L.; Pawson, S.; Lait, L.R. The anomalous change in the QBO in 2015–2016. Geophys. Res. Lett. 2016, 43, 8791–8797. [Google Scholar] [CrossRef]
  27. North, G.R.; Pyle, J.A.; Zhang, F. (Eds.) Encyclopedia of Atmospheric Sciences; Elsevier: Amsterdam, The Netherlands, 2014; Volume 1. [Google Scholar]
  28. Gray, L.J.; Brown, M.J.; Knight, J.; Andrews, M.; Lu, H.; O’Reilly, C.; Anstey, J. Forecasting extreme stratospheric polar vortex events. Nat. Commun. 2020, 11, 4630. [Google Scholar] [CrossRef] [PubMed]
  29. Gray, L.J.; Lu, H.; Brown, M.J.; Knight, J.R.; Andrews, M.B. Mechanisms of influence of the Semi-Annual Oscillation on stratospheric sudden warmings. Q. J. R. Meteorol. Soc. 2022, 148, 1223–1241. [Google Scholar] [CrossRef]
  30. Rhodes, C.T.; Limpasuvan, V.; Orsolini, Y. The composite response of traveling planetary waves in the middle atmosphere surrounding sudden stratospheric warmings through an overreflection perspective. J. Atmos. Sci. 2023, 80, 2635–2652. [Google Scholar] [CrossRef]
  31. Jaison, A.M.; Gray, L.J.; Osprey, S.; Smith, A.K.; Garcia, R.R. A momentum budget study of the semi-annual oscillation in the Whole Atmosphere Community Climate Model. Q. J. R. Meteorol. Soc. 2024, 150, 3544–3565. [Google Scholar] [CrossRef]
  32. Koushik, N.; Kumar, K.K.; Pramitha, M. A tropical stratopause precursor for sudden stratospheric warmings. Sci. Rep. 2022, 12, 2937. [Google Scholar] [CrossRef]
  33. Suclupe, J.; Chau, J.L.; Conte, J.F.; Pedatella, N.M.; Garcia, R.; Sato, K.; Zülicke, C.; Lima, L.M.; Li, G.; Rao, S.V.B.; et al. On the abnormally strong westward phase of the mesospheric semiannual oscillation at low latitudes during March equinox 2023. Geophys. Res. Lett. 2024, 51, e2024GL110331. [Google Scholar] [CrossRef]
Figure 1. Time evolution of 2023/24 winter zonal-mean zonal wind at 60 ° N and 10 hPa (a) or averaged over 5 ° S–5 ° N (b). The solid lines are the SSW composites, the dotted lines are the climatologies, and the shadings indicate one standard deviation. The red lines represent the stratospheric semi-annual oscillation (SSAO) and pertain to 50 km, while the blue lines represent the mesospheric semi-annual oscillation (MSAO) and pertain to 85 km. The two major SSW onsets are indicated by vertical green lines. Open circles indicate where the statistical significance level is above 95%.
Atmosphere 16 01320 g001
Figure 2. Altitude–time section of zonal-mean zonal wind averaged over 5 ° S–5 ° N from 13 August 2004 to 31 December 2024. The unit is m s−1. Orange (green) arrows indicate SSW events occurring when the stratospheric semi-annual oscillation (SSAO) peaks (transits). Years denote January of each year.
Atmosphere 16 01320 g002
Figure 3. Climatological evolution of zonal-mean zonal wind averaged over 5 ° S–5 ° N. The unit is m s−1. Blue and red curves show the stratospheric semi-annual oscillation (SSAO) at 50 km and mesospheric semi-annual oscillation (MSAO) at 85 km, respectively. Vertical bars indicate the standard deviation of interannual variability from 2004 to 2024.
Atmosphere 16 01320 g003
Figure 4. Time evolution of SSW composite zonal-mean zonal wind at 60 ° N and 10 hPa (a,b) or averaged over 5 ° S–5 ° N (c,d) during the SSAO maximum phase (January) and transition phase (February–March). Time is shown relative to the SSW onset (Day 0, green vertical line). The solid lines are the SSW composites, the dotted lines are the climatologies, and the shadings indicate one standard deviation. The red lines represent the stratospheric semi-annual oscillation (SSAO) and pertain to 50 km, while the blue lines represent the mesospheric semi-annual oscillation (MSAO) and pertain to 85 km. Open circles indicate where the statistical significance level is above 95%.
Atmosphere 16 01320 g004
Figure 5. Altitude–time section of SSW composite zonal-mean zonal wind averaged over 5 ° S–5 ° N during the SSAO maximum. The unit is m s−1. The filled contours are anomalies, while black contours are the climatology. The interval of the black contours is 10 m/s. Green dots show where the statistical significance level is above 95%.
Atmosphere 16 01320 g005
Figure 6. Latitude-altitude cross sections of SSW composites for zonal-mean zonal wind (a), temperature (b), meridional component (c) and vertical component (d) of the residual mean meridional circulation, resolved wave forcing (e), and gravity wave forcing (f) averaged from Day 0 to Day 5 during the SSAO maximum. The filled contours are anomalies, while black contours are the climatologies. The units are m s−1, K, m s−1, cm s−1, m s−1 day−1, and m s−1 day−1, respectively.
Atmosphere 16 01320 g006
Table 1. Onset dates of SSW events from 2004 to 2024 wintertime. SSW events occurring when the stratospheric semi-annual oscillation (SSAO) peaks (transits) are marked by orange (green).
YearJanuaryFebruaryMarch
2004–2005
2005–200621 January 2006
2006–2007 24 February 2007
2007–2008 22 February 200828 March 2008
2008–200924 January 2009
2009–2010 9 February 201024 March 2010
2010–2011
2011–2012
2012–20136 January 2013
2013–2014
2014–2015
2015–2016
2016–2017
2017–2018 12 February 201820 March 2018
2018–20191 January 2019
2019–2020
2020–20215 January 20211 February 2021
2021–2022
2022–2023 16 February 2023
2023–202416 January 2024 4 March 2024
Disclaimer/Publisher’s Note: The statements, opinions and data contained in all publications are solely those of the individual author(s) and contributor(s) and not of MDPI and/or the editor(s). MDPI and/or the editor(s) disclaim responsibility for any injury to people or property resulting from any ideas, methods, instructions or products referred to in the content.