Article

Climate Impact on the Seasonal and Interannual Variation in NDVI and GPP in Mongolia

by
Justinas Kilpys
1,*,
Egidijus Rimkus
1,
Oyunsanaa Byambasuren
2,3,
Jambajamts Lkhamjav
4 and
Tseren-Ochir Soyol-Erdene
2,5
1
Institute of Geosciences, Vilnius University, LT-03101 Vilnius, Lithuania
2
Department of Environmental and Forest Engineering, School of Engineering and Technology, National University of Mongolia, Ulaanbaatar 14201, Mongolia
3
Regional Central Asia Fire Management Resource Center, National University of Mongolia, Ulaanbaatar 14201, Mongolia
4
Department of Meteorology and Hydrology, School of Science and Art, National University of Mongolia, Ulaanbaatar 14201, Mongolia
5
Center for Environmental Technology and Development, National University of Mongolia, Ulaanbaatar 14201, Mongolia
*
Author to whom correspondence should be addressed.
Atmosphere 2025, 16(11), 1307; https://doi.org/10.3390/atmos16111307
Submission received: 13 October 2025 / Revised: 17 November 2025 / Accepted: 18 November 2025 / Published: 19 November 2025
(This article belongs to the Section Climatology)

Abstract

This study examined the influence of climate variability on vegetation dynamics in Mongolia from 2000 to 2024, using ERA5-Land reanalysis data together with the Normalized Difference Vegetation Index (NDVI) and Gross Primary Productivity (GPP) indicators. The results show a statistically significant mean annual air temperature increase of 0.94 °C, with the most pronounced warming occurring in March (>1.5 °C/10 years). Annual precipitation increased by 32 mm (~13%), mainly in the northern and eastern regions. At the same time, the maximum NDVI increased at a rate of 0.025 units/10 years, particularly in the north and east, while no change or slight decline was observed in the central steppes during May–June. During the study period, the average annual GPP increased by 38%, from 0.25 to 0.35 kgCm−2, with the highest gains observed in northern forests and eastern steppes. Correlation analysis revealed that NDVI is most sensitive to temperature in early spring (r = 0.31) and to precipitation in summer (r = 0.45–0.50). GPP primarily is driven by temperature in spring (r = 0.68) and by precipitation during summer (r = 0.30). The results of this study indicate that vegetation productivity in Mongolia is sensitive to seasonal climate variability, with temperature being the primary factor influencing spring growth and precipitation controlling summer growth.

Graphical Abstract

1. Introduction

Research on vegetation dynamics reveals complex interactions between climate change, human activity, and local ecosystems, particularly in grasslands. Since the 1980s, changes in grassland biomass have been observed globally, with trends varying by region. A study combining the satellite-based Normalized Difference Vegetation Index (NDVI) data with field observations from 84 grasslands across six continents found biomass increases in warm, moist, and species-rich areas, whereas declines occurred in arid regions with lower species diversity [1].
The relationship between NDVI and climate variables (temperature and precipitation) was analyzed to assess the impact of climate change on vegetation dynamics on the Mongolian Plateau from 1982 to 2100 [2]. Results show that NDVI increased until the mid-1990s but later declined, mainly due to a significant decrease in rainfall. Analysis indicates that around 66% of the plateau exhibited an upward trend before this shift, but afterward, 60% showed a decline. Vegetation loss was attributed to rising temperatures and decreased precipitation [2,3]. Higher temperatures directly impact vegetation by accelerating evaporation and intensifying droughts, while drier conditions also weaken vegetation’s recovery potential [4]. Nanzad et al. [5] analyzed NDVI data from Mongolia from 2000 to 2016 to assess the impacts of drought on vegetation. The study found that precipitation had a greater impact on NDVI than temperature. However, the strength of the impact of each factor depends on the vegetation type [5]. Regression analysis of NDVI data revealed significant changes in vegetation across half of Mongolia, with variations in latitude. Positive NDVI changes were more prevalent in northern Mongolia, while negative changes were primarily observed in the northeast. Results indicate that precipitation changes significantly influence trend patterns [6].
Enebish et al. [7] linked a sharp drop in NDVI in 1995 to atmospheric circulation that reduced moisture, as the precipitation zone shifted north of Mongolia. Because water availability is essential for ecosystem stability, these changes significantly degraded Mongolian grasslands. Although the decline in climate extremes led to some NDVI growth in later years, biomass was again lost as livestock numbers increased, leaving the region highly vulnerable to a return of extreme climate conditions [7].
Climate impacts on vegetation are further intensified by direct human activities such as overgrazing. Satellite data revealed that 70% of steppe ecosystems in Mongolia are degrading, with increased livestock grazing being the primary cause of vegetation loss, explaining up to 80% of the observed degradation in some areas. At the same time, precipitation changes were also an important factor [8]. X. Meng et al. [9] analyzed NDVI dynamics from 1982 to 2015 and found that areas of vegetation degradation and growth were roughly equal, although different vegetation types responded in distinct ways. Research also shows that while precipitation is the main factor influencing vegetation, livestock quantity is the primary cause of vegetation changes [9]. However, Miao et al. [10] provided evidence of Mongolian grassland resilience, showing that from 1982 to 2015, vegetation greening occurred despite increasing grazing intensity. Adequate rainfall can sustain grassland productivity under grazing pressure, challenging the view that grazing always causes degradation [10]. Another study identified regions with stable and unstable vegetation cover in Mongolia. The taiga and forest-steppe zones were relatively stable due to higher precipitation and forest cover. In contrast, vegetation varied most in the steppe and desert-steppe areas, which depend strongly on rainfall [11].
Gross Primary Productivity (GPP) represents the total carbon fixed by plant photosynthesis and is key to understanding terrestrial carbon variability. GPP depends on various climatic factors, including temperature, precipitation, solar radiation, atmospheric CO2 levels, and changes in land cover. Studies show that solar radiation and temperature changes primarily influence GPP increases at middle and high latitudes. In contrast, shifts in water availability tend to drive GPP changes at lower latitudes. At high altitudes, GPP variations are generally shaped by changes in both temperature and moisture conditions [12,13,14]. Mongolian ecosystems are highly susceptible to environmental changes. Bao et al. [15] assessed Mongolia’s net primary production (NPP) from 1982 to 2011. The results show that temperature-limited NPP values were observed in approximately 3.9% of the country, while precipitation was a limiting factor for 77.5%.
Studies on the Mongolian Plateau reveal a balanced pattern of GPP increase and decline, with most decreases occurring in northern Mongolia [13,16]. Water availability (precipitation, soil moisture, snow water equivalent), temperature, and solar radiation are identified as the most influential factors. Extreme climate events have smaller impacts than long-term climate change [13]. Another study showed that the impact of droughts on GPP varies across vegetation types and seasons, with the most significant effect occurring in summer and the least in spring [17].
Mongolia’s ecosystems are highly vulnerable to rising temperatures, changes in precipitation patterns, and intensified land-use pressure, such as overgrazing. Evaluation of vegetation dynamics, as measured by indicators such as NDVI and GPP, is critical for assessing the ecological health of Mongolia’s ecosystems in response to climate and anthropogenic drivers. In recent decades, Mongolia has experienced rapid warming and shifts in precipitation patterns, which have significantly impacted vegetation productivity, particularly in semi-arid regions.
The primary task of this study is to examine the spatial and temporal trends and the influence of climate factors on vegetation indices (NDVI and GPP) in Mongolia from 2000 to 2024. Unlike most previous studies, which primarily relied on annual values, this study analyzes monthly data, enabling a more detailed assessment of seasonal vegetation sensitivity to variations in temperature and precipitation. By integrating MODIS-based NDVI and GPP data with ERA5-Land reanalysis data, this approach offers a deeper understanding of how climate change impacts vegetation responses in various regions of Mongolia. The study also includes an analysis of extreme climate indices and assesses the delayed response of vegetation, providing new insights into the short-term processes of vegetation-climate interaction.

2. Data and Methodology

2.1. Study Region

Mongolia is situated in Central Asia’s arid and semi-arid region, characterized by a strong continental climate, significant altitude variation, and a diverse range of natural areas, including steppes, deserts, and mountains [18]. The landscape of Mongolia is distinguished by the Altai Mountains in the west and north, rolling plateaus in the central and eastern parts, and the Gobi Desert in the south. The mean altitude of Mongolia is 1580 m. Forests in the northern part of the country gradually transform into steppes in the center, which are followed by semi-deserts, and finally the Gobi Desert in the south.
According to the Köppen–Geiger climate classification, Mongolia is classified under continental climate zones, which include arid desert (BWk) and steppe (BSk) climate types in the south and east, as well as subarctic (Dwb and Dwc) climate in the north [19]. The desert climate (BWk) is found in the Gobi Desert region, where summers are arid and hot, while winters are cold and arid. The steppe climate (BS) prevails in the northeastern and central parts of the country. There is more precipitation than in the desert, though droughts are intense. The subarctic climate, characterized by cold winters (Dw), is typical of northern Mongolian regions and mountainous areas, where long cold spells and snow cover are common in winter. However, the snow depth is small due to the low precipitation amount [20].
Between 1940 and 2022, Mongolia’s near-surface temperature rose by 2.4 °C, with increases in some areas exceeding 3.0 °C. Winter temperatures have risen by 3.2 °C, while summer temperatures have increased by 1.6 °C. The number of hot days (above 30 °C) has increased, while the number of cold days (below 0 °C) has decreased [21]. The annual mean precipitation shows a slight overall increase. Although precipitation levels were above average in recent years (2012–2013, 2016, 2018, and 2020), a decreasing trend of 10–30 mm has been observed in central Mongolia, with slight increases in other areas. While cold-season precipitation has increased by 19% from 1940 to 2022, warm-season precipitation has shown no significant trend. Since the 1990s, Mongolia has also experienced more frequent droughts and severe dzuds [21], including an especially severe dzud in 2024 that had a devastating impact on livestock and rural livelihoods. Climate change and extensive land degradation have contributed to a prolonged drying trend in Mongolia, where over 75% of the land is affected by drought and desertification [22].

2.2. Datasets

In this study, we used MODIS (Moderate Resolution Imaging Spectroradiometer) data to determine changes in the Normalized Difference Vegetation Index (NDVI) and Gross Primary Production (GPP) in Mongolia. Although newer satellites have instruments with higher spatial and radiometric resolution, MODIS offers a long-term, homogeneous data record (dating back to 2000) that is well suited for climate-related analysis. Both NDVI and GPP datasets (MOD13A2 and MOD17A2HG) were acquired using NASA’s Earthdata portal (https://www.earthdata.nasa.gov/data/catalog, accessed on 8 February 2025).
MOD13A2 (version 6.1) product provides a 16-day NDVI composite with a 1 km spatial resolution [23]. NDVI helps quantify green vegetation and is sensitive to the chlorophyll absorption of the red portion of the electromagnetic spectrum. The values of the NDVI range from −1 to 1. Negative values of NDVI (values approaching −1) correspond to water. Values close to zero (−0.1 to 0.1) generally correspond to barren rock, sand, or snow. Low, positive values represent shrub and grassland (approximately 0.2 to 0.4), while high values indicate forests (close to 1). In a temperate climate, NDVI varies according to the seasons, being high during the active vegetation season and low during the cold season or during droughts.
GPP is the total amount of carbon dioxide absorbed by the photosynthetic plants per unit time through the reduction of CO2 into organic compounds. MODIS GPP product (MOD17A2HG, version 6.1) is based on the radiation use efficiency concept, and it depends on the fraction of photosynthetically active radiation (400–700 nm) absorbed by green vegetation [24]. GPP calculation integrates the geographic and seasonal variability of day length, temperature, daily cloud cover, atmospheric water deficit, and conversion factors for photosynthetically active radiation for different plant types.
Temperature and precipitation data were acquired from the ERA5-Land reanalysis project [25]. ERA5-Land is a spatially enhanced version of the ECMWF ERA5 climate reanalysis, which has been produced by replaying the land component of the model [26]. In this study, we used hourly temperature and precipitation data provided at 0.1° × 0.1° spatial resolution from 2000 to 2024. Data were downloaded from the Copernicus Climate Data Store (https://cds.climate.copernicus.eu/datasets, accessed on 12 February 2025). We used hourly minimum, maximum, and mean temperatures to derive daily values and the total precipitation. Previous studies showed that ERA5-Land reanalysis data match in situ observations well and can reliably capture regional climate trends [27,28,29]. In general, larger biases are observed over complex terrain due to altitude differences between ERA5-Land grid cells and ground-based observations [27,28]. Therefore, we consider ERA5-Land temperature and precipitation data suitable for assessing climate trends and their impacts on vegetation in Mongolia.

2.3. Climate Indices and Their Relationship with NDVI and GPP

Daily meteorological data were used to calculate extreme climate indices to quantify different meteorological phenomena in the study region. We used climate indices developed and recommended by the Expert Team for Climate Change Detection, Monitoring, and Indices (ETCCDMI) [30,31]. We calculated 10 monthly temperature and precipitation indices: freezing degree days (FDD), growing degree days (GDD), maximum precipitation amount over 5 days (RX5Day), wet spell total length (WSTL), number of warm and dry days (WADD), mean daily temperature range (DTR), consecutive dry days (CDD), days with maximum temperature below the 10th percentile (TX10P), days with minimum temperature above the 90th percentile (TN90P), and maximum consecutive summer days (CSU). Indices were calculated using the Python xclim library (version 0.57.0) for climate services. A detailed description of the indices and the specific values selected for the region is provided in Table 1.
The results presented in this study cover the period from 2000 to 2024. MODIS-based variables (NDVI, GPP) and temperature and precipitation data from ERA5-Land reanalysis data have different spatial and temporal resolutions (Table 2). To ensure spatial homogeneity, all datasets were resampled to the ERA5-Land grid (0.1° × 0.1°) resolution. NDVI product (MOD13A2) was upscaled using the spatial average method, while GPP product (MOD17A2HG) was resampled using the median method.
After spatial upscaling, all datasets were resampled to monthly composites. GPP was aggregated to monthly totals, while for NDVI, we used the maximum value composite approach [32]. For ERA5-Land reanalysis data, hourly values were first aggregated to the daily resolution. Then, daily data were used to calculate monthly climate extreme indices and to derive monthly precipitation totals, as well as minimum, maximum, and mean air temperatures for each grid cell.
Long-term trends were assessed using non-parametric Sen’s slope estimator, and their statistical significance was tested with the Mann–Kendall test (p-value < 0.05). The relationship between variables (precipitation and mean temperature) and ecosystem indicators (GPP and NDVI) was analyzed using the Pearson correlation coefficient. Correlations were calculated for the same-month values and with a one-month lag between temperature, precipitation, and NDVI (or GPP). For all correlation analyses, the p < 0.05 threshold was used to identify statistically significant relationships.

3. Results

3.1. Changes in Annual Mean Values

In Mongolia, there are large spatial differences in the mean annual air temperature: in the south, in the Gobi Desert region, the annual mean is above 6 °C, while in the Altai, Khangai and other mountains it is below −6 °C (Figure 1a). Based on the ERA5 Land reanalysis data, the territorial mean annual air temperature from 2000 to 2024 increased by 0.94 °C (Figure 1c), and this change was statistically significant (p < 0.05). Almost all of the territory (99%) experienced an increase in mean temperature, except for some small mountain areas in the northern and western parts of the country (Figure 1b). These negative changes were statistically insignificant and fell within the range of natural variation. The highest and statistically significant changes (exceeding 0.6 °C/10 years) were observed in the slopes of the Khangai and Altai mountains. Significant changes (0.4–0.6 °C/10 years) were also observed in the Gobi Desert and the eastern part of the country, specifically in the Dornod region. However, in some periods, strong negative temperature anomalies were recorded in the study area. Between 2009 and 2012, Mongolia experienced a series of cold anomalies in winter due to more frequent cold outbreak events. These phenomena were caused by a deepening tropospheric trough in Central Eurasia and increased northern cold air advection into Mongolia [33].
During the period from 2000 to 2024, the mean annual precipitation sum in Mongolia was 260 mm according to ERA5 Land reanalysis data (Figure 1d). The highest annual precipitation sum was recorded in 2003 (322 mm), and the lowest in 2017 and 2022 (217 mm) (Figure 1f). The annual precipitation sum increased by 32 mm (13%) during the investigation period, but this change was not statistically significant. Additionally, precipitation changes in Mongolia are not spatially homogeneous: a positive trend was detected in 72.7% of the territory, and a negative trend in 27.3%. The increase in total annual precipitation was observed in the northern and eastern parts (30–40 mm/10 years), with the most significant changes determined in the Khentii mountain area and Menen steppe (>50 mm/10 years) (Figure 1e). The decrease in total annual precipitation (−10 mm/10 years) was observed in the Gobi Desert and the Great Lakes basin (Figure 1e), but these changes were statistically insignificant.
The spatial distribution of annual maximum NDVI closely follows the Köppen–Geiger climate regions. The highest NDVI values in Mongolia are observed in the north and Numrug region in the east (Figure 1g). These regions have enough precipitation to maintain a higher concentration of biomass (Figure 1d). The lowest NDVI values were observed in 2007 (0.3), and the highest in 2018 and 2024 (0.41). During the study period from 2000 to 2024, mean maximum NDVI values exhibited a statistically significant increasing trend (Figure 1i), with a mean rate of 0.025 per 10 years. An increasing NDVI trend was observed in 92.5% of Mongolia, and 7.5% of the territory exhibited negative NDVI trends (Figure 1h). The increasing trends were statistically significant across all vegetated areas, particularly in forest and steppe regions.
The average annual GPP in Mongolia during the study period was 0.30 kgCm−2. The spatial distribution of GPP accurately reflects prevailing terrestrial biomes in the country: from nearly zero in the Gobi Desert to over 0.7 kgCm−2 in the forested areas of northern Mongolia and in Numurg National Park in the easternmost part of the country (Figure 1j). From 2000 to 2024, average annual GPP increased by 38%, from around 0.25 to 0.35 kgCm−2 (Figure 1l). The lowest average GPP value was recorded in 2007 (0.24 kgCm−2), a year that also saw the highest average annual temperature. The highest GPP value (0.38 kgCm−2) was recorded in 2024, coinciding with an unusually high amount of rainfall. The fastest increase rate of GPP (>0.8 kgCm−2/10 years) was observed in the northern forested areas and eastern steppes. The decrease in GPP was determined in only 2.4% of the territory: in the Great Lakes Basin region and at the edges of the Gobi Desert (Figure 1k), but these changes were statistically insignificant.

3.2. Changes in Monthly Mean Values

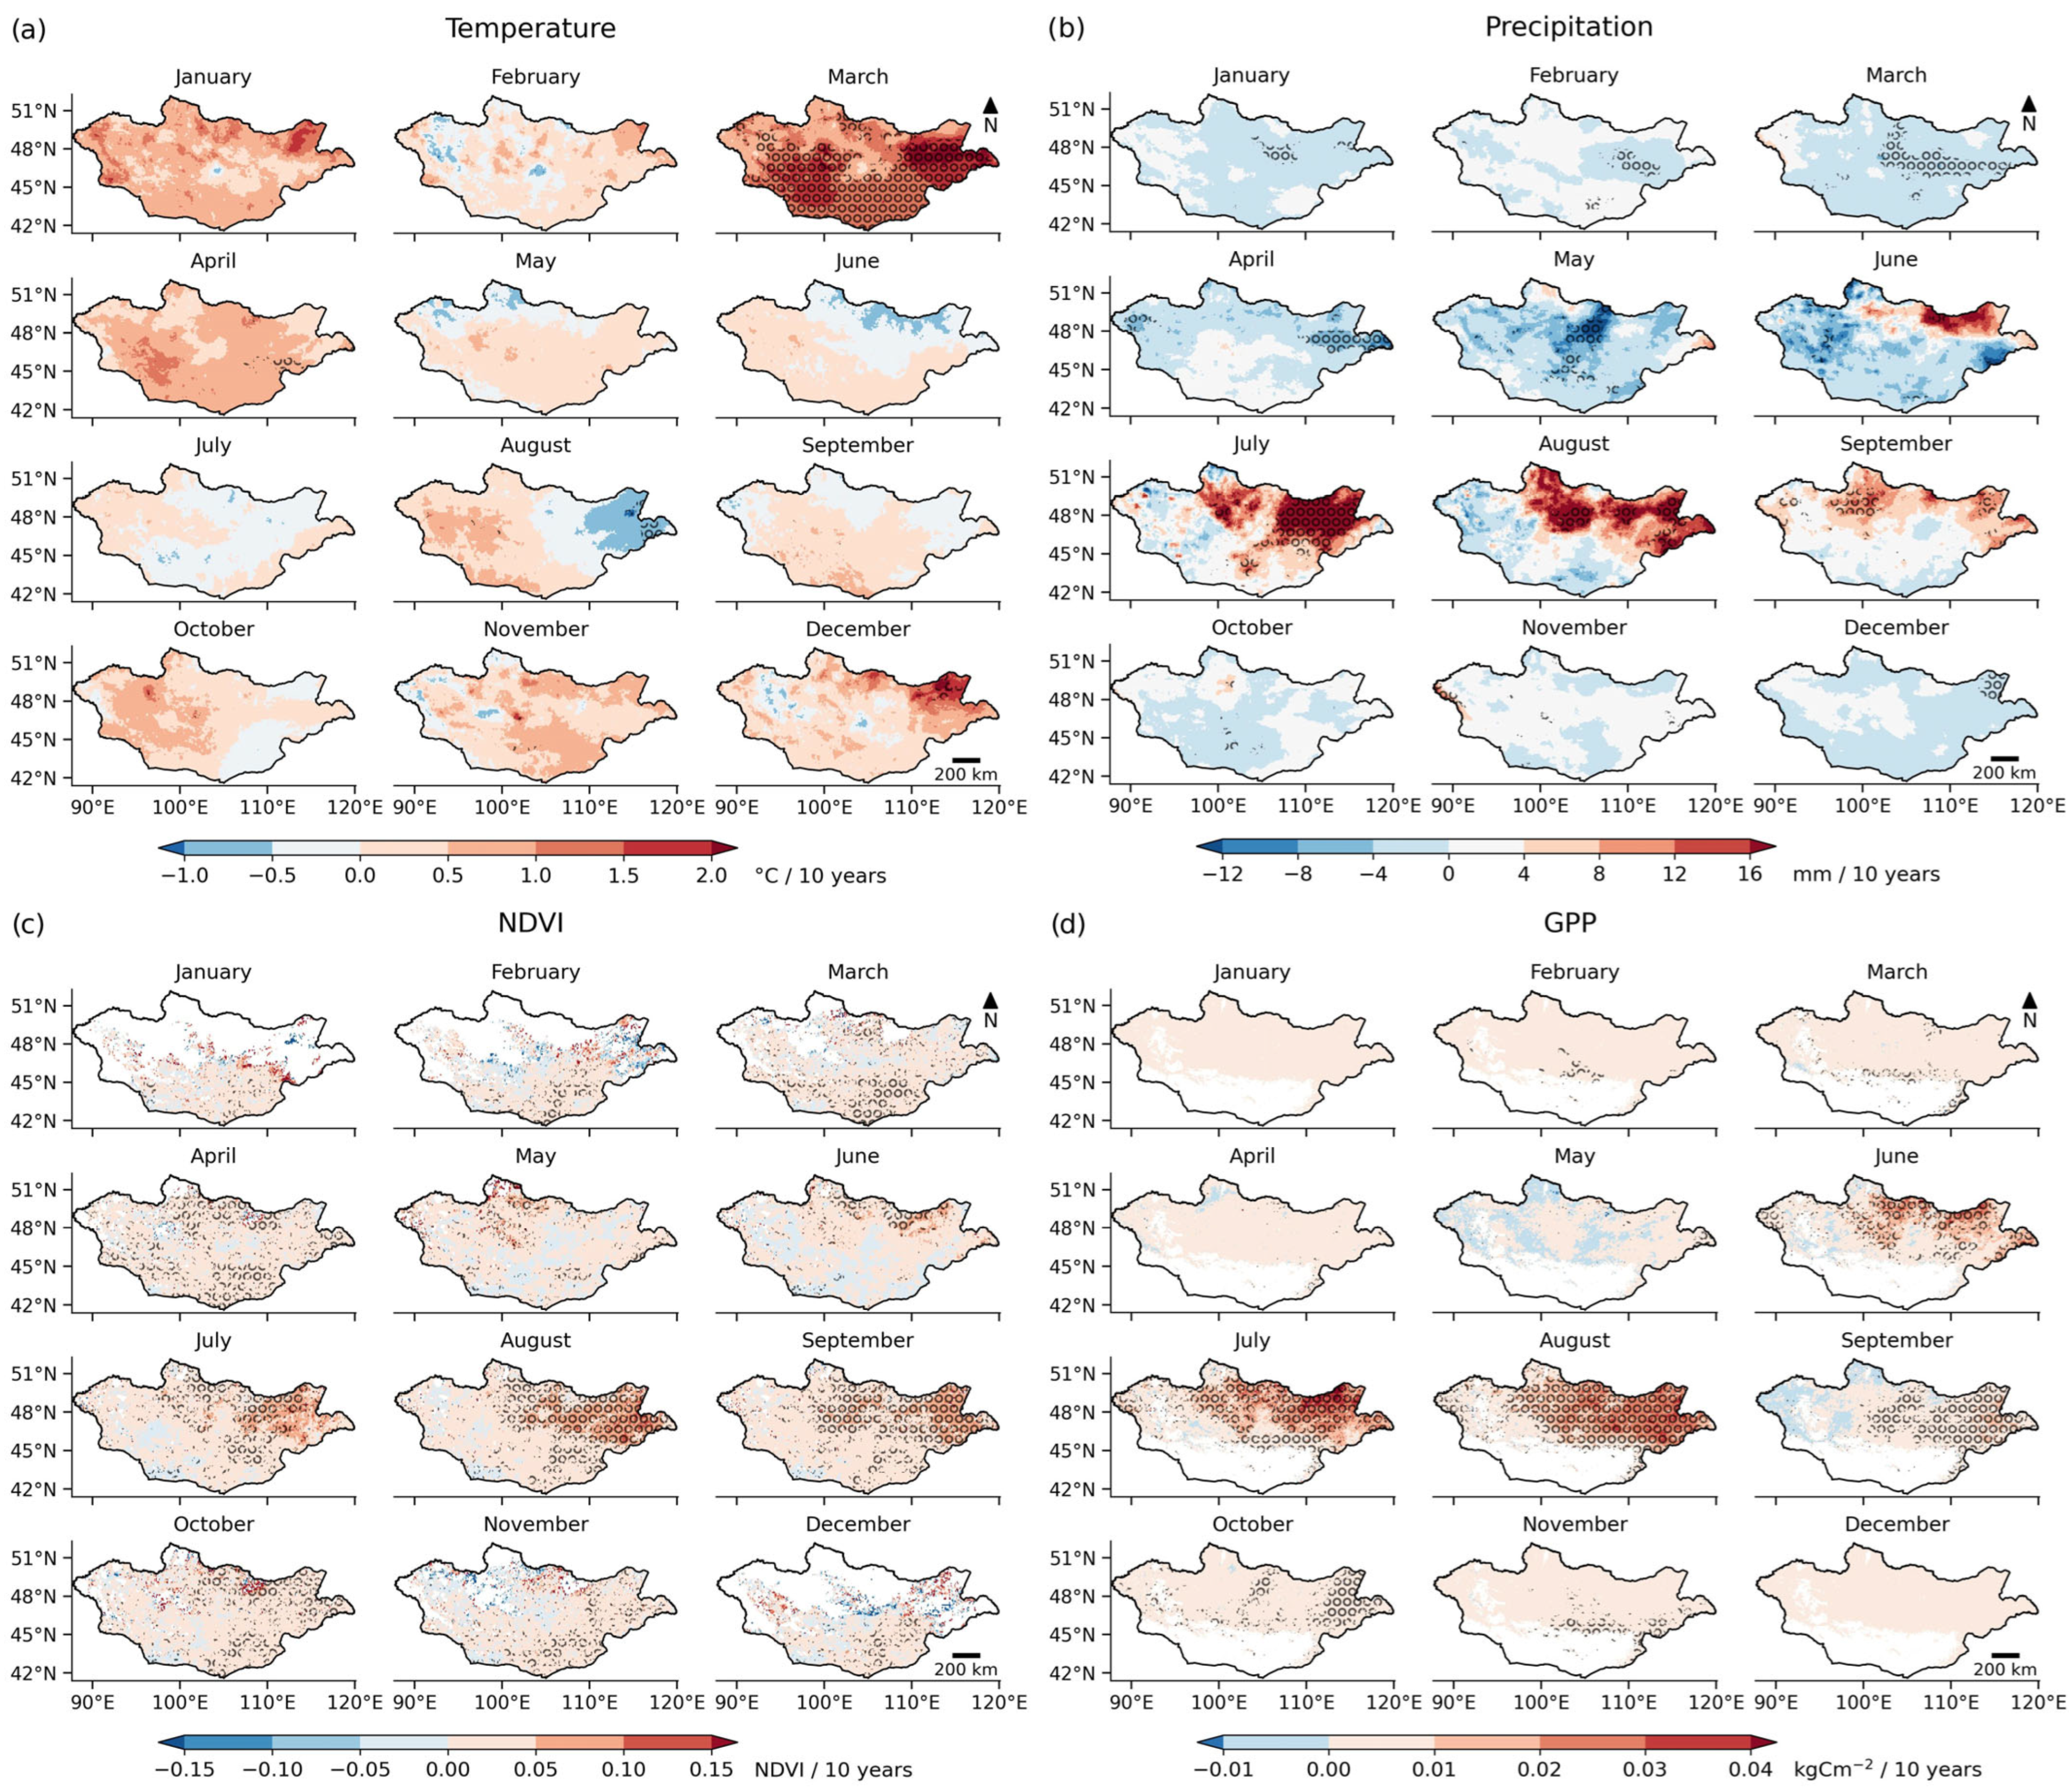
Although the annual mean temperature in Mongolia has increased from 2000 to 2024, the changes were not uniform across different months. Cold winter and spring months (December–April) showed increasing air temperature trends, with positive changes observed across 71–100% of the country, although not all of them were statistically significant (Figure 2a). The most prominent changes (1.5–2.0 °C/10 years) were found in March, and this temperature increase was statistically significant in 65% of the country’s territory (Figure 2a). During the warm season (May–September), minor negative temperature trends (less than −0.5 °C per 10 years) were observed in some northern and eastern regions, coinciding with increased precipitation in these areas (Figure 2a). Statistically significant negative trends occurred only in August, affecting about 2.1% of Mongolia’s eastern steppe region (Figure 2a).
Over the study period, changes in monthly precipitation were temporally and spatially inhomogeneous. During the cold season, from October to March, precipitation trends were mainly negative, but changes were small (less than −4 mm/10 years) (Figure 2b). However, due to the extremely low precipitation in winter months (with December-February totals not exceeding 10 mm in many areas of the country), even minor absolute changes (decrease by 2–4 mm) in some areas were statistically significant. In April and May, some regions of Mongolia’s central and eastern parts had a larger precipitation decrease (by 8–12 mm/10 years); however, this decreasing trend was significant only in 8% of the territory (Figure 2b). The increase in precipitation is notable mainly in July and August (the months with the highest precipitation amount), with significant positive trends (>20 mm/10 years) observed in the northern and eastern regions of the country (69–86% of territory). Our observed trends differ slightly from those of other studies, primarily due to the shorter study period (2000–2024). The Fourth National Communication of Mongolia reported that precipitation in the cold season has increased, while precipitation in the warm season showed no significant trend from 1940 to 2022 [21].
When analyzing NDVI changes in different months, the largest areas with statistically significant increases (79–94% of the territory) were identified in March–April and July–October (Figure 2c). However, these changes are not homogeneous across Mongolia. In March and April, a statistically significant increase in NDVI (0.12–0.18 units per 10 years) was observed in Gobi and northern forests, while in central steppes, a slight decrease was determined (−0.1 units per 10 years) (Figure 2c). Negative, but statistically insignificant NDVI changes in the central part of the country were also observed in May and June (24–30% of the territory). The highest statistically significant increase in NDVI values (0.32–0.39 per 10 years) was observed in July–September in the north and east parts of Mongolia (Figure 2c). The spatial distribution of the observed positive NDVI changes closely follows (r = 0.41–0.49) the spatial patterns of precipitation increase during these months (Figure 2c).
Due to harsh climate conditions from October to April, GPP values across the country remain very low, with monthly values not exceeding 0.02 kgCm−2. The active vegetation season begins in May, and GPP starts to increase in the north, while in the central steppes, this rise is typically delayed until June. Maximum GPP values occur in July (0.23–0.27 kgCm−2), coinciding with the highest temperatures and precipitation sums. There is a positive correlation (r = 0.65) between precipitation and GPP trends in July, and a strong negative correlation (r = −0.72) between temperature and GPP trends in August. This suggests that changing climate conditions have a substantial impact on GPP during the summer months.
During the study period the highest increase in GPP (more than 0.03 kgCm−2/10 years) was determined in summer months in the northern forests and eastern steppes, and these changes were statistically significant in 28–69% of the study area (Figure 2d). Smaller but still statistically significant GPP trends (0.01 kgCm−2/10 years) were observed in September-November in some central and eastern regions of the country (9–22% of territory) (Figure 2d). In May, June and September some locations in central and west part of the country had a slight negative GPP trend (less than −0.03 kgCm−2/10 years), but these changes were not statistically significant.

3.3. Relationship Between NDVI and Different Climate Indices

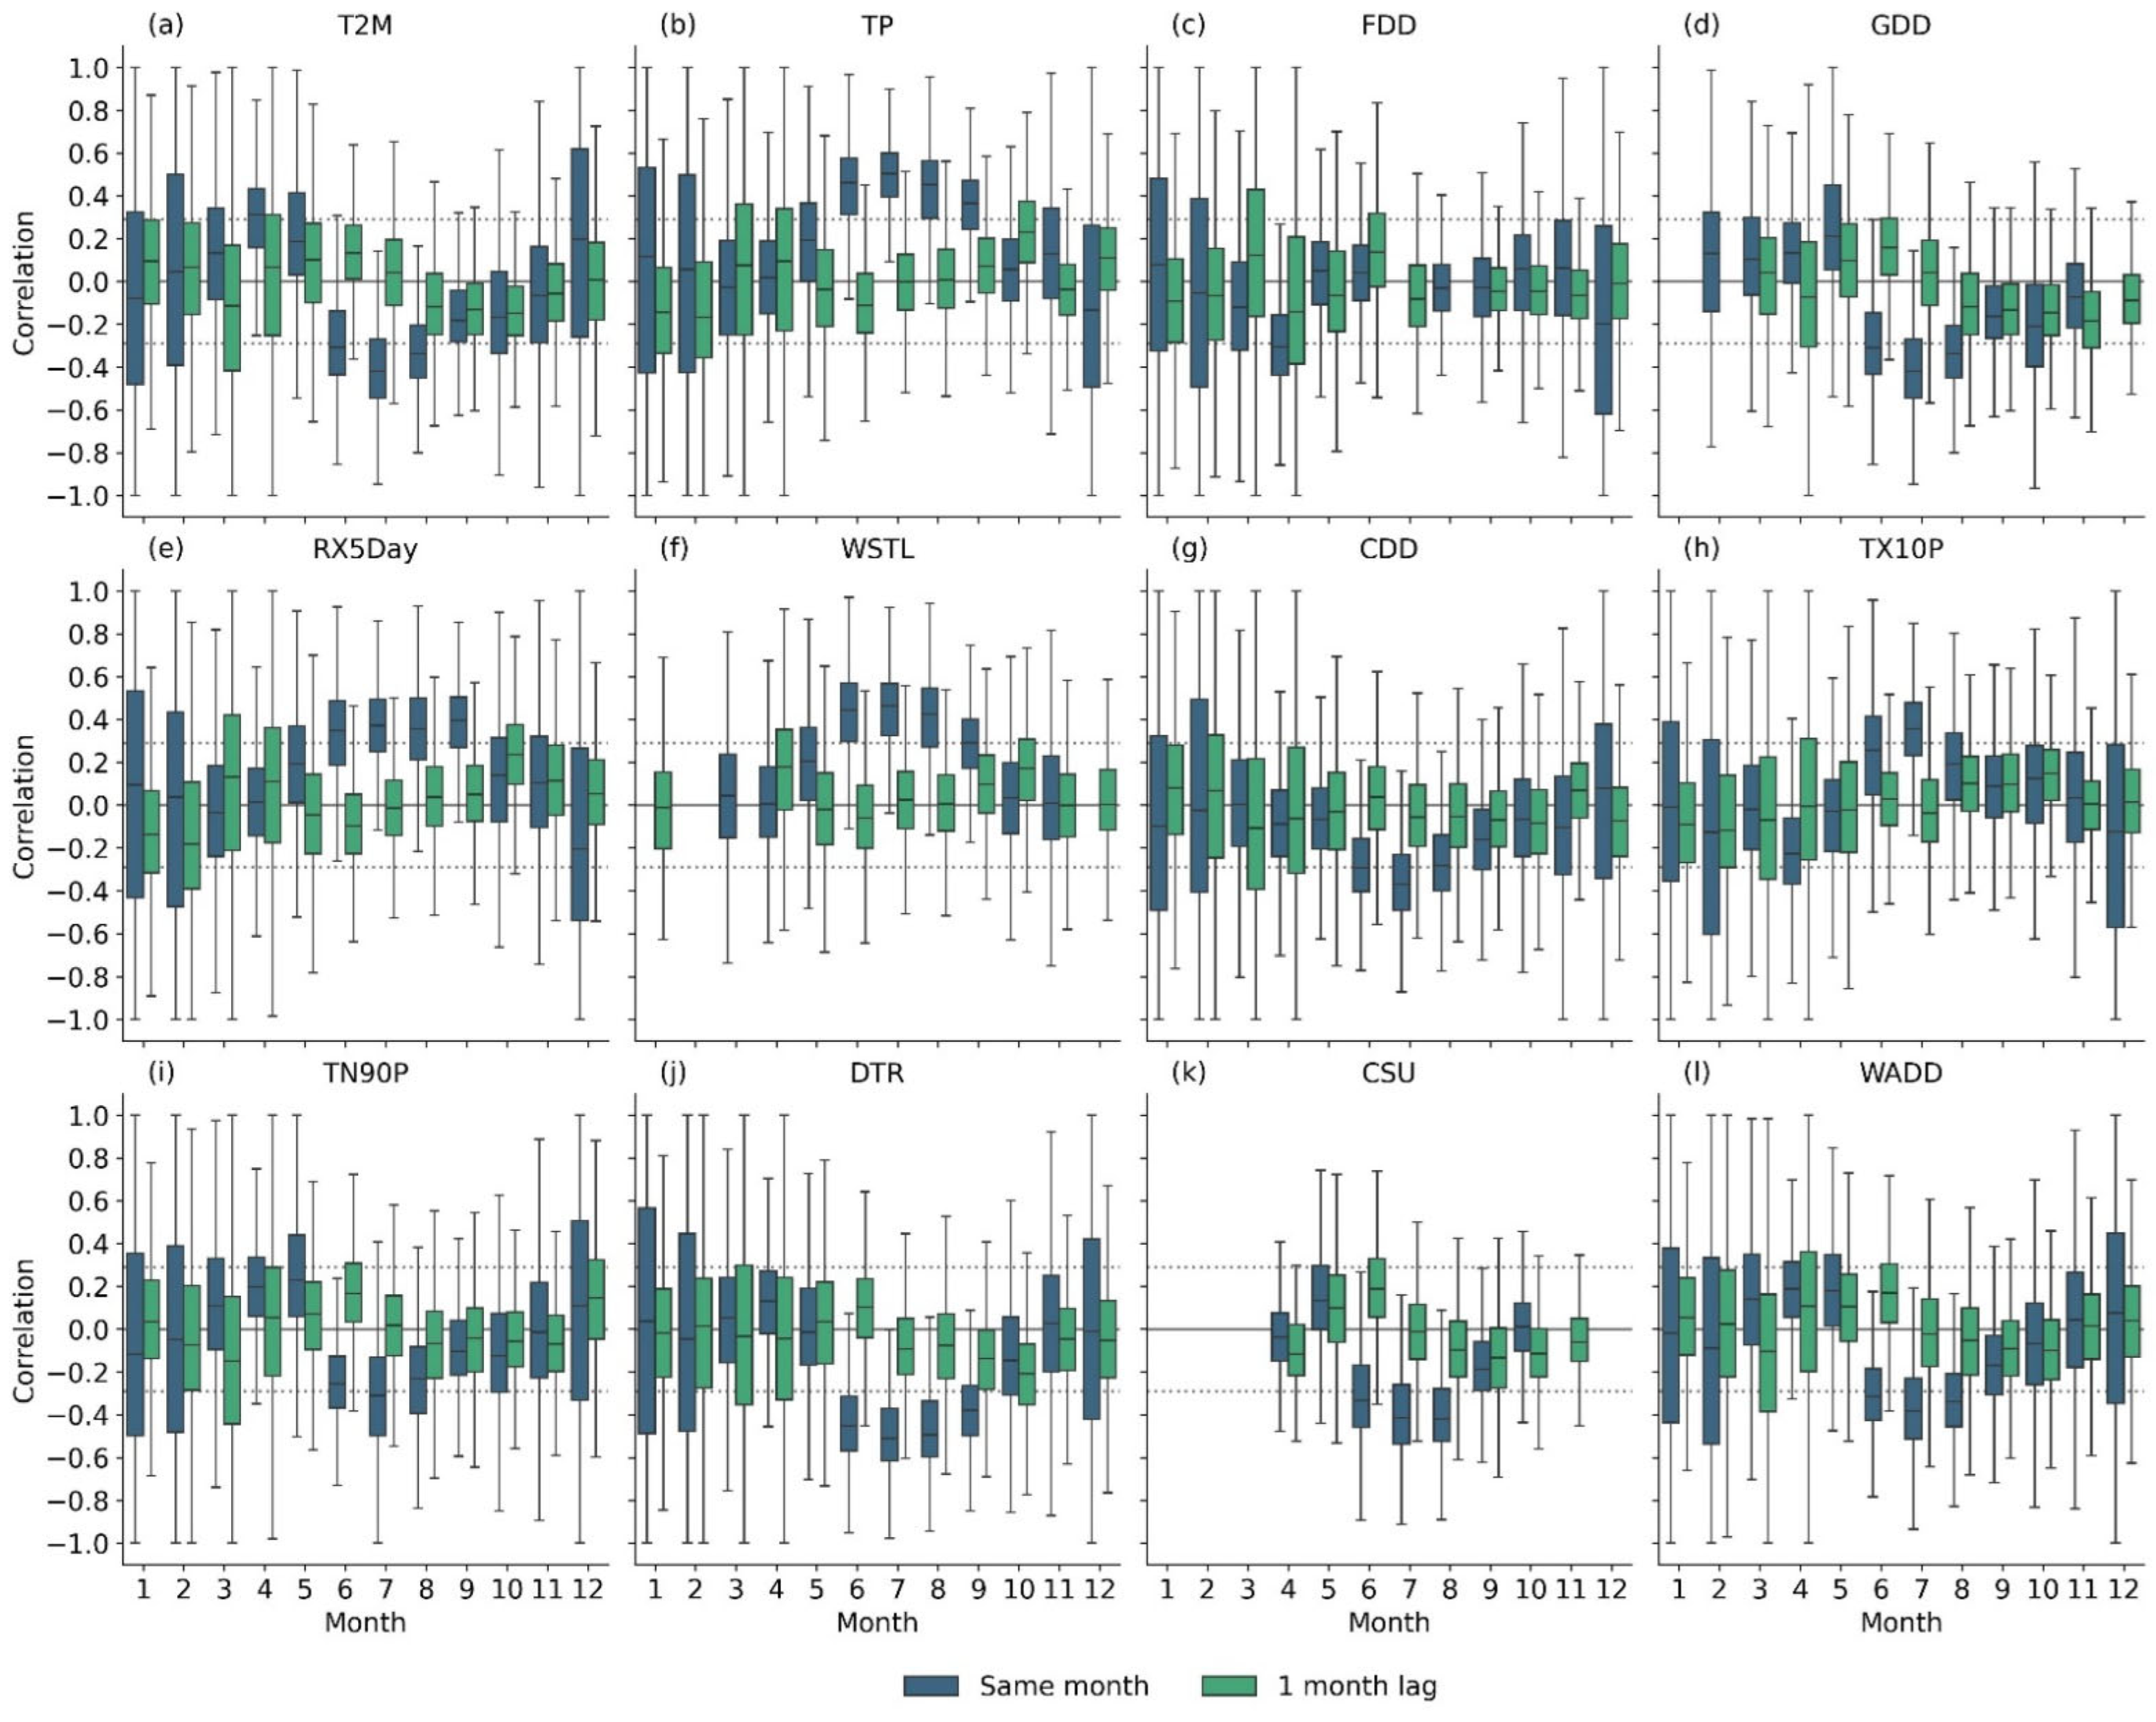
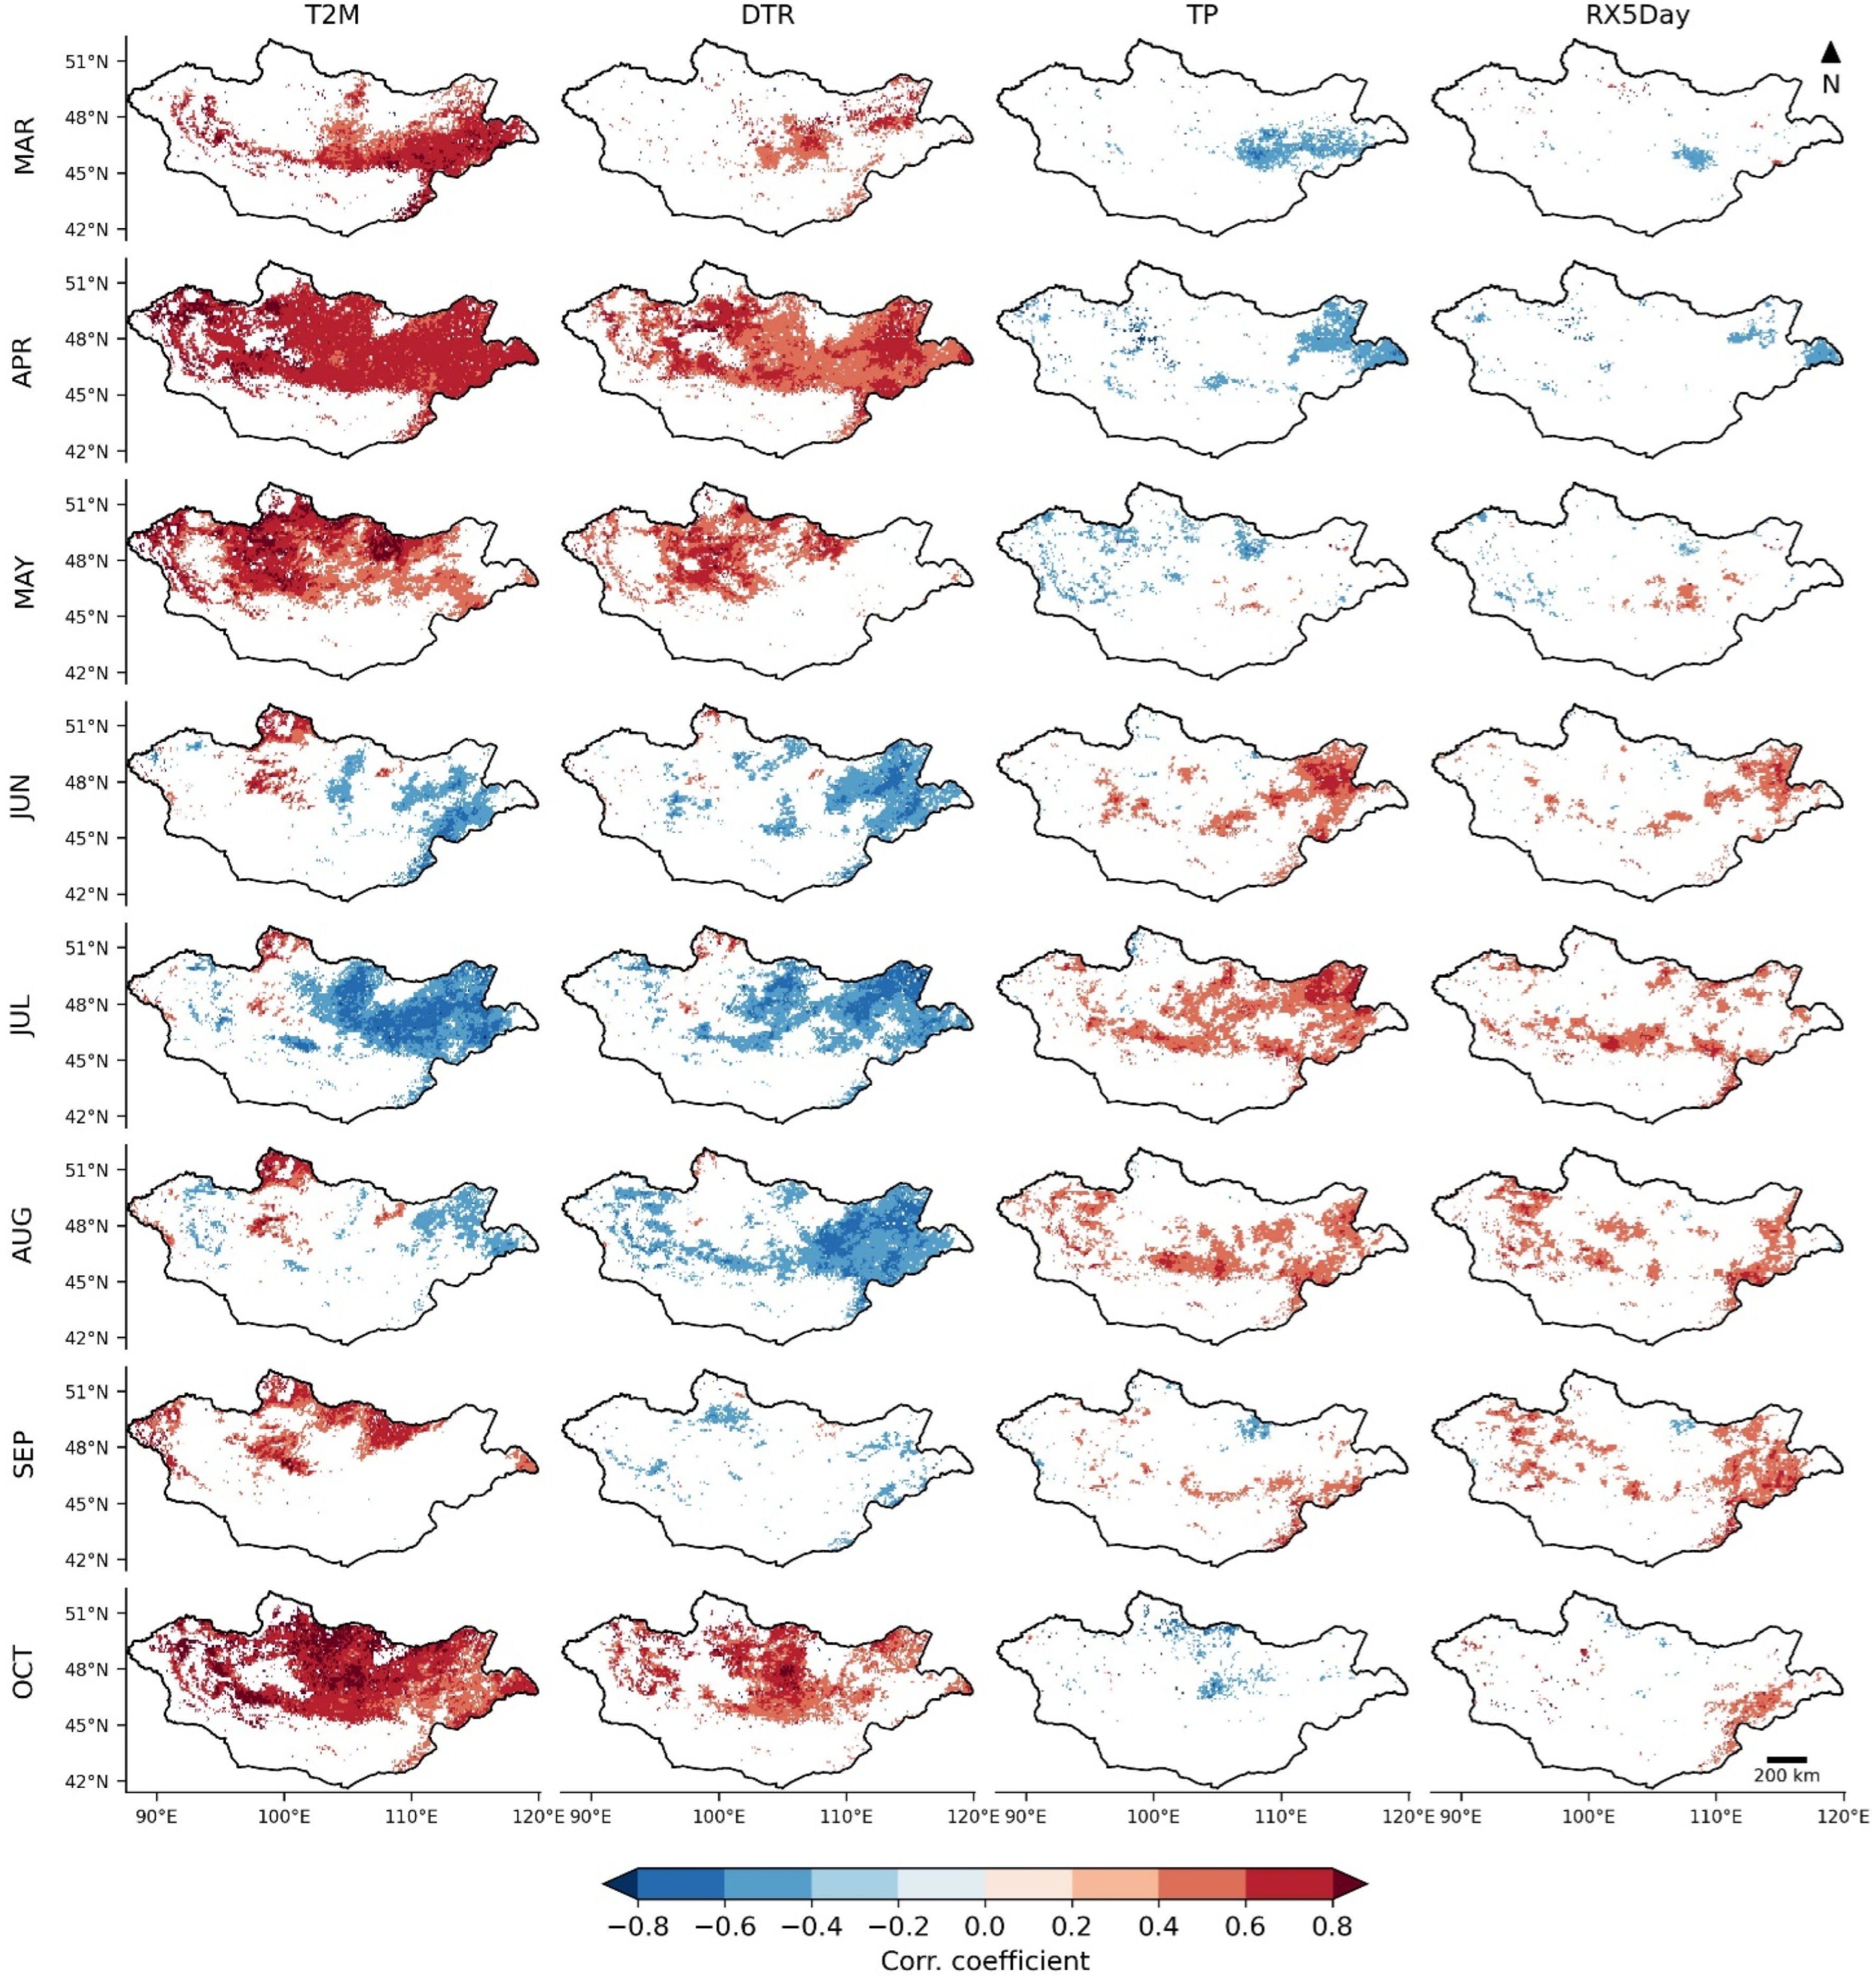
Analysis of correlation coefficients between NDVI and different climate indices shows that vegetation conditions in Mongolia are strongly influenced by weather conditions from April to September (Figure 3). At the beginning of the vegetation season, the strongest relationship was found between NDVI and mean temperature (T2M). In March, this relationship is only evident in Numrug National Park in the eastern part of the country (Figure 3). In April, it becomes noticeable in the whole of Mongolia with a median correlation coefficient (r) of 0.31 (Figure 4a). Another important climate index in April is FDD, but it has a negative relationship with NDVI (r = −0.31) (Figure 4c). These relationships suggest that vegetation conditions in Mongolia in April are most sensitive to the mean temperature and frequency of cold snaps, which can cause frost damage to vegetation. In May, some regional differences start to emerge. There is a moderate correlation between NDVI and T2M in the Khangai and Kenti mountains (r > 0.4) (Figure 3). In contrast, in the steppes of the eastern part of the country, NDVI exhibits a stronger relationship with monthly precipitation amount (TP) (r > 0.2). Correlation with temperature indices in this region is low and starts to become negative. For example, DTR in this region has a weak, yet statistically significant negative correlation (r = −0.08) (Figure 3).
As the vegetation season progresses into the summer, the relationship of NDVI and temperature turns to negative (r < −0.30)–higher T2M, DTR, and CSU values reduce vegetation greenness in Mongolia (Figure 4). This negative correlation is stronger in central and eastern steppes of the country (Figure 3). In summer NDVI becomes sensitive to the daily temperature range, with median correlation with DTR more negative than −0.45 (Figure 4j). Number of very cold days (TX10P) during the summer has a positive effect on NDVI (r = 0.36, in July) (Figure 4h). At the same time precipitation becomes the main factor influencing NDVI. In June-August, the correlation between NDVI and TP is 0.45–0.50 (Figure 4b). The impact of lack of precipitation on NDVI is most evident in July, when CDD has the highest negative correlation (r = −0.37) (Figure 4g). The strong relationship with summer precipitation was very evident in 2018 and 2002. In July and August 2018, high precipitation totals (70–80 mm) were observed, followed by the highest monthly average NDVI recorded during the study period (0.40). In 2002, the situation was opposite–the summer months were dry, with only 24–44 mm of precipitation, which was the main factor contributing to the lowest August NDVI value observed (0.28).
In September, the relationship between the NDVI and climate extreme indices exhibits the same patterns as in summer (Figure 3). A moderate negative correlation is observed with DTR (r = −0.38), and a positive correlation is found with TP (r = 0.37). However, in September, the relationship with temperature (T2M, TX10P, TN90P) becomes insignificant (Figure 4).
In the eastern steppes of Mongolia, the strongest correlation was observed between NDVI and RX5Day (r = 0.40). This relationship continues into October, but the correlation becomes weak (r = 0.14). In October, the highest correlation (r = 0.23) was found between NDVI and 1-month lagged precipitation (Figure 4b). This relationship is significant primarily in the grasslands of eastern and south-eastern Mongolia. The delayed response likely reflects a soil-moisture storage effect, whereby rainfall from the previous month infiltrates the soil and is retained as available moisture, supporting vegetation greenness and photosynthetic activity in the following weeks.
During the cold season (November–February), no significant relationships were found between NDVI and climate indices. In winter, the active vegetation season comes to a halt, and the NDVI in most of the country approaches zero. Throughout the year, we did not find any significant relationships between NDVI and 1-month lagged temperature or precipitation indices (Figure 4). Our results suggest that vegetation in Mongolia responds quickly to changing weather conditions, and the impact does not seem to extend to the following months.

3.4. Relationship Between GPP and Different Climate Indices

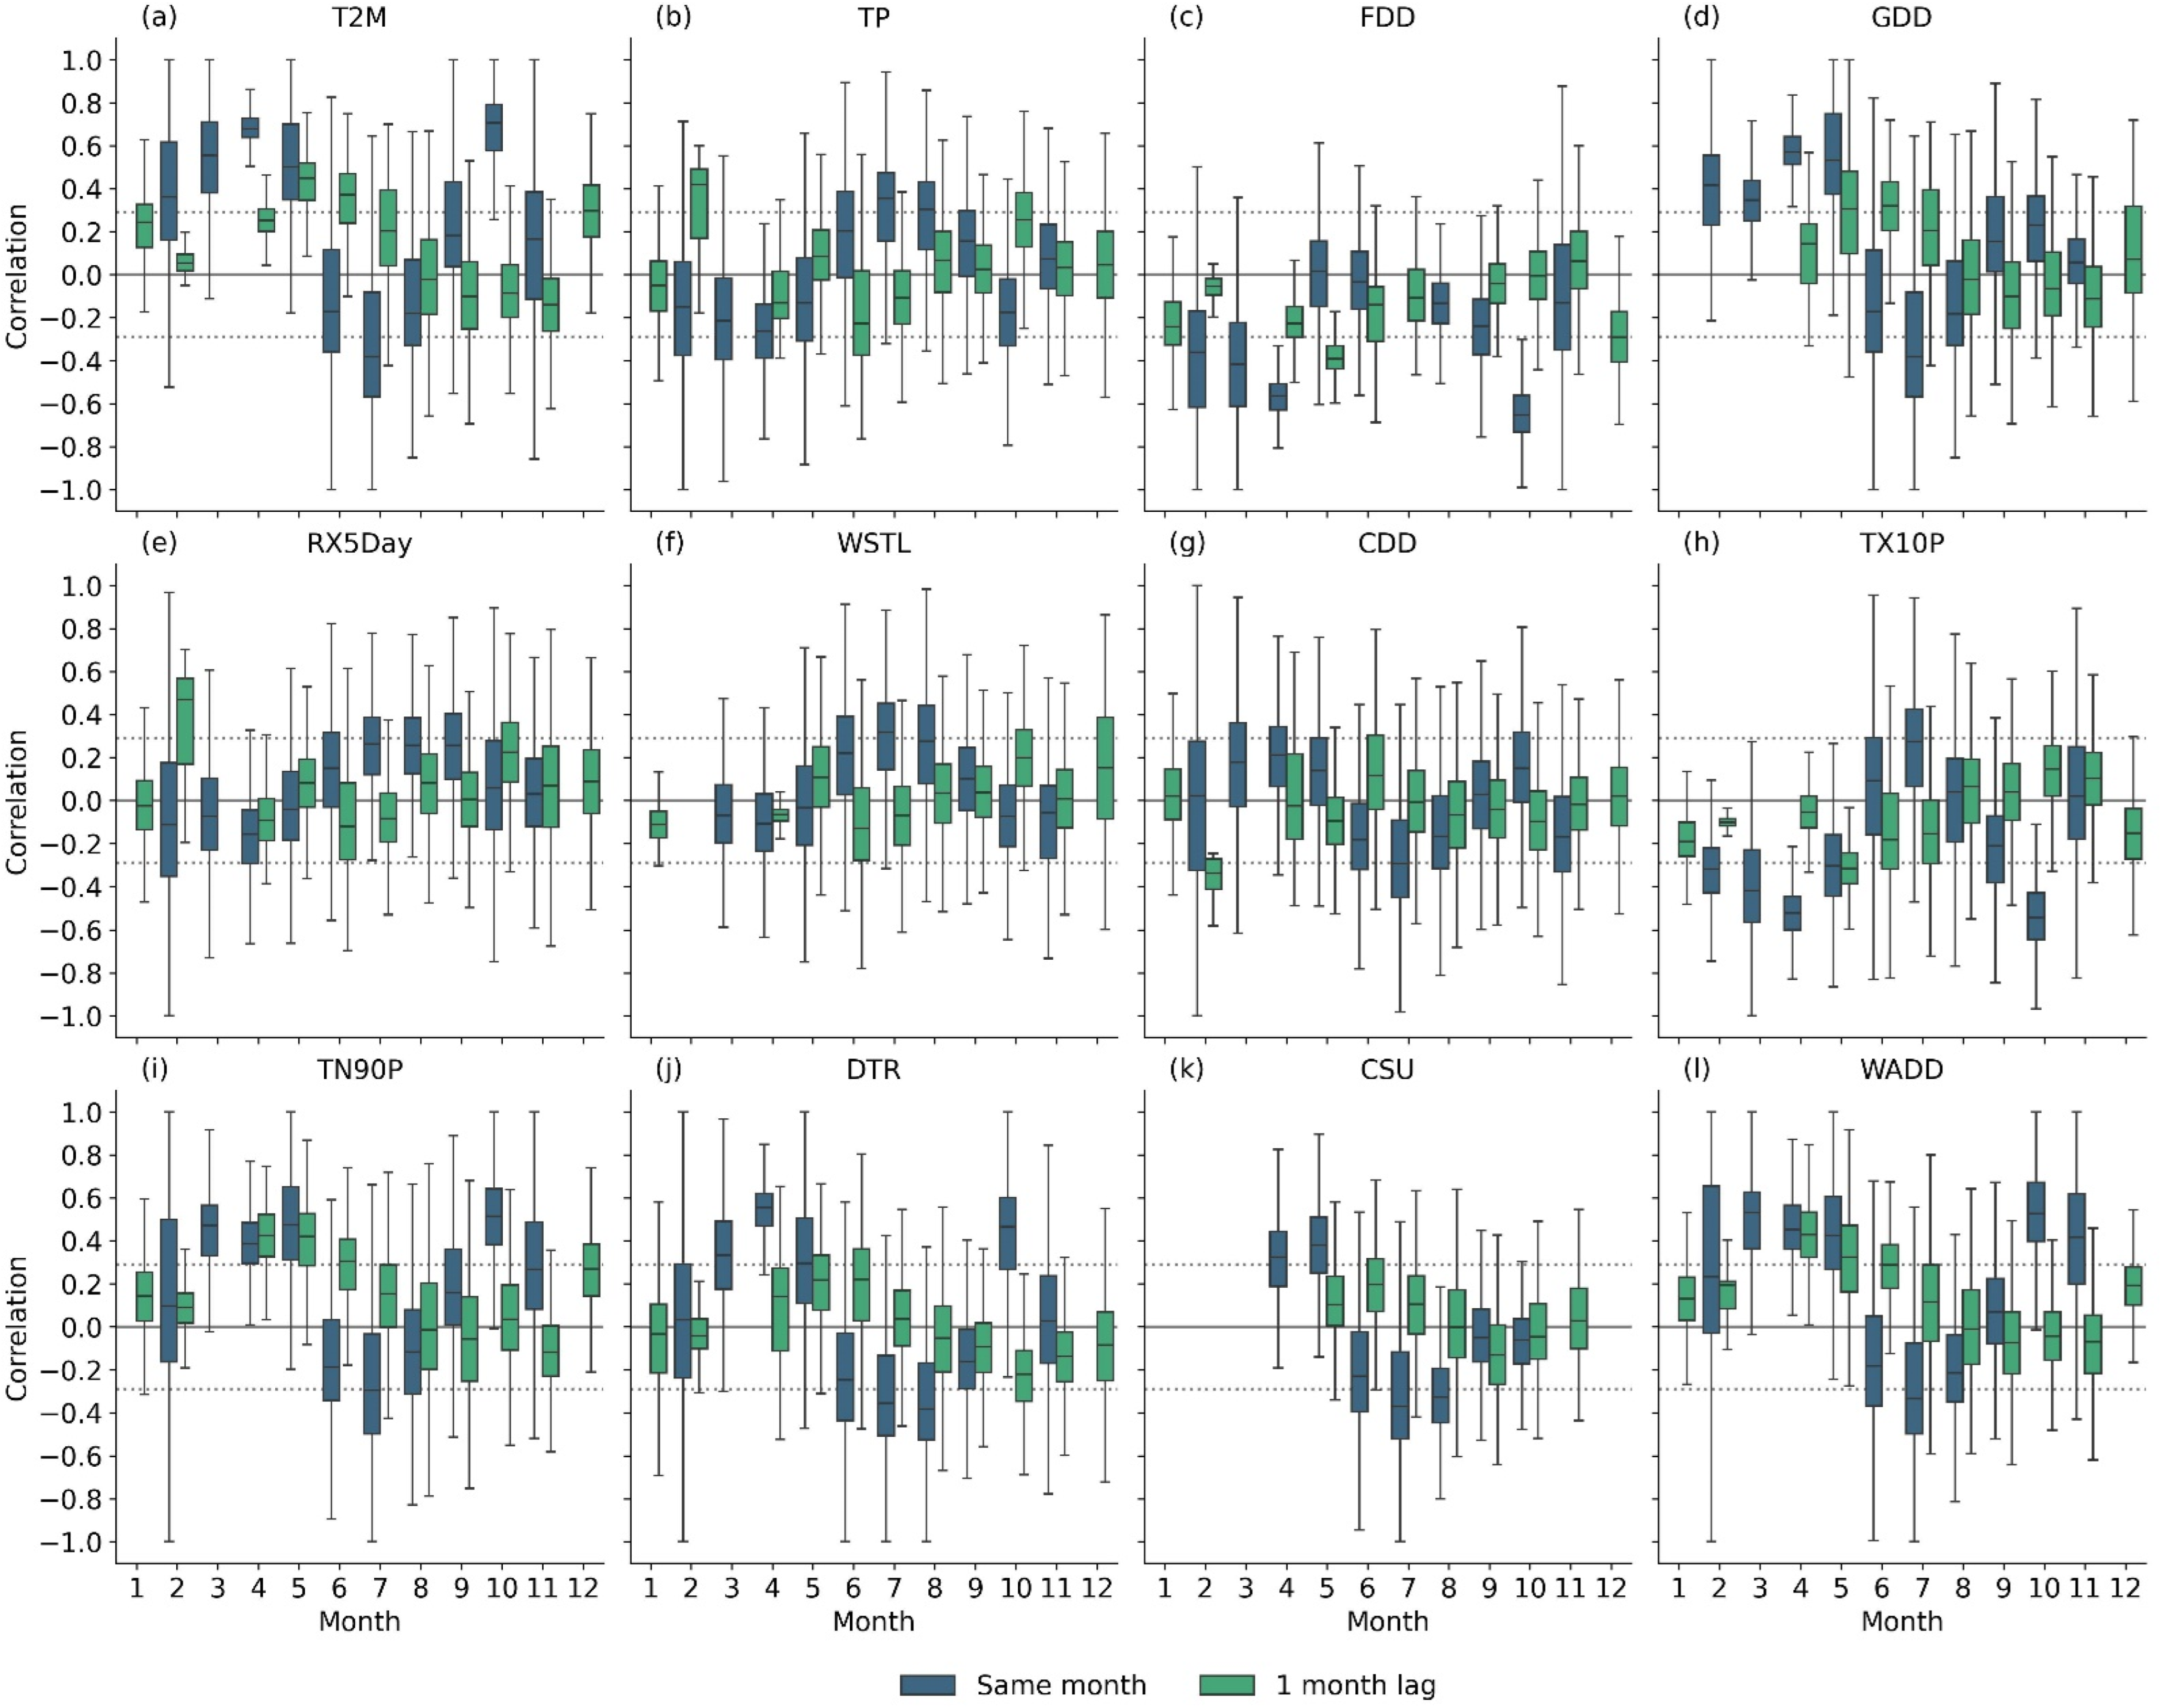
GPP is sensitive to variations in precipitation and temperature. In Mongolia, during spring, GPP shows the strongest positive correlations with temperature. In March, temperature (T2M) has a positive impact on GPP only in the eastern part of the country and in the transition region between Gobi Desert and central steppes (Figure 5). In April and May T2M and GDD have a moderate correlation with GPP (r > 0.50) in whole country, except mountain and desert areas (Figure 5). In April GPP is determined mainly by the temperature indices: T2M (r = 0.68), GDD (r = 0.57), FDD (r = −0.56) (Figure 6a,c,d). In the spring months, precipitation indices do not exhibit a significant relationship with GPP. Only in very limited areas in eastern Mongolia, in March and April, TP has a statistically significant, but negative impact on GPP (r < −0.21) (Figure 5). These findings suggest that in spring, when there is a high chance of snow or mixed precipitation, it can negatively impact the growth of the biomass in steppes.
In summer, the relationship between GPP and temperature indices in Mongolia becomes negative. The highest negative correlation was determined with CSU and DTR (r = −0.23 to −0.38). This indicates that vegetation biomass growth is negatively impacted by the prolonged periods of high temperatures (>25 °C) and high daily temperature amplitude (Figure 6j,k). However, there are some regional differences. In the mountain areas GPP is positively related to the T2M (r > 0.50), while in the steppes it has a significant negative correlation (r < −0.45) (Figure 5). Precipitation indices (TP, RX5Day, WSTL) in summer exhibit a positive effect on GPP (r = 0.23–0.35) (Figure 6b,e,f).
The highest GPP values in Mongolia are observed in July, and during the study period ranged from 0.06 kgCm−2 in 2007 to 0.11 kgCm−2 in 2021. The main factors influencing July GPP values are precipitation and mean temperature: in 2007, the mean temperature was 20.8 °C with only 46 mm of precipitation, while in 2021, the mean temperature was 19.5 °C and precipitation reached 73 mm. These two examples illustrate that GPP responds differently to variations in temperature and precipitation, highlighting their combined influence on vegetation productivity.
In September, the spatial distribution of statistically significant correlation coefficients between GPP and climate indices is similar to summer months (Figure 5). However, temperature-based indices (T2M, TN90P, WADD) begin to show positive correlations with GPP, while the relationship with TP starts to diminish (r = 0.0–0.1) (Figure 6). In October, the relationship between GPP and climate indices in Mongolia is very similar to that in April. There is a strong correlation with T2M (r = 0.70) and FDD (r = 0.65) (Figure 6a,c). The main difference is that GPP in October has a positive relationship (r = 0.25) with 1-month lagged precipitation (TP) (Figure 6b). This lag reflects vegetation and soil “memory,” as stored soil moisture and residual heat from the previous month continue to support photosynthesis in late season [34].
While no significant relationship was found between NDVI and 1-month lagged climate indices, GPP exhibited a stronger dependence on the climatic conditions of the preceding month. GPP in May shows moderate correlation with 1-month lag T2M and TN90P (r > 0.42) (Figure 6a,i). A similar pattern is also observed in June, with a significant correlation between GPP and the previous month T2M and GDD (r > 0.32) (Figure 6a,d). The highest impact of the previous month’s precipitation conditions was determined in October (r = 0.25). GPP often responds to climate conditions with a one-month lag, as soil moisture and accumulated heat from the previous month continue to influence photosynthesis and canopy activity [35,36].

4. Discussion

Our study results reveal the impact of climate change on Mongolia’s ecosystems from 2000 to 2024. We determined increasing trends in mean annual temperature, mean maximum NDVI, and total GPP, while precipitation did not show a statistically significant trend. Some of these findings are consistent with previous studies, which reported an increase in temperature and NDVI [9,10]. However, our observed trends in GPP and precipitation differ from some earlier results, possibly due to differences in study periods, data sources, or spatial coverage. By extending the analysis to 2024, this study provides new insights into the seasonal and spatial variability of vegetation responses, particularly under recent climate extremes such as the 2023–2024 dzud event. A dzud is a severe winter event characterized by extreme cold and heavy snowfall that restricts pasture access and causes widespread livestock losses [37].
For the first time in the Mongolian context, a set of ten ETCCDMI extreme climate indices has been applied, allowing the assessment of the impact of average and extreme temperature and precipitation fluctuations on vegetation. The study also showed that GPP is more sensitive to conditions in the previous month, revealing a delayed response in dry ecosystems. Overall, our results indicate that vegetation productivity in Mongolia is shaped not only by average climate conditions but also by extreme climate events, with their impact varying by season and region.
There are several limitations and uncertainties in our analysis. NDVI may become saturated in densely vegetated areas, potentially underestimating high biomass levels. ERA5-Land data can slightly overestimate precipitation in mountainous regions and underestimate local extremes. This may be attributed to the algorithm used in ERA5 reanalysis data to recalculate precipitation at different altitudes. Our annual precipitation totals in Mongolia were approximately 10–15% higher than the mean precipitation amount calculated using ground station data [21,22]. While the ERA5-Land data tend to overestimate precipitation, this bias has a minimal effect on the correlations observed, as the analysis is based on relative, not absolute, values. It is also important to note that bias is partially offset by the fact that ground stations often underestimate precipitation amounts due to methodological issues and technical measurement errors [28]. The actual difference between reanalysis and station data may be smaller than nominally presented, confirming the suitability of ERA5-Land for long-term trend analysis. Another limitation of this study is that spatial autocorrelation was not explicitly accounted for in the correlation analysis between climate variables, NDVI, and GPP. As neighboring grid cells often share similar climatic and vegetation characteristics, this spatial dependence may lead to slightly inflated significance levels (p < 0.05) [38]. Nevertheless, the observed spatial patterns are consistent with regional climatic gradients and provide meaningful insights into climate–vegetation interactions across Mongolia.
We determined an increasing annual GPP trend with a rate of 0.04 kgCm−2 per 10 years. This agrees with the change rate reported by Chen et al. [30]; however, other studies have shown mixed trends in GPP across the broader Mongolian Plateau region [16,31]. These apparent inconsistencies are mainly related to differences in the spatial domain, time period, and GPP products used. For example, Zhao et al. [16] analyzed the Mongolian Plateau (1982–2018) using GPP derived from the EC-LUE model [32], where 51% of the area exhibited decreasing trends and 49% showed increasing trends, with most of these changes being statistically insignificant. Similarly, Bai et al. [31] used the GLASS GPP product, also based on the EC-LUE model, and found spatially mixed patterns without a clear overall trend.
In contrast, our study focuses on Mongolia proper and covers a more recent period (2000–2024), including several exceptionally wet and warm years (2019–2024) that strongly influenced vegetation productivity. The exceptionally high GPP values in 2024 were likely driven by abundant precipitation and the severe 2023/2024 dzud winter, which reduced livestock numbers by 12.6% [35] and temporarily reduced grazing pressure on grasslands. Overall, differences among studies are primarily attributable to variations in spatial extent, temporal coverage, and data sources, rather than fundamental discrepancies in the underlying vegetation dynamics.
It was found that NDVI and GPP values increased across many northern and eastern regions, which is largely consistent with previous studies [6,13,39]. Our results highlight a strong positive correlation between summer precipitation and vegetation indicators (NDVI, GPP), which aligns with the findings of Bao et al. [15] and Bai et al. [17] regarding the significance of water availability for vegetation dynamics in semi-arid regions. Higher temperatures increase evapotranspiration, leading to surface and soil water loss and imposing limitations on photosynthesis due to water stress [40]. As a consequence, it also reduces vegetation productivity, especially in steppes, where excess heat causes moisture deficiency. While increasing temperatures in spring and autumn extend the growing season, plant water stress caused by higher evapotranspiration may reduce the growth potential of biomass [41,42].
While many studies on vegetation health and biomass changes in the region focus on annual values [5,16,31,36,40], we analyzed monthly means and trends to better capture seasonal vegetation responses to climate variability. By combining satellite-based vegetation data with detailed climate information, we could assess the short-term effects of temperature and rainfall that other studies often overlook. This approach provides a clearer understanding of how vegetation productivity varies throughout the growing season under different climatic conditions.
A monthly temporal scale revealed that NDVI and GPP trends, as well as their relationships with climate indices, vary across seasons and provinces. Between March and May, we observed statistically significant negative trends in the NDVI in certain central and eastern parts of Mongolia. From July to September, we observed significant positive NDVI trends in the same regions. Our results conflict with those of Bao et al. [3], who reported a decreasing trend in NDVI in steppes during summer months and an increasing trend in April from 1982 to 2010. They also reported monthly temperature and precipitation trends that were opposite to our analysis. These differences arise from different study periods and from the use of non-identical datasets. We used climate variables derived from ERA5 Land reanalysis data, while Bao et al. [3] used in situ data from 60 meteorological stations across Mongolia.
Chen et al. [43] hypothesized that GPP in the Mongolian Plateau was not affected by the length of the growing season, but our results show a strong correlation between GPP and T2M and DTR in April and October. This indicates that a longer growing season can have a positive impact, and we found a statistically significant increase in GPP in September and October. However, the GPP increase in spring and autumn may have only a marginal effect (<30%) on the total annual biomass growth, as the majority of biomass in the region is produced in summer [44]. The most pronounced statistically significant increases in GPP were observed during July and August, and this trend was consistent across Mongolia. We determined a strong correlation between GPP and precipitation during the summer months, and the spatial distribution of trends of these variables matches well. These findings confirm the results from other studies [15,17,44,45], that precipitation is the main limiting factor for biomass growth in summer.
Our results on the positive relationship between temperature indices and NDVI align with a study by Bao et al. [3], who reported a positive relationship between NDVI and temperature in April and May, and a negative relationship in July and August. However, Bao et al. [3], reported that NDVI positively correlates with temperature in June and September, while we observed a negative relationship. This discrepancy may be related to accelerating climate change, which has caused a rapid increase in mean spring temperatures and a longer growing season from 2000 to 2024. As a result, the limiting factor for NDVI in June and September becomes precipitation. The relationship between NDVI and precipitation, as determined in our study, agrees with the results from Bao et al. [3], which show a positive correlation between precipitation and NDVI from May to September. While Bao et al. [3] reported a positive correlation between 1- and 4-month lagged precipitation and NDVI, we did not determine any significant relationship between NDVI and 1-month lagged climate variables. Our study revealed a relationship between 1-month lag precipitation and GPP (especially in October), which is consistent with other studies that suggest vegetation growth is linked to water availability in previous periods [46,47,48].
In our study, we employed 10 different climate indices to examine whether extreme events have a higher impact on the NDVI and GPP than the mean monthly temperature and precipitation. However, results show that T2M and TP have a higher correlation with the vegetation indices than all other climate indices used in this study. While extreme climate indices are important for understanding climate change trends in Mongolia, mean temperature and precipitation are sufficient to explain the long-term monthly and annual trends of NDVI and GPP.
The results showed that in spring, NDVI and GPP depend most on temperature, while in summer, they rely most on precipitation, reflecting a clear seasonal differentiation in the impact of climate. The northern and eastern areas, where the increase in precipitation was greatest, recorded the most significant growth in GPP, while the changes in the central steppes were weaker.
Our results suggest that GPP is more sensitive to the conditions of the previous month than NDVI. The sensitivity of GPP to the meteorological conditions of the previous month indicates a delayed response of ecosystems to climate fluctuations. Our results indicate a more pronounced increase in summer productivity from 2018 to 2024, which is associated with wetter conditions. These data emphasize that the productivity of Mongolian vegetation is strongly dependent on seasonal water availability and its variability in the context of climate change.
While this study focused on GPP and NDVI trends and their relationships with temperature and precipitation indices, not all spatial and temporal variations in Mongolia’s vegetation can be explained solely by the climate conditions. Vegetation changes are also influenced by anthropogenic factors such as overgrazing and soil degradation. Future research integrating climatic, land-use, and livestock distribution data would help better distinguish the relative contributions of climate and human activities to variations in NDVI and GPP.

5. Conclusions

In this study, we examined changes in Mongolia’s climate and vegetation from 2000 to 2024 and investigated how different climate indices impact monthly and annual NDVI and GPP values. The results show that the mean annual air temperature increased by 0.94 °C during the study period. The strongest, statistically significant warming was observed in March, with a warming rate exceeding 1.5 °C per decade. During the investigation period, annual precipitation increased by approximately 13%, with the most notable increases in July and August in northern and eastern regions. However, precipitation trends were not statistically significant nationwide.
Maximum NDVI values showed a statistically significant increase of 0.025 NDVI units per decade, with absolute values rising from 0.30 in 2007 to 0.41 in 2018 and 2024. Increases were highest in the north and east of Mongolia, spatially aligning with regions of increased summer precipitation. GPP increased by 38%, from approximately 0.25 kgCm−2 in the early 2000s to 0.35 kgCm−2 in 2024. The highest monthly GPP was recorded in July, and the strongest rate of increase (over 0.08 kgCm−2 per 10 years) occurred in the northern forests and eastern steppes. NDVI showed moderate correlation with the mean temperature in March–April and precipitation during June–August. GPP showed the highest correlation with the analyzed temperature indices in April and with precipitation in the summer months. Unlike NDVI, GPP was also influenced by the weather conditions of the previous month, especially in May and June.
Our results underscore the strong seasonal and spatial variability in vegetation responses to climate variability and extremes in Mongolia. While the observed climate change trends indicate a prolonged vegetation season and increased precipitation in summer months, changes in NDVI and GPP cannot be explained solely by climate variables. Vegetation dynamics are shaped by both climatic and non-climatic factors, such as grazing and land degradation. The primary limitation of this study is the lack of spatially explicit data on soil and grazing intensity, which restricts our ability to fully distinguish the effects of climate and anthropogenic factors. Future research should integrate land-use, soil, and livestock data to provide a more comprehensive understanding of vegetation responses to environmental change.

Author Contributions

Conceptualization, J.K. and E.R.; methodology, J.K.; software, J.K. and J.L.; validation, O.B., J.L. and T.-O.S.-E.; formal analysis, J.K. and E.R.; investigation, E.R. and O.B.; resources, T.-O.S.-E.; data curation, J.L. and T.-O.S.-E.; writing—original draft preparation, J.K. and E.R.; writing—review and editing, O.B., J.L. and T.-O.S.-E.; visualization, J.L. and T.-O.S.-E.; supervision, E.R.; project administration, J.K.; funding acquisition, E.R. All authors have read and agreed to the published version of the manuscript.

Funding

This work was partially supported by the Embassy of the Republic of Lithuania to South Korea under the project grant MG2-2024 (Impact of Climate Extremes on the Ecosystem Productivity and Health in Mongolia).

Institutional Review Board Statement

Not applicable.

Informed Consent Statement

Not applicable.

Data Availability Statement

All data used in this study are openly available from public databases. The ERA5-Land reanalysis data is available through the Copernicus Climate Data Store online at https://cds.climate.copernicus.eu, accessed on 12 February 2025. All MODIS-based datasets are available from the NASA EarthData platform: MOD17A2HGF (https://www.earthdata.nasa.gov/data/catalog/lpcloud-mod17a2hgf-061, accessed on 9 February 2025); MOD13A2 (https://www.earthdata.nasa.gov/data/catalog/lpcloud-mod13a2-061, accessed on 8 February 2025).

Acknowledgments

The authors thank the editor and reviewers for their help in improving this manuscript.

Conflicts of Interest

The authors declare no conflicts of interest.

Abbreviations

The following abbreviations are used in this manuscript:
CDDConsecutive dry days
CSUConsecutive summer days
DTRMean daily temperature range
FDDFreezing degree days
GDDGrowing degree days
GPPGross Primary Productivity
MODIS Moderate Resolution Imaging Spectroradiometer
NDVINormalized Difference Vegetation Index
RX5DayThe highest precipitation amount over 5 days
T2MMean air temperature at 2 m
TN90PDays with very warm nights
TPTotal precipitation
TX10PVery cold days
WADDNumber of warm and dry days
WSTLWet spell total length

References

  1. MacDougall, A.S.; Esch, E.; Chen, Q.; Carroll, O.; Bonner, C.; Ohlert, T.; Siewert, M.; Sulik, J.; Schweiger, A.K.; Borer, E.T.; et al. Widening Global Variability in Grassland Biomass since the 1980s. Nat. Ecol. Evol. 2024, 8, 1877–1888. [Google Scholar] [CrossRef]
  2. Bao, G.; Qin, Z.; Bao, Y.; Zhou, Y.; Li, W.; Sanjjav, A. NDVI-Based Long-Term Vegetation Dynamics and Its Response to Climatic Change in the Mongolian Plateau. Remote Sens. 2014, 6, 8337–8358. [Google Scholar] [CrossRef]
  3. Bao, G.; Bao, Y.; Sanjjava, A.; Qin, Z.; Zhou, Y.; Xu, G. NDVI-Indicated Long-Term Vegetation Dynamics in Mongolia and Their Response to Climate Change at Biome Scale. Int. J. Climatol. 2015, 35, 4293–4306. [Google Scholar] [CrossRef]
  4. Wang, H.; Chen, A.; Wang, Q.; He, B. Drought Dynamics and Impacts on Vegetation in China from 1982 to 2011. Ecol. Eng. 2015, 75, 303–307. [Google Scholar] [CrossRef]
  5. Nanzad, L.; Zhang, J.; Tuvdendorj, B.; Nabil, M.; Zhang, S.; Bai, Y. NDVI Anomaly for Drought Monitoring and Its Correlation with Climate Factors over Mongolia from 2000 to 2016. J. Arid Environ. 2019, 164, 69–77. [Google Scholar] [CrossRef]
  6. Eckert, S.; Hüsler, F.; Liniger, H.; Hodel, E. Trend Analysis of MODIS NDVI Time Series for Detecting Land Degradation and Regeneration in Mongolia. J. Arid Environ. 2015, 113, 16–28. [Google Scholar] [CrossRef]
  7. Enebish, B.; Dashkhuu, D.; Renchin, M.; Russell, M.; Singh, P. Impact of Climate on the NDVI of Northern Mongolia. J. Indian Soc. Remote Sens. 2020, 48, 333–340. [Google Scholar] [CrossRef]
  8. Hilker, T.; Natsagdorj, E.; Waring, R.H.; Lyapustin, A.; Wang, Y. Satellite Observed Widespread Decline in Mongolian Grasslands Largely Due to Overgrazing. Glob. Change Biol. 2014, 20, 418–428. [Google Scholar] [CrossRef] [PubMed]
  9. Meng, X.; Gao, X.; Li, S.; Lei, J. Spatial and Temporal Characteristics of Vegetation NDVI Changes and the Driving Forces in Mongolia during 1982–2015. Remote Sens. 2020, 12, 603. [Google Scholar] [CrossRef]
  10. Miao, L.; Sun, Z.; Ren, Y.; Schierhorn, F.; Müller, D. Grassland Greening on the Mongolian Plateau despite Higher Grazing Intensity. Land Degrad. Dev. 2021, 32, 792–802. [Google Scholar] [CrossRef]
  11. Vandandorj, S.; Gantsetseg, B.; Boldgiv, B. Spatial and Temporal Variability in Vegetation Cover of Mongolia and Its Implications. J. Arid Land 2015, 7, 450–461. [Google Scholar] [CrossRef]
  12. Barman, R.; Jain, A.K.; Liang, M. Climate-Driven Uncertainties in Modeling Terrestrial Gross Primary Production: A Site Level to Global-Scale Analysis. Glob. Change Biol. 2014, 20, 1394–1411. [Google Scholar] [CrossRef]
  13. Meng, F.; Luo, M.; Wang, Y.; Sa, C.; Bao, S.; Bao, Y.; Liu, T. Revisiting the Main Driving Factors Influencing the Dynamics of Gross Primary Productivity in the Mongolian Plateau. Agric. For. Meteorol. 2023, 341, 109689. [Google Scholar] [CrossRef]
  14. Sun, Z.; Wang, X.; Yamamoto, H.; Tani, H.; Zhong, G.; Yin, S.; Guo, E. Spatial Pattern of GPP Variations in Terrestrial Ecosystems and Its Drivers: Climatic Factors, CO2 Concentration and Land-Cover Change, 1982–2015. Ecol. Inform. 2018, 46, 156–165. [Google Scholar] [CrossRef]
  15. Bao, G.; Tuya, A.; Bayarsaikhan, S.; Dorjsuren, A.; Mandakh, U.; Bao, Y.; Li, C.; Vanchindorj, B. Variations and Climate Constraints of Terrestrial Net Primary Productivity over Mongolia. Quat. Int. 2020, 537, 112–125. [Google Scholar] [CrossRef]
  16. Zhao, X.; Luo, M.; Meng, F.; Sa, C.; Bao, S.; Bao, Y. Spatiotemporal Changes of Gross Primary Productivity and Its Response to Drought in the Mongolian Plateau under Climate Change. J. Arid Land 2024, 16, 46–70. [Google Scholar] [CrossRef]
  17. Bai, Y.; Liu, M.; Guo, Q.; Wu, G.; Wang, W.; Li, S. Diverse Responses of Gross Primary Production and Leaf Area Index to Drought on the Mongolian Plateau. Sci. Total Environ. 2023, 902, 166507. [Google Scholar] [CrossRef] [PubMed]
  18. Yembuu, B. General Geographical Characteristics of Mongolia. In The Physical Geography of Mongolia; Yembuu, B., Ed.; Springer International Publishing: Cham, Switzerland, 2021; pp. 1–8. ISBN 978-3-030-61434-8. [Google Scholar]
  19. Beck, H.E.; McVicar, T.R.; Vergopolan, N.; Berg, A.; Lutsko, N.J.; Dufour, A.; Zeng, Z.; Jiang, X.; van Dijk, A.I.J.M.; Miralles, D.G. High-Resolution (1 Km) Köppen-Geiger Maps for 1901–2099 Based on Constrained CMIP6 Projections. Sci. Data 2023, 10, 724. [Google Scholar] [CrossRef]
  20. Morinaga, Y.; Tian, S.-F.; Shinoda, M. Winter Snow Anomaly and Atmospheric Circulation in Mongolia. Int. J. Climatol. 2003, 23, 1627–1636. [Google Scholar] [CrossRef]
  21. Ministry of Environment and Tourism of Mongolia. Fourth National Communication of Mongolia; Ministry of Environment and Tourism of Mongolia: Ulaanbaatar, Mongolia, 2024; p. 493.
  22. Han, J.; Dai, H.; Gu, Z. Sandstorms and Desertification in Mongolia, an Example of Future Climate Events: A Review. Environ. Chem. Lett. 2021, 19, 4063–4073. [Google Scholar] [CrossRef]
  23. Didan, K. MODIS/Terra Vegetation Indices 16-Day L3 Global 1km SIN Grid. V061. NASA Land Processes Distributed Active Archive Center. 2021. Available online: https://www.earthdata.nasa.gov/data/catalog/lpcloud-mod13a2-061 (accessed on 17 November 2025).
  24. Running, S.; Zhao, M. MODIS/Terra Gross Primary Productivity Gap-Filled 8-Day L4 Global 500m SIN Grid. V061. NASA Land Processes Distributed Active Archive Center. 2021. Available online: https://www.earthdata.nasa.gov/data/catalog/lpcloud-mod17a2hgf-061 (accessed on 17 November 2025).
  25. Muñoz-Sabater, J. ERA5-Land Hourly Data from 1950 to Present. Copernicus Climate Change Service (C3S) Climate Data Store (CDS). 2025. Available online: https://cds.climate.copernicus.eu/datasets/reanalysis-era5-land?tab=overview (accessed on 17 November 2025).
  26. Muñoz-Sabater, J.; Dutra, E.; Agustí-Panareda, A.; Albergel, C.; Arduini, G.; Balsamo, G.; Boussetta, S.; Choulga, M.; Harrigan, S.; Hersbach, H.; et al. ERA5-Land: A State-of-the-Art Global Reanalysis Dataset for Land Applications. Earth Syst. Sci. Data 2021, 13, 4349–4383. [Google Scholar] [CrossRef]
  27. Zhao, P.; He, Z. A First Evaluation of ERA5-Land Reanalysis Temperature Product Over the Chinese Qilian Mountains. Front. Earth Sci. 2022, 10, 907730. [Google Scholar] [CrossRef]
  28. Xin, Y.; Yang, Y.; Chen, X.; Yue, X.; Liu, Y.; Yin, C. Evaluation of IMERG and ERA5 Precipitation Products over the Mongolian Plateau. Sci. Rep. 2022, 12, 21776. [Google Scholar] [CrossRef]
  29. Clelland, A.A.; Marshall, G.J.; Baxter, R. Evaluating the Performance of Key ERA-Interim, ERA5 and ERA5-Land Climate Variables across Siberia. Int. J. Climatol. 2024, 44, 2318–2342. [Google Scholar] [CrossRef]
  30. Alexander, L.V.; Zhang, X.; Peterson, T.C.; Caesar, J.; Gleason, B.; Klein Tank, A.M.G.; Haylock, M.; Collins, D.; Trewin, B.; Rahimzadeh, F.; et al. Global Observed Changes in Daily Climate Extremes of Temperature and Precipitation. J. Geophys. Res. Atmos. 2006, 111, D05109. [Google Scholar] [CrossRef]
  31. Klein Tank, A.M.G.; Zwiers, F.W.; Zhang, X. Guidelines on Analysis of Extremes in a Changing Climate in Support of Informed Decisions for Adaptation; World Meteorological Organization (WMO) WMO/TD-No. 1500: Geneva, Switzerland, 2009. [Google Scholar]
  32. Taddei, R. Maximum Value Interpolated (MVI): A Maximum Value Composite Method Improvement in Vegetation Index Profiles Analysis. Int. J. Remote Sens. 1997, 18, 2365–2370. [Google Scholar] [CrossRef]
  33. Munkhjargal, E.; Shinoda, M.; Iijima, Y.; Nandintseteseg, B. Recently Increased Cold Air Outbreaks over Mongolia and Their Specific Synoptic Pattern. Int. J. Climatol. 2020, 40, 5502–5514. [Google Scholar] [CrossRef]
  34. Kusch, E.; Davy, R.; Seddon, A.W.R. Vegetation-Memory Effects and Their Association with Vegetation Resilience in Global Drylands. J. Ecol. 2022, 110, 1561–1574. [Google Scholar] [CrossRef]
  35. Liu, H.; Zhang, A.; Liu, C.; Zhao, Y.; Zhao, A.; Wang, D. Analysis of the Time-Lag Effects of Climate Factors on Grassland Productivity in Inner Mongolia. Glob. Ecol. Conserv. 2021, 30, e01751. [Google Scholar] [CrossRef]
  36. Wen, Y.; Liu, X.; Xin, Q.; Wu, J.; Xu, X.; Pei, F.; Li, X.; Du, G.; Cai, Y.; Lin, K.; et al. Cumulative Effects of Climatic Factors on Terrestrial Vegetation Growth. J. Geophys. Res. Biogeosci. 2019, 124, 789–806. [Google Scholar] [CrossRef]
  37. Natsagdorj, L.; Dulamsuren, J. Some Aspect of Assessment of the Dzud Phenomena. Pap. Inst. Meteorol. Hydrol. 2001, 23, 3–18. [Google Scholar]
  38. Cortés, J.; Mahecha, M.; Reichstein, M.; Brenning, A. Accounting for Multiple Testing in the Analysis of Spatio-Temporal Environmental Data. Environ. Ecol. Stat. 2020, 27, 293–318. [Google Scholar] [CrossRef]
  39. Li, C.; Li, L.; Wu, X.; Tsunekawa, A.; Wei, Y.; Liu, Y.; Peng, L.; Chen, J.; Bai, K. Increasing Precipitation Promoted Vegetation Growth in the Mongolian Plateau during 2001–2018. Front. Environ. Sci. 2023, 11, 1153601. [Google Scholar] [CrossRef]
  40. Jiang, L.; Guli, J.; Bao, A.; Guo, H.; Ndayisaba, F. Vegetation Dynamics and Responses to Climate Change and Human Activities in Central Asia. Sci. Total Environ. 2017, 599–600, 967–980. [Google Scholar] [CrossRef]
  41. Grossiord, C.; Buckley, T.N.; Cernusak, L.A.; Novick, K.A.; Poulter, B.; Siegwolf, R.T.W.; Sperry, J.S.; McDowell, N.G. Plant Responses to Rising Vapor Pressure Deficit. New Phytol. 2020, 226, 1550–1566. [Google Scholar] [CrossRef] [PubMed]
  42. Pan, S.; Pan, N.; Tian, H.; Friedlingstein, P.; Sitch, S.; Shi, H.; Arora, V.K.; Haverd, V.; Jain, A.K.; Kato, E.; et al. Evaluation of Global Terrestrial Evapotranspiration Using State-of-the-Art Approaches in Remote Sensing, Machine Learning and Land Surface Modeling. Hydrol. Earth Syst. Sci. 2020, 24, 1485–1509. [Google Scholar] [CrossRef]
  43. Chen, X.; Tao, X.; Yang, Y. Distribution and Attribution of Gross Primary Productivity Increase Over the Mongolian Plateau, 2001–2018. IEEE Access 2022, 10, 25125–25134. [Google Scholar] [CrossRef]
  44. Bao, G.; Chen, J.; Chopping, M.; Bao, Y.; Bayarsaikhan, S.; Dorjsuren, A.; Tuya, A.; Jirigala, B.; Qin, Z. Dynamics of Net Primary Productivity on the Mongolian Plateau: Joint Regulations of Phenology and Drought. Int. J. Appl. Earth Obs. Geoinf. 2019, 81, 85–97. [Google Scholar] [CrossRef]
  45. Lin, C.; Dugarsuren, N. Deriving the Spatiotemporal NPP Pattern in Terrestrial Ecosystems of Mongolia Using MODIS Imagery. Photogramm. Eng. Remote Sens. 2015, 81, 587–598. [Google Scholar] [CrossRef]
  46. Gong, H.; Wang, G.; Fan, C.; Zhuo, X.; Sha, L.; Kuang, Z.; Bi, J.; Cheng, T. Temporal Accumulation and Lag Effects of Precipitation on Carbon Fluxes in Terrestrial Ecosystems across Semi-Arid Regions in China. Agric. For. Meteorol. 2024, 356, 110189. [Google Scholar] [CrossRef]
  47. Wei, X.; He, W.; Zhou, Y.; Ju, W.; Xiao, J.; Li, X.; Liu, Y.; Xu, S.; Bi, W.; Zhang, X.; et al. Global Assessment of Lagged and Cumulative Effects of Drought on Grassland Gross Primary Production. Ecol. Indic. 2022, 136, 108646. [Google Scholar] [CrossRef]
  48. Li, C.; Liu, Y.; Zhu, T.; Zhou, M.; Dou, T.; Liu, L.; Wu, X. Considering Time-Lag Effects Can Improve the Accuracy of NPP Simulation Using a Light Use Efficiency Model. J. Geogr. Sci. 2023, 33, 961–979. [Google Scholar] [CrossRef]
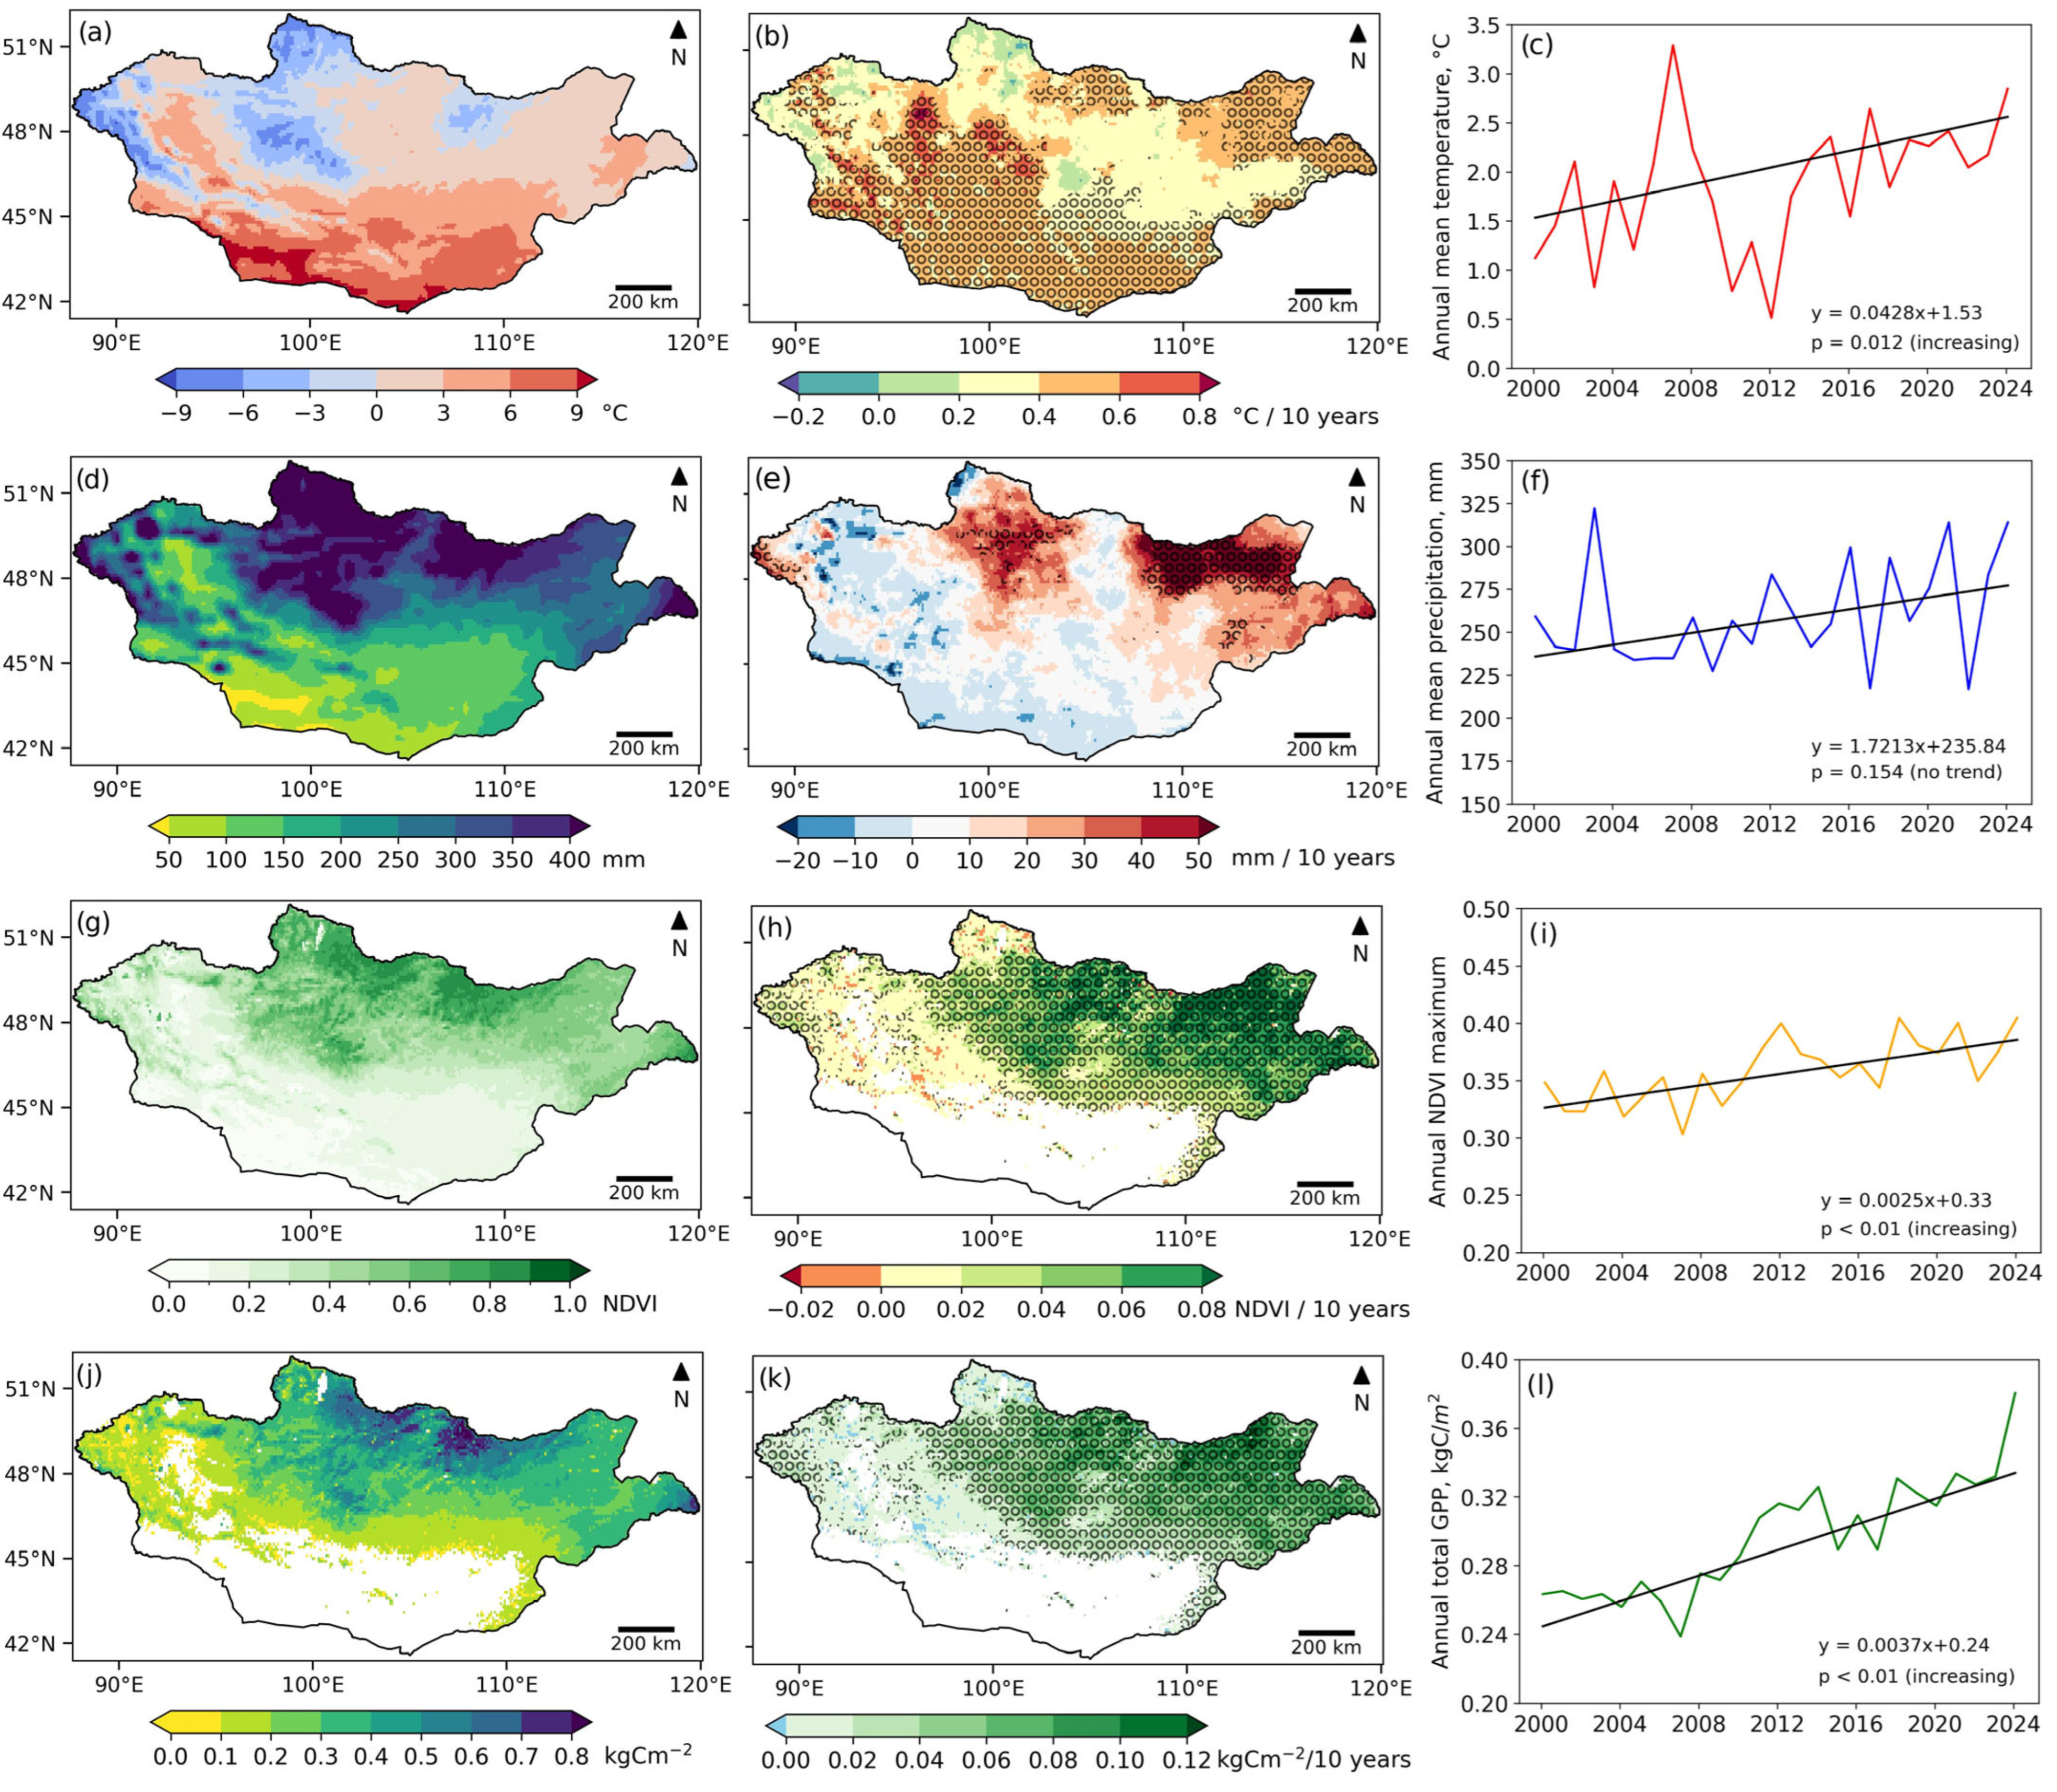
Figure 1. Spatial distribution and observed trends in air temperature, precipitation, NDVI, and GPP across Mongolia from 2000 to 2024. Areas with statistically significant trends (p < 0.05) are marked with circles. Panels: (a) mean annual air temperature; (b) change rate of annual air temperature (°C per 10 years); (c) air temperature variation and trend significance; (d) mean total annual precipitation; (e) change rate of annual precipitation (mm per 10 years); (f) precipitation variation and trend significance; (g) mean maximum NDVI; (h) NDVI change rate (NDVI per 10 years); (i) NDVI variation and trend significance; (j) mean annual GPP; (k) change rate of total annual GPP (kgCm−2 per 10 years); (l) GPP variation and trend significance.
Atmosphere 16 01307 g001
Figure 2. Trends of monthly mean variables in Mongolia from 2000 to 2024: (a) air temperature (°C per 10 years); (b) precipitation (mm per 10 years); (c) NDVI (NDVI units per 10 years); and (d) GPP (kgCm−2 per 10 years). Areas with statistically significant trends (p < 0.05) are marked with circles.
Atmosphere 16 01307 g002
Figure 3. Spatial distribution of the correlation coefficients between NDVI and four climate variables: mean air temperature (T2M), diurnal temperature range (DTR), total precipitation (TP), and maximum 5-day precipitation (RX5Day) for March–October. Only statistically significant correlations (p < 0.05) are shown. Correlations for November–February are omitted due to weak or insignificant relationships.
Atmosphere 16 01307 g003
Figure 4. Correlation between NDVI and different climate variables and indices: (a) temperature (T2M); (b) precipitation (TP); (c) freezing degree days (FDD); (d) growing degree days (GDD); (e) highest precipitation amount over 5 days (RX5Day); (f) wet spell total length (WSTL); (g) consecutive dry days (CDD); (h) very cold days (TX10P); (i) days with very warm nights (TN90P); (j) daily temperature range (DTR); (k) consecutive summer days (CSU); (l) number of warm and dry days (WADD). Blue boxplots show correlations for the same month, and green boxplots show correlations between NDVI and climate indices from one month before. Dotted lines mark the thresholds of moderate correlation (|r| ≥ 0.30).
Atmosphere 16 01307 g004
Figure 5. Spatial distribution of the correlation coefficients between GPP and four climate variables: mean air temperature (T2M), diurnal temperature range (DTR), total precipitation (TP), and maximum 5-day precipitation (RX5Day) for March–October. Only statistically significant correlations (p < 0.05) are shown. Correlations for November–February are omitted due to weak or insignificant relationships.
Atmosphere 16 01307 g005
Figure 6. Correlation between GPP and different climate variables and indices: (a) temperature (T2M); (b) precipitation (TP); (c) freezing degree days (FDD); (d) growing degree days (GDD); (e) highest precipitation amount over 5 days (RX5Day); (f) wet spell total length (WSTL); (g) consecutive dry days (CDD); (h) very cold days (TX10P); (i) days with very warm nights (TN90P); (j) daily temperature range (DTR); (k) consecutive summer days (CSU); (l) number of warm and dry days (WADD). Blue boxplots show correlations for the same month, and green boxplots show correlations between GPP and climate indices from one month before. Dotted lines mark the thresholds of moderate correlation (|r| ≥ 0.30).
Atmosphere 16 01307 g006
Table 1. List of the 10 selected climate indices that were used in this study.
Climate IndexAbbreviationDescription
Freezing degree days FDDCumulative sum of temperature degrees for the mean daily temperature below 0 °C
Growing degree days GDDCumulative sum of temperature degrees for the mean daily temperature above 5 °C
The highest precipitation amount over 5 daysRX5DayThe highest precipitation amount accumulated over a 5-day moving window
Consecutive summer daysCSUMaximum number of consecutive days with maximum daily temperature above 25 °C
Number of warm and dry days WADDNumber of days where the mean temperature is above the 75th percentile and precipitation is below the 25th percentile
Mean daily temperature range DTRMean diurnal temperature range
Consecutive dry days CDDMaximum number of consecutive dry days
(total precipitation < 1 mm)
Wet spell total length WSTLTotal number of days in wet periods. The total precipitation amount has to be >10 mm, and the duration of the wet spell has to be ≥3 days
Days with very warm nightsTN90PNumber of days with daily minimum temperature over the 90th percentile
Very cold daysTX10PNumber of days with daily maximum temperature below the 10th percentile
Table 2. Satellite and climate data were used in the study.
DatasetVariablesSpatial
Resolution
Temporal
Resolution
MOD13A2
(version 6.1)
Normalized Difference Vegetation Index (NDVI)1 km16 day composite
(from 18 February 2000)
MOD17A2HG
(version 6.1)
Gross Primary Production (GPP)500 m8 days composite
(from 1 January 2000)
ERA5 Land Reanalysis Mean, min, and max temperature, precipitation0.1° × 0.1°Hourly
(2000–2024)
Disclaimer/Publisher’s Note: The statements, opinions and data contained in all publications are solely those of the individual author(s) and contributor(s) and not of MDPI and/or the editor(s). MDPI and/or the editor(s) disclaim responsibility for any injury to people or property resulting from any ideas, methods, instructions or products referred to in the content.