Article

Sensitivity Analysis of Tropospheric Ozone Concentration to Domestic Anthropogenic Emission of Nitrogen Oxides (NOx) and Volatile Organic Compounds (VOC) in Japan: Comparison Between 2015 and 2050

1
Graduate School of Science and Engineering, Ibaraki University, 4-12-1 Nakanarusawa, Hitachi 316-8511, Ibaraki, Japan
2
Graduate School of Engineering, Tokyo Denki University, 5 Senjuasahi, Adachi-ku, Tokyo 120-8551, Japan
3
Japan Automobile Research Institute, 2530 Karima, Tsukuba 305-0822, Ibaraki, Japan
4
Haltermann Carless Japan G.K., Suite 402, Bldg., 14 Nihon Odori, Naka-ku, Yokohama 231-0021, Kanagawa, Japan
5
Institute of Integrated Atmospheric Environment (IIAE), 1-2-8 Koraku, Bunkyo-ku, Tokyo 112-0004, Japan
6
Nissan Motor Co., Ltd., 560-2 Okatsukoku, Atsugi 243-0192, Kanagawa, Japan
7
Toyota Motor Corp., 1 Toyota, Toyota 471-8571, Aichi, Japan
*
Authors to whom correspondence should be addressed.
Atmosphere 2025, 16(11), 1261; https://doi.org/10.3390/atmos16111261
Submission received: 4 October 2025 / Revised: 28 October 2025 / Accepted: 29 October 2025 / Published: 3 November 2025

Abstract

Tropospheric ozone (O3) is a harmful air pollutant and a short-lived greenhouse gas. To find effective O3 reduction strategies, it is essential to understand the sensitivity of O3 concentrations to its precursors, nitrogen oxides (NOx), and volatile organic compounds (VOC). This study applied the Community Multi-Scale Air Quality model (CMAQ) to assess the effects of domestic anthropogenic emissions in 2015 and 2050. The emission scenarios were based on Japan’s CO2 reduction targets, assuming an 80% decrease by 2050. Sensitivity analysis was performed by adjusting NOx and VOC emissions by ±10% and ±20%, respectively, and examining seasonal and regional variations in the O3 response. The results show that O3 levels will decrease notably in spring and summer by 2050, although concentrations will still exceed the standards in some areas. NOx reductions lead to significant O3 decreases, while VOC reductions show limited benefits, except in urban regions such as Kanto and Kansai. In winter, NOx reductions may even increase O3 levels due to weakened titration. Overall, the findings highlight the importance of prioritizing NOx control measures for effective O3 mitigation in Japan’s future energy transition.

1. Introduction

Tropospheric ozone (O3) is harmful to human health and needs to be maintained below a certain concentration to prevent adverse effects [1]. O3 is also a short-lived greenhouse gas that contributes approximately +0.47 W m−2 to a global effective radiative forcing and has exhibited a continuous increase since the 1990s [2]. O3 is formed through photochemical reactions in the atmosphere involving nitrogen oxides (NOx) and volatile organic compounds (VOC) emitted from either biogenic or anthropogenic sources [3].
In recent years, the average O3 concentration has shown an increase while the occurrence of high concentrations reaching warning levels during summer has decreased in Japan [4]. The average O3 concentration is highest in spring, with a peak occurring around May [5]. These high concentrations in spring and summer represent the main issue for O3 levels in Japan, while autumn and winter are not currently considered problematic. Furthermore, from the perspective of comparison with environmental standards, the attainment rate against Japan’s environmental standard [6] was 0% in the fiscal year 2023, indicating a serious situation [4]. For example, in analyses on the trends in O3 concentrations, Akimoto et al. (2015) [7] showed that the long-term trend of O3 concentrations are gradually increasing over Japan over the past couple of decades. The increasing trend in O3 concentrations is not limited to Japan but is observed globally: Gaudel et al. (2020) [8] demonstrated that since the late 1990s, O3 has been on an upward trend in most regions of the Northern Hemisphere.
In addressing the problem of high O3 concentrations, it is noteworthy that the average O3 concentration has not decreased, despite reductions in NOx and VOC concentrations in Japan [4]. Akimoto et al. (2015) demonstrated that the decrease in NO titration effects due to NOx reduction, along with an increase in transboundary transport, contributed to an increase in O3 concentrations [7]. Chatani et al. (2020) conducted a source–receptor analysis considering recent emission regulations implemented in Japan and neighboring countries, and found that transboundary pollution from outside Japan continues to have a significant impact on domestic O3 concentrations, whereas the sensitivity of domestic O3 concentrations to domestic emission sources is either small or, in some cases, negative, which means reductions in domestic emissions can paradoxically lead to higher O3 levels due to changes in photochemical reactions [9]. Analyses of the factors behind high O3 concentrations have also been conducted outside Japan [10,11,12], revealing that these factors vary widely depending on the country or region. On the other hand, several characteristics observed in these studies are similar to the situation in Japan. Sharma et al. (2016) [10] demonstrated that, in India, NOx reductions contributed to decreases in O3 concentrations at many sites, whereas in urban areas, NOx reductions led to increases in O3 levels. A similar trend in urban areas was also reported by Santiago et al. (2024) [11] in their analysis of Mexico. Such consistent patterns observed in various regions suggest that the analysis of the Japanese case may also provide valuable insights applicable to other countries.
Considering that reducing precursor emissions does not necessarily lead to lower O3 concentrations, there is concern that future changes in precursor emissions associated with CO2 reduction could have adverse effects. Ito et al. (2021) pointed out that because air pollutants are often emitted alongside CO2 during combustion, efforts toward CO2 reduction may have the potential to improve air pollution issues [13]. However, they also noted that, in some cases, such efforts could have negative impacts, emphasizing the need to monitor this issue.
Despite such concerns, efforts toward substantial CO2 reductions, which could affect O3 concentrations, have already begun. In 2021, at the 26th Conference of the Parties (COP26) of the United Nations Framework Convention on Climate Change (UNFCCC), an implementation guideline for the Paris Agreement, which set the framework for greenhouse gas emission reductions beyond 2020, was agreed upon [14]. Furthermore, at the recent COP29, an agreement was reached on a financial framework for climate change measures [15], indicating that climate action has evolved beyond mere principles and targets to the stage of concrete implementation. Especially in Japan, in 2020, achieving carbon neutrality by 2050 has been set as a goal [16]. In 2021, the 6th Strategic Energy Plan was approved by the Cabinet of Japan [17], reflecting an active movement toward CO2 emission reductions both domestically and internationally.
Several studies have been conducted to assess the future O3 situation under such emissions scenarios of 2050. To examine how conditions may change under future emission scenarios, Morikawa et al. (2021) used air quality simulations to calculate O3 concentrations in 2050 based on an 80% greenhouse gas reduction scenario under the 5th Strategic Energy Plan in Japan [18]. The results indicated that compared to 2015, the duration of high O3 concentration periods in summer would decrease, leading to a significant reduction in photochemical smog warnings. However, it was also found that the decrease in O3 concentration during spring was minimal, making it difficult to maintain the environmental standard of 60 ppb or lower. Hata et al. (2023) conducted a detailed evaluation of the impact of net-zero carbon technologies on O3 concentration using air quality simulations [19]. Their findings suggested that, while O3 concentrations would decrease significantly by 2050 compared to 2015, they would not fully fall below the environmental standard levels.
Although previous studies have investigated the impact of air pollutant reductions on future O3 concentrations, few have specifically quantified the sensitivity of O3 concentrations to changes in NOₓ and VOC emissions in Japan under a 2050 scenario. This knowledge gap makes it difficult to assess the effectiveness of additional emission-reduction measures beyond government policies. Furthermore, despite such efforts in other countries [20,21], additional reduction measures beyond government-planned policies have not been extensively evaluated in Japan. Given the nonlinear relationship between O3 formation and precursor emissions [22], a detailed sensitivity analysis is crucial for developing effective O3 reduction strategies.
Therefore, this study aimed to quantify the sensitivity of O3 concentrations in Japan in 2050 to NOx and VOC emissions from domestic anthropogenic sources using air quality simulation. This study contributes to the development of effective O3 reduction strategies by providing a common indicator applicable to various emission sectors. Using the 2050 emission scenario estimated by Morikawa et al. (2021) [18] as a baseline, air quality simulations were employed to independently vary NOx and VOC emissions from domestic anthropogenic sources by ±10% and ±20%, then the sensitivity of O3 concentrations to these emission changes was quantified to evaluate potential reduction strategies.

2. Materials and Methods

2.1. Air Quality Simulations

The Community Multi-Scale Air Quality Model (CMAQ) (version 5.3.2; U.S. Environmental Protection Agency, Research Triangle Park, NC, USA) [23] was used for the air quality simulation. For the chemical reaction model, SAPRC07tc [24,25] was used for gas-phase reaction processes, and AERO6 was used for aerosol processes. The Weather Research and Forecasting (WRF) model (version 3.8.1; National Center for Atmospheric Research, Boulder, CO, USA) [26] was used to simulate weather conditions. In WRF, the following physics parameterization schemes was used: Thompson scheme for microphysics, ACM2 scheme for planetary boundary layer physics, Betts–Miller–Janjic scheme for cumulus, RRTM scheme for longwave radiation and Dudhia scheme for shortwave radiation. The objective analysis data input to the WRF was 2015 data from the National Centers for Environmental Prediction Final Operational Model Global Tropospheric Analyses [27]. Meteorological conditions for 2015 were also applied to the 2050 calculations to eliminate the influence of weather conditions.
Figure 1 shows the computational domain used in this study. Calculations were first performed for the East Asia Domain, which covers East Asia at a horizontal grid size of 40 km, followed by calculations for the Japan Domain, which covers Japan at a horizontal grid size of 20 km. The initial and boundary conditions for the East Asia Domain were derived from the results of the global chemistry model CAM-Chem [28] under the 2015 conditions, whereas the Japan Domain uses the results of the East Asia Domain.
Air quality simulations were performed for 29 days in each of the following seasons: Spring (26 April to 24 May), Summer (16 July to 13 August), Autumn (16 October to 13 November), and Winter (16 January to 13 February). For the actual calculations, an additional spin-up time was added before the period indicated for each season; 5 days for Japan Domain and 10 days for East Asia Domain.

2.2. Emissions

Emission data for 2015 were obtained from multiple sources. For anthropogenic emissions and volcanic emissions from Japan, PM2.5 Emission Inventory (PM2.5EI) [29] was used. For anthropogenic emissions other than from Japan and Russia, the Regional Emission inventory in ASia (REAS) version 3 [30] was used. For anthropogenic emissions from Russia, ECLIPSE v5a [31] was used. Biogenic VOC emissions were estimated by the Model of Emissions of Gases and Aerosols from Nature (MEGAN) [32]. Especially in the case of Japan Domain, improved emission factors developed by Chatani et al. (2015) [33] was applied. For open biomass burning emissions, Global Fire Emissions Database (GFED) version 4.1 [34] was used for both East Asia Domain and Japan Domain.
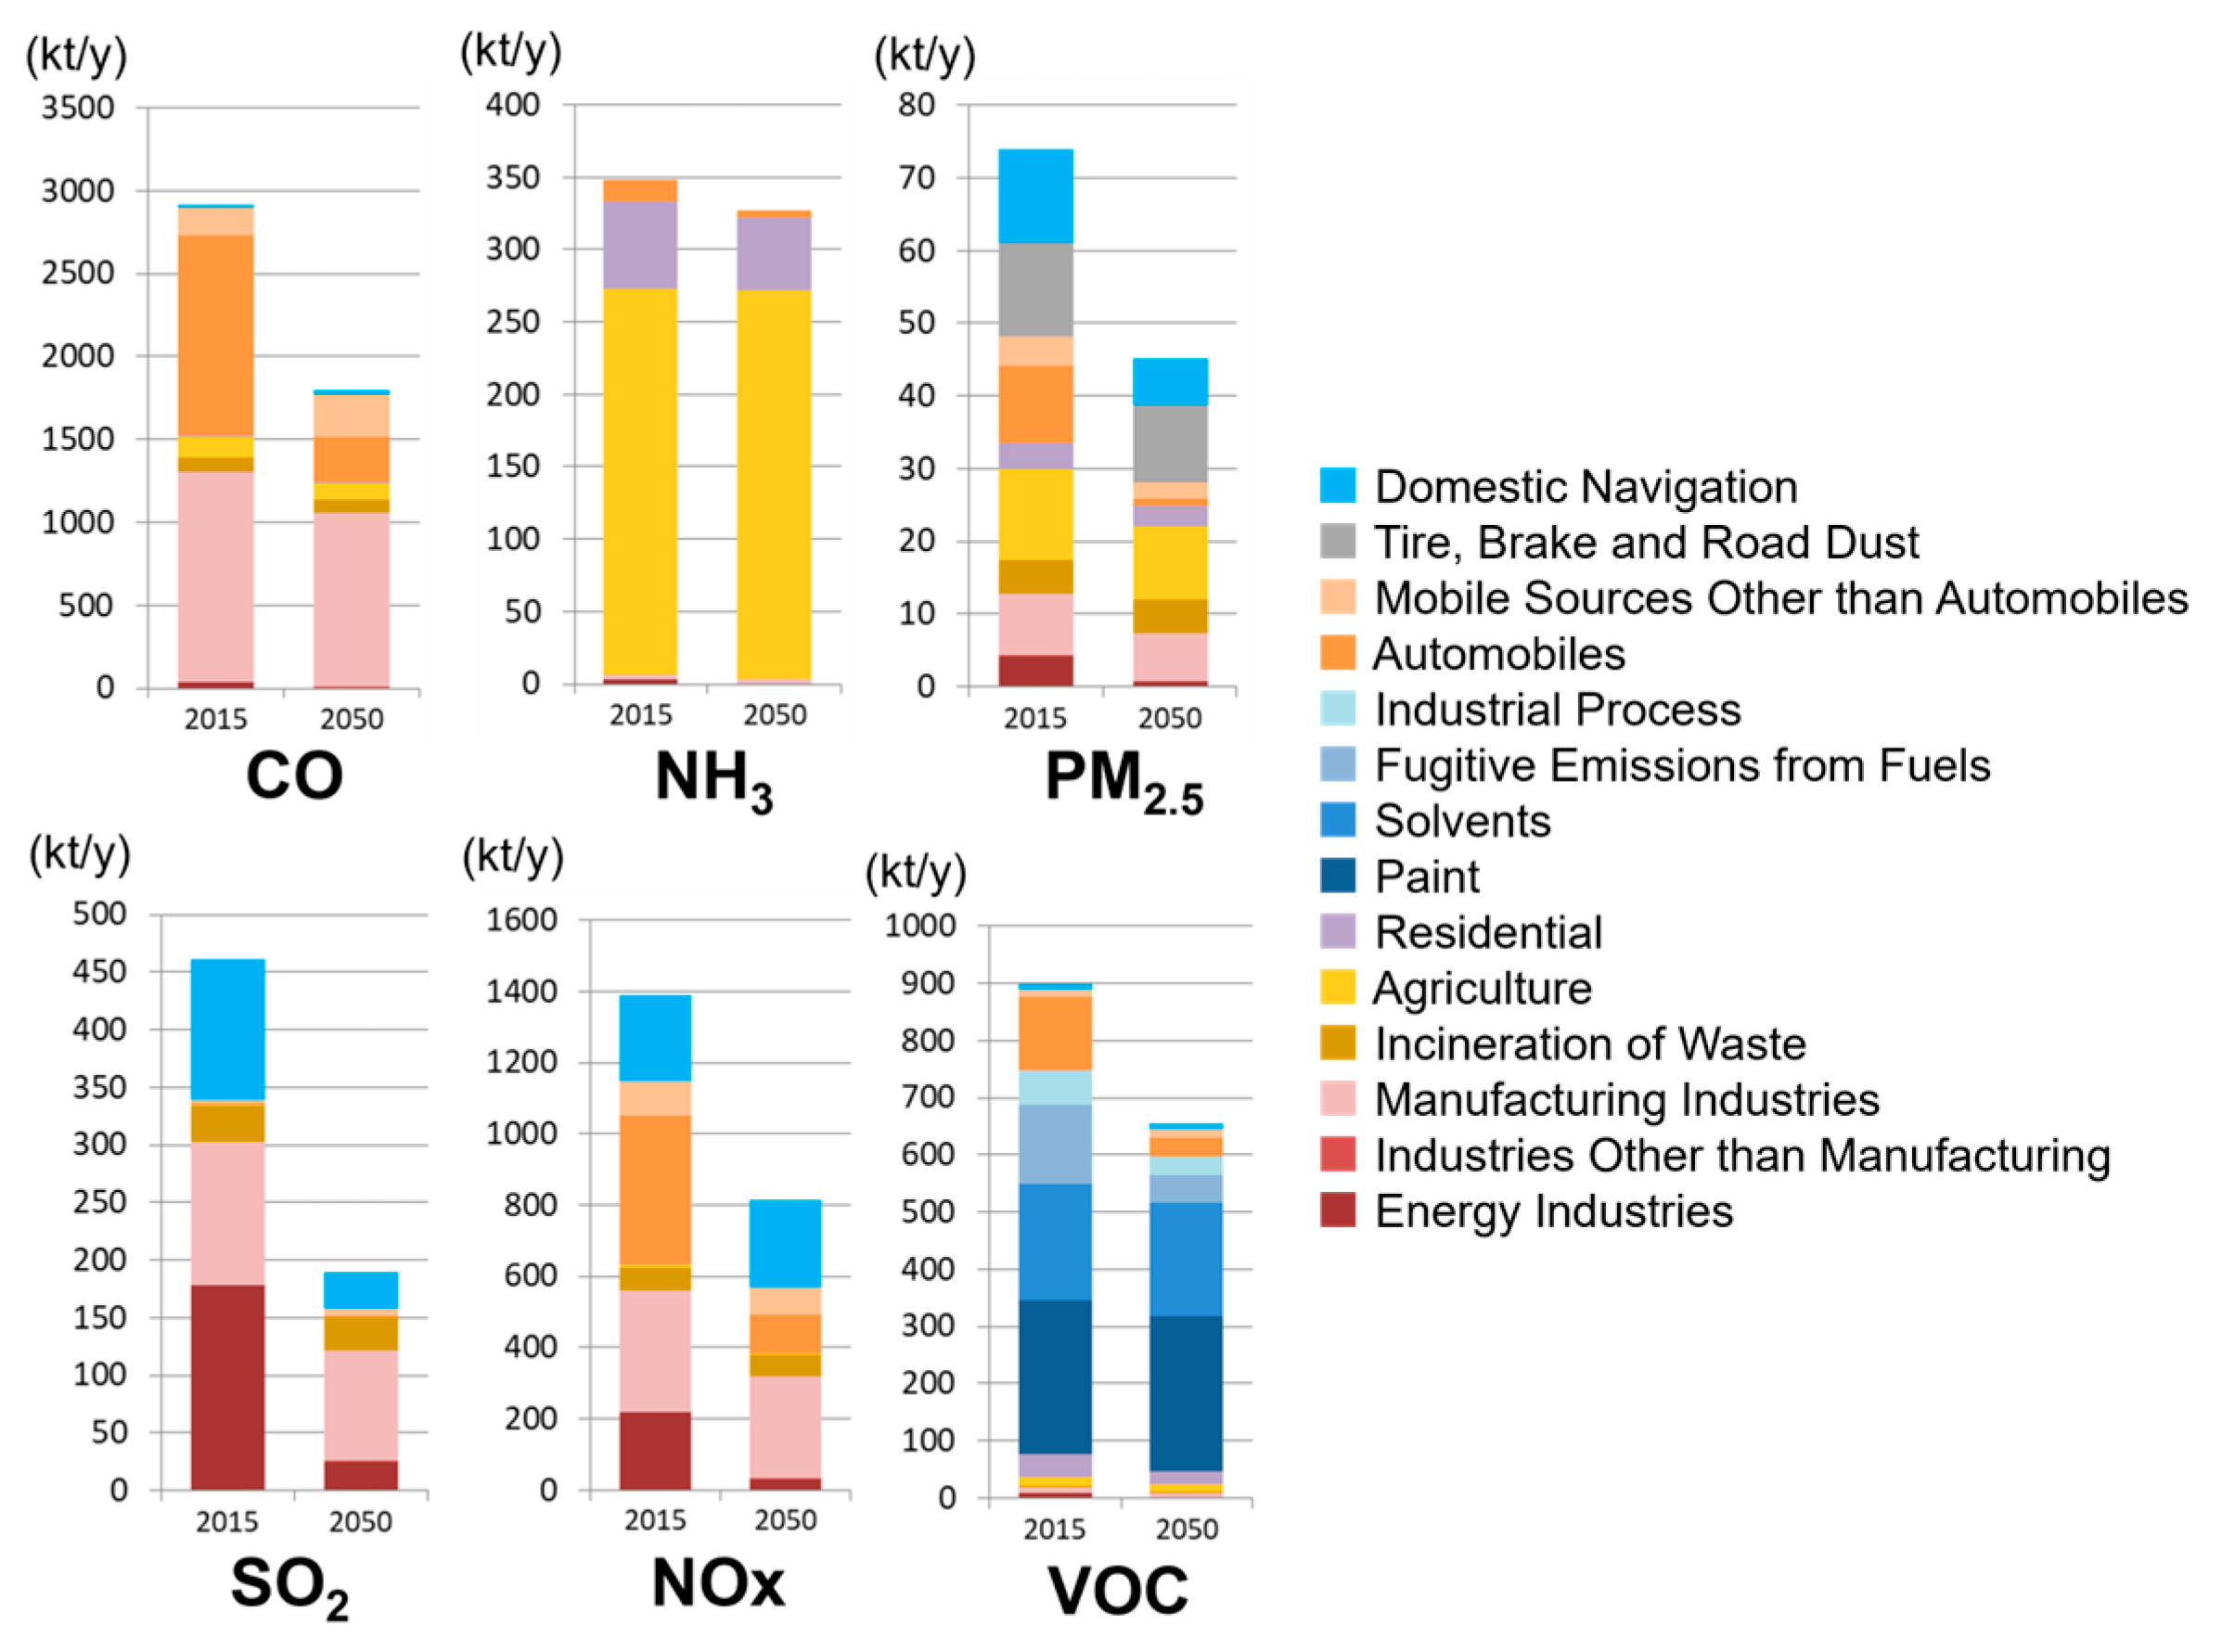
Emission data for 2050 in Japan were estimated based on Morikawa et al. (2021) [18]. It is assumed that atmospheric pollutant emissions from combustion sources (NOx, VOC, CO, NH3, PM2.5 and SO2) decrease in proportion to the CO2 reduction ratio from 2015 to 2050. Note that factors other than CO2 reduction rate, such as changes in type of fuel or exhaust gas treatment technologies, were not considered. CO2 reduction rate was estimated based on the Japanese government’s target, announced in 2018, of 80% reduction in greenhouse gas emissions. For stationary anthropogenic sources, emissions were estimated by applying changes in power generation and industrial activities and considering variations in electricity generation and fuel composition on those emissions in 2015. Vehicle emissions were estimated using JEI-VEM, considering the progress of vehicle electrification and the reduction in vehicle ownership. For anthropogenic emissions from areas other than Japan, the ECLIPSE V5a max technical feasible reduction scenario (MTFR) [31] was used. Emissions of biogenic VOC, open biomass burning, and volcanoes were assumed to remain unchanged from 2015. Figure 2 shows the anthropogenic emissions of atmospheric pollutants from Japan in 2015 and 2050.

2.3. Sensitivity Analysis

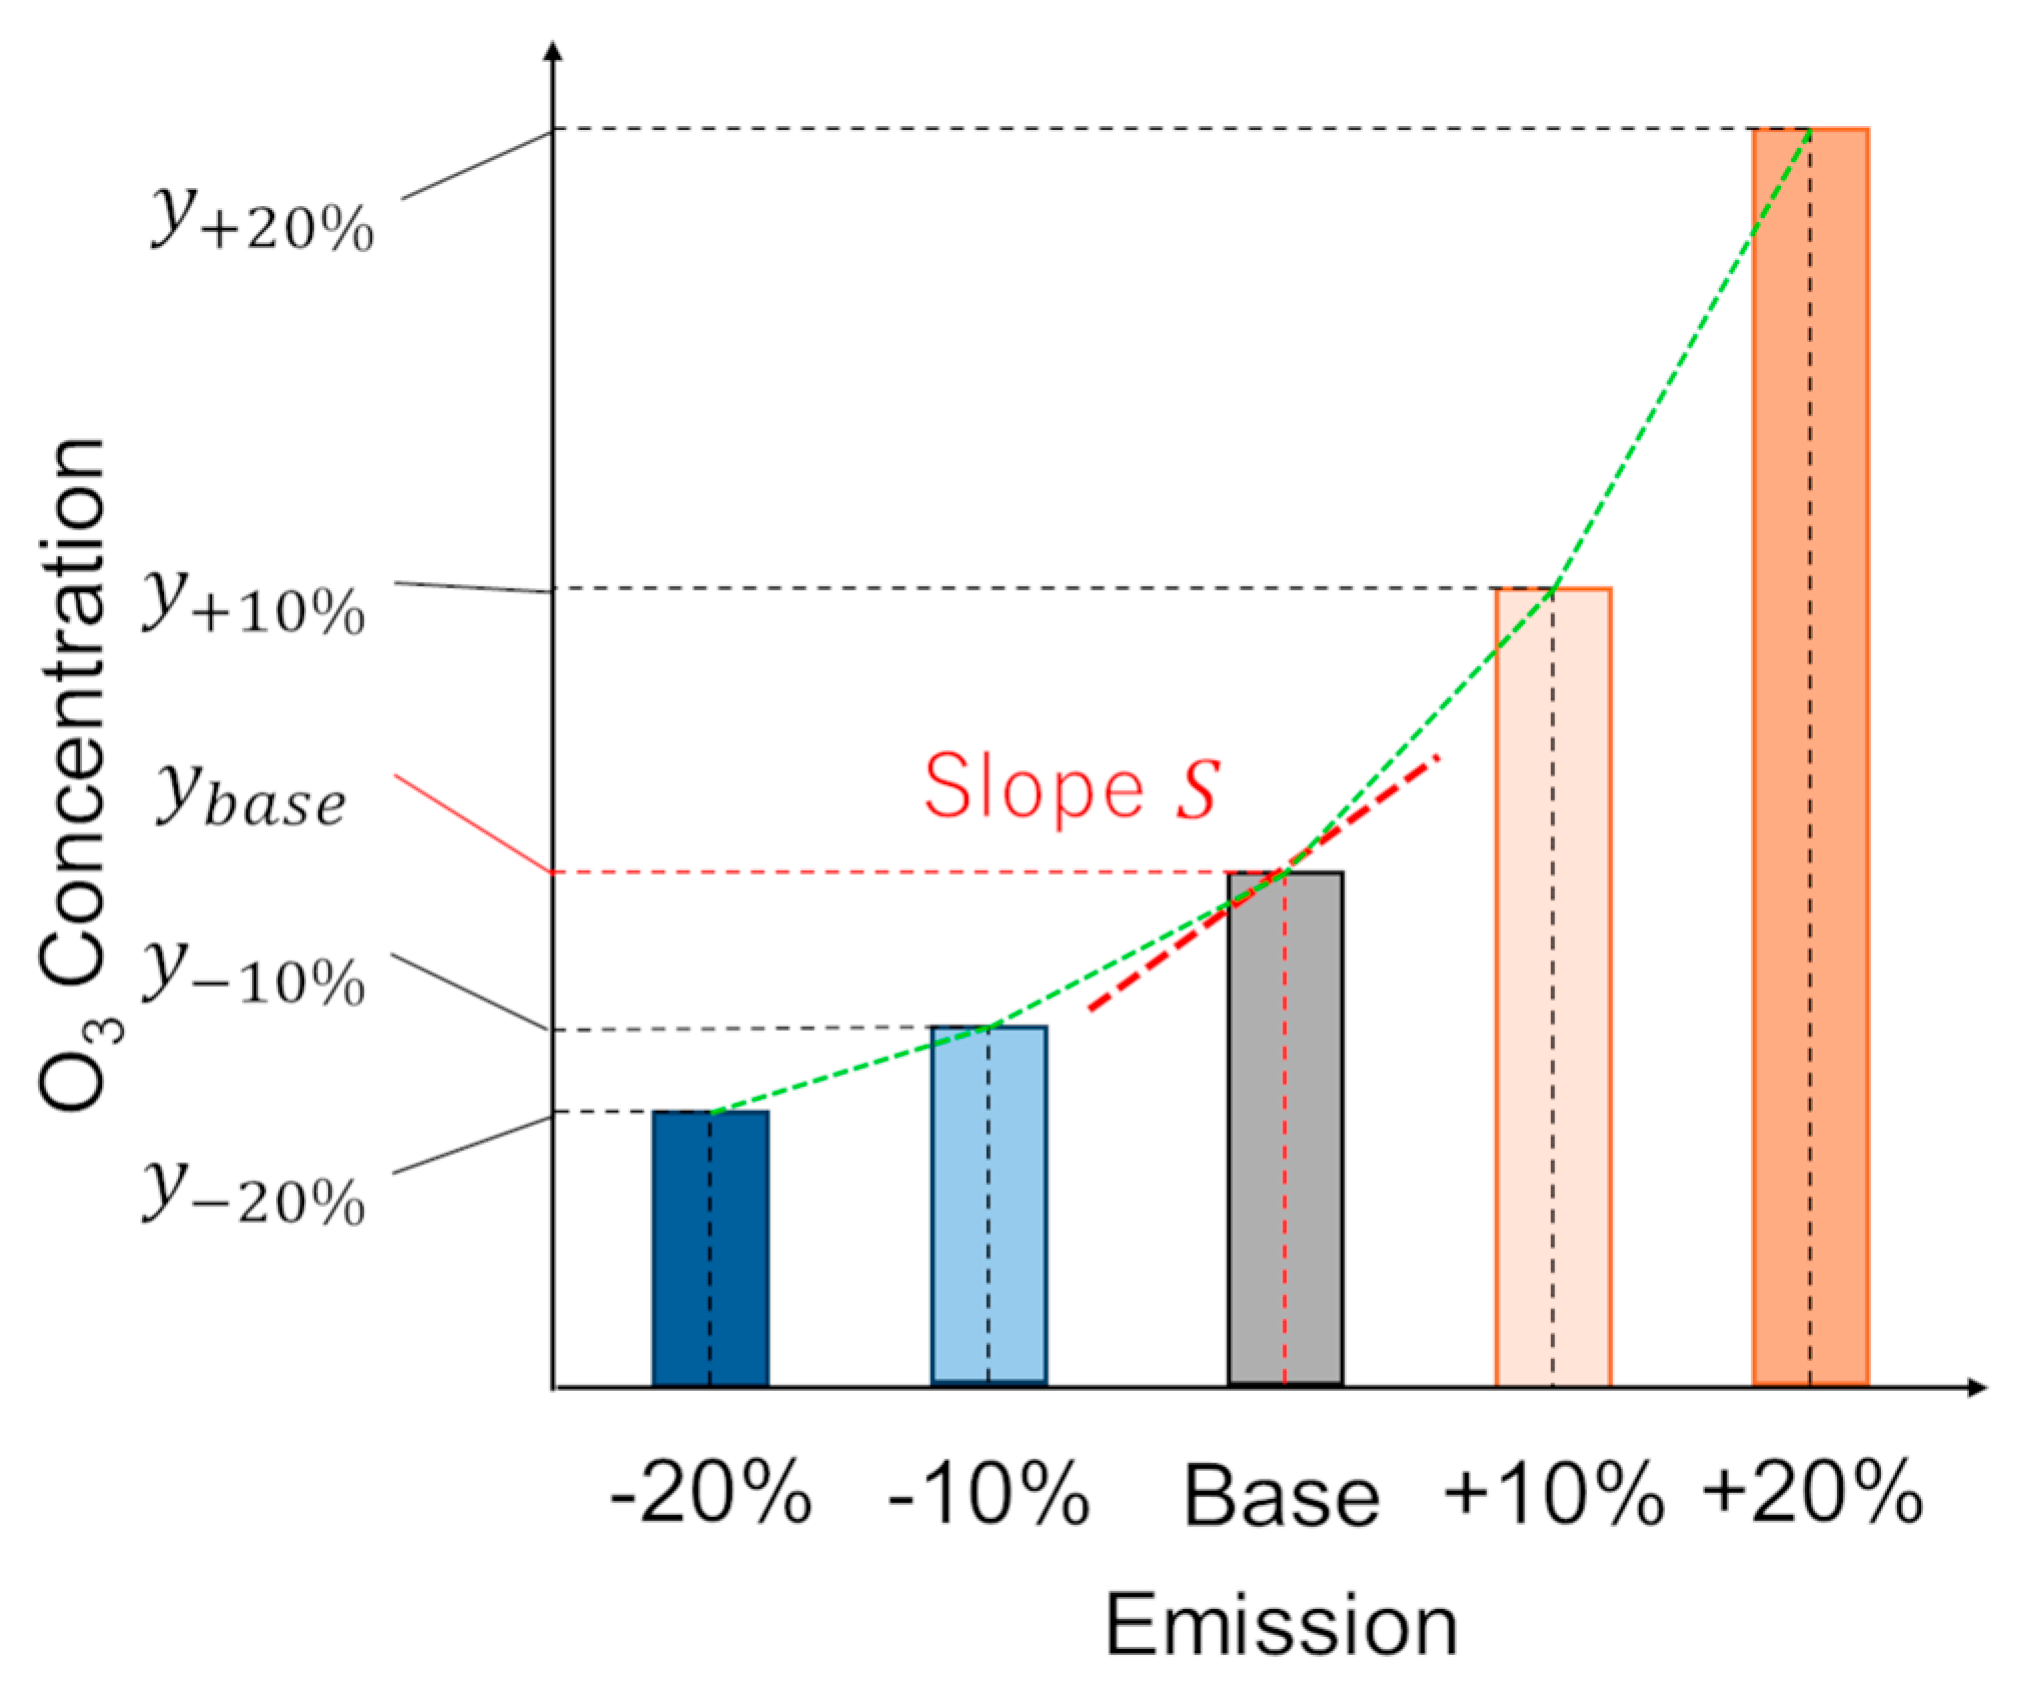
The sensitivity coefficients of O3 concentration to NOx and VOC emissions were calculated for both 2015 and 2050. Figure 3 illustrates the concept of the sensitivity coefficient used in this study.
y b a s e [ppb] is the O3 concentration at a reference precursor emission level (Base). y + 10 % [ppb] is O3 concentration when the precursor emissions are increased by 10% from Base. Similarly, y 20 % [ppb], y 10 % [ppb] and y + 20 % [ppb] show the O3 concentrations when the precursor emissions are changed by −20%, −10%, and +20% relative to Base, respectively. In this case, the sensitivity coefficient S is defined as the slope of O3 concentration with respect to the precursor emissions at Base. The sensitivity coefficient S is determined using the second-order central difference method when the change in emissions is Δ x [kt/y], expressed as follows:
S = y 20 % + 8 y 10 % 8 y + 10 % + y + 20 % 12 Δ x p p b / ( k t / y )
Then, Δ x [kt/y] is expressed as follows:
Δ x = ( 1 / 10 ) E k t / y
where E [kt/y] represents the annual emissions. Therefore, Equation (1) can be rewritten as follows:
S = 5 6 y 20 % + 8 y 10 % 8 y + 10 % + y + 20 % E p p b / k t / y
The sensitivity coefficient S represents the change in O3 concentration [ppb] per unit change in annual precursor emissions [kt/y]. A positive sensitivity coefficient S indicates that a reduction in precursor emissions leads to a decrease in O3 concentration. Conversely, a negative sensitivity coefficient S indicates that a reduction in precursor emissions results in an increase in O3 concentration.
To calculate the sensitivity coefficients, additional scenarios were simulated, in which anthropogenic NOx or VOC emissions in Japan were individually varied by ±10% and ±20% for 2015 and 2050, respectively, in addition to the estimated emission scenarios for these years. Table 1 summarizes the emission scenarios considered in this study. Based on these simulation results, the sensitivity coefficients of O3 concentration with respect to NOx and VOC emissions were determined for both 2015 and 2050.
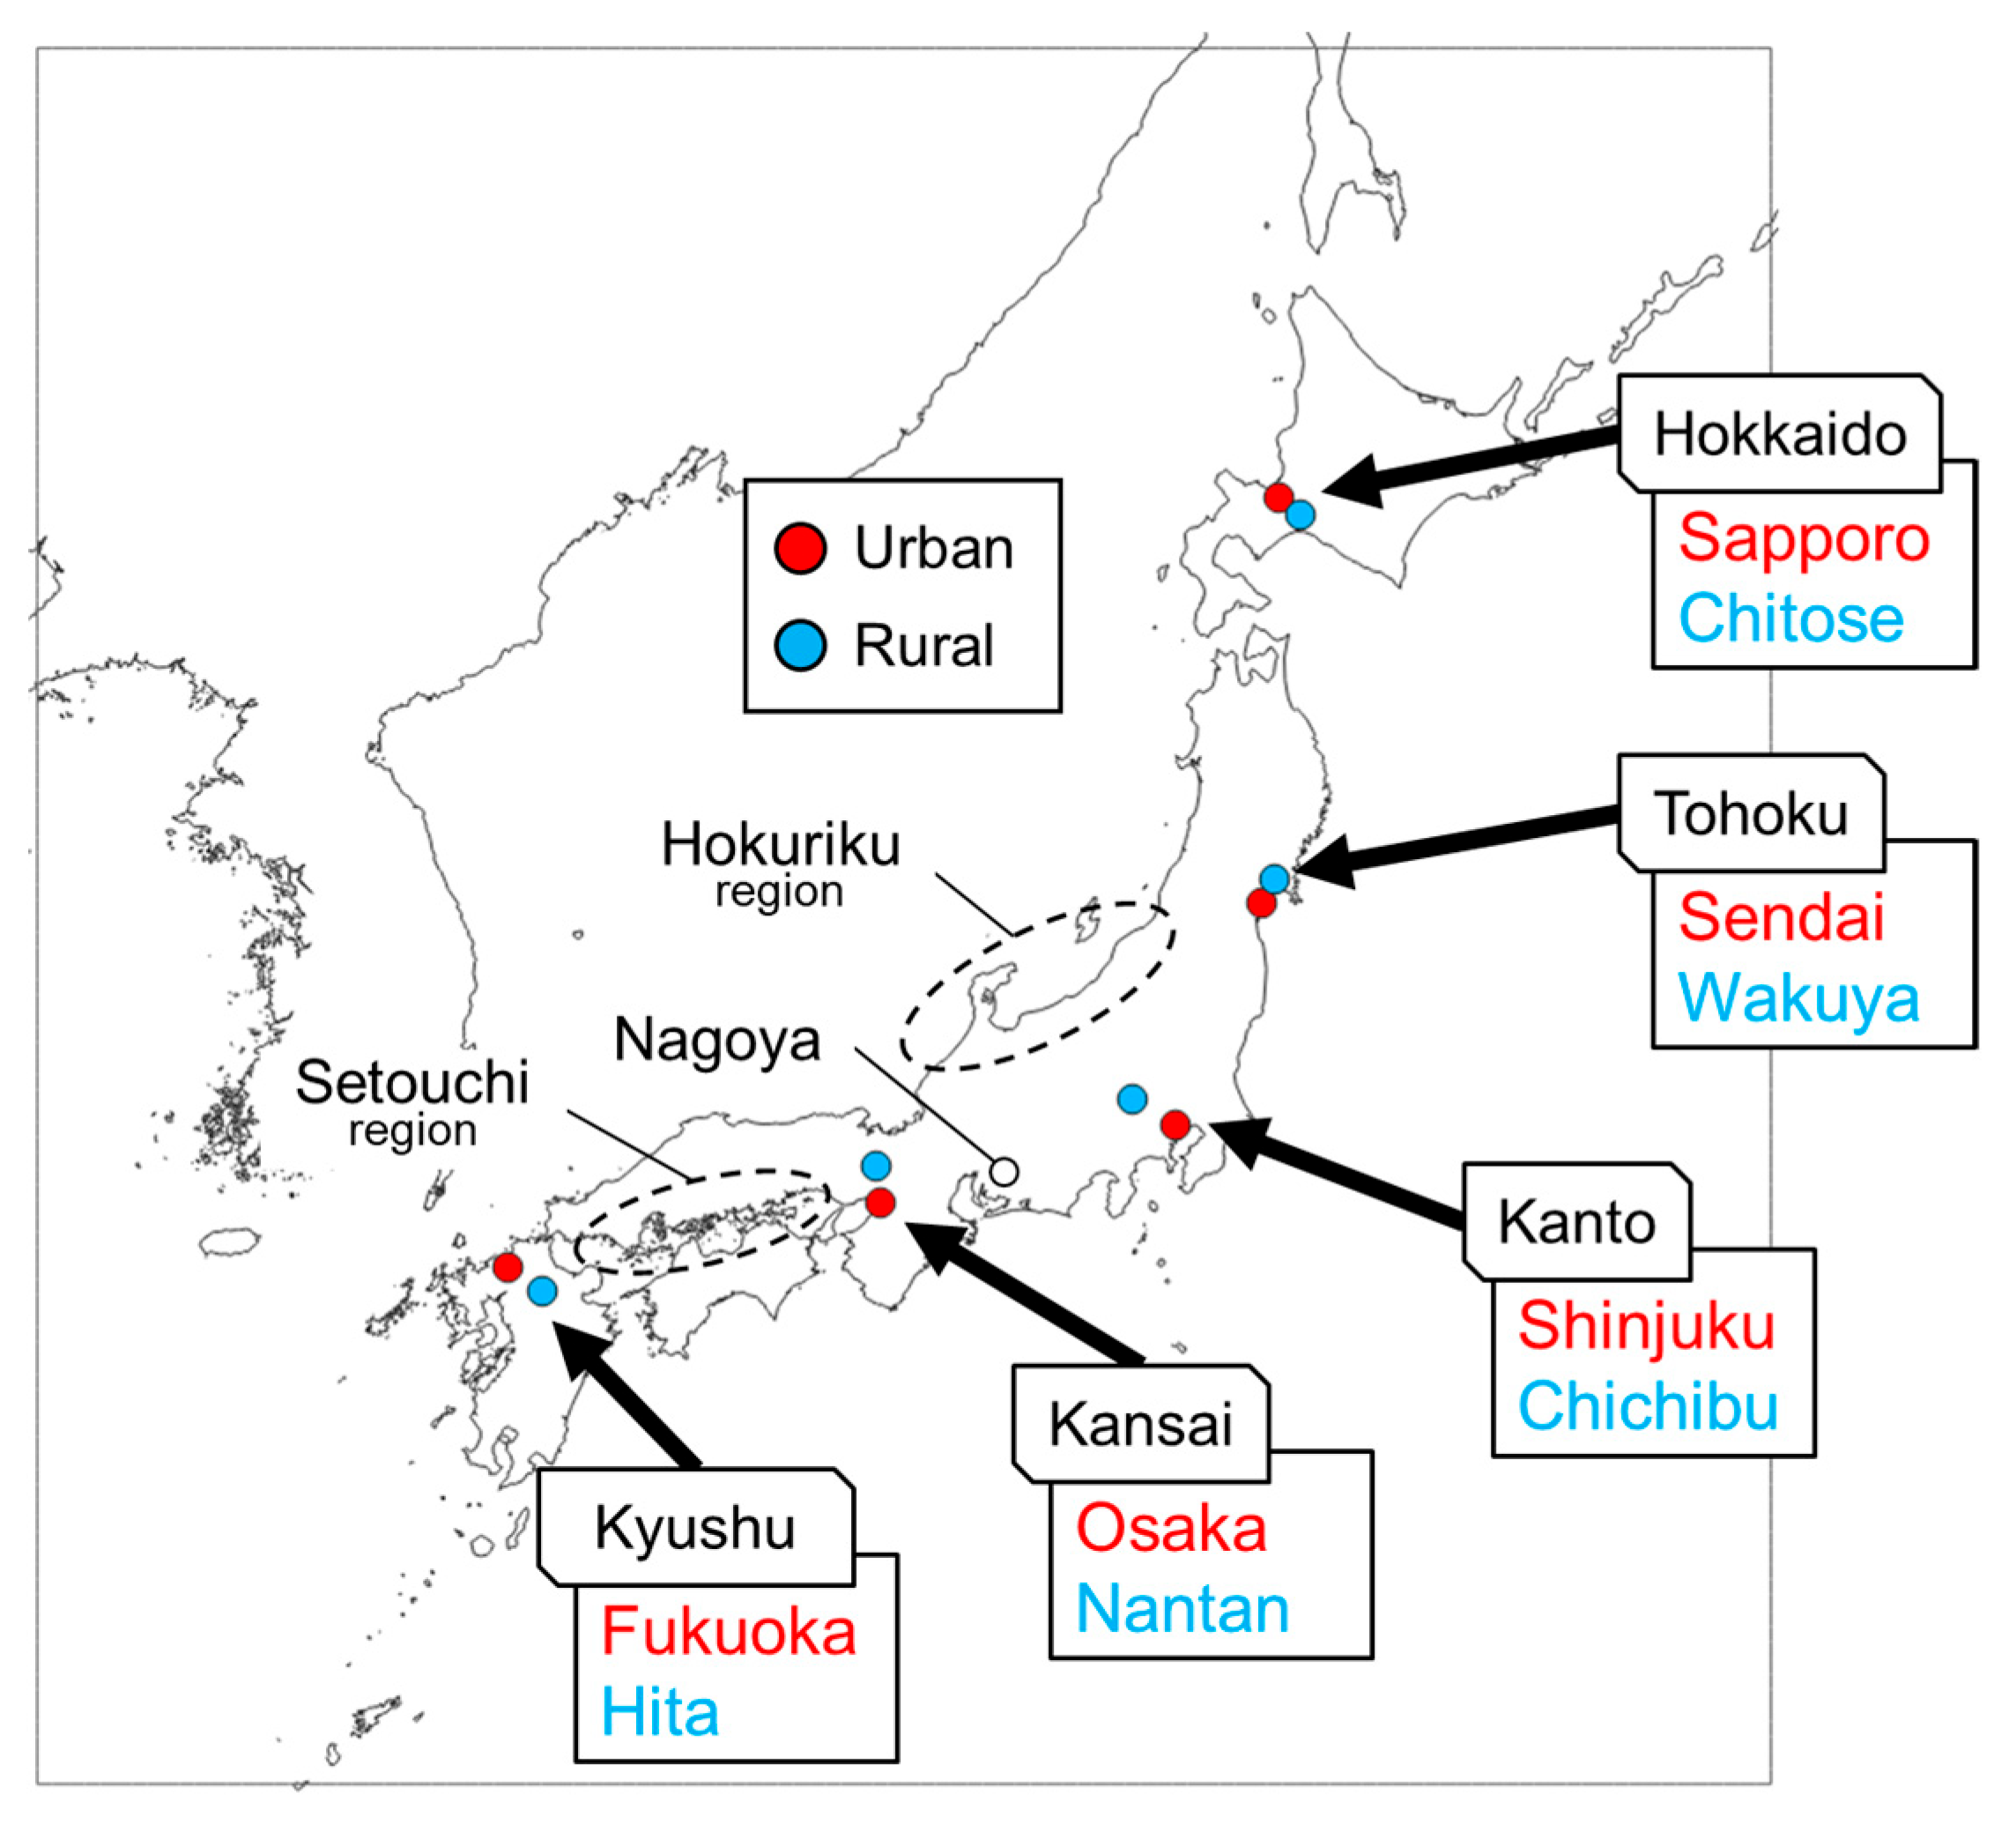
Sensitivity analysis was conducted for several representative locations across Japan. Figure 4 shows the locations at which sensitivity analysis was performed. First, five regions with different climates across the Japanese archipelago (Hokkaido, Tohoku, Kanto, Kansai, and Kyushu) were selected. Then, both an urban and a rural site were chosen within each region. In this study, the classification of “urban” or “rural” was determined based on population density data from the 2015 POPULATION AND HOUSEHOLDS OF JAPAN [35]. Cities with a population density lower than that of Shizuoka City—the least densely populated among the cities with populations of over 500,000, which are considered important in local governance in Japan (499.3 persons/km2)—were defined as “rural”, while those with a population density highest in each region, mostly higher than that of the least densely populated ward in the Tokyo 23 wards (5009.1 persons/km2) were defined as “urban.” This distinction is important because O3 formation processes are expected to differ between urban centers where anthropogenic emissions are concentrated, and rural areas where such emissions are relatively low. By comparing these two types of sites, differences in sensitivity between areas strongly affected by local emissions and those influenced by transported pollutants can be clearly identified.

3. Results and Discussions

3.1. Model Performance Evaluation

To evaluate the model performance, the calculated results of the 2015 Base case were compared with the observed O3 concentrations in 2015 [36] at each site used for the sensitivity analysis. The Mean Bias Error (MBE), Root Mean Square Error (RMSE), and refined index of agreement (IoA) were calculated. IoA ranges from −1 to 1, where a value of 1 represents perfect agreement between a model and observations, and a value of −1 represents complete disagreement [37]. Since this study focuses on the daily maximum 8 h average (MDA8), these statistical indicators were evaluated for MDA8. Table 2 shows the average, maximum, and minimum values of MBE, RMSE, and IoA for the 2015 simulation at each location in the model configuration used in this study. For more detailed seasonal values of MBE, RMSE, and IoA at each location, please refer to Tables S1–S4. The temporal variations in MDA8 O3 at each site are shown in Figures S1–S10.
The MBE results show that at most sites, the model overestimates O3 concentrations compared to observations across all seasons, with a maximum overestimation of 18.1 ppb in terms of MBE. The RMSE was up to 19.5 ppb. The MBE, RMSE, and IoA results suggest that the model performs relatively well during spring and summer. However, the results also indicate that the model’s reproducibility is limited during autumn and winter. Although a detailed analysis of the sources of error was not conducted in this study, the seasons and locations with relatively lower reproducibility tended to correspond to periods and areas strongly affected by transboundary pollution. Therefore, it is likely that the overestimation of background O3 concentrations was one of the primary contributing factors. As the reproducibility of O3 concentrations in spring and summer, the seasons in which high O3 concentrations are concerned were mostly well enough, it was determined that conducting sensitivity analyses using the model settings that achieved such performance was appropriate.

3.2. Calculation Results of the Daily Maximum 8 h O3 Concentration in the Base Scenario

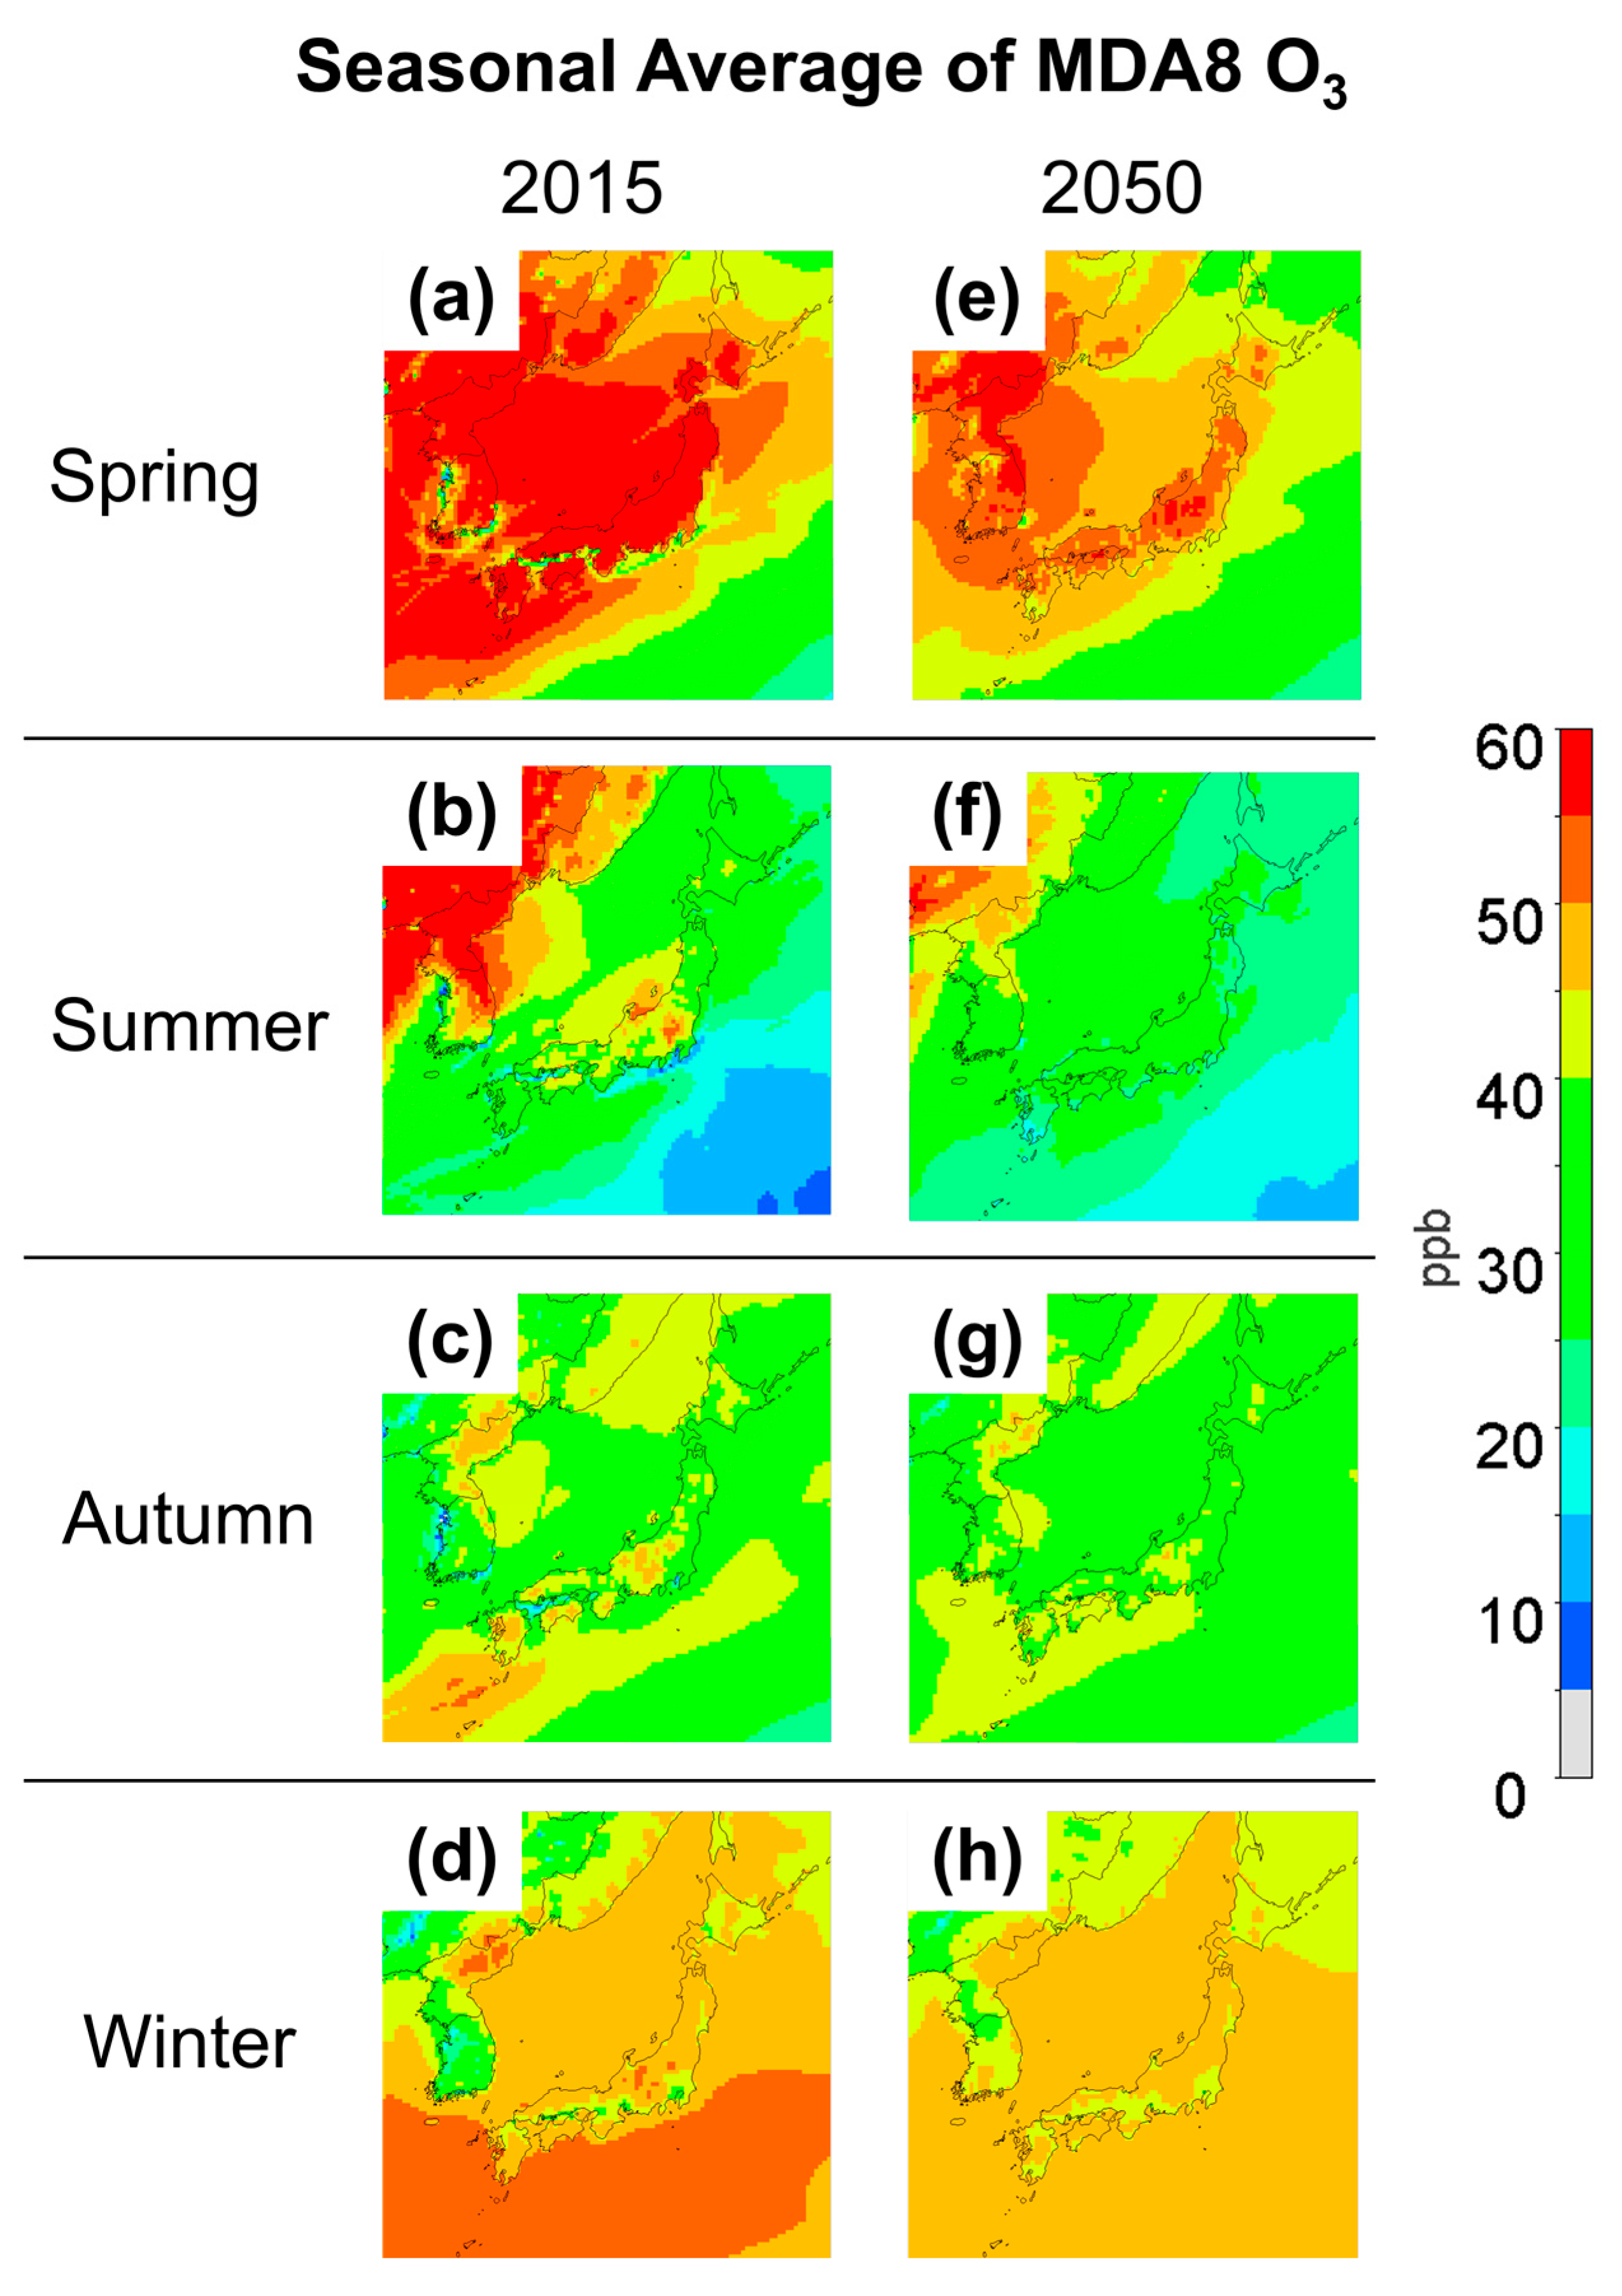
Figure 5 shows the seasonal average distribution of the daily maximum 8 h O3 concentration in the Base scenario for both 2015 and 2050. Notable differences in O3 concentrations between 2015 and 2050 were observed in spring and summer. According to Figure 5a,e, in spring, most areas of the Japanese archipelago exhibited high O3 concentrations of approximately 60 ppb in 2015. However, in 2050, concentrations decreased to 45–55 ppb, with a maximum reduction of approximately 25 ppb. Similarly, Figure 5b,f show that in summer, high O3 concentrations of up to 55 ppb were observed in northern Kanto region and eastern Hokuriku region in 2015, with approximately 40 ppb in other parts of Honshu, the main island of Japan. In 2050, concentrations had decreased across Japan, ranging from 20 to 35 ppb. In contrast, O3 concentrations in autumn and winter did not exhibit a significant reduction as in spring and summer, and in some cases, an increase was observed. Figure 5c,g indicate that in autumn, O3 concentrations in 2015 ranged from 30 to 50 ppb, while in 2050, they were within 30–45 ppb, with a maximum reduction of approximately 5 ppb. According to Figure 5d,h, in winter, O3 concentrations ranged from 35 to 55 ppb in 2015 but shifted to 40–50 ppb in 2050. The maximum reduction was limited to approximately 5 ppb, and in major urban areas, such as Sapporo, Shinjuku, Nagoya, Osaka, and Fukuoka, as well as in the Setouchi region, an increase of approximately 5 ppb was observed.

3.3. Results of Sensitivity Analysis

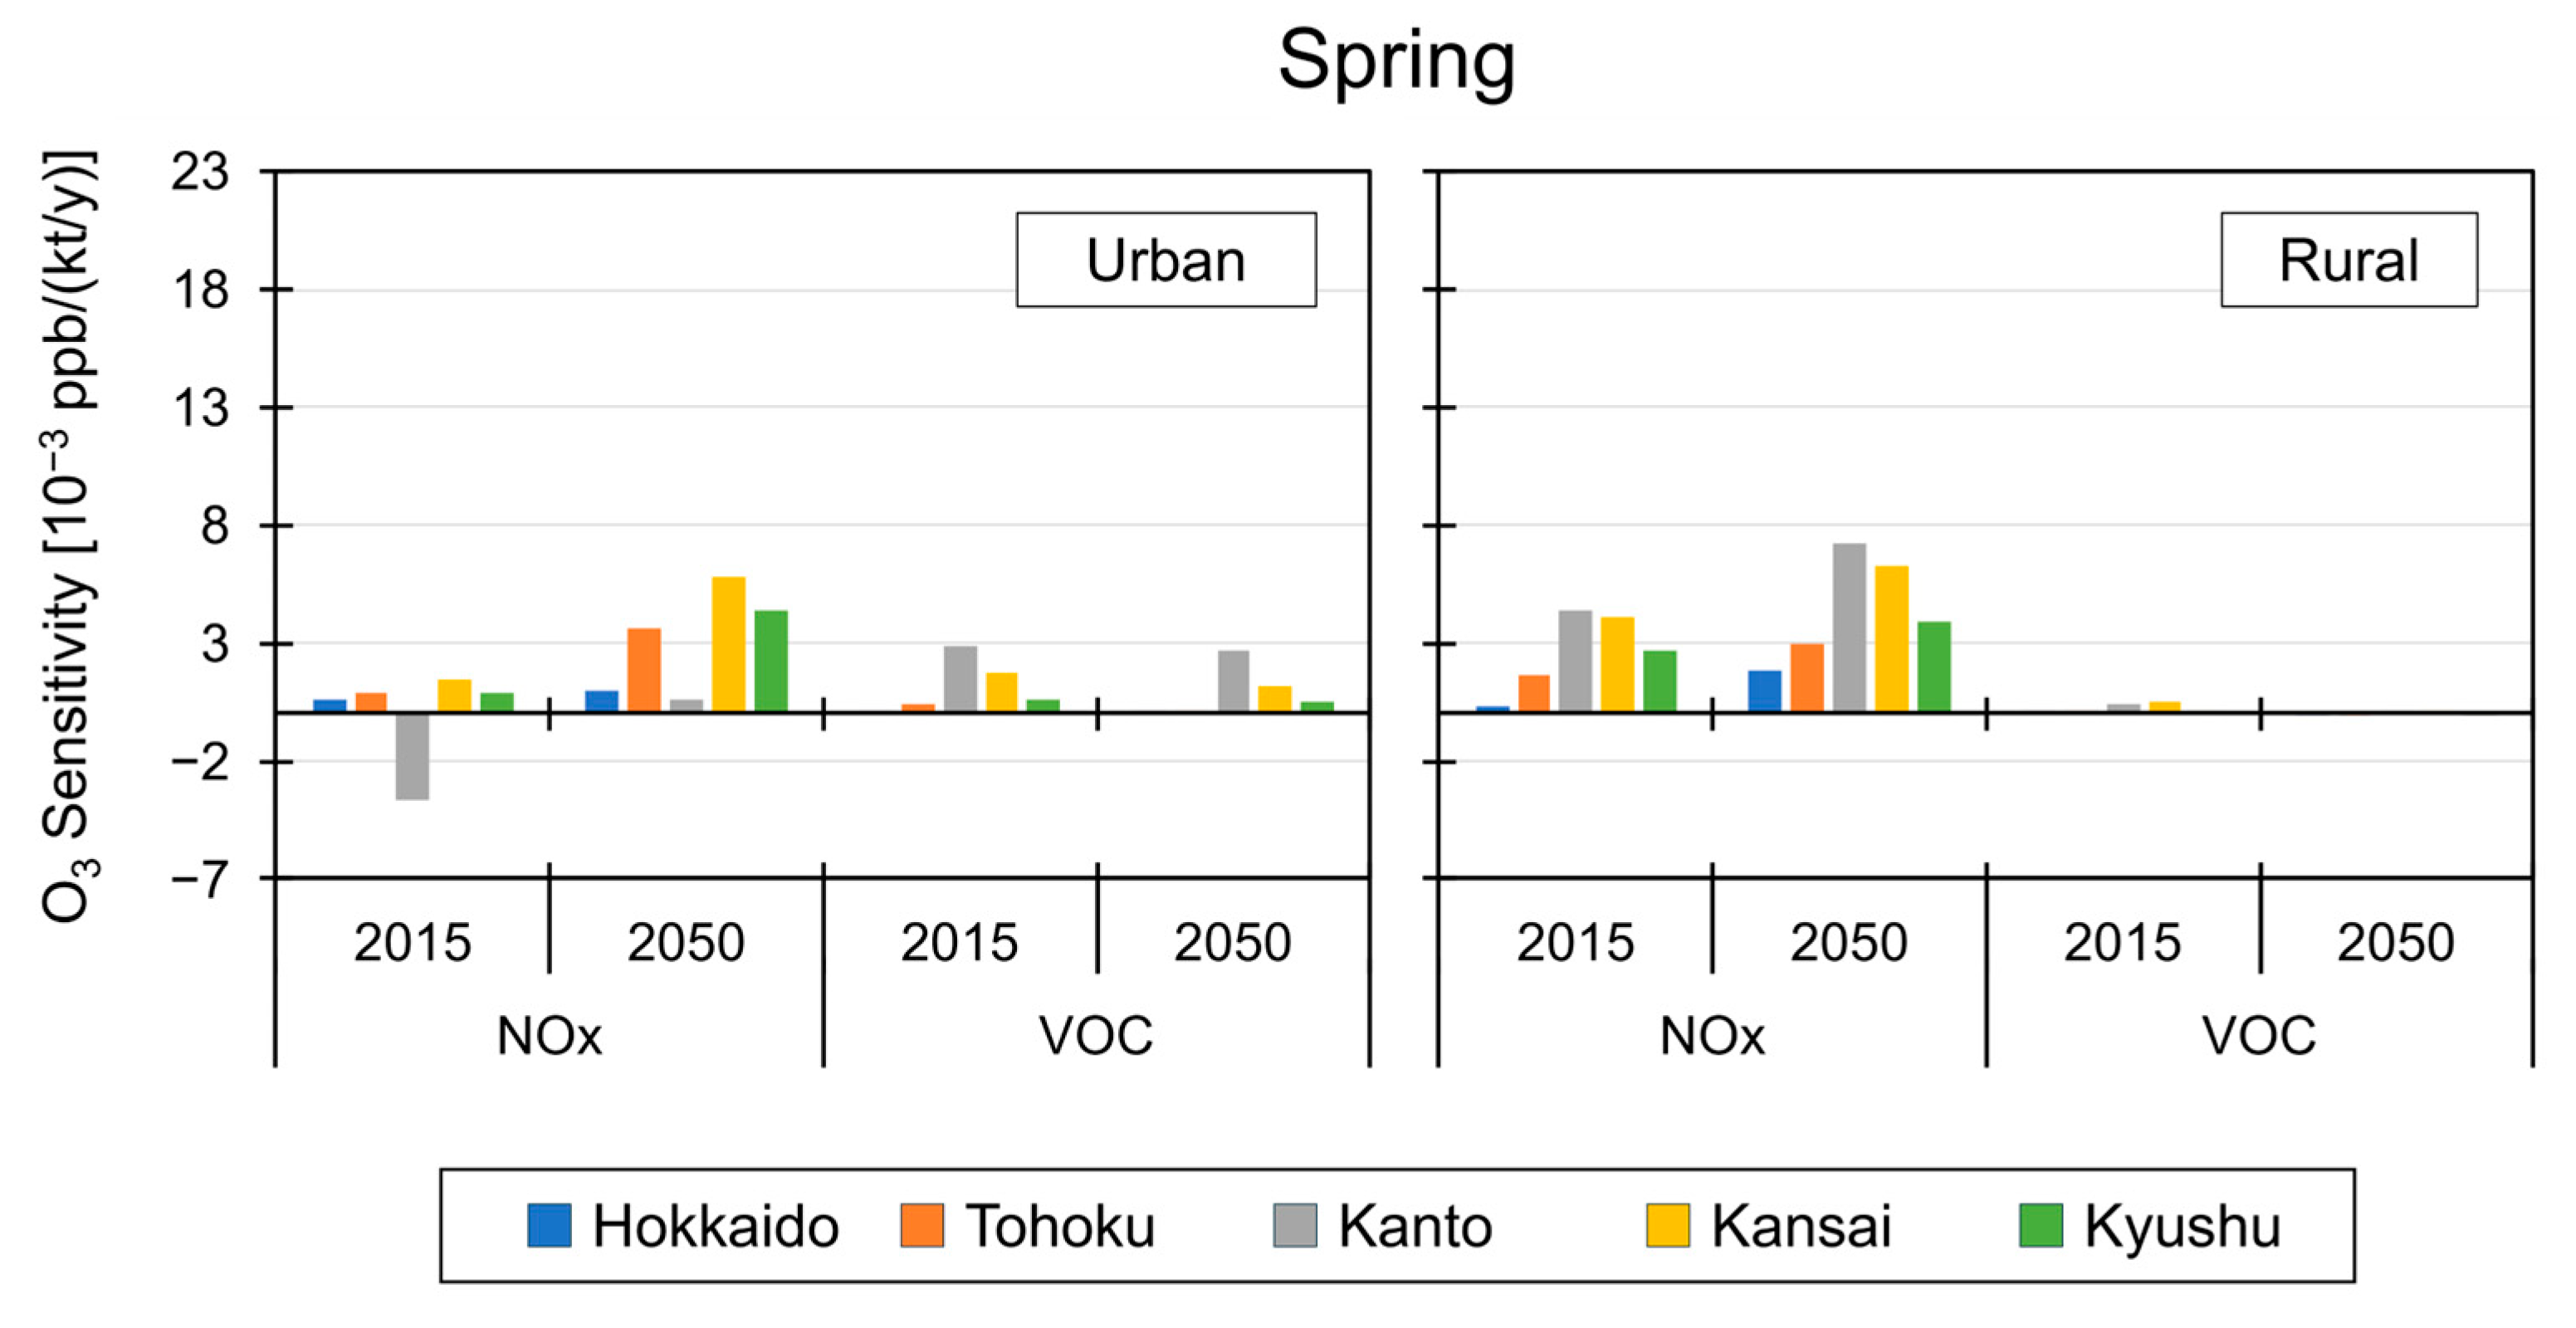
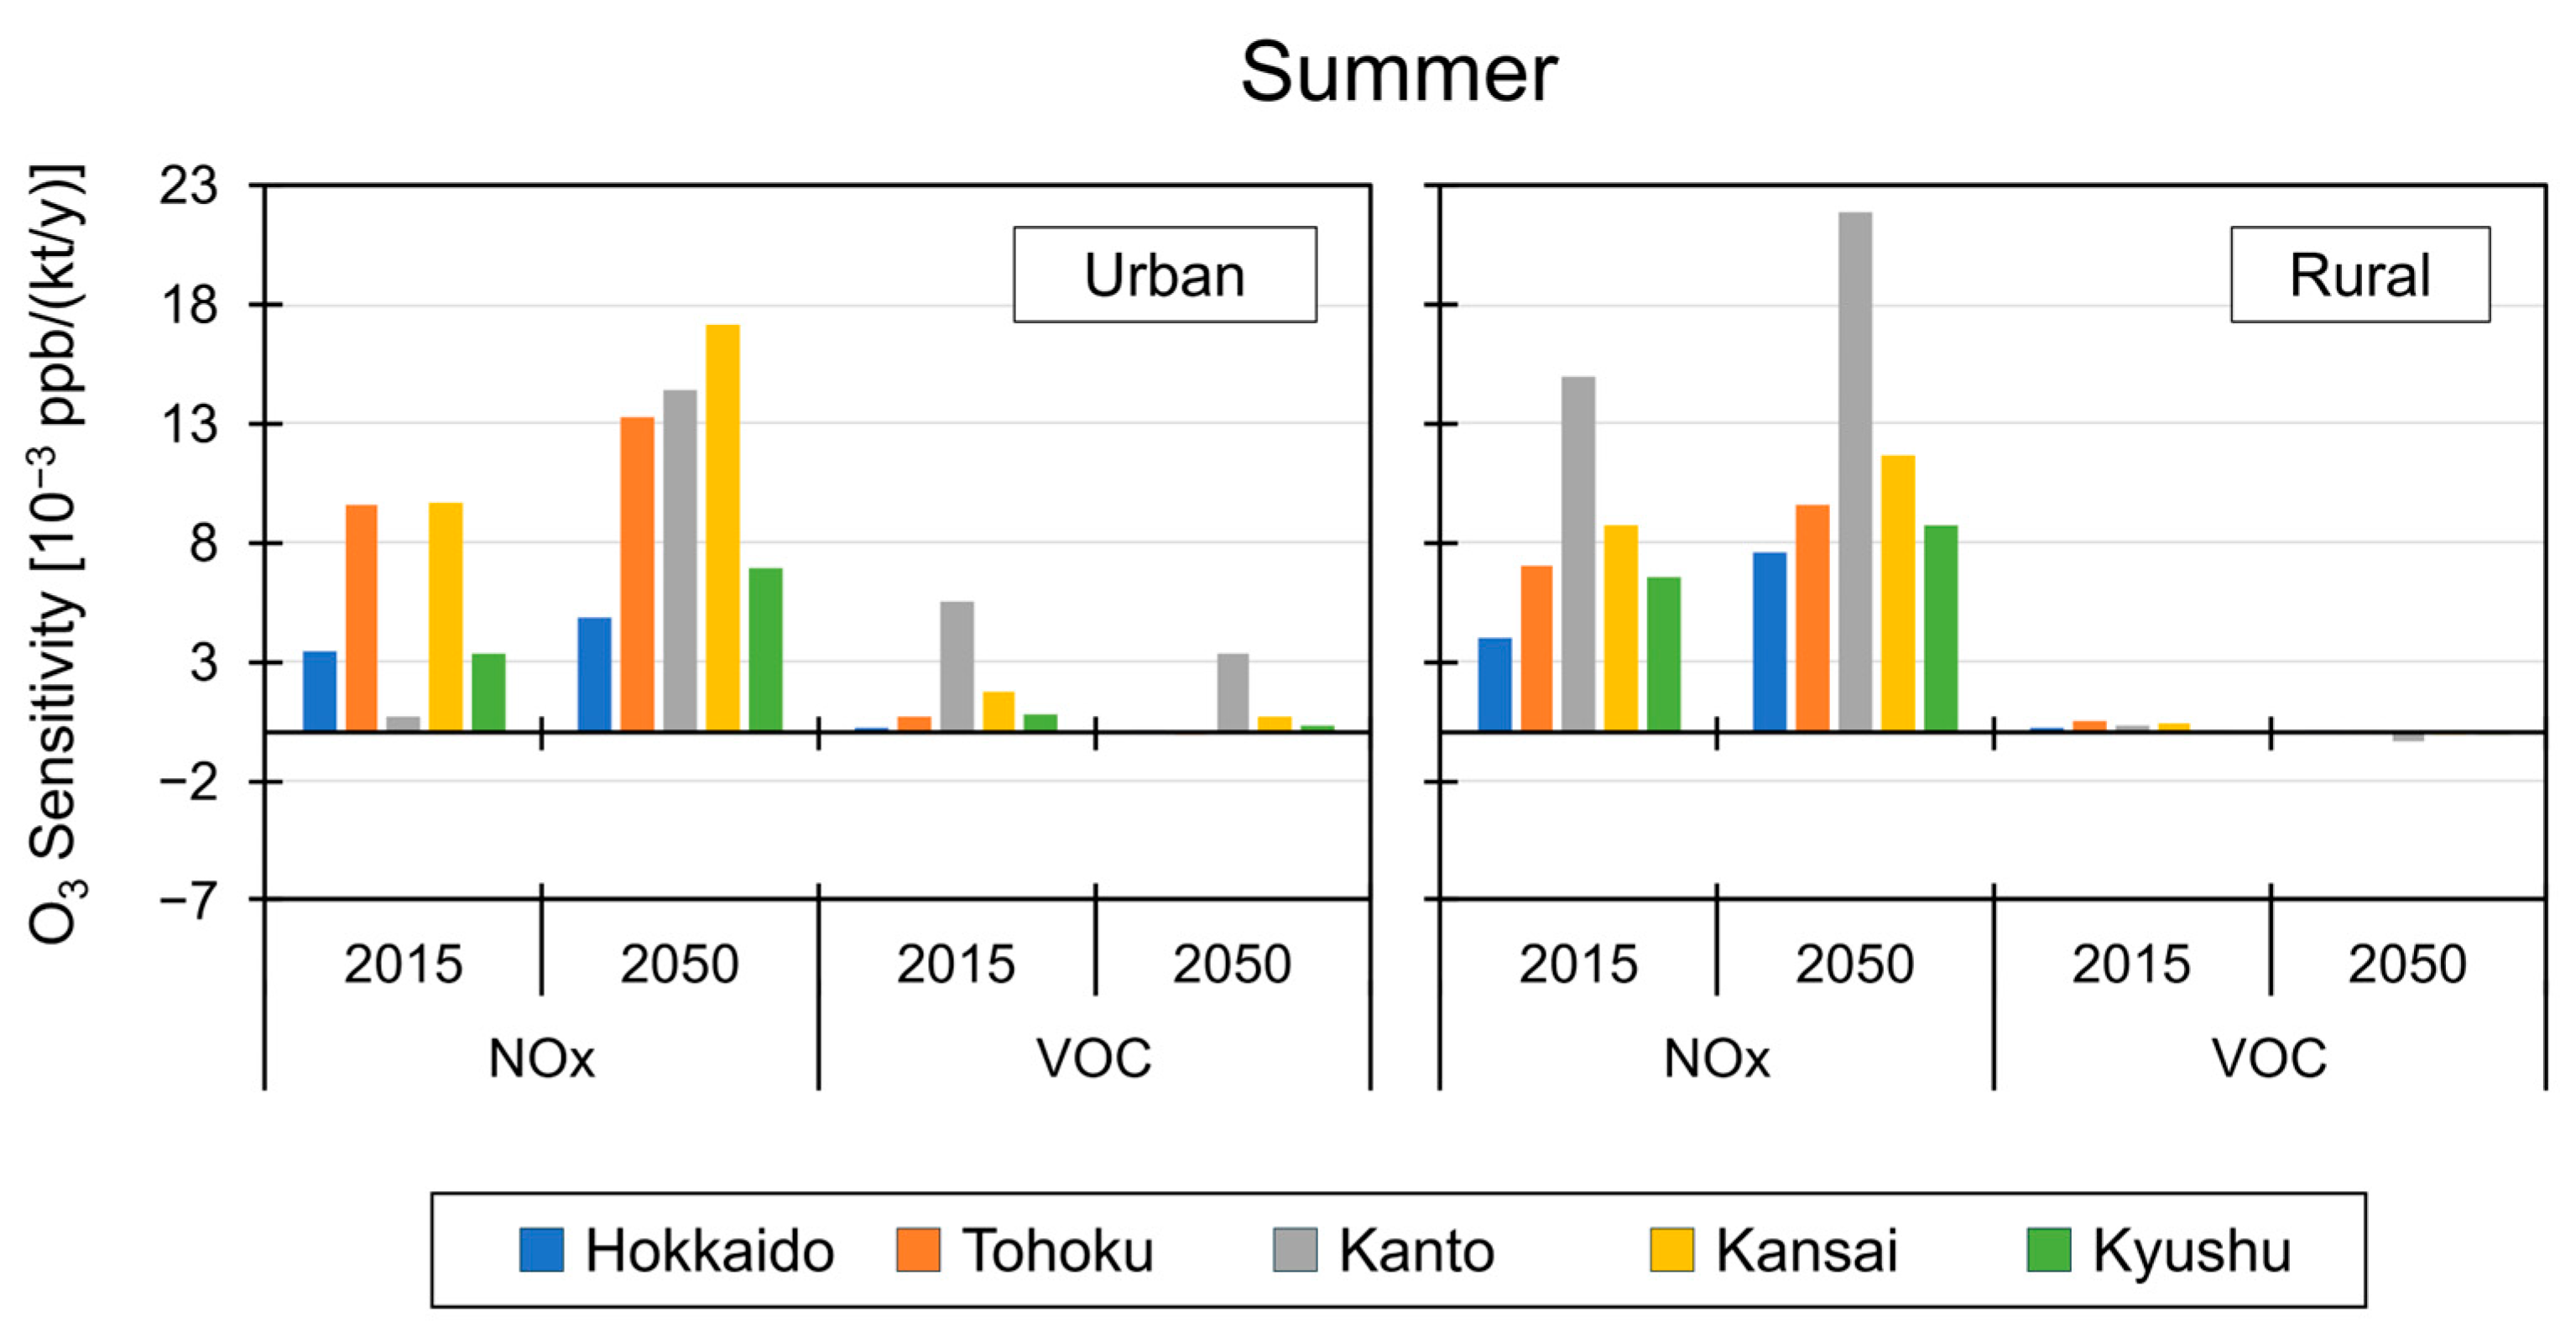
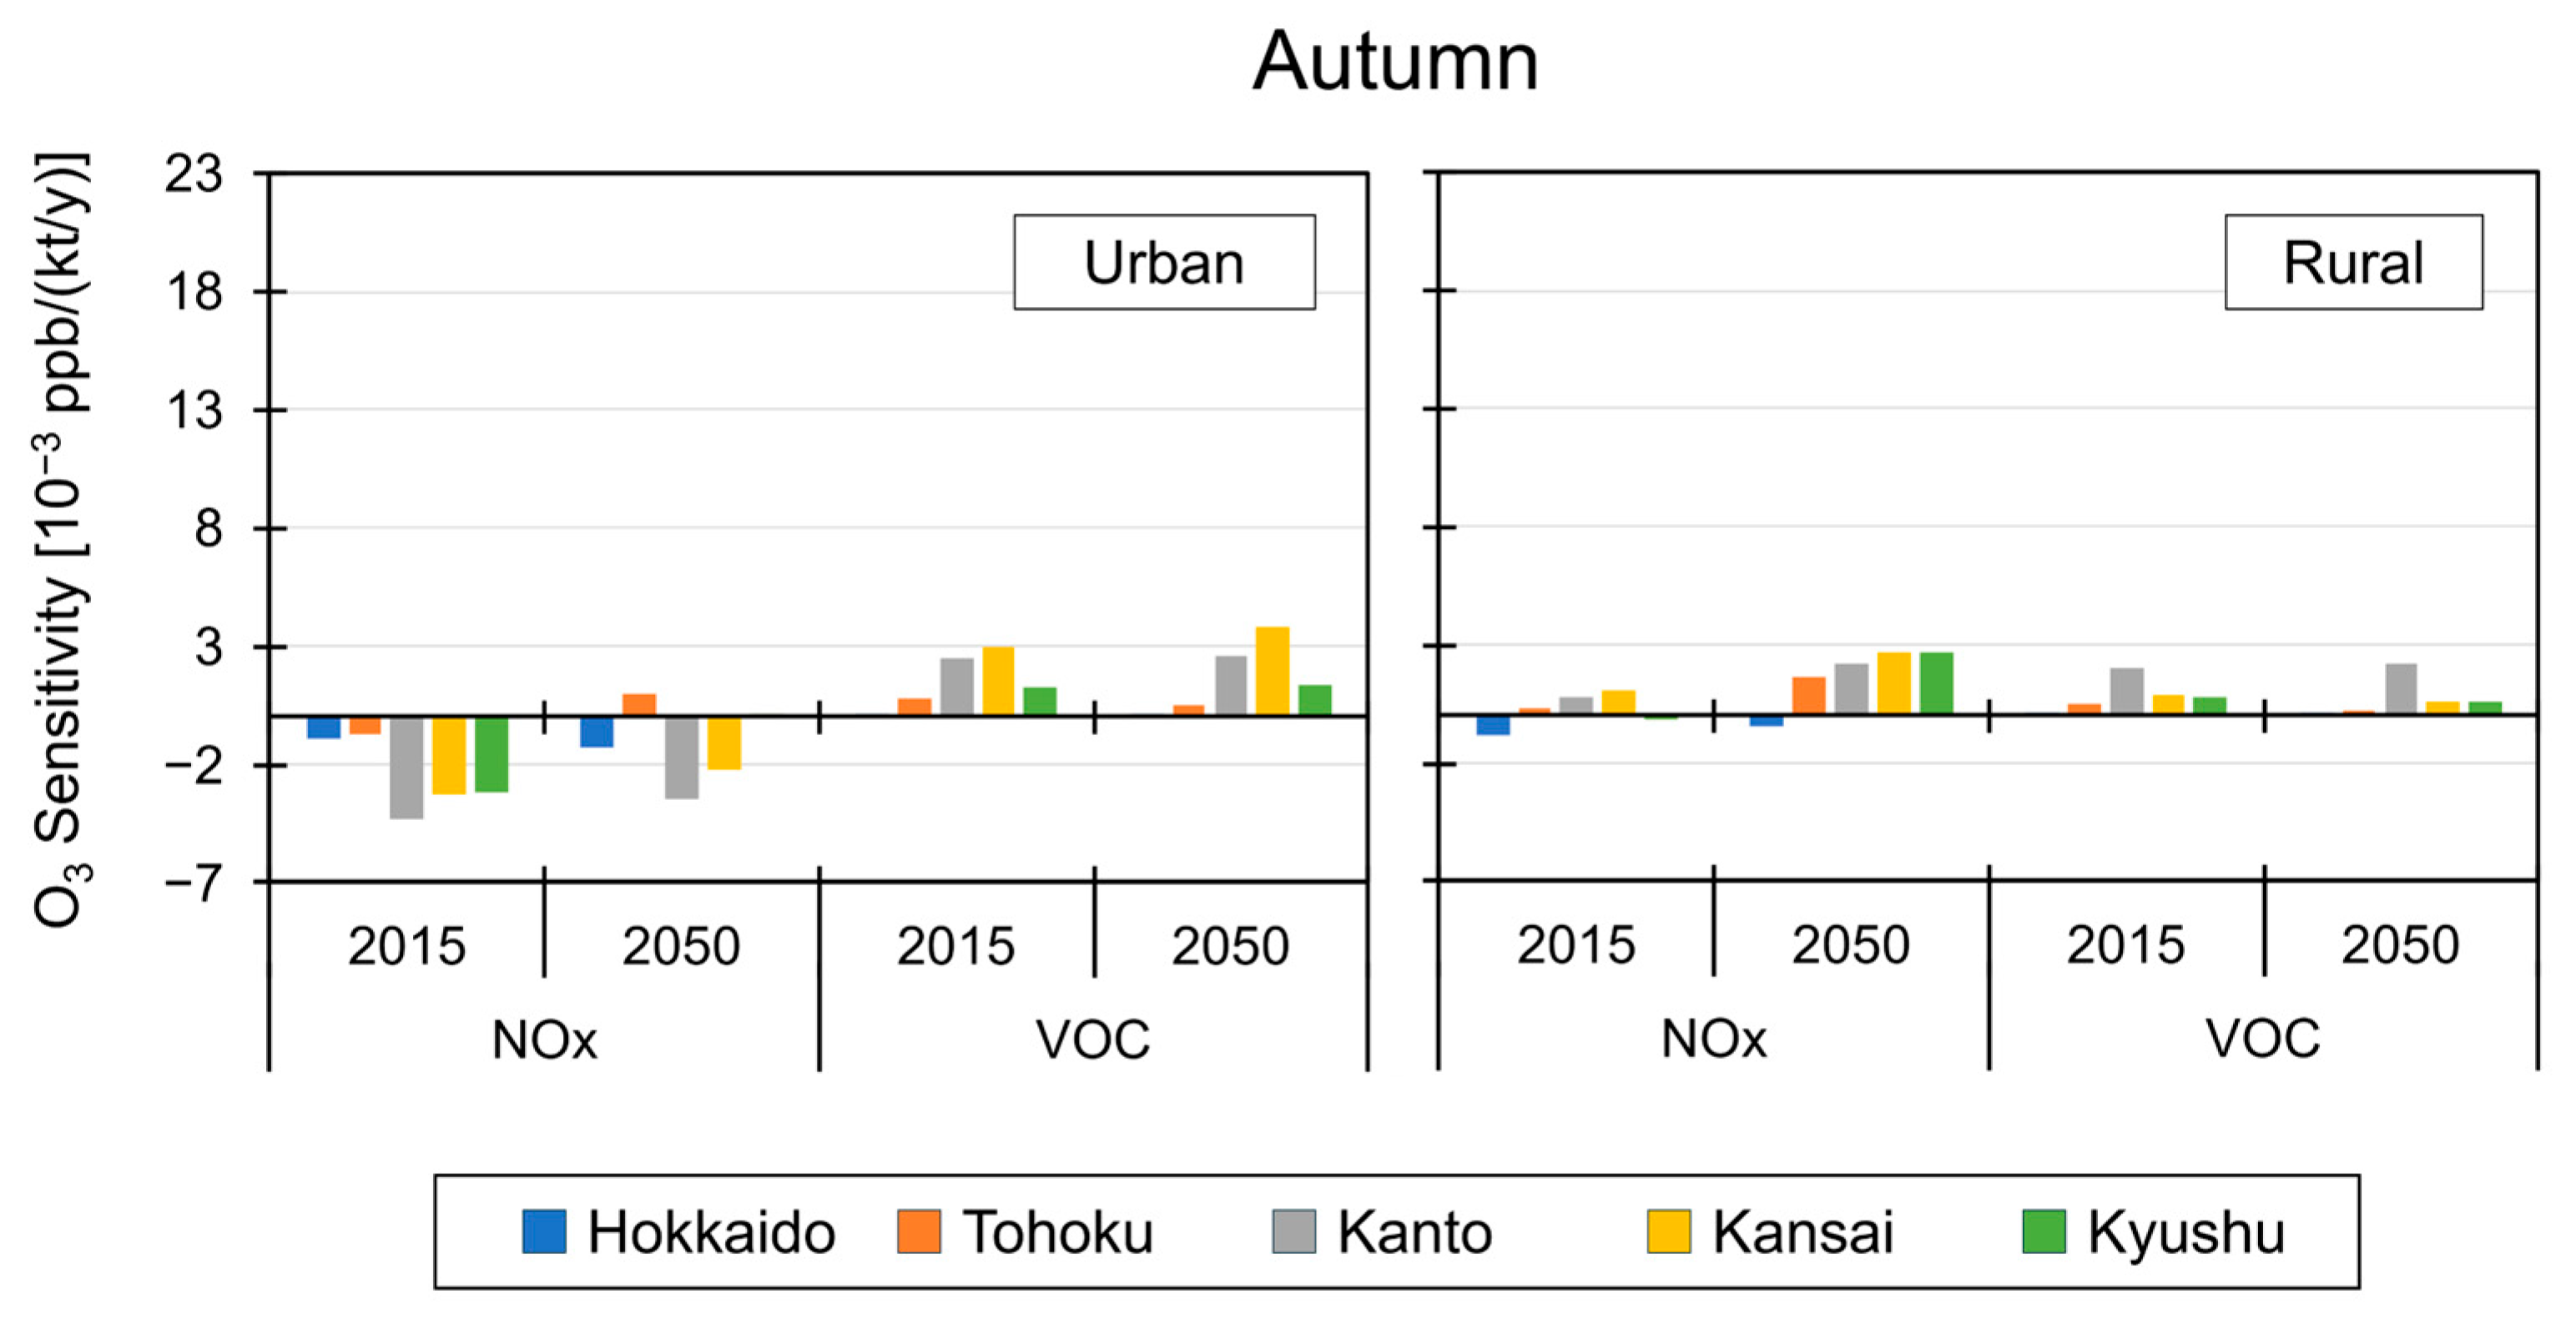
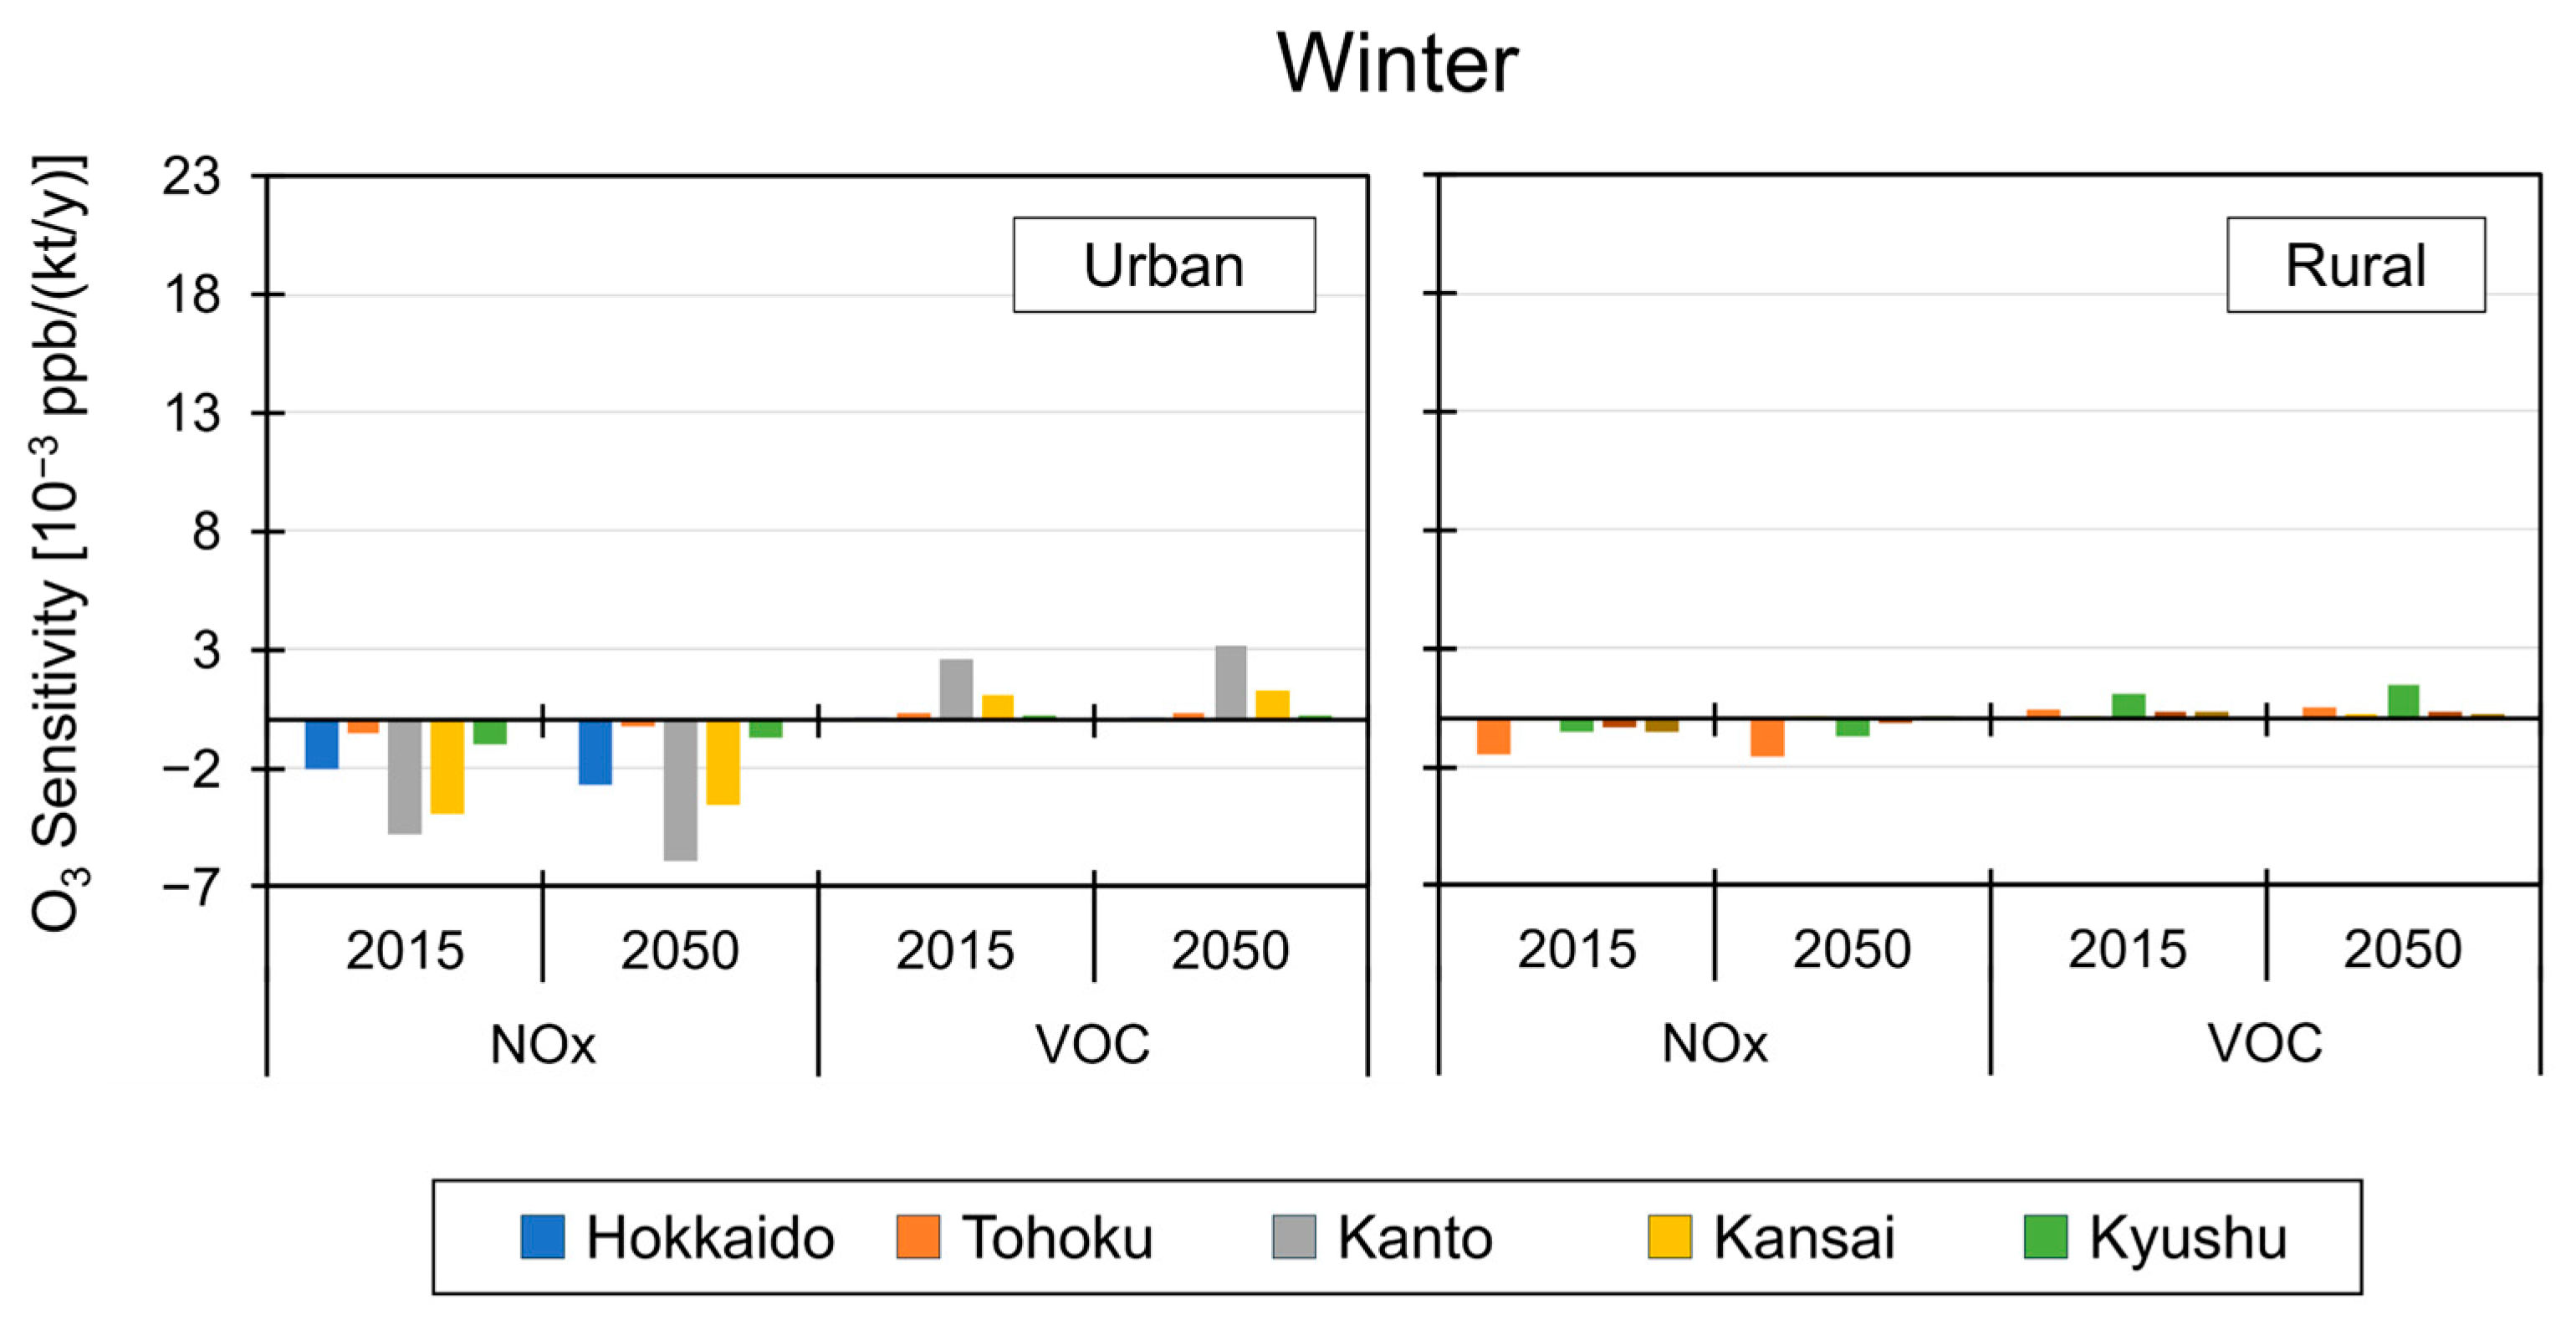
Figure 6, Figure 7, Figure 8 and Figure 9 show the results of the sensitivity analysis. As shown in Figure 6 and Figure 7, in both spring and summer, anthropogenic NOx emissions exhibited a positive sensitivity to O3 concentrations, with a greater magnitude than that in 2015. This indicates that in spring and summer, reductions in NOx emissions become more effective at lowering O3 concentrations in 2050 compared to 2015. According to the result of sensitivity analysis, the magnitude of this increase in effectiveness ranges from −0.18 (which means the place where NOx reduction was counterproductive in 2015 become effective in 2050) to 4.93 times in urban areas and 1.45 to 5.69 times in rural areas during spring, and from 1.39 to 19.48 times in urban areas and 1.33 to 1.89 times in rural areas during summer, relative to 2015. Sensitivity to anthropogenic VOC emissions in rural areas during spring and summer was negligible in both 2015 and 2050. This indicates that reductions in anthropogenic VOC emissions contribute little to lowering O3 concentrations in these periods in rural areas. In the urban areas of Kanto and Kansai, VOC sensitivity was slightly positive, indicating that VOC reductions had some effect on lowering O3 concentrations. However, effectiveness decreased from 2015 to 2050, with spring values ranging from 0.68 to 0.93 times and summer values from 0.42 to 0.60 times, suggesting that by 2050, VOC emission reductions will become less effective in lowering O3 concentrations in urban areas. Figure 8 and Figure 9 show that, in autumn and winter, urban areas exhibited little to no sensitivity or negative sensitivity to anthropogenic NOₓ emissions, whereas rural areas showed almost no sensitivity, while both urban and rural areas showed little positive or no sensitivity anthropogenic VOC emissions. Sensitivity in autumn and winter does not change significantly between 2015 and 2050. In colder seasons, photochemical O3 formation is not active, whereas the titration effect is present, which is thought to account for this characteristic. Results for autumn and winter indicate that O3 increases with NOx reductions in autumn and winter; however, since these are not seasons when high concentrations typically occur, it is not considered a major issue.
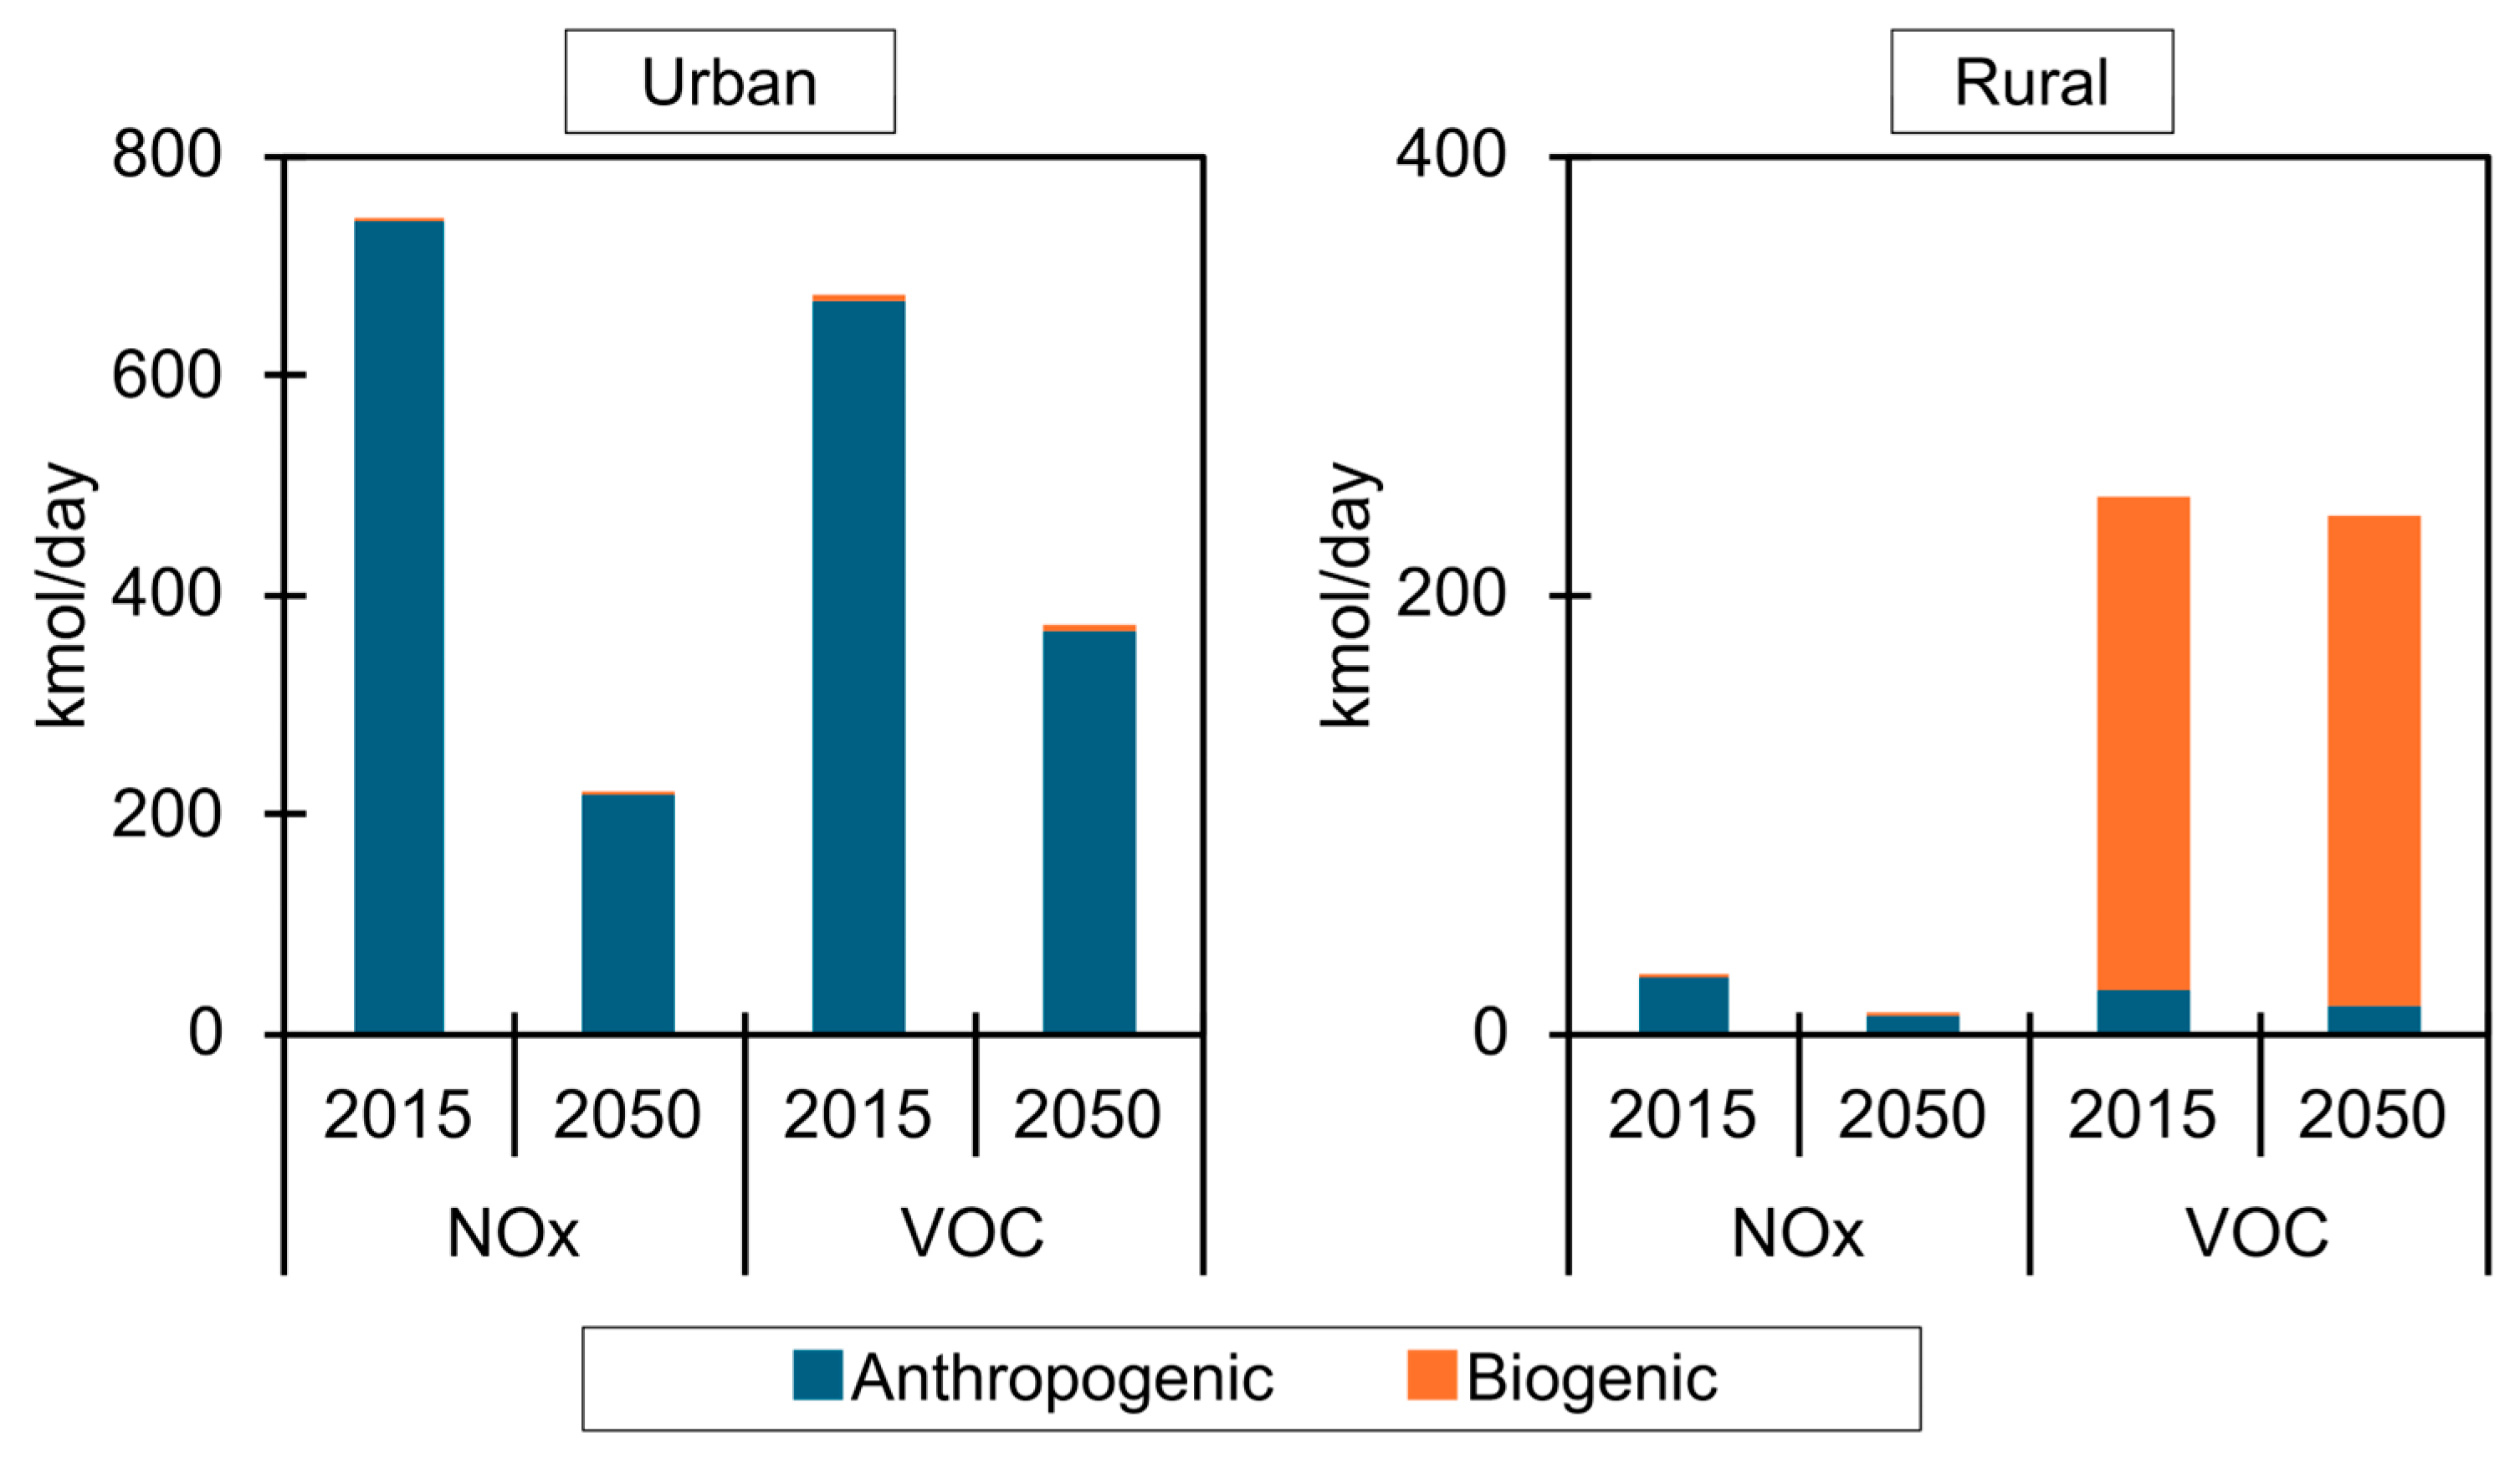
The reason for the changes in O3 sensitivity during spring and summer from 2015 to 2050 was investigated. In this section, firstly particular attention is given to the Kanto region, where the sensitivity in the urban core showed the most significant variations. Since O3 sensitivity to NOx and VOC depends on the balance between their respective emissions, NOx and VOC emissions in both urban and rural areas of Kanto were analyzed. Figure 10 shows NOx and VOC emissions in spring. In the urban area, the ratio between NOx and VOC (NOx/VOC) changes from 1.1 in 2015 to 0.59 in 2050; the relative dominance between NOx and VOC emissions reversed. In contrast, in the rural area, since anthropogenic emissions are relatively small and biogenic VOC (BVOC) account for the majority of total VOC emissions with a large amount, NOx/VOC does not change significantly: it changed from 0.11 in 2015 to 0.04 in 2050. As the NOx/VOC ratio decreases, the sensitivity to NOx becomes more positive. Therefore, the changes in the emission balance observed here are consistent with the trends in sensitivity changes found in this study. Figure 11 shows NOx and VOC emissions in summer and indicates that a conclusion similar to that for spring can also be drawn for summer. In the urban area, NOx/VOC changes from 0.72 in 2015 to 0.41 in 2050. In contrast, in the rural area, NOx/VOC does not change significantly: it changed from 0.02 in 2015 to 0.01 in 2050. Although the relative dominance between NOx and VOC emissions did not reverse in the urban area in summer, VOC emissions became relatively higher, which could cause the NOx sensitivity to increase more positively. For reference, emissions at other locations are shown in Figures S11–S18. A mechanism similar to that observed in the Kanto region was also seen in Hokkaido, Tohoku, and Kansai; since reduction in anthropogenic NOx emissions is relatively larger than anthropogenic VOC emissions, NOx/VOC ratio shifts low and leads to NOx-limited conditions. In Kyushu region, BVOC showed a noticeable influence even in the urban area, and NOx-limited conditions are likely governed by a combination of changes in anthropogenic emissions and the effects of BVOC. In all regions, the large contribution of BVOC relative to anthropogenic emissions maintains NOx-limited conditions from 2015 to 2050 in rural areas.

4. Conclusions

In this study, a sensitivity analysis of anthropogenic NOx and VOC emissions on O3 concentrations in Japan in 2015 and 2050 was conducted using the regional air quality model CMAQ.
It is revealed that in spring and summer, anthropogenic NOx emissions exhibited a positive sensitivity to O3 concentrations, with an average magnitude in 2050 approximately three times greater than that in 2015. This indicates that in spring and summer, reductions in NOx emissions become three times more effective at lowering O3 concentrations in 2050 compared to 2015. Sensitivity to anthropogenic VOC emissions in rural areas during spring and summer was negligible in both 2015 and 2050. This indicates that reductions in anthropogenic VOC emissions contribute little to lowering O3 concentrations in these periods in rural areas. In the urban areas of Kanto and Kansai, VOC sensitivity was slightly positive, indicating that VOC reductions had some effect on lowering O3 concentrations. However, effectiveness decreased from 2015 to 2050, with an average value reduced to approximately 0.66 times, suggesting that by 2050, VOC emission reductions will become less effective in lowering O3 concentrations in urban areas. In spring and summer, the changes in sensitivity from 2015 to 2050 are primarily attributed to alterations in the balance between NOx and VOC emissions. In urban areas such as the Kanto and Kansai regions, relatively larger reductions in anthropogenic NOx emissions compared with anthropogenic VOC emissions result in lower NOx/VOC ratios, leading to more pronounced NOx-limited conditions by 2050. In contrast, in rural areas, where BVOC emissions dominate over anthropogenic sources, NOx-limited conditions are maintained from 2015 to 2050. In certain regions, such as Kyushu, even urban areas exhibit a notable influence of BVOC, suggesting that the NOx-limited regime is governed by a combined effect of anthropogenic emission changes and BVOC contributions.
In autumn and winter, anthropogenic NOx and VOC emissions exhibited little to no sensitivity in urban areas, with some locations exhibiting negative NOx sensitivity, whereas rural areas displayed almost no sensitivity in both NOx and VOC. Particularly in colder seasons, owing to minimal photochemical reactions, the reduction in the titration effect of anthropogenic NOx emissions led to cases where reducing NOx emissions causes an increase in O3 concentrations. However, since autumn and winter are not seasons when high O3 concentrations typically occur, it is not considered a major issue. The changes in sensitivity to both NOx and VOC emissions between 2015 and 2050 were limited.
This study estimated atmospheric pollutant emissions based on changes in CO2 emissions by incorporating various processes under the framework of the 5th Strategic Energy Plan. However, the 6th Strategic Energy Plan has since been published, and industries have presented more detailed and specific visions for 2050. Results of sensitivity analysis in this study also indicate that if NOx emissions are not reduced as much as assumed in this study, O3 concentrations in spring and summer are likely to remain at higher levels in 2050. Therefore, future analyses should be conducted using updated estimates of the pollutant emissions. From a perspective beyond domestic emissions, factors such as transboundary pollution from other countries and changes in meteorological conditions, including global warming, would also be important considerations.

Supplementary Materials

The following supporting information can be downloaded at: https://www.mdpi.com/article/10.3390/atmos16111261/s1.

Author Contributions

Conceptualization, Y.Y., T.M. and K.T.; methodology, Y.Y., T.M., M.H. and K.T.; formal analysis, Y.Y., R.H. and T.U.; investigation, Y.Y.; resources, K.T.; data curation, Y.Y.; writing—original draft preparation, Y.Y.; writing—review and editing, T.M., M.H., H.Y., K.T., S.O., Y.S., H.W. and T.K.; visualization, Y.Y.; supervision, T.M., M.H., H.Y., K.T., S.O., Y.S., H.W. and T.K.; project administration, Y.Y. All authors have read and agreed to the published version of the manuscript.

Funding

This research received no external funding.

Institutional Review Board Statement

Not applicable.

Informed Consent Statement

Not applicable.

Data Availability Statement

Dataset available on request from the authors.

Conflicts of Interest

Author Shinichiro Okayama was employed by the company Haltermann Carless Japan G.K. Author Hiroe Watanabe was employed by the company Nissan Motor Co., Ltd. Author Toru Kidokoro was employed by the company Toyota Motor Corp. The remaining authors declare that the research was conducted in the absence of any commercial or financial relationships that could be construed as a potential conflict of interest.

References

  1. Brunekreef, B.; Holgate, S.T. Air Pollution and Health. Lancet 2002, 360, 1233–1242. [Google Scholar] [CrossRef]
  2. Intergovernmental Panel on Climate Change (IPCC). Climate Change 2021—The Physical Science Basis: Working Group I Contribution to the Sixth Assessment Report of the Intergovernmental Panel on Climate Change; Cambridge University Press: Cambridge, UK, 2023; ISBN 9781009157896. [Google Scholar]
  3. Donzelli, G.; Suarez-Varela, M.M. Tropospheric Ozone: A Critical Review of the Literature on Emissions, Exposure, and Health Effects. Atmosphere 2024, 15, 779. [Google Scholar] [CrossRef]
  4. Ministry of the Environment. Reiwa 5-Nendo Taiki Osen jōkyō ni Tsuite [Air Pollution Status in FY2023]. Available online: https://www.env.go.jp/press/press_04931.html (accessed on 24 September 2025).
  5. Kawano, N.; Nagashima, T.; Sugata, S. Changes in Seasonal Cycle of Surface Ozone over Japan during 1980–2015. Atmos. Environ. 2022, 279, 119108. [Google Scholar] [CrossRef]
  6. Ministry of the Environment. Environmental Quality Standards in Japan-Air Quality. Available online: https://www.env.go.jp/en/air/aq/aq.html (accessed on 7 February 2025).
  7. Akimoto, H.; Mori, Y.; Sasaki, K.; Nakanishi, H.; Ohizumi, T.; Itano, Y. Analysis of Monitoring Data of Ground-Level Ozone in Japan for Long-Term Trend during 1990–2010: Causes of Temporal and Spatial Variation. Atmos. Environ. 2015, 102, 302–310. [Google Scholar] [CrossRef]
  8. Gaudel, A.; Cooper, O.R.; Chang, K.-L.; Bourgeois, I.; Ziemke, J.R.; Strode, S.A.; Oman, L.D.; Sellitto, P.; Nédélec, P.; Blot, R.; et al. Aircraft Observations since the 1990s Reveal Increases of Tropospheric Ozone at Multiple Locations across the Northern Hemisphere. Sci. Adv. 2020, 6, eaba8272. [Google Scholar] [CrossRef]
  9. Chatani, S.; Shimadera, H.; Itahashi, S.; Yamaji, K. Comprehensive Analyses of Source Sensitivities and Apportionments of PM2.5 and Ozone over Japan via Multiple Numerical Techniques. Atmos. Chem. Phys. 2020, 20, 10311–10329. [Google Scholar] [CrossRef]
  10. Sharma, S.; Chatani, S.; Mahtta, R.; Goel, A.; Kumar, A. Sensitivity Analysis of Ground Level Ozone in India Using WRF-CMAQ Models. Atmos. Environ. 2016, 131, 29–40. [Google Scholar] [CrossRef]
  11. Santiago, J.V.; Jaimes Palomera, M.; Resendiz Martinez, C.; Hernandez Matamoros, A.; Hata, H.; Inoue, K.; Tonokura, K. Ozone Responses to Reduced Precursor Emissions: A Modeling Analysis on How Attainable Goals Can Improve Air Quality in the Mexico City Metropolitan Area. Sci. Total Environ. 2024, 912, 169180. [Google Scholar] [CrossRef]
  12. Ge, S.; Wang, S.; Xu, Q.; Ho, T. Characterization and Sensitivity Analysis on Ozone Pollution over the Beaumont-Port Arthur Area in Texas of USA through Source Apportionment Technologies. Atmos. Res. 2021, 247, 105249. [Google Scholar] [CrossRef]
  13. Ito, A.; Wakamatsu, S.; Morikawa, T.; Kobayashi, S. 30 Years of Air Quality Trends in Japan. Atmosphere 2021, 12, 1072. [Google Scholar] [CrossRef]
  14. United Nations. COP26: Together for Our Planet|United Nations. Available online: https://www.un.org/en/climatechange/cop26 (accessed on 16 February 2025).
  15. United Nations. COP29: Investing in a Livable Planet for All. Available online: https://www.un.org/en/climatechange/cop29 (accessed on 25 October 2025).
  16. House of Representatives. Dai 203-kai kokkai honkaigi dai 1-gō (reiwa 2-nen 10-gatsu 26-nichi (getsuyōbi)) [The 203rd National Diet Session, Plenary Session, No. 1 (Monday, 26 October 2020)]. Available online: https://www.shugiin.go.jp/internet/itdb_kaigiroku.nsf/html/kaigiroku/000120320201026001.htm (accessed on 16 February 2025).
  17. Agency for Natural Resources and Energy. Strategic Energy Plan. Available online: https://www.enecho.meti.go.jp/category/others/basic_plan/pdf/strategic_energy_plan.pdf (accessed on 16 February 2025).
  18. Morikawa, T.; Yamada, H.; Tanaka, K.; Okayama, S.; Shibata, Y.; Nakata, Y.; Watanabe, H.; Kidokoro, T. Air Quality Estimation in 2050. Trans. Soc. Automot. Eng. Jpn. 2021, 52, 1261–1266. [Google Scholar] [CrossRef]
  19. Hata, H.; Inoue, K.; Yoshikado, H.; Genchi, Y.; Tsunemi, K. Impact of Introducing Net-Zero Carbon Strategies on Tropospheric Ozone (O3) and Fine Particulate Matter (PM2.5) Concentrations in Japanese Region in 2050. Sci. Total Environ. 2023, 891, 164442. [Google Scholar] [CrossRef]
  20. Zhao, Y.; Li, Y.; Li, Y.; Kumar, A.; Ying, Q.; Kleeman, M.J. Reducing Southern California Ozone Concentrations in the Year 2050 under a Low Carbon Energy Scenario. Atmos. Environ. 2024, 320, 120315. [Google Scholar] [CrossRef]
  21. Doğan Güzel, T.; Alp, K. The Effects of Technological Developments in Transportation Vehicles on Air Pollution Mitigation of Metropolitan Cities: A Case Study of Istanbul. Sci. Total Environ. 2024, 912, 168996. [Google Scholar] [CrossRef]
  22. Sillman, S. The Relation between Ozone, NOx and Hydrocarbons in Urban and Polluted Rural Environments. Atmos. Environ. 1999, 33, 1821–1845. [Google Scholar] [CrossRef]
  23. US EPA Office of Research and Development. CMAQ, version 5.3.2. Zenodo; 2020. Available online: https://zenodo.org/records/4081737 (accessed on 16 February 2025).
  24. Carter, W.P.L. Development of a Condensed SAPRC-07 Chemical Mechanism. Atmos. Environ. 2010, 44, 5336–5345. [Google Scholar] [CrossRef]
  25. Carter, W.P.L. Development of the SAPRC-07 Chemical Mechanism. Atmos. Environ. 2010, 44, 5324–5335. [Google Scholar] [CrossRef]
  26. Skamarock, W.C.; Klemp, J.B.; Dudhia, J.; Gill, D.O.; Barker, D.M.; Duda, M.G.; Powers, J. A Description of the Advanced Research WRF Version 3. NCAR Tech. Note 2008, 475, 10–5065. [Google Scholar]
  27. National Centers for Environmental Prediction, National Weather Service, NOAA, U.S. Department of Commerce. NCEP FNL Operational Model Global Tropospheric Analyses, Continuing from July 1999; NSF National Center for Atmospheric Research: Boulder, CO, USA, 2000; Available online: https://gdex.ucar.edu/datasets/d083002/ (accessed on 16 February 2025).
  28. Lamarque, J.-F.; Emmons, L.K.; Hess, P.G.; Kinnison, D.E.; Tilmes, S.; Vitt, F.; Heald, C.L.; Holland, E.A.; Lauritzen, P.H.; Neu, J.; et al. CAM-Chem: Description and Evaluation of Interactive Atmospheric Chemistry in the Community Earth System Model. Geosci. Model Dev. 2012, 5, 369–411. [Google Scholar] [CrossRef]
  29. Ministry of the Environment. PM2.5 Emission Inventory; Ministry of the Environment, Government of Japan: Tokyo, Japan, 2019. [Google Scholar]
  30. Kurokawa, J.; Ohara, T. Long-Term Historical Trends in Air Pollutant Emissions in Asia: Regional Emission Inventory in ASia (REAS) Version 3. Atmos. Chem. Phys. 2020, 20, 12761–12793. [Google Scholar] [CrossRef]
  31. IIASA-International Institute for Applied Systems Analysis. Global Emission Fields of Air Pollutants and GHGs; IIASA—International Institute for Applied Systems Analysis: Laxenburg, Austria, 2024.
  32. Guenther, A.; Karl, T.; Harley, P.; Wiedinmyer, C.; Palmer, P.I.; Geron, C. Estimates of Global Terrestrial Isoprene Emissions Using MEGAN (Model of Emissions of Gases and Aerosols from Nature). Atmos. Chem. Phys. 2006, 6, 3181–3210. [Google Scholar] [CrossRef]
  33. Chatani, S.; Matsunaga, S.N.; Nakatsuka, S. Estimate of Biogenic VOC Emissions in Japan and Their Effects on Photochemical Formation of Ambient Ozone and Secondary Organic Aerosol. Atmos. Environ. 2015, 120, 38–50. [Google Scholar] [CrossRef]
  34. Randerson, J.T.; Van Der Werf, G.R.; Giglio, L.; Collatz, G.J.; Kasibhatla, P.S. Global Fire Emissions Database, Version 4.1 (GFEDv4); ORNL DAAC: Oak Ridge, TN, USA, 2017. [Google Scholar]
  35. Statistics Bureau; Ministry of Internal Affairs; Communications Statistics Bureau Home Page. Final Report of 2015 “POPULATION AND HOUSEHOLDS OF JAPAN”. Available online: https://www.stat.go.jp/english/data/kokusei/2015/final_en/final_en.html (accessed on 24 October 2025).
  36. National Institute for Environmental Studies, The Environmental Observatory Air Pollution Monitoring Data File. Available online: https://tenbou.nies.go.jp/download/ (accessed on 24 October 2025).
  37. Willmott, C.J.; Robeson, S.M.; Matsuura, K. A Refined Index of Model Performance. Int. J. Climatol. 2012, 32, 2088–2094. [Google Scholar] [CrossRef]
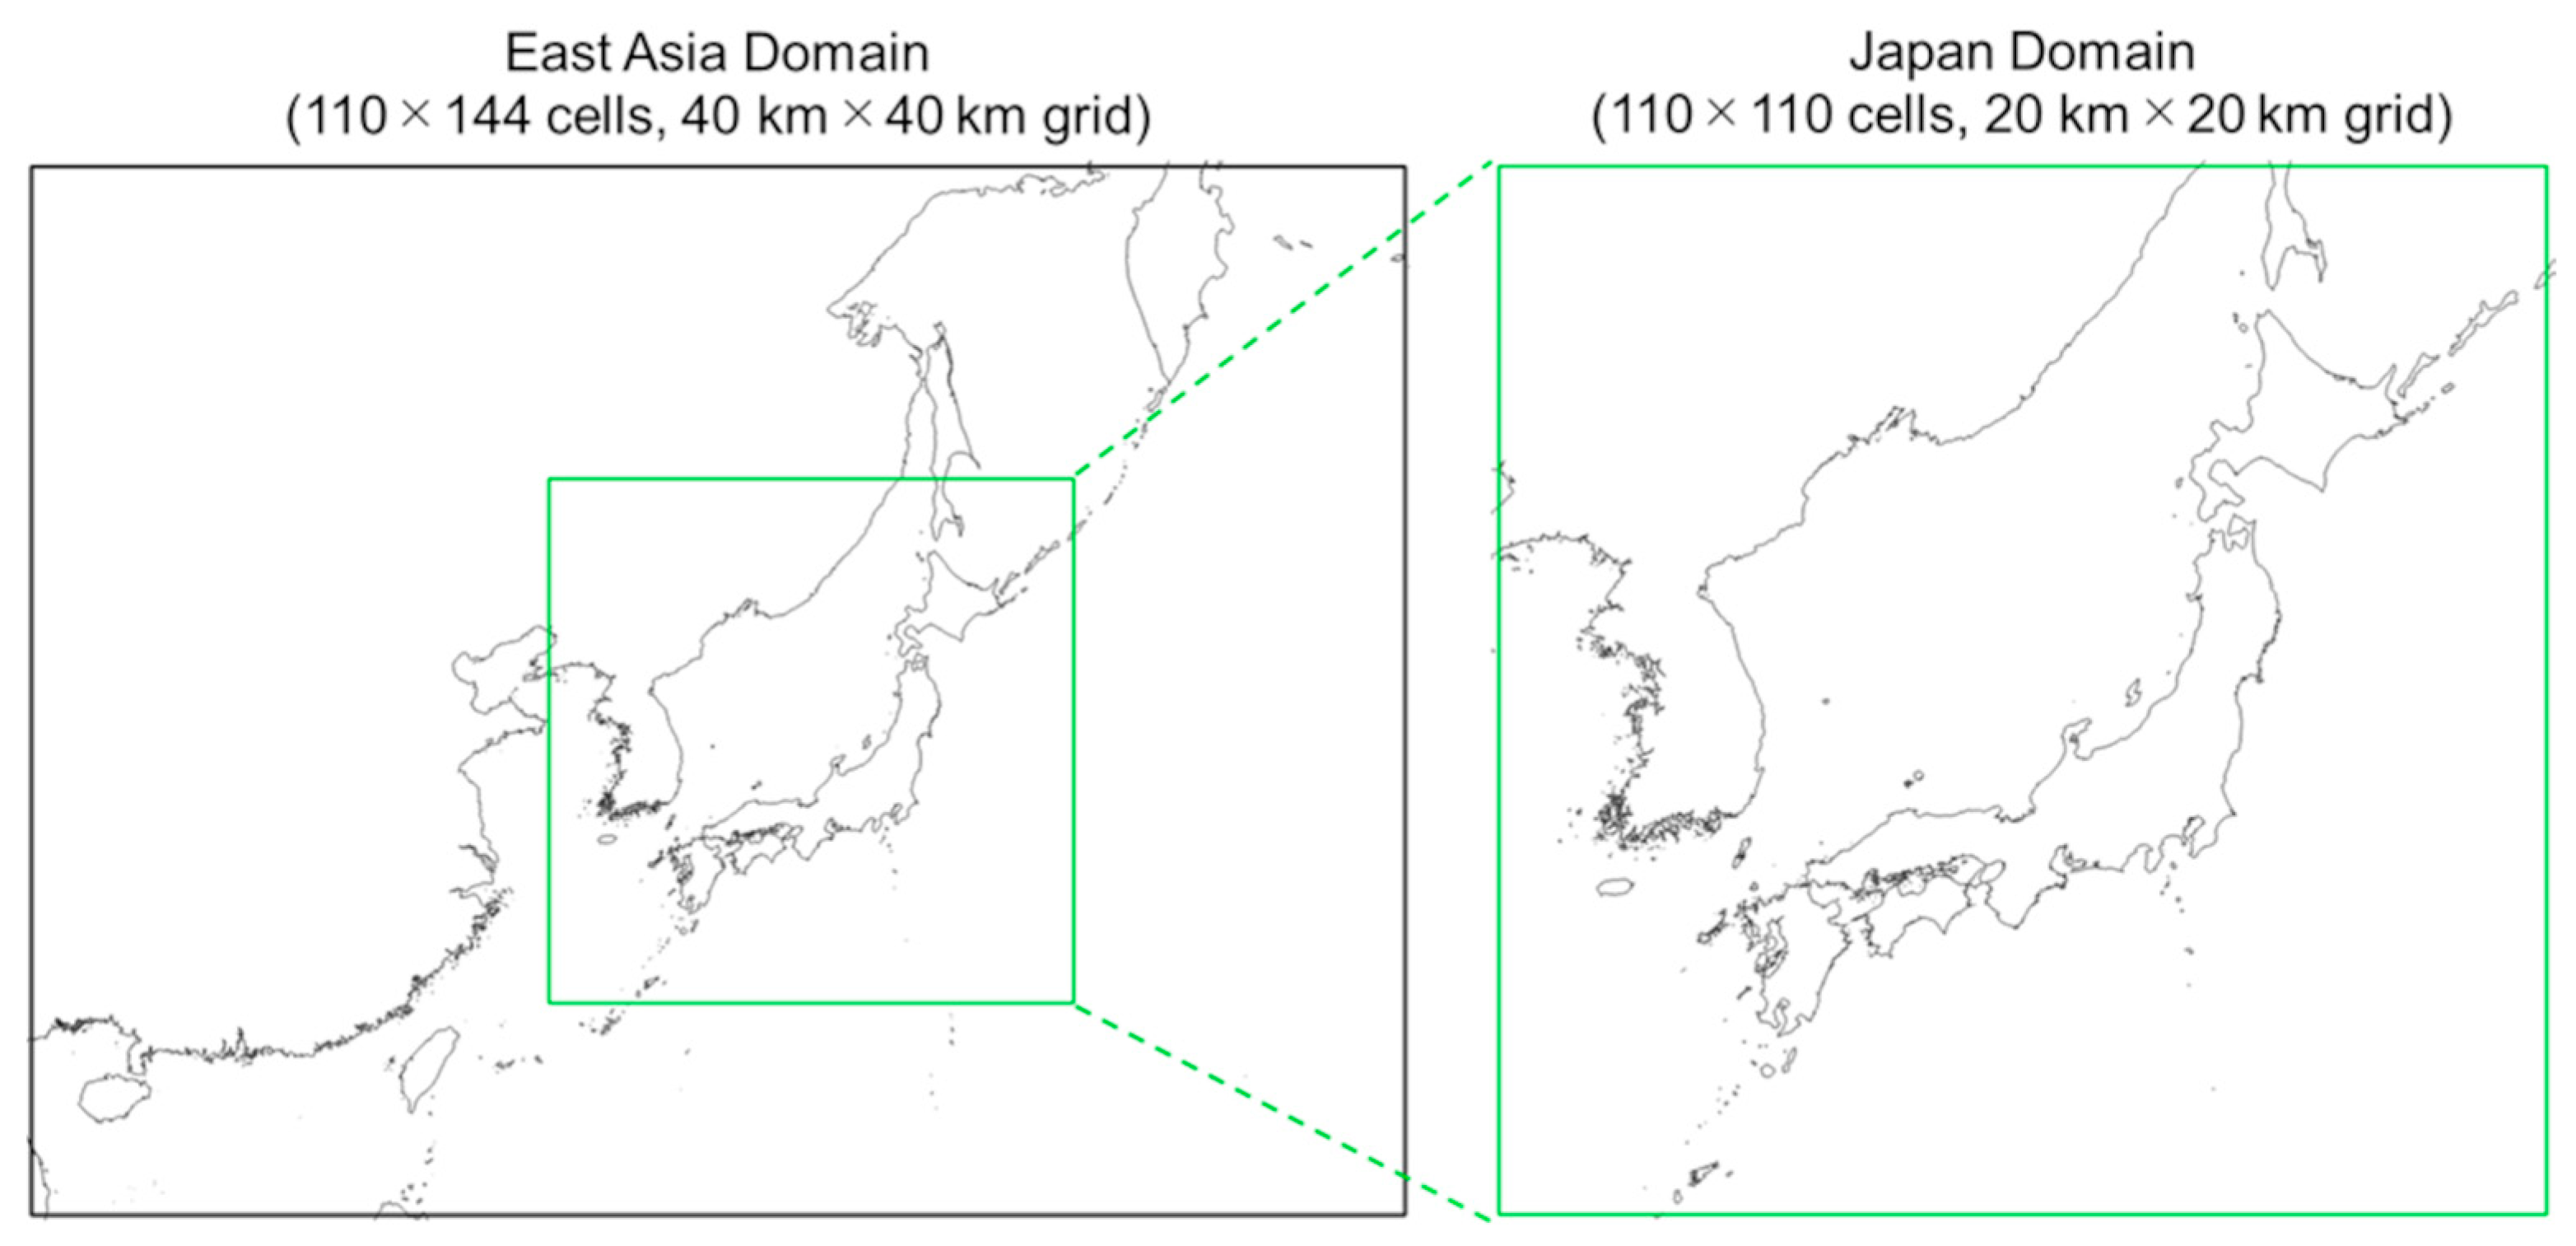
Figure 1. The computational domain used in this study.
Atmosphere 16 01261 g001
Figure 2. The anthropogenic emissions of atmospheric pollutants from Japan in 2015 and 2050.
Atmosphere 16 01261 g002
Figure 3. The concept of the sensitivity coefficient used in this study.
Atmosphere 16 01261 g003
Figure 4. The locations at which sensitivity analysis were performed in this study. To support understanding of the calculation results, certain regional names are presented, although a sensitivity analysis was not performed.
Atmosphere 16 01261 g004
Figure 5. The calculation results of the seasonal average distribution of the daily maximum 8 h O3 concentration. (a) spring in 2015; (b) summer in 2015; (c) autumn in 2015; (d) winter in 2015; (e) spring in 2050; (f) summer in 2050; (g) autumn in 2050; (h) winter in 2050.
Atmosphere 16 01261 g005
Figure 6. Sensitivity of the daily maximum 8 h O3 concentration to domestic anthropogenic NOx and VOC emissions in spring.
Atmosphere 16 01261 g006
Figure 7. Sensitivity of the daily maximum 8 h O3 concentration to domestic anthropogenic NOx and VOC emissions in summer.
Atmosphere 16 01261 g007
Figure 8. Sensitivity of the daily maximum 8 h O3 concentration to domestic anthropogenic NOx and VOC emissions in autumn.
Atmosphere 16 01261 g008
Figure 9. Sensitivity of the daily maximum 8 h O3 concentration to domestic anthropogenic NOx and VOC emissions at winter.
Atmosphere 16 01261 g009
Figure 10. NOx and VOC emissions on a spring day (May 1) in Kanto region.
Atmosphere 16 01261 g010
Figure 11. NOx and VOC emissions on a summer day (August 1) in Kanto region.
Atmosphere 16 01261 g011
Table 1. The emission scenarios considered in this study.
ScenarioEast AsiaJapan
YearYearAnthropogenic
NOx Emissions
Anthropogenic
VOC Emissions
2015 Base20152015±0%±0%
2015 NOx +10%+10%±0%
2015 NOx +20%+20%±0%
2015 NOx −10%−10%±0%
2015 NOx −20%−20%±0%
2015 VOC +10%±0%+10%
2015 VOC +20%±0%+20%
2015 VOC −10%±0%−10%
2015 VOC −20%±0%−20%
2050 Base20502050±0%±0%
2050 NOx +10%+10%±0%
2050 NOx +20%+20%±0%
2050 NOx −10%−10%±0%
2050 NOx −20%−20%±0%
2050 VOC +10%±0%+10%
2050 VOC +20%±0%+20%
2050 VOC −10%±0%−10%
2050 VOC −20%±0%−20%
Table 2. The average, maximum, and minimum values of MBE, RMSE, and IoA for the 2015 simulation at each analysis site in the model configuration used in this study.
SeasonMBE (ppb)RMSE (ppb)IoA
Ave.Max.Min.Ave.Max.Min.Ave.Max.Min.
Spring8.114.0−2.312.517.98.00.320.65−0.24
Summer8.916.1−1.614.918.59.80.440.84−0.27
Autumn10.014.98.012.017.19.40.260.51−0.15
Winter15.618.112.316.720.213.0−0.390.04−0.83
Disclaimer/Publisher’s Note: The statements, opinions and data contained in all publications are solely those of the individual author(s) and contributor(s) and not of MDPI and/or the editor(s). MDPI and/or the editor(s) disclaim responsibility for any injury to people or property resulting from any ideas, methods, instructions or products referred to in the content.