Article

Modeling Study on Key Factors Related to Changes in Sea Fog Formation on the Western Coast of the Korean Peninsula

1
Earth Environment Research Center, Kongju National University, Gongju 32588, Republic of Korea
2
Department of Atmospheric Sciences, Kongju National University, Gongju 32588, Republic of Korea
*
Author to whom correspondence should be addressed.
Atmosphere 2025, 16(11), 1253; https://doi.org/10.3390/atmos16111253
Submission received: 16 September 2025 / Revised: 29 October 2025 / Accepted: 30 October 2025 / Published: 31 October 2025
(This article belongs to the Section Biosphere/Hydrosphere/Land–Atmosphere Interactions)

Abstract

A notable decline in the frequency of sea fog inflows and an increase in low-cloud ceiling height were observed following the construction of the Saemangeum Seawall west of the Gunsan Airport, an area traditionally prone to frequent sea fog events. To the mechanisms underlying these changes, a numerical experiment was conducted using the Weather Research and Forecasting model. An 11-m-high seawall was used as a physical barrier, and an elevated sea surface temperature (SST) was established within the enclosed area to simulate realistic post-construction conditions. The model successfully reconstructed sea fog occurrences, and the cloud–water mixing ratio effectively captured the spatial distribution of sea fog. Deviations from the control experiment showed a consistent pattern of reduced cloud–water mixing ratios near the surface and enhanced concentrations at high levels. Decreased buoyancy frequency in the surface layer enhanced atmospheric instability, inducing upward motion and intensified condensation activity. Increases in the turbulence kinetic energy within the planetary boundary layer (TKE within the PBL), vertical wind shear, and temperature further corroborated the reduction in sea fog and enhanced stratus formation. These findings indicate that the increased SST and seawall significantly influence the modification of the sea fog structure and its inflow dynamics.

1. Introduction

Fog is defined as a surface-based cloud comprising small, light droplets (or ice crystals) that reduce the horizontal field of view to ˂1 km [1]. The influence of fog on human activities has been recognized for centuries; however, its effects have considerably increased in recent decades owing to increasing air, sea, and road traffic. Economic and human losses resulting from fog and low visibility are comparable to those associated with other meteorological events, such as tornadoes and, in certain cases, even hurricanes [2,3].
Sea fog is a subtype of advection fog generated when air moves above sea level at different temperatures. This is classified into cold sea fog (or warm advection fog), which develops when warm air moves above a cold sea surface, and warm sea fog (or cold advection fog), which is formed when cold air moves above a warm sea surface [4,5,6]. The primary regions of occurrence include the Arabian Peninsula, the northwestern Atlantic coast, the South China Sea, South Africa, the western coast of the United States, and the West Sea of Korea [7,8,9,10]. In the western coastal region of Korea, most sea fog is cold advection fog, which occurs when warm air flows over the cold sea surface from spring to summer [1,6,11]. These sea fog events have resulted in an average of three to four low-visibility warnings per month at Gunsan Airport, where there are few obstacles except for islands, presenting a considerable threat to aircraft takeoff and landing. However, following the completion of the Saemangeum Seawall in 2010, a large marine structure was constructed, and reclaimed land was formed, which notably changed the weather environment west of Gunsan Airport. Hwang and Chang [12] conducted a statistical analysis of the weather conditions at Gunsan Airport before and after the completion of the seawall. Their findings indicated a reduction in the inflow of sea fog and increased stratus ceiling heights, which they attributed to the structure of the seawall and increased sea surface temperature (SST) inside the seawall. Previous studies have validated the results using a statistical approach; however, for a comprehensive analysis of the underlying cause of the phenomenon, understanding the structure of the atmospheric environment through model experiments is necessary.
Since the second half of the 20th century, the rapid development of numerical modeling has enabled the study of complex physical processes using three-dimensional (3D) models. Simulations of 3D fog structures have underscored the influence of inversion layers [13], cloud-top longwave radiation [14], land–sea gradients [8], and complex interactions between advection, weather evolution, and local circulation [15]. Sea fog studies have focused on the formation, development, and dissipation of fog. Sea fog is a boundary layer phenomenon; therefore, its formation and development are strongly affected by SST and thermodynamic fluxes at the air–sea interface [16,17]. To evaluate the effect of the characteristics of the surface atmospheric environment on sea fog, we explored marine features and synoptic conditions during sea fog, including wind, temperature, humidity, and atmospheric stability [18], and investigated sea fog events using Weather Research and Forecasting (WRF) models, revealing that low-level jets and topography are important in fog duration and dissipation [19]. Additionally, Han et al. [20] observed that air–sea interactions primarily affect the formation and evolution of sea fog through cooling, humidification, and reinforcement of the lower atmospheric stable layer, whereas low-level humidity decreases during the fog dissipation phase owing to an increase in vertical mixing and low-level wind speed.
Compared with satellite cloud images and microphysical parameter observations, the cloud–water mixing ratio, liquid water content, and droplet number concentration in the model are the main factors affecting the atmospheric horizontal visibility distribution [16,18]. Stoelinga and Warner [21] and Guo et al. [18] showed the relationship between the visibility and the cloud–water mixing ratio by using the WRF model simulation and observations. Fog is typically a low-level cloud formed near the surface, and its main components are liquid droplets, such as clouds. Therefore, the change in fog can be attributed to the increase or decrease in the cloud–water mixing ratio. This process is related to factors, such as wind, temperature, humidity, radiation, atmospheric stability, and turbulent mixing.
Owing to limited direct observational data on the occurrence of sea fog events in the West Sea and challenges in identifying factors to estimate corrections at sea from numerical experimental results, accurate analysis and objective forecasting of sea fog are challenging [22]. Recently, efforts have been made to simulate and predict fog environments using numerical models by analyzing fog formation mechanisms through the assimilation of satellite data [23,24,25]. In Korea, Hwang and Chang [12] recently analyzed changes in sea fog formation and inflow patterns along the west coast following the construction of the Saemangeum Seawall. They provided a statistical summary highlighting a reduction in sea fog inflow at Gunsan Airport and an increase in stratified clouds, attributing these phenomena to the increase in sea temperature inside the Saemangeum Seawall. This study conducted numerical experiments based on the WRF model to simulate the meteorological environment around Gunsan Airport following the construction of the Saemangeum Seawall and to introduce a new approach for analyzing changes in sea fog inflow characteristics through variations in related influencing factors. Specifically, the study analyzed the spatiotemporal variations in cloud–water mixing ratio, buoyancy frequency, turbulent kinetic energy, wind shear, temperature, and wind speed, with the aim of identifying the causes of changes in sea fog inflow characteristics.

2. Data Source and Model Introduction

2.1. Introduction of the Saemanguem Seawall

Shin [26] compared satellite images from 1984, before the completion of the Saemangeum Seawall, and 2020, after the completion of the Saemangeum Seawall, as shown in Figure 1. In 1989, the sea was smooth, and the west and south of the Gunsan Airport, marked with yellow dots, were in contact with it (Figure 1a). In 2020, following the completion of the Saemangeum Seawall, many reclamation projects were conducted, which appeared gray in Figure 1b. The change in topography around Gunsan Airport, highlighted by yellow dots, was large and located inland away from the coastline. The Saemangeum Seawall, completed in 2010, is a 33.9 km-long sea structure with an average height of 11 m above sea level. This project converted the coastal structure of seawater and mudflats into land and lake, creating 291 km2 of reclaimed land. The sea environment west of Gunsan Airport underwent substantial change compared to conditions before construction. Approximately 100,000 tons of sand are deposited per year because of the steady inflow of sediments from the Mangyeong and Dongjin rivers in the inner sea of the seawall, which increases the area of the intertidal zone and typically decreases the water depth within 6 m, and the depth of the tidal zone remains shallow [27].

2.2. Data Source

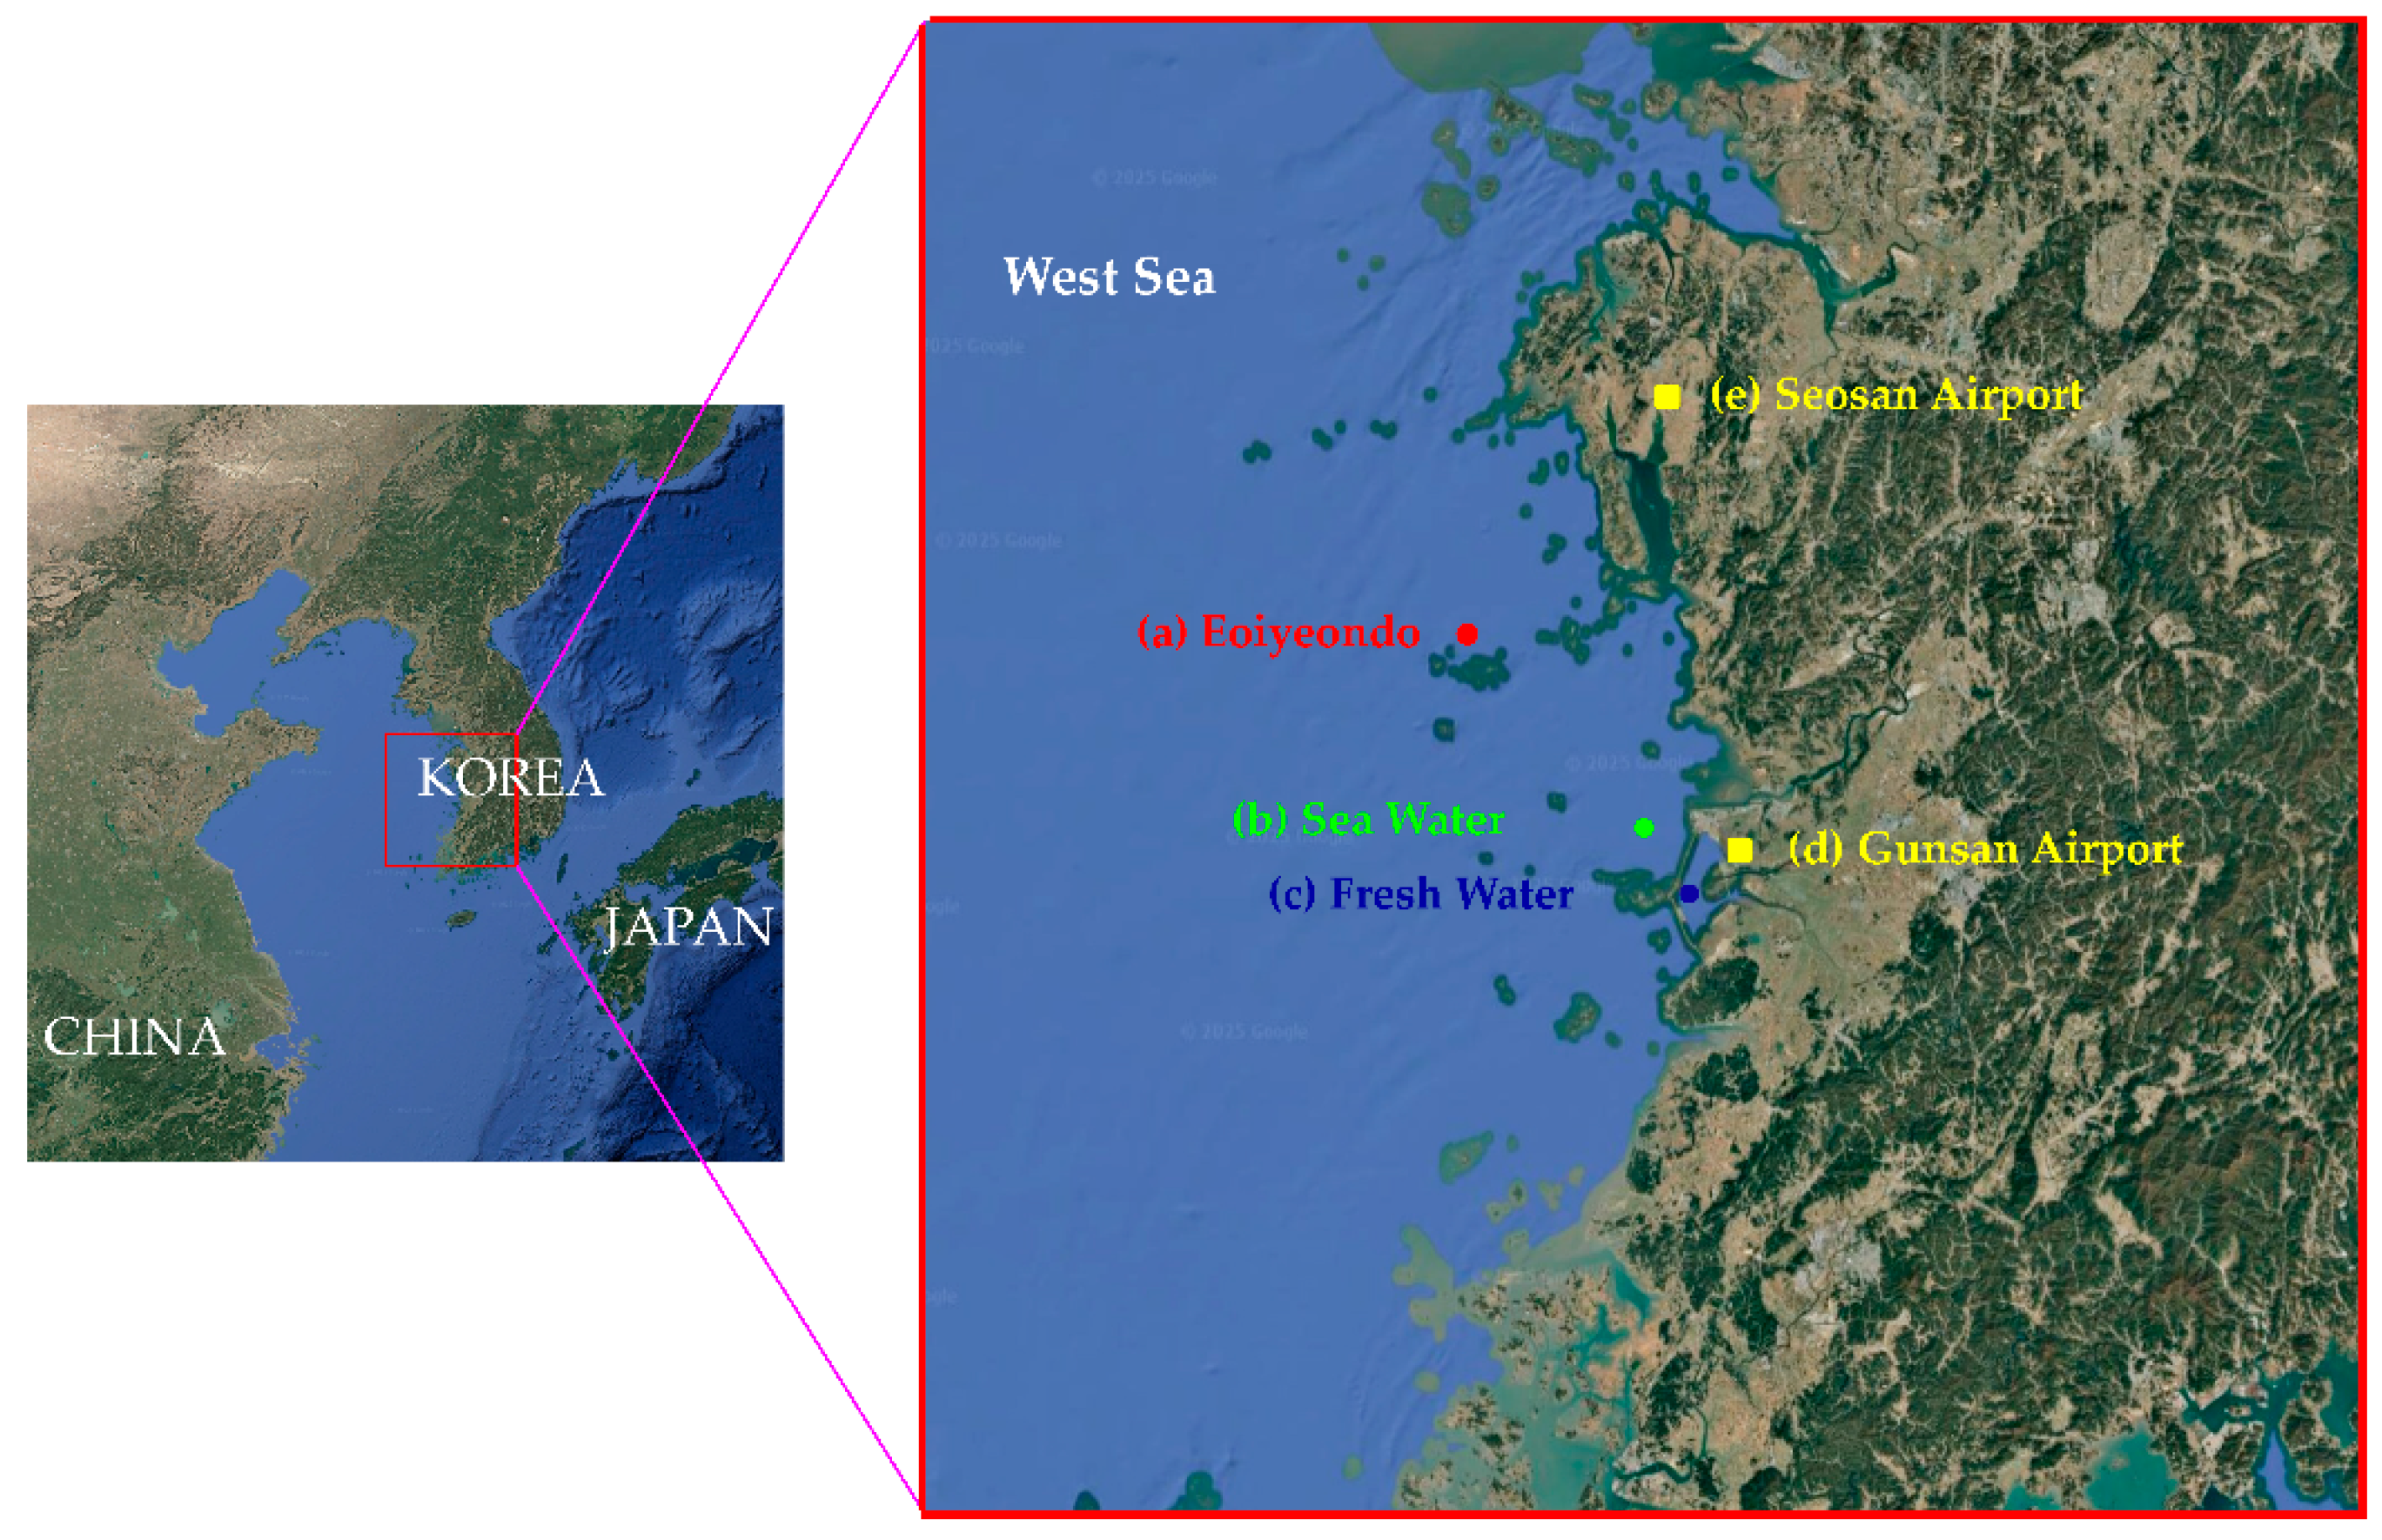
Figure 2 shows the location of two airports and three SST observation points along the west coast of Korea, and the following data are used in this study [28].
(1)
Meteorological Aviation Report (METAR) of Gunsan Airport: Visibility, cloud ceiling, wind speed, temperature, and humidity data were obtained from the METAR of Gunsan Airport, where observations were conducted every hour from 2000 to 2019.
(2)
METAR of Seosan Airport during the same period: Seosan Airport, highlighted by a yellow square in Figure 2, is also adjacent to the west coast and has similar characteristics of frequent sea fog to Gunsan Airport; therefore, the visibility and cloud ceiling data of Seosan Airport were used as environmental data to compare sea fog changes at Gunsan Airport after the construction of the Saemangeum Seawall.
(3)
The monthly mean SST for 2010–2023 observed in the weather bouy of Eoiyeondo (red dot in Figure 2).
(4)
The monthly mean SST in 2023 at two locations on and around the Saemangeum Seawall.
In Figure 2, the green dot (35.905° N, 126.441° E) located outside the seawall is a representative point of the seawater zone, and the blue dot (35.812° N, 126.554° E) located inside the seawall is a representative point of the freshwater zone. The monthly mean data of the SST were calculated every 3 h between January and December 2023 using the Geostationary Korea Multi-Purpose Satellite 2A (GK-2A, developed and operated by KMA) observation data on the Korean Peninsula (Source: Korea Meteorological Administration [KMA] open MET Data Portal). Since the environment inside the seawall continues to change even after its completion, the SST data from 2023 were selected for comparison, as they best represent the most recent state of change.

2.3. Model Introduction

WRF v4.2.2 was used as the model (Table 1). The Thompson microphysics scheme is a comprehensive microphysical parameterization capable of accurately simulating various phase transitions of water vapor, including fog, cloud, precipitation, and sea fog. The RRTMG is a radiation (radiative transfer) scheme used in WRF and stands for Rapid Radiative Transfer Model for GCMs. It is an improved package designed for fast and accurate use in GCMs and mesoscale models. It includes both longwave and shortwave modules. The west coast area was divided into two domains for analysis: Domain 1, with a horizontal resolution of 2.5 km, was used to analyze the southern West Sea area, and Domain 2, with a horizontal resolution of 0.5 km, was used to analyze the Gunsan Saemangeum Seawall area (Figure 3). The ECMWF Reanalysis 5th Generation (ERA5 Reanalysis) was used for the initial and lateral boundary, and the Optimum Interpolation Sea Surface Temperature (OISST) data were used for seawater temperature.

3. Methodology

3.1. Statistical Approach

Using observation data from Gunsan Airport, we analyzed changes in sea fog patterns entering Gunsan Airport from the West Sea by comparing various weather factors. A statistical approach was applied to evaluate the impact of the artificial Saemangeum Seawall on weather changes at Gunsan Airport, and the t-test was used to analyze the significance of the change (see Table 1 from Hwang and Chang [12]).
First, we analyzed the changes in the number of fog occurrence days observed at Gunsan and Seosan airports before and after the completion of the Saemangeum Seawall. For comparison, data from the 10 years before and after the completion of the Saemangeum Seawall were analyzed. At Gunsan Airport, the average monthly sea fog occurrence days decreased from 2.6 to 1.9 days after the completion of the seawall, indicating a decrease of 0.7 days per month; however, this change was not statistically significant. In particular, during the heavy fog season From March to July, the average monthly fog days decreased from 3.4 to 2.5 days, a decrease of 0.9 days (statistically significant change at the p < 0.05 level). In contrast, at Seosan Airport, the annual reduction in fog occurrence averaged 0.2 days per month, while during the heavy fog season, the reduction was only 0.1 days per month, showing opposite results that were not statistically significant.
The number of stratus (ceiling height below 600 m) occurrence days at Gunsan Airport was compared with the average ceiling height change before and after the construction of the Saemangeum Seawall. For Gunsan Airport, the average ceiling height increased from 203 to 264 m, a statistically significant increase of 61 m (statistically significant change at the p < 0.01 level). In contrast, at Seosan Airport, the number of stratus occurrence days decreased by an average of 0.3 days per month, and the average ceiling height changed from 269 to 246 m, resulting in a decrease of 23 m, though this change was not statistically significant. Assuming that the change at Seosan Airport is an environmental change, this change at Gunsan Airport is considered unique and abnormal, and in this study, this was attributed to the influence of the Saemangeum Seawall.
Table 2 presents a comparison of the SST observed at the three locations in the West Sea shown in Figure 2, along with the distribution of monthly mean air temperatures at Gunsan Airport during the 10 years following the construction of the Saemangeum Seawall. As the environment inside the seawall continues to change following its completion, we selected 2023 SST to best represent the latest conditions and employed them in the experiments. The trend based on the monthly SST change showed a similar pattern; however, between March and July, freshwater was the highest, decreasing in the order of seawater and Eoiyeondo. An analysis of the distribution of the average water temperature values by point revealed that the values of the Eoiyeondo and the seawater point showed similar characteristics at 15.7 and 15.4 °C, respectively. However, inside the seawall, it showed a high distribution at 16.4 °C, indicating that substantial desalination has progressed since the completion of the seawall. Considering the mechanism by which warm air passing over the cold sea surface of the West Sea generates fog, it was observed that from April to July, when sea fog frequently occurs, the SST outside the Saemangeum Seawall and at Eoiyeondo was lower than the air temperature, creating favorable conditions for sea fog formation. In contrast, the SST inside the seawall was higher than the air temperature, which led to fog dissipation. Therefore, the high-temperature water mass inside the seawall, along with the resulting updrafts, influenced fog dissipation and lifting of the stratus ceiling. This study aimed to verify these findings through model experiments.

3.2. Experimental Settings

In this study, 2 cases (19 May 2000 and 20 April 2001) when actual sea fog occurred before the construction of the seawall were selected, and the weather environment on that date was reproduced using the WRF model reanalysis data. Since the construction of the Saemangeum seawall structure began in June 2001, dates with dense sea fog that occurred before any influence of the seawall were selected. By applying the current changes to the reanalysis data for those dates, the effects of the Saemangeum seawall were examined by analyzing the variations in sea fog and related meteorological factors. The first case (19 May 2000, hereafter case 1) is identified as a large-scale sea fog event that is broadly distributed over the West Sea of Korea, while the second case (20 April 2001, hereafter case 2) is analyzed as a small-scale (coastal) sea fog event that occurs locally near the coastal boundary. In this study, four experiments were conducted using two factors: the first factor was the seawall structure, and the second was the increased SST inside the seawall after its completion. The details are described below and presented in Table 3.
(1) CTRL experiment: An experiment that did not define either the seawall structure or SST changes to identify the weather environment during sea fog inflow. (2) CWALL experiment: An experiment that defined only the structure of the seawall without SST changes to analyze the impact of the seawall structure. (3) HISST experiment: An experiment that did not define the structure of the seawall but only the changes in sea level temperature inside the seawall to analyze the effect of increasing SST. (4) ALL experiment: An experiment that defined both the structure of the seawall and changes in the SST to identify the weather environment after the construction of the seawall.
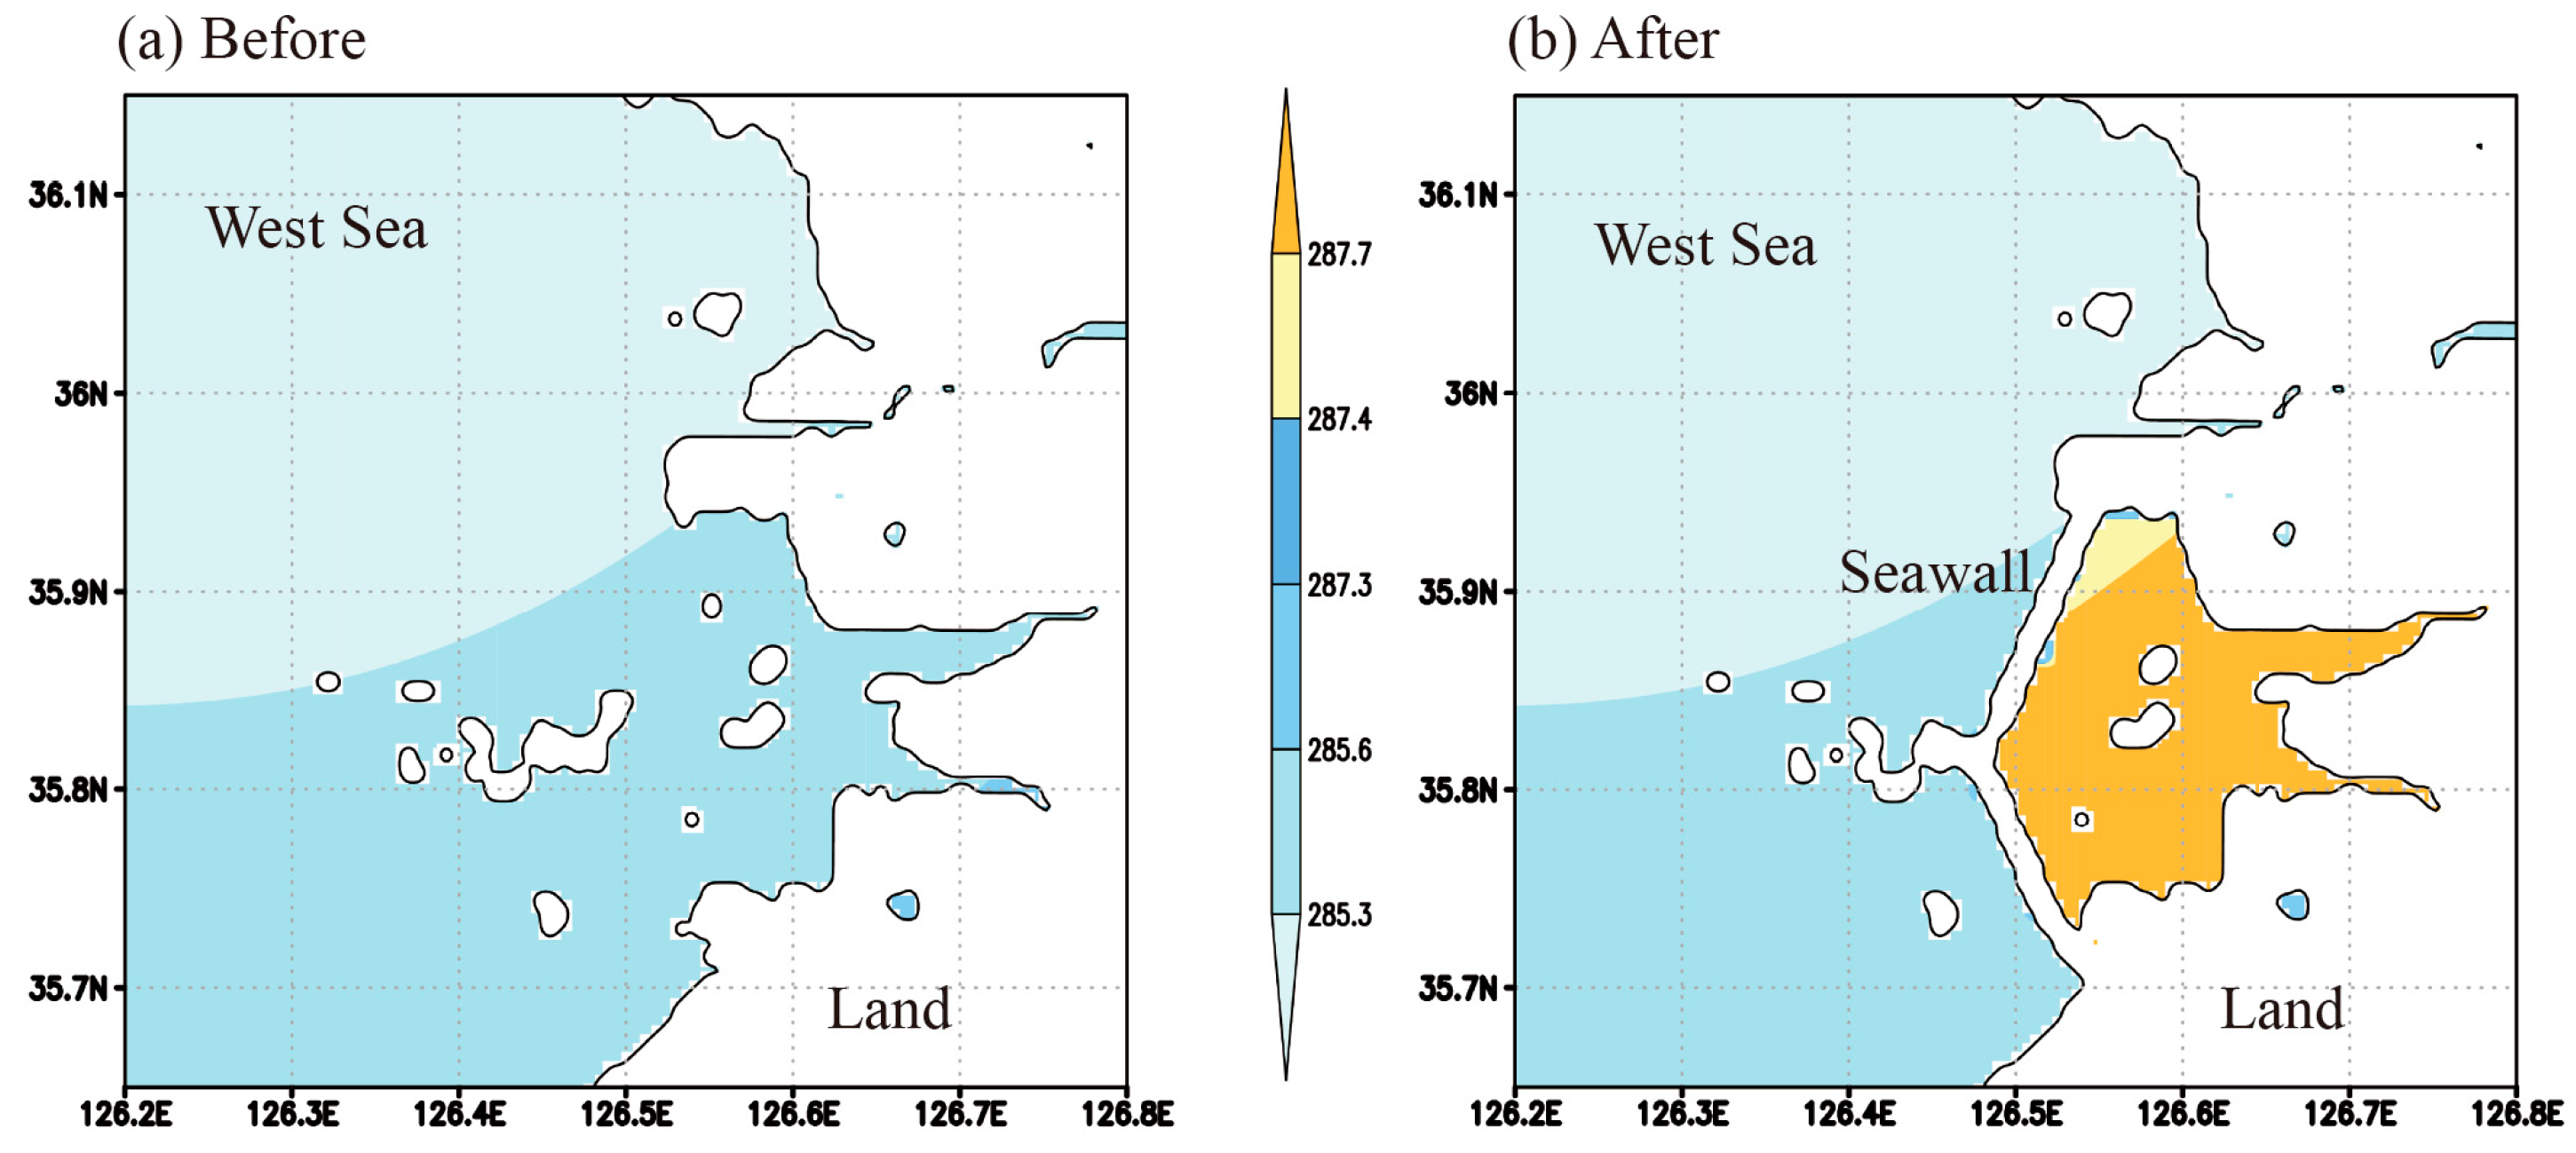
The Saemangeum Seawall structure applied to the experiment was set to an urban and built-up land type using high-resolution Environmental Geographic Information System (EGIS) data, which provides environmental spatial information, through the classification table of the US Geological Survey. The height of the Saemangeum Seawall was set to 11 m using the Fortran program, and the result is shown in Figure 4 below.
The SST data were obtained from OISST. As presented in Table 2, the SST distribution inside and outside the seawall revealed temperature differences in +1.6 K in April and +2.4 K in May, when the case days were included. To evaluate the effect of the increase in SST, the SST inside the seawall was forcibly adjusted in the HISST and ALL experiments, as shown in Figure 5. Using these experiments, we aimed to identify the individual effects of topographic changes and SST variations before and after the construction of the Saemangeum Seawall and to analyze the influence of construction on changes in sea fog inflow characteristics at Gunsan Airport.

4. Results

Model Experiments

Fog forms when water vapor condenses into suspended droplets in the lower atmosphere. The cloud–water mixing ratio (qc) is a key diagnostic variable for fog formation and dissipation [16,18]. In this study, the vertical distribution of cloud–water mixing ratios on the two days when thick sea fog occurred was examined, and the deviation between each experiment was analyzed to determine the characteristics of fog flowing into Gunsan Airport by analyzing the presence or absence of the seawall structure and the effect of rising SST inside the seawall.
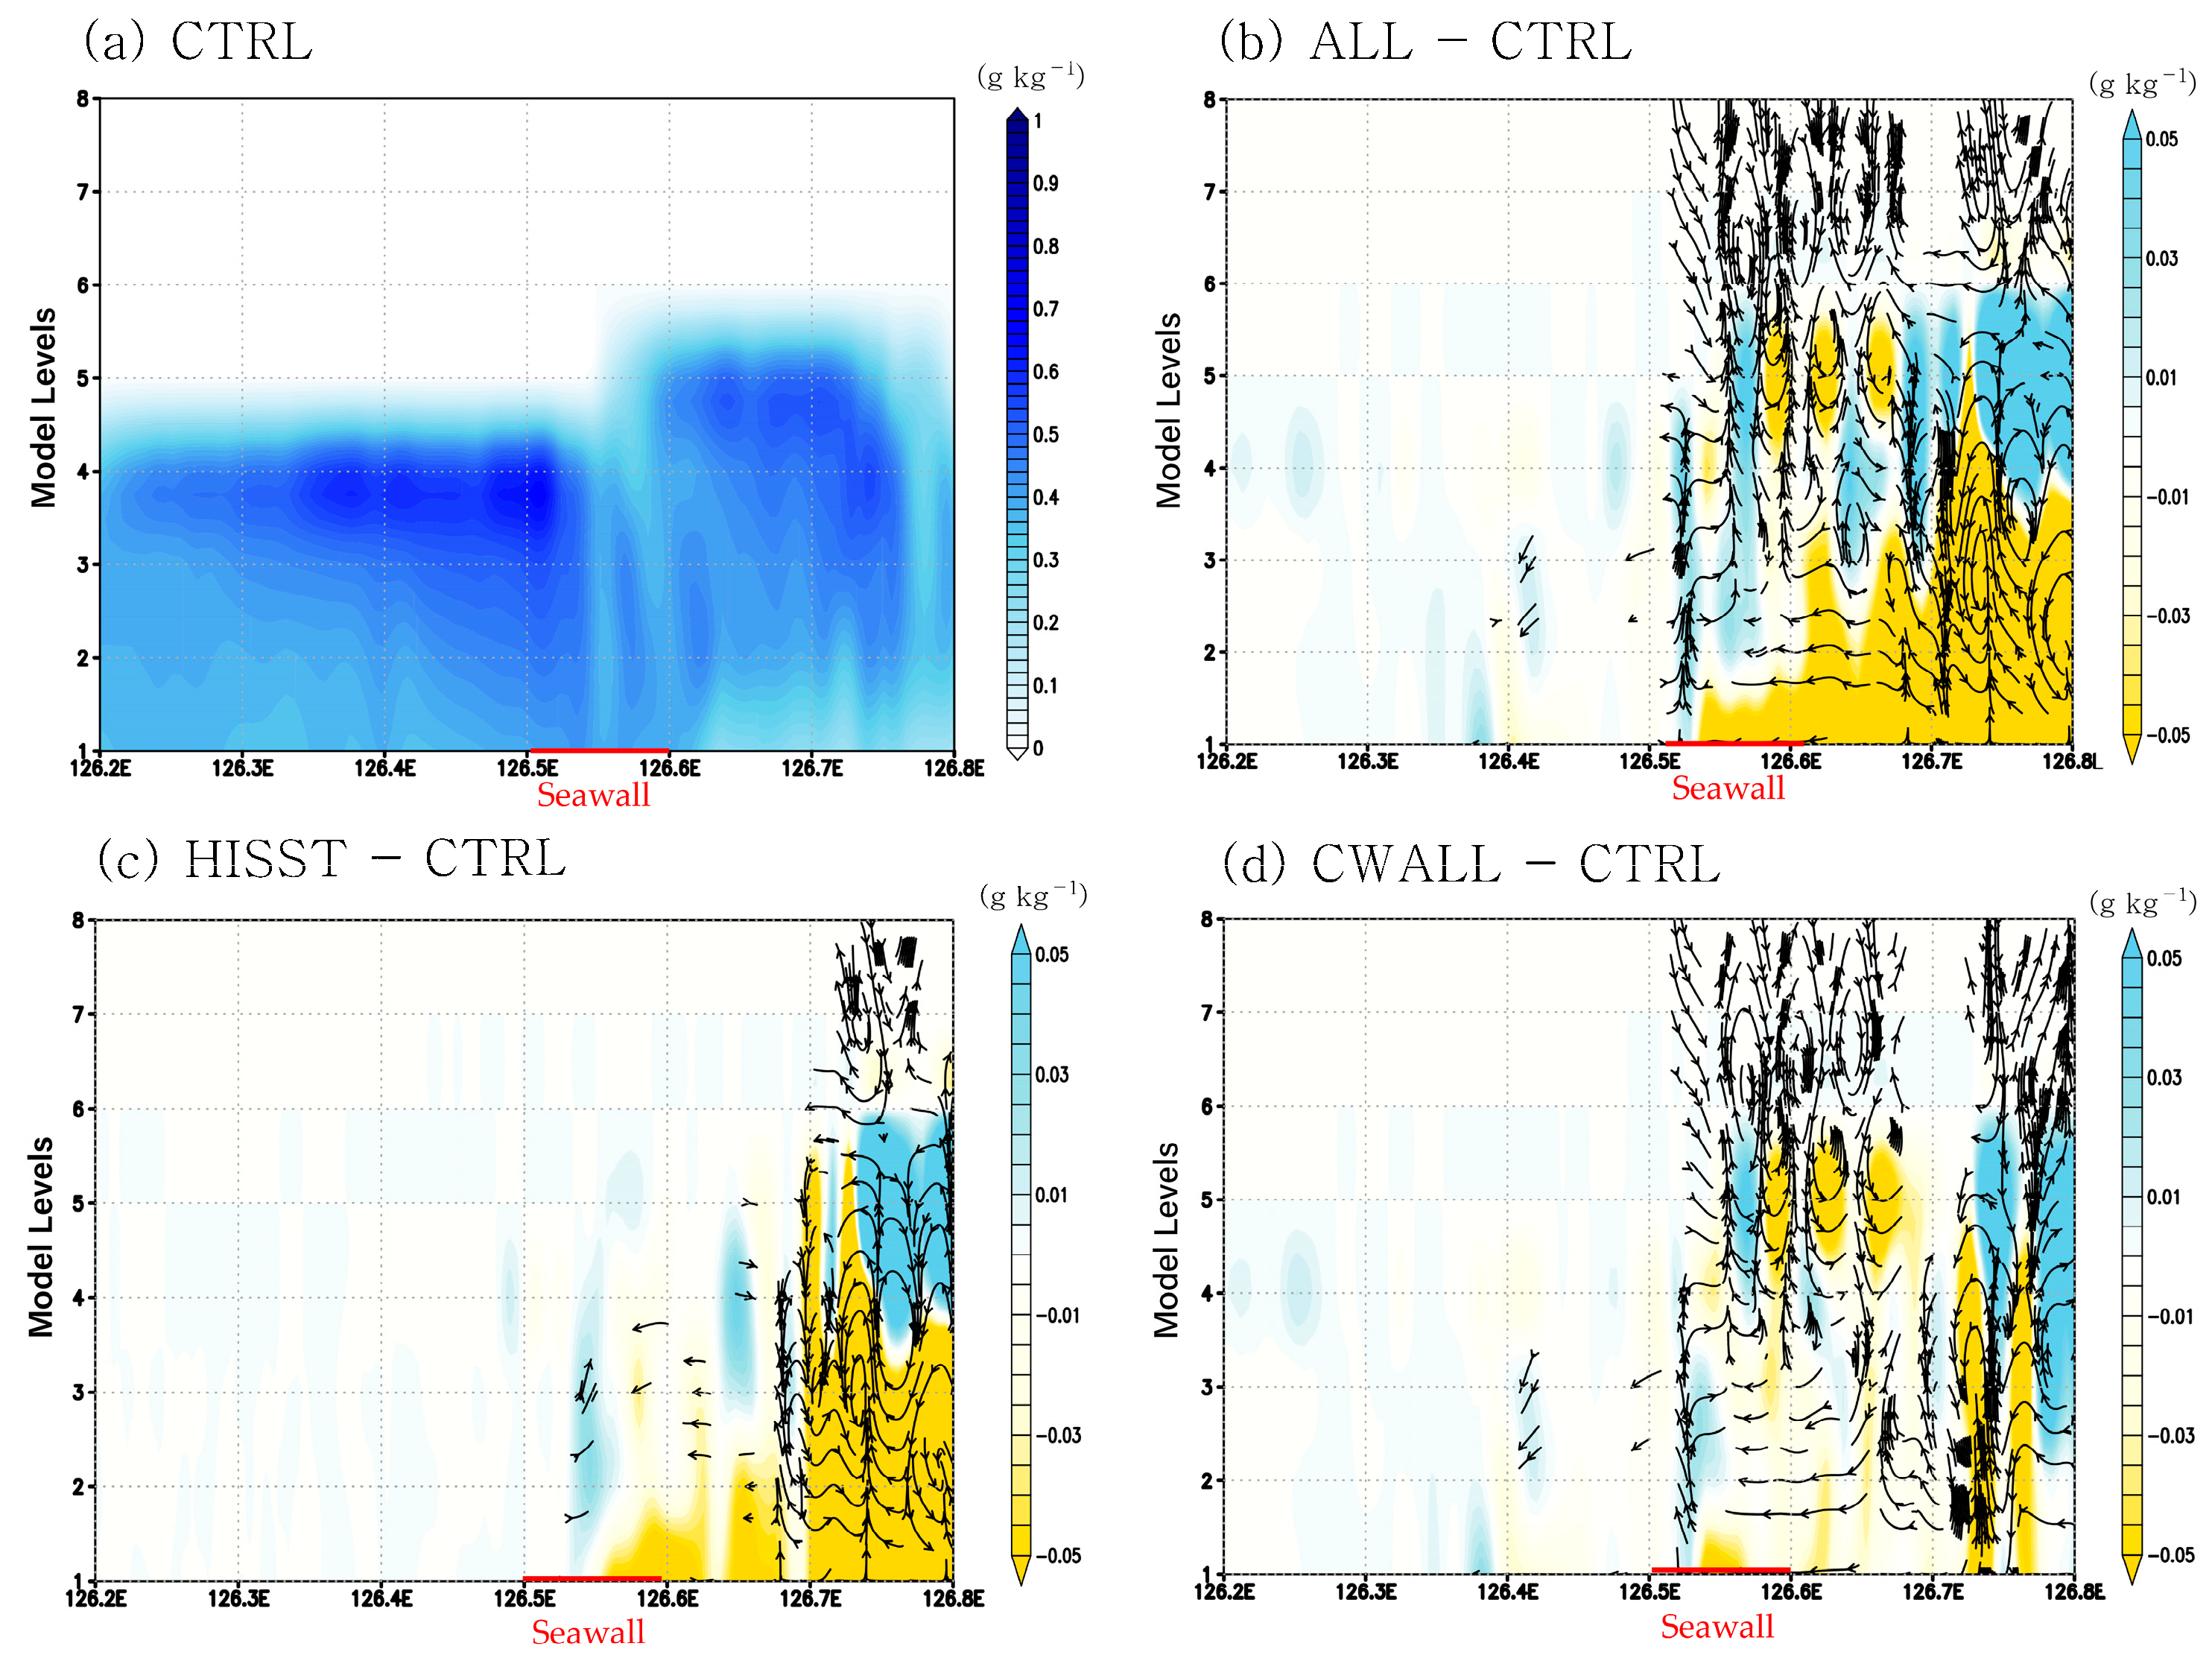
Figure 6 shows the results of the experiment conducted for case 1 (19 May 2000). The red solid line at the bottom of the figure indicates the location of the Saemangeum Seawall. In the CTRL experiment (Figure 6a) conducted without forcing, blue area represents the distribution of the cloud–water mixing ratio, indicating that the inflow of sea fog was well captured. As the fog passed the seawall and approached the coast, the cloud–water mixing ratio near the surface tended to weaken slightly, while the fog layer became elevated. This phenomenon is likely attributed to several factors, including increased surface friction, rising coastal temperatures, and the development of upward air motion. For reference, in Figure 6b–d, blue indicates an increase in the cloud–water mixing ratio, while yellow denotes a decrease. The black arrows represent the u and w wind components. In Figure 6b, the deviations between the ALL experiment, in which both SST and seawall changes were implemented, and the CTRL experiment showed a tendency for the cloud–water mixing ratio to decrease in the surface layer and increase in the upper layer inside the seawall, as well as enhanced updrafts near the seawall and around the airport. In Figure 6c, the deviations between the HISST experiment, in which the SST increased, and the CTRL experiment revealed a similar pattern to that in Figure 6b, with a substantial decrease near the surface inside the seawall and an increase in the upper layer. Wind analysis further indicated strengthened updrafts over the sea surface inside the seawall, which were attributed to the SST increase. In Figure 6d, the deviations between the CWAL experiment, in which the seawall structure was implemented, and the CTRL experiment also showed a tendency for the cloud–water mixing ratio to decrease near the surface and increase in the upper layer, although the changes were relatively weak. Wind analysis revealed updrafts near the seawall and around the airports.
Overall, the results indicated that difference between the HISST and the CNTL experiments (Figure 6c), which analyzed the effects of the SST increase, exhibited patterns more similar to the difference in Figure 6b, in which all changes were applied, than to difference in Figure 6d, which represented the seawall effect. In both Figure 6b,c, the updrafts over and inside the Saemangeum Seawall were more strongly enhanced. Therefore, in the experiment applying the sea fog case on 19 May 2000, the cloud–water mixing ratio significantly decreased over and inside the seawall, accompanied by intensified updrafts. These results evidently illustrate that, following the completion of the seawall, sea fog inflow decreased, and the stratus cloud ceiling height increased. Additionally, the influence of the SST increase was greater than that of the seawall structure. This further suggests that large-scale sea fog is predominantly controlled by environmental factors (e.g., sea surface temperature) rather than by small-scale, local factors such as seawall construction.
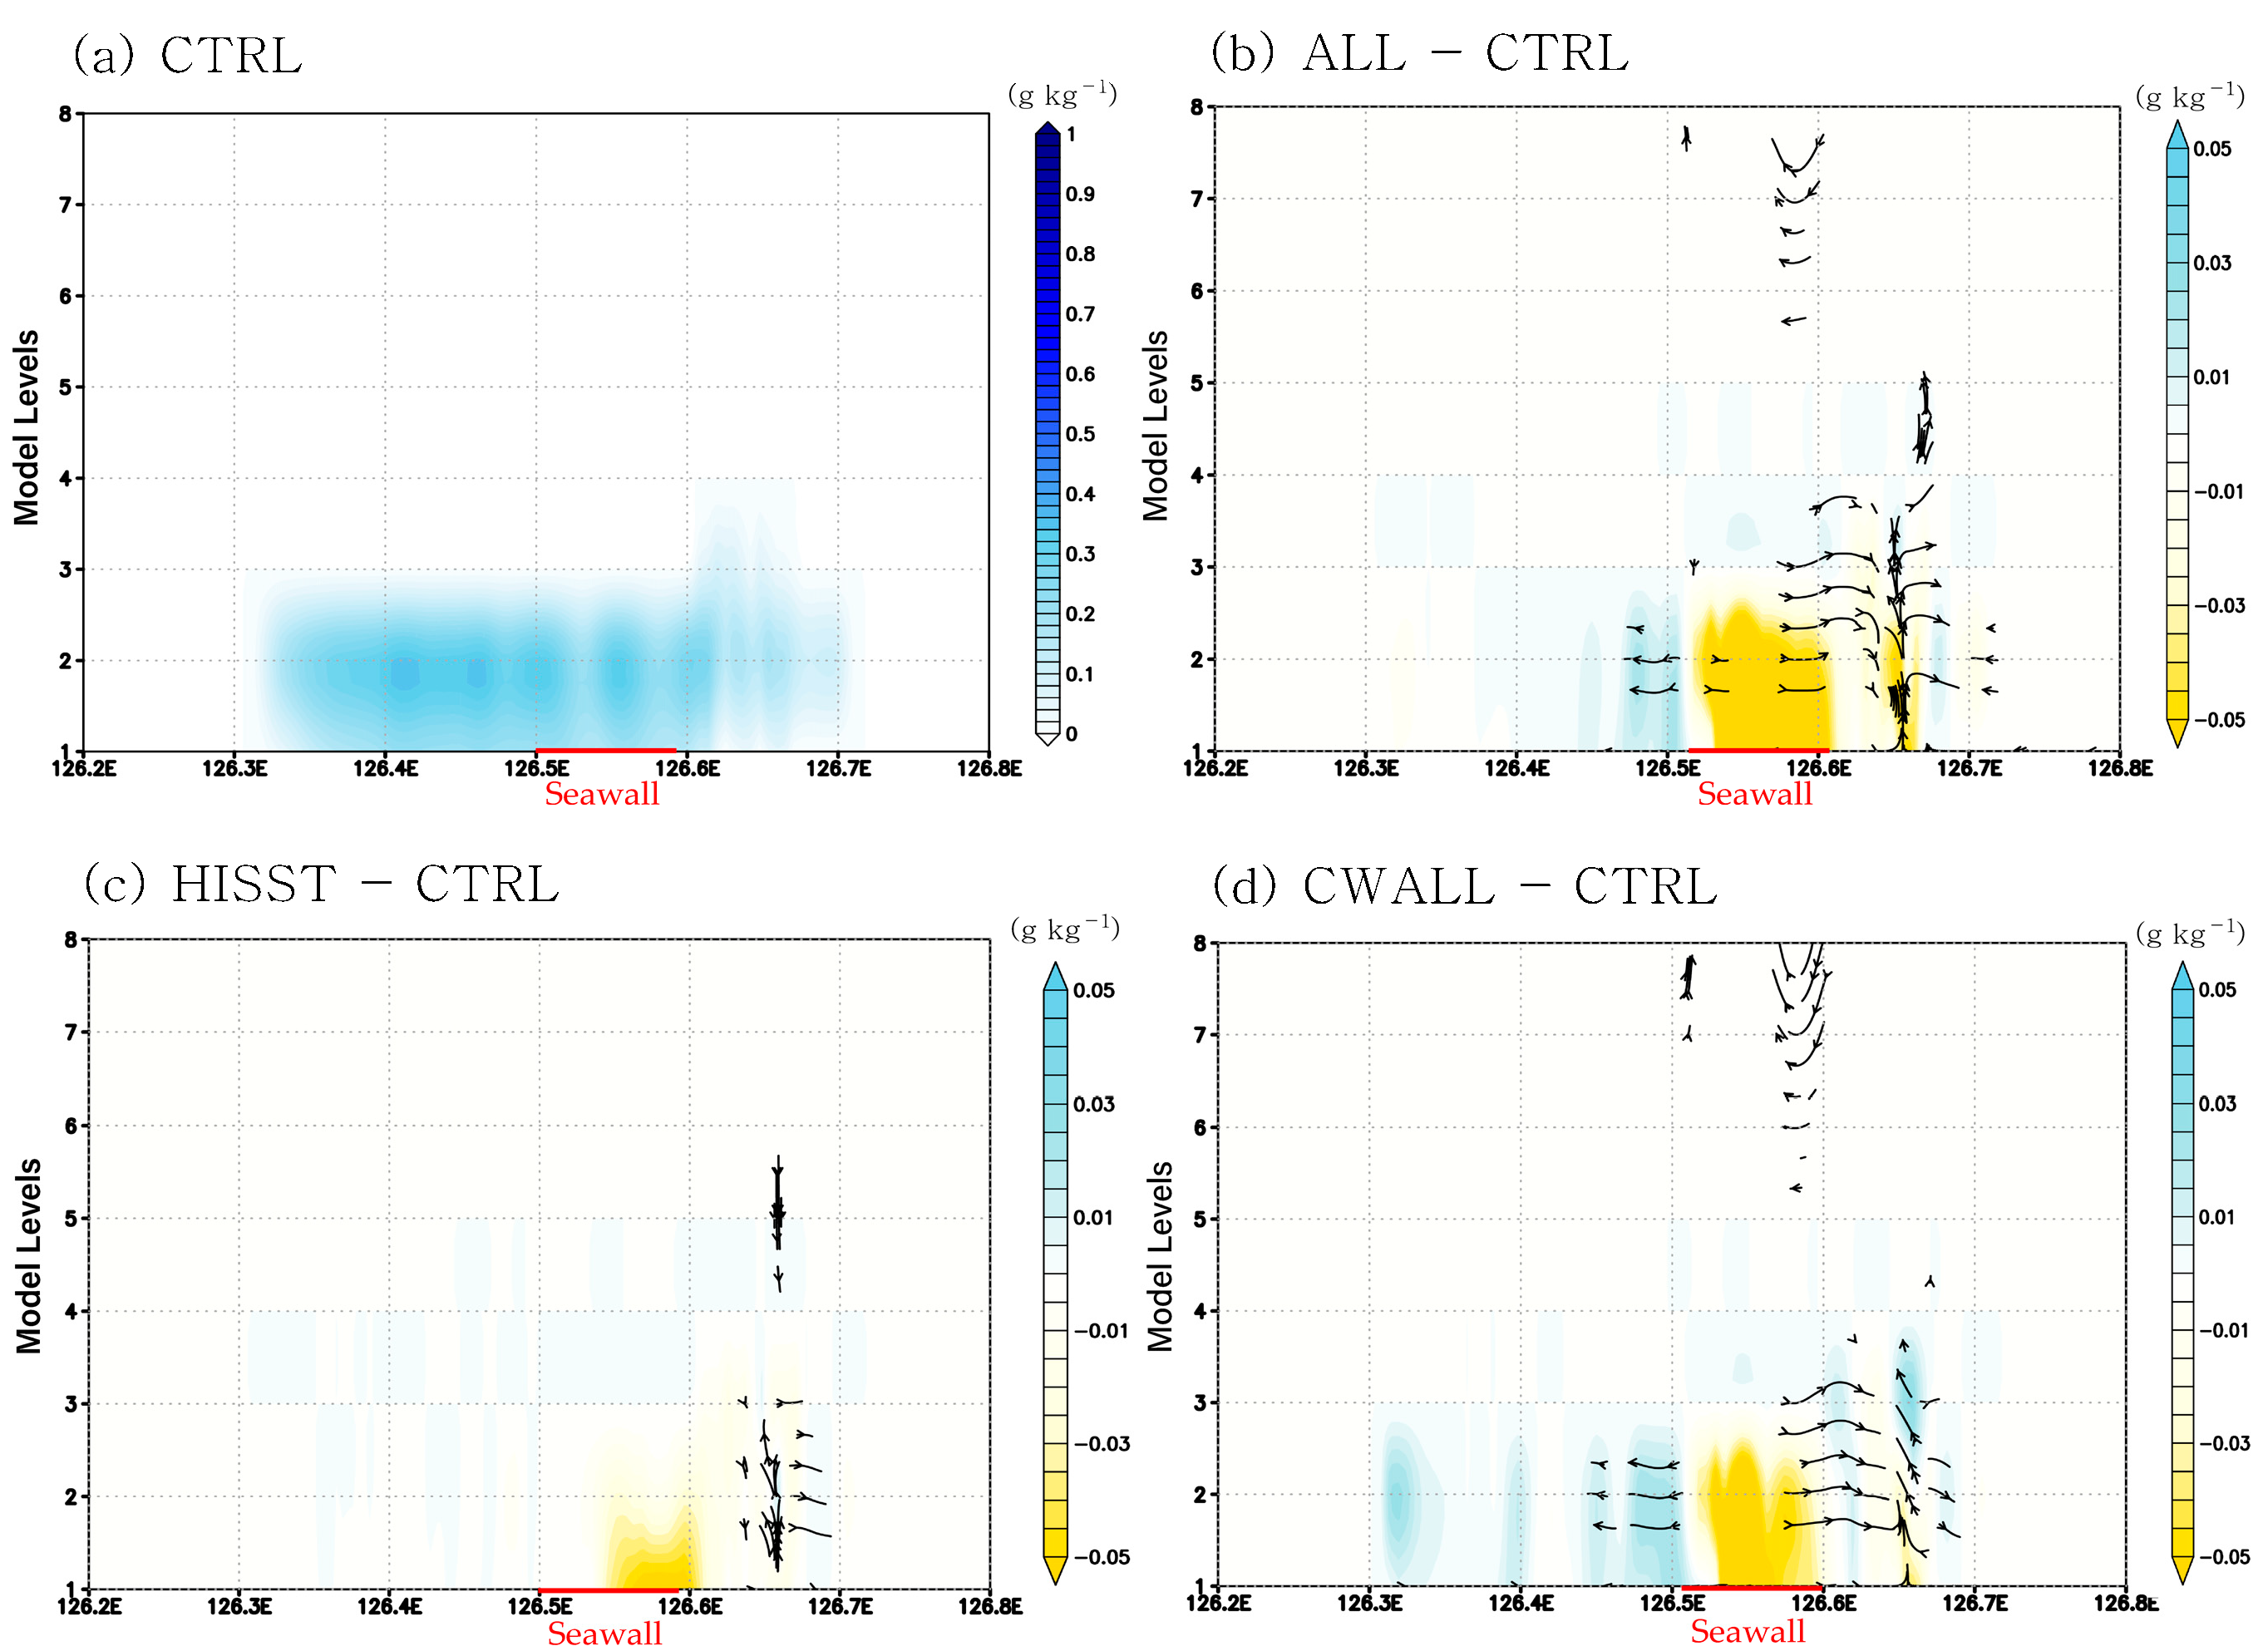
Figure 7 shows the experimental results and differences for case 2 (20 April 2001). In the CTRL experiment (Figure 7a), the cloud–water mixing ratio was thinner in depth and weaker in intensity than in case 1 but evidently showed sea fog being extensively distributed in the lower layer and continuously advected, with a slight weakening in the surface layer as it advected over the seawall. Figure 7b shows the deviations between ALL and CTRL experiments. Inside the seawall, the cloud–water mixing ratio decreased in the surface layer, whereas a slight increase was observed in the upper layer and in front of the seawall. The wind field revealed a pattern of subsidence, followed by rapid upward motion inside the seawall. In Figure 7c, the deviations between the HISST and CTRL experiments were relatively weaker but showed results similar to those in Figure 7b–d The deviations between the CWALL and CTRL experiments also showed a slight increase along the surface layer in front of the seawall, followed by a substantial decrease as it advected over the seawall, with increased updrafts observed inside the seawall. For case 2, except for the CWALL–CTRL experiment, which represented the seawall effect and exhibited the situation more effectively, the results showed similar distributions, although relatively weaker. The differences between the two case days were attributed to variations in the thickness of the fog layer and prescribed SST values for each scenario.
The experimental results for the two cases indicate that following the construction of the Saemangeum Seawall, the distribution of the cloud–water mixing ratio advected from the West Sea to Gunsan Airport weakened in the surface layer but strengthened in the upper layer, with updrafts developing over and inside the seawall. These changes can account for the observed weather conditions at Gunsan Airport, where sea fog occurrence in the lower layer decreased, and the stratus ceiling height increased. The primary factors responsible for these changes are likely the seawall structure, high SST inside the seawall, and the resulting generation of updrafts. In contrast to large-scale sea fog, small-scale sea fog events like Case 2 demonstrate greater sensitivity to small-scale factors such as seawall construction rather than to large-scale environmental factors.
In addition, we analyzed several factors related to fog formation and dissipation to determine the cause of the experimental results. As previously mentioned, the change in fog can be interpreted as an increase or decrease in the cloud–water mixing ratio, and this process is intertwined with several factors, including wind, temperature, humidity, radiation, atmospheric stability, and turbulence mixing. The effects of surface atmospheric environmental characteristics on sea fog include the wind field, ocean currents, temperature, and atmospheric stability [15]. Lower layer humidity decreases owing to an increase in vertical mixing and an increase in lower layer wind speed in the fog dissipation phase [20]. Therefore, this study compared factors, such as buoyancy frequency, TKE within the PBL, vertical shear, temperature, and wind speed, to analyze the causes of typical changes in the inflow of sea fog at Gunsan Airport following the completion of the Saemangeum Seawall using the previous experiment.
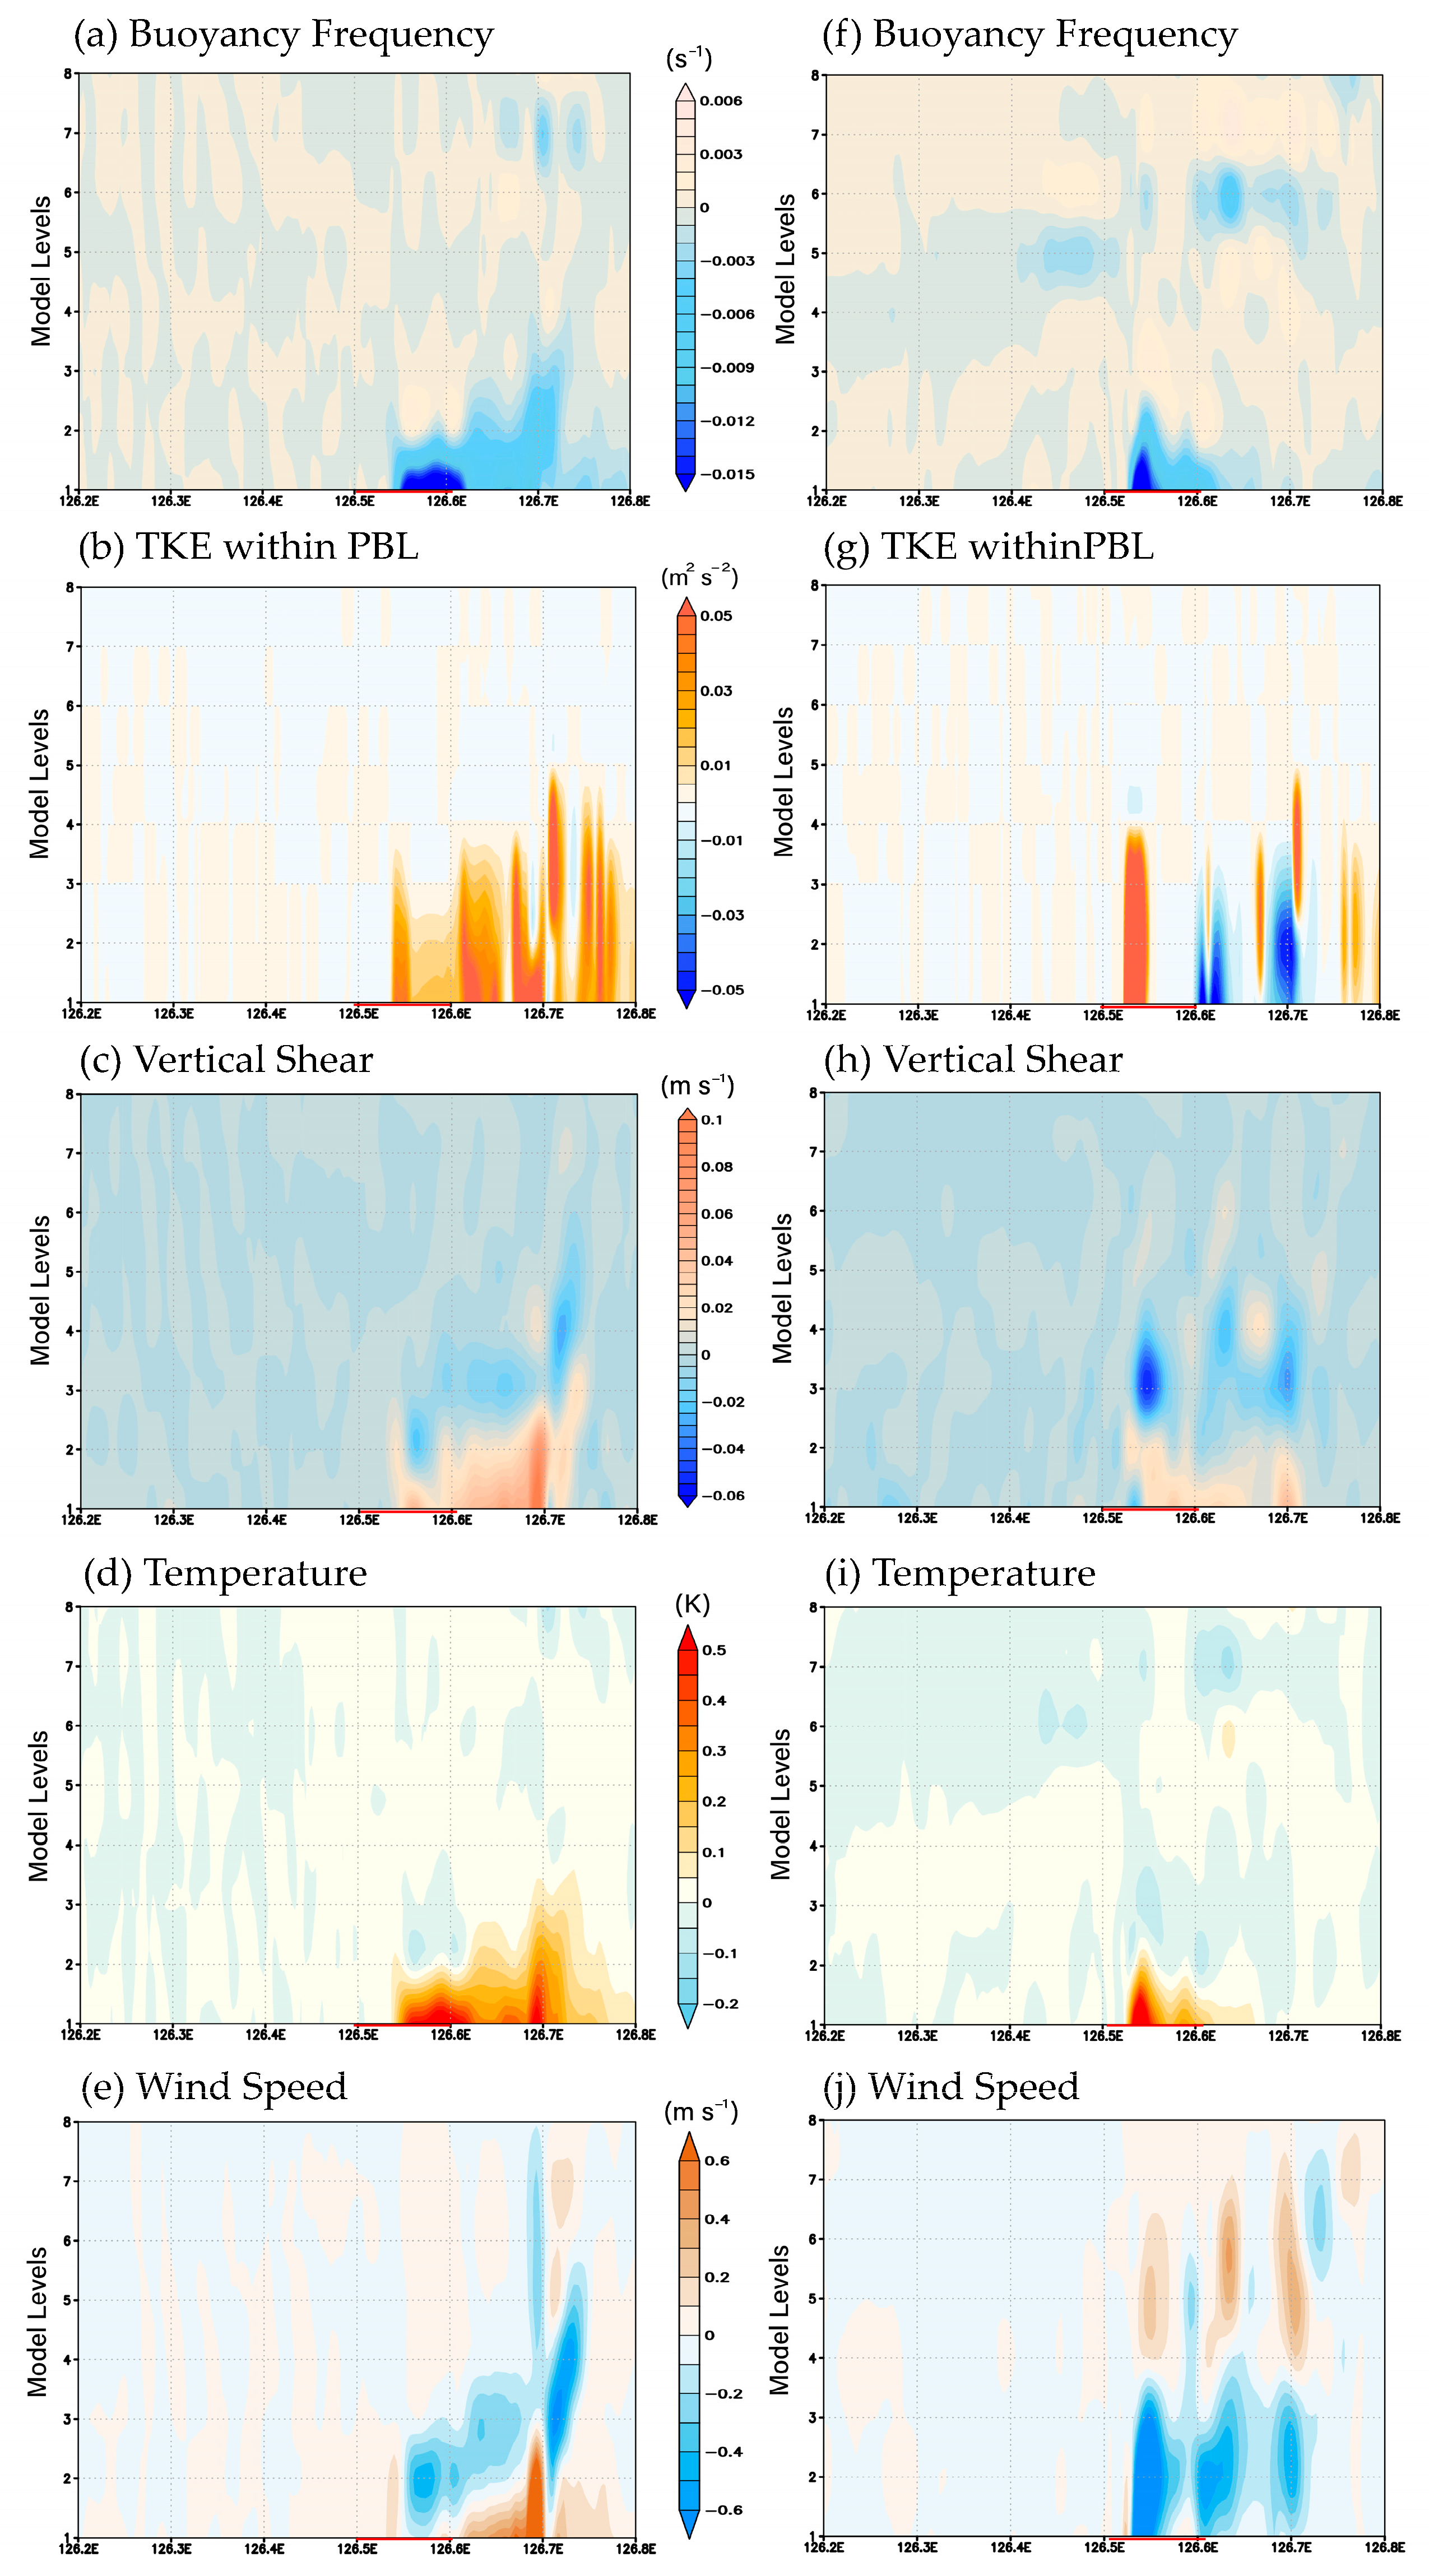
In the previous analysis, the cloud–water mixing ratio on the ground weakened as it flowed into the Saemangeum Seawall and strengthened in the upper layer. Figure 8 shows the changes in the elements of the scenario on case 1 (19 May 2000), and the cause of the changes in various factors, such as buoyancy frequency, TKE within the PBL, vertical shears, temperature, and wind speed. Figure 8a–e focuses on the influence of SST by calculating the deviation between the HISST and CTRL experiments. Figure 8f–j focuses on the influence of the seawall structure by calculating the deviation between the CWALL and CTRL experiments.
By examining the changes in the buoyancy frequency (Figure 8a,f), both experiments showed that the surface layer inside the seawall decreased. The horizontal reduction range was wider in the HISST experiment (Figure 8a), and the vertical reduction was large because of the influence of the CWALL experiment (Figure 8f). The buoyancy frequency (Brunt–Väisälä frequency) is defined as follows. Here, N (rad s−1) denotes the Brunt–Väisälä frequency, g (≈9.81 m s−2) is the gravitational acceleration, θ (K) is the potential temperature, and z (m) represents the height.
N = g θ d θ d z
Durran et al. [29] demonstrated that buoyant frequencies are involved in the stability of the atmosphere and moisture processes. A negative N2 indicates an unstable atmosphere, resulting in an enhanced upward flow and the air ascending higher. When the ascending air reaches the dew point, water vapor condenses to form clouds. Thus, both experiments were analyzed as situations in which instability was enhanced, and air currents were observed to increase, facilitating clouds to strengthen more than fog.
TKE within the PBL represents the kinetic energy associated with turbulence vortices within the PBL. The lowest part of the Earth’s atmosphere is directly affected by the surface, which is important for understanding vertical mixing, momentum, heat, and moisture transfer within the PBL, and is used to parameterize turbulence mixing. Turbulence mixing increased in both experiments, with the HISST experiment showing a wide area of increase inside the seawall (Figure 8b), and the CWALL experiment showing a narrow and substantial increase inside the seawall (Figure 8g), followed by a decrease and an increase in range intersecting. Morrison et al. [30] revealed that vertical shear maintains upward-moving air parcels in a vertical orientation, thereby contributing to cloud formation. In both the experiments shown in Figure 8c,h, the vertical shear increased in the surface layer but decreased in the upper layer. As shown in Figure 8d,i, temperature changes facilitate the formation of clouds, as air, which has risen because of the temperature difference between the upper and lower layers, cools with adiabatic expansion to reach saturation, showing a substantial increase in the surface layer in both experiments and a stronger and more widespread distribution in HISST experiment (Figure 8d). For wind speed, the results of the two experiments were different; however, the HISST experiment (Figure 8e) showed a structure that increased in the lower layer and decreased in the upper layer, which could promote upward motion inside the seawall, dissipate fog, and strengthen the formation of laminar clouds. In contrast, the CWALL experiment (Figure 8j) showed a distribution that decreased in the lower layer and increased in the upper layer due to the effect of seawall; however, the irregular distribution enhanced atmospheric instability.
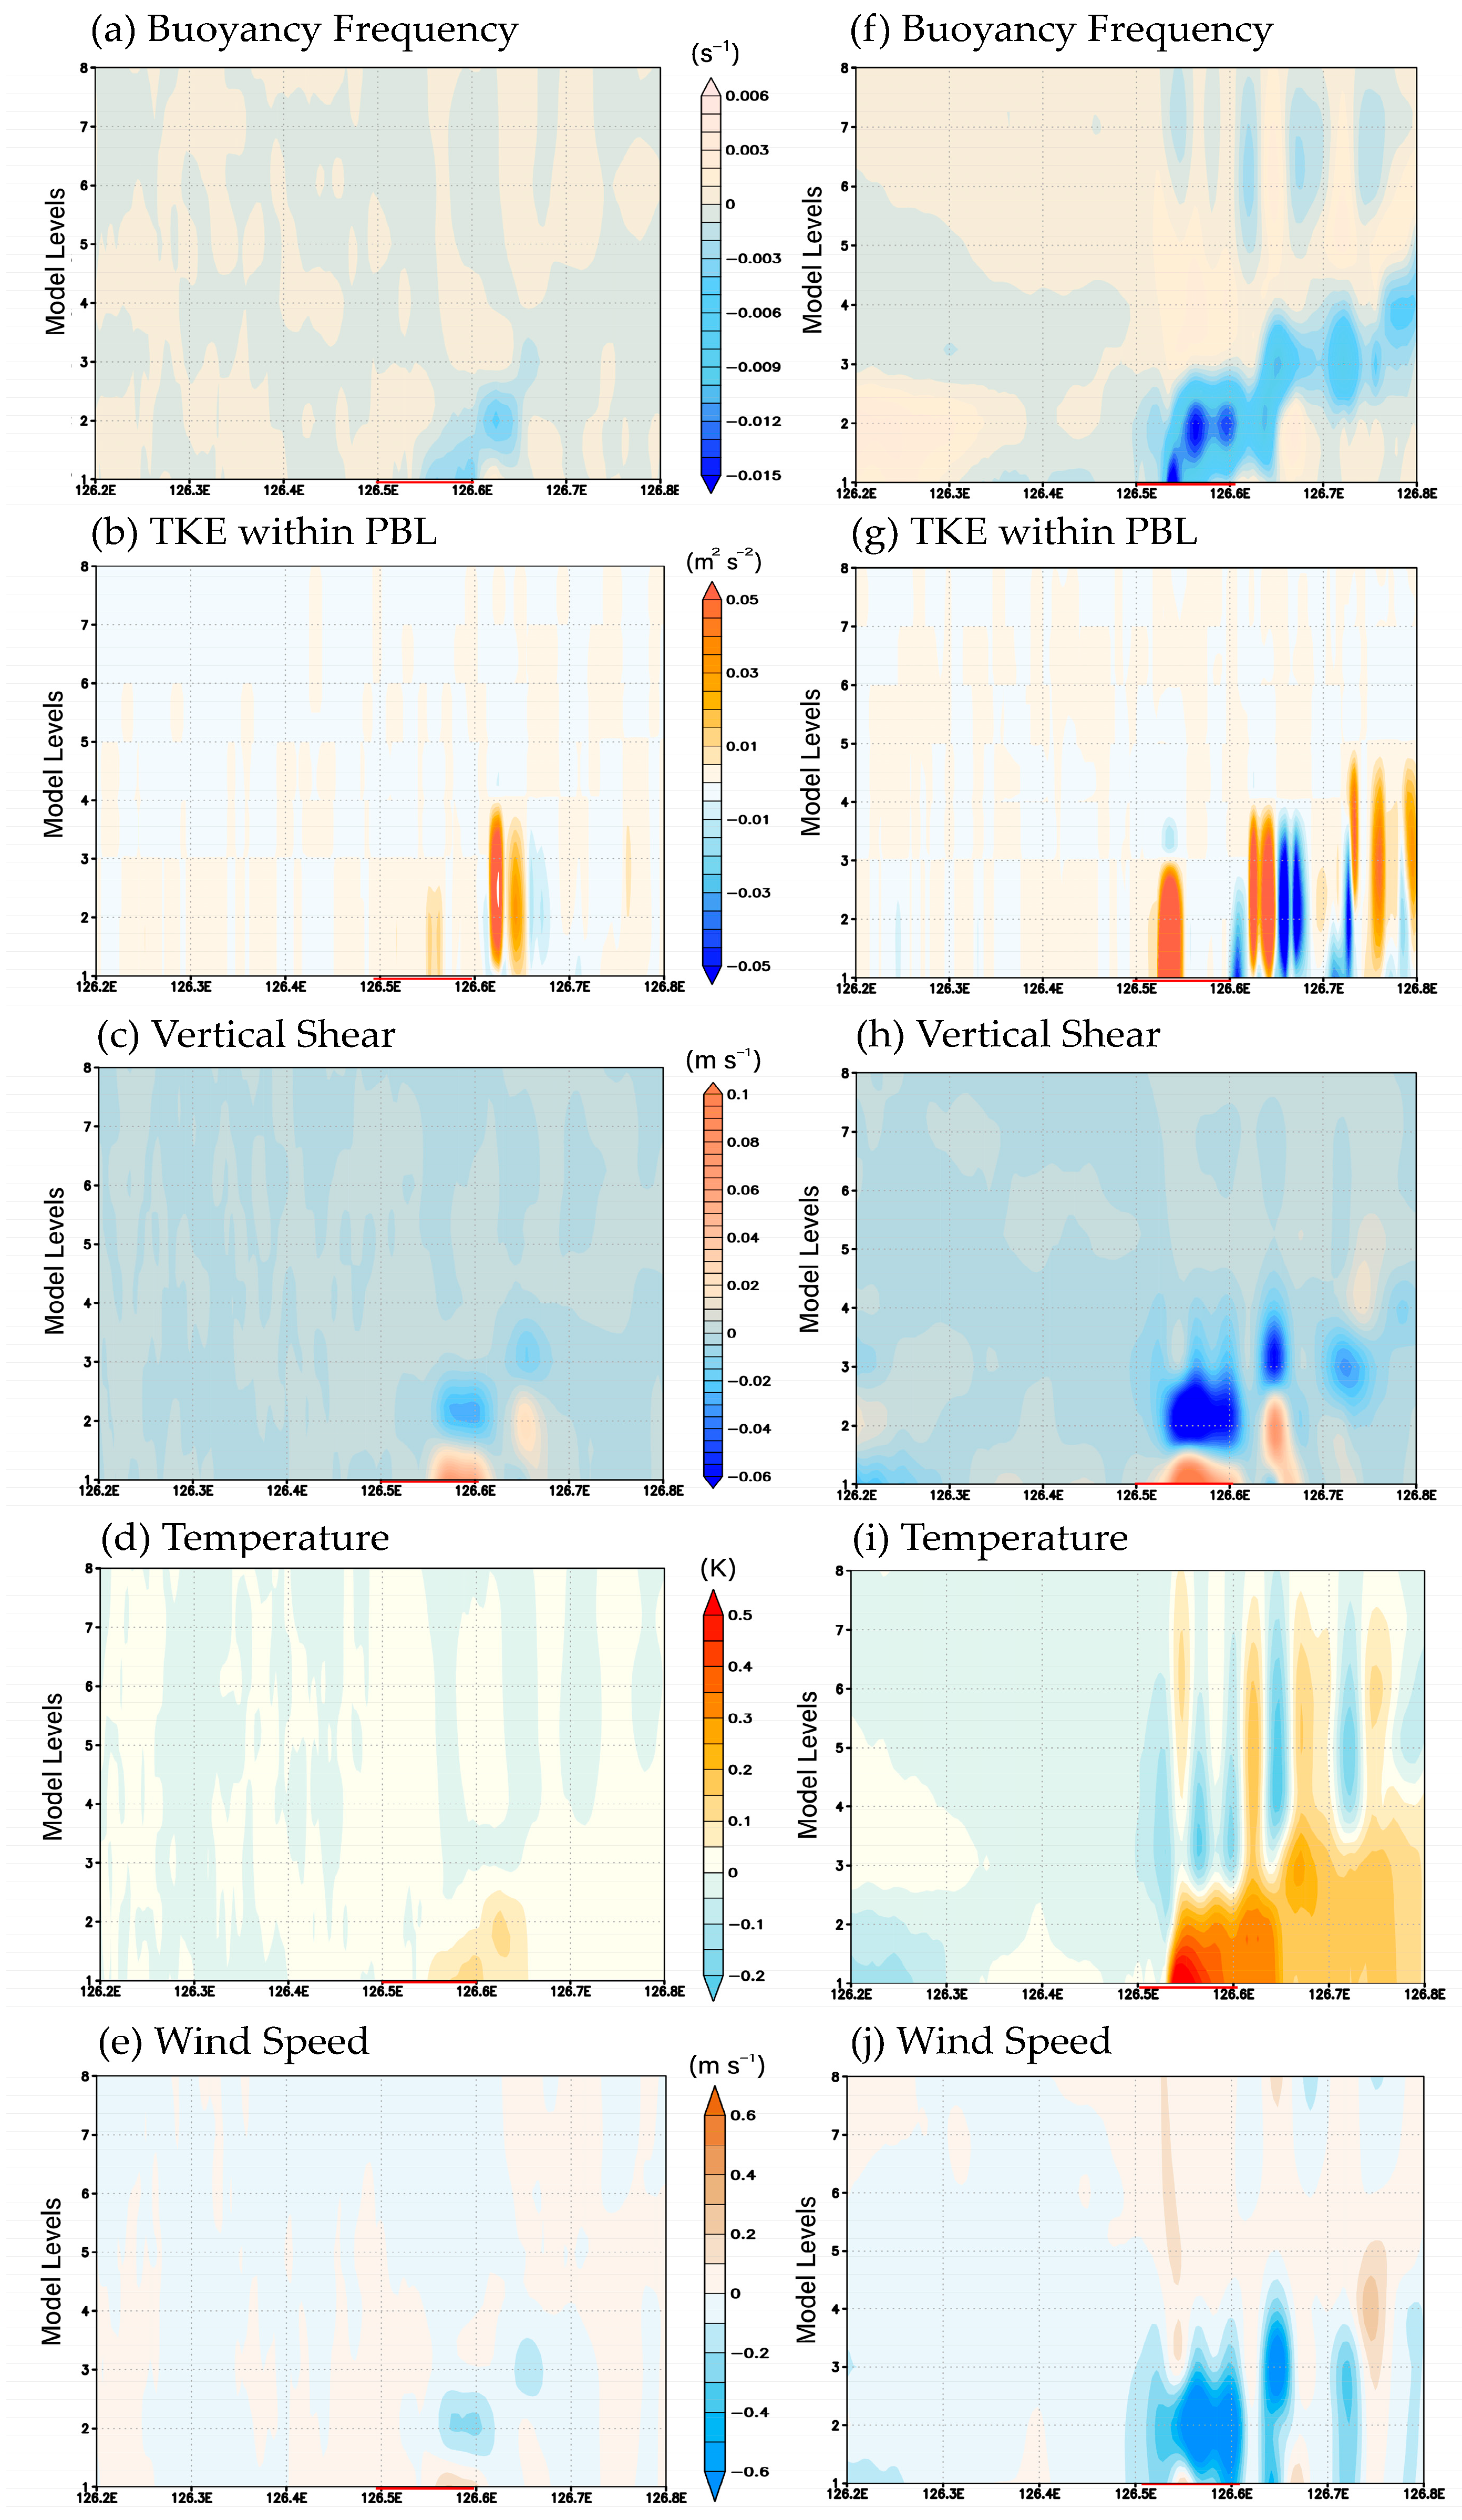
Figure 9 shows the case of 20 April 2001, and its basic structure is presented. As shown in Figure 9a,f, the changes in the buoyancy frequencies showed a decrease in both the HISST and CWALL experiments, and unlike the previous cases, they showed a stronger response in the CWALL experiments (Figure 9f). In both experiments shown in Figure 9b,g, the TKE within the PBL also exhibited both a decrease and an increase after a substantial increase inside the seawall, and the CWALL experiment (Figure 9g) was more variable. As shown in Figure 9c,h, the vertical shears increased in the surface layer and decreased in the upper layer in both experiments, showing a stronger distribution in the CWALL experiment (Figure 9h). As shown in Figure 9d,i, the temperature exhibited a strong increase in the surface layer in both experiments, which was more substantial and widespread in the CWALL experiment. As shown in Figure 9e, the wind speed was relatively weaker than that in Figure 8; however, it increased near the surface and decreased in the upper layer. As in the previous case (Figure 9j), the wind speed decreased in the lower layer; however, irregular variations were observed inside the seawall.
Table 4 presents the effects of the changes in the main factors on the changes in fog and clouds. The buoyancy frequency exhibited negative values in the lower layer, increasing atmospheric instability and strengthening the upward motion, thereby promoting cloud condensation. The TKE within the PBL showed positive values in the lower layer, enhancing atmospheric mixing, expanding the saturated layer, and increasing instability. In addition, the vertical shear and temperature increased near the surface and decreased in the upper layer, which strengthened the updrafts, contributing to fog dissipation in the surface layer and facilitating cloud formation in the upper layer. Unlike other variables, wind speed showed opposite results between the two experiments. In the HISST experiment, wind speed increased in the lower layer and decreased in the upper layer, which could strengthen the upward airflow, leading to fog dissipation and cloud formation. In contrast, the CWALL experiment exhibited decreased wind speed in the lower layer and increased wind speed in the upper layer, resulting in the opposite effect. This can be interpreted as a decrease in wind speed on the leeward side caused by the formation of turbulences as the flow passed over the 11 m-high seawall, which is consistent with the building experiment results of Ozman et al. [31]. The turbulences generated inside the seawall can enhance atmospheric instability, thereby influencing fog dissipation. However, the irregular distribution in both cases may still contribute to enhanced atmospheric instability.
Hwang and Chang [12] argued that the seawall structure and high SST area inside the seawall were the main factors responsible for two representative meteorological phenomena observed at Gunsan Airport after the completion of the Saemangeum Seawall in 2010: a reduction in sea fog and an increase in stratus ceiling height. In the present study, WRF experiments confirmed the pattern of a decreased cloud–water mixing ratio in the lower layer and increased values in the upper layer, including distinct updrafts generated by the seawall structure and high SST area inside the seawall. Additionally, using five additional factor experiments, the dynamic mechanisms supporting these findings were identified, showing that enhanced atmospheric instability and strengthened updrafts contributed to these changes.

5. Summary and Conclusions

Gunsan Airport previously encountered challenges with aviation weather support owing to the direct influence of the west coast sea fog. Since the construction of the Saemangeum Seawall in 2010, the frequency of sea fog occurrence has decreased. Therefore, this study was initiated to understand the effect of environmental changes around the observatory on the weather environment. In a study on changes in sea fog inflow at Gunsan Airport based on weather statistics for 20 years from 2000 to 2019, the average number of sea fog days per month decreased by 27% from 2.6 to 1.9 days, and the ceiling altitude increased by 30% from 203 to 264 m during laminar inflow. In addition, the structure of the Saemangeum Seawall and the elevated SST inside the seawall were key factors in this change [12].
Therefore, using the ERA5 reanalysis and OISST data, we reconstructed the atmospheric environment for previous sea fog case days using the WRF model 4.2.2 version and designed four experiments to evaluate the effect of the seawall structure and SST. These included the CTRL experiment that did not specify any conditions to examine the condition of the seawall before its completion, the HISST experiment that implemented an increase in seawater temperature to investigate the effect of increasing seawater temperature inside the seawall, the CWALL experiment that specified the 11 m Saemangeum Seawall high-resolution EGIS topographic information to explore the physical effect of the seawall structure, and the ALL experiment that used both elements to observe the appearance after the seawall construction.
Consequently, as shown in Figure 5 and Figure 6, the vertical cross-sections of the cloud–water mixing ratio over Gunsan Airport in the CTRL experiment successfully simulated sea fog inflow for both case days. Deviation analyses between the CWALL and CTRL experiments, as well as between the HISST and CTRL experiments, indicated that the cloud–water mixing ratio decreased near the surface and increased in the upper layer. Furthermore, the u–w wind-field analysis evidently simulated enhanced updrafts over the seawall and over the high SST area inside the seawall. Because the occurrence and dissipation of sea fog and stratus are influenced by the combined effects of lower atmospheric factors, such as atmospheric stability, temperature, and wind, this study analyzed the vertical cross-sections of buoyancy frequency, TKE within the PBL, vertical shear, temperature, and wind speed [17,19,20]. The results showed that inside the seawall, the buoyancy frequency decreased in the lower layer, the TKE within the PBL increased in the lower layer, and the vertical shear, temperature, and wind speed increased in the surface layer but decreased in the upper layer. These changes in each factor are comprehensively summarized in Table 4.
Overall, the results indicate that after the completion of the Saemangeum Seawall to the west of Gunsan Airport, physical changes caused by the seawall structure and thermal changes resulting from the high SST inside the seawall enhanced dynamic and thermal instability and promoted the development of updrafts, leading to a reduction in sea fog inflow and an increase in the stratus ceiling height. In this study, two specific cases with observed dense sea fog events were selected, and the model was used to impose forcing factors representing environmental changes in order to analyze the resulting variations in detail. This approach allowed for the examination of various influencing factors; however, the results derived from only two cases are insufficient for generalization. Therefore, further studies incorporating a larger number of cases are required to establish more robust conclusions. Such environmental changes can directly affect the living conditions of local residents; therefore, it is necessary to expand the scope of fog-related research beyond coastal areas to include inland regions, such as studies on the reduction in radiation fog caused by urbanization, and to conduct more objective analyses through a greater number of case studies. In addition, a more comprehensive analysis of the impacts of artificial environmental changes on climate change is required. Furthermore, a sufficient prior assessment of potential meteorological impacts on surrounding areas should be conducted when large-scale projects, such as land reclamation or development, are planned in the future.

Author Contributions

Conceptualization, E.-C.C. and J.-D.H.; Data curation, J.-D.H. and C.-Y.G.; Formal analysis, J.-D.H. and C.-Y.G.; Funding acquisition, E.-C.C.; Investigation, J.-D.H. and C.-Y.G.; Methodology, J.-D.H. and E.-C.C.; Supervision, E.-C.C.; Visualization, J.-D.H. and C.-Y.G.; Writing—original draft, J.-D.H.; Writing—review & editing, E.-C.C. All authors have read and agreed to the published version of the manuscript.

Funding

This work was funded by the Korea Meteorological Administration Research and Development Program under Grant (RS-2023-00240346). This research was also supported by the Specialized University Program for Confluence Analysis of Weather and Climate Data of the Korea Meteorological Institute (KMI), funded by the Korean government (KMA).

Institutional Review Board Statement

Not applicable.

Informed Consent Statement

Not applicable.

Data Availability Statement

The data used in this study are partially available from public sources and upon request. Surface meteorological observation data, SST data from the Eoi-yeon-do buoy, and satellite imagery products from the Geostationary Korea Multi-Purpose Satellite 2A (GK-2A) provided by the Korea Meteorological Administration (KMA) are freely accessible at https://data.kma.go.kr/cmmn/main.do (accessed on 15 September 2025). Additionally, the METAR data collected by the Republic of Korea Air Force can be obtained after a security review process. All other data generated and/or analyzed during this study are available from the corresponding author upon reasonable request.

Conflicts of Interest

The authors declare no conflicts of interest.

Abbreviations

The following abbreviations are used in this manuscript:
WRF modelWeather Research and Forecasting model
SSTSea Surface Temperature
TKE within the PBLTurbulence Kinetic Energy within the Planetary Boundary Layer
3DThree-dimensional
KMAKorea Meteorological Administration
GK-2AGeostationary Korea Multi-Purpose Satellite 2A
METARMeteorological Aviation Report
ERA5ECMWF Reanalysis 5th Generation
EGISEnvironmental Geographic Information System
USGSUnited States Geological Survey
OISSTOptimum Interpolation Sea Surface Temperature

References

  1. Hong, S.G. Aviation Meteorology; Kyohakyungusa, Ltd.: Seoul, Republic of Korea, 2019; pp. 189–191. (In Korean) [Google Scholar]
  2. Gultepe, I.; Tardif, R.; Michaelides, S.C.; Cermak, J.; Bott, A.; Bendix, J.; Müller, M.D.; Pagowski, M.; Hansen, B.; Ellrod, G.; et al. Fog research: A review of past achievements and future perspectives. Pure Appl. Geophys. 2007, 164, 1121–1159. [Google Scholar] [CrossRef]
  3. Kim, M.H.; Park, S.W.; Bae, J.H. Flight Delay and Cancellation Analysis and Management Strategies; Korea Transport Institute: Seoul, Republic of Korea, 2020; pp. 13–29. Available online: https://www.nkis.re.kr/subject_view1.do?otpId=OTP_0000000000006140 (accessed on 15 September 2025). (In Korean)
  4. Taylor, G.I. The formation of fog and mist. Quart. J. Royal. Meteorool. Soc. 1917, 43, 241–268. [Google Scholar] [CrossRef]
  5. Lee, H.Y.; Chang, E.C. Impact of land-sea thermal contrast on the inland penetration of sea fog over the coastal area around the Korean peninsula. JGR Atmos. 2018, 123, 6487–6504. [Google Scholar] [CrossRef]
  6. Liu, L.; Wang, X.; Li, Y.; Wei, W. The effect of sea surface temperature on relative humidity and atmospheric visibility of a winter sea fog event over the Yellow-Bohai sea. Atmosphere 2022, 13, 1718. [Google Scholar] [CrossRef]
  7. Wang, S.; Li, Y.; Shi, X.; Chen, X. The microphysical properties of a sea-fog event along the west coast of the Yellow Sea in spring. Atmosphere 2020, 11, 413. [Google Scholar] [CrossRef]
  8. Zhang, S.P.; Xie, S.P.; Liu, Q.Y.; Yang, Y.Q.; Wang, X.G.; Ren, Z.P. Seasonal variations of yellow Sea fog: Observations and mechanisms. J. Clim. 2009, 22, 6758–6772. [Google Scholar] [CrossRef]
  9. Koračin, D.; Dorman, C.E.; Lewis, J.M.; Hudson, J.G.; Wilcox, E.M.; Torregrosa, A. Marine fog: A review. Atmos. Res. 2014, 143, 142–175. [Google Scholar] [CrossRef]
  10. Lee, E.; Kim, J.H.; Heo, K.Y.; Cho, Y.K. Advection fog over the eastern Yellow Sea: WRF simulation and its verification by satellite and in situ observations. Remote Sens. 2021, 13, 1480. [Google Scholar] [CrossRef]
  11. Lakra, K.; Avishek, K. A review on factors influencing fog formation, classification, forecasting, detection and impacts. Rend. Lincei. Sci. Fis. Nat. 2022, 33, 319–353. [Google Scholar] [CrossRef]
  12. Hwang, J.D.; Chang, E.C. A Statistical Study on the Characteristics of Costal Sea Fog in Gunsan following Saemangeum Seawall construction. Korean J. Earth Sci. 2025, in print. [Google Scholar]
  13. Nakanishi, M. Large-Eddy simulation of radiation fog. Bound. Layer Meteorol. 2000, 94, 461–493. [Google Scholar] [CrossRef]
  14. Koračin, D.; Lewis, J.; Thompson, W.T.; Dorman, C.E.; Businger, J.A. Transition of stratus into fog along the California coast: Observations and modeling. J. Atmos. Sci. 2001, 58, 1714–1731. [Google Scholar] [CrossRef]
  15. Koračin, D.; Businger, J.A.; Dorman, C.E.; Lewis, J.M. Formation, evolution, and dissipation of coastal sea fog. Bound. Layer Meteorol. 2005, 117, 447–478. [Google Scholar] [CrossRef]
  16. Gultepe, I.; Milbrandt, J.A. Microphysical observations and mesoscale model simulation of a warm fog case during FRAM project. Pure Appl. Geophys. 2007, 164, 1161–1178. [Google Scholar] [CrossRef]
  17. Heo, K.Y.; Ha, K.J. A coupled model study on the formation and dissipation of sea fogs. Mon. Weather Rev. 2010, 138, 1186–1205. [Google Scholar] [CrossRef]
  18. Guo, J.; Xu, J.; Xu, X. An observational and modeling study of a sea fog event over the yellow and east China seas on 17 March 2014. Trop. Cyclone Res. Rev. 2021, 2021, 182–190. [Google Scholar] [CrossRef]
  19. Li, P.Y.; Fu, G.; Lu, C.G.; Fu, D.; Wang, S. The formation mechanism of a spring sea fog event over the Yellow-Sea associated with a low-level jet. Weather. Forecast. 2012, 27, 1538–1553. [Google Scholar] [CrossRef]
  20. Han, L.; Zhang, S.; Xu, F.; Lü, J.; Lu, Z.; Ye, G.; Chen, S.; Xu, J.; Du, J. Simulations of sea fog case impacted by air–sea interaction over South China Sea. Front. Mar. Sci. 2022, 9, 1000051. [Google Scholar] [CrossRef]
  21. Stoelinga, M.T.; Warner, T.T. Nonhydrostatic, mesobeta-scale model simulations of cloud ceiling and visibility for an East Coast winter precipitation event. J. Appl. Meteorol. 1999, 38, 385–404. [Google Scholar] [CrossRef]
  22. Lee, Y.H.; Won, D.J.; Kim, K.E.; Min, K.D. The role of turbulence in numerical model on the sea fog over the Yellow-sea. Asia Pac. J. Atmos. Sci. 2000, 36, 643–654. Available online: https://www.dbpia.co.kr/journal/articleDetail?nodeId=NODE00942244 (accessed on 15 September 2025). (In Korean).
  23. Pahlavan, R.; Moradi, M.; Tajbakhsh, S.; Azadi, M.; Rahnama, M. Fog probabilistic forecasting using an ensemble prediction system at six airports in Iran for 10 fog events. J. Appl. Meteorol. 2021, 28, e2033. [Google Scholar] [CrossRef]
  24. Xu, D.; Chen, H.; Chen, Y.; Liu, D.; Ge, F.; Ye, X.; Sun, Q.; Shen, F. The impact of assimilating FY-3D microwave humidity sounder II radiance data on the analysis and forecast of two advection fog cases. Atmos. Res. 2025, 323, 108162. [Google Scholar] [CrossRef]
  25. Sim, S.; Im, J.; Jung, S.; Han, D. Improving short-term prediction of ocean fog using numerical weather forecasts and geostationary satellite-derived ocean fog data based on AutoML. Remote Sens. 2024, 16, 2348. [Google Scholar] [CrossRef]
  26. Shin, S.C. The Changed View of Saemangeum from the Sky. The Today Gunsan, 5 November 2020. Available online: http://www.todaygunsan.co.kr/news/articleView.html?idxno=3433 (accessed on 15 September 2025). (In Korean).
  27. Lee, H.J.; Jo, H.R.; Kim, M.J. Topographical changes and textural characteristics in the areas around the Saemangeum dyke. Ocean Polar Res. 2006, 28, 293–303. (In Korean) [Google Scholar] [CrossRef]
  28. Gunsan City, South Korea. Satellite Imagery; Google: Earth. Available online: https://earth.google.com (accessed on 17 July 2025).
  29. Durran, D.R.; Klemp, J.B. On the effects of moisture on the Brunt-Väisälä frequency. J. Atmos. Sci. 1992, 39, 2152–2158. [Google Scholar] [CrossRef]
  30. Morrison, H.; Thompson, G.; Tatarskii, V. Impact of cloud microphysics on the development of trailing stratiform precipitation in a simulated squall line: Comparison of one and two-moment schemes. Mon. Weather Rev. 2009, 137, 991–1007. [Google Scholar] [CrossRef]
  31. Ozmen, Y.; Baydar, E.; Beeck, J.P.A.J. Wind flow over the low-rise building models with gabled roofs having different pitch angles. Build. Environ. 2016, 95, 63–74. [Google Scholar] [CrossRef]
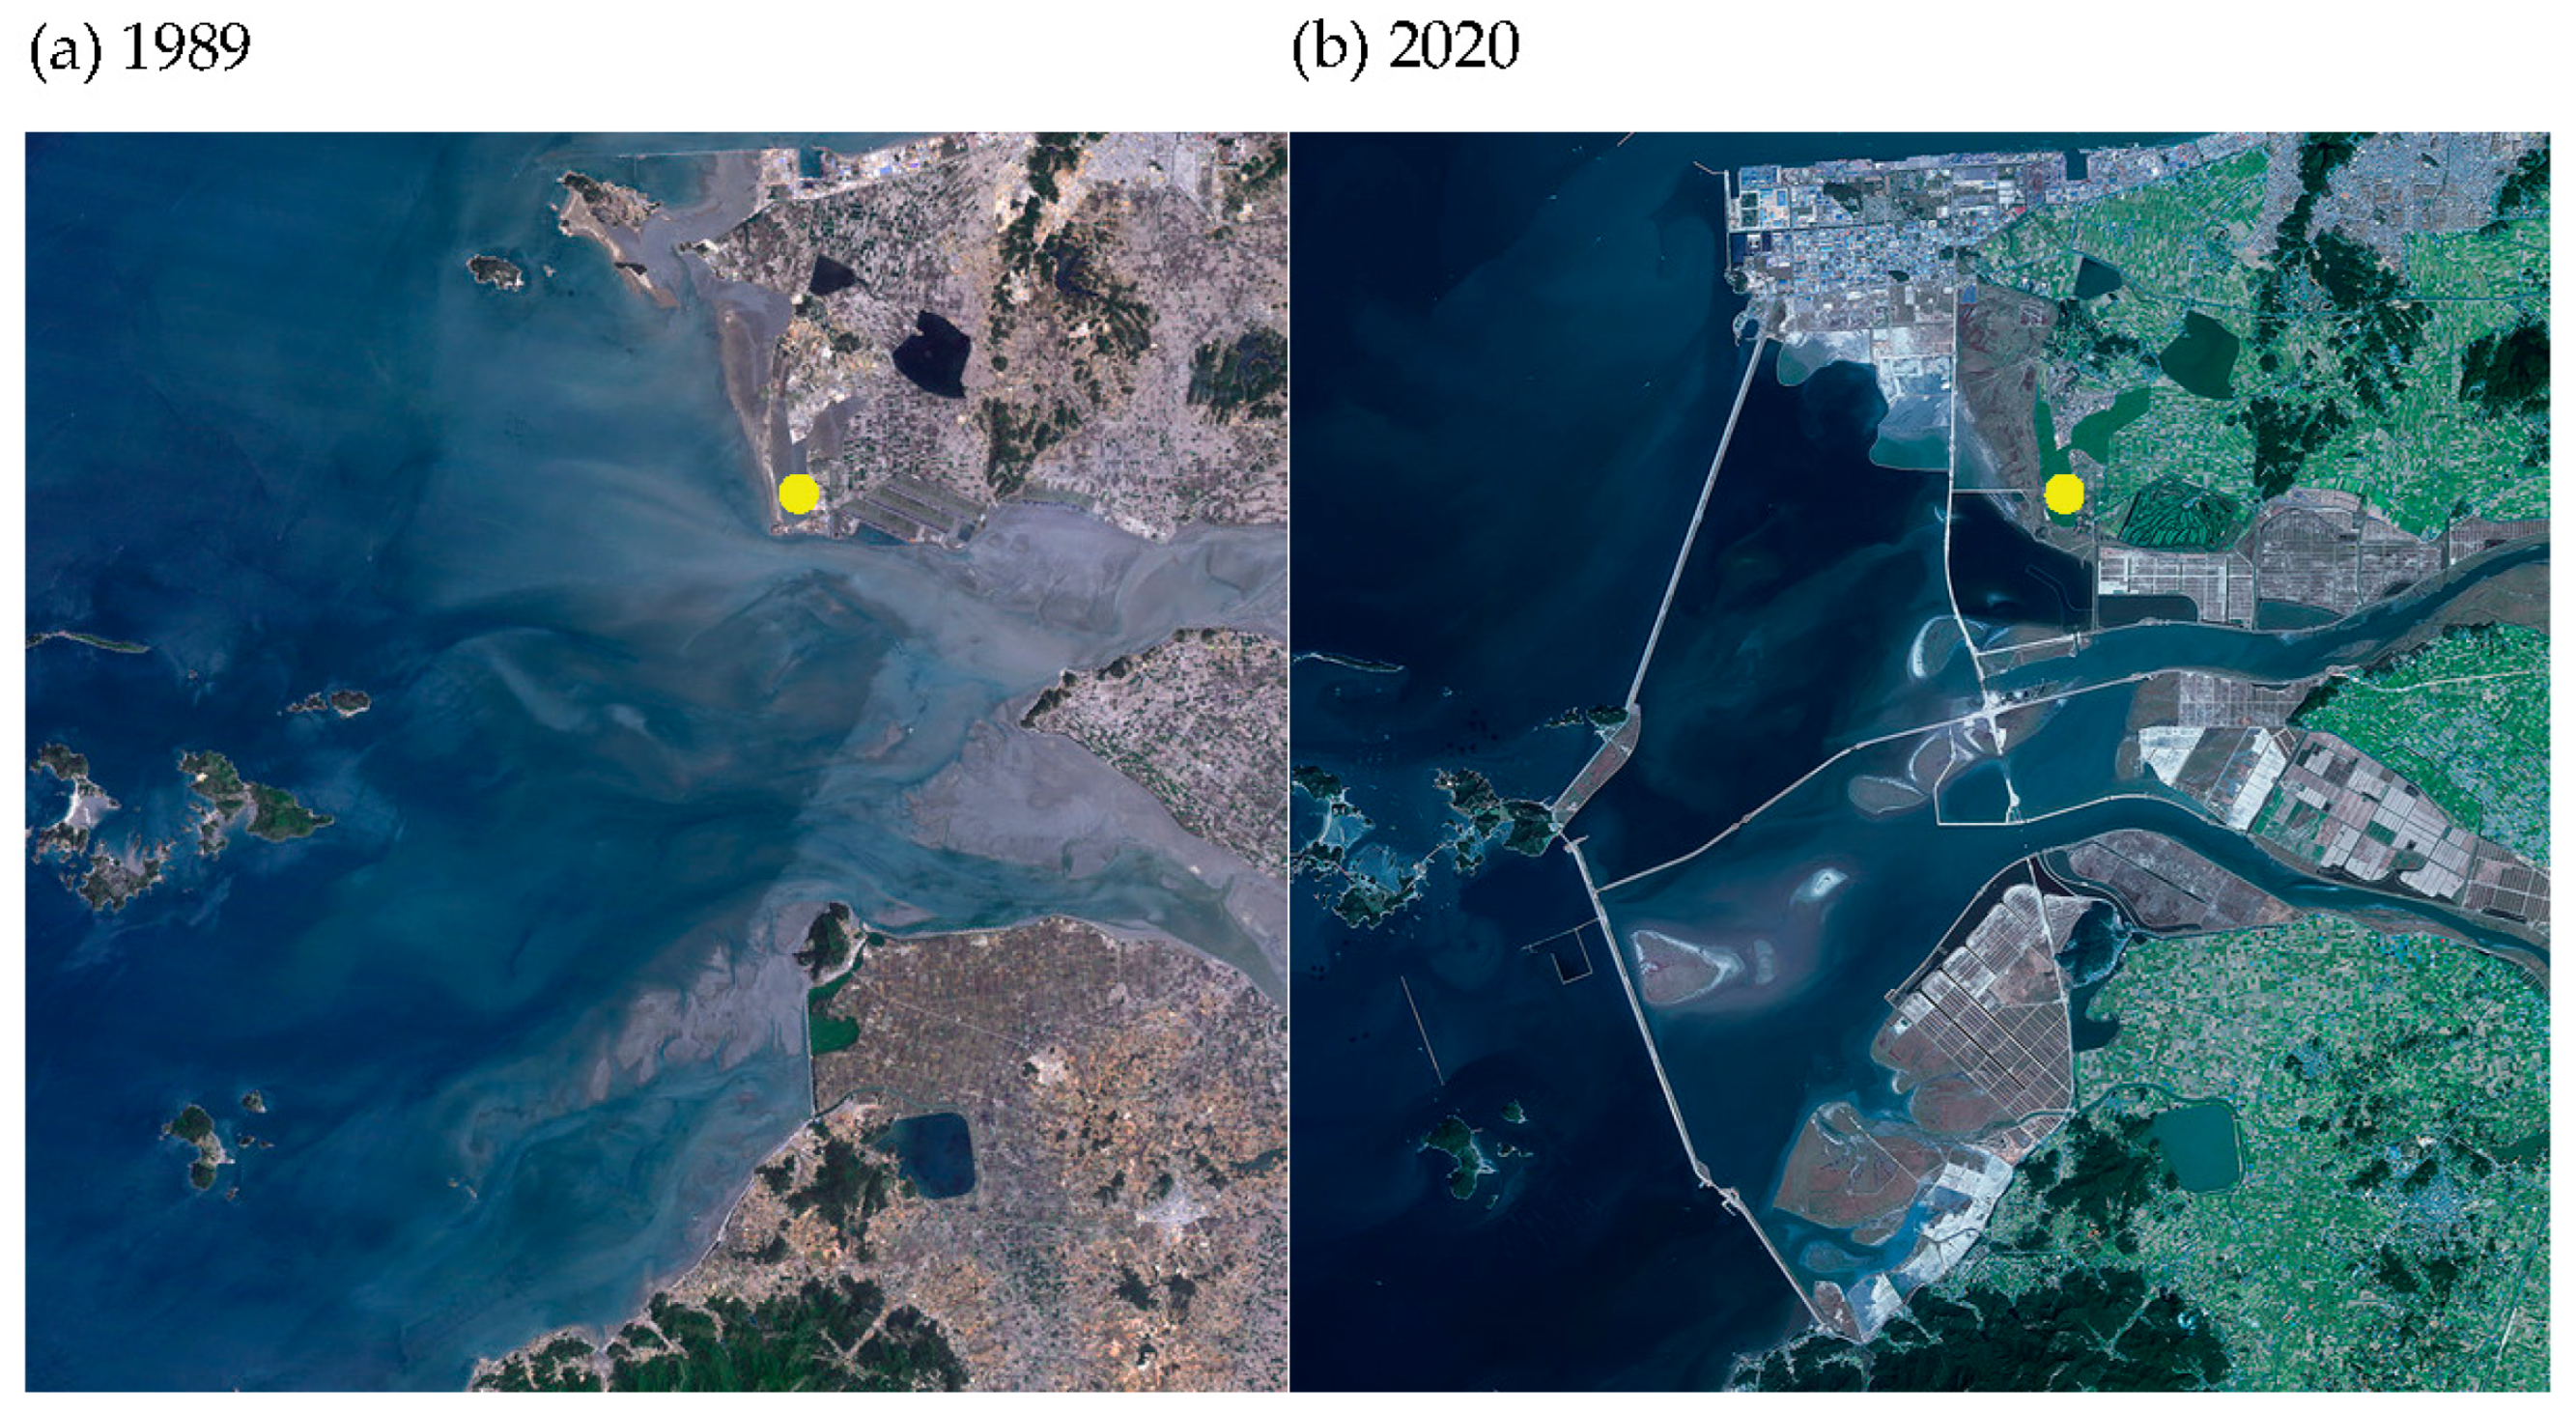
Figure 1. Satellite images of the Gunsan Airport area comparing (a) 1989 and (b) 2020. The yellow dots indicate the location of Gunsan Airport.
Atmosphere 16 01253 g001
Figure 2. Satellite image from Google Earth showing the locations of the measurement sites for SST and the two airports. The red dot indicates (a) Eoyeondo, the green dot indicates (b) the seawater measurement site outside the seawall, and the blue dot represents (c) the freshwater measurement site inside the seawall. The yellow squares indicate (d) Gunsan and (e) Seosan airports. (Source: Google Earth, ©2025 Google LLC).
Atmosphere 16 01253 g002
Figure 3. The model experiment was conducted in two stages: Domain 1 for the West Sea area and Domain 2 for the Gunsan Saemangeum Seawall area.
Atmosphere 16 01253 g003
Figure 4. Changes in topography before and after the construction of the seawall modified by the high-resolution data EGIS.
Atmosphere 16 01253 g004
Figure 5. Based on OISST data, the SST (K) before and after the construction of the seawall, which modified the SST change data observed from the satellite, is shown.
Atmosphere 16 01253 g005
Figure 6. The model experiment results correspond to case 1 (19 UTC on 19 May 2000). (a) Vertical distribution of the cloud–water mixing ratio (g Kg−1) around the seawall, (b) changes when both SST and seawall were applied by the All–CTRL experiment, (c) changes when only SST changes were applied by the HISST–CTRL experiment, (d) changes when only the structure of the seawall was applied by the CWALL–CTRL experiment. The figure shows a vertical cross-section along 35.925° N, extending from 126.2° E to 126.8° E, which passes through the Saemangeum Seawall and Gunsan Airport. The vertical axis represents model layers, where layer 1 is at 15 m, layer 8 is approximately at 1200 m, and the values between these layers increase linearly. The black solid line with arrows in (bd) represents streamlines for zonal and vertical wind differences.
Atmosphere 16 01253 g006
Figure 7. Same as Figure 6, but for case 2 (12 UTC 20 April 2001).
Atmosphere 16 01253 g007
Figure 8. The left column: (a) buoyancy frequency (s−1), (b) TKE within the PBL, (c) Vertical Shear, (d) Temperature, and (e) Wind Speed were used to analyze the effect of SST (HISST– CTLR) for case 1 (19 May 2000). The right column: (fj) are the same as (ae) but were used to analyze the effect of seawalls (CWALL–CTRL). The figure shows a vertical cross-section along 35.925° N, extending from 126.2° E to 126.8° E, which passes through the Saemangeum Seawall and Gunsan Airport. The vertical axis represents model layers, where layer 1 is at 15 m, layer 8 is approximately at 1200 m, and the values between these layers increase linearly. The red solid line at the bottom indicates the location of the Saemangeum Seawall.
Atmosphere 16 01253 g008
Figure 9. Same as Figure 8, but for case 2 (12 UTC 20 April 2001). The red solid line at the bottom indicates the location of the Saemangeum Seawall.
Atmosphere 16 01253 g009
Table 1. Description of the experimental configuration using the WRF model.
WRF v4.2.2
Horizontal ResolutionDomain 1
2.5 km
Domain 2
0.5 km
Model Layers45
Time Step15 s
Initial & Lateral BoundaryERA5 Reanalysis, OISST
MicrophysicsThompson
CumulusTiedtke
Longwave RadiationRRTMG
Shortwave RadiationRRTMG
Planetary Boundary LayerMYJ
Land SurfaceUnified Noah
Table 2. Distribution of SST (°C) at three points near the Saemangeum Seawall in 2023 and the monthly mean temperature (°C) at Gunsan Airport after the completion of the seawall. Each observation point is highlighted in Figure 2.
SST in Heavy Fog Season (°C)Yearly Mean SST (°C)Annual
Deviation (°C)
MAR APR MAY JUN JUL
(a) Eoiyeondo6.78.914.321.324.715.721.5
(b) Sea water7.111.016.020.825.015.422.1
(c) Fresh water8.012.618.423.526.416.424.9
(d) Surface Temperature
at Gunsan Airport
5.711.317.221.725.913.127.6
Table 3. Model experiment design to analyze the effect of the Saemangeum Seawall and sea surface.
ExperimentCTRLCWALLHISSTALL
Seawall application××
SST application××
○: applied; ×: not applied.
Table 4. Impact of changes in each factor on changes in fog and clouds.
ElementStatus ChangeImpact of Changes in Each Element
Buoyancy
frequency
Lower: decrease (−)Increased atmospheric instability
→ Strengthen upward motion
→ Fog dissipation, Cloud condensation
TKE within the PBLLower: increase (+)Enhanced atmospheric mixing
→ Water vapor supply
→ Saturation layer expansion
Vertical
Shear
Upper: decrease (−)
Lower: increase (+)
vertical airflow enhancement
→ fog dissipation
TemperatureUpper: decrease (−)
Lower: increase (+)
Air Parcel rise → Insulation expansion → Cooling
→ Condensation → Cloud formation
Wind
speed
HISSTUpper: decrease (−)
Lower: increase (+)
vertical airflow enhancement
→ fog dissipation
CWALLUpper: increase (+)
Lower: decrease (−)
Turbulence occurs
→ atmospheric instability increases
Disclaimer/Publisher’s Note: The statements, opinions and data contained in all publications are solely those of the individual author(s) and contributor(s) and not of MDPI and/or the editor(s). MDPI and/or the editor(s) disclaim responsibility for any injury to people or property resulting from any ideas, methods, instructions or products referred to in the content.