Abstract
The Greek territory and the surrounding marine area constitute an excellent laboratory for studying moderate-magnitude earthquakes (4–6 M), as such earthquakes occur very frequently in this region. Ten years ago, it was proposed that there is some kind of relation between earthquakes and unusual Schumann Resonance signals one to twenty days prior to an impending earthquake. During the last five years (2020–2025), a fairly large collection of signals has been gathered that may be considered as precursory seismic signals. Unfortunately, individual case studies overestimate their contribution to the final event and may lead to unjustified ‘extended pictures’ of the phenomenon. In the present article, we systematically attempt to evaluate these signals by examining them as a whole, rather than individually as in case studies. We confirmed that while case studies are a reasonable way to start a research project, they do not guarantee the final result. In our case, while individual studies were very hopeful, the present integrated study led to several unresolved issues that need to be addressed. The results of our work will help to determine whether these signals represent a significant part of the broader LAIC scenario, which is currently the only reliable suggestion for triggering and predicting earthquakes, or whether the origin of these signals should be sought elsewhere.
1. Introduction
Earthquakes (hereafter EQs) are extremely complex phenomena as evidenced by the absence of a reliable prediction method. However, EQ prediction is absolutely necessary for civil protection because, along with the accompanying phenomena they may cause, such as tsunamis, landslides, and volcanic activity, they are among the most destructive natural events. Since the early 20th century, traditional seismology/geology has been attempting to develop a prediction method, but with little success [1]. Since the beginning of the 21st century, the study of EQs has expanded beyond traditional seismology/geology and extended into general physics, particularly electromagnetism, which now contains the newer field called seismo-electromagnetics or electro-seismology [2,3]. This extension has renewed the effort to predict EQs and has given hope for formulating a prediction method in the near future.
So far, electro-seismology has developed a basic scenario of interrelated mechanisms, known as LAIC (Lithosphere-Atmosphere-Ionosphere-Coupling [4,5,6,7]; that may generate seismic precursors. The name of this scenario makes evident that the mechanism for EQ generation starts from the Earth’s crust and, through a chain of physicochemical interactions, extends to the ionosphere and possibly beyond. For the moment, four branches of interaction have been identified, from the depths of the lithosphere to the ionosphere, as described by Hayakawa et al. [7]. The first branch (geological) includes purely geological interactions, like gas emissions near the EQ epicenter which could induce air and electromagnetic changes in the atmosphere till the ionosphere. The second (chemical) starts with mainly chemical influences like water, heating and conductivity changes. The third (atmospheric, waving) has mainly to do with turbulence, acoustic and gravity waves triggered by heat sources. Finally, the last branch (electromagnetic) has to do with ULF (Ultra Low Frequency) emissions which create an electromagnetic track from the ground to the bottom of the ionosphere. All of them are secondary manifestations of a triggering mechanism in the depth of the EQ epicenter.
Although the LAIC model encompasses a broad range of geological, chemical, and electromagnetic mechanisms, it does not fully address certain processes, such as tidal phenomena, which have been extensively studied since the early 21st century. Incorporating these phenomena into the first branch could significantly complement the LAIC framework. As early as the late 20th century, it was proposed that rapid changes in the effective Atmospheric Angular Momentum (AAM) functions were linked to the occurrence of major EQs, as well as to swift fluctuations in several parameters of the Earth’s rotation. Zharov [8] hypothesized that a strong correlation exists between these AAM function changes and the timing of EQs. Additionally, he noted that rapid variations in the length of the day (up to 0.2 milliseconds) were induced by fluctuations in the axial component of the AAM functions, which were similarly correlated with seismic events. Notably, common periodicities were observed in both the AAM functions and EQ sequences. Since then, multiple studies have explored the correlation between Earth tides—caused by the Moon’s position relative to Earth—and seismic activity. Fridman et al. [9] investigated the potential link between global seismicity and variations in Earth’s rotational parameters, suggesting that changes in the Earth’s rotation could be associated with either an increase or decrease in seismic events on a global scale. Gross [10] examined changes in the rotation of the solid Earth by applying the principle of conservation of angular momentum. According to this, variations in the Earth’s rotation arise due to external torques, internal mass redistribution, and the transfer of angular momentum between the solid Earth and the fluid regions with which it interacts. Hengxin et al. [11] likely presented an analysis indicating that variations in the Earth’s rotation may influence the timing of seismic events, further supporting the hypothesis that changes in the Earth’s rotational dynamics are tied to seismicity. Levin et al. [12] analyzed the relationship between fluctuations in the Earth’s rotation rate and geodynamic processes within the Earth, including seismic activity. Their results highlight the need for further research, which is crucial for enhancing space systems and technologies. Ambrosino et al. [13] proposed that Earth tides (surface movements of the Earth by several centimeters) and, more notably, ocean tides (which can cause surface movements of up to a meter or more) may alter the confining pressure on shallow, dipping faults near continental margins and subduction zones. They identified a correlation between anomalies in the Earth’s rotation rate and the occurrence of major EQs (magnitude ≥ 7 and/or more than 150 events per day). Finally, Ershkov et al. [14] contended that EQ activity is strongly correlated with changes in the regime of Earth’s spin dynamics across all observed time periods. They further demonstrated that the long-term dynamics of the Earth’s angular rotation are influenced by quasiperiodic solar activity, which generates additional large-scale torques from unbalanced (reactive) reradiating heat fluxes.
From the variety of the above interactions involved in the basic LAIC scenario it is clear that there is not a single phenomenon that can act as a precursor. Instead, there are many precursor phenomena but they neither manifest themselves all together in the same EQ, nor the same precursor is present in two or more successive EQs in the same or different places. This is what makes the formulation of a valid prediction method so difficult. It is possible that EQ precursors depend on the particular geophysical/geological conditions prevailing in each EQ area or the specific characteristics of a certain EQ as defined by traditional seismology.
A very important quasi-precursor phenomenon reported by several researchers is disturbances in the spectrum of Schumann Resonances (hereafter SR). SRs are very low-frequency (2–50 Hz) stationary electromagnetic waves created by lightning, which move within the waveguide formed between the Earth’s surface and the base of the ionosphere [15,16,17]. Their spectrum manifests very characteristic harmonics around 7.83, 14.3, 20.8, 27.3, 33.8 Hz (Figure 1).
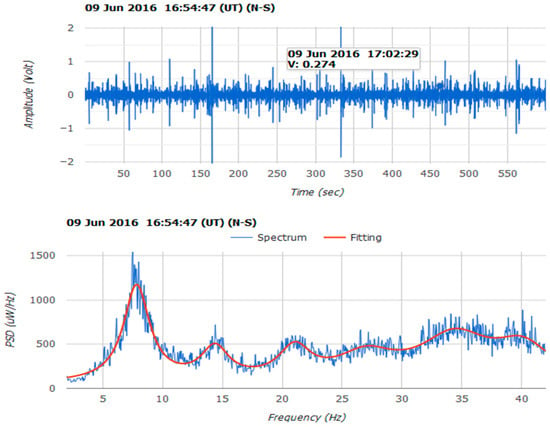
Figure 1.
Typical 10 min SR recording (upper panel) and corresponding power spectra (lower panel). Broad harmonics around 7, 14, 21, 27, 34 Hz are evident.
These waves often show specific disturbances from a few hours to 20 days before an EQ. The disturbance under consideration that is assumed to be a seismic precursor signal is a high increase like a bulge in the 20–30 Hz range of the spectrum that corresponds to the third and fourth harmonics of the SR, while the rest of the spectrum remains at a very low level (Figure 2). Our empirically defined prerequisite for classifying these disturbances as pre-seismic was that we should consider EQs with magnitude of at least 4.0 M that occurred within a circle of 250 km around the recording point.
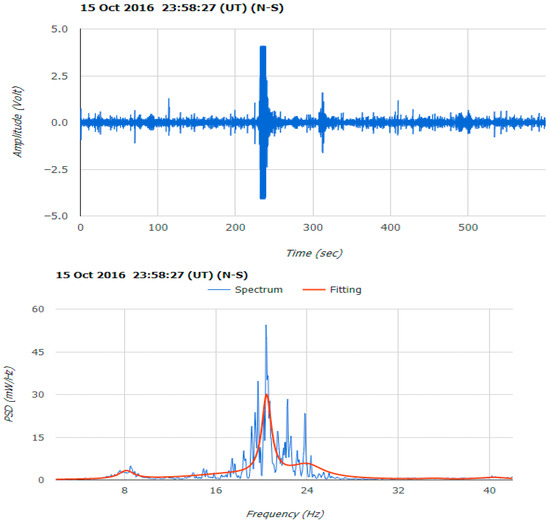
Figure 2.
The first recording of a possible pre-seismic signal at the Northern Station (Kalpaki) a few hours before a magnitude 5.2 EQ that occurred a few kilometers from the recording point on 15 October 2016. The (upper panel) is a 10 min recording (raw data) while the (lower panel) is the corresponding spectrum. The differences between Figure 1 and Figure 2 are obvious.
Possible pre-seismic signals related to an increase in the 20–30 Hz range have been already reported by several authors. Specifically, Nishimura [18], in the context of a study on whether animals can sense impending EQs, diagnosed sensitivity in animals in the 6-8 Hz range (first harmonic SR) before the onset of seismic activity. Athanasiou et al. [19] detected electrostatic disturbances in the 20 Hz range six days before an EQ occurred. Hayakawa et al. [20] observed an increase in the spectrum at 25 Hz before the CHI-CHI EQ. They attempted to explain this disturbance by proposing the creation of gyroscopic waves at the ionosphere’s base, the mechanism of which was formulated by Sorokin and Pokhotelov [21].
In Greece, significant efforts have been made to study the relationship between SR and EQs because the region is suitable for such studies. In the mainland and the island regions of the Aegean and Ionian Seas, EQs with magnitudes of 4–6 M are very frequent. This favors long-term statistical studies that focus on both the relation between SR and EQs, as well as on the differences between EQs with epicenters on land and at sea.
There is already a recorded SR dataset covering, with some gaps, the period from 2020 to 2025, while sporadic recordings exist since 2016. Details regarding the location, time, and method of recording have already been published [22,23,24,25]. The present study aims to estimate, far from narrow case studies, the degree of credibility for unusual/abnormal SR signals as seismic precursors, and their possible participation in the overall LAIC scenario. In particular, the quasi-pre-seismic SR signals seem to belong mainly to the fourth category (electromagnetic) of the LAIC scenario. Our goal is to determine the possible correlation of the identified pre-seismic signals with EQs that occurred within 20 days after their appearance.
2. Data Availability and Summary of Observations
The recording of SR signals in Greece began experimentally in 2014, with the initial aim of testing a recording system and selecting a suitable site for its installation. The latter proved perhaps the most difficult and demanding part of this type of research, as the site needed to be electromagnetically “clean” within at least a five-kilometer radius, permanently free from human activity, safe from vandalism, and easily accessible. All these requirements are rarely met, especially in a small and densely populated country.
Eventually, after several trials, systematic recordings of SR signals began in 2017 inside a small rural chapel in the village of Dolianna (Kalpaki) near the Greek-Albanian border. This station, hereafter referred to as the Northern Station, operated until 2019, when it ceased operations due to the COVID-19 pandemic and administrative issues related to the managing of the chapel. Meanwhile, testing of the Southern Station had already begun in the region of Laconia, on Mount Parnon at an elevation of 1450 m. This station continues to operate today, albeit with some interruptions, and provides excellent quality recordings. This success was significantly supported by the parallel installation of a system from the University of Krakow, which functions flawlessly.
As is well known, SR signals are associated with various geophysical phenomena such as lightning, ionospheric disturbances, etc. In our case, the focus immediately turned to the potential connection between SR signals and seismic activity, due to Greece’s and the Eastern Mediterranean’s high seismicity. Interest in this topic was further intensified by a strong EQ that occurred very close to the Northern Station on 15 October 2016 just a few months after it became operational. The first such recording is shown in Figure 2. One month after the first recording, another similar signal was recorded two days before the 4.8 M EQ in the area of Kilkis about 150 km away from the recording point (Figure 3). Although the operation of the North Station was intermittent, several signals possibly related to EQs were detected during the period 2016–2017 [26]. Similar signals were later recorded at the Southern Station on Mount Parnon by both the Greek and Polish systems simultaneously (Figure 4).
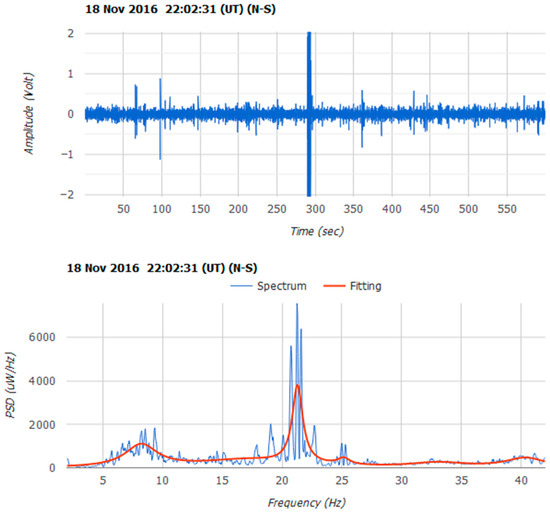
Figure 3.
A quasi-pre-seismic signal recorded two days before the 16 November 2016 4.8 M EQ at Kilkis in Northern Greece. The red curve is a typical Lorentzian fit.
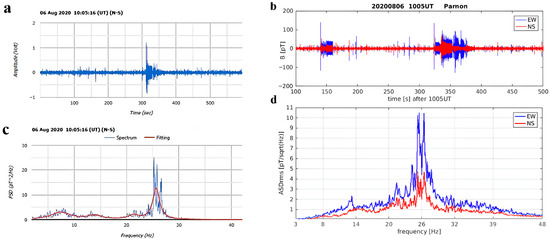
Figure 4.
Simultaneous recordings of the Greek (left, a,c) and the Polish (right, b,d) systems ten days before a 5.0 M EQ occurred in the sea area of island Hydra, 100 km away from the recording point.
From the above actions and diagrams, the following preliminary conclusions can be drawn. At first, the recording of the same signal at two different stations more than 300 km apart one in the North and one in the South, rules out the possibility of a local origin. This must be a phenomenon that covers a wide area and is recorded independently of the recording location. Furthermore, the simultaneous appearance of this characteristic pattern in two different recording systems (Greek and Polish) eliminates the possibility of interference, instrumental malfunction or mechanical failure.
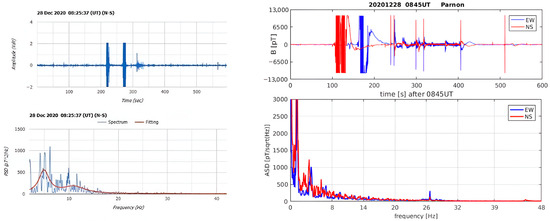
After ruling out the local origin of the signal and the failure of the recording systems, our effort focused on excluding external factors that could have caused these signals. For this purpose, a series of simple experiments were conducted, where various noises were intentionally generated to determine whether the signals were caused by random events. Specifically, a series of human-made noises were produced, such as the simulation of an artificial EQ with system vibrations, banging on metal objects, gunshots, passing cars, loud music, etc. [27]. The results showed that none of these human-induced factors could produce the signals shown in Figure 2, Figure 3 and Figure 4. It was crucial to exclude the primary candidate for creating quasi-pre-seismic signals, namely seismic ground vibrations. To achieve this, we artificially generated EQs by manually vibrating the coils in all directions. Figure 5 shows the recordings made after the vibrations were induced in the coils to simulate a seismic tremor. It is clear that ground vibrations do not produce signals similar to those in Figure 2, Figure 3 and Figure 4. Finally, the results of all these experiments indicated that no known human activity can produce the signals shown in Figure 2, Figure 3 and Figure 4.
Following these findings, the most fundamental question of this evaluation remains to be discussed:
Are these abnormal SR signals actually pre-seismic or not?
In a series of publications [26,27,28,29], we have examined a significant number of signals that we have classified as pre-seismic, because all of them occur within twenty days before an upcoming EQ. Empirical assumptions have been appointed that the EQ magnitude should be greater than about 4 M on the Richter scale and that its epicenter should lie no more than 250 km away from the recording station. To determine whether these signals are truly pre-seismic, the following question must be asked:
If there were no earthquakes, would these signals still occur or not?
In simple terms: do these signals happen because of impending EQs, or would they occur regardless of whether EQs are present? To give a valid answer to this question, we considered examining SR observations in another country that is not seismically active like Greece or other Mediterranean countries, to see whether such signals appear in the recordings without the presence of EQs. A country that fits this description perfectly is Poland, where systematic SR observations are conducted, but which is not a seismically active country. For this purpose, recordings from the Hylaty monitoring station—located on the southern border of Poland with Slovakia and Ukraine—were used (Figure 6).
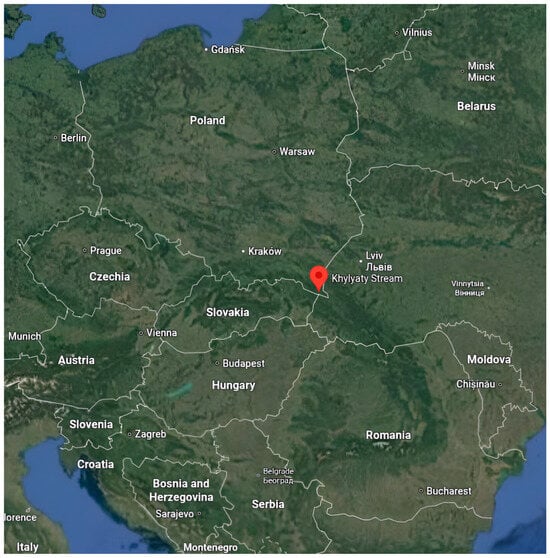
Figure 6.
Map of the Hylaty station area in Poland close to the borders with Slovakia and Ukraine.
In Figure 7, recordings from a period of fourteen months and ten days are shown (01/01/2024–10/03/2025). Each point in this figure has been calculated as follows: we took the average height of the spectrum in the 20–30 Hz range and compared it with the average height of the spectrum on either side of that range—specifically, 0–20 Hz and 30–50 Hz. Points that exceed the red line at the value of 2 indicate a bulge in the 20–30 Hz range, namely the average height of the spectrum in the area 20-30 Hz is more than twice the average of the neighboring ranges 0–20 Hz and 30–50 Hz. This is a strong indication that these points exhibit similar patterns to those shown in Figure 2, Figure 3 and Figure 4.
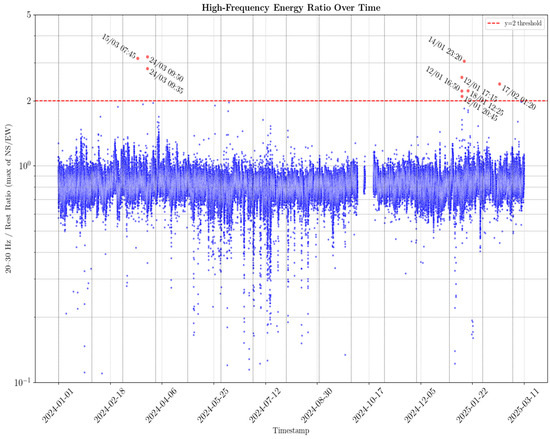
Figure 7.
Comparative spectrum recordings between the 20–30 Hz range and the 0–20 Hz and 30–50 Hz ranges. Each point represents the ratio of the average amplitude in the 20–30 Hz range to the average of the 0–20 Hz and 30–50 Hz ranges. Points that exceed the threshold of 2 (red line) imply the presence of a bulge similar to that in Figure 2, Figure 3 and Figure 4.
From Figure 7 it follows that in the entire 14.5-month recording period, only 8 points exceed the threshold line at value 2 and thus warrant further investigation. It must be emphasized that during the period covered by Figure 7, no EQs occurred in the wider Hylaty region, even at distances greater than 500 km.
Four of the eight Polish recordings that exceeded the 2x threshold are shown in Figure 8. At first glance, they resemble pre-seismic signals like those in Figure 2, Figure 3 and Figure 4, but closer inspection of the raw data reveals sinusoidal variations unlike the sharp patterns of the typical pre-seismic signals. The other four signals are similar. The difference in the raw data recordings between Figure 2, Figure 3, Figure 4 and Figure 8 shows that the recordings from the Hylaty station are unrelated to those from the Greek Stations but represent a rather different phenomenon. Thus, it is highly unlikely that Figure 2, Figure 3, Figure 4 and Figure 8 represent the same phenomenon.
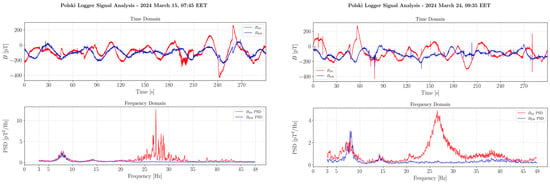

Figure 8.
Four of the eight figures that show similarities with possible pre-seismic signals at the Hylaty Polish station.
In contrast, during the same period (01/01/2024–10/03/2025), at the Parnon station in Greece, 82 signals were recorded and 53 EQs occurred within a 250 km radius from the recording site (see Table 1). The quantitative difference between HYLATY and Parnon during the period 01/01/2024–10/03/2025, is obvious.

Table 1.
Summary of results for the SR signal recording period at the Southern Station (Parnon).
Table 1 lists the following:
- Column 1: Years with available SR recordings.
- Column 2: Number of days on which measurements were taken.
- Column 3: Number of relevant EQs (magnitude ≥ 4 M, distance ≤ 250 km).
- Column 4: Average number of days between two successive relevant EQs.
- Column 5: Number of abnormal signals that appeared before an EQ.
- Column 6: Number of “orphan” signals (not corresponding to an EQ.
- Column 7: Percentage of SR signals that are observed prior to EQs.
Having ruled out the possibility that the signals in Figure 2, Figure 3 and Figure 4 are due to local effects, mechanical failure, anthropogenic influences, and occurrence in non-seismic areas, a key question remains:
Do these abnormal SR signals correlate with upcoming EQs, or do they stem from an unrelated mechanism?
3. Discussion
From the detailed study of the summary signals in Table 1, the following points arise, which need to be discussed. First, we observe a very good correlation between the appearance of EQs and signals (column 7). The only exception is year 2022, during which signals appear without corresponding EQs. Notably, these “orphan” signals appear within a narrow time frame of a three-month period (June–August 2022), which opens the possibility for various speculations, such as these signals being linked to EQs that were expected but did not ultimately occur for some reason.
However, there is another question that raises doubts. The EQs of interest—those with magnitudes greater than 4 M within 250 km from the recording station—are numerous (column 3). On average, at least 1–2 EQs occur each month, and there are months with almost 5–6 EQs. Since all authors dealing with this subject argue that pre-seismic signals appear up to three weeks before an EQ, this means that a signal cannot be associated with a specific EQ. Within the following three weeks after the signal’s appearance, up to six EQs may have occurred in various places around the recording station, making it impossible to determine which one (or which ones) were responsible for the signal, if any.
Furthermore, the great number of EQs introduces an additional complication. If the so-called pre-seismic signals are not pre-seismic at all but rather result from another unrelated mechanism, their appearance before EQs could simply be attributed to the large number of EQs. If the recorded abnormal SR signals are placed randomly inside the observation period, the large number of EQs in the Greek region would certainly place them within 20 days before an EQ. This suggests a high probability of coincidental overlap, rather than a systematic relation between seismic activity and abnormal SR signals.
The above confirms the complexity of the seismic phenomenon and the difficulty in predicting it. It also confirms that case studies can serve as the starting point for a systematic study of a phenomenon, but in no way do they constitute confirmation or lead to a final conclusion. The key conclusions derived from the above discussion may be summarized as follows:
- These recordings are not a local phenomenon (i.e., a peculiarity in the region of the EQ origin) because they are observed across the entire Greek mainland.
- These signals do not seem to appear in non-seismic countries like, e.g., Poland.
- These signals are real physical phenomena and are not caused by material failure or various anthropogenic activities around the recording station.
Based on the above findings, one might be led to conclude that the SR signals, as described, provide strong evidence of an impending EQ. However, additional issues need to be addressed before reaching this conclusion. The primary issue is the issue of coincidental correlation with EQs that we have already discussed. The dismissal of the pre-seismic nature (precursory) of SR signals through coincidental correlation suggests that further analysis of the potential pre-seismicity of SR signals is required before a definitive conclusion can be drawn.
4. Conclusions and Suggestions
A preliminary point reinforced by this study that needs to be emphasized is that case studies may serve as a starting point for broader studies, but they do not provide a secure foundation for drawing conclusions, as they often generate optimism that does not always lead to a reliable prediction. Regarding the case of abnormal SR signals as pre-seismic indicators, while all case studies were particularly encouraging, at times impressive, an extensive study of them over time led to several unresolved issues.
The question of the pre-seismic nature of these signals remains open, and additional actions need to be taken to clarify the nature of these signals. In our opinion, an action that could definitively resolve this issue would be to record these signals in a country or region where very few EQs occur—no more than one EQ every three months, on average. This would address both the issue of pre-seismicity (signal appearance 1 to 3 weeks before an EQ) and the issue of coincidental correlation (signals due to an unknown mechanism appearing to be pre-seismic due to the large number of EQs).
Another action that could provide answers to these questions would be to correlate these signals with other potential pre-seismic signals predicted by the LAIC scenario, such as changes in atmospheric electrical conductivity, disturbances in TEC (Total Electron Content), the Earth’s magnetic field, changes in the ionospheric height or other parameters. An alternative research approach would be to focus on the period between June and August 2022, when fifty signals appeared without any accompanying EQ. This suggests two possibilities: either the region was preparing for one or more EQs that did not occur, or the SR signals are not pre-seismic, but are caused by some other mechanism. Ultimately, this period (June–August 2022) might hold the key to revealing the origin of these signals.
Author Contributions
Conceptualization, V.T.; methodology, V.T., I.C. and E.C.; software, E.C.; validation, I.C., J.M., E.C. and J.K.; formal analysis, I.C. and E.C.; investigation, V.T. and J.M.; resources, V.T. and J.M.; data curation, E.C.; writing—original draft preparation, V.T.; writing—review and editing, V.T., I.C. and J.M.; funding acquisition, I.C. All authors have read and agreed to the published version of the manuscript.
Funding
This work was funded by the Sectoral Development Program (OΠΣ 5223471) of the Ministry of Education, Religious Affairs and Sports, through the National Development Program (NDP) 2021-25.
Institutional Review Board Statement
Not applicable.
Informed Consent Statement
Not applicable.
Data Availability Statement
The original contributions presented in this study are included in the article. Further inquiries can be directed to the corresponding author(s).
Acknowledgments
We would like to express our gratitude to the Forest Service of the Lakonia Prefecture in Sparta, particularly Director G. Zakkas, and forest personnel S. Petrakos, K. Samartzis, N. Sourlis, and K. Tsagaroulis, for their invaluable contributions to the establishment and maintenance of our South Observation Site on Mount Parnon, near the village of Vamvakou. We would also like to extend our sincere thanks to the Mariolopoulos–Kanaginis Foundation for Environmental Sciences for their initial financial support, as well as to the Research Committee of the Academy of Athens for their supplementary assistance.
Conflicts of Interest
The authors declare no conflicts of interest.
References
- Tritakis, V. Seismicity Precursors and Their Practical Account. Geosciences 2025, 15, 147. [Google Scholar] [CrossRef]
- Hayakawa, M.; Molchanov, O.A. Seismo-electromagnetics: As a new field of radiophysics: Electromagnetic phenomena associated with EQs. Radio Sci. Bull. 2007, 2007, 8–17. [Google Scholar]
- Hayakawa, M.; Molchanov, O. (Eds.) Seismo-Electromagnetics: Lithosphere-Atmosphere-Ionosphere Coupling; Terra Scientific Publishing Company: Tokyo, Japan, 2002. [Google Scholar]
- Pullinets, A.S. Lithosphere-Atmosphere-Ionosphere Coupling Related to EQs. In Proceedings of the 2nd URSI AT-OASC, Gran Canaria, Spain, 28 May–1 June 2018. [Google Scholar]
- Pulinets, S.; Ouzounov, D.; Karelin, A.; Boyarchuk, K. EQ Precursors in the Atmosphere and Ionosphere; Springer: Dordrecht, The Netherlands, 2022. [Google Scholar]
- Pullinets, A.S.; Ouzounov, D. Lithosphere–Atmosphere–Ionosphere Coupling (LAIC) model—A unified concept for EQ precursors validation. J. Asian Earth Sci. 2010, 41, 371–382. [Google Scholar] [CrossRef]
- Hayakawa, M.; Schekotov, A.; Izutsu, J.; Nickolaenko, A.P. Seismogenic effects in ULF/ELF/VLF electromagnetic waves. Int. J. Electron. Appl. Res. 2019, 6, 1–86. [Google Scholar] [CrossRef]
- Zharov, V.E. Connection of the Earth’s Rotation with the Atmospheric Angular Momentum and the Strongest Earthquakes. Astron. Astrophys. Trans. 1996, 9, 317–327. [Google Scholar] [CrossRef]
- Fridman, A.M.; Klimenko, A.V.; Polyachenko, E.V.; Fridman, M.V. On relation of the global seismic activity of the Earth with features of its rotation. Volcanol. Seismol. 2005, 1, 67–74. [Google Scholar]
- Gross, R.S. Earth Rotation Variations—Long Period. Treatise Geophys. 2007, 3, 239–294. [Google Scholar]
- Wang, H.; Zhao, X.; Li, Y.; Chen, X. Relationship between Earth’s Rotation and Several Strong Earthquakes and Moderate-small Earthquakes Occurring around the Epicenter Regions Pior to Strong Earthquakes. Earthq. Res. China 2011, 25, 443–455. [Google Scholar]
- Levin, B.W.; Sasorova, E.V.; Steblov, G.M.; Domanski, A.V.; Prytkov, A.S.; Tsyba, E.N. Variations of the Earth’s rotation rate and cyclic processes in geodynamics. Geod. Geodyn. 2017, 8, 206–212. [Google Scholar] [CrossRef]
- Ambrosino, F.; Thinová, L.; Briestenský, M. Anomalies identification of Earth’s rotation rate time series (2012–2017) for possible correlation with strong earthquakes occurrence. Geod. Geodyn. 2019, 10, 455–459. [Google Scholar] [CrossRef]
- Ershkov, S.; Leshchenko, D.; Prosviryakov, E. Long-Time Dynamics of Earth’s Angular Rotation Depending on Quasiperiodic Solar Activity. Mathematics 2023, 11, 2117. [Google Scholar] [CrossRef]
- Schumann, W.O. On the free oscillations of a conducting sphere which is surrounded by an air layer and an ionosphere shell. Z. Naturforschaftung 1952, 7, 149–154. (In German) [Google Scholar] [CrossRef]
- Nickolaenko, A.; Hayakawa, M. Resonances in the Earth-Ionosphere Cavity. In Modern Approaches in Geophysics; Kluwer Academic Publishers: Dordrecht, The Netherlands, 2002. [Google Scholar]
- Nickolaenko, A.; Hayakawa, M. Schumann Resonance for Tyros; Springer: Berlin/Heidelberg, Germany, 2014. [Google Scholar] [CrossRef]
- Nishimura, T.; Okano, H.; Tada, H.; Nishimura, E.; Sugimoto, K.; Mohri, K.; Fukushima, M. Lizards respond to an extremely low-frequency electromagnetic field. J. Exp. Biol. 2010, 213, 1985–1990. [Google Scholar] [CrossRef]
- Athanasiou, M.A.; Anagnostopoulos, G.C.; Iliopoulos, A.C.; Pavlos, G.P.; David, C.N. Enhanced ULF radiation observed by DEMETER two months around the strong 2010 Haiti EQ. Nat. Hazards Earth Syst. Sci. 2011, 11, 1091–1098. [Google Scholar] [CrossRef]
- Hayakawa, M.; Ohta, K.; Sorokin, M.V.; Yaschenko, K.A.; Izutsu, J.; Hobara, Y.; Nickolaenko, P.A. Interpretation in terms of gyrotropic waves of Schumann—Resonance-like line emissions observed at Nakatsugawa in possible association with nearby Japanese EQs. J. Atmos. Terr. Phys. 2010, 72, 1292–1298. [Google Scholar] [CrossRef]
- Sorokin, M.V.; Pokhotelov, A.O. Gyrotropic Waves in the mid-latitude ionosphere. J. Atmos. Sol.-Terr. Phys. 2005, 67, 921–930. [Google Scholar] [CrossRef]
- Tatsis, G.; Votis, C.; Christofilakis, V.; Kostarakis, P.; Tritakis, V.; Repapis, C. A prototype data acquisition and processing system for Schumann resonance measurements. J. Atmos. Sol.-Terr. Phys. 2015, 135, 152–160. [Google Scholar] [CrossRef]
- Tatsis, G.; Christofilakis, V.; Chronopoulos, S.K.; Kostarakis, P.; Nistazakis, H.E.; Repapis, C.; Tritakis, V. Design and Implementation of a Test Fixture for ELF Schumann Resonance Magnetic Antenna Receiver and Magnetic Permeability Measurements. Electronics 2020, 9, 171. [Google Scholar] [CrossRef]
- Votis, C.; Tatsis, G.; Christofilakis, V.; Chronopoulos, S.; Kostarakis, P.; Tritakis, V.; Repapis, C. A new portable ELF Schumann resonance receiver: Design and detailed analysis of the antenna and the analog front end. EURASIP J. Wirel. Commun. Netw. 2018, 2018, 155. [Google Scholar] [CrossRef]
- Mlynarczyk, J.; Popek, M.; Kulak, A.; Klucjasz, S.; Martynski, K.; Kubisz, J. New Broadband ELF Receiver for Studying Atmospheric Discharges in Central Europe; Baltic URSI Symposium: Poznan, Poland, 2018. [Google Scholar]
- Christofilakis, V.; Tatsis, G.; Votis, G.; Contopoulos, I.; Repapis, C.; Tritakis, V. Significant ELF perturbations in the Schumann Resonance band before and during a shallow mid-magnitude seismic activity in the Greek area (Kalpaki). J. Atmos. Sol.-Terr. Phys. 2019, 182, 138–146. [Google Scholar] [CrossRef]
- Mlynarczyk, J.; Tritakis, V.; Contopoulos, I.; Nieckarz, Z.; Christophilakis, V.; Tatsis, G.; Repapis, C. Anthropogenic Sources of Electromagnetic Interference in the Lowest ELF Band Recordings (Schumann Resonances). Magnetism 2022, 2, 152–167. [Google Scholar] [CrossRef]
- Tritakis, V.; Contopoulos, I.; Mlynarczyk, J.; Christofilakis, V.; Tatsis, G.; Repapis, C. How Effective and Prerequisite Are Electromagnetic Extremely Low Frequency (ELF) Recordings in the Schumann Resonances Band to Function as Seismic Activity Precursors. Atmosphere 2022, 13, 185. [Google Scholar] [CrossRef]
- Contopoulos, I.; Mlynarczyk, J.; Kubisz, J.; Tritakis, V. Possible Identification of Precursor ELF Signals on Recent EQs That Occurred Close to the Recording Station. Atmosphere 2024, 15, 1134. [Google Scholar] [CrossRef]
Disclaimer/Publisher’s Note: The statements, opinions and data contained in all publications are solely those of the individual author(s) and contributor(s) and not of MDPI and/or the editor(s). MDPI and/or the editor(s) disclaim responsibility for any injury to people or property resulting from any ideas, methods, instructions or products referred to in the content. |
© 2025 by the authors. Licensee MDPI, Basel, Switzerland. This article is an open access article distributed under the terms and conditions of the Creative Commons Attribution (CC BY) license (https://creativecommons.org/licenses/by/4.0/).