4.1. Baseline Regression and Model Robustness Test
In order to ensure the accuracy of the research results, this study changes the sample size by changing the sample data selection time period, and tests the stability of the model on the basis of changing the sample size. The data in
Table 4 shows that the analysis results of panel data with different sample sizes show good model stability. The sign direction of the variable does not change, and the variation range of the regression coefficient is small. The
Appendix B presents the model robustness test of the transformation variables, and tests the adaptability of forestry investment variable in the model through the transformation of forestry indicators.
According to the national panel data analysis, the factors influencing total carbon emissions, ranked in descending order of the impact of each factor on the total carbon emissions, are as follows: urbanization index (U), total population (lnP), technology level (lnT), forestry resources (lnF), water resources (lnW), economic development, and wealth level (lnA).
The urbanization index (U) has the highest impact coefficient on carbon emissions, indicating that urbanization is the main factor for the increase in carbon emissions in China. In this study, the new urbanization index used in the calculation of urbanization index is used to examine the urbanization level of different regions from multiple dimensions such as economic growth and social development. This shows that the new urbanization index will still significantly increase the increase in carbon emissions in the short term.
The coefficient of the variable total population (lnP) is positive, indicating that the indicator changes in the same direction as carbon emissions. In general, there is a positive correlation between the total population and carbon emissions. The findings presented here must be interpreted within a specific historical context. In recent years, China has experienced a precipitous decline in births, leading to a slowdown in population growth across many regions. Despite this demographic shift, total carbon emissions have continued to rise. Nevertheless, the deceleration in population growth is expected to contribute to the long-term control of aggregate carbon emissions.
The impact of technology level of carbon emissions (lnT) on carbon emissions is also positive, which shows that China’s economic growth still depends on high-intensity energy input, and a large number of carbon emissions are generated. In this study, forestry investment is used to represent the increase, protection, and development of forestry resources.
The impact of forestry resources (lnF) on carbon emissions is also positive, which shows that the impact of people on forestry resources promotes the increase in carbon emissions. The carbon emission benefit of forestry resource investment needs to be improved. This is an interesting discovery, which has a specific impact mechanism behind it. The mechanism of the positive impact of forestry investment on carbon emissions may be as follows: (1) Forestry investment has short-term effects on carbon emissions. For example, the use of logging machinery, forestry related infrastructure construction, and reforestation in forestry investment causes large short-term carbon emissions. (2) Forestry investment has not reached the state of return to scale, or has entered the range of no return to scale. (3) Low investment efficiency caused by low level of forestry technology. The economic and ecological benefits of forestry investment need to be improved.
Water resources (lnW) and economic development and wealth level (lnA) have a negative impact on carbon emissions, indicating that both factors contribute to emission reduction through specific mechanisms. Areas rich in water resources are more suitable for the development of hydropower and water conservancy projects and the application of clean energy such as hydropower to achieve carbon emission reduction. This study uses per capita GDP to represent the level of economic development and wealth. Regions with high per capita GDP have generally more advanced and well-established industrial structures, scientific and technological innovation capabilities, educational level, infrastructure systems, etc. Economic development and wealth level reflect the quality of economic and social development to a certain extent, and high-quality development is conducive to reducing carbon emissions.
Table 5 shows the regional differences in carbon emission mechanisms. The panel data analysis of sub regions shows that there is significant heterogeneity between regions. The population factor is the mechanism to promote the growth of carbon emissions in different regions. Wealth level, technical factors of carbon emission intensity, urbanization, water resources, and forestry factors all have the characteristics of regional carbon emission impact differentiation. In regions with higher levels of economic development, such as East China, South Central China and Southwestern China, the impact of wealth indicators on carbon emissions is negative. There are four factors that have a negative impact on carbon emissions in the northwest and central and southern regions with better carbon emission reduction mechanisms. The North China region exhibits the fewest negative influencing factors on carbon emissions, indicating that its carbon reduction mechanisms require further improvement.
A common feature in both the Yangtze River Basin and the Yellow River Basin is the negative impact of water resources on carbon emissions. Abundant water resources facilitate the development of clean energy sources such as hydropower and support the substitution of traditional thermal power generation.
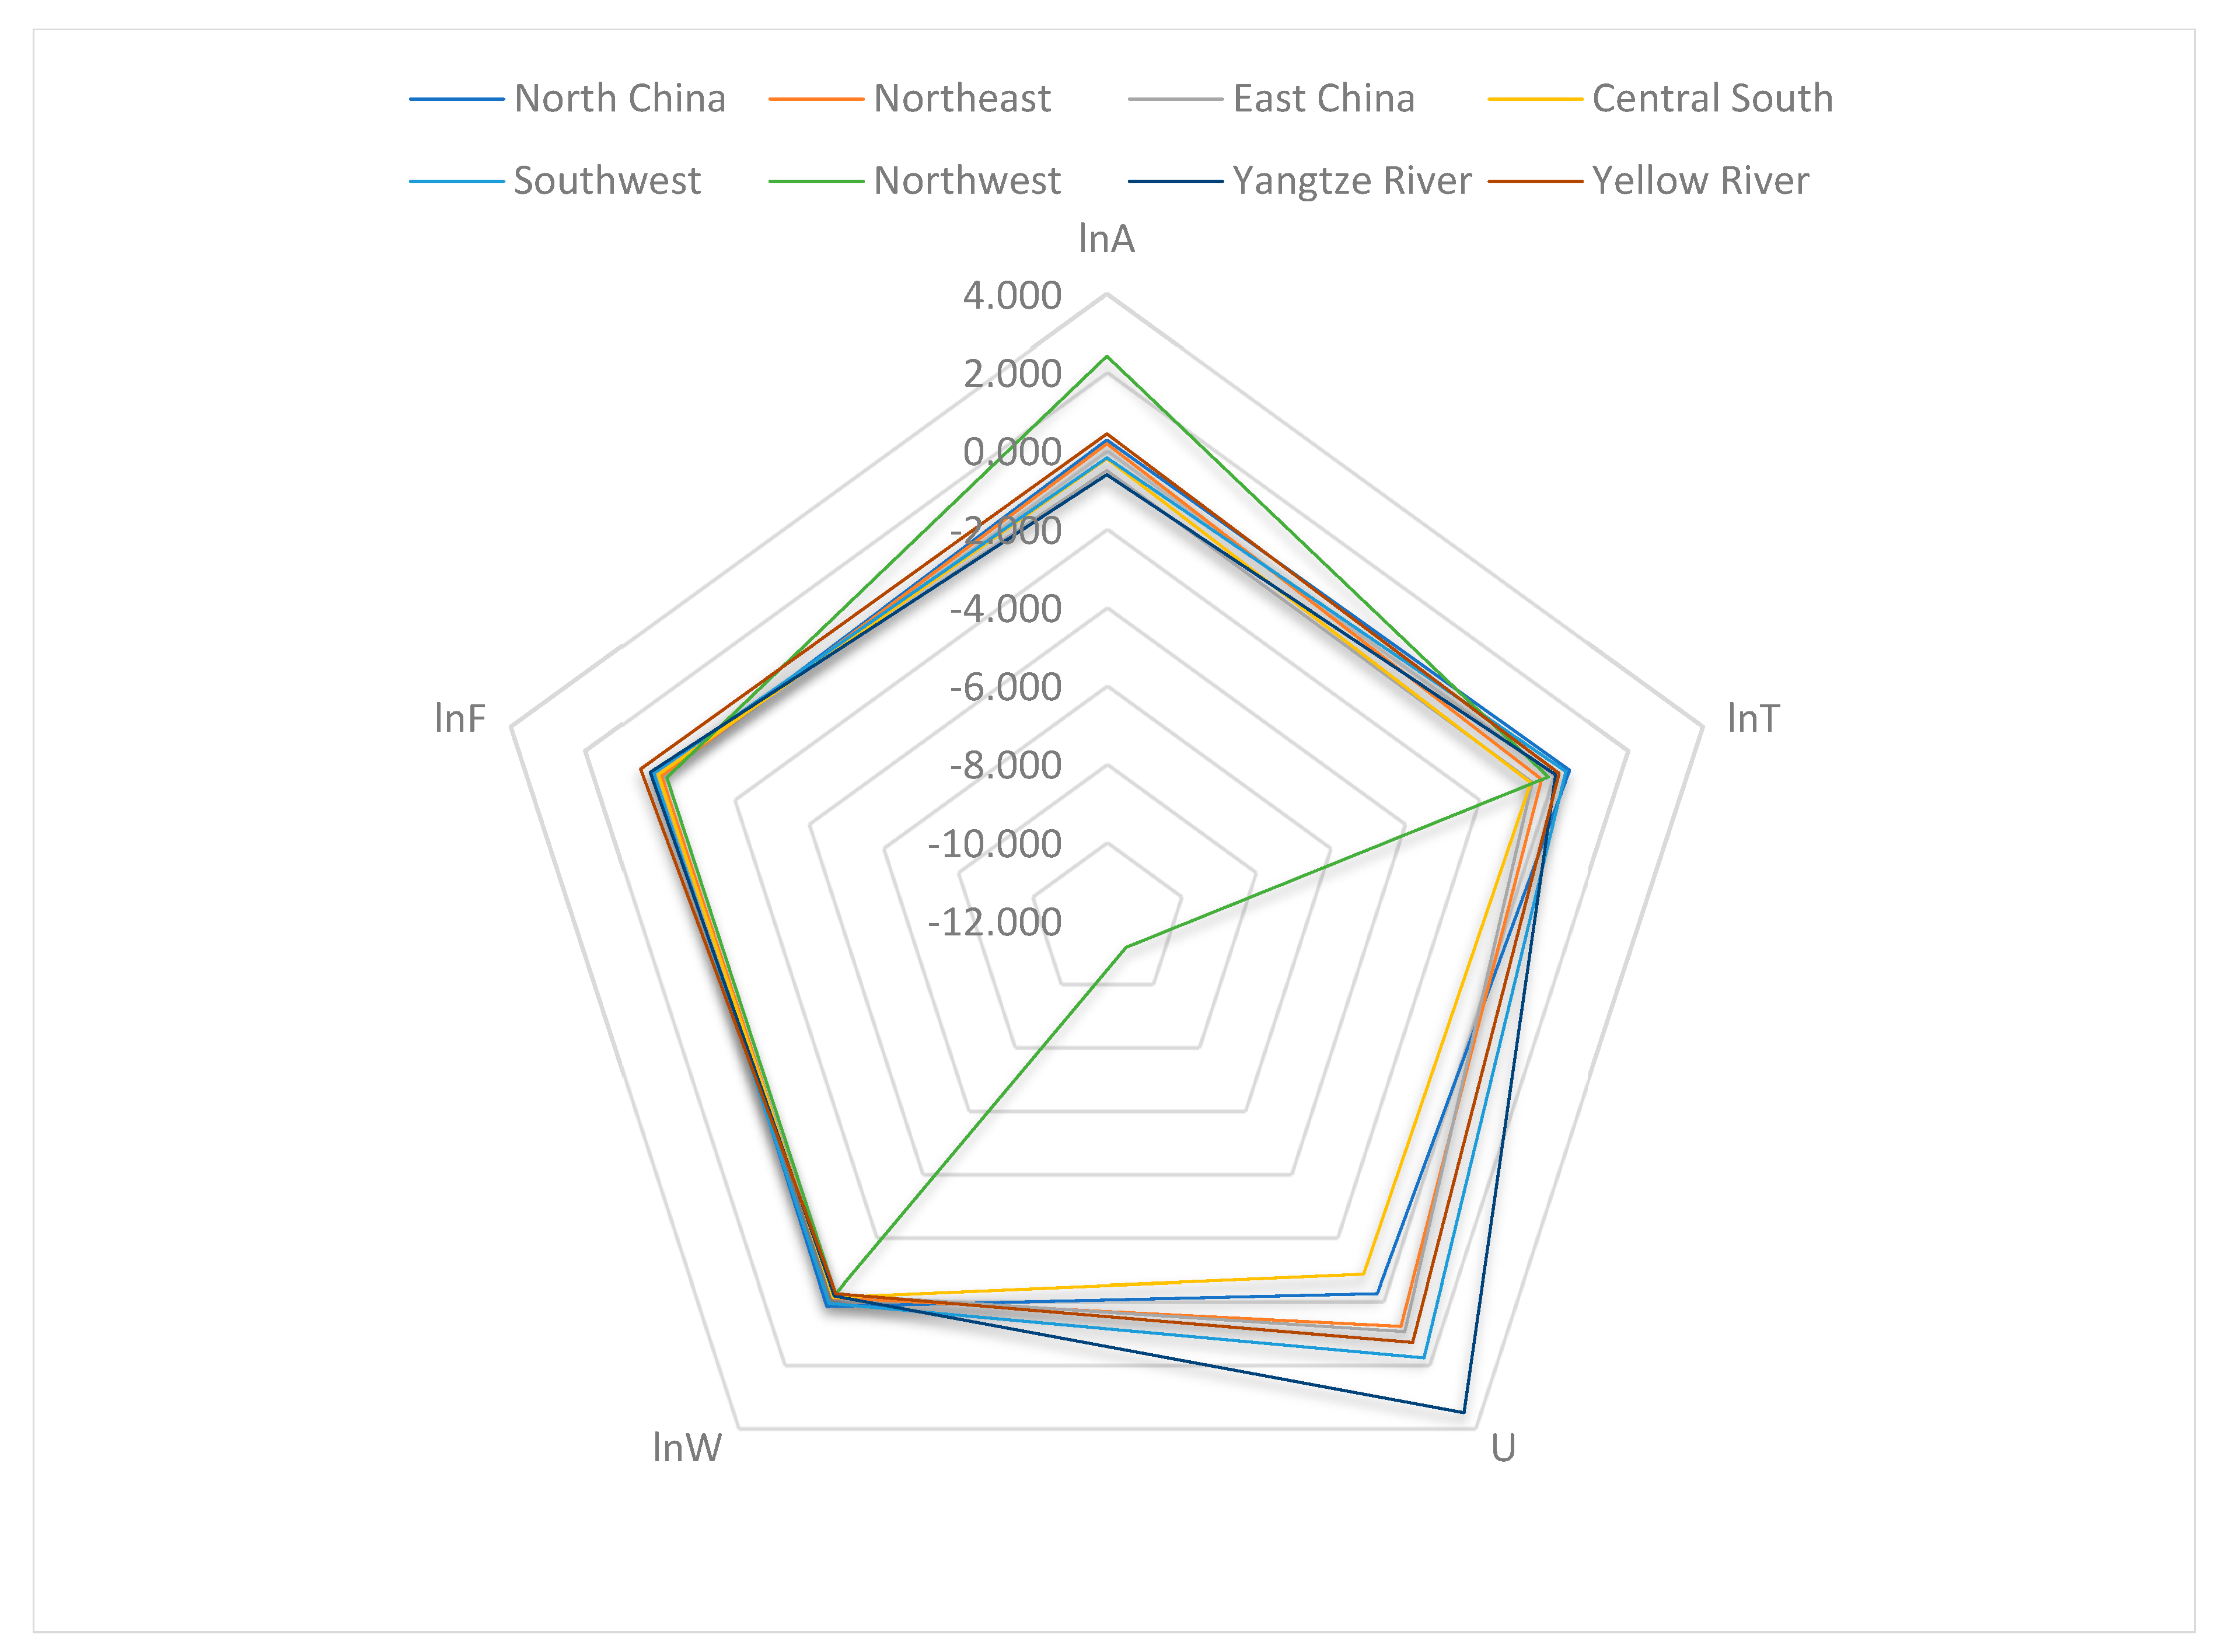
Figure 3 shows the regional differences in the carbon emission mechanism. If the Pentagon of a region converges to the center, the carbon emission mechanism tends to be eco-friendly. The figure shows that the regional difference in carbon emission mechanism mainly comes from the difference in urbanization index (
U), followed by the difference caused by
lnA.
4.2. Impact Mechanism of Urbanization, Water Resources and Forestry Coupling on Carbon Emissions
The difference in carbon emissions in different regions may be mainly caused by the different coupling degrees of urbanization, water resources, and forestry. By introducing coupling degree as a control variable, the underlying mechanisms influencing regional carbon emissions can be evaluated more accurately. To ensure the accuracy of the research results, this analysis changes the sample size by changing the sample data selection time period, and tests the stability of the model on the basis of changing the sample size. The data in
Table 6 shows that the results of panel data analysis with different sample sizes demonstrate relatively high model stability. The sign direction of the variable does not change, and the variation range of the regression coefficient is small. The model with coupling control variable has better stability and higher coefficient regression significance.
From the national panel data analysis (
Table 6), it is found that the factors affecting total carbon emissions are ranked in descending order of impact as follows: urbanization index (
U), total population (
lnP), wealth level (
lnA), and technology level (
lnT), forestry resources
(lnF), water resources (
lnW), and the coupling degree of urbanization, water resources and forestry development. The urbanization index (
U) has the highest impact coefficient on carbon emissions, indicating that urbanization is the main factor for the increase in carbon emissions in China. The coefficient of the variable total population (
lnP) is positive, which indicates that the indicator changes in the same direction as carbon emissions. The impact of technology level of carbon emissions (
lnT) on carbon emissions is also positive, which shows that China’s economic growth still depends on high-intensity energy input, and a large number of carbon emissions are generated. The impact of wealth level (
lnA) on carbon emissions is also positive.
Forestry resources (
lnF) and water resources (
lnW) have a negative impact on carbon emissions. Water resources and forestry development activities have a mechanism to reduce carbon emissions. Areas rich in water resources are more suitable for the development of hydropower and water conservancy projects and the application of clean energy such as hydropower to achieve carbon emission reduction. The coupling degree has a negative impact on carbon emissions, which fully illustrates the importance of coordinated development of urbanization, water resources, and forestry resources. The coefficient of
Cuwf (−13.653) means that the 0.01 unit change in the coupling index has a relatively negative impact on 13.653% of the emission coefficient. In view of China’s vast territory and unbalanced regional development, it is imperative to analyze the regional differences in carbon emission mechanisms. The analysis results are shown in
Table 7. The regression results show that the impact mechanism of carbon emission in most regions is similar to the overall situation of the country. Population, wealth, technology, and urbanization all show a positive impact on carbon emission, which is consistent with the reality of China’s social and economic development.
The data in
Table 7 shows that the heterogeneity of carbon emission mechanisms among different regions has decreased after the coupling control variable is incorporated. Different regions and watersheds show similar carbon emission impact mechanisms, and the total population, wealth level, carbon emission intensity, and urbanization all show positive effects. This suggests that various influencing factors of carbon emissions in the process of economic growth and urbanization have an impact on different regions. There is no fundamental difference in the carbon emission mechanism in different regions of China, and the difference is mainly reflected in the degree of influence of the influencing factors. Water resources and forestry have a negative impact on carbon emissions, especially when the coupling degree of urbanization, water resources, and forestry is taken into account.
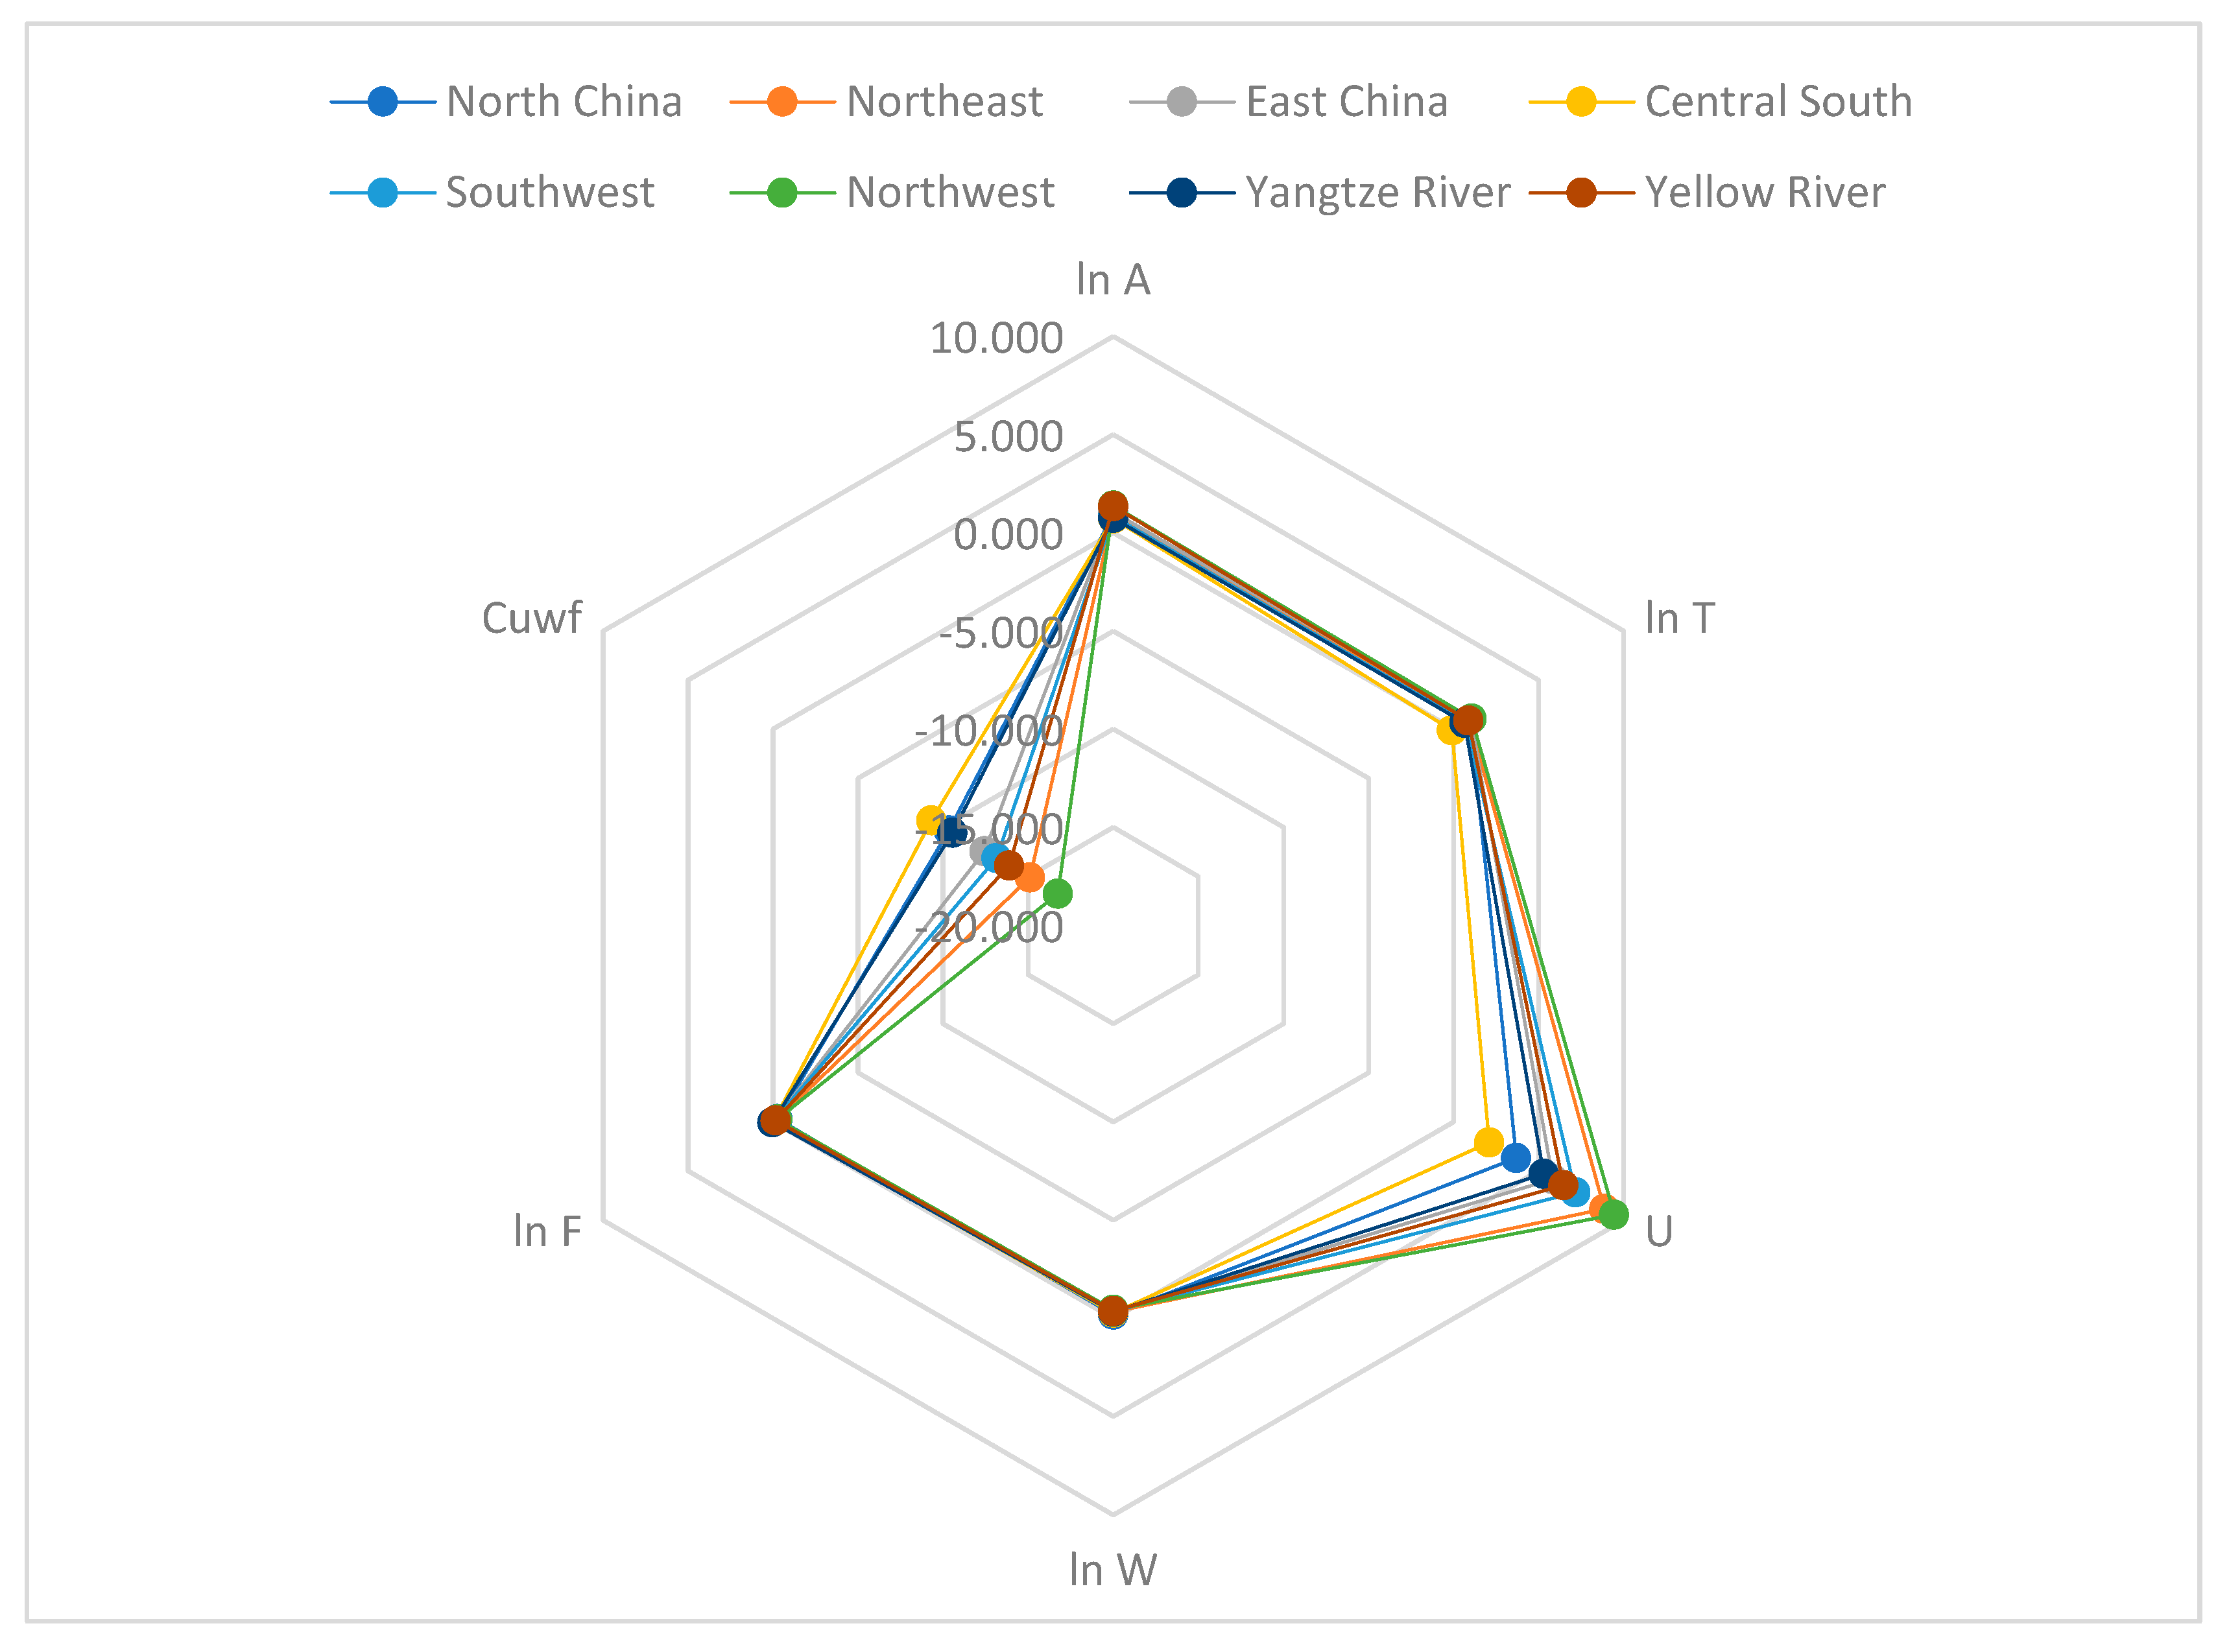
Regions with high coupling degree of urbanization, water resources, and forestry can better promote the coordinated development of economy and environment. For example, Inner Mongolia’s afforestation initiatives demonstrate synergistic interactions by simultaneously advancing ecological conservation and economic development, thereby fostering complementary relationships across all three subsystems. Regional analysis reveals distinct patterns of system coordination. Collaborative dynamics characterize Kunming, Yuxi, and Honghe in Yunnan Province, areas concentrated in central and southern regions where elevated economic development levels, optimized industrial structures, and integrated water resource management during urban construction processes yield superior overall coordination. The regional difference in carbon emission mechanism under the adjustment of coupling degree is shown in
Figure 4. The figure shows that the coupling degree of urbanization and urbanization, water resources, and forestry are the main factors causing the difference in carbon emission mechanism.
4.3. Heterogeneity Analysis
With the continuous promotion of urbanization, a large number of rural populations are transferred to cities, and the number of urban populations is increasing, leading to the increase in the demand for infrastructure and the serious problem of carbon emissions while driving the regional economic development. However, the agglomeration of population can bring scale effect, as well as knowledge and technology spillover effect, thereby reducing regional carbon emissions. This study argues that regional carbon emissions are closely related to the level of economic development, population, and human capital. It mainly analyzes the heterogeneity of regional carbon emissions from the perspective of urban economic scale, population scale, and human capital level.
The economic development level has different effects on regional carbon emissions. In the early stage of economic development, when the level of social production is low, the industrial structure is dominated by the secondary industry. In order to meet the needs of people’s lives, enterprises increase material production, increase infrastructure construction, etc., and the consumption of resources and energy increases, aggravating the problem of carbon emissions. When the economy develops to a relatively developed level, the public’s awareness of environmental protection gradually increases, the government’s environmental regulation efforts are improved, the industrial structure is transformed and upgraded, and the technical level and energy utilization efficiency is improved, contributing to the reduction in regional carbon emissions.
From the perspective of urban population scale, the increase in regional population is conducive to the formation of scale effect, the promotion of industrial agglomeration, the encouragement of enterprises’ specialized and cleaner production, the improvement in energy efficiency, and the reduction in carbon emissions. On the other hand, the improvement in agglomeration improves the level of regional economic development, and the government and enterprises have a positive awareness of environmental protection, which is conducive to energy conservation and emission reduction. However, the population agglomeration will also have a crowding effect, increasing the production and living costs.
According to the endogenous economic growth theory, the improvement in human capital will stimulate the spillover effect of knowledge and technology, thereby improving energy efficiency and promoting the reduction in regional carbon emissions. When the regional human capital level is low, most of the labor force is limited to agriculture or traditional industrial production, which is not conducive to the optimization and upgrading of the industrial structure, resulting in high energy consumption and rising carbon emissions. However, in areas with high human capital, the scientific and technological level is more advanced, which is more conducive to the research, development, promotion, and application of cleaner regional production technology, and addressing the problem of carbon emissions from the source.
In order to test the difference in the impact of economic development, urban population, and human capital scale heterogeneity on carbon dioxide emissions, this paper divides the research samples into high and low groups according to the total economic output, the number of urban population, and the number of people with regional higher education degrees, and carries out panel data regression, respectively. The regression results are shown in
Table 8.
Economic development has a significant heterogeneous impact on carbon emissions. Wealth indicators and forestry variables in regions with high economic output have a negative effect on carbon emissions, while water resources and coupling variables in regions with low economic output have a negative effect on carbon emissions. The impact coefficient of the urbanization index on carbon emissions in regions with large economic scale (1.774) is considerably smaller than that in regions with low economic scale (7.089). A possible explanation is that economically advanced regions benefit from relatively abundant fiscal revenue, higher public demand for environmental quality, more advanced scientific and technological capabilities, and greater efficiency in pollution management. With the continuous improvement in economic level, the positive externalities of urbanization gradually emerge, which is conducive to reducing regional carbon emissions, while regions and cities with low development may still be in the stage of industrialization and undertake more pollution-intensive industries relocated from developed regions.
Regions with large urban population and those with small urban population have similar carbon emission mechanisms, with various factors influencing carbon emissions in the same direction. The impact of heterogeneity of urban population size on carbon emissions is mainly reflected in the numerical difference in regression coefficient. Regions with larger urban population have smaller regression coefficients, indicating lower carbon emission intensity. A possible explanation is that the emission reduction effect of economies of scale and agglomeration effect brought by population agglomeration in large and medium-sized cities is greater than that of the increase in people’s demand for infrastructure. For small cities, the advancement of urbanization leads to substantial energy consumption, thereby diminishing the positive externalities of urbanization on carbon reduction.
The heterogeneity in how human capital affects carbon emissions exhibits a mechanism similar to that of urban population size. Regions with high levels of human capital demonstrate lower carbon emission coefficients, particularly reflected in the urbanization indicator. A potential explanation is that in areas with high human capital, during the early stages of urbanization, population agglomeration led to congestion effects, and increased demand for infrastructure prompted greater production and construction of related facilities, thereby exacerbating carbon emissions. However, after urbanization reached a critical threshold, further urban development facilitated more efficient resource sharing and widespread knowledge spillovers, which accelerated technological progress and promoted the development and application of clean production technologies. Consequently, the growth rate of regional carbon emissions slowed. In contrast, regions with lower human capital may lack the capacity for clean technology innovation due to relatively lower educational attainment, resulting in less advanced technology and lower energy efficiency.
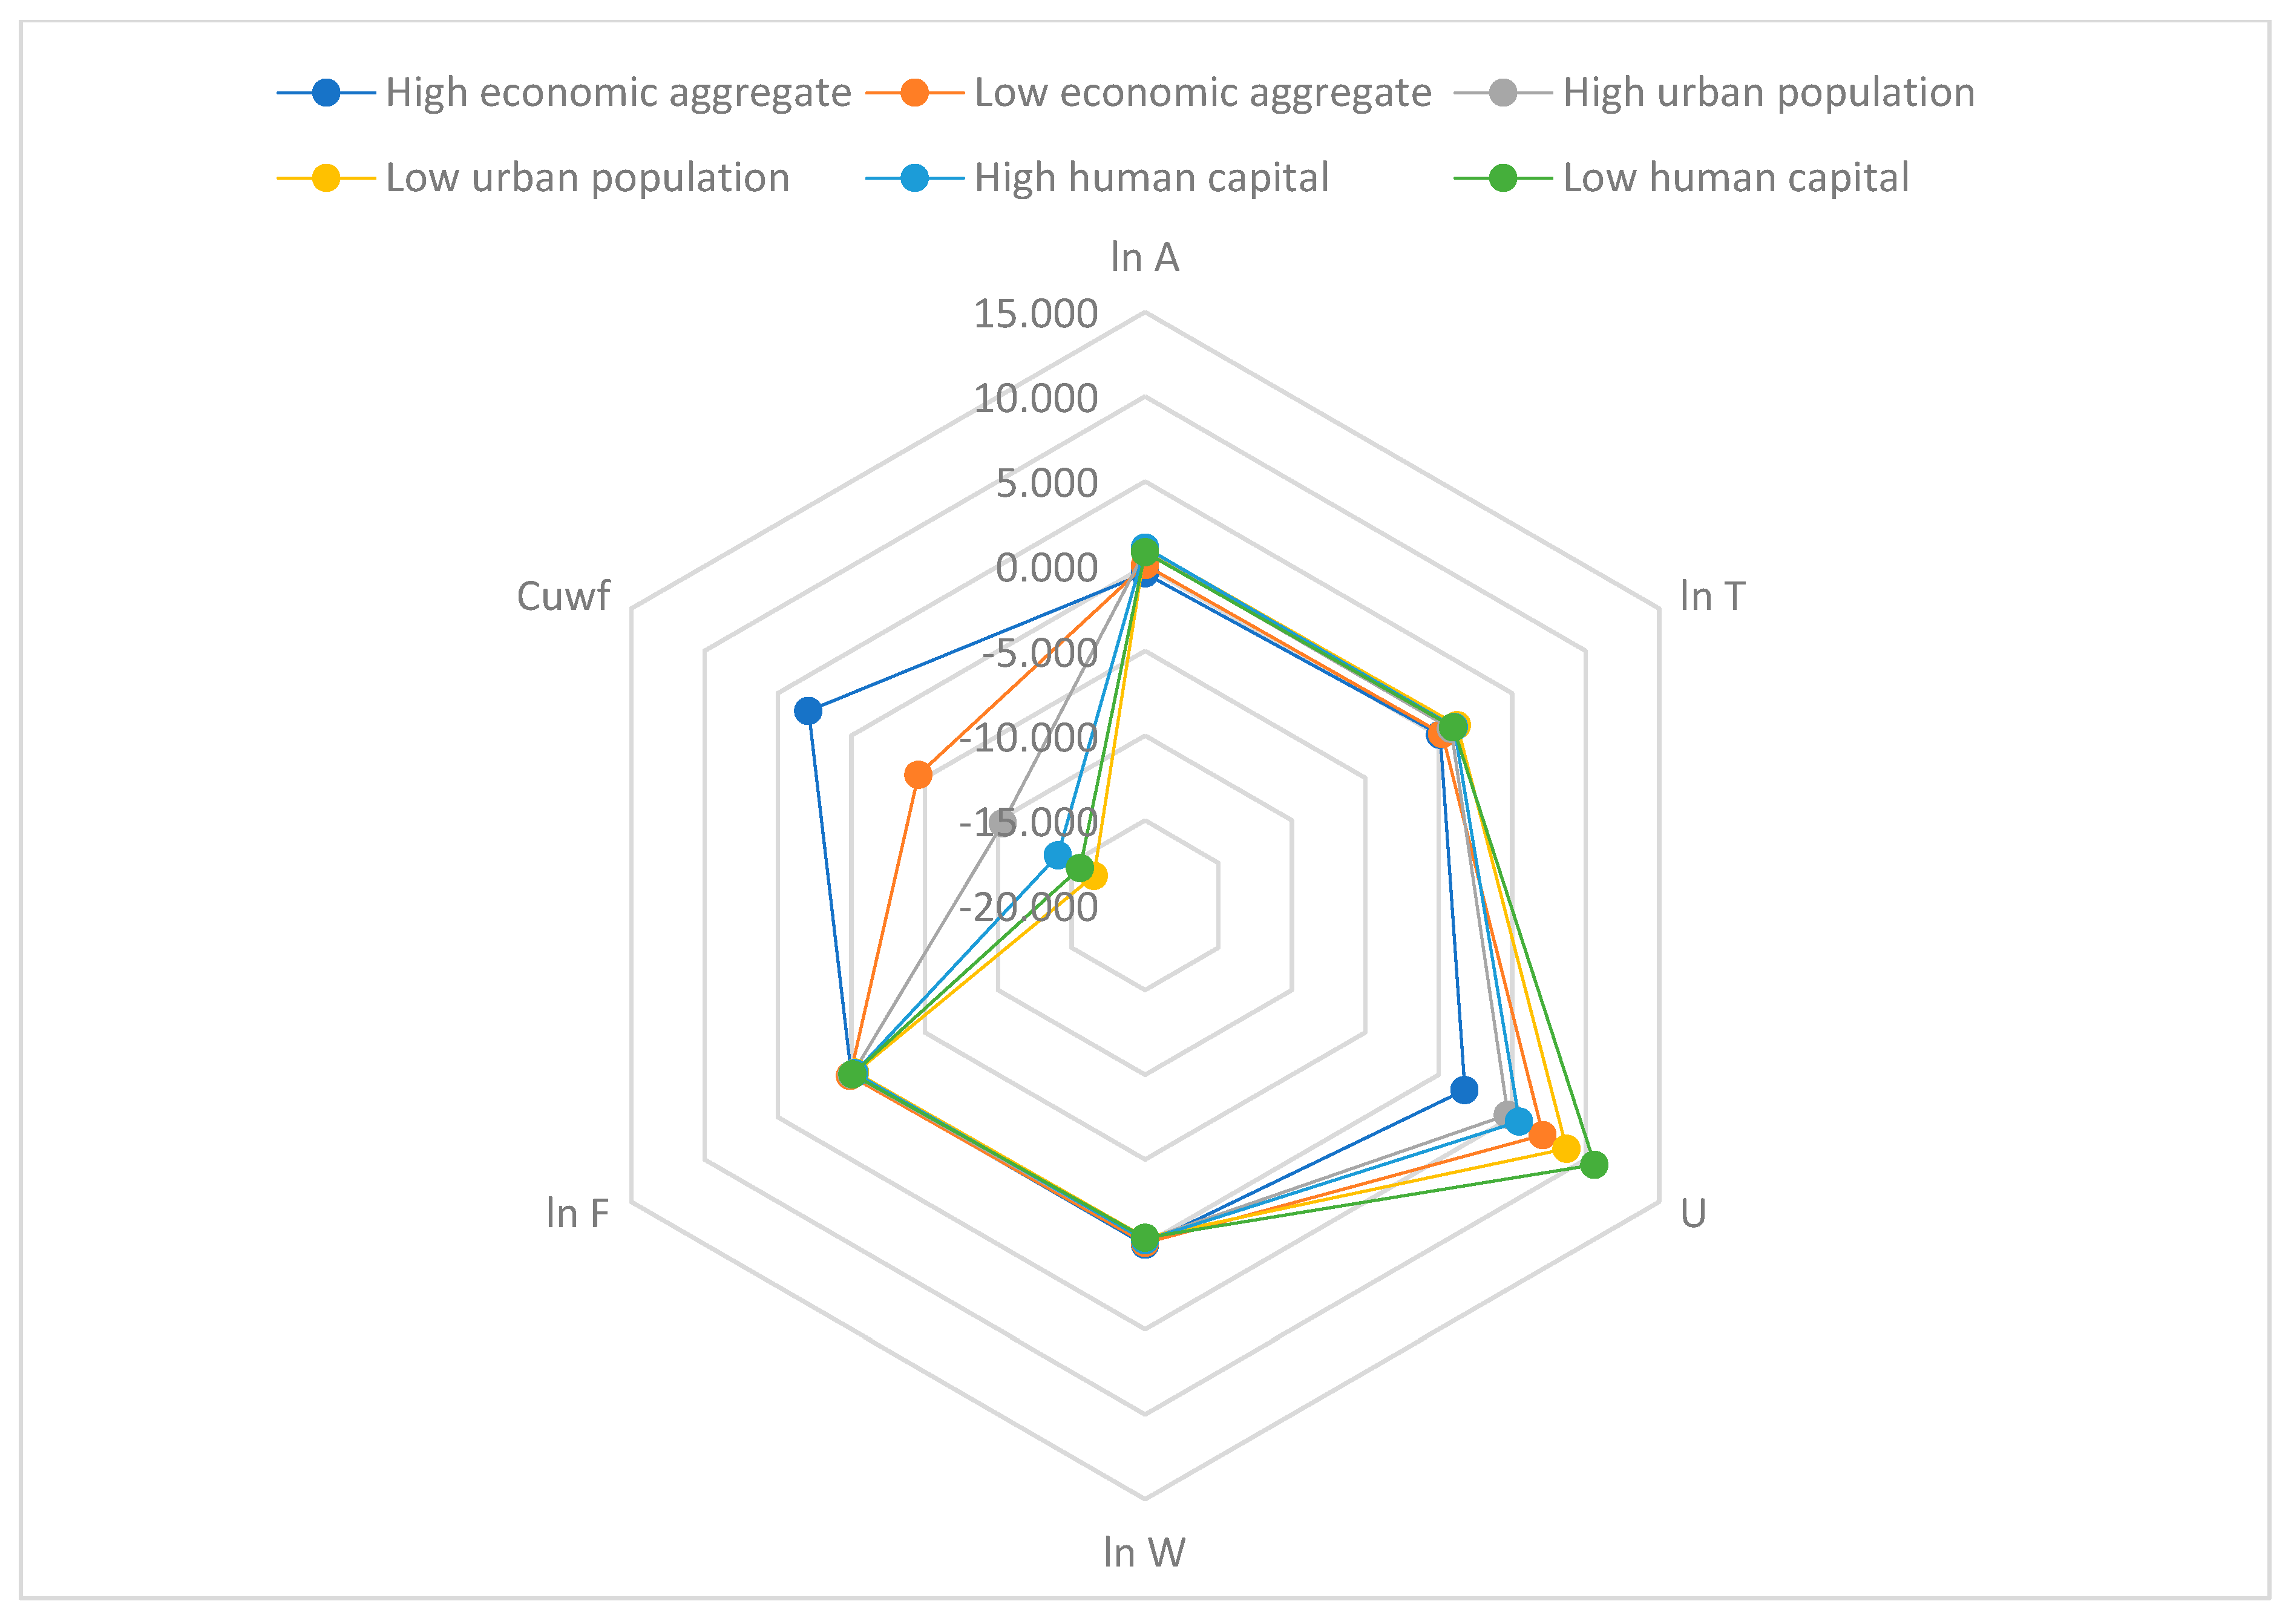
Figure 5 shows the difference in carbon emission mechanism in different regions under the condition of heterogeneity of environmental factors. Observing the figure, we can see that the source of the difference mainly lies in urbanization and its coupling with water resources and forestry.


