Article

Implications of East Pacific La Niña Events for Southern African Climate

1
Geography Department, University Zululand, KwaDlangezwa 3886, South Africa
2
Physics Department, University of Puerto Rico Mayagüez, Mayagüez, PR 00681, USA
Atmosphere 2025, 16(10), 1204; https://doi.org/10.3390/atmos16101204
Submission received: 25 July 2025 / Revised: 22 August 2025 / Accepted: 12 September 2025 / Published: 17 October 2025
(This article belongs to the Section Climatology)

Abstract

Longitudinal shifts in the zonal dipole associated with the El Niño–Southern Oscillation (ENSO) in the tropical Pacific have implications for the summer climate of Southern Africa. These features are studied via Empirical Orthogonal Function analysis applied to monthly standardized sea temperatures from 1 to 100 m in depth and spanning 1980–2024. The dipole exhibits two modes: central and east Pacific. The central mode has 4–7 yr oscillations, while the east mode has a periodicity of 3 yr and 8–14 yr, with a trend toward La Niña. Correlations are mapped with environmental fields around Southern Africa. During east-mode La Niña, there are low-level westerlies over the Kalahari Plateau that coincide with a warm-west Indian Ocean and neutral summer (Dec–Mar) weather conditions over Southern Africa. The weak climatic response across the Atlantic–Indian basins during east Pacific La Niña is linked to an isolated Walker cell that feeds tropical moisture into a trough over the dateline (180° W). It is the central mode that has greater influence over Southern Africa, by triggering global Walker cells that link with the Indian Ocean Dipole.

1. Introduction

The El Niño–Southern Oscillation (ENSO) is a coupled ocean–atmosphere phenomenon characterized by alternating thermocline slopes in response to variations in trade winds over the tropical Pacific Ocean [1,2,3,4,5]. The subtropical anticyclones induce Ekman divergence and equatorial upwelling typical of La Niña conditions. During El Niño events, the trade wind upwelling collapses, leading to a deeper thermocline in the east Pacific.
The oceanic response to trade wind fluctuations is modulated by subsurface Rossby waves that propagate westward over timescales spanning several years. On reaching the basin edge, they reflect eastward as equatorial Kelvin waves, i.e., forming a delayed oscillation [6,7,8,9,10,11]. The subsurface waves are slowed down by atmospheric coupling, setting the inter-annual rhythm for ENSO.
As the thermocline tilts back and forth, dipole patterns of the sea surface temperature (SST) link with the overlying Walker circulation, shifting deep convection across the Pacific basin [12,13,14,15]. Secondary circulations spread climatic anomalies across the Atlantic and Indian Oceans and continental monsoons [16,17]. ENSO signals tend to amplify during southern hemisphere summers when Hadley cell confluence nears the equator and promotes coupling between the Walker circulation and SST dipole [18,19,20]. Rising motion over the Maritime Continent warm pool generates diabatic heating and atmospheric Rossby wave trains, which slant eastward into higher latitudes [21]. These act as teleconnection pathways, linking the ENSO dipoles to mid-latitude jet streams and standing trough-ridge patterns. Summer rainfall across the southern subtropics usually increases under La Niña conditions, via sympathetic responses that involve upper easterlies over the Atlantic and cooling of the west Indian Ocean [22].
Intensified trade winds over the tropical east Pacific lift the thermocline and initiate a see-saw pattern that characterizes ENSO transitions and reversals of the Walker circulation. Although cold events tend to spread slowly westward from South America with subtropical ocean Rossby waves, equatorial Kelvin waves and associated air–sea interactions govern eastward propagating warm events [23,24,25,26]. Structural differences between central and east Pacific ENSO arise from distinct ocean–atmosphere coupling, responses to multi-decadal oscillations, and coastal upwelling off South America [27]. Westerly winds during El Niño discharge heat from the east Pacific, leading to thermocline shoaling. Many months later, SST cooling, atmospheric subsidence, and trade winds reimpose La Niña conditions [28].
Long-term projections under global warming suggest changes in ENSO characteristics. Ref. [29] analyzed climate model simulations and found an eastward shift and trend toward La Niña in response to rising greenhouse gas concentrations. This underscores the importance of differentiating ENSO types and quantifying air–sea interactions to improve adaptation strategies in climate-sensitive regions.
In this study, the characteristics of east Pacific ENSO are examined from 1980 to 2024, with a specific focus on implications for Southern Africa’s summer climate (December–March). A statistical analysis of central and east Pacific modes yields key differences in teleconnection pathways that drive convection and circulation responses around Southern Africa. The reader may note a related paper [30] using similar methodology, focused on the Caribbean and its tropical cyclones.

2. Data Analysis

The monthly datasets employed include the following: National Ocean Data Center (NODC) 1–100 m (upper ocean) sea temperatures [31], satellite outgoing longwave radiation (OLR) [32] and vegetation color fraction [33], European reanalysis v5 [34], and NASA Merra2 meteorological reanalysis [35] of wind, vertical motion, surface temperature, rainfall, and potential evaporation. Linear cyclostationary Empirical Orthogonal Function (EOF) decomposition is applied to upper ocean sea temperatures in the Maritime Continent and tropical Pacific (17° S–17° N, 150° E–77° W), and the dominant loading patterns and their standardized time scores from the period 1980–2024 are extracted, similarly to earlier work [36,37]. The east Pacific ENSO PC-2 dipole is of primary interest (with 10% variance) for comparison with the central Pacific ENSO PC-1 dipole (47% variance). A low-pass filter is applied to the time scores to suppress intra-seasonal oscillations < 6 months. Herein, subsurface sea temperatures are preferred to avoid ‘noisy’ surface fluxes. Diagnostics are confined to the satellite era to improve statistical confidence. Ref. [38] suggests that the first two PCs of tropical Pacific SST represent non-linear evolution of ENSO, a concept supported by the analysis here.
The filtered PC-1 and PC-2 time scores are analyzed for seasonal amplification, autocorrelation, wavelet spectral energy, and two forms of lag-correlation: the first, segregated by PC-1 El Niño and La Niña, and the second with the Indian Ocean Dipole (IOD) [39]. A comparison of the global circulation response is performed by ranking the austral summer (Dec–Mar) time scores and identifying the top 10 with values greater than one standard deviation. Central mode La Niña years are 84,85,88,89,99,00,08,11,21,22, while east mode La Niña years are 94,03,04,05,07,16,17,19,20,24. Composite 200 hPa velocity potential, streamfunction, and wind fields are averaged and global anomalies are mapped by subtracting the 1980–2024 mean. The PC-2 time scores are correlated with Dec–Mar fields of OLR, surface temperature, wind, rainfall, vegetation fraction, and potential evaporation. These are repeated for PC-1 across global (35° S–35° N, 180° W–180° E) and regional (0°–45° S, 5°–52° E) domains. PC-2 correlations are calculated in global height and depth sections averaged to 10S-5N to identify the zonal circulation, humidity, and sea temperature responses via Merra2 and Global ocean data assimilation (GODAS) reanalysis [40]. The point-to-field analysis assumes opposing teleconnections in cool- and warm-phase ENSO. Temporal correlations have ~45 degrees of freedom, wherein significance at 95% confidence requires R > |0.29|. To uncover possible links with climate change, long-term linear trends are mapped via simulated sea-level air pressure from the Hadley esm3 [41] in 8.5 W/m2 for the scenario of 1980–2050, and via historical surface temperatures and winds from Merra2 for 1980–2024 over the east Pacific and western Amazon.

3. Results

3.1. Pacific ENSO Patterns and Time Scores

The EOF decomposition of monthly upper ocean sea temperature fields spanning 1980–2024 yields spatial loading maps in the tropical Pacific (Figure 1a,b). The first two modes are similar but zonally displaced, with the central dipole at 150° E and 120° W and east dipole at 180° W and 90° W. The cyclostationary loading maps exhibit a “<” shape, consistent with the latitude-dependent phase speed of subtropical ocean Rossby waves [25] and coupled atmospheric trough-ridge patterns. The EOF decomposition presented here yields distinctive central and east dipole modes, unlike the self-organizing maps [42] that generate four types of El Nino and four types of La Nina.
The continuously filtered PC time scores are presented in Figure 1c and reveal inter-annual fluctuations that tend to be in-phase during the period 1980–1999. The time scores have diverged in recent decades and exhibit spells of inverse or lagged behavior. Remarkably, the scatterplot (Figure 1d) has a parabolic fit, with positive regression in El Niño and negative regression in La Niña, evidence of non-linear behavior [38]. Support for the notion that these dipole modes are independent comes from their the mean annual cycle. The lower and upper percentiles of PC time scores (Table 1) diverge prominently in Oct–Jan for the central mode, in contrast with Mar–Jun for the east mode. Their seasonal amplification is different.
The wavelet spectral plots (Figure 1e,f) show further contrasts: central PC-1 exhibits confined 4–6 yr oscillations, while east PC-2 has a spread of 3 yr and 8–14 yr oscillations. A steady thermocline see-saw pattern is implicated for the central Pacific [36,43], whereas high- and low-frequency rhythms prevail during east Pacific ENSO. Lag-correlation of the two time scores segregated by central PC-1 into El Niño and La Niña are presented in Figure 1g,h. The functional relationship between the two modes is positive and near-simultaneous during central El Niño events (PC-1 < –0.2), indicating widespread relaxation of trade wind upwelling, whereas during La Niña events, eastern cooling lags central warming by 3–6 months. The two modes are in-phase during El Niño and out-of-phase during La Niña, due to the speed of ocean Kelvin and Rossby waves. Eastward equatorial waves are an order of magnitude faster than their westward subtropical counterpart (~2.0 vs. 0.2 m.s), with the difference sustaining non-linear behavior.
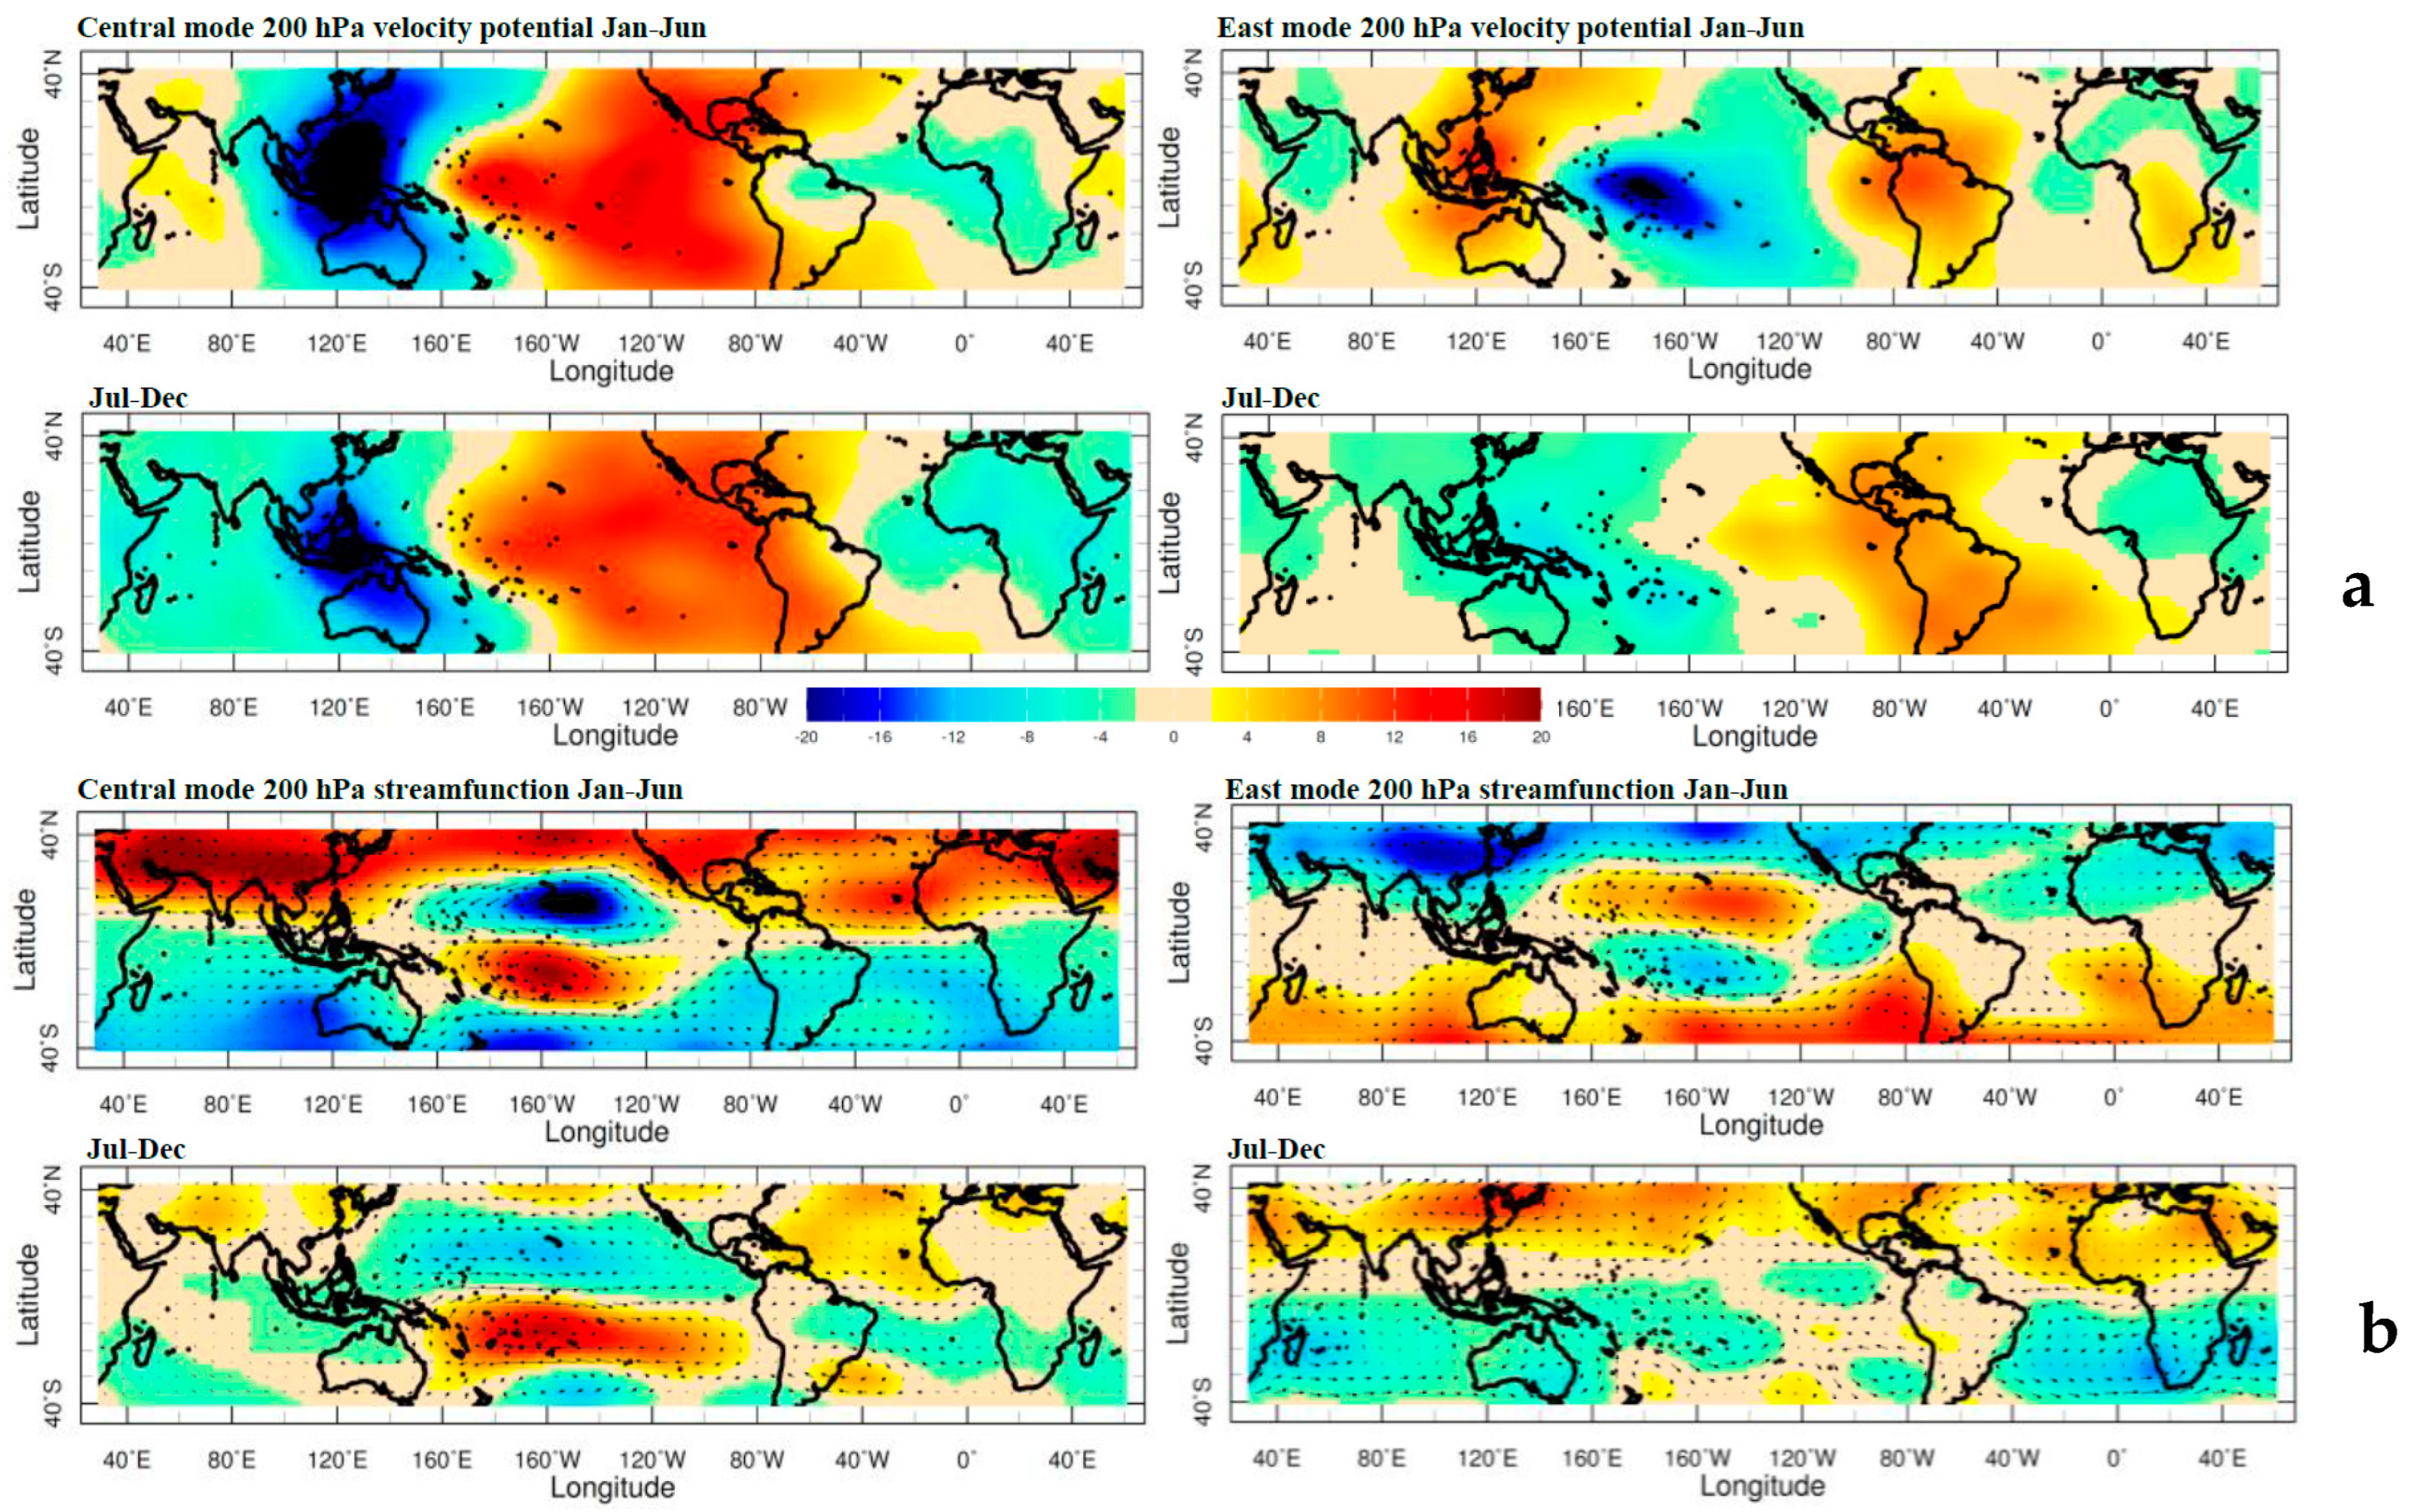
Global composites of 200 hPa velocity potential, streamfunction, and wind anomalies are analyzed in Figure 2a,b for top-10 seasons with PC time scores exceeding the 1σ threshold (La Niña). The signals in east mode are half the strength of those in central mode. The subtropical jets strengthen in east mode, but weaken in central mode. The rotary circulation over the Pacific is opposed in central and east mode, inferring more efficient teleconnections in the former. A significant feature is the upper divergence over the Maritime Continent in central mode, but convergence in east mode. An east La Niña does not support airflow from the Indian Ocean toward Southern Africa.
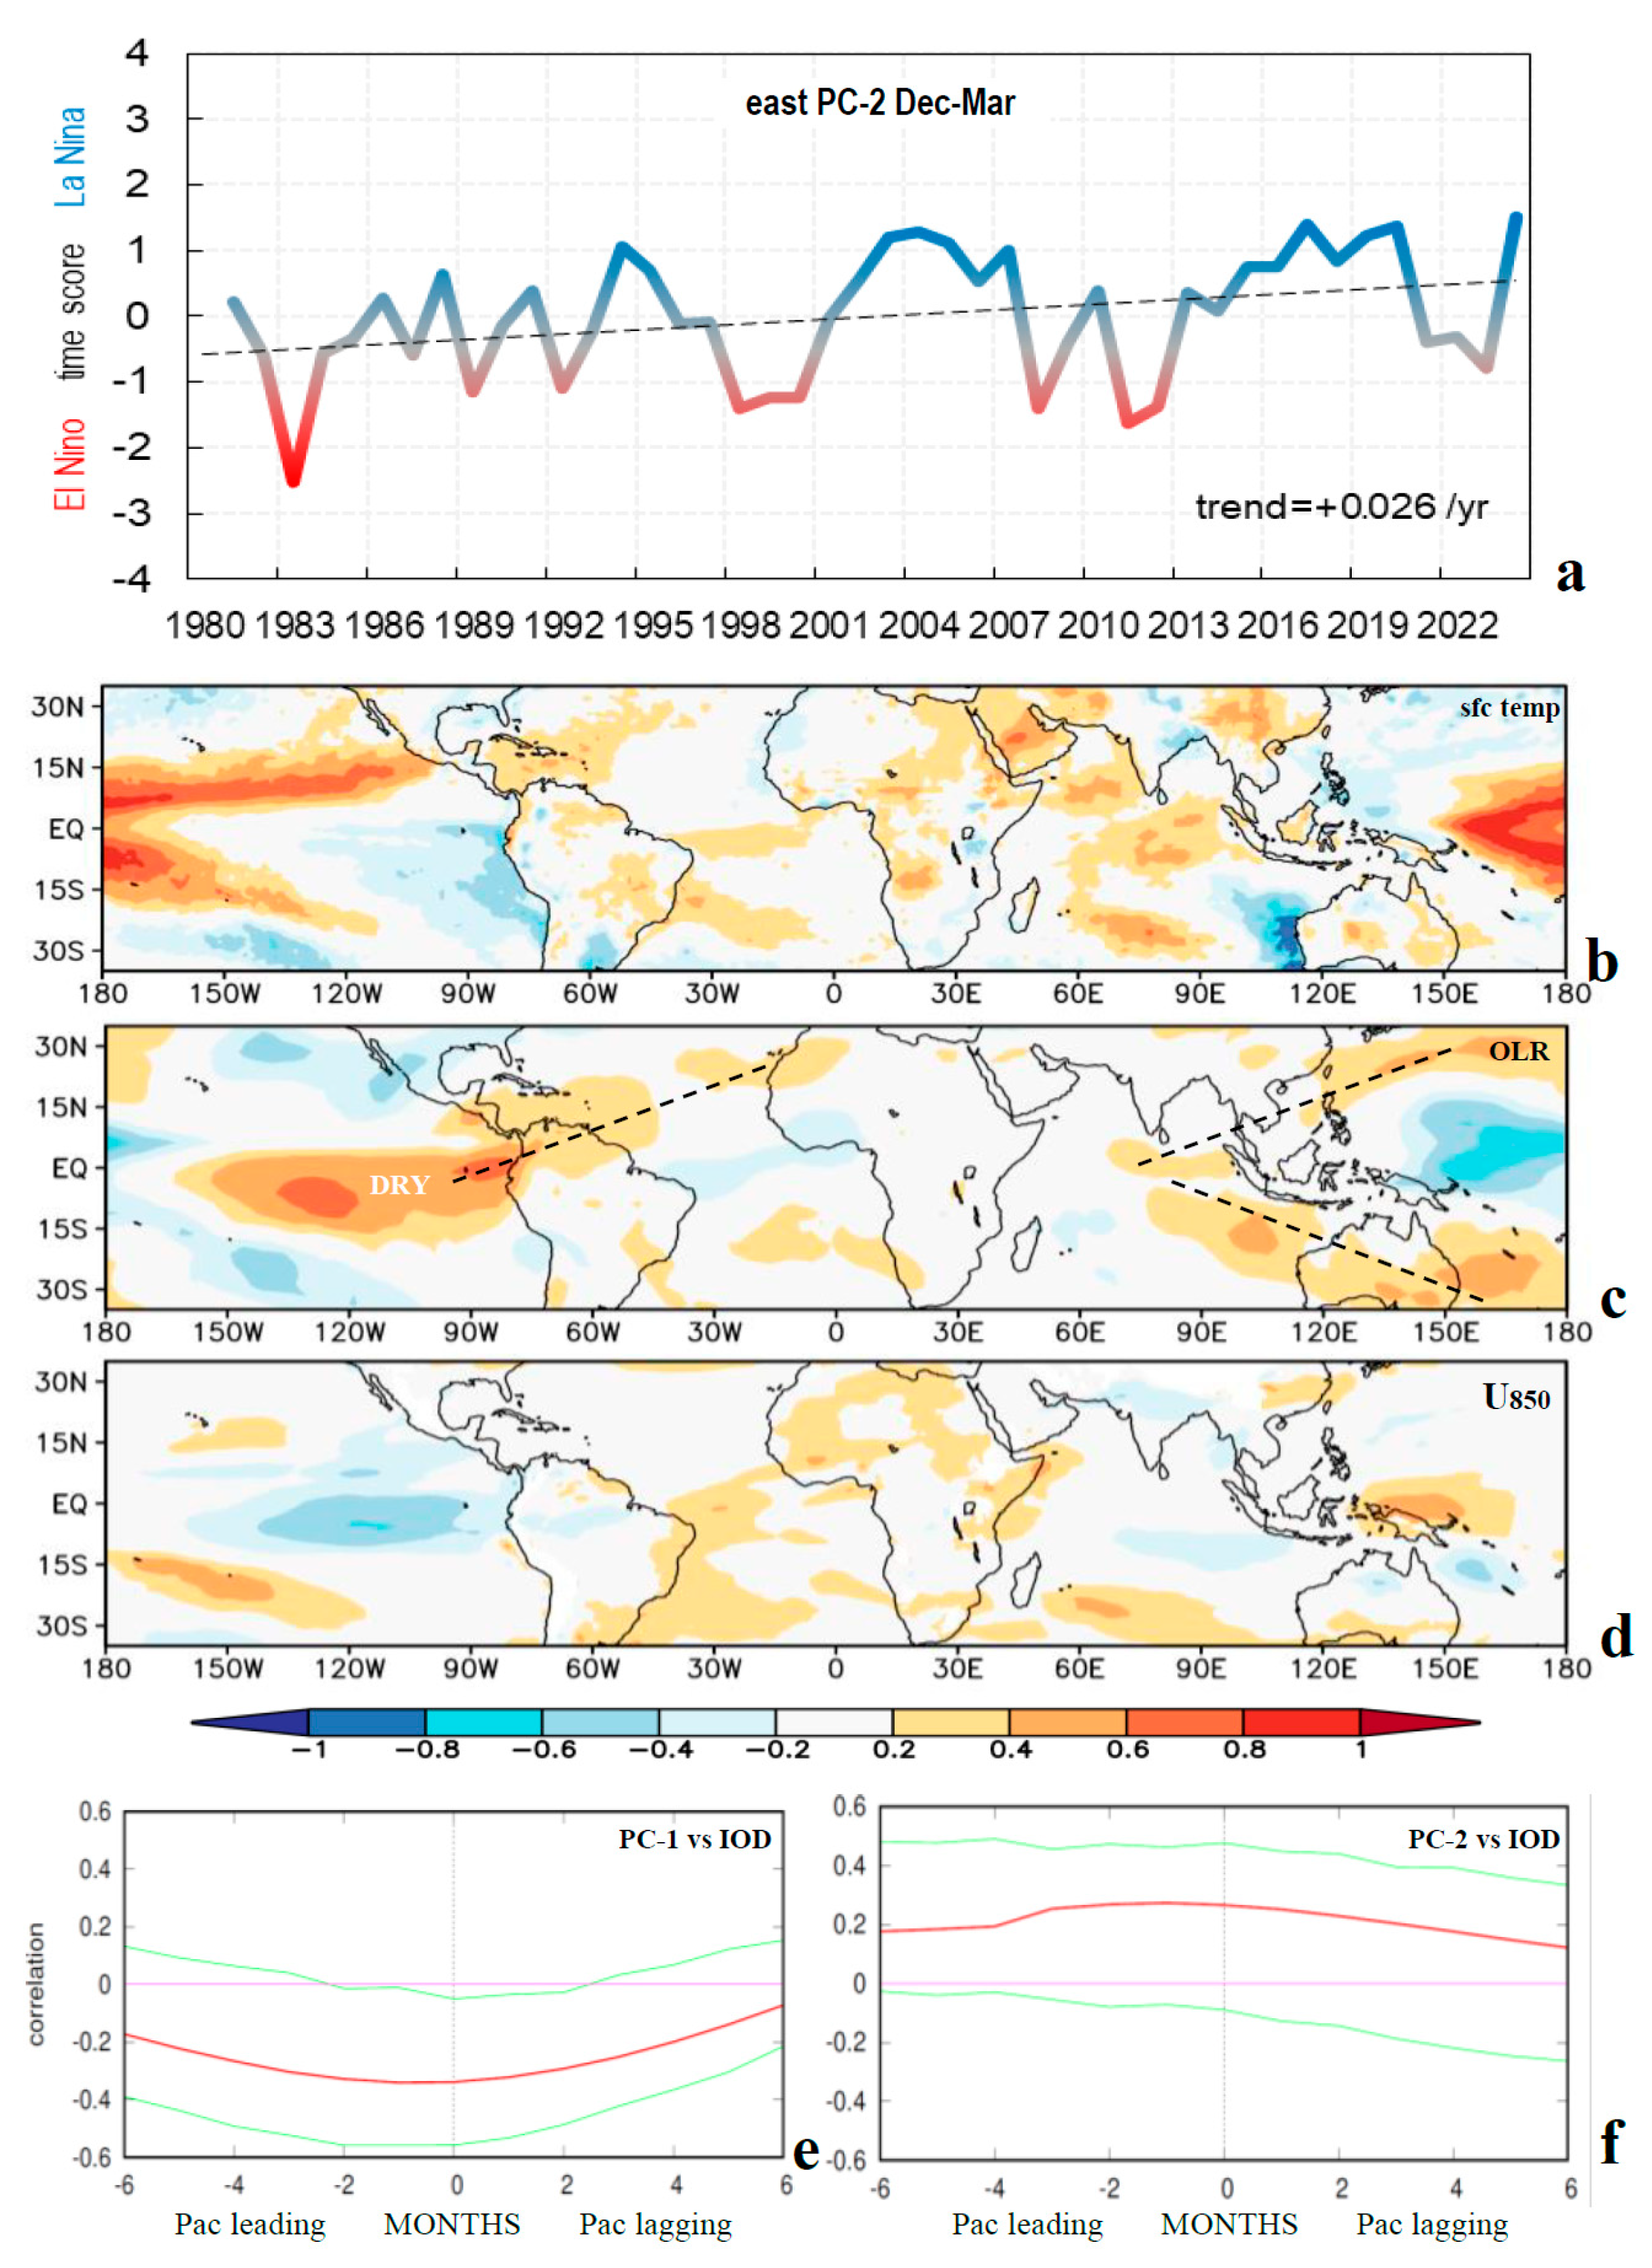
Analysis of Dec–Mar PC-2 time scores (Figure 3a) revealed a trend toward east Pacific La Niña amidst multi-year fluctuations. Autocorrelation of east PC-2 is R = 0.32 at a 1-year lag, whereas for central PC-1, R = 0.06 at 1-year lag (not shown). Thus, east PC-2 holds persistence that contributes to year-round influence. Its +0.026 σ/yr trend reflects intensified coastal upwelling off the coast of Peru [44].

3.2. Dec–Mar Correlation Maps

3.2.1. Global Tropics

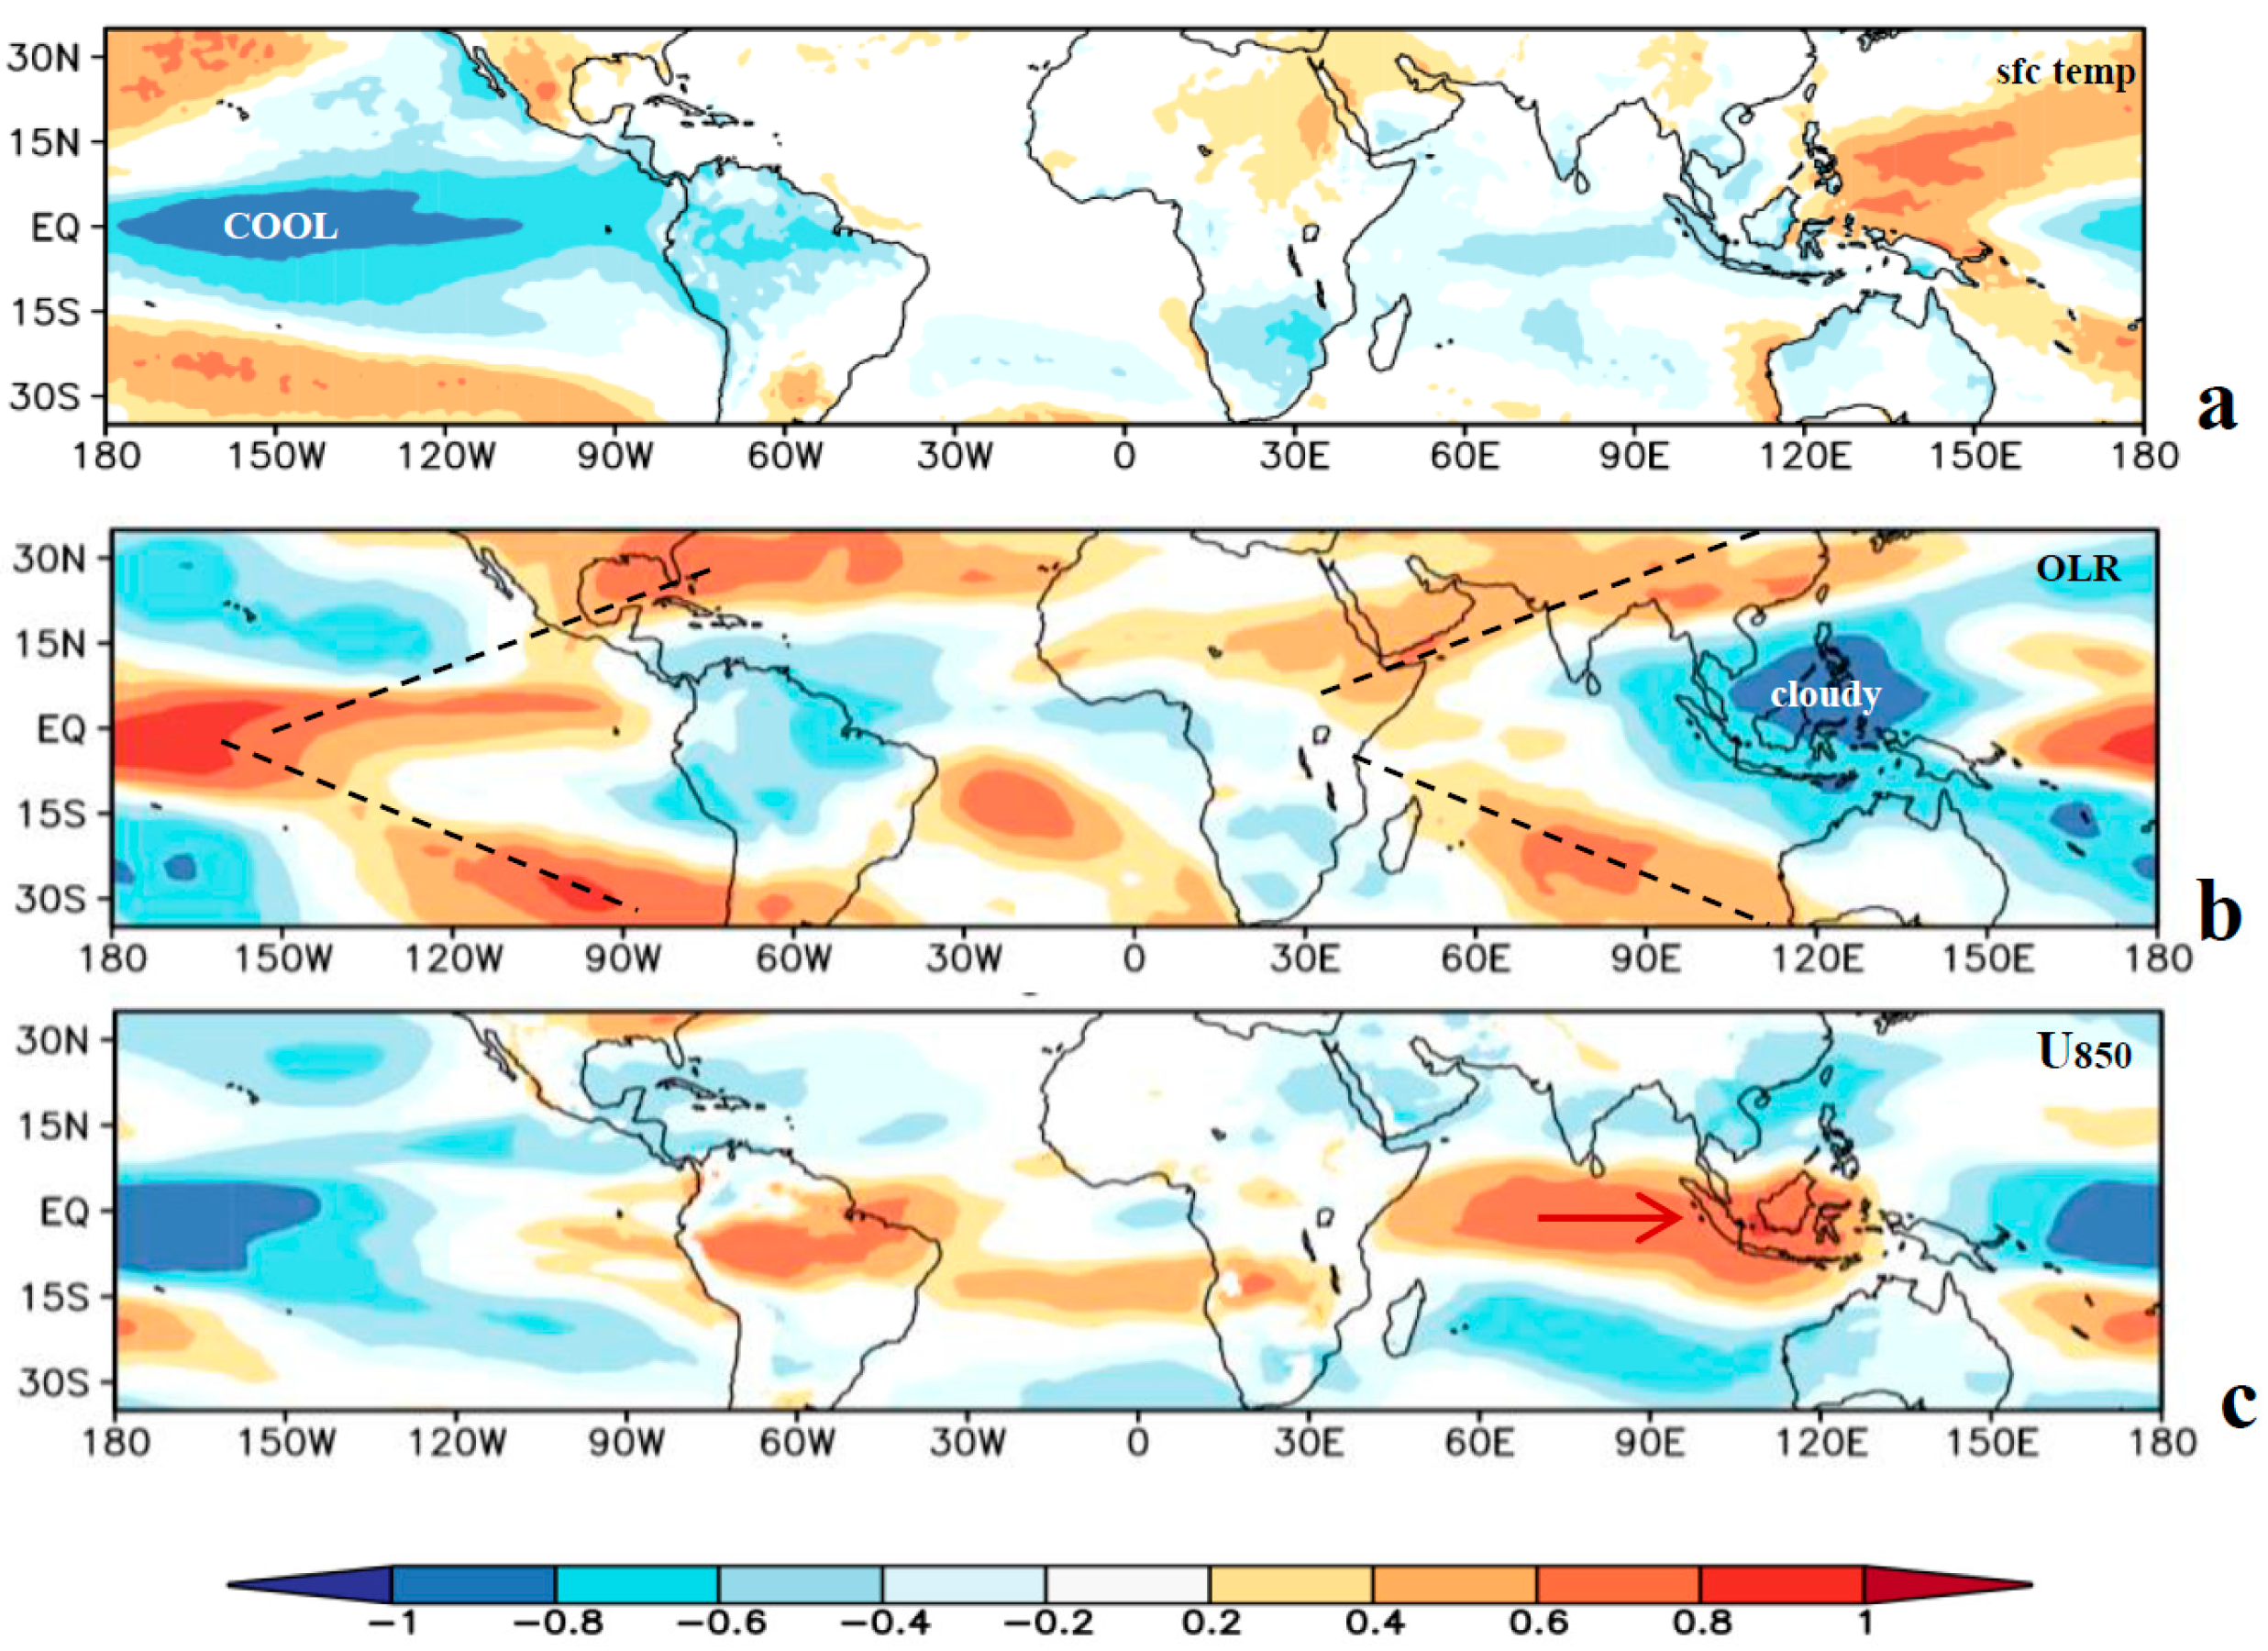
The Dec–Mar point-to-field correlation maps with respect to PC-2 are presented in Figure 3b–d. Surface temperatures reveal coastal upwelling off the coast of Peru, warming in a “<” shape over the west Pacific (dateline) and west Atlantic, and an ‘inverted’ warm/west–cool/east pattern in the Indian Ocean. The satellite OLR correlation map with respect to Dec–Mar PC-2 time scores reveals dry weather in the equatorial east Pacific and east Indian Ocean, and deep convection over the west Pacific. Positive R-values spread into the Amazon, suggesting disruption of the monsoon. Zonal winds at 850 hPa correlated with Dec–Mar PC-2, exhibiting the expected accelerated trade winds over the east Pacific, westerlies over the west Pacific, and weak westerlies over the Atlantic–African region. There is little response over the central Indian Ocean. In comparison (cf. Appendix A, Figure A1), much stronger correlations appear with respect to the Dec–Mar PC-1 time score. A central Pacific ENSO elicits global responses: cooling across the tropical Pacific and Indian Ocean; deepened convection over the Amazon, Southern Africa, and Maritime Continent; and westerly winds over the central Indian Ocean with consequences for subtropical ocean Rossby waves [10].
Differences in global coupling translate into distinct regional teleconnections with IOD (Figure 3e,f): PC-1 lag-correlations show negative values at a one-season lead time (e.g., central Pacific upwelling linked with cool/west Indian Ocean). In contrast, PC-2 exhibits positive association at a one-season lead time (e.g., east Pacific upwelling linked with warm/west Indian). Although the R values are weak, they show that central and east modes are diametrically opposed with respect to IOD. The central mode is coupled with the global circulation and subtropical ocean Rossby waves, while the east mode remains isolated.

3.2.2. Southern Africa

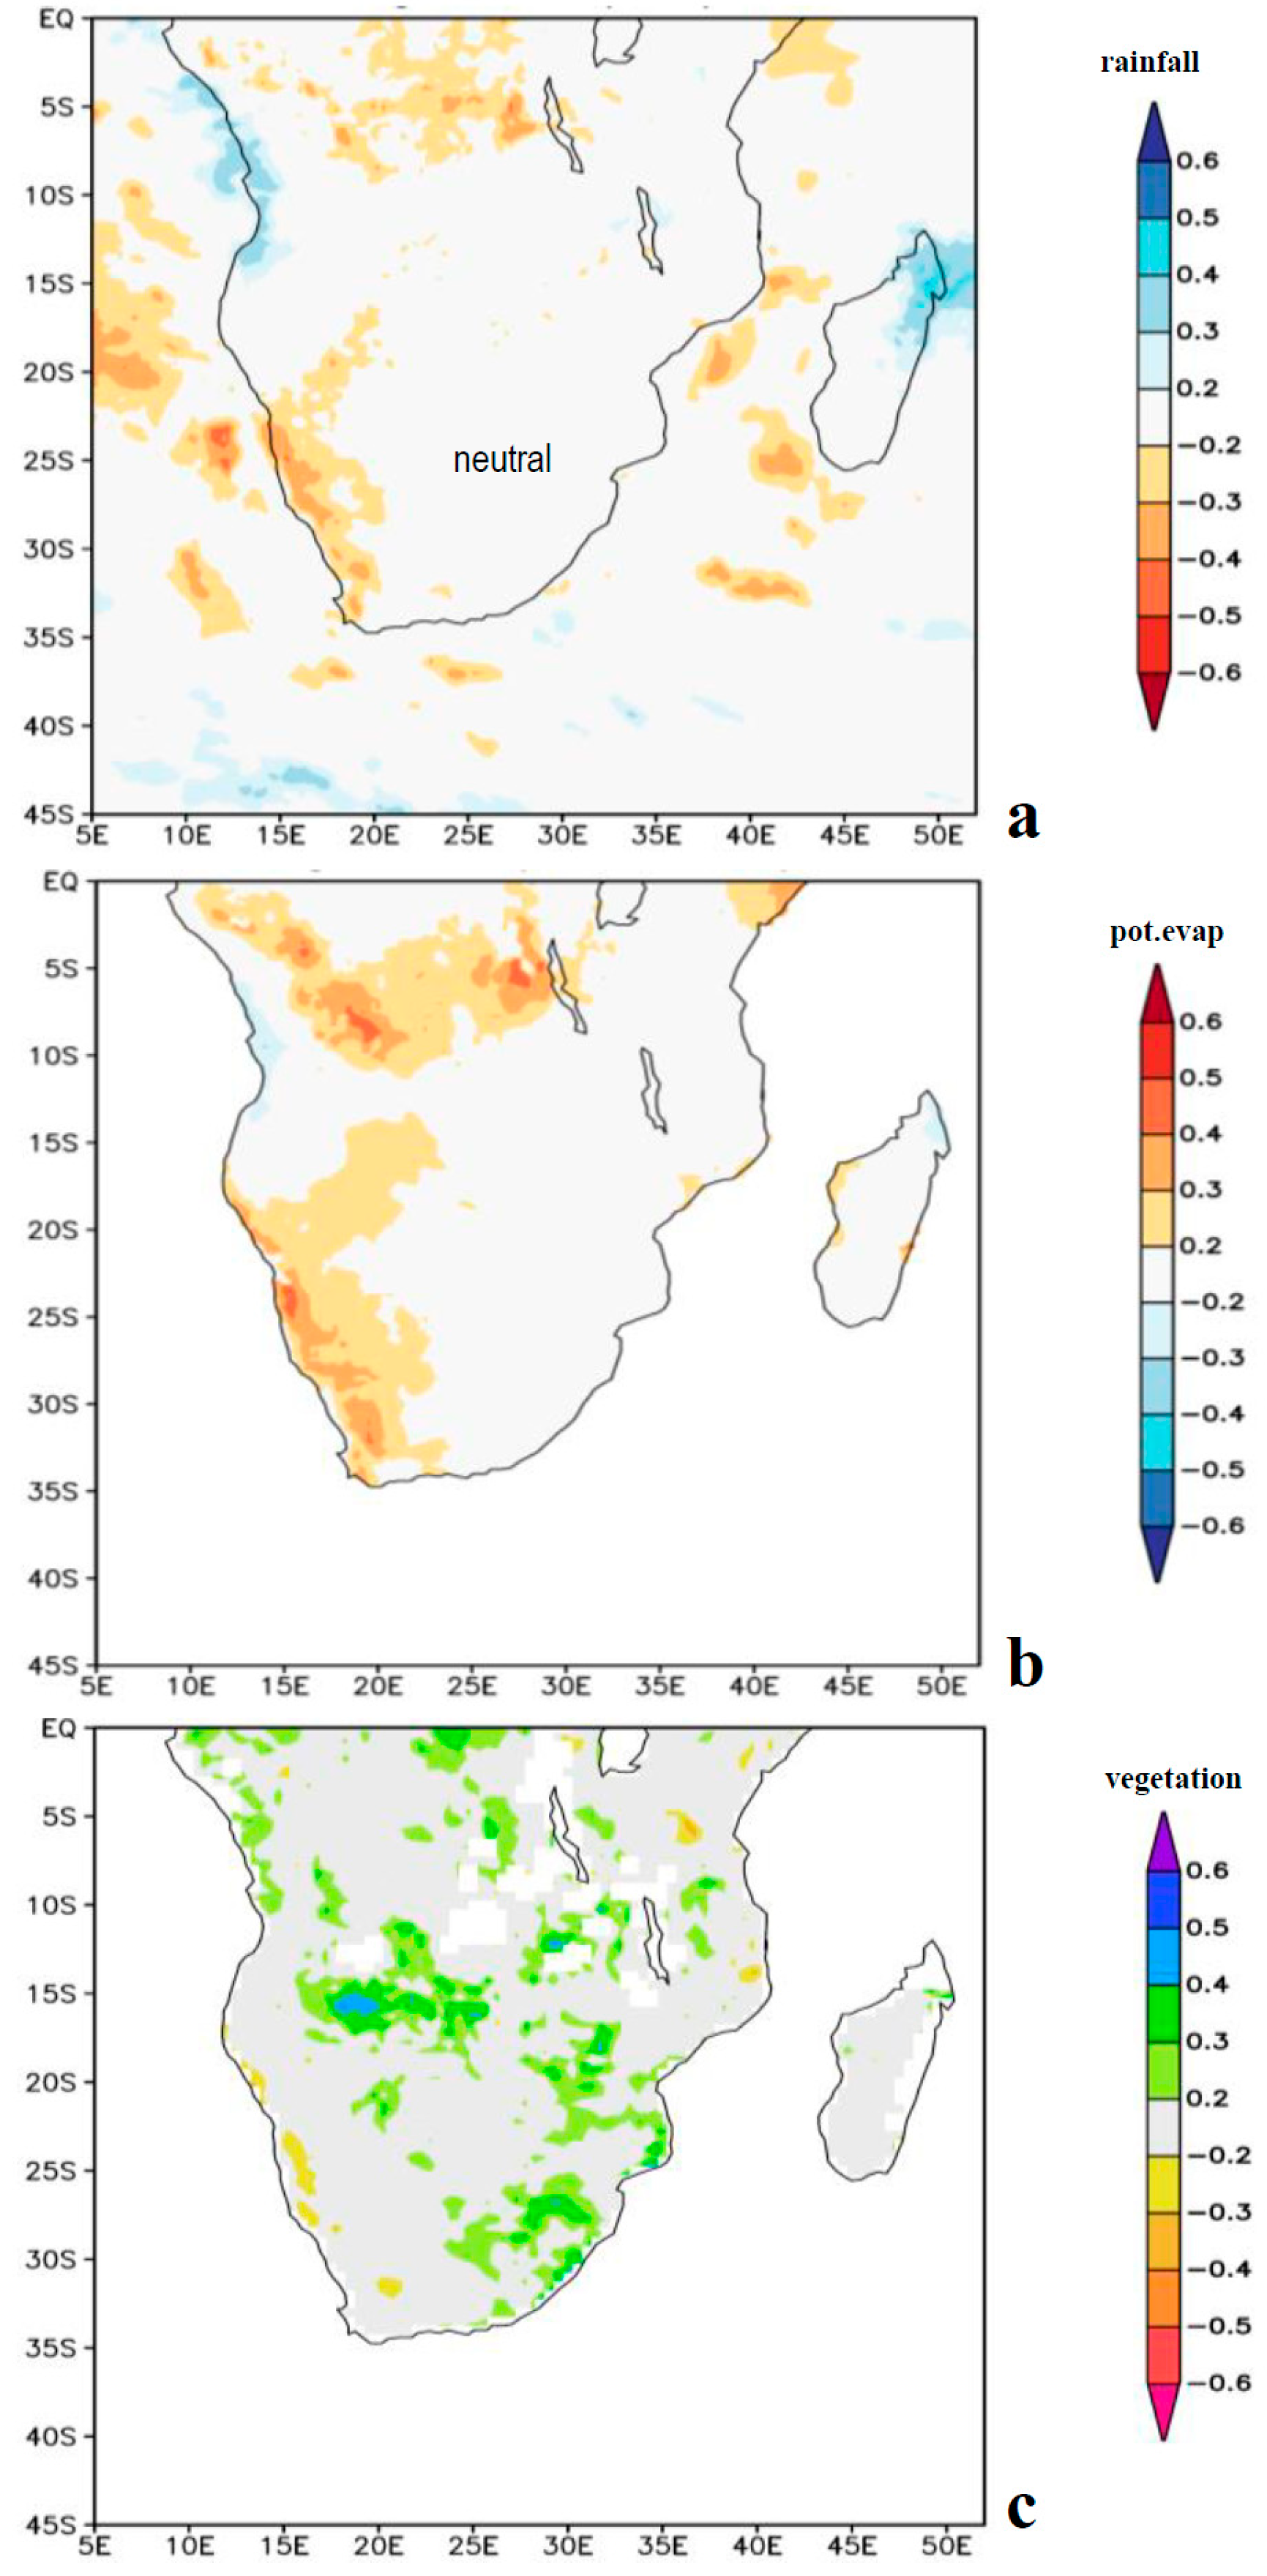
Southern Africa’s Dec–Mar point-to-field correlation maps with respect to PC-2 are presented in Figure 4a–c. Rainfall and potential evaporation show a weak signal: east Pacific La Niña corresponds with a drier Kalahari Desert. The crop-growing area (25–32° E) experiences a slightly positive influence on vegetation but no effect on the surface water balance (R ~ 0). PC-2 offers little benefit, unlike central Pacific PC-1 (cf. Appendix A, Figure A2), wherein strong correlations with rainfall, potential evaporation, and vegetation indicate surplus water balance (P > E). Past research has demonstrated a marked ENSO influence on the Southern African climate and crop production [45], albeit with multi-decadal instability [36]—here attributed to decoupling when the Pacific zonal dipole shifts eastward.
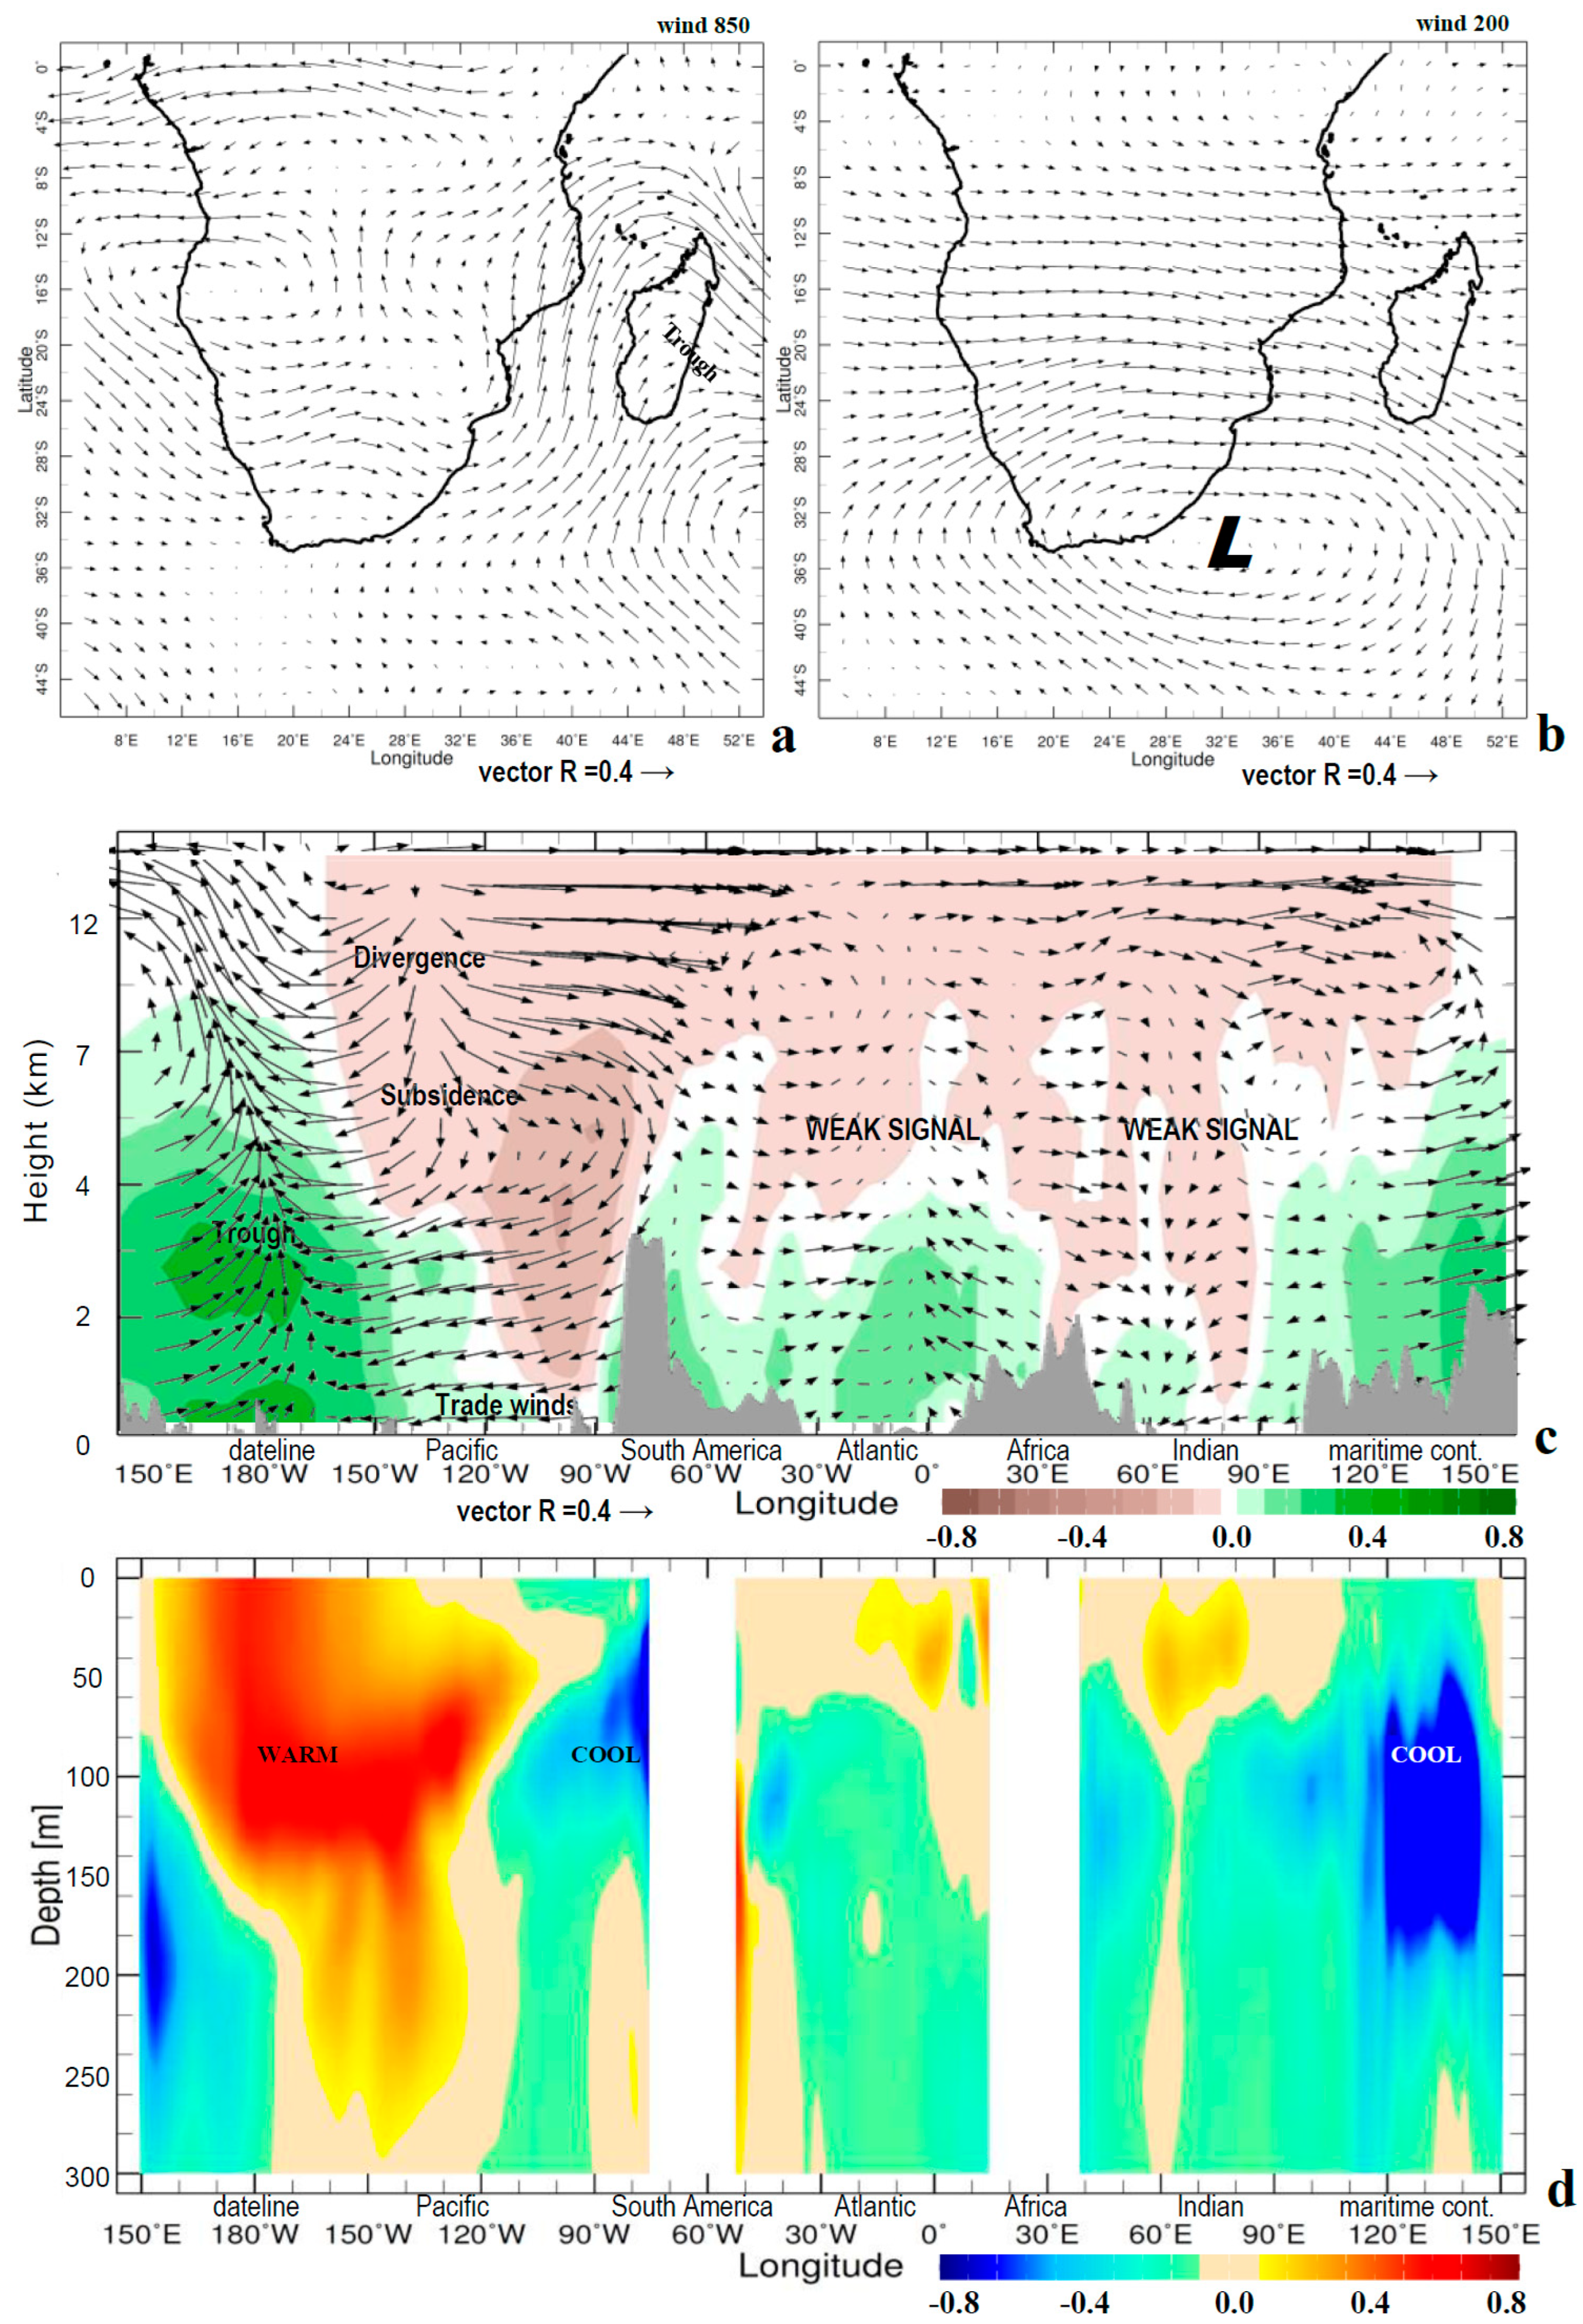
Why is the impact of east mode ENSO so minimal? Wind vector correlation maps (Figure 5a,b) illustrate that low-level westerlies spread dry Kalahari air across the plateau of Southern Africa in conjunction with an upper-level low over the warm Agulhas Current (during east Pacific La Niña). A trough over the warm west Indian Ocean induces subsident equatorward airflow over Southern Africa that neutralizes the climatic response to east mode ENSO.

3.3. Global Height/Depth Sections

Global height-and-depth correlation sections averaged over 10° S–5° N (Figure 5c,d) reveal a zonal overturning circulation in the tropical Pacific, but no signal is observed over the Atlantic–Indian sector with respect to PC-2 time score. The Dec–Mar Walker cell diverges and subsides over the east Pacific, generating deep trade winds across the central basin that lift at the dateline into a trough over the west Pacific. The upper atmosphere is dry from South America to Africa under PC-2 influence. Subsurface sea temperature correlations (Dec–Mar, 1980–2024) show the expected warm pool near the dateline, upwelling off South America, and cooling around the Maritime Continent. However, secondary dipole patterns in the Atlantic–Indian basins are weak and do not reach the surface. These features indicate ocean–atmosphere coupling is longitudinally dependent and disrupted when the Pacific ENSO dipole shifts toward South America. PC-2 correlations reveal an isolated Walker cell without teleconnections to the east or west, in contrast with PC-1 [17,46].

3.4. Link to Climate Change

The east Pacific PC-2 time score contained an upward trend that may be associated with climate change. An independent analysis of trends in sea-level air pressure from the Hadley esm3 simulation scenario spanning 1980–2050 in 8.5 W/m2 (Figure 6a) shows an enhancement of the south Pacific marine anticyclone (+2 Pa/yr) and a thermal low over the Amazon (−2 Pa/yr). The pressure gradient accelerates SE winds and coastal upwelling off Peru, as South America warms under deforestation. The historical surface temperature trend from Merra2 reanalysis spanning 1980–2024 is −0.02 C/yr over marine areas and +0.02 C/yr over terrestrial areas (Figure 6b). A steric response underpins the land–sea pressure gradient that funnels equatorward winds over the tropical east Pacific, along the periphery of a thermal low over South America. These features correspond with an upward trend in PC-2 time score, and a tendency for more frequent and sustained La Niña conditions [29].

4. Discussion

The zonal dipole representing the El Niño–Southern Oscillation (ENSO) has two leading modes, central PC-1 and east PC-2, as seen in linear cyclostationary Empirical Orthogonal Function analysis applied to monthly 1–100 m sea temperatures from 1980 to 2024 in the tropical Pacific (17° S–17° N, 150° E–77° W). In this study, the PC-1 and PC-2 patterns and time scores were contrasted. The dipole centers of action had similar wavelength but were located 30° longitude apart. PC-1 exhibited 4–6 yr oscillations, while PC-2 had 3 yr and 8–14 yr oscillations. The dipole time score scatterplot had a parabolic fit with positive regression for El Niño and negative regression for La Niña, indicating widespread warm-phase downwelling [47], whereas cold-phase upwelling is either equatorial or coastal, according to non-linear evolution [38]. Our statistical outcomes derive from upper ocean temperature dipole patterns, distinct from singular SST indices [48,49].
Turning our attention to the consequences for Southern Africa’s summer climate: dipole time score correlations with a variety of fields exhibited lackluster responses for the east mode (PC-2) in comparison with the central mode (PC-1). As the western center-of-action shifts away from the Maritime Continent, coupling with the Walker Circulation breaks down. PC-2 correlation maps revealed dry low-level westerlies over the Kalahari Plateau drawn toward a warm-west Indian Ocean during east La Niña, which is quite different to the teleconnections under the central mode (Figure A1b) [42].
The weak climatic response across the Atlantic–Indian basins with respect to east Pacific ENSO was linked to an isolated Walker cell that fed tropical moisture into a trough over the dateline (180° W) during La Niña phase. In the absence of secondary overturning circulations, the ENSO signal was confined to the Pacific. Across Southern Africa, an east Pacific La Niña showed no benefit for crop-growing areas (25–32° E). Long-term trends exhibited land–sea contrasts that accelerate coastal upwelling off South America, which favor the east mode, a harbinger of future ocean–atmosphere coupling.
When the Pacific ENSO dipole is in the east mode, seasonal forecasts should take into account altered ocean–atmosphere interactions, and tailor Southern African adaptation measures towards a neutral climate outcome. While it is known that convective anomalies propagate eastward in the tropics [50,51] and amplify when Walker cells align with ocean dipoles [52], further work should seek to understand the effect of continental monsoons on transient evolutions.

Funding

This research benefited from collaboration with the National University of Trujillo Peru.

Institutional Review Board Statement

Not applicable.

Informed Consent Statement

Not applicable.

Data Availability Statement

Websites for data analysis include </iridl.ldeo.columbia.edu/> and </climexp.knmi.nl/>. A data analysis spreadsheet will be shared on email request.

Acknowledgments

Outcome-based support from the South African Department of Higher Education is acknowledged.

Conflicts of Interest

The author declares no conflicts of interest.

Appendix A

Figure A1. Correlation of Dec–Mar PC-1 time score with (a) surface temperature, (b) OLR, and (c) U850 wind spanning 1980–2024, for comparison with PC-2 maps (Figure 3b–d above). Dashed lines in (b) refer to standing atmospheric Rossby waves.
Atmosphere 16 01204 g0a1
Figure A2. Correlation of Dec–Mar PC-1 time score with (a) ERA5 precipitation, (b) potential evaporation, (c) satellite vegetation color fraction spanning 1980–2024, for comparison with PC-2 maps (Figure 4a–c above). Color bar inverted for rain and vegetation.
Atmosphere 16 01204 g0a2

References

  1. Tourre, Y.M.; White, W.B. Evolution of the ENSO signal over the Indo–Pacific domain. J. Phys. Oceanogr. 1997, 27, 683–696. [Google Scholar] [CrossRef]
  2. Wang, B.; Wu, R.; Fu, X. Pacific–East Asian teleconnection: How does ENSO affect East Asian climate? J. Clim. 2000, 13, 1517–1536. [Google Scholar] [CrossRef]
  3. Trenberth, K.E.; Caron, J.M.; Stepaniak, D.P.; Worley, S. Evolution of El Niño–Southern Oscillation and global atmospheric surface temperatures. J. Geophys. Res. 2002, 107, 4065. [Google Scholar] [CrossRef]
  4. MacMynowski, D.G.; Tziperman, E. Factors affecting ENSO’s period. J. Atmos. Sci. 2008, 65, 1570–1586. [Google Scholar] [CrossRef]
  5. Yang, X.; DelSole, T. Systematic comparison of ENSO teleconnection patterns between models and observations. J. Clim. 2012, 25, 425–446. [Google Scholar] [CrossRef]
  6. Jin, F.-F. An equatorial ocean recharge paradigm for ENSO, part I: Conceptual model. J. Atmos. Sci. 1997, 54, 811–829. [Google Scholar] [CrossRef]
  7. Picault, J.; Masia, F.; duPenhoat, Y. An advective-reflective conceptual model for the oscillatory nature of the ENSO. Science 1997, 277, 663–666. [Google Scholar] [CrossRef]
  8. Wang, C. A unified oscillator model for the El Niño–Southern Oscillation. J. Clim. 2001, 14, 98–115. [Google Scholar] [CrossRef]
  9. White, W.B.; Tourre, Y.M.; Barlow, M.; Dettinger, M. A delayed action oscillator shared by biennial, inter-annual, and decadal signals in the Pacific basin. J. Geophys. Res. 2003, 108, 3070. [Google Scholar] [CrossRef]
  10. Jury, M.R.; Huang, B. The Rossby wave as a key mechanism of Indian Ocean climate variability. Deep Sea Res. 2004, 51, 2123–2136. [Google Scholar] [CrossRef]
  11. Lin, J. Ocean-atmosphere interaction in the lifecycle of ENSO: The coupled wave oscillator. Chin. Ann. Math. Ser. B 2009, 30, 715–726. [Google Scholar] [CrossRef]
  12. Cook, K.H. A southern hemisphere wave response to ENSO with implications for southern Africa precipitation. J. Atmos. Sci. 2001, 58, 2146–2162. [Google Scholar] [CrossRef]
  13. Tanaka, H.L.; Ishizaki, N.; Kitoh, A. Trend and inter-annual variability of Walker, monsoon and Hadley circulations defined by velocity potential in the upper troposphere. Tellus A 2004, 56, 250–269. [Google Scholar] [CrossRef]
  14. Wang, C. ENSO, Atlantic climate variability, and the Walker and Hadley circulations. In The Hadley Circulation: Present, Past and Future; Diaz, H.F., Bradley, R.S., Eds.; Springer: Dordrecht, The Netherlands, 2004; pp. 173–202. [Google Scholar]
  15. Xu, K.; Zhu, C.; He, J. Two types of El Niño-related Southern Oscillation and their different impacts on global land precipitation. Adv. Atmos. Sci. 2013, 30, 1743–1757. [Google Scholar] [CrossRef]
  16. Tartaglione, C.A.; Smith, S.R.; O’Brien, J.J. ENSO impact on hurricane landfall probabilities for the Caribbean. J. Clim. 2003, 16, 2925–2931. [Google Scholar] [CrossRef]
  17. Jury, M.R. Global wave-2 structure of ENSO-modulated convection. Intl. J. Climatol. 2019, 39. [Google Scholar] [CrossRef]
  18. Bjerknes, J. Atmospheric teleconnections from the equatorial Pacific. Mon. Wea. Rev. 1969, 97, 163–172. [Google Scholar] [CrossRef]
  19. Gill, A.E. Some simple solutions for heat-induced tropical circulation. Q. J. R. Meteorol. Soc. 1980, 106, 447–462. [Google Scholar]
  20. Lindzen, R.S.; Nigam, S. On the role of sea-surface temperature gradients in forcing low-level winds and convergence in the tropics. J. Atmos. Sci. 1987, 44, 2418–2436. [Google Scholar] [CrossRef]
  21. Lee, S.-K.; Wang, C.; Mapes, B.E. A simple atmospheric model of the local and teleconnection responses to tropical heating anomalies. J. Clim. 2009, 22, 272–284. [Google Scholar] [CrossRef]
  22. Jury, M.R.; Mulenga, H.; Rautenbach, H. Tropical Atlantic variability and Indo-Pacific ENSO: Statistical analysis and numerical simulation. Glob. Atmos. Ocean Syst. 2000, 7, 107–124. [Google Scholar]
  23. Fu, C.; Diaz, H.; Fletcher, J. Characteristics of the response of sea surface temperature in the central Pacific associated with warm episodes of the Southern Oscillation. Mon. Weather Rev. 1986, 114, 1716–1739. [Google Scholar] [CrossRef]
  24. Wang, B. Interdecadal changes in El Niño onset in the last four decades. J. Clim. 1995, 8, 267–285. [Google Scholar] [CrossRef]
  25. White, W.B. Tropical coupled Rossby waves in the Pacific ocean–atmosphere system. J. Phys. Oceanogr. 2000, 30, 1245–1264. [Google Scholar] [CrossRef]
  26. Xu, J.; Chan, J.C.L. The role of the Asian–Australian monsoon system in the onset time of El Niño events. J. Clim. 2001, 14, 418–433. [Google Scholar] [CrossRef]
  27. Yu, J.-Y.; Kao, H.-K. Decadal changes of ENSO persistence barrier in SST and ocean heat content indices: 1958–2001. J. Geophys. Res. 2007, 112, D13106. [Google Scholar] [CrossRef]
  28. Kao, H.; Yu, J. Contrasting eastern-Pacific and central-Pacific types of ENSO. J. Clim. 2009, 22, 615–632. [Google Scholar] [CrossRef]
  29. Geng, T.; Cai, W.; Wu, L.; Santoso, A.; Wang, G.; Jing, Z.; Gan, B.; Yang, Y.; Li, S.; Wang, S.; et al. Emergence of changing central-Pacific and eastern-Pacific El Niño-Southern Oscillation in a warming climate. Nat. Commun. 2022, 13, 6616. [Google Scholar] [CrossRef] [PubMed]
  30. Jury, M.R. Impact of east Pacific La Niña on Caribbean climate. Atmosphere 2025, 16, 485. [Google Scholar] [CrossRef]
  31. Levitus, S.; Antonov, J.I.; Boyer, T.P.; Baranova, O.K.; Garcia, H.E.; Locarnini, R.A.; Mishonov, A.V.; Reagan, J.R.; Seidov, D.; Yarosh, E.S.; et al. World Ocean heat content and thermosteric sea level change (0–2000 m) 1955–2010. Geophys. Res. Lett. 2012, 39, L10603. [Google Scholar] [CrossRef]
  32. Lee, H.-T. Climate Algorithm Theoretical Basis Document: Outgoing Longwave Radiation (OLR); CDRP-ATBD-0526; NOAA’s Climate Data Record (CDR) Program: Asheville, CA, USA, 2014; 46p.
  33. Pinzon, J.E.; Tucker, C.J. A non-stationary 1981–2012 AVHRR NDVI time series. Remote Sens. 2014, 6, 6929–6960. [Google Scholar] [CrossRef]
  34. Hersbach, H.; Bell, B.; Berrisford, P.; Hirahara, S.; Horányi, A.; Muñoz-Sabater, J.; Nicolas, J.; Peubey, C.; Radu, R.; Schepers, D.; et al. The ERA5 global reanalysis. Q. J. R. Meteorol. Soc. 2020, 146, 1999–2049. [Google Scholar] [CrossRef]
  35. Gelaro, R.; McCarty, W.; Suárez, M.J.; Todling, R.; Molod, A.; Takacs, L.; Randles, C.A.; Darmenov, A.; Bosilovich, M.G.; Reichle, R.; et al. The modern-era retrospective analysis for research and applications v2 (Merra2). J. Clim. 2017, 30, 5419–5454. [Google Scholar] [CrossRef] [PubMed]
  36. Folland, C.K.; Parker, D.E.; Colman, A.W.; Washington, R. Large scale modes of ocean surface temperature since the late 19th century. In Beyond El Niño: Decadal and Interdecadal Climate Variability; Navarra, A., Ed.; Springer: Berlin, Germany, 1999; Chapter 4; 374p. [Google Scholar]
  37. Kim, K.Y. Investigation of ENSO variability using cyclostationary EOFs of observational data. Meteorol. Atmos. Phys. 2002, 81, 149–168. [Google Scholar] [CrossRef]
  38. Takahashi, K.; Montecinos, A.; Goubanova, K.; Dewitte, B. ENSO regimes: Reinterpreting the canonical and Modoki El Niño. Geophys. Res. Lett. 2011, 38, L10704. [Google Scholar] [CrossRef]
  39. Jury, M.R. Representing the Indian Ocean Dipole. Phys. Ocean. 2022, 29, 417–432. [Google Scholar]
  40. Penny, S.G.; Behringer, D.W.; Carton, J.A.; Kalnay, E. The hybrid global ocean data assimilation system at NCEP. Mon. Weather Rev. 2015, 143, 4660–4677. [Google Scholar] [CrossRef]
  41. Andrews, M.B.; Ridley, J.K.; Wood, R.A.; Andrews, T.; Blockley, E.W.; Booth, B.; Burke, E.; Dittus, A.J.; Florek, P.; Gray, L.J.; et al. Historical simulations with Hadley3-GEM for CMIP6. J. Adv. Mod. Earth Sys. 2020, 12, e2019MS001995. [Google Scholar] [CrossRef]
  42. Hoell, A.; Funk, C.; Magadzire, T.; Zinke, J.; Husak, G.J. El Niño–Southern Oscillation diversity and Southern Africa teleconnections during Austral Summer. Clim. Dyn. 2015, 45, 1583–1599. [Google Scholar] [CrossRef]
  43. Kirtman, B.P. Oceanic Rossby wave dynamics and the ENSO period in a coupled model. J. Clim. 1997, 10, 1690–1704. [Google Scholar] [CrossRef]
  44. Jury, M.R.; Alfaro-Garcia, L. Peru north coast climate variability and regional ocean-atmosphere forcing. Coasts 2024, 4, 508–534. [Google Scholar] [CrossRef]
  45. Moeletsi, M.K.; Walker, S.; Landman, W.A. ENSO and implications on rainfall characteristics with reference to maize production in the Free State Province of South Africa. Phys. Chem. Earth 2011, 36, 715–726. [Google Scholar] [CrossRef]
  46. Wang, C. Atmospheric circulation cells associated with the El Niño–Southern Oscillation. J. Clim. 2002, 15, 399–419. [Google Scholar] [CrossRef]
  47. Yang, G.Y.; Hoskins, B. ENSO impact on Kelvin waves and associated tropical convection. J. Atmos. Sci. 2013, 70, 3513–3532. [Google Scholar] [CrossRef]
  48. Mpheshea, L.E.; Blamey, R.C.; Reason, C.J.C. The influence of ENSO-type on rainfall characteristics over southern Africa during the austral summer. Clim. Dyn. 2025, 63, 161. [Google Scholar] [CrossRef]
  49. Cai, W.; Reason, C.; Mohino, E.; Rodrigues, R.R.; Taschetto, A.S.; Garreaud, R.D.; Dewitte, B.; Poveda, G.; Ham, Y.-G.; Santoso, A.; et al. Climate impacts of the El Niño–Southern Oscillation in Africa. Nat. Rev. Earth Environ. 2025, 6, 503–520. [Google Scholar] [CrossRef]
  50. White, W.B.; Tourre, Y.M. Global SST/SLP waves during the 20th century. Geophys. Res. Lett. 2003, 30, 1651. [Google Scholar] [CrossRef]
  51. Wang, S.-Y.; Jiang, X.; Fosu, B. Global eastward propagation signals associated with the 4–5-year ENSO cycle. Clim. Dyn. 2015, 44, 2825–2837. [Google Scholar] [CrossRef]
  52. Ashok, K.; Guan, Z.; Yamagata, T. A look at the relationship between the ENSO and the Indian Ocean Dipole. J. Meteorol. Soc. Jpn. 2003, 81, 41–56. [Google Scholar] [CrossRef]
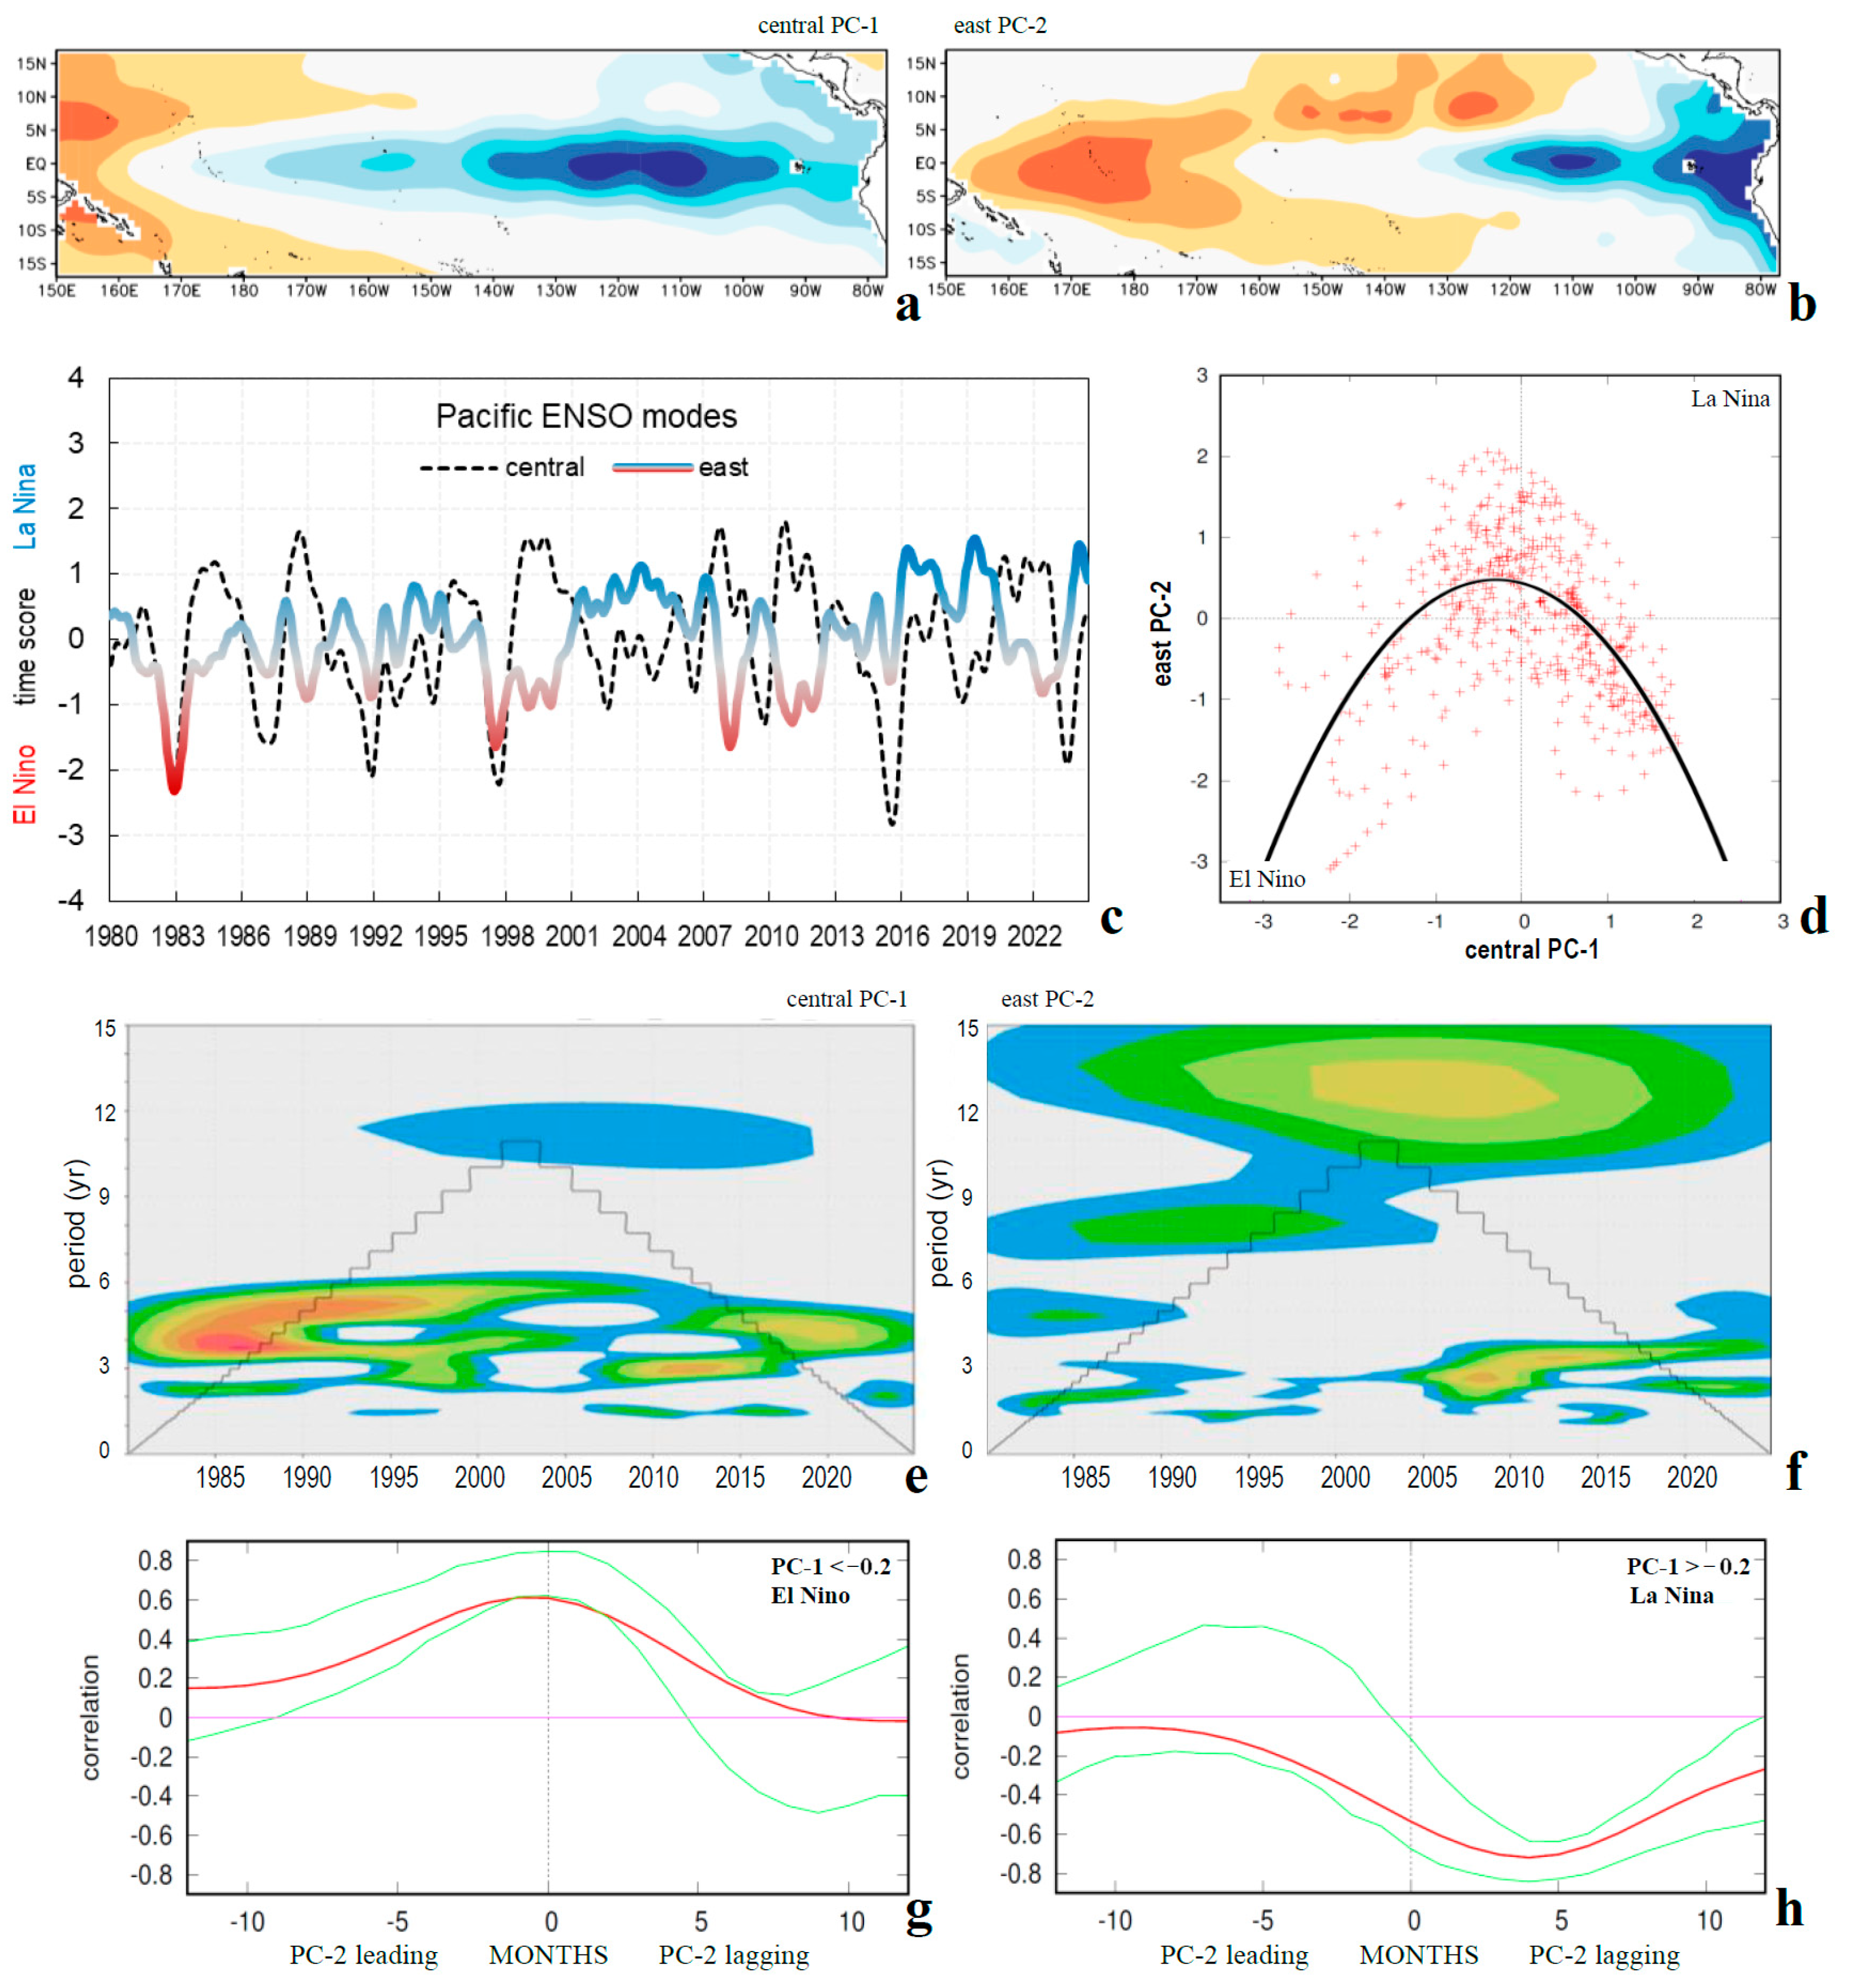
Figure 1. EOF decomposition: (a,b) spatial loading pattern of PC-1 and PC-2 with + sign convention whereby cool–east, (c) filtered time scores, (d) scatterplot of time scores with parabolic fit, and (e,f) time score wavelet spectra, where the shaded areas indicate > 95% confidence. Lag-correlation of PC-1 and PC-2 time scores segregated by central PC-1 into (g) El Niño and (h) La Niña. All cover the period 1980–2024.
Atmosphere 16 01204 g001
Figure 2. (a) Composite 200 hPa velocity potential anomalies for central ENSO seasons, 84,85,88,89,99,00,08,11,21,22 (left), and east mode ENSO, 94,03,04,05,07,16,17,19,20,24, in Jan–Jun (1st and 3rd row) and Jul–Dec (2nd and 4th row). (b) Composite 200 hPa streamfunction and wind vector anomalies; the largest anomaly = 3 m/s. Upper divergence is indicated by negative blue shading in (a); upper rotation is identified in (b); units ×105 m2/s.
Atmosphere 16 01204 g002
Figure 3. EOF decomposition: (a) PC-2 Dec–Mar time score and linear trend. Correlation of Dec–Mar PC-2 time score with (b) surface temperature, (c) OLR, and (d) U850 wind during 1980–2024. Lag-correlation of (e) PC-1 and (f) PC-2 time scores with Indian Ocean Dipole (sea temperatures); green lines are upper and lower quintiles. Dashed lines in (c) refer to standing atmospheric Rossby waves. Appendix A Figure A1 shows equivalent PC-1 correlation maps.
Atmosphere 16 01204 g003
Figure 4. Correlation of Dec–Mar PC-2 time scores with (a) ERA5 precipitation, (b) potential evaporation, and (c) satellite vegetation color fraction. Appendix A Figure A2 shows the equivalent PC-1 correlation maps. Color bar inverted for rain and vegetation.
Atmosphere 16 01204 g004
Figure 5. Correlation of Dec–Mar PC-2 time scores with Merra2: (a) 850 hPa winds and (b) 200 hPa winds over Southern Africa. PC-2 correlation with global equatorial: (c) atmospheric circulation (vectors) and humidity (shaded) and (d) subsurface sea temperature averaged 10° S–5° N. All refer to east Pacific La Niña conditions; vertical motion is exaggerated in (c).
Atmosphere 16 01204 g005
Figure 6. (a) Projected trend of Hadley esm3 sea-level air pressure (Pa/yr) for 1980–2050 (8.5 W/m2 scenario) over the east Pacific. (b) Historical trend of Merra2 surface temperature for 1980–2024 (C/yr); surface wind trend (m s−1/yr) overlain in (a) with vectors < 95% confidence omitted.
Atmosphere 16 01204 g006
Table 1. Mean annual cycle of lower and upper 2.5 percentiles of PC-1 and PC-2 time scores (1980–2024), identifying distinct differences in seasonal amplification (shaded) for central and east Pacific dipole modes.
CentralLowerUpperDifference EastLowerUpperDifference
Jul−2.261.223.48 Jul−2.032.114.13
Aug−2.351.473.82 Aug−1.841.893.73
Sep−2.441.704.15 Sep−2.061.673.73
Oct−2.531.944.47 Oct−2.391.453.84
Nov−2.401.904.31 Nov−2.301.443.74
Dec−2.261.924.18 Dec−2.191.413.61
Jan−2.381.924.29 Jan−2.181.603.78
Feb−2.171.593.76 Feb−2.251.553.79
Mar−1.961.353.31 Mar−2.511.704.21
Apr−1.861.243.10 Apr−2.771.914.68
May−1.881.213.10 May−2.511.894.40
Jun−1.971.213.19 Jun−2.241.994.23
Disclaimer/Publisher’s Note: The statements, opinions and data contained in all publications are solely those of the individual author(s) and contributor(s) and not of MDPI and/or the editor(s). MDPI and/or the editor(s) disclaim responsibility for any injury to people or property resulting from any ideas, methods, instructions or products referred to in the content.