Article

Urban–Rural PM2.5 Dynamics in Kraków, Poland: Patterns and Source Attribution

Department of Geoinformatics and Applied Computer Science, Faculty of Geology, Geophysics and Environmental Protection, AGH University of Kraków, 30-059 Krakow, Poland
*
Author to whom correspondence should be addressed.
Atmosphere 2025, 16(10), 1201; https://doi.org/10.3390/atmos16101201
Submission received: 11 September 2025 / Revised: 6 October 2025 / Accepted: 10 October 2025 / Published: 17 October 2025
(This article belongs to the Special Issue High-Performance Computing for Atmospheric Modeling (2nd Edition))

Abstract

Hourly PM2.5 concentrations were measured from February to May 2025 by a network of low-cost sensors located in urban Kraków and its surrounding municipalities. Temporal variability associated with the transition from the heating period to the spring months, together with spatial contrasts, were assessed with principal component analysis (PCA), urban–rural difference curves, and a detailed examination of the most severe smog episode (12–13 February). Particle trajectories generated with the HYSPLIT dispersion model, run in a coarse-grained, 36-task parallel configuration, were combined with kernel density mapping to trace emission pathways. The results show that peak concentrations coincide with the heating season; rural sites recorded higher amplitudes and led the urban signal by up to several hours, implicating external sources. Time-series patterns, PCA loadings, and HYSPLIT density fields provided mutually consistent evidence of pollutant advection toward the city. Parallelizing HYSPLIT on nine central processing unit (CPU) cores reduced the runtime from more than 600 s to about 100 s (speed-up ≈ 6.5), demonstrating that routine episode-scale analyses are feasible even on modest hardware. The findings underline the need to extend monitoring and mitigation beyond Kraków’s administrative boundary and confirm that coarse-grained parallel HYSPLIT modeling, combined with low-cost sensor data and relatively basic statistics, offers a practical framework for rapid source attribution.

Graphical Abstract

1. Introduction

Air pollution is one of the major problems faced by cities worldwide. This issue also affects Poland. According to a 2024 report by the European Environment Agency (EEA), air pollution was responsible for 8.1 million deaths globally in 2021 and was the second leading cause of death among young children [1]. Air pollution, especially in urbanized areas, negatively impacts the health of European residents, including those in Poland. The EEA estimates that in 2021, at least 238,000 people in the EU died prematurely due to exposure to PM2.5 levels exceeding the WHO’s recommended annual average of 5 µg/m3. Nitrogen dioxide (NO2) pollution caused 49,000 premature deaths, and ozone (O3) pollution caused 24,000 premature deaths in the EU [2]. According to EEA analyses for 2020, the main source of suspended particulate pollution was the combustion of solid fuels for residential heating. This sector was responsible for 44% of PM10 and 58% of PM2.5 emissions.
Another significant contributor to particulate matter pollution in cities is road transport, which mainly generates PM10 and nitrogen dioxide (NO2). High concentrations of suspended particles and other pollutants contribute to the formation of smog, which is harmful to human health. Numerous studies have shown that air pollution contributes to an increased incidence of malignant tumors, especially brain [3] and lung cancers [4]. It also leads to respiratory diseases, causing asthma [5], chronic obstructive pulmonary disease (COPD), and exacerbated symptoms [6,7], as well as other chronic inflammatory conditions of the bronchi and lungs [8]. Smog resulting from pollution contributes to cardiovascular diseases such as atherosclerosis, heart attacks, and hypertension [9]. It can also significantly weaken the immune system and trigger various allergies [10]. There is also a documented correlation between air pollution and neurodegenerative diseases such as Parkinson’s and Alzheimer’s diseases [11].
The problem of air pollution and its impact on the health of residents also affects Polish cities. According to the EEA report for 2021, the number of premature deaths in Poland caused by PM2.5 particulate matter pollution is estimated at 36,500 during the period examined.
The main pollutants responsible for poor air quality are suspended particles PM10 and PM2.5, nitrogen dioxide (NO2), benzo(a)pyrene, and sulfur dioxide (SO2). In Poland, the currently applicable standards are less stringent: for PM2.5, the annual average limit is 20 µg/m3 (no daily limit has been set), and for PM10, it is 40 µg/m3 annually and 50 µg/m3 daily (permitted to be exceeded 35 times per year) [12].
These standards are less restrictive than the current WHO air quality guidelines (in force since 2021), which are an annual PM2.5 limit of 5 µg/m3 and a daily limit of 15 µg/m3. For PM10, the limits are 15 µg/m3 annually and 45 µg/m3 daily [13].
A new air quality directive adopted by the European Parliament that also concerns Poland calls for a significant tightening of air quality standards starting in 2030. The annual permissible level for PM10 will be reduced from 40 µg/m3 to 20 µg/m3 and for PM2.5 from 25 µg/m3 to 10 µg/m3 [14].
Kraków has long been among the most polluted cities in Europe. One reason is the city’s geographical location. Kraków lies in the Vistula River valley and is surrounded on the west, north, and south by hills. This location results in naturally poor ventilation [15], which, in turn, leads to frequent high concentrations of air pollutants in the city. Thanks to a large-scale public campaign to improve air quality, led in part by the Kraków Smog Alert, an anti-smog resolution for Kraków was finally adopted after many years. Since 1 September 2019, a complete ban on the use of solid fuels (coal and wood) for heating via boilers, fireplaces, and stoves has been in force within the city [16]. The entry into force of the anti-smog resolution in Kraków has undoubtedly contributed to a significant improvement in air quality. In 2012, the air monitoring station on Krasińskiego Avenue recorded 132 days with PM10 levels exceeding the daily limit. In 2023, this number had dropped to just 31 days. Similar improvements were recorded at other monitoring stations throughout the city. There was also a substantial 53% decrease in annual PM10 concentrations in downtown Kraków in 2023 compared to 2021 [17]. However, air quality in Kraków is still affected by pollution from neighboring municipalities [18]. It can be shown that PM10 and PM2.5 particulate matter is transported into Kraków from surrounding areas (to the west, southwest, southeast, and northeast). Although an anti-smog resolution has also been adopted for the entire Małopolskie Voivodeship in 2022 [19], aimed at improving air quality in surrounding municipalities, progress is slow. The resolution required that by the end of April 2024, all coal or wood boilers that do not meet any emissions standards must be replaced. By the end of 2026, all boilers meeting only basic emission requirements (class 3 or 4 under PN-EN 303-5:2012 [20]) must also be phased out. The resolution also mandates chimney upgrades or the installation of devices to reduce harmful emissions. However, the replacement of outdated stoves in the municipalities surrounding Kraków is progressing slowly, and harmful suspended particles still reach the city, particularly during the heating season.
Motor vehicle traffic is another important factor negatively impacting the air quality in Kraków. The city has long struggled with severe traffic congestion. The situation is particularly acute during rush hours, between 6:00 and 9:00 AM and 3:00 to 6:00 PM, with the afternoon peak being more intense. During these hours, the increased number of vehicles significantly raises the emission of harmful substances such as PM10 and nitrogen dioxide, especially in the city center. A traffic survey commissioned by the Kraków city council in April 2024 measured traffic volumes at 50 entry points to the city. The highest traffic levels were recorded on the city’s highway bypass near the Kościuszko Water Plant: 92,500 vehicles per day. Other high-traffic areas included Powstańców Wielkopolskich and Śląskich Avenues, with 73,500 vehicles, Conrada Street, with 68,800, Dębnicki Bridge, with 68,000, and Opolska Street (near the Białucha River), with 65,400 vehicles. The majority of vehicles were private cars (87.73%), followed by delivery vans (6.3%) and tractor–trailer trucks (2.48%) [21]. Such high traffic volumes release substances harmful to human health into the atmosphere. After many years of campaigning for a clean transport zone in Kraków, including environmental analyses, air quality studies, and public consultations, the Kraków City Council adopted a resolution on 12 June 2025 to establish a Low-Emission Zone (LEZ) within the boundaries of the city’s fourth ring road [22]. The new regulations are set to come into force on 1 January 2026.
The reduction of air pollution achieved in recent years has entailed substantial costs. Consequently, the continuation of measures aimed at improving air quality, both within Kraków and in the surrounding municipalities, should be grounded in rigorous scientific research that enables precise identification of the principal sources of pollution. Such evidence-based analyses also provide a foundation for broad dialogue with local communities, thereby facilitating the acceptance of effective pollution mitigation strategies. The research presented in this paper draws upon data from sensors installed in Kraków (82 units) and in adjacent municipalities (36 units) (Figure 1). The primary objective is to examine differences in pollution patterns between the urban environment and surrounding areas. To this end, methods of data analysis were employed. Furthermore, potential transport pathways were investigated through the application of the HYSPLIT model [23,24,25,26].
Another objective of the study is to demonstrate that the use of low-cost air quality sensors is sufficient for determining pollution pathways and identifying their sources. While such sensors provide only basic information on air quality, they are deployed in large numbers across both urban and rural areas. In contrast, advanced monitoring stations deliver more comprehensive information on air quality but are typically limited in number, often only a few per entire region. This sparse distribution makes it impractical to reliably trace pollution transport and identify emission sources. Importantly, application of such dense networks of low-cost sensors can also provide convincing evidence of the direct link between pollution sources outside the city and air quality within the urban area. This may be of particular value for policymakers, especially in contexts where there is strong resistance to change and a growing anti-science sentiment.
The study tested three working hypotheses:
(1)
A measurable difference exists between air pollution patterns in urban Kraków and in the neighboring municipalities, and this contrast disappears after the heating season.
(2)
Particle transport path analysis can more precisely connect low-emission sources with the locations where their impact is observed.
(3)
Practical use of HYSPLIT for large-batch analyses, even with a limited number of monitoring sites, requires parallel computations.

2. Materials and Methods

2.1. Study Area

The study utilized data from a network of 82 low-cost PM sensors by Airly (www.airly.com (accessed on 10 September 2025)), located in Kraków and neighboring municipalities. Of the 82 sensors, 46 were located inside the administrative boundary of Kraków and 36 in neighboring municipalities. The coordinates obtained from the devices were verified spatially. Hourly measurements of PM2.5 concentrations were analyzed, supplemented by meteorological parameters (temperature, relative humidity, and air pressure), for the period February–May 2025.

2.2. Data Collection

All data were collected using Airly REST API. Raw JSON payloads were retrieved, parsed, and merged into a single tidy table. Basic quality control revealed no abnormalities such as negative PM values or duplicate timestamps. The data provided by the sensors were of high quality, and the share of missing measurements was relatively low (data completeness in successive months was as follows: 89%, 97%, 92%, and 93%). In cases of missing PM2.5 data for individual sensors, imputation was performed using the Random Forest algorithm [27]. For this purpose, the ranger R library was employed [28]. Based on the complete data, missing observations were predicted and inserted. For each month, a separate Random Forest model (ranger, 300 trees, with default parameters) was trained for every sensor that contained gaps, and the resulting infilled series yielded a fully complete hourly dataset for subsequent analysis. To assess the robustness of the Random Forest imputation, two approaches were applied: the internal out-of-bag (OOB) estimates provided by the algorithm and an external hold-out test, in which a random subset of observed values was temporarily masked and then re-predicted. In both cases, the resulting R2 values were high and only rarely fell below 0.90, confirming the reliability of the imputed series.

2.3. Statistical Analysis

Following imputation, principal component analysis (PCA) was performed separately for February, March, April, and May using the prcomp function in R with centering and scaling enabled; PC1–PC2 projections were examined, with sensors divided into two groups: inside (within Kraków boundaries) and outside (neighboring municipalities). The analysis was applied to the wide-format data matrix, where rows corresponded to measurement hours and columns to individual sensors. It should be emphasized that imputed data were not used where unnecessary (e.g., while calculating averages).

2.4. Trajectory Modeling

For dispersion analysis, the HYSPLIT model was implemented in R (v4.3.3) using the splitr (v0.4.0) wrapper [29]. The analysis incorporated 36 external point sources with the following parameters: emission rate = 5 g h−1 PM2.5, particle diameter = 2.5 µm, density = 1.8 g cm−3, and shape factor = 0.8. These parameters correspond to a traditional coal boiler with EF = 331 g GJ−1 and fuel consumption of 12 kg d−1 [30]. In the presented example, the emission time was set to 5 h, forward trajectories were calculated, and meteorological input from GDAS1 (ARL files, arl.noaa.gov) was used. To investigate particle transport into the city, filtering was applied only for heights below 20 m AGL. A two-dimensional kernel density estimate (KDE) was then performed (using R spatstat (v3.0.7) [31], raster resolution 100 m) in UTM-34N.

2.5. Instrumentation

The low cost sensors (LCSs) used in this study measure particulate matter (PM1, PM2.5, and PM10), selected gaseous pollutants, as well as temperature, pressure, and humidity in real time. Their key advantage lies in the density of the network they form. While only nine official monitoring stations operate within Kraków and five in the surrounding municipalities, hundreds of these low-cost devices provide much finer spatial coverage. When properly prepared and calibrated, they can deliver results comparable to reference stations. The Airly sensors used in this study are manufactured in compliance with ISO standards and the General Product Safety Regulation. Each unit is factory calibrated and certified under the UK MCERTS (Monitoring Certification Scheme) for PM2.5 and PM10 measurements. The manufacturer conducts regular comparative tests against reference stations for PM2.5, PM10, NO2, and O3, with reports publicly available on the Airly website. In addition, monthly calibration checks are performed to ensure precision and accuracy over time.
A comparison of computation times for single-core and multi-core execution was conducted on relatively modest generic desktop personal computer (10 Intel(R) Core(TM) i9-9900X CPU @ 3.50 GHz cores). The parallel HYSPLIT variant was implemented using the R future [32] and furrr [33] packages (with a multisession plan). Each worker wrote outputs to a separate exec_dir, while a shared met_dir was used for reading meteorological data; this represented the only point of synchronization in the coarse-grained parallelization scheme (HYSPLIT per source). Of course, various other parallelization approaches are possible (e.g., cluster-based methods using the SNOW package). However, in this case, a high-level approach was applied, as the results obtained were satisfactory.

3. Results

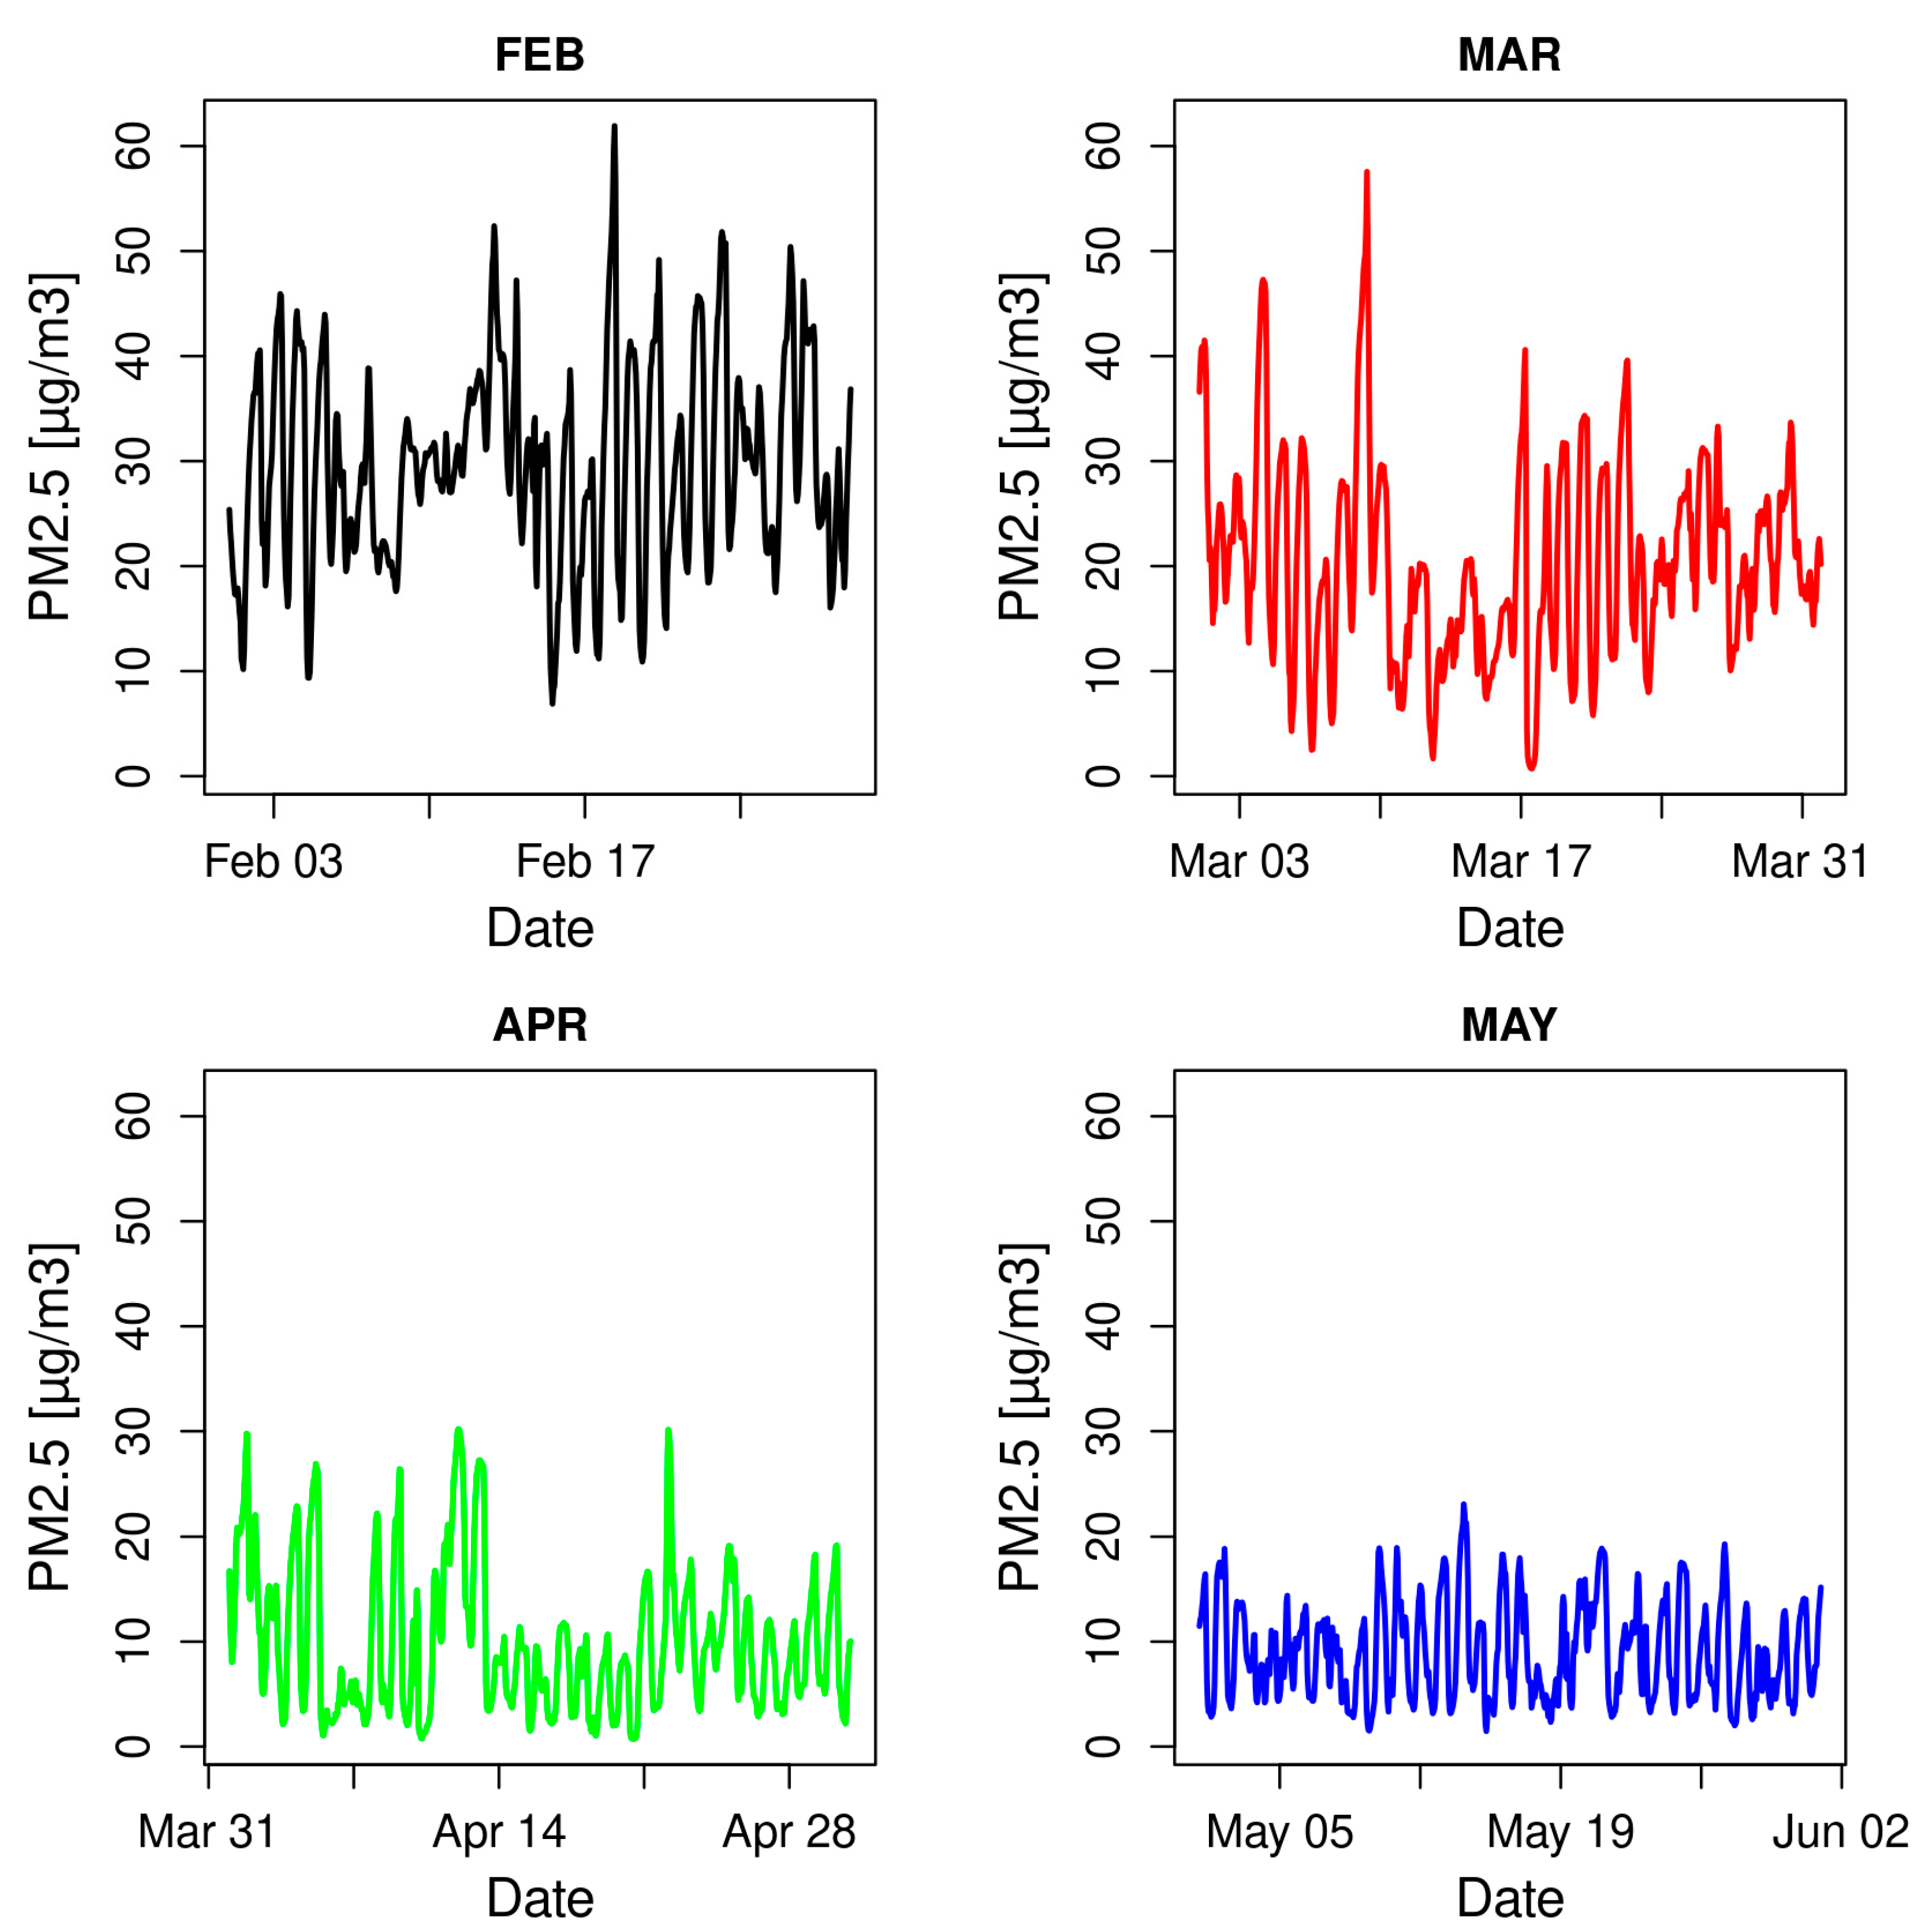
In the first stage, the mean values for the entire study area were analyzed. Figure 2 displays the variability of hourly PM2.5 concentrations from February to May, plotted separately for each month. A clear pattern is evident: the highest values occur in February and March, a decline is observed in April, and the lowest levels are recorded in May. In February, average values frequently exceed 40–50 µg m−3, indicating pronounced pollution episodes. March is still characterized by large fluctuations and high peaks, although these remain slightly lower than those observed in February. April shows a decline in mean concentrations; episodes become rarer and less intense. In May, a marked improvement in air quality is observed, with concentrations seldom exceeding 20 µg m−3. It should be emphasized that diurnal variability and short-term peaks occur in every month, but their amplitude diminishes progressively towards the warm season. This decrease is consistent with the broader U-shaped intra-annual distribution of particulate matter, reflecting both seasonal changes in atmospheric self-cleaning processes and reduced heating demand, as observed for example in Sučany, Slovakia, which shares similar heating characteristics with southern Poland [34]. Please note that the selected months were chosen to illustrate the transition from the heating to the non-heating period. Although pollution episodes may also occur in Kraków in other months [18], including as early as November, February is often reported as the most polluted month in this area [35].
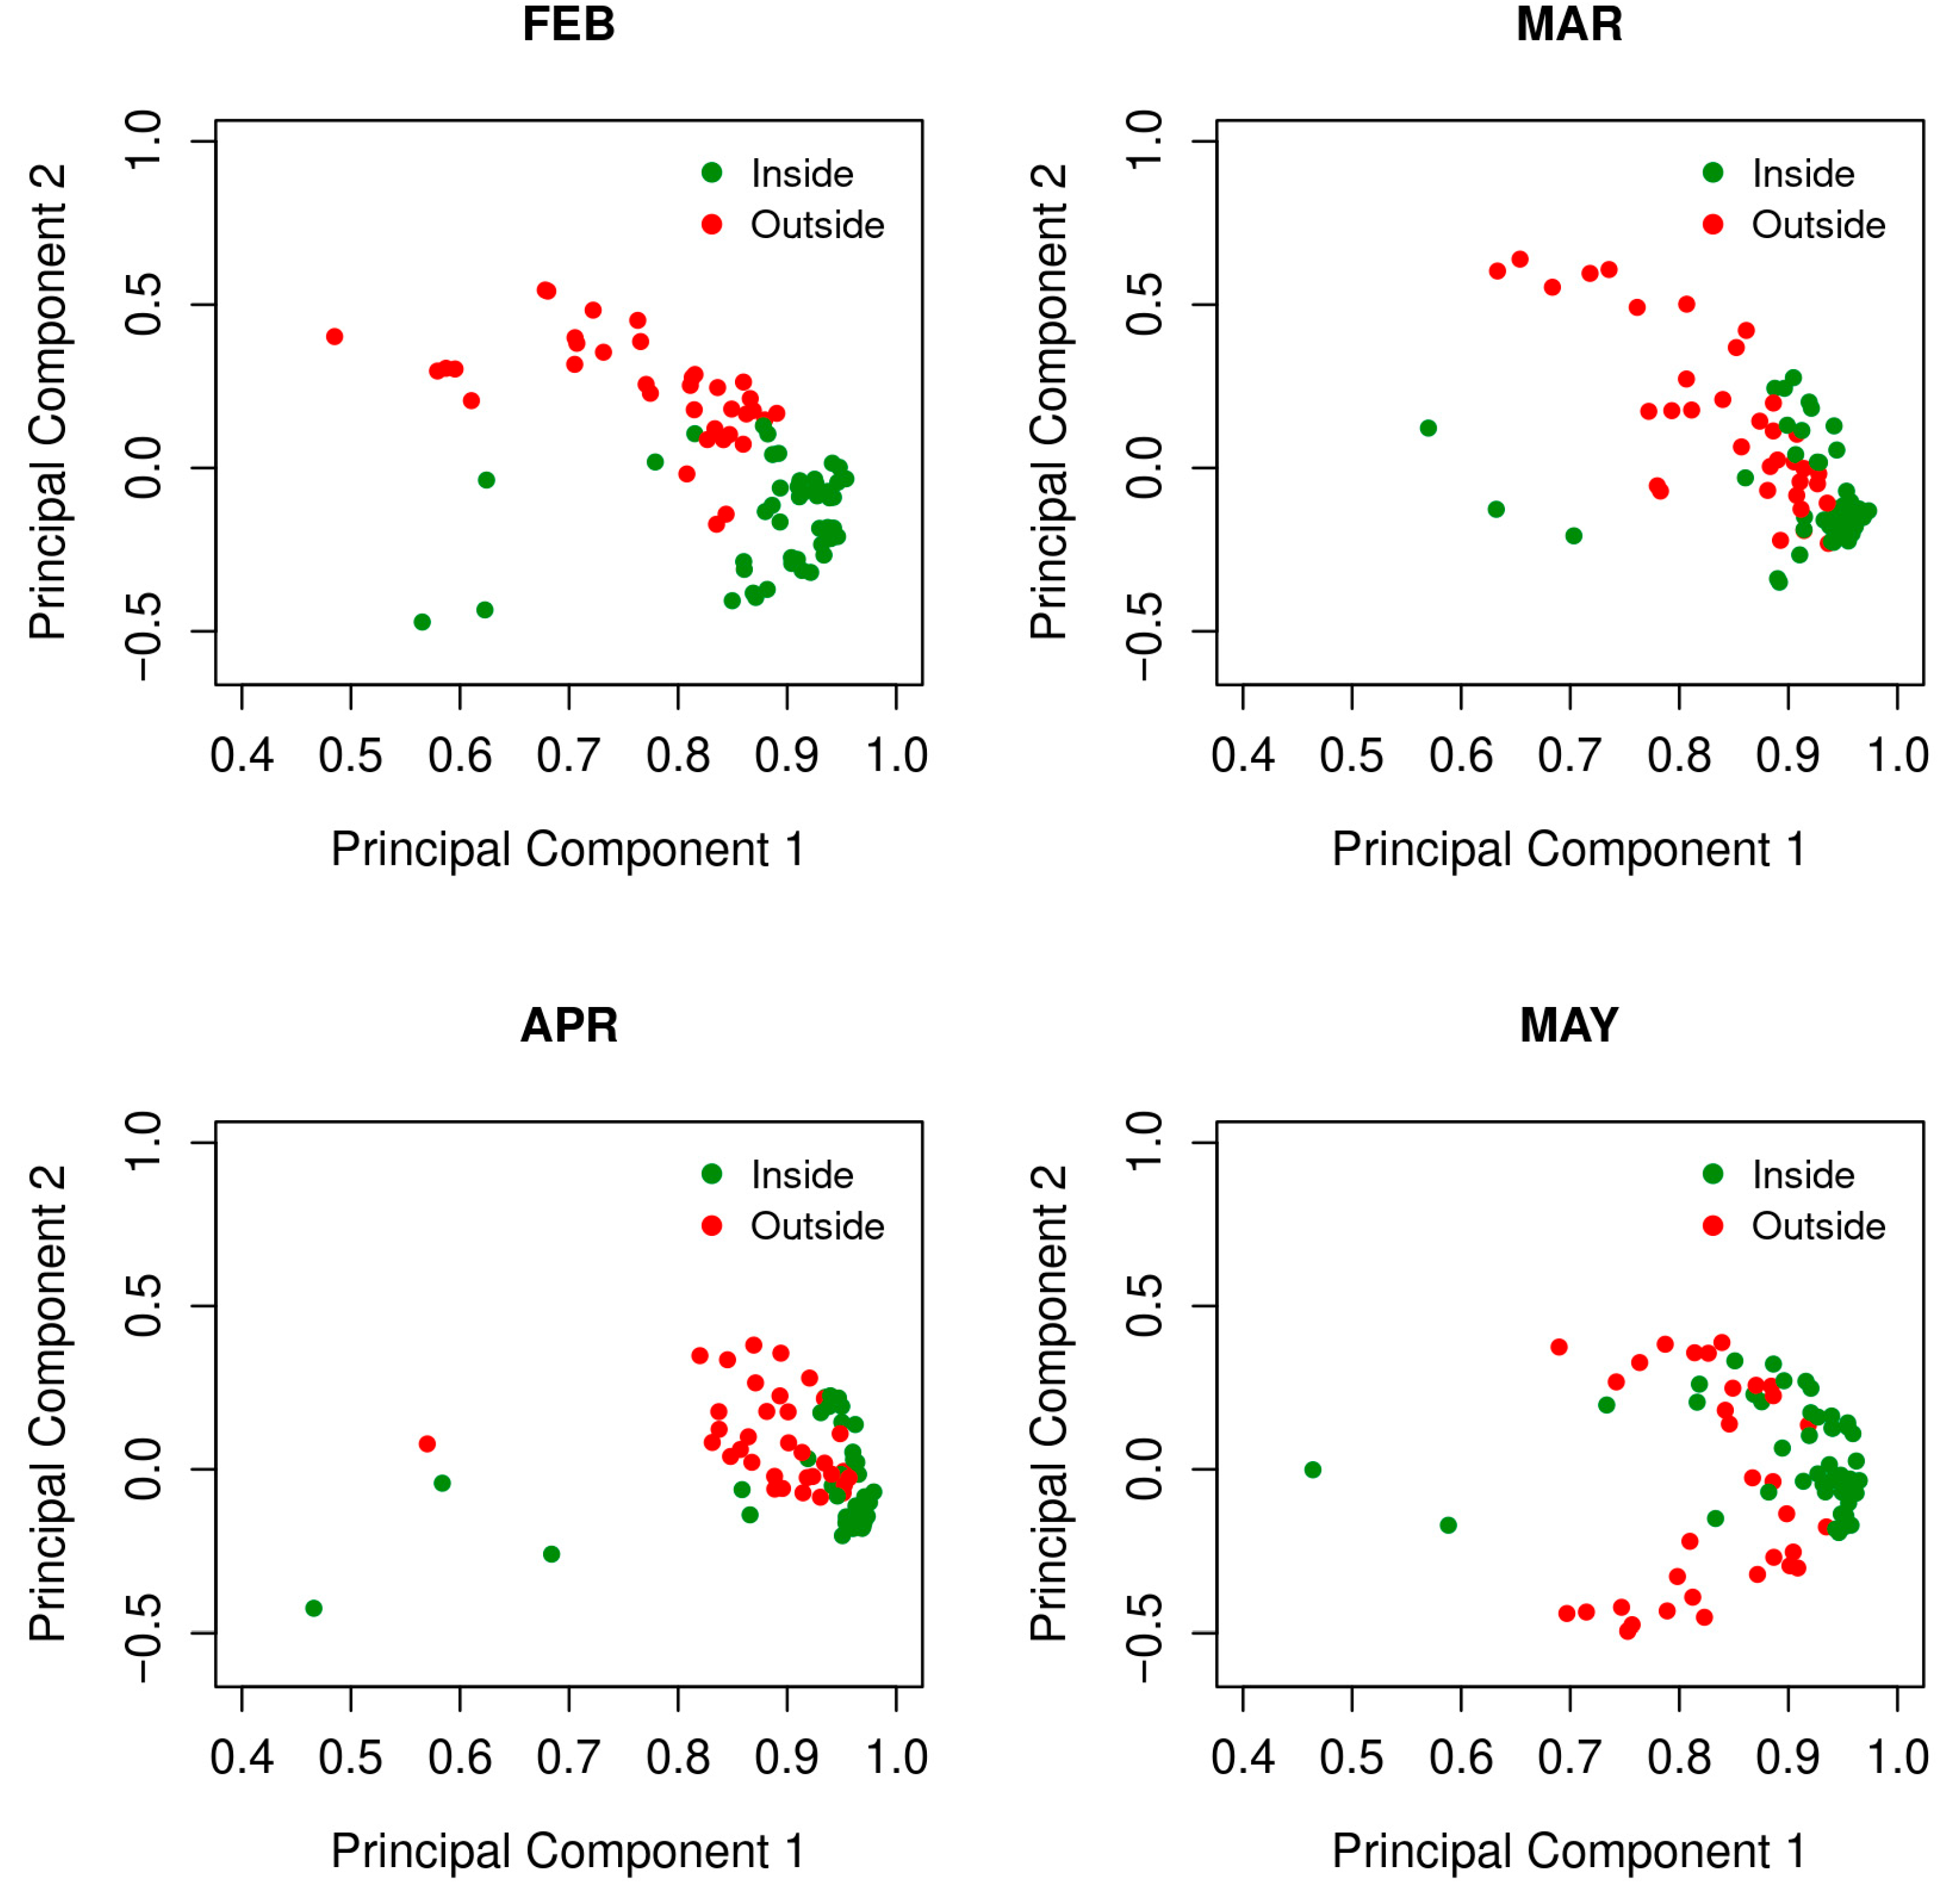
Figure 3 displays the principal component scores (first vs. second) for each month from February to May. Each panel shows urban samples (“Inside”, green points) and rural samples (“Outside”, red points). In February and March, the point clouds are more dispersed, and the Inside–Outside separation is pronounced. In April, the cloud contracts, and the inter-group differences diminish. In May, the configuration diverges from that of April; a wider separation and a modified cloud geometry are evident, suggesting altered conditions relative to the preceding month.
Diurnal variation in the PM2.5 concentration difference between the urban (“Inside”) and rural (“Outside”) sensor groups for February–May is presented in Figure 4. Positive values prevail in February during the morning and forenoon, while negative values dominate in the evening and at night. March follows the same pattern but with a slightly smaller amplitude. In April, the differences narrow: the curve remains close to zero, dipping only modestly in the evening. May likewise stays near zero, yet the zero-crossing is delayed, occurring early in the morning in April but in the late afternoon in May. A clear daytime asymmetry characterizes February and March; by contrast, the urban–rural contrast is much less marked in April and May. This pattern demonstrates that winter months are dominated by stronger rural emissions advected into the city, while in the spring, the contrasts fade, and urban traffic becomes a relatively more important contributor.
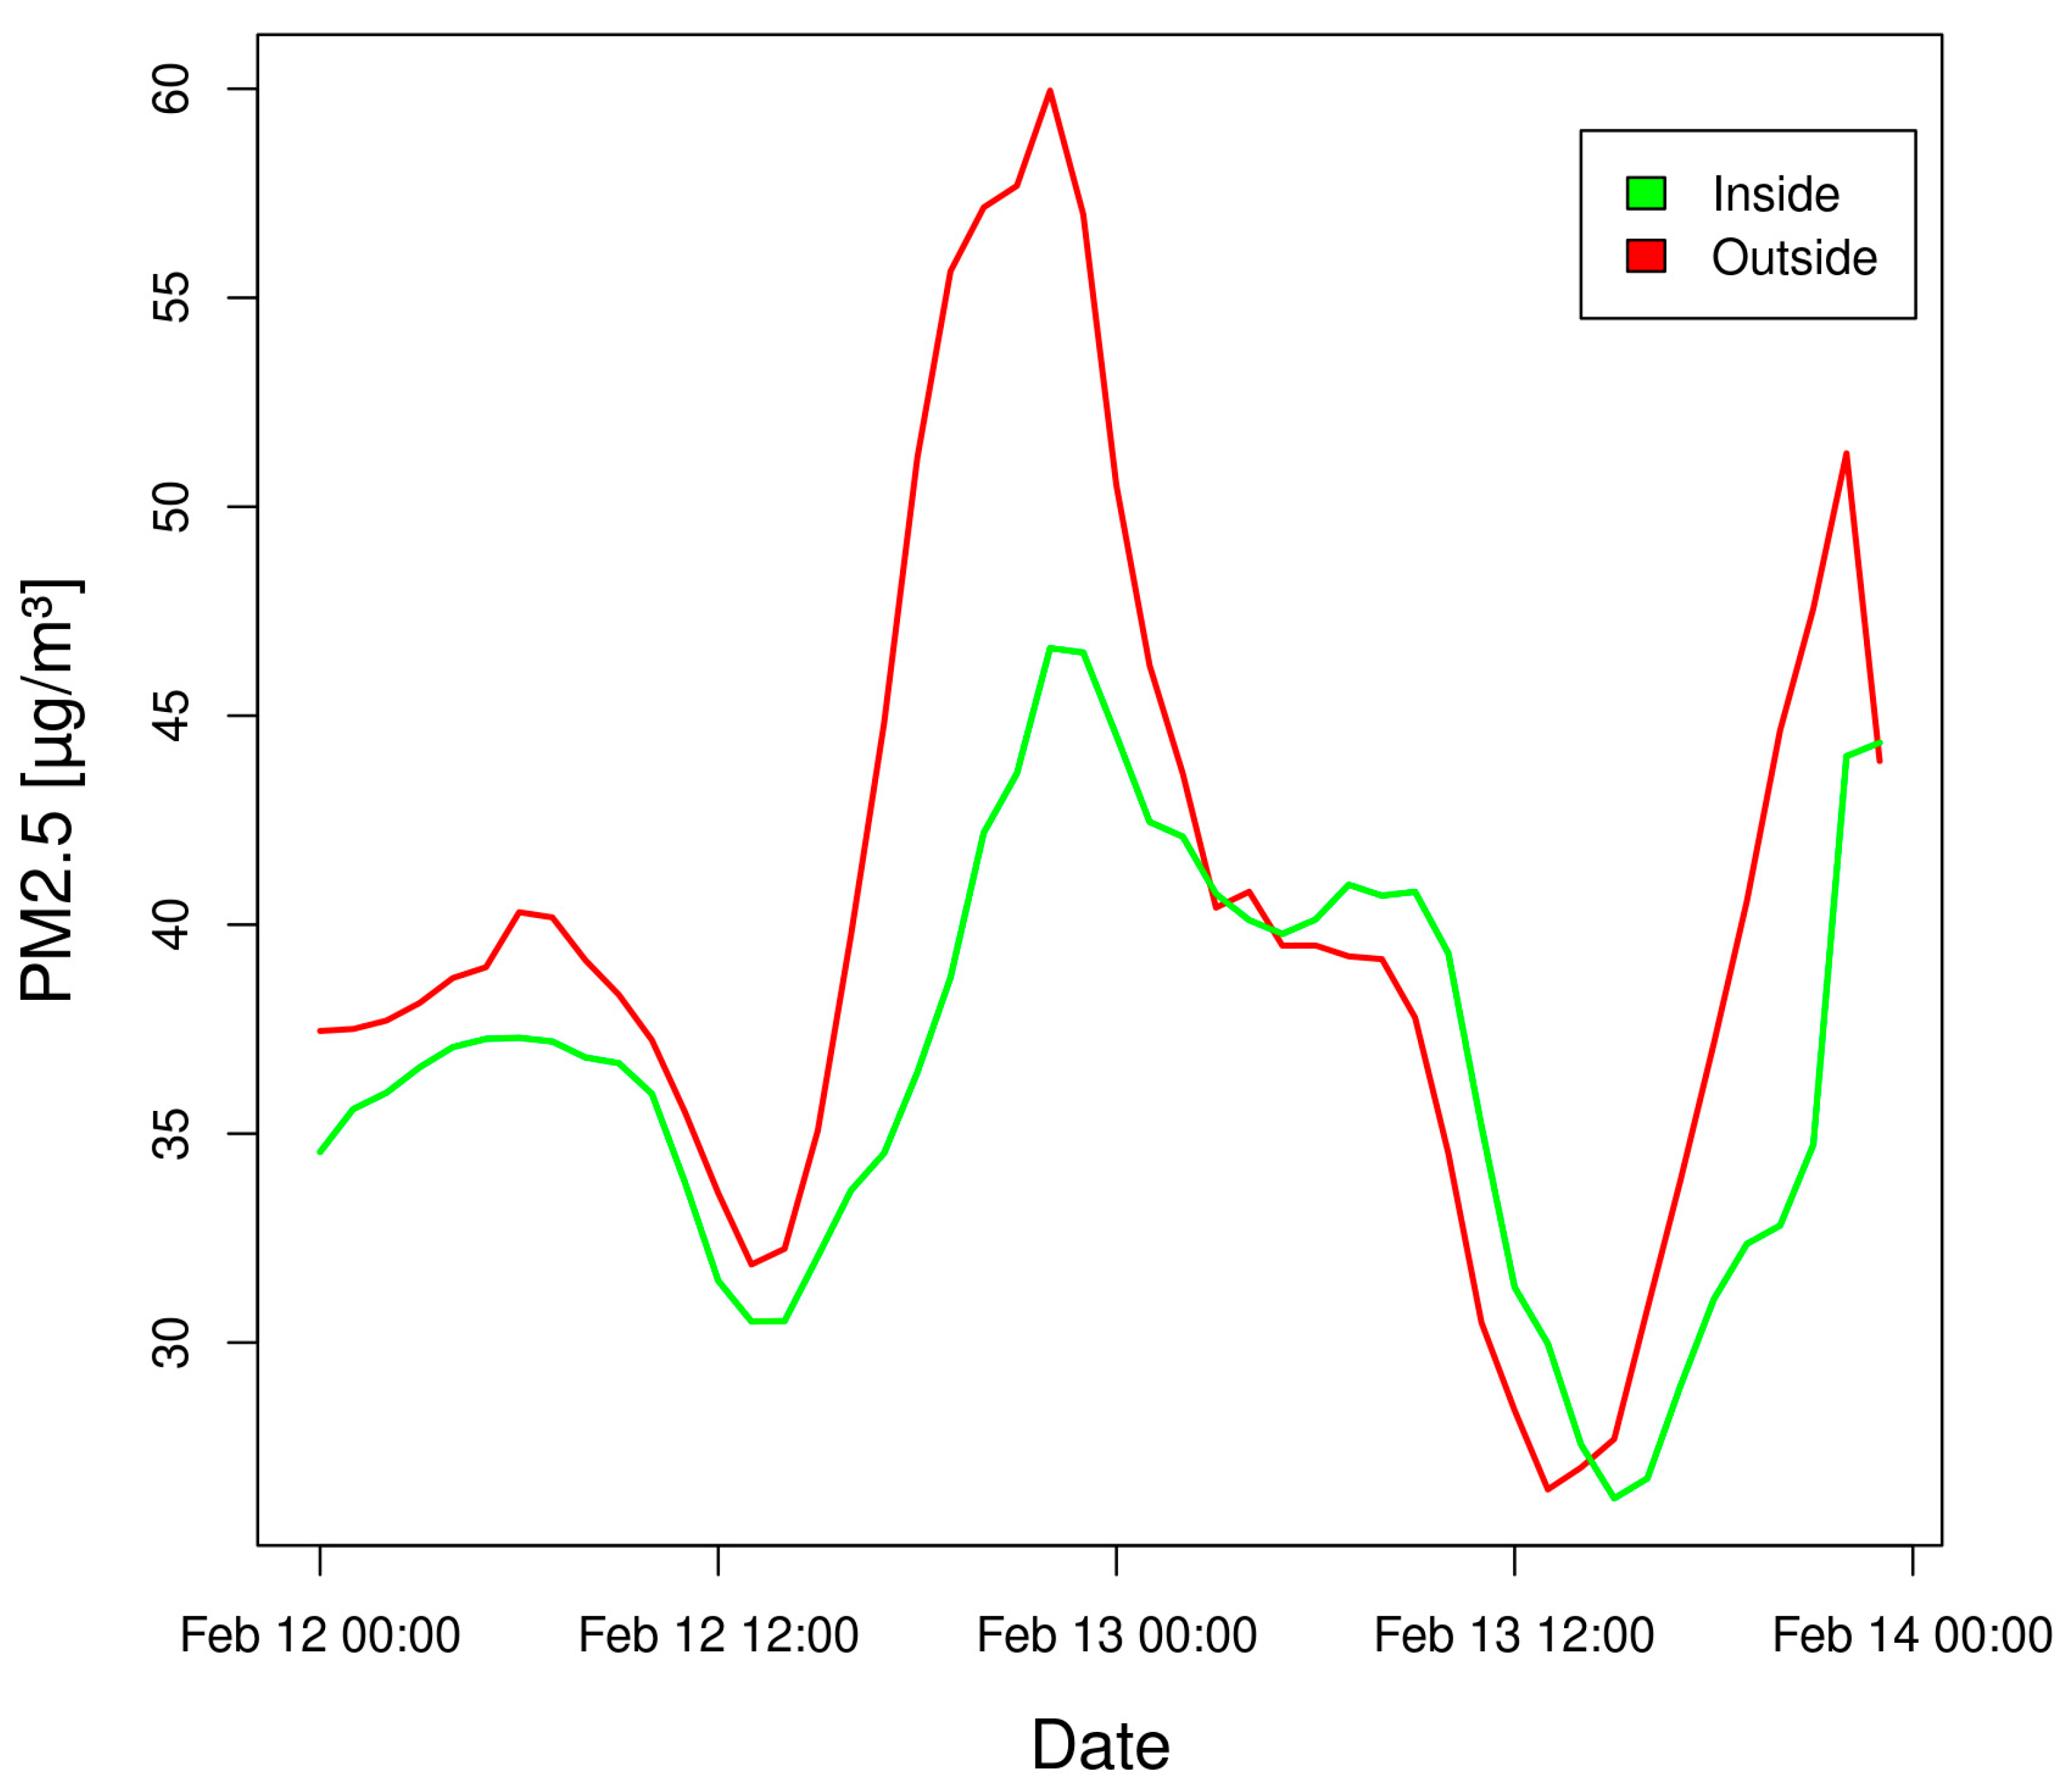
The most severe smog event in the data occurred during the night of 12–13 February 2025, and all further analyses focus on this episode. Average PM2.5 readings from urban and rural sensor groups were compared hour by hour to trace its development. During the episode, rural sensors (red curve in Figure 5) recorded much higher peaks than urban sensors (green curve), especially at the main nighttime maximum. Both curves exhibit a similar temporal profile; however, the increases and decreases in concentration at the urban sensors occur later, indicating a clear time lag.
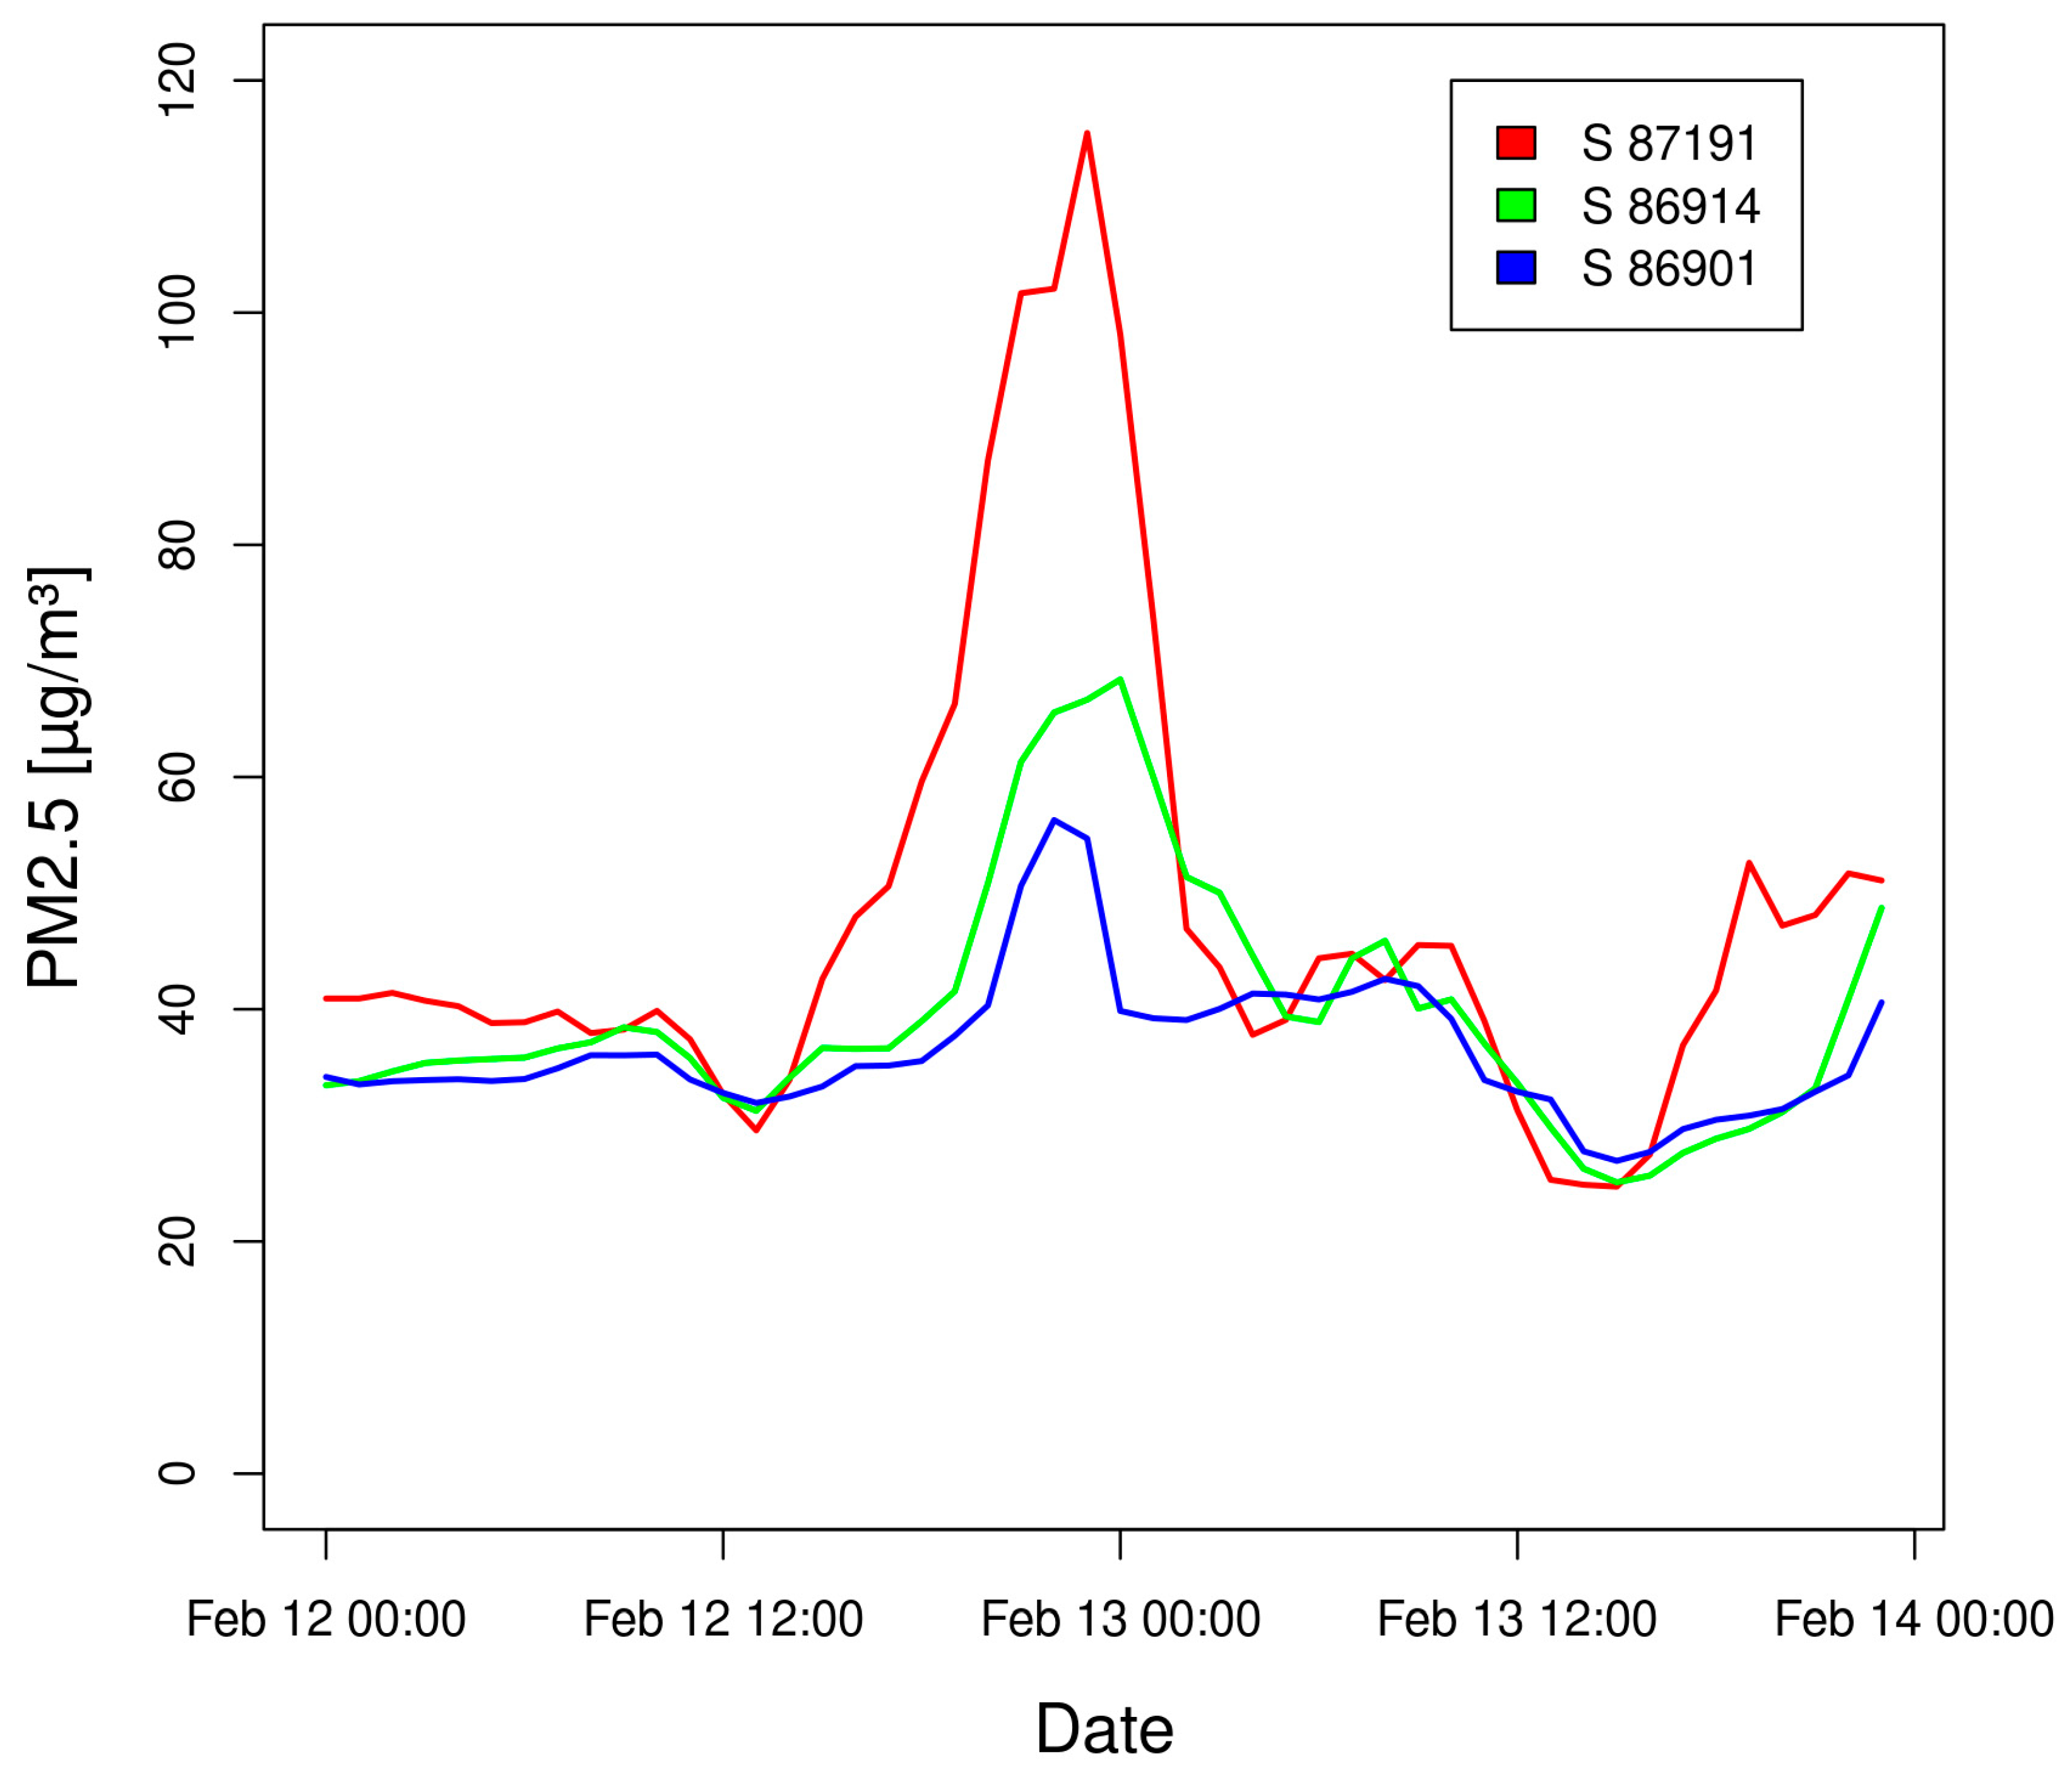
Figure 6A presents the particle density map produced by the HYSPLIT model for the selected smog episode. The HYSPLIT dispersion output (ARL data driven) was converted to a point set of simulated particle positions. A kernel density estimate was then computed over these modeled endpoints (Gaussian kernel, data driven bandwidth; 100 m grid), and the raster was clipped to the city polygon. A clear concentration of particle trajectories is visible and can be directly linked to possible low-emission sources. It is noteworthy that no sensors are installed in the eastern part of the city, where a prominent trajectory from one rural point is projected into that area. Three sensors (86901, 86914, and 87191) were used for more detailed examination. Figure 6B shows the raw HYSPLIT endpoints associated with the emission from vicinity of the selected rural sensor 87191. The endpoints form an elongated southeast to northwest pattern, consistent with the northwesterly winds that prevailed during the episode and with the density field identified in Figure 6A. Notably, this band extends across the two urban sensors 86914 and 86901, confirming that simulated air parcels from the rural source intersect those specific locations within the city. Measurements from the three above-mentioned sensors are plotted in Figure 7. The rural sensor 87191 (red curve) registered the highest concentrations, exceeding 100 µg m−3 at the main nocturnal peak. The urban sensors 86914 (green) and 86901 (blue) also recorded a marked rise but with lower amplitudes and with the characteristic time shift that increases with distance from the source. The data again show that the episode was strongest at the rural location. The urban time series have the same overall shape but are clearly delayed: the farther from the probable source, the later and smaller the increase in concentration.
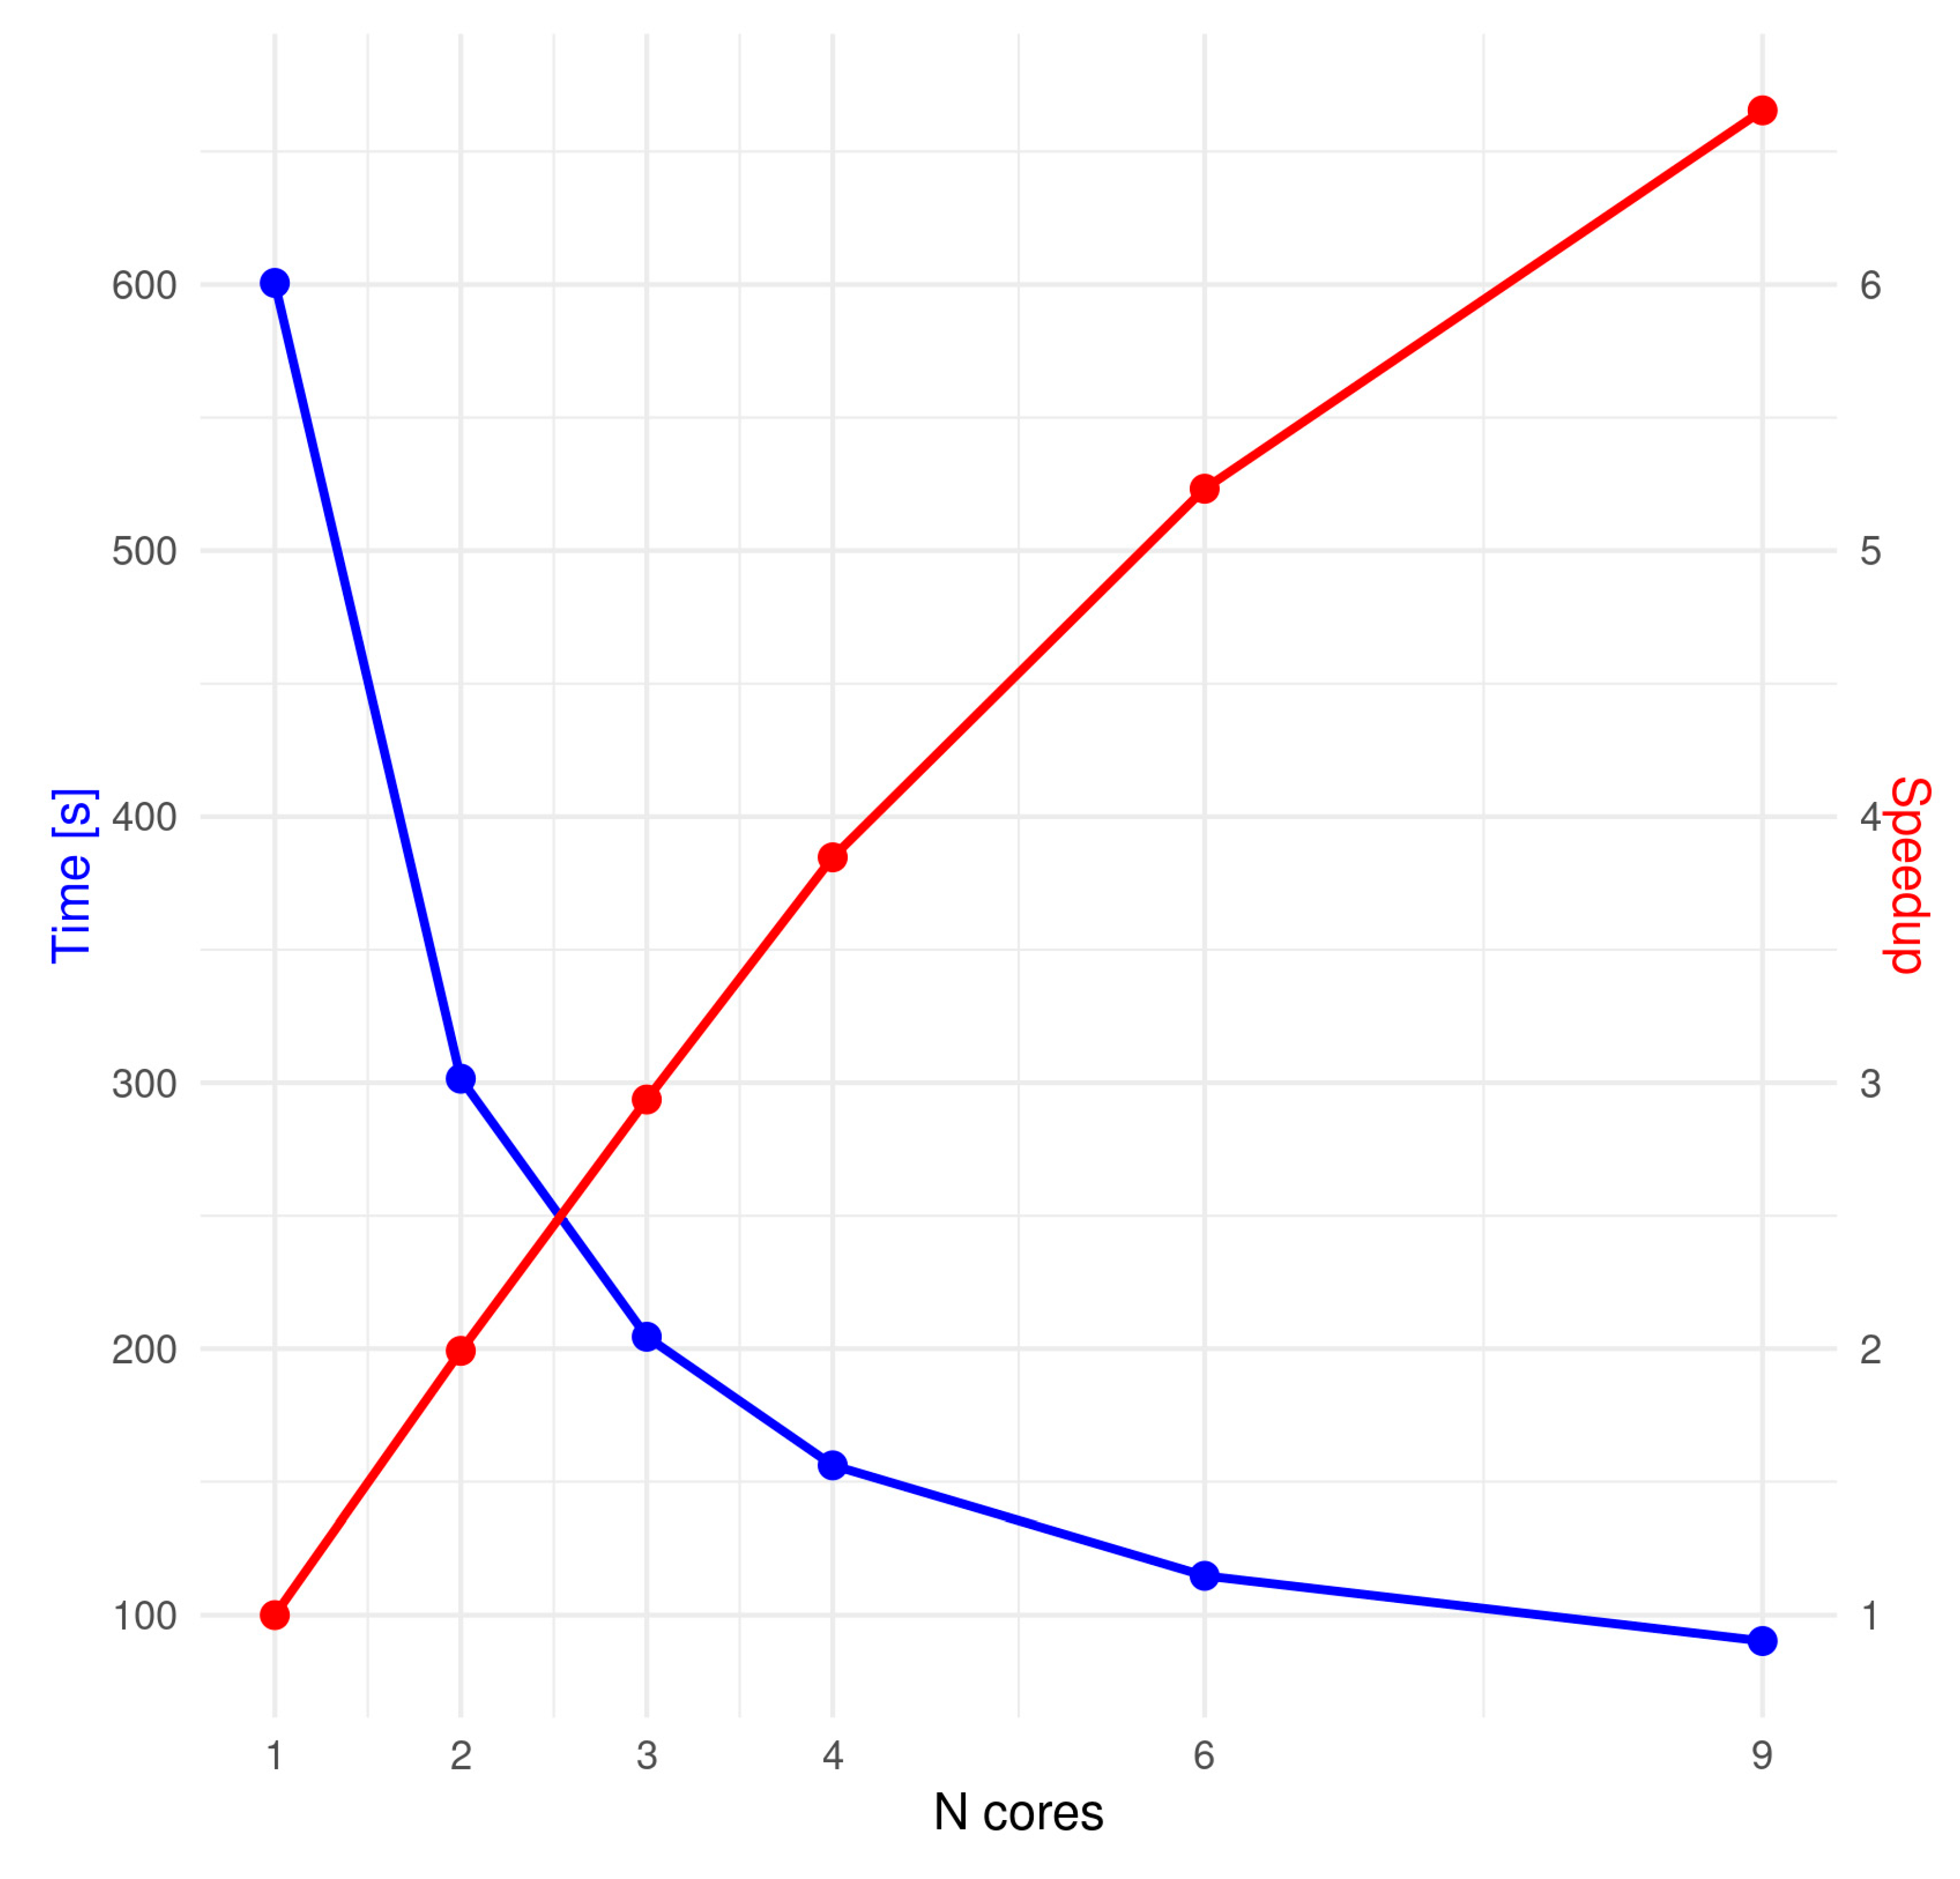
Because HYSPLIT calculations remain time consuming even at a relatively small scale, high-performance computing techniques were employed; an ultra-coarse-grained task decomposition (without any communication) was selected as a practical solution. Figure 8 illustrates the relationship between the number of computational cores and both simulation time and achieved speed-up. To keep the 36 tasks divisible without remainder, speed-up tests were conducted with 2, 3, 4, 6, and 9 cores. Such divisibility is essential for the efficiency of this coarse-grained approach. The runtime (blue line) decreases from more than 600 s with a single core to below 100 s when nine cores are used. The speed-up factor (red line) increases almost linearly, exceeding 6.5 at nine cores, a very good result for such a high-level approach.

4. Discussion

Data from the network of low-cost sensors revealed a pronounced heating-season signature: hourly PM2.5 values rose sharply in the winter and fell towards late spring. The relationship between the increase in PM2.5 concentrations and the heating season is intuitive and well documented in Kraków and its surroundings [18]. Nevertheless, highlighting this effect is important, as it provides a necessary context for interpreting the temporal variability of sources and the different contributions of urban and rural emissions across the day and throughout the year. Principal component patterns varied from month to month, implying shifts in transport pathways and source mixtures. The urban and rural clusters resembled each other most closely in April, whereas the May data showed greater scatter at rural sites, plausibly linked to agricultural activity.
Urban–rural contrasts confirmed that pollutant origin also changes with location. During the winter months, emissions outside Kraków dominated; in May, however, concentrations remained higher inside the city until the late afternoon, a pattern consistent with intensified road traffic. The larger amplitudes and systematic time lags recorded at rural stations, as compared with Kraków, where solid fuels are banned indicate the advection of pollution from outside the municipal boundary.
The smog episode of 12–13 February 2025 illustrates this process. Trajectories generated with HYSPLIT presented as a kernel density map matched the temporal records, linking probable emission points to the observed concentration peaks. The three case study sensors captured the expected gradient in both amplitude and timing along the inferred advection path. Although the trajectory analysis proved internally consistent, its accuracy ultimately depends on meteorological data resolution, particle count, emission height and timing, and other model settings.
Combining HYSPLIT trajectories with urban and rural sensor signals, as well as with particle density maps, provides a practical framework for identifying dominant low-emission sources. Large stationary sources are not analyzed here, as for many years, the primary contributors to air pollution in the Kraków region have been emissions from solid-fuel combustion used for residential heating in the surrounding municipalities, where such fuels remain permitted unlike within the city itself [35,36,37,38]. Extending the proposed approach will require additional episodes that span a range of wind directions and thermal regimes, including stagnation events; future work should also test the sensitivity to the modeling parameters noted above. It should also be emphasized that the case study analysis is based on surface-level measurements from low-cost sensors. While HYSPLIT trajectories are driven by three-dimensional meteorological fields, our approach does not reconstruct vertical wind profiles or atmospheric stratification in detail. Instead, the analysis is designed to demonstrate how surface networks, combined with trajectory modeling, can reliably identify low-level transport of pollutants associated with residential heating sources.
To meet the computational demand, an ultra-coarse-grained decomposition was adopted. Running 36 independent HYSPLIT jobs in parallel scaled well up to 9 CPU cores: the runtime dropped from more than 600 s on one core to less than 100 s on nine, and the speed-up exceeded 6.5. Most of the gain occurred between one and four cores, with diminishing returns thereafter, pointing to moderate overheads from process initialization, meteorological I/O, and task scheduling in the high-level furrr implementation.
An additional dimension that deserves emphasis is the practical application of these findings. One of the most effective ways of addressing air pollution linked to everyday human activities is to increase public awareness. This requires simple, fast, and transparent tools that can both illustrate the scale of the problem and identify its sources. Our study contributes to this by showing how data from dense networks of low-cost sensors can be used to track pollution pathways and attribute them to specific source regions. This complements previous work that has relied mainly on sparse reference monitoring stations, which provide detailed chemical or physical characterization but lack sufficient spatial coverage for reliable transport analysis. By contrast, our approach demonstrates how high-resolution spatio-temporal data can reveal direct linkages between suburban emissions and urban air quality, thereby offering a valuable instrument for local authorities when designing and communicating air quality policies.
Several limitations of this study should be acknowledged. The analysis relied on low-cost sensors, which, although calibrated and certified, provide less detailed chemical information than reference stations and are therefore restricted to mass concentrations. The HYSPLIT trajectories are sensitive to meteorological resolution, emission height, and particle count, which may affect the precision of source attribution. Furthermore, the study focused on a single heating season and four consecutive months; broader generalization will require longer time series and additional episodes under varying synoptic conditions.

5. Conclusions

The study indicates that peak PM2.5 concentrations tend to occur during the heating season and that both amplitude differences and temporal lags between rural and urban sites suggest an external inflow of pollutants, especially during smog episodes. The consistent evidence provided by time-series analysis, PCA patterns, and HYSPLIT particle density fields supports this interpretation and illustrates the utility of the proposed analytical framework for source attribution. Effective monitoring and mitigation must extend beyond the city boundary, as rural areas shape urban pollution events. From an operational standpoint, even the coarse-grained parallelization applied here proved helpful, as without it, multi-source HYSPLIT simulations take too long for routine use. Overall, the results uphold each of the three hypotheses formulated at the outset of this work. Although preliminary and requiring confirmation across additional episodes with varying meteorological regimes, the findings suggest that integrating low-cost monitoring networks with HPC-enabled modeling offers a promising pathway for regional air quality management.

Author Contributions

Conceptualization, D.L., P.L. and T.D.; methodology, D.L., P.L. and T.D.; software, D.L., P.L. and T.D.; validation, D.L., P.L. and T.D.; formal analysis, D.L., P.L. and T.D.; investigation, D.L., P.L. and T.D.; resources, D.L., P.L. and T.D.; data curation, D.L., P.L. and T.D.; writing—original draft preparation, D.L., P.L. and T.D.; writing—review and editing, D.L., P.L. and T.D.; visualization, D.L., P.L. and T.D.; supervision, T.D.; project administration, D.L., P.L. and T.D.; funding acquisition, D.L., P.L. and T.D. All authors have read and agreed to the published version of the manuscript.

Funding

The study was financed by the AGH University of Krakow, Faculty of Geology, Geophysics and Environmental Protection, as part of the statutory project and by the program Excellence initiative-research university for the AGH University of Krakow.

Data Availability Statement

The Airly sensor data analyzed in this study were obtained under a free academic API key issued by Airly S.A. in accordance with the Airly API Service Terms. These terms restrict redistribution of the raw data and prohibit sharing of the API key with third parties. Consequently, the underlying data are not publicly available. Researchers can obtain current data directly from Airly by registering for an academic research API key at https://airly.org (accessed on 10 September 2025) (see Airly API Terms of Service).

Conflicts of Interest

The authors declare no conflicts of interest.

References

  1. State of Global Air 2024; EEA Report: Copenhagen, Denmark, 2024.
  2. European Environment Agency (EEA). Air Quality in Europe 2022—Health Impacts of Air Pollution: Table 2; EEA: Copenhagen, Denmark, 2022; Available online: https://www.eea.europa.eu/publications/air-quality-in-europe-2022/health-impacts-of-air-pollution-table2 (accessed on 10 September 2025).
  3. ESCAPE (European Study of Cohorts for Air Pollution Effects, 2019). Available online: https://cordis.europa.eu/project/id/211250 (accessed on 10 September 2025).
  4. Raaschou-Nielsen, O.; Andersen, Z.J.; Beelen, R.; Samoli, E.; Stafoggia, M.; Weinmayr, G.; Hoffmann, B.; Fischer, P.; Nieuwenhuijsen, M.J.; Brunekreef, B.; et al. Air pollution and lung cancer incidence in 17 European cohorts: Prospective analyses from the European Study of Cohorts for Air Pollution Effects (ESCAPE). Lancet Oncol. 2013, 14, 813–822. [Google Scholar] [CrossRef] [PubMed]
  5. Weinmayr, G.; Romeo, E.; De Sario, M.; Weiland, S.; Forastiere, F. Short-term effects of PM10 and NO2 on respiratory health in children with asthma or asthma-like symptoms: A systematic review and meta-analysis. Environ. Health Perspect. 2010, 118, 449–457. [Google Scholar] [CrossRef] [PubMed]
  6. Dąbrowiecki, P.; Chciałowski, A.; Dąbrowiecka, A.; Piórkowska, A.; Badyda, A. Air pollution and long-term risk of hospital admission due to chronic obstructive pulmonary disease exacerbations in Poland: A time-stratified, case-crossover study. Polskie Arch. Med. Wewnętrznej 2023, 133, 1–7. [Google Scholar] [CrossRef]
  7. Szikowski, T.; Adam, M.; Marcon, A.; Cai, Y.; Vierkötter, A.; Carsin, A.E.; Jacquemin, B.; Al Kanani, Z.; Beelen, R.; Birk, M.; et al. Ambient air pollution and the incidence and prevalence of COPD. Eur. Respir. J. 2014, 44, 614–626. [Google Scholar] [CrossRef] [PubMed]
  8. MacIntyre, E.A.; Gehring, U.; Molter, A.; Fuertes, E.; Klümper, C.; Kramer, U.; Quass, U.; Hoffmann, B.; Gascon, M.; Brunekreef, B.; et al. Air pollution and respiratory infections in early childhood: An analysis of 10 European birth cohorts within the ESCAPE project. Environ. Health Perspect. 2014, 122, 107–113. [Google Scholar] [CrossRef] [PubMed]
  9. Cesaroni, G.; Forastiere, F.; Stafoggia, M.; Andersen, Z.J.; Badaloni, C.; Beelen, R.; Caracciolo, B.; de Faire, U.; Erbel, R.; Eriksen, K.T.; et al. Long term exposure to ambient air pollution and incidence of acute coronary events: Prospective cohort study and meta-analysis in 11 European cohorts from the ESCAPE Project. BMJ 2014, 348, f7412. [Google Scholar] [CrossRef] [PubMed]
  10. Burte, E.; Leynaert, B.; Bono, R.; Brunekreef, B.; Bousquet, J.; Carsin, A.E.; De Hoogh, K.; Forsberg, B.; Gormand, F.; Heinrich, J.; et al. Association between air pollution and rhinitis in two European cohorts. Environ. Int. 2018, 115, 257–266. [Google Scholar] [CrossRef] [PubMed]
  11. Kwon, D.; Paul, K.C.; O’Sharkey, K.; Paik, S.A.; Yu, Y.; Bronstein, J.M.; Ritz, B. Challenges in studying the impact of air pollution on neurodegenerative diseases. Environ. Res. 2025, 278, 121597. [Google Scholar] [CrossRef] [PubMed]
  12. Główny Inspektorat Ochrony Środowiska (GIOŚ). Poziomy Dopuszczalne Zanieczyszczeń w Powietrzu ze Względu na Ochronę Zdrowia Ludzi i Ochronę Roślin, Terminy ich Osiągnięcia Oraz Okresy, Dla Których Uśrednia się Wyniki Pomiarów; GIOŚ: Warsaw, Poland, 2015. Available online: https://powietrze.gios.gov.pl/pjp/content/annual_assessment_air_acceptable_level# (accessed on 10 September 2025).
  13. World Health Organization (WHO). WHO Global Air Quality Guidelines. Particulate Matter (PM2.5 and PM10), Ozone, Nitrogen Dioxide, Sulfur Dioxide and Carbon Monoxide; WHO: Geneva, Switzerland, 2021; Available online: https://iris.who.int/bitstream/handle/10665/345329/9789240034228-eng.pdf?sequence=1&isAllowed=y (accessed on 10 September 2025).
  14. Directive (EU) 2024/2881 of the European Parliament and of the Council of 23 October 2024 on Ambient Air Quality and Cleaner Air for Europe EU: 2024. Available online: https://eur-lex.europa.eu/legal-content/PL/TXT/PDF/?uri=OJ:L_202402881 (accessed on 10 September 2025).
  15. Bokwa, A. Development of research on the local climate of Kraków. Acta Geogr. Lodz. 2019, 108, 7–20. [Google Scholar]
  16. Sejmik Województwa Małopolskiego. Resolution No. XVIII/243/16 of the Małopolska Regional Assembly of 15 January 2016 on Introducing Restrictions on the Operation of Installations Using Fuel Combustion in the City of Kraków; Official Journal of the Małopolska Region: Kraków, Poland, 2016. [Google Scholar]
  17. Polski alarm smogowy. Kraków Nie Jest Już Stolicą Smogu—Historyczna Poprawa Jakości Powietrza; Polski alarm smogowy: Warsaw, Poland, 2024; Available online: https://polskialarmsmogowy.pl/2024/05/krakow-nie-jest-juz-stolica-smogu-historyczna-poprawa-jakosci-powietrza/ (accessed on 10 September 2025).
  18. Danek, T.; Zaręba, M. Using public data from low-cost sensors for geospatial analysis of air pollution from solid fuel heating during the spring COVID-19 pandemic in Kraków. Sensors 2021, 21, 5208. [Google Scholar] [CrossRef] [PubMed]
  19. Sejmik Województwa Małopolskiego. Resolution No. LIX/842/22 of the Małopolska Regional Assembly of 26 September 2022 Amending Resolution No. XXXII/452/17 of 23 January 2017 on Introducing Restrictions and Prohibitions in the Operation of Installations Using Fuel Combustion in the Małopolska Region; Official Journal of the Małopolska Region: Kraków, Poland, 2022. [Google Scholar]
  20. EN 303-5:2012; Heating Boilers—Part 5: Heating Boilers for Solid Fuels, Hand and Automatically Stoked, Nominal Heat Output of up to 500 kW—Terminology, Requirements, Testing and Marking. CEN: Brussels, Belgium, 2012; Polish version: PN-EN 303-5:2012, Polish Committee for Standardization (PKN): Warsaw, Poland.
  21. Portal Samorządowy. Kraków Przeprowadził Pomiary Ruchu Drogowego. Wiadomo Już, Gdzie Jest Najgorzej; Portal samorządowy: Katowice, Poland, 2024; Available online: https://www.portalsamorzadowy.pl/wydarzenia-lokalne/krakow-przeprowadzil-pomiary-ruchu-drogowego-wiadomo-juz-gdzie-jest-najgorzej,574610.html?mp=promo (accessed on 10 September 2025).
  22. Kraków City Council. Resolution No. XXXII/619/25 of the Kraków City Council of 12 June 2025 on Establishing the Clean Transport Zone in Kraków; Official Journal of the Małopolska Voivodeship: Kraków, Poland, 2025; Item 3829. [Google Scholar]
  23. Stein, A.F.; Draxler, R.R.; Rolph, G.D.; Stunder, B.J.B.; Cohen, M.D.; Ngan, F. NOAA’s HYSPLIT atmospheric transport and dispersion modeling system. Bull. Am. Meteorol. Soc. 2015, 96, 2059–2077. [Google Scholar] [CrossRef]
  24. Draxler, R.R. HYSPLIT4 User’s Guide. In NOAA Tech. Memo. ERL ARL-230; NOAA Air Resources Laboratory: Silver Spring, MD, USA, 1999. [Google Scholar]
  25. Draxler, R.R.; Hess, G.D. An overview of the HYSPLIT_4 modeling system of trajectories, dispersion, and deposition. Aust. Meteorol. Mag. 1998, 47, 295–308. [Google Scholar]
  26. Draxler, R.R.; Hess, G.D. Description of the HYSPLIT_4 modeling system. In NOAA Tech. Memo. ERL ARL-224; NOAA Air Resources Laboratory: Silver Spring, MD, USA, 1997; p. 24. [Google Scholar]
  27. Breiman, L. Random Forests. Mach. Learn. 2001, 45, 5–32. [Google Scholar] [CrossRef]
  28. Wright, M.N.; Ziegler, A. ranger: A Fast Implementation of Random Forests for High Dimensional Data in C++ and R. J. Stat. Softw. 2017, 77, 1–17. [Google Scholar] [CrossRef]
  29. Iannone, R. splitr: Use the HYSPLIT Model from Inside R. R Package Version 0.4.0.9000. Available online: https://github.com/rich-iannone/splitr (accessed on 10 September 2025).
  30. KOBiZE. Wskaźniki Emisji Zanieczyszczeń ze Spalania Paliw Dla Źródeł o Nominalnej Mocy Cieplnej do 5 MW, Zastosowane do Automatycznego Wyliczenia Emisji w Raportach do Krajowej Bazy za Lata 2022–2024 [Emission Factors of Pollutants from Fuel Combustion in Sources with a Nominal Thermal Input up to 5 MW, Applied for the Automatic Calculation of Emissions in National Database Reports for 2022–2024]; Institute of Environmental Protection—National Research Institute (IOŚ-PIB): Warsaw, Poland, 2025; Available online: https://kobize.pl (accessed on 10 September 2025).
  31. Baddeley, A.; Rubak, E.; Turner, R. Spatial Point Patterns: Methodology and Applications with R; Chapman & Hall/CRC Press: London, UK, 2015; ISBN 978-1-4822-1020-0. [Google Scholar]
  32. Bengtsson, H. A Unifying Framework for Parallel and Distributed Processing in R Using Futures. R J. 2021, 13, 208–227. [Google Scholar] [CrossRef]
  33. Vaughan, D.; Dancho, M. furrr: Apply Mapping Functions in Parallel Using Futures, R Package Version 0.3.1; Comprehensive R Archive Network (CRAN): Vienna, Austria, 2022. [Google Scholar]
  34. Jandacka, D.; Durcanska, D.; Nicolanska, M.; Holubcik, M. Impact of Seasonal Heating on PM10 and PM2.5 Concentrations in Sučany, Slovakia: A Temporal and Spatial Analysis. Fire 2024, 7, 150. [Google Scholar] [CrossRef]
  35. Samek, L.; Stegowski, Z.; Furman, L.; Styszko, K.; Zajusz-Zubek, E.; Michalik, J. Seasonal variation in chemical composition of PM2.5 in Kraków, Poland. Water Air Soil Pollut. 2017, 228, 3483. [Google Scholar] [CrossRef]
  36. WIOŚ Kraków. Jakość Powietrza w Krakowie: Podsumowanie Wyników Badań. 2020. Available online: https://krakow.wios.gov.pl/2020/09/jakosc-powietrza-w-krakowie-podsumowanie-wynikow-badan/ (accessed on 3 October 2025).
  37. Bogacki, M.; Widziewicz, K.; Puta, R. Low-stack emission as the dominant factor of air pollution in Kraków. E3S Web Conf. 2018, 44, 00053. [Google Scholar] [CrossRef]
  38. Rogula-Kozłowska, W.; Majewski, G.; Rogula-Kopiec, P.; Pastuszka, J.S.; Mathews, B.; Sówka, I. Contribution of residential heating and traffic to PM2.5 during and after COVID-19 restrictions in Kraków, Poland. Appl. Sci. 2023, 13, 11492. [Google Scholar] [CrossRef]
Figure 1. Locations of sensors in Kraków and neighboring municipalities.
Atmosphere 16 01201 g001
Figure 2. Hourly mean PM2.5 readings averaged across all sensors, shown month by month from February to May.
Atmosphere 16 01201 g002
Figure 3. Principal component scatterplots (PC1 vs. PC2) of hourly PM2.5 profiles for each month (February–May) after outlier removal. Green points represent sensors located inside the city, while red points are those situated outside the city limits.
Atmosphere 16 01201 g003
Figure 4. Hour-by-hour differences in mean PM2.5 concentration (Inside–Outside) for each month from February to May. Positive values denote higher levels at urban core (“Inside”) sensors, whereas negative values indicate higher levels at peripheral (“Outside”) sites.
Atmosphere 16 01201 g004
Figure 5. Mean PM2.5 concentrations recorded by urban (“Inside”) and rural (“Outside”) sensor groups during the smog episode of 12–13 February 2025.
Atmosphere 16 01201 g005
Figure 6. (A) Kernel density of PM2.5 particles simulated with the HYSPLIT dispersion model for the selected 12–13 February smog episode. Three individual sensors used in further analysis are labeled. Red dots—rural (“Outside”) sensors; green dots—urban (“Inside”) sensors. (B) Raw HYSPLIT particle endpoints for the 12–13 February smog episode and selected source. The same three sensors are highlighted (red—rural; green—urban).
Atmosphere 16 01201 g006
Figure 7. Raw PM2.5 time series recorded by three selected sensors: one rural (“Outside”: 87191, red) and two urban (“Inside”: 86914, green; 86901, blue).
Atmosphere 16 01201 g007
Figure 8. Wall-clock runtime (blue, left axis) and parallel speed-up (red, right axis) achieved for an ultra-coarse task decomposition of the HYSPLIT R wrapper, plotted against the number of CPU cores.
Atmosphere 16 01201 g008
Disclaimer/Publisher’s Note: The statements, opinions and data contained in all publications are solely those of the individual author(s) and contributor(s) and not of MDPI and/or the editor(s). MDPI and/or the editor(s) disclaim responsibility for any injury to people or property resulting from any ideas, methods, instructions or products referred to in the content.