Abstract
PM2.5 pollution events evolve continuously through spatiotemporal diffusion. However, their three-dimensional spatiotemporal variation characteristics are often overlooked, and the interactions among key characteristics (e.g., duration, maximum concentration) have not yet been systematically analyzed. This study established a three-dimensional (longitude, latitude, and time) spatiotemporal framework for identifying contiguous PM2.5 pollution events based on the high-resolution ChinaHighAirPollutants (CHAP) dataset (1 km spatial and 1-day temporal resolution). The framework applied the meteorological event tracking algorithm (i.e., the Forward-in-Time method) to track PM2.5 pollution events. Based on this framework, we systematically tracked and characterized the spatiotemporal evolution of PM2.5 events across China from 2013 to 2021, quantified the relationships among key event characteristics, and tracked their transport pathways. The results show that: (1) The combination of the FiT algorithm and CHAP dataset enables effective tracking and identification of the three-dimensional spatiotemporal evolution of PM2.5 pollution events across China. (2) Event PM2.5 totals, average totals per event and pollution events exhibit a distinct right-inclined “T”-shaped pattern, with hotspots located in Xinjiang, the Beijing-Tianjin-Hebei (BTH) region, Shandong, and Henan, where annual event frequency exceeds 15. (3) Event PM2.5 totals show strong correlations with average duration per event and average maximum concentration per event, particularly in heavily polluted areas where the Pearson correlation coefficient is close to 1. (4) PM2.5 pollution events are mainly characterized by short durations of 1 day or 2–3 days, accounting for over 80% of occurrences. Long-duration events are mostly concentrated in areas with severe pollution problems, and their persistence is closely linked to spatial coverage, terrain barrier effects, and meteorological conditions. (5) PM2.5 pollution events consistently exhibit a west-to-east transport pattern. Short-duration events propagate slower across the inland northwest, whereas long-duration events show a pronounced increase in meridional transport speeds along the eastern coastal areas. This study elucidates the continuous spatiotemporal evolution and intrinsic drivers of PM2.5 pollution events, offering scientific insights to support air quality improvement and the development of targeted management strategies.
1. Introduction
Spatiotemporal continuum characteristics of pollution events (e.g., event duration, average concentration, and maximum concentration) constitute critical determinants for environmental health risk quantification and emergency response protocol activation. These characteristics exhibit pronounced spatial heterogeneity and complex temporal evolution, as shaped by the interplay of regional emission sources, meteorological conditions, and atmospheric dynamics [1,2]. Consequently, understanding the spatiotemporal continuum characteristics of pollution events is essential for improving air quality and formulating effective management strategies. PM2.5, defined as fine particulate matter with an aerodynamic diameter of ≤2.5 μm, is a key air pollutant known for its long-range transport, complex chemical composition, and alveolar deposition potential [3]. It is classified as a Group 1 carcinogen by the World Health Organization [4]. While the spatiotemporal distribution of PM2.5 pollution is a well-established research domain, the continuum characteristics of PM2.5 pollution events remain poorly characterized.
Rapid industrialization and urbanization have intensified PM2.5 pollution. Many countries have implemented stringent emission regulations to mitigate localized contamination. However, PM2.5 pollution continues to confront challenges such as transboundary transport and secondary pollution [5,6,7]. For instance, biomass burning emissions in Southeast Asia drive transboundary PM2.5 transport, with significant impacts documented in Southwest China [8]; transcontinental dispersion delivers North American wildfire smoke to the eastern seaboard [9,10]. In this context, a growing consensus among scholars underscores the need to investigate transport pathways of PM2.5 pollution events and to examine critical characteristics such as maximum concentration and event duration [11,12]. These studies have primarily focused on the multidimensional characterization of pollution events, including spatiotemporal pattern analyses, development of emission source inversion models, and investigations of how climate change and anthropogenic activities influence pollution processes. Amidst continuously strengthening air quality controls (e.g., “Blue Skies” type campaigns in China), annual mean PM2.5 concentrations may stabilize or decline, while high-concentration, long-duration pollution events recur alarmingly frequently [13,14,15]. The intrinsic linkages among these event characteristics and their underlying mechanisms represent a critical research focus.
Conventional pollution event analysis relies on ground monitoring networks, while their inherent spatial sparsity prevents comprehensive characterization of pollution diffusion’s continuous spatial dynamics [16,17]. To overcome the spatial sparsity of ground monitoring networks, numerous studies employ spatial interpolation techniques to characterize the spatial variability of pollution events [18,19]. For example, to overcome the limitations of traditional spatial interpolation techniques, Ma et al. [20] introduced a novel spatial interpolation technique that leverages the Long Short-Term Memory neural network to produce the spatial distribution of air pollutant concentrations. Meng et al. [21] predicted PM2.5 concentration changes in central and eastern China by integrating meteorological and air quality data via inverse distance interpolation and evaluating various machine learning models. They highlighted the effectiveness of spatial interpolation in capturing PM2.5 trends. Moreover, the spatial sparsity of ground monitoring networks can introduce systematic representation biases [18], particularly in regions with complex terrain and atmospheric conditions [22].
Advancements in satellite remote sensing have greatly enhanced the large-scale monitoring and analysis of PM2.5 pollution, with the fusion of multi-source remote sensing and ground-based observations markedly improving retrieval accuracy [23]. Yan et al. [24] utilized high-temporal-resolution satellite data to derive PM2.5 concentrations and applied deep learning models for estimation, effectively overcoming the limitations of sparse ground monitoring networks. Kong et al. [25] provided a review of imaging lidar methods for detecting pollution sources, emphasizing the current applications and future potential of remote sensing data and technologies in air quality analysis. Furthermore, numerous studies have employed numerical models, including WRF-Chem, to simulate PM2.5 spatial variability and transport dynamics [26,27,28,29]. Nonetheless, numerical modeling approaches frequently encounter challenges: substantial data requirements, computationally intensive simulations, and limited applicability beyond localized case studies. Although remote sensing datasets resolve macroscale PM2.5 spatial heterogeneity, their inherent resolution constraints impede microscale pollution characterization. This limitation necessitates the synergistic integration of high-resolution ground monitoring networks for fine-scale spatial differentiation analysis [30]. For instance, the ChinaHighAirPollutants (CHAP) dataset integrates satellite remote sensing, ground observations, and model simulations to provide continuous, gap-free PM2.5 data at 1 km spatial and daily temporal resolutions [31].
PM2.5 pollution events are typically identified via ground stations or designated grid cells; however, their inherent spatiotemporal continuum characteristics remain fundamentally unaccounted for in conventional detection frameworks. To capture these spatiotemporal continuum characteristics, numerous methodologies and algorithms have been developed for identifying pollution events. Various methodologies—including FLEXPART [32], random forest-based machine learning techniques [33], Graph Convolutional Network-driven deep learning methods [34,35], Hermitized Models [36], and Gaussian atmospheric dispersion models [37]—have been implemented for pollution event identification and modeling, demonstrating proven effectiveness across diverse regions. Hart et al. [38] reviewed some methodologies for detecting air pollution events, critically assessed the strengths and limitations of each approach, and emphasized the critical role of pollution data in event tracking. Moreover, certain algorithms originally developed for tracking and identifying other types of events offer potential solutions for detecting and tracking air pollution events. For example, Object-based spatiotemporal analysis methods, such as the Forward-in-Time (FiT) algorithm, offer novel approaches to track air pollution events. Originally developed for meteorological event tracking (e.g., rainfall systems), the FiT algorithm identifies contiguous ‘objects’ and establishes temporal linkages to quantify event duration, spatial extent, and transport trajectories [39,40]. Despite its validated efficacy, the application of the FiT algorithm in PM2.5 research remains limited, particularly in regions with complex terrain and heterogeneous emissions like China.
Despite substantial advances in understanding PM2.5 pollution events, critical scientific questions remain unresolved, particularly regarding how to elucidate the continuous spatiotemporal evolution and underlying drivers of PM2.5 pollution events from a high-resolution remote sensing dataset perspective, and specifically, how to incorporate dynamic behaviors including event splitting, merging, and migration. Furthermore, the interaction mechanisms among key characteristics of pollution events—such as event duration, maximum concentration, and event PM2.5 totals—are not well understood, which leads to mitigation strategies that primarily focus on ‘end-of-pipe’ control rather than interrupting the pollution formation process. To address these challenges, this study investigates the spatiotemporal continuum characteristics of PM2.5 pollution events in China from 2013 to 2021, utilizing the CHAP dataset and the FiT algorithm. The specific objectives are to: (i) characterize the spatiotemporal continuum characteristics of PM2.5 pollution events, encompassing frequency, duration, intensity, and spatial coverage; (ii) quantify correlations among key event attributes (e.g., event duration, maximum concentration, event PM2.5 totals) and identify dominant drivers; (iii) track the movement trajectories of pollution events to support refined pollution control strategies.
2. Methodology
2.1. Forward-in-Time Algorithm
Spatiotemporally contiguous air pollution events were detected from gridded daily average PM2.5 data using the FiT algorithm. The FiT algorithm [39,40], which is developed based on the Object-based Diagnostic Evaluation method [41], is an object-based analysis approach, that is, it identifies different pollution events based on the temporal and spatial distribution of pollution objects. The tracked events are conceptualized as three-dimensional entities spanning the spatial (longitude, latitude) and temporal domains. The algorithm assumes that there is no interaction between spatial objects occurring in separate time intervals. Consequently, each time interval is treated as an independent scenario, and no attempts are made to establish correlations between objects in adjacent intervals. The process of spatiotemporally contiguous air pollution event detection involves two main steps: (1) identifying spatial objects at each time step, (2) establishing spatiotemporal linkages among the objects within the same event. More details of the FiT algorithm can be found in the literature [39,40].
- (1)
- Identifying spatial objects at each time step
The spatial object identification framework includes three key modules: (i) setting a threshold, (ii) performing convolutional processing, and (iii) identifying spatial objects.
(i) Setting a threshold
This study primarily investigates the continuous spatiotemporal variations of PM2.5 pollution events. Additionally, to align with the standard stipulated in the “Ambient Air Quality Standards” (GB3095-2012) [42], where a daily average PM2.5 concentration equal to or exceeding 75 μg/m3 is deemed as PM2.5 pollution, the PM2.5 concentration threshold was set at 75 μg/m3. This aligns with the “Ambient Air Quality Standards” (GB3095-2012) [42], which defines a daily average PM2.5 concentration ≥ 75 μg/m3 as a pollution episode. When the daily average PM2.5 concentration fell below this threshold, it was assigned a value of zero. Thus, days with PM2.5 concentrations below this threshold were excluded from the analysis.
(ii) Performing convolutional processing
To obtain more realistic spatial extents for the identified PM2.5 pollution events at each time step, a spatial convolution was applied to smooth the data. This convolution process involved computing a spatial moving average with a horizontal convolution radius Rs over the original PM2.5 data. Specifically, the process calculates the mean PM2.5 concentration for all grid cells within the specified radius Rs:
where denotes the total number of grid cells within radius Rs; and represents the PM2.5 concentration at the grid cell with coordinates (x, y). Rs is set to 0.75° for this study, this value was chosen to effectively smooth the data and connect nearby pollution patches into coherent objects without excessively merging distinct features.
(iii) Identifying spatial objects
Following the convolution process described in step (ii), the original PM2.5 concentration data are smoothed to suppress noisy grid cells. Subsequently, grid cells with PM2.5 concentrations exceeding the threshold (i.e., ≥75 μg/m3) are identified, while those below the threshold are disregarded. The contiguous area formed by the identified grids is considered an object. Consequently, multiple objects can be identified simultaneously within a single time step. For each identified object, its centroid can be calculated based on its spatial configuration.
- (2)
- Establishing spatiotemporal linkages among the objects within the same event
During the identification of spatial objects at each time step, only the spatial extents of pollution objects are delineated. To establish spatiotemporal linkages of the objects across different time steps, the FiT algorithm employs a forward-in-time tracking mode. This mode permits a spatially contiguous pollution object to split into two or more discrete objects (i.e., fragmentation of a spatially continuous pollution entity) as well as the merging of multiple discrete objects into a single contiguous entity (i.e., amalgamation of spatially discontinuous entities). Critically, the algorithm operates strictly forward in time and does not incorporate backward tracking.
The FiT algorithm primarily assigns objects to the same pollution event by detecting spatial overlap between pollution objects at the current time step and the preceding time step. Figure 1 illustrates a schematic diagram of this assignment process. If an object at the current time step overlaps with an object from the previous time step, they are assigned to the same event. Similarly, if two distinct objects at the current time step both overlap with a single object from the previous time step, all three are assigned to the same event. It is important to note that the processes of splitting and merging are determined exclusively by the spatial overlap of objects between consecutive time steps. The PM2.5 concentration values of the constituent grid cells remain unchanged from the original dataset. To identify pollution events within a specific period, tracking begins at the first time step. Therefore, for any identified pollution event, the object at its initial time step exhibits no overlap with objects from the preceding time step, and the object at its final time step exhibits no overlap with objects from the subsequent time step.
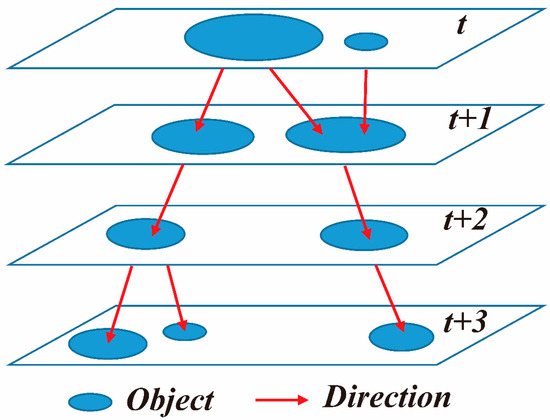
Figure 1.
Schematic diagram of PM2.5 pollution event identification based on the Forward-in-Time algorithm.
The duration of each PM2.5 pollution event is calculated as the difference (in time steps) between its final and initial occurrences. Given the daily temporal resolution of the PM2.5 data, the event duration in days is equivalent to the number of time steps it encompasses. For example, an event spanning a single time step has a duration of 1 day, and an event spanning two consecutive time steps has a duration of 2 days.
2.2. Pearson Correlation Coefficient
Pearson correlation coefficient (r) quantifies the relationship between two sets of interval variables. Its formula is expressed as:
A value of r = 0 indicates no linear correlation, while values approaching ±1 signify a strong correlation. The absolute value of r reflects the strength of the relationship. In this study, key characteristics of pollution events—such as frequency, mean concentration, and duration—are inherently interdependent. To quantitatively assess these complex interactions and elucidate their intrinsic relationships, we employed the Pearson correlation coefficient.
3. Study Area and Data
3.1. Study Area
This study investigates the continuous spatiotemporal evolution of PM2.5 pollution events across China. China spans nearly 50° in latitude from north to south and 62° in longitude from east to west, exhibiting complex and diverse geographical and climatic features. The terrain descends in a three-step staircase pattern from west to east, resulting in dramatic elevation changes (Figure 2). This vast area contains diverse landforms, including mountains, plateaus, hills, basins, plains, and deserts.
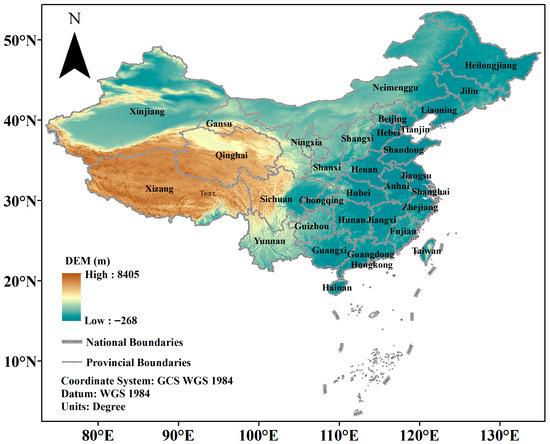
Figure 2.
The spatial distribution of China’s elevation and provinces.
Due to its vast geographical extent, China encompasses multiple climate zones: tropical monsoon, subtropical monsoon, temperate monsoon, temperate continental, and plateau climates. These diverse climate regimes result in pronounced spatiotemporal variations in precipitation and temperature. Annual precipitation decreases from the southeastern coast to the northwestern interior, with wet seasons receiving substantially more rainfall than dry seasons. Temperature disparities are equally significant, particularly in winter when northern regions experience severe cold compared to milder conditions in the south.
Regional economic development is highly uneven, shaped by heterogeneous natural resources and geographical constraints. The eastern coastal areas are characterized by advanced industrialization, in stark contrast to the less developed central and western regions, e.g., light manufacturing dominates southern China, while heavy industries prevail in the north. These differences directly impact PM2.5 emission patterns and pollution distribution.
In recent years, China has prioritized environmental governance by implementing stringent policies to improve air quality. According to the Ministry of Ecology and Environment, the average proportion of “good-air-quality days” in 339 cities increased in 2023, and the annual mean PM2.5 concentration declined compared to 2019. However, PM2.5 pollution remains a critical environmental challenge, especially in northern China during winter when coal heating and industrial emissions peak. These regional economic disparities further complicate pollution control efforts; for instance, economically advanced areas face high emissions from concentrated industries, while less developed regions struggle with inadequate pollution mitigation infrastructure.
3.2. Data
This study utilizes PM2.5 data obtained from the ChinaHighAirPollutants (CHAP) dataset, a high-resolution, high-quality near-surface air pollutant dataset for China, released by the National Earth System Science Data Center (https://www.geodata.cn/data/datadetails.html?dataguid=192965641360576&docid=131, accessed on 14 October 2024). The CHAP dataset is a seamless, long-term, full-coverage, high spatiotemporal resolution, and high-precision remote sensing dataset of ground-level PM2.5 concentrations over China [31]. It was generated by integrating multi-source satellite remote sensing data. It assimilates extensive datasets including ground-based observations, atmospheric reanalysis, emission inventories, and model simulations. For this study, we employed the CHAP dataset covering China for the period 2013–2021. The dataset features a spatial resolution of 1 km and a temporal resolution of daily, with units of μg/m3. To align with the standard stipulated in the Ambient Air Quality Standards (GB3095–2012) [42], a daily average PM2.5 concentration equal to or exceeding 75 μg/m3 is deemed as PM2.5 pollution.
4. Results and Discussion
4.1. Spatiotemporal Continuum Characteristics of PM2.5 Pollution Events
To investigate the spatiotemporal continuum characteristics of PM2.5 pollution events across China, we defined a PM2.5 pollution episode as any period with a 24-h average concentration ≥ 75 μg/m3. We then applied the FiT algorithm to track and identify these pollution events. Six indices (i.e., event PM2.5 totals per year, PM2.5 pollution events per year, average totals per event, average duration per event, average maximum concentration per event, average concentration per event) are selected to analyze the spatiotemporal continuum characteristics of PM2.5 pollution events.
As shown in Figure 3a, the highest event PM2.5 totals per year were predominantly found in provinces including Xinjiang, the BTH region (i.e., Beijing city, Tianjin city, and Hebei province), Shandong, and Henan. Moderate totals were observed in the northeastern provinces (Liaoning, Jilin, Heilongjiang), as well as in Hubei, Hunan, Guangxi, Anhui, Jiangsu, Shanxi, Shaanxi, and Sichuan, while the remaining provinces recorded relatively lower totals. This spatial pattern aligns with ground-based PM2.5 air quality monitoring data [43]. The event PM2.5 totals per year exhibited a distinct right-inclined “T”-shaped spatial distribution pattern. This distribution characteristic is closely linked to regional industrial composition and meteorological conditions [44,45,46]. Specifically, the monsoon corridor stretching from Xinjiang to East China provides dynamic conditions for PM2.5 dispersion, while regional industrial composition serves as a primary source of PM2.5 emissions.
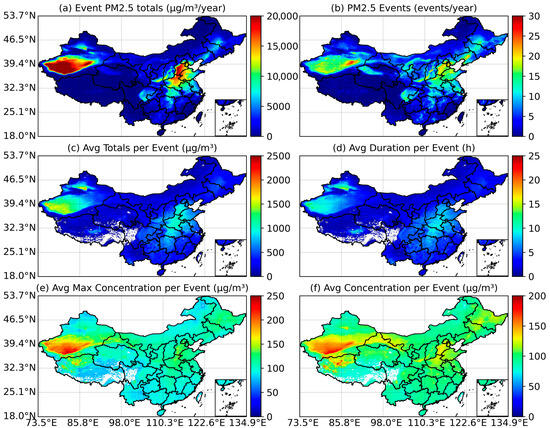
Figure 3.
The spatiotemporal continuum characteristics of PM2.5 pollution events across China: (a) event PM2.5 totals per year, (b) PM2.5 pollution events per year, (c) average totals per event, (d) average duration per event, (e) average maximum concentration per event, (f) average concentration per event.
Figure 3b reveals that the spatial distribution pattern of the PM2.5 pollution events per year closely resembles that of the event PM2.5 totals per year. That is, regions with higher event PM2.5 totals also experienced a greater number of PM2.5 pollution events. In southern Xinjiang, PM2.5 pollution events generally exceeded 15 events/year, with the peak values located in the eastern part of southern Xinjiang, where the frequency exceeded 20 events/year. Provinces like Shandong, BTH, and Henan also had a high number of PM2.5 pollution events, ranging between 10 and 30 events/year. Other provinces with relatively larger event PM2.5 totals, primarily Jiangsu, Anhui, and Hubei, had PM2.5 pollution event frequencies mainly between 7 and 20 events/year. The annual number of PM2.5 pollution events in other provinces was relatively low, generally less than 10 events/year.
As evident from the spatial characteristics of PM2.5 pollution events (Figure 3c–f), the spatial distribution patterns of average totals per event, average duration per event, average maximum concentration per event, and average concentration per event closely resembled those of the event PM2.5 totals per year (Figure 3a) and PM2.5 pollution events per year (Figure 3b). Therefore, the detailed spatial characteristics of these event-average indices are not reiterated here. It is noteworthy that the blank areas observed in parts of Tibet, Sichuan, and Qinghai resulted from the absence of qualifying pollution events in these regions; specifically, the daily mean PM2.5 concentrations consistently remained below the 75 μg/m3 threshold, resulting in zero identified pollution events. Consequently, the corresponding characteristic values for these areas could not be calculated.
It is noteworthy that although Xinjiang, the BTH region, Shandong, and Henan all exhibit high frequencies of pollution episodes, their underlying mechanisms may differ substantially. Elevated PM2.5 events in Xinjiang are largely associated with dust aerosols from the Taklamakan Desert and residential coal combustion for heating during winter. Their formation and persistence are strongly influenced by stagnant meteorological conditions and temperature inversions exacerbated by the basin’s topography. In contrast, pollution episodes in the BTH region and its vicinity primarily originate from intensive anthropogenic emissions related to population density, industrial activities, and transportation. Under unfavorable meteorological conditions—such as stagnant air, high humidity, and thermal inversions—these emissions facilitate rapid chemical transformation and accumulation of secondary particulate matter. Consequently, while these regions similarly display spatial hotspots of high PM2.5 concentrations, the dominant drivers and physicochemical processes involved necessitate distinct interpretation and management strategies.
Since the Air Pollution Prevention and Control Action Plan was issued in 2013, air quality across China has significantly improved. To investigate the changes in the characteristics of PM2.5 pollution events following the implementation of this plan, we conducted a comparative analysis of the event-based PM2.5 air pollution indices between 2013 and 2021. Overall, the fundamental characteristics of PM2.5 pollution events exhibited a general improvement trend nationwide (Figure 4). However, deterioration was still observed in certain regions compared to 2013. Event PM2.5 totals per year (Figure 4a) and average concentration per event (Figure 4f) in 2021 showed an overall decrease compared to 2013, except in parts of Inner Mongolia and Xinjiang. The most substantial reduction in Event PM2.5 totals per year occurred in regions that had the highest totals in 2013, namely the BTH region, Shandong, and Henan. Although Xinjiang also showed a decrease, the magnitude of reduction was relatively smaller than in the aforementioned provinces (Figure 4a). Average concentration per event generally decreased, with the spatial pattern of this reduction being relatively uniform, except for increases observed in parts of Inner Mongolia and Xinjiang (Figure 4f).
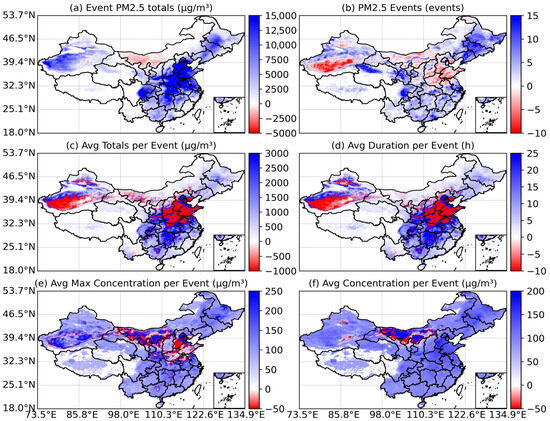
Figure 4.
Differences in the spatiotemporal continuum characteristics of PM2.5 pollution events between 2013 and 2021: (a) event PM2.5 totals per year, (b) PM2.5 pollution events per year, (c) average totals per event, (d) average duration per event, (e) average maximum concentration per event, (f) average concentration per event. Noted that areas with positive values indicate improvements in the corresponding indices, while negative values suggest the opposite.
It is important to note that the comparative analysis between 2013 and 2021 provides a snapshot of the net change over this period but does not capture the interannual variability. Furthermore, the year 2021 was still subject to the influence of the COVID-19 pandemic, which led to temporary reductions in anthropogenic emissions in certain regions and sectors. While this may have contributed to the observed improvements in some indices, the overall declining trend from 2013 to 2021 is consistent with the long-term effectiveness of China’s air pollution control policies.
The spatial patterns of change for the other four indices (i.e., PM2.5 pollution events per year, average totals per event, average duration per event, and average maximum concentration per event) between 2013 and 2021 were broadly similar (Figure 4b–e). The spatial patterns of change in the remaining four indices—annual pollution event frequency, average total per event, average duration, and average maximum concentration—from 2013 to 2021 were broadly consistent (Figure 4b–e). While most areas showed improvement, increases were observed in the PM2.5 pollution events per year, average totals per event, and average duration per event in some regions, including parts of Xinjiang, the BTH region, and Henan (Figure 4b–e).
4.2. Correlation Analysis of the Patiotemporal Continuum Characteristics of PM2.5 Pollution Events
In air quality management, the spatiotemporal continuum characteristics of PM2.5 pollution events (e.g., event PM2.5 totals, event duration, and maximum concentration) have garnered significant attention. Quantifying the relationships among these indices is therefore essential. This study used Pearson correlation analysis to quantify the relationships between key event characteristics, specifically between: event PM2.5 totals per year and average duration per event, event PM2.5 totals per year and average maximum concentration per event, event PM2.5 totals per year and average concentration per event, average maximum concentration per event and average concentration per event. To ensure the statistical robustness of the correlation analysis, we only considered regions where the total number of pollution events during 2013–2021 exceeded five.
As shown in Figure 5, regions with more severe PM2.5 pollution problems (e.g., Xinjiang, BTH, Shandong) exhibited strong correlations between event PM2.5 totals and event duration, with Pearson correlation coefficients approaching 1. Conversely, in regions with less severe pollution (e.g., Fujian, Guangdong, Zhejiang), the correlation between these two characteristics was weaker, with coefficients generally below 0.3. In areas with high event PM2.5 totals, pollution concentrations remained elevated throughout most of the event period, leading to a pronounced increase in total pollutant mass with longer durations (Figure 5a). The correlation between event PM2.5 totals and average maximum concentration per event exhibited a spatial distribution pattern similar to that between event PM2.5 totals and event duration. However, the Pearson correlation coefficients in heavily polluted areas were relatively lower, ranging between 0.7 and 1. This indicates that the correlation between event totals and maximum concentration was generally weaker than the correlation between event totals and duration (Figure 5b). The correlation between event PM2.5 totals and average concentration per event (Figure 5c) was weaker than the correlations between event totals and either duration or maximum concentration. The correlation coefficients for this pair were generally below 0.8, with higher values typically found in regions experiencing higher pollution concentrations and lower values in less polluted regions. Similarly, the correlation between average maximum concentration per event and average concentration per event (Figure 5d) also showed a pattern where coefficients were generally higher (between 0.7 and 1) in more polluted areas. It is worth noting that the Pearson correlation coefficients approaching 1 observed in severe pollution hotspots should be interpreted as evidence of a highly constrained and deterministic relationship in these regions, primarily resulting from a data structure with low internal variability around a strong linear trend.
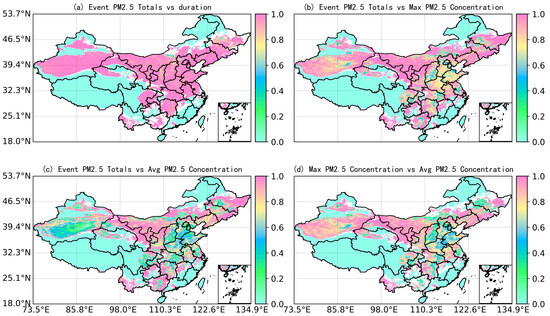
Figure 5.
Correlation analysis of the spatiotemporal continuum characteristics of PM2.5 pollution events from 2013 to 2021: (a) event PM2.5 totals per year and average duration per event, (b) event PM2.5 totals per year and average maximum concentration per event, (c) event PM2.5 totals per year and average concentration per event, (d) average maximum concentration per event and average concentration per event.
Comparative analysis of Figure 5a–c reveals that in regions with high event PM2.5 totals, both event duration and average maximum concentration per event were strongly correlated with event PM2.5 totals. However, in some high-total regions (e.g., parts of Xinjiang), the correlation coefficient between event PM2.5 totals and average concentration per event was considerably weaker (0.4 to 0.6). This weaker correlation indicates greater temporal variability in PM2.5 concentrations during events in these areas, which are often characterized by particularly high maximum concentrations.
4.3. Characteristics of PM2.5 Pollution Events with Different Durations
Event duration is a key factor for understanding regional PM2.5 pollution dynamics and formulating effective control strategies. To analyze the spatial variation patterns of PM2.5 pollution events across different regions, this study calculated the proportion of pollution events falling into various duration categories relative to the total number of events affecting each 1 km × 1 km grid cell (Figure 6). It is important to note that within a single grid cell, a specific PM2.5 pollution event is counted only once. However, the same pollution event is calculated separately in each grid cell.
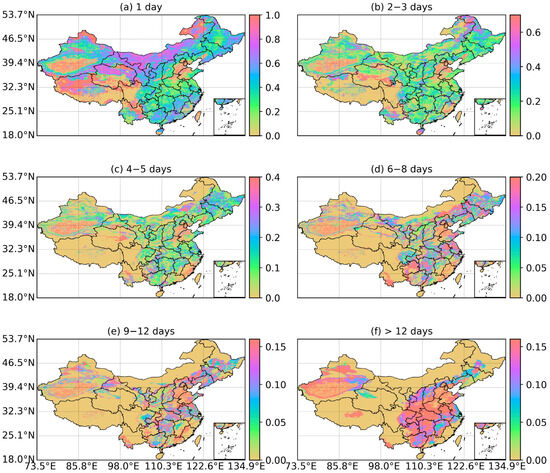
Figure 6.
Proportion of PM2.5 pollution events with different durations across China (2013–2021).
Overall, PM2.5 pollution events across China were predominantly short-duration events, specifically those lasting 1 day or 2–3 days. In regions with less severe PM2.5 pollution (e.g., Inner Mongolia, Gansu, Qinghai, Guangdong, Jiangxi, Fujian, Zhejiang), the proportion of 1-day duration events was generally greater than 0.6 (Figure 6a), significantly higher than in regions with more severe pollution (e.g., BTH, Shandong, Shanxi). The proportion of events lasting 2–3 days was generally above 0.2 (excluding provinces like Tibet and Sichuan with virtually no qualifying events), and its spatial distribution was relatively uniform (Figure 6b). This proportion remained fairly consistent between areas of higher and lower pollution severity, exhibiting significantly less spatial variation than the proportion of 1-day events. In less polluted regions, the combined proportion of 1-day and 2–3 day events typically exceeded 0.9. Conversely, in some heavily polluted areas (e.g., BTH), the combined proportion of events lasting less than 3 days was below 0.1.
Regions experiencing more severe PM2.5 pollution generally exhibited higher proportions of long-duration events. As shown in Figure 6c–f, the spatial extent affected by long-duration PM2.5 events progressively decreased as the event duration increased. Long-duration events were primarily concentrated in regions with more prominent pollution problems. Events with durations of 4–5 days and 6–8 days were still distributed across various provinces, but their proportions were generally less than 0.3 and 0.2, respectively. In regions with relatively higher PM2.5 pollution levels (e.g., BTH, Shandong, Shanxi, and over ten other provinces), the proportions of events lasting 9–12 days and >12 days ranged approximately between 0.05–0.15 and 0.10–0.15, respectively. Notably, the geographical area experiencing events lasting longer than 12 days was relatively limited.
4.4. Spatial Variation Patterns in Transport Pathways of PM2.5 Pollution Events
The transport pathways of PM2.5 pollution are critical for controlling regional atmospheric compound pollution. This study analyzed the movement and spatial variation patterns of PM2.5 pollution events with different durations across China, taking the transport pathways observed in 2021 as an illustrative example. Overall, the duration of PM2.5 pollution events in China is intrinsically linked to their spatial coverage, terrain barrier effects, and meteorological conditions.
The duration of PM2.5 pollution events significantly affects their spatial transport range. Events with shorter durations (2–3 days) were predominantly concentrated in Northwest to North China (Figure 7a), exhibiting local-scale spatial coverage. These events typically result from rapid accumulation of regional high-emission sources (e.g., coal heating, industrial emissions) under weak wind conditions [47]. Enclosed terrain in northwestern regions (e.g., Xinjiang) further exacerbates pollution stagnation, increasing the frequency of short-duration events. Events lasting 4–5 days and 6–8 days showed progressively eastward-extending trajectories (Figure 7b,c). These were frequently associated with persistent stagnant weather, where reduced boundary layer height and temperature inversions limited vertical dispersion, while horizontal transport was governed by weak westerly disturbances. Longer-duration events demonstrated trans-regional transport characteristics, with trajectories reaching East and Southeast China. Such events are often coupled with large-scale weather systems (e.g., the Siberian High in winter or subtropical high margins in summer), facilitating long-range transport via the westerly jet stream or monsoon circulation.
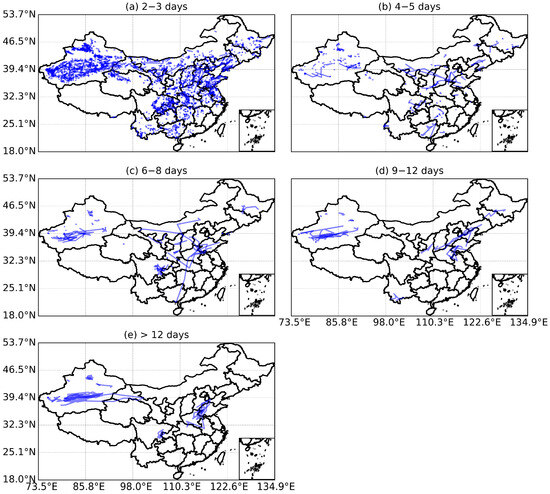
Figure 7.
Spatial variation patterns in transport pathways of PM2.5 pollution events in 2021.
As shown in Figure 7, all PM2.5 pollution events exhibited a consistent west-to-east transport trend, aligning with China’s prevailing winter westerlies and cold air outbreak paths. Short-duration events in inland Northwest China (e.g., Xinjiang, Gansu) showed slower propagation (<5° E/day meridional displacement), while long-duration events accelerated significantly along the eastern coast (>8° E/day), likely due to periodic intensification of the East Asian trough and jet stream acceleration. Additionally, the high trajectory density observed east of 110.3° E indicates that the superposition of intensive anthropogenic emissions in the eastern economic corridor with regionally transported pollutants likely amplifies secondary aerosol formation [42].
High-frequency PM2.5 pollution corridors clustered in mid-to-high latitudes (32.3° N–53.7° N), where winter heating-driven coal consumption surged and stable meteorological conditions amplified PM2.5 concentrations. Conversely, sparse trajectories in low latitudes (18.0° N–25.1° N) resulted from efficient wet deposition and horizontal dispersion under frequent South China Sea monsoon and tropical cyclones, enhanced by marine air mass cleansing [48].
It is noteworthy that the primary objective of this was to identify and characterize the role of PM2.5 pollution event migration across China, rather than to diagnose the underlying physical and chemical drivers in detail. The “movement” or continuity of events, as tracked by the FiT algorithm, represents the systematic progression of high-concentration areas in a three-dimensional space-time continuum. We acknowledge that the specific mechanisms driving these pathways—such as the complex interplay between long-range transport of pollutants versus local emission accumulation, the role of topographic forcing, and the breakdown of wintertime inversions by specific meteorological events—are undoubtedly critical and vary significantly across regions. A rigorous, mechanistic attribution of these pathways requires a dedicated investigation that integrates detailed emission inventories, high-resolution meteorological modeling, and chemical transport analysis, which falls beyond the scope of this methodological and macro-scale characterization study. Therefore, the pathways presented herein should be interpreted as the emergent, large-scale spatiotemporal signatures of PM2.5 pollution events.
5. Conclusions
PM2.5 pollution events pose severe health and environmental risks across China, yet their continuous evolution in three-dimensional space (longitude–latitude–time) is often overlooked, and the intrinsic linkages among key event characteristics (e.g., duration, maximum concentration, event PM2.5 totals) remain poorly understood. Traditional methods based on ground stations or low-resolution data fail to capture dynamic behaviors such as event splitting, merging, and migration, thereby limiting the development of refined air pollution control strategies. By integrating the meteorological event tracking algorithm (i.e., the FiT algorithm) with the CHAP dataset (1-day temporal resolution, 1 km spatial resolution), this study developed a novel three-dimensional spatiotemporal framework for identifying contiguous PM2.5 pollution events. This framework enabled a systematic characterization of the spatiotemporal evolution of PM2.5 events across China (2013–2021), a quantification of correlations among key event indices, and the tracking of transport pathways. The principal findings are as follows:
- (1)
- An innovative framework applying the FiT algorithm to track PM2.5 pollution events is proposed. Results demonstrate that combining the FiT algorithm with the CHAP dataset effectively captures the three-dimensional (space-time) continuum characteristics of PM2.5 events in China.
- (2)
- The annual event PM2.5 totals and pollution event frequency both exhibit a distinct right-skewed “T”-shaped spatial pattern. Hotspots concentrate in Xinjiang, the BTH region, Shandong, and Henan, where the annual event frequency exceeds 15. Provinces such as Jiangsu, Anhui, and Hubei report 7–20 events/year, whereas most others reported fewer than 10 events/year.
- (3)
- Strong positive correlations exist between event PM2.5 totals and both event duration and maximum concentration, particularly in heavily polluted areas where Pearson’s values approach 1. This indicates that in these regions, longer-duration events accumulate greater pollutant mass and maintain higher peak concentrations.
- (4)
- Event duration exhibited significant regional heterogeneity. Short-duration events (1 day or 2–3 days) dominate (>80% of all events), while long-duration events cluster in heavily polluted areas. In less polluted regions, 1-day events account for >60% of occurrences, contrasting with lower proportions in severely polluted areas. The proportion of 2–3-day events is spatially uniform (>20%). In pollution hotspots (e.g., BTH), events lasting 9–12 days and >12 days constitute 5–15% and 10–15% of occurrences, respectively.
- (5)
- Short-duration events (2–3 days) were typically confined to local areas in Northwest–North China. Medium-duration events (4–8 days) extended further eastward, and long-duration events demonstrated trans-regional transport, reaching the southeastern coast. All events generally show a consistent west-to-east transport trend. Short-duration events propagate more slowly across inland Northwest China (<5° E/day), whereas long-duration events accelerate significantly along the eastern coast (>8° E/day).
It is noteworthy that the field lacks a universal standard for defining PM2.5 pollution events. Variations in key parameters—such as the concentration threshold, spatial criteria, and tracking algorithms—can significantly influence the identified characteristics of events (e.g., frequency, duration, and transport pathways). The findings of this study are based on a specific framework employing a 75 μg/m3 threshold and the FiT algorithm, ensuring internal consistency and policy-relevance within China. Consequently, direct comparisons with studies using different criteria require caution. Future work should systematically evaluate the sensitivity of event characteristics to these definitional parameters to foster more harmonized understanding and robust comparisons across studies.
Author Contributions
Z.Z. (Zhihua Zhu): Conceptualization, Methodology, Software, Data curation, Visualization, Project administration. R.L.: Writing—original draft, Data curation. Y.C.: Resources, Data curation. Z.Z. (Zhenlin Zhang): Writing—review & editing, Data curation. Y.G.: Writing—review & editing, Resources. B.X.: Conceptualization, Writing—review & editing, Funding acquisition. Y.Z.: Conceptualization, Resources, Funding acquisition. All authors have read and agreed to the published version of the manuscript.
Funding
This research was funded by the Natural Science Foundation of Guangdong Province [2024A1515012440], National Natural Science Foundation of China [52009021, 52209025], Scientific Research Starting Foundation of Huizhou University for PhD and Prof. [2023JB006], Huizhou Philosophy and Social Sciences Planning Project [HZSK2024GJ067], and Huizhou Science and Technology Project [2022CQ010026]. And The APC was funded by [2022CQ010026].
Institutional Review Board Statement
Not applicable.
Informed Consent Statement
Not applicable.
Data Availability Statement
Publicly available datasets were analyzed in this study. This data can be found here: https://www.geodata.cn/data/datadetails.html?dataguid=192965641360576&docid=131 (accessed on 14 October 2024). Support from "National Earth System Science Data Center, National Science & Technology Infrastructure of China (http://www.geodata.cn (accessed on 12 October 2025)).
Acknowledgments
We express our sincere appreciation to the three anonymous reviewers for their constructive comments.
Conflicts of Interest
The authors declare that they have no known competing financial interests or personal relationships that could have appeared to influence the work reported in this paper.
References
- Chen, T.-L.; Hsieh, W.-J.; Lai, H.-C.; Lin, N.-H.; Tsay, S.-C.; Chou, C.C.K.; Hsiao, T.-C. Seasonal Variations in Aerosol Characteristics from Local Pollution and Long-Range Transport at the Northern Tip of Taiwan. Sustain. Environ. Res. 2025, 35, 12. [Google Scholar] [CrossRef]
- Dong, Z.; Li, X.; Dong, Z.; Su, F.; Wang, S.; Shang, L.; Kong, Z.; Wang, S. Long-Term Evolution of Carbonaceous Aerosols in PM2.5 during over a Decade of Atmospheric Pollution Outbreaks and Control in Polluted Central China. Sci. Total Environ. 2024, 935, 173089. [Google Scholar] [CrossRef]
- Chen, S.; Liu, D.; Huang, L.; Guo, C.; Gao, X.; Xu, Z.; Yang, Z.; Chen, Y.; Li, M.; Yang, J. Global Associations between Long-Term Exposure to PM2.5 Constituents and Health: A Systematic Review and Meta-Analysis of Cohort Studies. J. Hazard. Mater. 2024, 474, 134715. [Google Scholar] [CrossRef]
- Anbari, K.; Sicard, P.; Khaniabadi, Y.O.; Naqvi, H.R.; Fard, R.F.; Rashidi, R. PM2.5 and PM10-Related Carcinogenic and Non-Carcinogenic Risk Assessment in Iran. J. Atmos. Chem. 2024, 81, 10. [Google Scholar] [CrossRef]
- Jiang, X.; Li, G.; Fu, W. Government Environmental Governance, Structural Adjustment and Air Quality: A Quasi-Natural Experiment Based on the Three-Year Action Plan to Win the Blue Sky Defense War. J. Environ. Manag. 2021, 277, 111470. [Google Scholar] [CrossRef] [PubMed]
- Lukman, K.M.; Hastuti, L.P.; Oktavia, D.; Pratiwi, D.; Uchiyama, Y.; Harding, D. Towards Blue Skies: A Comprehensive Review and Regional Mapping of Ambient Air Quality in Indonesian Cities. J. Environ. Manag. 2025, 389, 126132. [Google Scholar] [CrossRef] [PubMed]
- Wang, Y.; Wang, X.; Liu, Z.; Chao, S.; Zhang, J.; Zheng, Y.; Zhang, Y.; Xue, W.; Wang, J.; Lei, Y. Assessing the Effectiveness of PM2.5 Pollution Control from the Perspective of Interprovincial Transport and PM2.5 Mitigation Costs across China. Environ. Sci. Ecotechnology 2024, 22, 100448. [Google Scholar] [CrossRef] [PubMed]
- Li, J.; Fan, W.; Wu, J.; Han, Z.; Li, J.; Zhang, C.; Liang, L. Impacts of Open Biomass Burning in Southeast Asia on Atmospheric PM2.5 Concentrations over South China from 2009 to 2018. Atmos. Environ. 2024, 327, 120491. [Google Scholar] [CrossRef]
- Hung, W.-T.; Lu, C.-H.; Shrestha, B.; Lin, H.-C.; Lin, C.-A.; Grogan, D.; Hong, J.; Ahmadov, R.; James, E.; Joseph, E. The Impacts of Transported Wildfire Smoke Aerosols on Surface Air Quality in New York State: A Case Study in Summer 2018. Atmos. Environ. 2020, 227, 117415. [Google Scholar] [CrossRef]
- Miller, D.J.; Sun, K.; Zondlo, M.A.; Kanter, D.; Dubovik, O.; Welton, E.J.; Winker, D.M.; Ginoux, P. Assessing Boreal Forest Fire Smoke Aerosol Impacts on U.S. Air Quality: A Case Study Using Multiple Data Sets: Biomass Burning Air Quality Impacts. J. Geophys. Res. 2011, 116, D22209. [Google Scholar] [CrossRef]
- Ali-Taleshi, M.S.; Bakhtiari, A.R.; Liu, N.; Hopke, P.K. Characterization and Transport Pathways of High PM2.5 Pollution Episodes During 2015–2021 in Tehran, Iran. Aerosol Air Qual. Res. 2025, 25, 18. [Google Scholar] [CrossRef]
- Fuzzi, S.; Baltensperger, U.; Carslaw, K.; Decesari, S.; Denier Van Der Gon, H.; Facchini, M.C.; Fowler, D.; Koren, I.; Langford, B.; Lohmann, U.; et al. Particulate Matter, Air Quality and Climate: Lessons Learned and Future Needs. Atmos. Chem. Phys. 2015, 15, 8217–8299. [Google Scholar] [CrossRef]
- Feng, T.; Shi, Y.; Wang, X.; Wan, X.; Mi, Z. Synergies of Air Pollution Control Policies: A Review. J. Environ. Manag. 2025, 377, 124655. [Google Scholar] [CrossRef]
- Li, L.; He, M.; Liang, X.; Deng, H.; Yang, R. How Does the Impact of a Two-Stage Air Pollution Control Policy on Air Quality Different? Evidence from 258 Cities in China. Atmos. Pollut. Res. 2024, 15, 102148. [Google Scholar] [CrossRef]
- Zhao, H.; Chen, K.; Liu, Z.; Zhang, Y.; Shao, T.; Zhang, H. Coordinated Control of PM2.5 and O3 Is Urgently Needed in China after Implementation of the “Air Pollution Prevention and Control Action Plan”. Chemosphere 2021, 270, 129441. [Google Scholar] [CrossRef]
- Apte, J.S.; Manchanda, C. High-Resolution Urban Air Pollution Mapping. Science 2024, 385, 380–385. [Google Scholar] [CrossRef] [PubMed]
- Di, Q.; Kloog, I.; Koutrakis, P.; Lyapustin, A.; Wang, Y.; Schwartz, J. Assessing PM2.5 Exposures with High Spatiotemporal Resolution across the Continental United States. Environ. Sci. Technol. 2016, 50, 4712–4721. [Google Scholar] [CrossRef]
- Chen, P.-C.; Lin, Y.-T. Exposure Assessment of PM2.5 Using Smart Spatial Interpolation on Regulatory Air Quality Stations with Clustering of Densely-Deployed Microsensors. Environ. Pollut. 2022, 292, 118401. [Google Scholar] [CrossRef]
- Wang, M.; Young, M.; Marshall, J.D.; Piepmeier, L.; Bi, J.; Kaufman, J.D.; Szpiro, A.A. National PM2.5 Spatiotemporal Model Integrating Intensive Monitoring Data and Land Use Regression in a Likelihood-Based Universal Kriging Framework in the United States: 2000–2019. Environ. Pollut. 2025, 366, 125405. [Google Scholar] [CrossRef] [PubMed]
- Ma, J.; Ding, Y.; Cheng, J.C.P.; Jiang, F.; Wan, Z. A Temporal-Spatial Interpolation and Extrapolation Method Based on Geographic Long Short-Term Memory Neural Network for PM2.5. J. Clean. Prod. 2019, 237, 117729. [Google Scholar] [CrossRef]
- Meng, C.; Xie, S.; Liu, L.; Wei, P.; Tang, Y.; Zhang, Y. Regional PM2.5 Concentration Prediction Analysis and Spatio-Temporal Mapping Incorporating ZWD Data. Atmos. Pollut. Res. 2024, 15, 102028. [Google Scholar] [CrossRef]
- Wang, X. Research on the Impact of Land Use and Meteorological Factors on the Spatial Distribution Characteristics of PM2.5 Concentration. Atmos. Pollut. Res. 2025, 16, 102462. [Google Scholar] [CrossRef]
- Li, T.; Wang, Y.; Wu, J. Deriving PM2.5 from Satellite Observations with Spatiotemporally Weighted Tree-Based Algorithms: Enhancing Modeling Accuracy and Interpretability. npj Clim. Atmos. Sci. 2024, 7, 138. [Google Scholar] [CrossRef]
- Yan, X.; Zang, Z.; Luo, N.; Jiang, Y.; Li, Z. New Interpretable Deep Learning Model to Monitor Real-Time PM2.5 Concentrations from Satellite Data. Environ. Int. 2020, 144, 106060. [Google Scholar] [CrossRef]
- Kong, Z.; Fei, R.; Cheng, Y.; Wang, X.; Xu, N.; Wang, Z.; Zheng, K.; Zhao, C.; Liu, D.; Hua, D.; et al. Imaging-Based Lidar for Atmospheric Remote Sensing: A Review. Opt. Laser Technol. 2025, 191, 113354. [Google Scholar] [CrossRef]
- Gianquintieri, L.; Oxoli, D.; Caiani, E.G.; Brovelli, M.A. Implementation of a GEOAI Model to Assess the Impact of Agricultural Land on the Spatial Distribution of PM2.5 Concentration. Chemosphere 2024, 352, 141438. [Google Scholar] [CrossRef]
- Kryza, M.; Werner, M.; Holland, M.; ApSimon, H. Quantifying the Health Impact of PM2.5 with Various Chemical Transport Models and for Different Years—A Case Study for Poland. Environ. Int. 2024, 194, 109179. [Google Scholar] [CrossRef]
- Ye, X.; Yang, J.; Chen, Z.; Liu, G.; Sun, J.; Jiang, Q.; Huang, X.; Gao, Y.; Niu, X.; Xu, H.; et al. Triangulating Residential Biomass Burning Impacts on PM2.5 via PMF, Satellite Observation-Based Emission Inventory, and WRF-Chem. Environ. Int. 2025, 201, 109580. [Google Scholar] [CrossRef]
- Zhao, H.; Su, Y.; Qian, C.; Huang, H. Forecasting PM2.5 Concentrations with Spatial-Temporal Hypergraph Attention Network: Modeling Geospatial Correlations and Latent Associations among Stations. Expert Syst. Appl. 2025, 288, 128298. [Google Scholar] [CrossRef]
- Semlali, B.-E.B.; Amrani, C.E.; Ortiz, G.; Boubeta-Puig, J.; Garcia-de-Prado, A. SAT-CEP-Monitor: An Air Quality Monitoring Software Architecture Combining Complex Event Processing with Satellite Remote Sensing. Comput. Electr. Eng. 2021, 93, 107257. [Google Scholar] [CrossRef]
- Xu, X.; You, Q.; Zhang, Z.; Zhao, Z.; Wang, Z.; Zhang, B.; Bo, X. Insights into Civil Aviation Emissions in China: Analysis of an Emission Inventory of Air Pollutants and the ChinaHighAirPollutants (CHAP) Dataset. Atmos. Environ. X 2024, 22, 100270. [Google Scholar] [CrossRef]
- Liu, S.; Chai, Z.; Dong, S.; Wu, H.; Deng, R.; Ma, P. Spatiotemporal Analysis and Source Attribution of Severe PM2.5 Pollution Episodes in Beijing during October–November 2023. Atmos. Environ. 2025, 343, 121007. [Google Scholar] [CrossRef]
- Li, T.; Huang, X.; Zhang, Q.; Wang, X.; Wang, X.; Zhu, A.; Wei, Z.; Wang, X.; Wang, H.; Chen, J.; et al. Machine Learning-Guided Integration of Fixed and Mobile Sensors for High Resolution Urban PM2.5 Mapping. npj Clim. Atmos. Sci. 2025, 8, 95. [Google Scholar] [CrossRef]
- Muthukumar, P.; Cocom, E.; Nagrecha, K.; Comer, D.; Burga, I.; Taub, J.; Calvert, C.F.; Holm, J.; Pourhomayoun, M. Predicting PM2.5 Atmospheric Air Pollution Using Deep Learning with Meteorological Data and Ground-Based Observations and Remote-Sensing Satellite Big Data. Air Qual. Atmos. Health 2022, 15, 1221–1234. [Google Scholar] [CrossRef]
- Li, H.; Yang, T.; Du, Y.; Tan, Y.; Wang, Z. Interpreting Hourly Mass Concentrations of PM2.5 Chemical Components with an Optimal Deep-Learning Model. J. Environ. Sci. 2025, 151, 125–139. [Google Scholar] [CrossRef]
- Essa, K.S.M.; El-Otaify, M.S. Mathematical Model for Atmospheric Dispersion Equation (a Review). Ecol. Chem. Eng. 2021, 19, 297–314. [Google Scholar]
- Snoun, H.; Krichen, M.; Chérif, H. A Comprehensive Review of Gaussian Atmospheric Dispersion Models: Current Usage and Future Perspectives. Euro-Mediterr. J. Environ. Integr. 2023, 8, 219–242. [Google Scholar] [CrossRef]
- Hart, R.; Liang, L.; Dong, P. Monitoring, Mapping, and Modeling Spatial–Temporal Patterns of PM2.5 for Improved Understanding of Air Pollution Dynamics Using Portable Sensing Technologies. Int. J. Environ. Res. Public Health 2020, 17, 4914. [Google Scholar] [CrossRef] [PubMed]
- Skok, G.; Bacmeister, J.; Tribbia, J. Analysis of Tropical Cyclone Precipitation Using an Object-Based Algorithm. J. Clim. 2013, 26, 2563–2579. [Google Scholar] [CrossRef]
- Skok, G.; Tribbia, J.; Rakovec, J.; Brown, B. Object-Based Analysis of Satellite-Derived Precipitation Systems over the Low- and Midlatitude Pacific Ocean. Mon. Weather Rev. 2009, 137, 3196–3218. [Google Scholar] [CrossRef]
- Davis, C.; Brown, B.; Bullock, R. Object-Based Verification of Precipitation Forecasts. Part I: Methodology and Application to Mesoscale Rain Areas. Mon. Weather Rev. 2006, 134, 1772–1784. [Google Scholar] [CrossRef]
- Ministry of Environmental Protection. Ambient Air Quality Standards (GB 3095-2012). 2012. Available online: https://www.mee.gov.cn/ywgz/fgbz/bz/bzwb/dqhjbh/dqhjzlbz/201203/W020250407403788086276.pdf (accessed on 11 October 2025).
- Guo, H.; Cheng, T.; Gu, X.; Wang, Y.; Chen, H.; Bao, F.; Shi, S.; Xu, B.; Wang, W.; Zuo, X.; et al. Assessment of PM2.5 Concentrations and Exposure throughout China Using Ground Observations. Sci. Total Environ. 2017, 601–602, 1024–1030. [Google Scholar] [CrossRef] [PubMed]
- Lin, Z.; Ji, Y.; Lin, Y.; Yang, Y.; Gao, Y.; Wang, M.; Xiao, Y.; Zhao, J.; Feng, Y.; Yang, W.; et al. PM10 and PM2.5 Chemical Source Profiles of Road Dust over China: Composition, Spatio-Temporal Distribution, and Source Apportionment. Urban Clim. 2023, 51, 101672. [Google Scholar] [CrossRef]
- Wang, C.-Y.; Xiao, S.; Cai, R.-T.; Du, W.-T.; Mi, N.; Liu, S.-X.; Liu, J.-B. Characterization and Sources of Winter PM2.5 Organic and Elemental Carbon in the High-Altitude Region of Qinling Mountains. Environ. Earth Sci. 2025, 84, 273. [Google Scholar] [CrossRef]
- Xu, Z.; Peng, Z.; Zhang, N.; Liu, H.; Lei, L.; Kou, X. Impact of Meteorological Conditions and Reductions in Anthropogenic Emissions on PM2.5 Concentrations in China from 2016 to 2020. Atmos. Environ. 2024, 318, 120265. [Google Scholar] [CrossRef]
- Zeng, Y.; Sui, X.; Ma, C.; Liao, R.; Yang, J.; Wang, D.; Zhang, P. Industrial Heat Source-Related PM2.5 Concentration Estimates and Analysis Using New Three-Stage Model in the Beijing–Tianjin–Hebei Region. Atmosphere 2024, 15, 131. [Google Scholar] [CrossRef]
- Huang, P.; Xu, J.; Liang, M. Decadal Variation in the Frequency of Tropical Cyclones Originating in the South China Sea and Migrating from the Western North Pacific. Front. Earth Sci. 2022, 10, 980220. [Google Scholar] [CrossRef]
Disclaimer/Publisher’s Note: The statements, opinions and data contained in all publications are solely those of the individual author(s) and contributor(s) and not of MDPI and/or the editor(s). MDPI and/or the editor(s) disclaim responsibility for any injury to people or property resulting from any ideas, methods, instructions or products referred to in the content. |
© 2025 by the authors. Licensee MDPI, Basel, Switzerland. This article is an open access article distributed under the terms and conditions of the Creative Commons Attribution (CC BY) license (https://creativecommons.org/licenses/by/4.0/).