Abstract
In order to effectively control the spread of the 2019 novel coronavirus (COVID-19), China has undertaken relatively strict blockade measures, which can effectively reduce population mobility and eliminate transmission pathways at the source. Therefore, it is of great significance to understand the impact of urban blockades on the air quality before, during, and after COVID-19. This study uses data collected from monitoring stations in Xi’an, a typical city in northwestern China, from 2018 to 2023 to conduct an in-depth analysis of the changes in concentration of various pollutants in the atmosphere from a spatiotemporal perspective. The results showed that the average concentrations of particulate matter with aerodynamic diameters less than 2.5 µm (PM2.5), particulate matter with aerodynamic diameters less than 10 µm (PM10), sulfur dioxide (SO2), nitrogen dioxide (NO2), ozone (O3), and carbon monoxide (CO) decreased during the epidemic lockdown (2020–2022) by 18.7%, 15.4%, 29.4%, 20.9%, 0.03%, and 28.1%, respectively. After the implementation of urban lockdown (2023), the annual average concentrations of the five major pollutants other than O3 decreased, while the concentration of O3 increased. The monthly changes in concentration of PM2.5, PM10, CO, SO2, and NO2 were similar during 2018–2023, being “higher in winter and lower in summer”. The monthly average concentration of O3 changed in a “unimodal” manner. The concentrations of SO2, NO2, and PM10 decreased the most in January, by 46.4%, 33.5%, and 26.4%, respectively. The concentration of CO decreased the most in April, by 37.3%. PM2.5 decreased the most in May, with a decrease of 26.7%. O3 showed the largest increase in November, by 28.6%. After taking relevant measures, the concentrations of various pollutants and their correlations decreased. However, after resuming work, the concentrations of pollutants were still relatively high, and long-term management of air quality in Xi’an is still needed. These results provide a scientific basis for formulating more precise and effective air pollution control strategies.
1. Introduction
Air quality is one of the key parameters for directly evaluating the urban living environment [1]. However, in recent years, with the acceleration of urbanization and industrialization, air pollution has become increasingly severe, attracting widespread attention from all sectors of society, especially regarding the impact of air pollution on residents’ quality of life and physical health [2,3]. Numerous studies have shown [4,5,6] that different types of pollutants in the air can have varying degrees of impact on the physical and mental health of individuals, such as respiratory diseases [4], cardiovascular diseases [5], lung cancer [6], and even death [7,8,9]. Other studies suggest that there may be correlations between different pollutants [10,11]. Therefore, it is of great significance to effectively control air pollution, ensure residents’ health, and promote sustainable urban development.
At present, scholars and research institutions from various countries have conducted a large amount of research on air pollution [12,13,14,15,16], focusing on the composition of pollutants [12], regional control of particulate matters [13], dispersion patterns of pollutants [14], and the correlation between pollutants and meteorological factors [15,16]. Although some achievements have been made, research on inland cities in northwestern China remains scarce. In addition, various functional zones are formed by different landforms and climate characteristics [17]; therefore, air pollution characteristics will also differ between regions. The existing conclusions cannot be generalized or directly applied, and need to be dynamically adjusted according to local economic development and urban pattern changes [18].
A new type of coronavirus pneumonia (COVID-19) spread rapidly in China and the rest of the world in December 2019 [19], and had an unprecedented impact on human health and the economies of all countries. In response to the epidemic, strict prevention and control measures were implemented in various regions of China, such as lockdowns, restrictions on personal movement, and suspension of industrial production [20]. These measures have had a significant impact on the air quality of cities while also controlling the spread of the epidemic. At the same time, the emissions of major pollution sources such as industrial and transportation sources were significantly reduced [21]. Compared with normal periods, the human activity patterns in cities underwent fundamental changes during the epidemic period [21]. Therefore, domestic and foreign institutions and individual experts have conducted extensive research on the changes in air quality under different pollution source emission intensities and the interrelationships between pollutants [22,23,24]. Statistical analysis methods have been used to investigate the impact of meteorological and human factors on environmental air quality during epidemic control, and detailed analysis has been conducted using air quality models [25], machine learning models [26], and other methods. These studies have discovered the distribution characteristics of pollutants during the epidemic shutdown period.
During the prevention and control of COVID-19, human activities were significantly reduced, leading to a significant reduction in industrial production, construction, and other activities, which further led to a reduction in emissions. For example, research abroad mainly focuses on the short-term impact of lockdown measures on air quality during the pandemic [27,28]. The population-weighted exposure and total-time comprehensive exposure levels have been studied in Hamburg, Germany; Liege, Belgium; and Marseille, France. The results showed that the lockdown measures significantly reduced the concentrations of NO2 and PM2.5, while increasing the concentration of O3 [29]. The air quality in Portugal improved after the restrictions were implemented during the COVID-19 pandemic in all study periods and regions except industrial sites. This verified that the measures taken during the epidemic had a practical impact on air quality [30]. Other studies have investigated the impact of the lockdown on PM2.5 concentrations and aerosol optical depth values in Colombia [31]; the relationship between air pollution and mortality of COVID-19 in the United States and Europe [32,33,34,35]; the effects of COVID-19 lockdown on urban air quality in Monterrey, Mexico [36]; and risk factors for Middle East respiratory syndrome coronavirus [37]. Correlation between NO2 and COVID-19 mortality was assessed by satellite data and machine learning [38], and remote sensing was used to investigate the COVID-19 pandemic [39,40]. National researchers in China have conducted more comprehensive and in-depth research on the changes in air quality during the epidemic [41,42]. By analyzing the distribution of air pollution during the lockdown in Xi’an, it was found that the concentration of O3 increased by 100.6%, while the concentrations of PM2.5 and PM10 decreased by 22.4% and 20.7%, respectively. During the recovery period, the concentration of PM10 increased by 12.8% [43]. By studying six types of air pollutants in Nanjing, China, during the epidemic lockdown period compared with the pre- and during-lockdown phases, PM10, PM2.5, and NO2 showed decreasing trends while SO2, CO, and O3 concentrations increased [44]. Therefore, it can be seen that the epidemic lockdown period has relatively good air quality, effectively reducing the production of greenhouse gasses such as CO2 [41]. However, with the lifting of lockdowns in some areas of China and the resumption of work and production by enterprises, there has been a large-scale flow of people and goods, and the emission of air pollutants has gradually increased [45].
However, existing research has only focused on typical cities; there is a lack of research on Xi’an. Xi’an is also located in the Guanzhong Plain, with relatively enclosed terrain and complex climate conditions. The diffusion and transformation patterns of pollutants may differ from other cities [46], but there is currently limited targeted research in this area. In addition, the changes in air quality and correlations between various pollutants during the resumption of work and production after the epidemic with the recovery of human activities and changes in pollution source emissions has not been fully studied and explored.
Based on the above practical problems, the air quality and correlation between various pollutants before, during, and after the lockdown in Xi’an have been compared and analyzed. This provides a scientific basis for formulating more accurate and effective air pollution control strategies and is of practical value.
2. Methods
2.1. Data Sources
Xi’an is located in the Guanzhong Basin in the middle of the Yellow River Basin in the hinterland of the Chinese Mainland, between 107° 40′–109° 49′ E and 33° 39′–34° 45′ N, as shown in Figure 1. In 2020, the permanent population of Xi’an was 12.95 million. Xi’an is the starting point of the ancient Silk Road and an important node city of the “the Belt and Road” initiative. The data in this paper were used from a monitoring platform, located at http://www.tianqi.com/air/xian.html, accessed on 13 June 2024 and http://www.tianqihoubao.com/aqi/xian.html, accessed on 13 June 2024. The concentrations of various pollutants in Xi’an from 31 January 2018 to 31 December 2023 are provided. By calculating the annual, monthly, and daily average values of SO2, NO2, CO, PM10, PM2.5, and O3 in Xi’an, differences can be compared in different times and spaces. IBM SPSS Statistics (SPSS V26.0) is supplied by International Business Machines Corporation, Armonk, NY, USA. It is used to organize the data, and relevant standards (GB3095-2012, HJ663-2013) are used to process the data effectively and ensure the validity of the statistics [47,48].
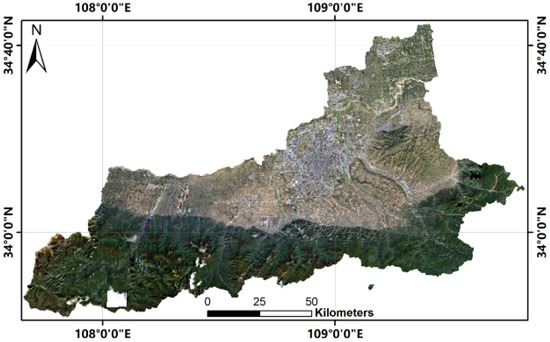
Figure 1.
An area map of Xi’an.
2.2. Classification of Epidemic Prevention and Control Stages
COVID-19 broke out at the beginning of the 2020 Spring Festival, and the epidemic was fully concluded on 7 December 2022 [49]. Therefore, the period from 2018 to 2023 was divided into pre-pandemic lockdown (2018–2019), pandemic lockdown (2020–2022), and post-pandemic lockdown (2023). For the purposes of this work, we decided that the period between March and May was spring, summer was from June to August, autumn was from September to November, and winter was from December to February of the following year.
3. Results and Discussion
3.1. Annual Variation in Air Pollutants
The annual trends in various air pollutants from 2018 to 2023 are shown in Figure 2.
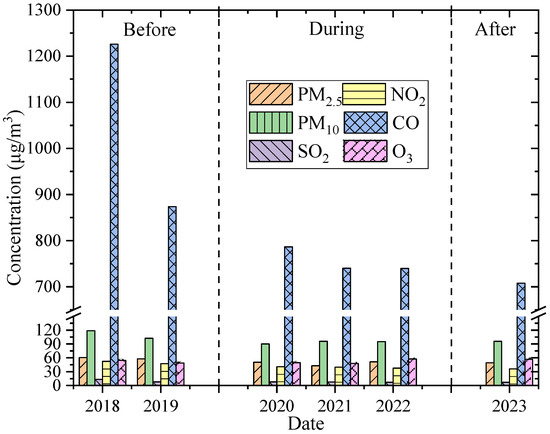
Figure 2.
Annual variation in pollutant concentration in Xi’an City from 2018 to 2023.
From Figure 2, it can be seen that the annual concentrations of various pollutants show a decrease from 2018 to 2023, with a concentration distribution of CO > PM10 > PM2.5 > O3 > NO2 > SO2. The whole period’s average concentration values of PM2.5 and PM10 are both higher than the national first level concentration limits (15 μg/m3 and 40 μg/m3, respectively) and second level concentration limits (35 μg/m3 and 70 μg/m3, respectively) [47]. The annual average concentrations of PM2.5 from 2018 to 2023 are as follows: 60.7 μg/m3, 57.7 μg/m3, 50.3 μg/m3, 42.7 μg/m3, 51.3 μg/m3, and 49.4 μg/m3, respectively. The annual average concentrations of PM10 from 2018 to 2023 are as follows: 118.9 μg/m3, 102.5 μg/m3, 90.0 μg/m3, 95.7 μg/m3, 95.1 μg/m3, and 95.8 μg/m3, respectively, indicating that PM pollution is still an important factor affecting the air quality in Xi’an and that efforts to prevent and control it need to be strengthened. The value of average concentration of SO2 from 2018 to 2023 (8.5 μg/m3) is lower than the national first level concentration limit (20 μg/m3) [47], while the value of average concentration of NO2 from 2018 to 2023 (42.3 μg/m3) is slightly higher than the national first and second level standard limits (40 μg/m3) [47].
Before the lockdown due to the epidemic, the annual average concentrations of PM2.5, PM10, SO2, NO2, O3, and CO were 59.2 μg/m3, 110.7 μg/m3, 10.6 μg/m3, 49.7 μg/m3, 51.6 μg/m3, and 1.0 mg/m3, respectively. The average concentrations of PM2.5, PM10, SO2, NO2, O3, and CO in the city during the lockdown were 48.1 μg/m3, 93.6 μg/m3, 7.5 μg/m3, 39.3 μg/m3, 51.6 μg/m3, and 0.8 mg/m3, respectively. They decreased by 18.7%, 15.4%, 29.4%, 20.9%, 0.0% (0.03%), and 28.1%, respectively. This is because many factories shut down due to the needs of epidemic prevention and control, students suspended classes, and strict traffic control was implemented [50], indicating that human activities made a certain contribution to pollutant concentrations. The epidemic lockdown reduced human activities, the number of car journeys decreased, and the anthropogenic sources of pollutants were significantly reduced, significantly affecting the environmental air quality [27].
After the lockdown due to the epidemic, the average concentrations of PM2.5, PM10, SO2, NO2, O3, and CO were 49.4 μg/m3, 95.8 μg/m3, 7.0 μg/m3, 36.0 μg/m3, 56.8 μg/m3, and 0.7 mg/m3, respectively. Except for O3, which increased by 9.3%, the average concentrations of the other five air pollutants decreased compared to before the lockdown. Compared to during the lockdown, PM2.5, PM10, and O3 increased by 2.5%, 2.3%, and 9.3%, respectively, while the average concentrations of the other three air pollutants decreased. The increase in O3 concentration indicates that the problem of ozone pollution in Xi’an has become increasingly prominent in recent years. O3 is mostly generated under conditions of light, high temperature, and low humidity [51,52], and is a product of volatile organic compounds (VOCs) emitted from various pollution sources and NOx [53]. This also indicates that human activities rapidly recovered during the post-lockdown period of the epidemic, and various emissions from production and daily life intensified the formation of ozone precursors such as NO2 and VOCs. In addition, the implementation of coal to gas and coal to electricity projects in Xi’an in recent years has reduced the contribution of CO, SO2, and other emissions from coal-fired sources to air pollution [54]. In addition, the measures taken to suspend work during the epidemic have reduced emissions from industrial sources, indicating that the reduction in anthropogenic sources has a certain impact on O3 concentration. However, further research is needed on the formation mechanism of ozone pollution in Xi’an. However, it is also evident that China’s air pollution prevention and control measures have been continuously promoted in recent years [55], and the concentrations of various pollutants have shown a downward trend year on year. This indicates that the reduction in human activity intensity and the shutdown of industrial activities have had an impact on pollutant emissions [56].
3.2. Number of Days with Particulate Matter Exceeding the National Standard
The changes in the number of days with excessive particulate matter from 2018 to 2023 are shown in Table 1.

Table 1.
Parameter statistics of PM10 and PM2.5 from 2018 to 2023.
From Table 1, it can be seen that the annual average values fluctuate; they generally show a downward trend. Overall, from 2018 to 2023, the proportion of days with PM10 exceeding the first level standard in Xi’an decreased 20.8%, corresponding to 74 days [47]. The proportion of days exceeding the second level standard decreased 8.9%, corresponding to 32 days [47]. At the same time, the proportion of PM2.5 days exceeding the first level standard in Xi’an decreased 18.7%, corresponding to 67 days. The proportion of days exceeding the second level standard decreased 6.7%, corresponding to 24 days. It can be clearly seen that the proportion of days with low concentration has increased, while the proportion of days with excessive concentration has decreased. As shown in Table 1, if the number of days with PM10 and PM2.5 exceeding the first level concentration decreases (50 μg/m3, 35 μg/m3), it indicates an increase in the number of days that meet the first level concentration. The first level concentration refers to a relatively low concentration, indicating an increase in the number of days with low concentration and an increase in its proportion, while the second level concentration (150 μg/m3, 75 μg/m3) refers to a relatively high concentration, and the decrease in the number of days exceeding the standard is relatively small compared to the first level concentration. This indicates that the air quality in Xi’an is gradually improving, and the concentration of particulate matter in the air is showing a decreasing trend.
Before the lockdown due to the epidemic, the proportion of PM10 exceeding the first and second level standards was 83.2% and 22.6% [47], respectively. The proportion exceeding the first and second level standards for PM10 during the lockdown due to the epidemic was 77.2% and 14.3%, respectively. Compared to before the lockdown, the proportion of PM10 exceeding the first and second level standards decreased by 6.0% and 8.3%, respectively. This indicates that after implementing epidemic control measures, there has been an improvement in air quality, and the amount of excessive particulate matter has decreased. The proportion exceeding the first and second level standards for PM10 after the lockdown due to the epidemic was 66.3% and 16.4%, respectively. Compared to before the lockdown, the proportion of PM10 exceeding the first and second level standards decreased by 16.9% and 6.2%. Compared to during the lockdown, the proportion of PM10 exceeding the first level standard decreased by 10.9%, while that exceeding the second level standard rebounded, increasing by 2.1%.
Before the lockdown due to the epidemic, the proportion of PM2.5 exceeding the first and second level standards was 59.0% and 23.8% [47], respectively. The proportion of PM2.5 exceeding the first and second level standards during the lockdown was 50.5% and 18.8%, respectively. Compared to before the lockdown, the proportion of PM2.5 exceeding the first and second level standards decreased by 8.4% and 5.0%, respectively. This also indicates that after implementing epidemic control measures, the phenomenon of excessive particulate matter decreased. The proportion of PM2.5 exceeding the first and second level standards after the lockdown due to the epidemic was 44.1% and 19.2%, respectively. Compared to before the lockdown, the proportion of PM2.5 exceeding the first and second level standards decreased by 14.8% and 4.7%. Compared to during the lockdown, the proportion of PM2.5 exceeding the first level standard decreased by 6.4%, while that exceeding the second level standard rebounded, increasing by 0.4%.
This indicates that some activities were reduced, such as the shutting down of some factories, schools, restaurants, and other entertainment facilities, and the reduction of unnecessary outings for residents. The significant reduction in anthropogenic sources led to a decrease in pollutant emissions, resulting in an improvement in air quality. In the late stage of the epidemic lockdown, work and production gradually resumed, and industrial enterprises began to discharge pollutants. The gap in air quality gradually narrowed, and even rebounded. For example, the average concentration of PM10 in 2023 (95.8 μg/m3) increased compared to the concentrations in 2020–2022 (90.0 μg/m3, 95.7 μg/m3, 95.2 μg/m3). Therefore, the control of pollutants in the air still needs to be further strengthened.
3.3. Monthly Variation in Pollutant Concentration
The monthly changes in different air pollutants before, during, and after the epidemic lockdown are shown in Figure 3.
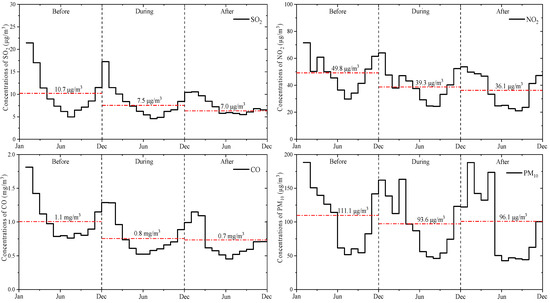
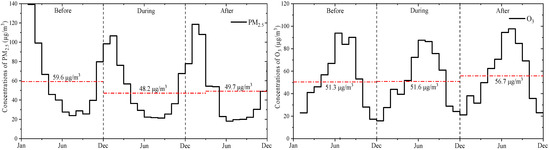
Figure 3.
Monthly variation in pollutant concentration in Xi’an at different times.
From Figure 3, it can be seen that from 2018 to 2023, the monthly changes in concentration of PM2.5, PM10, CO, SO2, and NO2 are similarly “higher in winter and lower in summer”. This is consistent with the conclusion given in the literature [57]. This can indicate that the concentration of these five pollutants increased due to the use of coal for heating in winter, coupled with the relatively low temperature and weak light intensity in Xi’an, making it difficult for pollutants to diffuse and dilute [53]. The relatively low concentration of pollutants in summer was mainly due to the reduction in coal-fired sources and the strong sunlight and precipitation in summer, which reduce their concentration. However, PM10 remains at a relatively high concentration, mainly due to the influence of sandstorms in the north, resulting in a higher concentration of airborne particulate matter.
The monthly average concentration of O3 changes in a “unimodal” manner, with the highest concentration in summer and the lowest concentration in winter. This is mainly related to the temperature and the strength of solar radiation [53]. In summer, the temperature is higher and the solar ultraviolet radiation is enhanced, which easily forms O3. In winter, the temperature is lower and the ultraviolet intensity is also lower, which is more stable and not conducive to the occurrence of photochemical reactions. Therefore, the concentration of O3 is the lowest in winter.
Compared to before the lockdown, the concentration of SO2 during and after the epidemic lockdown decreased by 29.8% and 34.6%, respectively. The concentration during the epidemic lockdown decreased the most in January compared to before the lockdown, by 46.4%. After the epidemic lockdown, the concentration decreased the most in December compared to before the lockdown, by 67.3%, while it also decreased the most in December compared to during the epidemic lockdown, by 45.9%. The concentration of NO2 decreased by 21.1% and 27.6%, respectively. During the epidemic lockdown, the concentration decreased the most in January compared to before the lockdown, by 33.5%. After the epidemic lockdown, the concentration decreased the most in May compared to before the lockdown, by 45.7%. Similarly, the concentration decreased the most in May compared to during the epidemic lockdown, by 34.2%. The concentration of CO decreased by 28.2% and 32.6%, respectively. During the epidemic lockdown, the concentration decreased the most in April compared to before the lockdown, by 37.3%. After the epidemic lockdown, the concentration decreased the most in March compared to before the lockdown, by 44.8%. Similarly, the concentration decreased the most in November compared to during the epidemic lockdown, by 20.1%.
PM10 and PM2.5 showed a decrease before and during the lockdown period, but showed an upward trend after the lockdown. The concentration of PM10 during the epidemic lockdown decreased the most in January compared to before the lockdown, by 26.4%. After the epidemic lockdown, the concentration decreased the most in May compared to before the lockdown, by 55.8%. Similarly, the concentration decreased the most in April compared to during the epidemic lockdown, by 44.2%. The concentration of PM2.5 decreased the most in May during the epidemic lockdown compared to before the lockdown, by 26.7%. After the epidemic lockdown, the concentration also decreased the most in May compared to before the lockdown, by 42.8%. Similarly, the concentration of PM2.5 decreased the most in April compared to during the epidemic lockdown, by 32.3%.
O3 showed an upward trend before, during, and after the epidemic lockdown. Compared to before the lockdown, the concentration of O3 has increased by 0.6% and 9.4%, respectively. During the mid-term of the epidemic lockdown, the concentration increased the most in November compared to before the lockdown, reaching 28.6%. After the lockdown due to the epidemic, the concentration increased the most in January compared to before the lockdown, reaching 39.8%. Similarly, during the later stage of the epidemic lockdown, the concentration also increased the most in January compared to the mid-term of the epidemic lockdown, reaching 27.7%.
3.4. Comparative Analysis of Pollutant Concentrations
The daily changes in various pollutants before, during, and after the epidemic lockdown are shown in Figure 4.
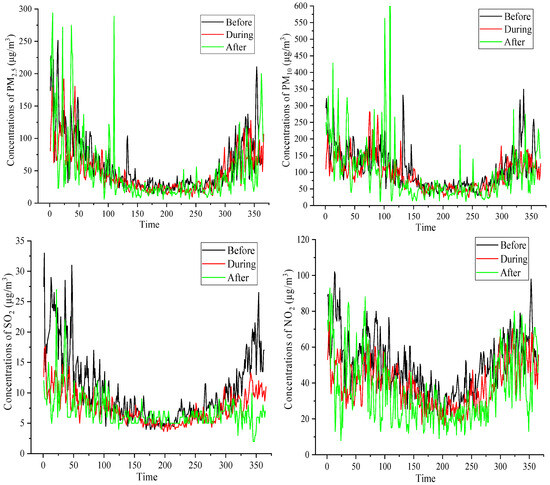
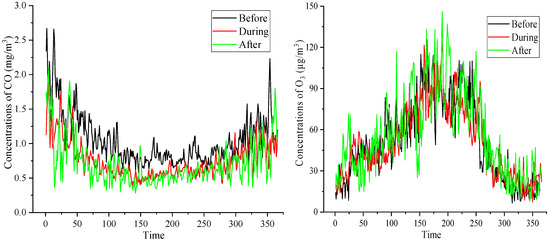
Figure 4.
Daily variation in different pollutant concentrations.
From Figure 4, SO2, NO2, and CO had the highest daily average before the epidemic lockdown; PM10, PM2.5 and O3 had the highest daily average after the epidemic lockdown. The daily average concentration ranges of PM10, SO2, NO2, CO, O3, and PM2.5 before the lockdown were 10.0~576.0 μg/m3, 2.0~50.0 μg/m3, 12.0~114.0 μg/m3, 0.3~3.2 mg/m3, 4.0~149.0 μg/m3, and 5.0~292.0 μg/m3, respectively. The daily average concentration ranges of PM10, SO2, NO2, CO, O3, and PM2.5 during the epidemic lockdown were 8.0~658.0 μg/m3, 3.0~22.0 μg/m3, 6.0~93.0 μg/m3, 0.3~2.1 mg/m3, 4.0~138.0 μg/m3, and 4.0~278.0 μg/m3, respectively. The concentrations of six pollutants decreased; this indicates that after taking relevant measures, such as decreasing residents’ outings, in the result was a decrease in pollutant emissions and an improvement in air quality.
After the epidemic lockdown, the daily average concentration ranges of PM10, SO2, NO2, CO, O3, and PM2.5 were 11.0~1116.0 μg/m3, 2.0~27.0 μg/m3, 8.0~93.0 μg/m3, 0.3~2.1 mg/m3, 8.0~146.0 μg/m3, and 6.0~294.0 μg/m3, respectively. Compared to before the epidemic lockdown, except for an increase in O3 concentration, the concentrations of other pollutants decreased. However, PM10 and PM2.5 reached their extreme values at around 100 days, due to the intensified emissions of pollutants caused by the resumption of production and work, as well as the impact of sand and dust transport [58], resulting in extreme concentrations of particulate matter. This aligns with the results of previous studies [59], so precise prevention and control of typical weather still need to be carried out.
Similarly, compared to during the epidemic lockdown, the concentrations of pollutants are shown to increase in Figure 4. It can be seen that with the gradual resumption of work and production, the amount of personal travel and the emissions of automobile exhausts and factories also gradually increased; the daily average concentration also increased accordingly, and a rebound phenomenon even occurred. Further differences in the concentrations of various pollutants are shown in Table 2.
Table 2.
Differences in daily average concentration of pollutants.
3.5. Correlation Analysis Between Various Pollutants
By analyzing the correlation between these six pollutants, it is possible to effectively understand their interaction, and within that, the type and distribution of the same or different sources of air pollutants, especially comparing these values through the three periods. The changes in correlations between various pollutants before, during, and after the epidemic lockdown are shown in Figure 5.
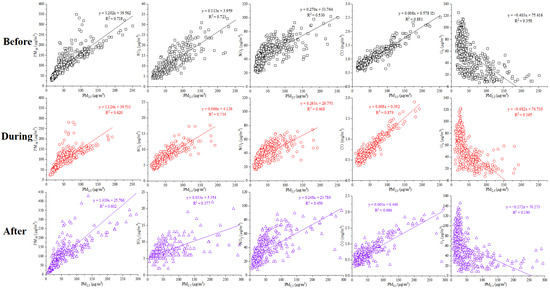
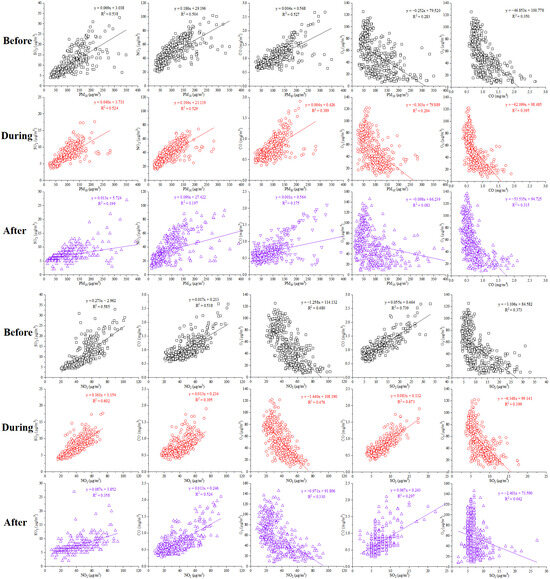
Figure 5.
Correlation curves of various pollutants at different time points. Weak correlation: 0–0.33, moderate correlation: 0.33–0.66, high correlation: 0.66–1 [60].
It can be seen from Figure 5 that before the epidemic lockdown, the average correlation values between PM2.5 and PM10, SO2, and CO are 0.718, 0.723, and 0.881, respectively. The average correlation value between SO2 and CO is 0.739, showing they are highly correlated. The average correlation values of PM2.5 with NO2 and O3 are 0.530 and 0.358; the average correlation values of PM10 with SO2, NO2, and CO are 0.538, 0.504, and 0.527; the average correlation value of CO with O3 is 0.350; the average correlation values of NO2 with SO2, CO, and O3 are 0.585, 0.538, and 0.480; and the average correlation value of SO2 and O3 is 0.373, all of which are moderate correlations. The average correlation value between PM10 and O3 is 0.283, indicating a weak correlation.
During the epidemic lockdown, the average correlation values between PM2.5 and SO2 and CO are 0.734 and 0.879, respectively, and the average correlation value between SO2 and CO is 0.671. All are highly correlated. The average correlation values between PM2.5 and PM10, NO2, and O3 are 0.620, 0.468, and 0.365, respectively. The average correlation values of PM10 with SO2, NO2, and CO are 0.524, 0.529, and 0.389, respectively. The average correlation value between CO and O3 is 0.395; the average correlation values between NO2 and SO2, CO, and O3 are 0.602, 0.395, and 0.476, respectively; and the average correlation value between SO2 and O3 is 0.399. All are moderately correlated. The average correlation value between PM10 and O3 is 0.294, indicating a weak correlation.
After the epidemic lockdown, the average correlation value between PM2.5 and CO is 0.686, indicating a high degree of correlation. The average correlation values between PM2.5 and PM10, SO2, and NO2 are 0.602, 0.377, and 0.450, respectively. The average correlation values between NO2 and SO2, CO, and O3 are 0.358, 0.524, and 0.330, respectively, all of which are moderate correlations. The average correlation value between PM2.5 and O3 is 0.190, and the average correlation values between PM10 and SO2, NO2, CO, and O3 are 0.199, 0.197, 0.175, and 0.083, respectively. The average correlation value between CO and O3 is 0.315, and the average correlation values between SO2 and CO and O3 are 0.297 and 0.042, respectively, indicating weak correlation. These results indicate the following: Firstly, pollution homogeneity can be revealed: a significant correlation between pollutants (such as PM2.5 and SO2) can directly prove that they may come from the same emission source (such as coal combustion), providing core data support for tracing pollution sources. Secondly, if the correlation between two pollutants is extremely strong, it indicates that there is information redundancy in the monitoring data. Based on this, the layout of monitoring stations or indicator settings can be adjusted to reduce monitoring costs while ensuring data validity. In addition, easily monitored pollutants (such as PM10) can be used as alternative indicators for difficult to monitor pollutants (such as VOCs), simplifying the input parameters of air quality prediction models and improving prediction efficiency.
However, with the resumption of work and production, multi-source pollution is still one of the primary problems to be solved in Xi’an. The control of pollutants in the air still requires long-term management. For special environments such as underground [61,62,63,64], more focused research is needed to provide a reference for effective treatment of pollutants in multi-dimensional environments.
This study focuses on the comparison of the concentrations of six pollutants in the atmosphere before, during, and after the lockdown, but there are two limitations: Firstly, it does not fully integrate meteorological data with atmospheric diffusion parameters, and fails to quantify the delayed effects mediated by pollutant accumulation cycles and diffusion rates, resulting in a lack of comprehensive interpretation of the concentration wave mechanism. Secondly, it mainly relies on concentration data from monitoring stations and lacks a combination of dynamic changes in pollution source emission inventories, making it difficult to accurately distinguish the cumulative effects of delayed effects and changes in emission intensity. Future research can quantify the actual contribution of delay effects by coupling meteorological observation data with atmospheric diffusion models and special in-depth research on the mechanism of ozone formation, while expanding to regional scales and extending time series to compare differences in delay effects under different geographical backgrounds and long-term evolution patterns in the post-pandemic era.
4. Conclusions
This paper is based on a statistical analysis of monitoring data from Xi’an from 2018 to 2023, and conducts in-depth analysis of the concentration changes in various pollutants in the atmosphere from a temporal perspective. The conclusions are as follows:
- After the epidemic lockdown (2023), the annual average concentrations of PM2.5, PM10, SO2, NO2, and CO decreased, while the concentration of O3 increased. Compared to before the epidemic lockdown, the average concentrations of PM2.5, PM10, SO2, NO2, O3, and CO during the epidemic lockdown (2020–2022) decreased by 18.7%, 15.4%, 29.4%, 20.9%, 0.03%, and 28.1%, respectively.
- Compared to before the epidemic lockdown, the proportion of PM10 exceeding the first and second level standards in the city decreased by 6.0% and 8.3%, respectively. The proportion of PM2.5 exceeding the first and second level standards in urban areas under the epidemic lockdown decreased by 8.4% and 5.0%, respectively.
- The monthly changes in concentration of PM2.5, PM10, CO, SO2, and NO2 were “higher in winter and lower in summer”. The monthly average concentration of O3 changed in a “unimodal” structure. The concentrations of SO2, NO2, and PM10 decreased the most in January, by 46.4%, 33.5%, and 26.4%, respectively. The concentration of CO decreased the most in April, by 37.3%. PM2.5 decreased the most in May, with a decrease of 26.7%. O3 showed the largest increase in November, reaching 28.6%.
- After taking relevant measures, such as shutting down some factories, schools, restaurants, and other entertainment facilities, and reducing unnecessary outings for residents, the significant reduction in anthropogenic sources led to a decrease in pollutant emissions, resulting in an improvement in air quality. Therefore, long-term management of air quality in Xi’an is still needed. This paper explores more detailed information so that the decision-makers can choose adequate strategies.
Author Contributions
Conceptualization, F.L. and X.Z.; methodology, X.Z.; investigation, T.Y.; data curation, F.L.; writing—original draft preparation, F.L. and X.Z.; writing—review and editing, X.Z. and T.Y. All authors have read and agreed to the published version of the manuscript.
Funding
This research was funded by the Natural Science Basic Research Program of Shaanxi Province (No. 2024JC-YBQN-0453), the Shaanxi Provincial Department of Education Service Local Special Plan Project (No. 24JC050), the XI’AN JIANDA INSTITUTE OF URBAN PLANNING & DESIGN CO., LTD (Program NO. X20240067), and the Shaanxi Provincial Department of Science and Technology Project (No. 2024JC-YBQN-0733).
Institutional Review Board Statement
Not applicable.
Informed Consent Statement
Not applicable.
Data Availability Statement
The data presented in this study are available on request from the corresponding author.
Conflicts of Interest
The authors declare no conflicts of interest.
References
- He, Z.; Wu, Z.; Herzog, O.; Hei, J.; Li, L.; Li, X. Compound health effects and risk assessment of extreme heat and ozone air pollution under climate change: A case study of 731 urban areas in China. Sustain. Cities Soc. 2025, 119, 106084. [Google Scholar] [CrossRef]
- Kumar, P.; Singh, A.B.; Arora, T.; Singh, S.; Singh, R. Critical review on emerging health effects associated with the indoor air quality and its sustainable management. Sci. Total Environ. 2023, 872, 162163. [Google Scholar] [CrossRef]
- Manisalidis, I.; Stavropoulou, E.; Stavropoulos, A.; Bezirtzoglou, E. Environmental and health impacts of air pollution: A review. Front. Public Health 2020, 8, 14. [Google Scholar] [CrossRef] [PubMed]
- Jeon, J.; Chen, Y.; Kim, H. Influences of meteorology on emission sources and physicochemical properties of particulate matter in Seoul, Korea during the heating period. Atmos. Environ. 2023, 303, 119733. [Google Scholar] [CrossRef]
- Li, Q.; Li, S.; Zhai, T.; Jin, S.; Wang, C.; Fang, B.; Xia, T. Association of Cardiovascular Disease Mortality and Ambient Temperature Variation in Shanghai, China: Beyond Air Quality Index PM2.5. Atmosphere 2025, 16, 119. [Google Scholar] [CrossRef]
- Liu, B.; Jiang, M.; Wu, Y.; Zheng, P.; Gao, X.; Wang, J. Impact of air pollution on the progress-free survival of non-small cell lung cancer patients with anti-PD-1/PD-L1 immunotherapy: A cohort study. Environ. Pollut. 2025, 368, 125683. [Google Scholar] [CrossRef]
- Bagheri, G.; Schlenczek, O.; Turco, L.; Thiede, B.; Stieger, K.; Kosub, J.M.; Clauberg, S.; Pöhlker, M.L.; Pöhlker, C.; Moláček, J.; et al. Size, concentration, and origin of human exhaled particles and their dependence on human factors with implications on infection transmission. J. Aerosol Sci. 2023, 168, 106102. [Google Scholar] [CrossRef]
- Schiavo, B.; Meza-Figueroa, D.; Vizuete-Jaramillo, E.; Robles-Morua, A.; Angulo-Molina, A.; Reyes-Castro, P.A.; Inguaggiato, C.; Gonzalez-Grijalva, B.; Pedroza-Montero, M. Oxidative potential of metal-polluted urban dust as a potential environmental stressor for chronic diseases. Environ. Geochem. Health 2023, 45, 3229–3250. [Google Scholar] [CrossRef]
- Zhou, F.R.; Yang, J.R.; Wen, G.; Ma, Y.; Pan, H.; Geng, H.; Cao, J.; Zhao, M.; Xu, C. Estimating spatio-temporal variability of aerosol pollution in Yunnan Province, China. Atmos. Pollut. Res. 2022, 13, 101450. [Google Scholar] [CrossRef]
- Song, H.; Dong, Y.H.; Yang, J.Y.; Zhang, X.; Nie, X.X.; Fan, Y.X. Concentration Characteristics and Correlations with Other Pollutants of Atmospheric Particulate Matter as Affected by Relevant Policies. Int. J. Environ. Res. Public Health 2023, 20, 1051. [Google Scholar] [CrossRef] [PubMed]
- da Silva, R.M.D.; Castelhano, F.J.; Sitoe, G.A.A.; Hoinaski, L.; Amini, H.; Saldiva, P.H.N.; Requia, W.J. The mediating role of air pollution in the relationship between greenspace and cardiorespiratory admissions in Brazil. Environ. Pollut. 2025, 369, 125849. [Google Scholar] [CrossRef]
- Tian, Y.L.; Li, X.Y.; Sun, H.T.; Xue, W.H.; Song, J.X. Characteristics of atmospheric pollution and the impacts of environmental management over a megacity, northwestern China. Urban Clim. 2022, 42, 101114. [Google Scholar] [CrossRef]
- Norbu, N.; Sheng, X.; Liu, Q.; Han, H.; Zhang, X. Effect of Heating Emissions on the Fractal Size Distribution of Atmospheric Particle Concentrations. Atmosphere 2024, 15, 95. [Google Scholar] [CrossRef]
- Wang, J.; Li, T.N.; Li, Z.Q.; Fang, C.S. Study on the Spatial and Temporal Distribution Characteristics and Influencing Factors of Particulate Matter Pollution in Coal Production Cities in China. Int. J. Environ. Res. Public Health 2022, 19, 3228. [Google Scholar] [CrossRef] [PubMed]
- Nakyai, T.; Santasnachok, M.; Thetkathuek, A.; Phatrabuddha, N. Influence of meteorological factors on air pollution and health risks: A comparative analysis of industrial and urban areas in Chonburi Province, Thailand. Environ. Adv. 2025, 19, 100608. [Google Scholar] [CrossRef]
- Behera, N.; Gokhale, S. Understanding meteorological factors influencing heavy air pollution in Guwahati, India. Atmos. Pollut. Res. 2025, 16, 102337. [Google Scholar] [CrossRef]
- Zhang, X.; Sun, H.; Li, K.P.; Nie, X.X.; Fan, Y.S.; Wang, H.; Ma, J.Y. Comparison of the Application of Three Methods for the Determination of Outdoor PM2.5 Design Concentrations for Fresh Air Filtration Systems in China. Int. J. Environ. Res. Public Health 2022, 19, 16537. [Google Scholar] [CrossRef]
- Wu, Z.T.; Chen, X.; Li, G.X.; Tian, L.; Wang, Z.; Xiong, X.Q.; Yang, C.; Zhou, Z.J.; Pan, X.C. Attributable risk and economic cost of hospital admissions for mental disorders due to PM2.5 in Beijing. Sci. Total Environ. 2020, 718, 137274. [Google Scholar] [CrossRef]
- Feng, R.; Xu, H.; Wang, Z.; Gu, Y.; Liu, Z.; Zhang, H.; Zhang, T.; Wang, Q.; Zhang, Q.; Liu, S.; et al. Quantifying air pollutant variations during COVID-19 lockdown in a capital city in Northwest China. Atmosphere 2021, 12, 788. [Google Scholar] [CrossRef]
- Wang, J.; Xu, X.; Wang, S.; He, S.; He, P. Heterogeneous effects of COVID-19 lockdown measures on air quality in Northern China. Appl. Energy 2021, 282, 116179. [Google Scholar] [CrossRef] [PubMed]
- Silva, A.C.T.; Branco, P.T.; Sousa, S.I. Health and economic burden avoided due to air pollution reduction during the COVID-19 Lockdown: Portugal case study. Sustain. Cities Soc. 2024, 106, 105371. [Google Scholar] [CrossRef]
- Morawska, L.; Li, Y.; Salthammer, T. Lessons from the COVID-19 pandemic for ventilation and indoor air quality. Science 2024, 385, 396–401. [Google Scholar] [CrossRef]
- He, J.; Harkins, C.; O’Dell, K.; Li, M.; Francoeur, C.; Aikin, K.C.; Anenberg, S.; Baker, B.; Brown, S.S.; Coggon, M.M.; et al. COVID-19 perturbation on US air quality and human health impact assessment. Proc. Natl. Acad. Sci. Nexus 2024, 3, pgad483. [Google Scholar] [CrossRef]
- Mi, K.; Zhuang, R.L.; Zhang, Z.H.; Gao, J.; Pei, Q. Spatiotemporal characteristics of PM2.5 and its associated gas pollutants, a case in China. Sustain. Cities Soc. 2019, 45, 287–295. [Google Scholar] [CrossRef]
- Persis, J.; Amar, A.B. Predictive modeling and analysis of air quality–Visualizing before and during COVID-19 scenarios. J. Environ. Manag. 2023, 327, 116911. [Google Scholar] [CrossRef]
- Rahimi, I.; Chen, F.; Gandomi, A.H. A review on COVID-19 forecasting models. Neural Comput. Appl. 2023, 35, 23671–23681. [Google Scholar] [CrossRef] [PubMed]
- Wang, Q.; Su, M. A preliminary assessment of the impact of COVID-19 on environment–A case study of China. Sci. Total Environ. 2020, 728, 138915. [Google Scholar] [CrossRef]
- Fan, C.; Li, Y.; Guang, J.; Li, Z.; Elnashar, A.; Allam, M.; de Leeuw, G. The impact of the control measures during the COVID-19 outbreak on air pollution in China. Remote Sens. 2020, 12, 1613. [Google Scholar] [CrossRef]
- Ramacher, M.O.P. Incorporating dynamic population activities in modeling exposure to urban air pollution: Insights from COVID-19 lockdowns in three European cities. Air Qual. Atmos. Health 2025, 18, 1507–1526. [Google Scholar] [CrossRef]
- Silva, A.C.T.; Branco, P.T.; Ferrini Rodrigues, P.; Sousa, S.I. Sustainable policies for air pollution reduction after COVID-19 pandemic: Lessons learnt from the impact of the different lockdown periods on air quality. Sustain. Dev. 2023, 31, 959–975. [Google Scholar] [CrossRef]
- Arregocés, H.A.; Rojano, R.; Restrepo, G. Impact of lockdown on particulate matter concentrations in Colombia during the COVID-19 pandemic. Sci. Total Environ. 2021, 764, 142874. [Google Scholar] [CrossRef]
- Wu, X.; Nethery, R.C.; Sabath, M.B.; Braun, D.; Dominici, F. Air pollution and COVID-19 mortality in the United States: Strengths and limitations of an ecological regression analysis. Sci. Adv. 2020, 6, eabd4049. [Google Scholar] [CrossRef] [PubMed]
- Bonnet, F.; Grigoriev, P.; Sauerberg, M.; Alliger, I.; Mühlichen, M.; Camarda, C.G. Spatial disparities in the mortality burden of the COVID-19 pandemic across 569 European regions (2020–2021). Nat. Commun. 2024, 15, 4246. [Google Scholar] [CrossRef] [PubMed]
- Achebak, H.; Garatachea, R.; Pay, M.T.; Jorba, O.; Guevara, M.; Pérez García-Pando, C.; Ballester, J. Geographic sources of ozone air pollution and mortality burden in Europe. Nat. Med. 2024, 30, 1732–1738. [Google Scholar] [CrossRef]
- Carballo, I.H.; Bakola, M.; Stuckler, D. The impact of air pollution on COVID-19 incidence, severity, and mortality: A systematic review of studies in Europe and North America. Environ. Res. 2022, 215, 114155. [Google Scholar] [CrossRef]
- Schiavo, B.; Morton-Bermea, O.; Arredondo-Palacios, T.E.; Meza-Figueroa, D.; Robles-Morua, A.; García-Martínez, R.; Valera-Fernández, D.; Inguaggiato, C.; Gonzalez-Grijalva, B. Analysis of COVID-19 Lockdown Effects on Urban Air Quality: A Case Study of Monterrey, Mexico. Sustainability 2022, 15, 642. [Google Scholar] [CrossRef]
- Hui, D.S.; Azhar, E.I.; Kim, Y.J.; Memish, Z.A.; Oh, M.D.; Zumla, A. Middle East respiratory syndrome coronavirus: Risk factors and determinants of primary, household, and nosocomial transmission. Lancet Infect. Dis. 2018, 18, e217–e227. [Google Scholar] [CrossRef]
- Amoroso, N.; Cilli, R.; Maggipinto, T.; Monaco, A.; Tangaro, S.; Bellotti, R. Satellite data and machine learning reveal a significant correlation between NO2 and COVID-19 mortality. Environ. Res. 2022, 204, 111970. [Google Scholar] [CrossRef]
- Mehmood, K.; Bao, Y.; Mushtaq, S.; Saifullah; Khan, M.A.; Siddique, N.; Bilal, M.; Heng, Z.; Huan, L.; Tariq, M.; et al. Perspectives from remote sensing to investigate the COVID-19 pandemic: A future-oriented approach. Front. Public Health 2022, 10, 938811. [Google Scholar] [CrossRef]
- Chen, Y.; Qin, R.; Zhang, G.; Albanwan, H. Spatial temporal analysis of traffic patterns during the COVID-19 epidemic by vehicle detection using planet remote-sensing satellite images. Remote Sens. 2021, 13, 208. [Google Scholar] [CrossRef]
- Ye, J.; Song, Y.; Liu, Y.; Zhong, Y. Assessment of medical waste generation, associated environmental impact, and management issues after the outbreak of COVID-19: A case study of the Hubei Province in China. PLoS ONE 2022, 17, e0259207. [Google Scholar] [CrossRef] [PubMed]
- Guan, Y.; Shen, Y.; Liu, X.; Liu, X.; Chen, J.; Li, D.; Xu, M.; Wang, L.; Duan, E.; Hou, L.A.; et al. Important revelations of different degrees of COVID-19 lockdown on improving regional air quality: A case study of Shijiazhuang, China. Environ. Sci. Pollut. Res. 2023, 30, 21313–21325. [Google Scholar] [CrossRef]
- Han, L.; Zhao, J.; Gu, Z. Assessing air quality changes in heavily polluted cities during the COVID-19 pandemic: A case study in Xi’an, China. Sustain. Cities Soc. 2021, 70, 102934. [Google Scholar] [CrossRef]
- Hasnain, A.; Hashmi, M.Z.; Bhatti, U.A.; Nadeem, B.; Wei, G.; Zha, Y.; Sheng, Y. Assessment of Air Pollution before, during and after the COVID-19 Pandemic Lockdown in Nanjing, China. Atmosphere 2021, 12, 743. [Google Scholar] [CrossRef]
- Zhao, H.; Huang, Z.; Xu, L.; Tang, J.; Chen, Y. Modeling the resumption of work and production of enterprises during COVID-19: An SIR-based quantitative framework. Front. Public Health 2022, 10, 1066299. [Google Scholar] [CrossRef]
- Jiang, Z.; Cheng, H.; Zhang, P.; Kang, T. Influence of urban morphological parameters on the distribution and diffusion of air pollutants: A case study in China. J. Environ. Sci. 2021, 105, 163–172. [Google Scholar] [CrossRef] [PubMed]
- GB3095-2012; Ambient Air Quality Standards. China Environmental Science Press: Beijing, China, 2012.
- HJ663-2013; Technical Regulation for Ambient Air Quality Assessment (On Trial). China Environmental Science Press: Beijing, China, 2013.
- Zhang, Q.; Yang, J.; Niu, T.; Wen, K.H.; Hong, X.; Wu, Y.; Wang, M. Analysis of the evolving factors of social media users’ emotions and behaviors: A longitudinal study from China’s COVID-19 opening policy period. BMC Public Health 2023, 23, 2230. [Google Scholar] [CrossRef]
- Shen, J.; Duan, H.; Zhang, B.; Wang, J.; Ji, J.S.; Wang, J.; Pan, L.; Wang, X.; Zhao, K.; Ying, B.; et al. Prevention and control of COVID-19 in public transportation: Experience from China. Environ. Pollut. 2020, 266, 115291. [Google Scholar] [CrossRef]
- Adame, J.A.; Gutierrez-Alvarez, I.; Notario, A.; Yela, M. Contrasting ozone responses driven by Mediterranean ventilation and anticyclonic blocking under high-temperatures in coastal Southwestern Europe. Atmos. Res. 2025, 327, 108350. [Google Scholar] [CrossRef]
- Carrasco-Venegas, L.A.; Castañeda-Pérez, L.G.; Martínez-Hilario, D.G.; Medina-Collana, J.T.; González-Fernández, J.V.; Gutiérrez-Cuba, C.; Cuba-Torre, H.R.; Pilco-Nuñez, A.; Ancieta-Dextre, C.A.; Rodriguez-Taranco, O.J. Mathematical Modeling of Photochemical and Chemical Interactions in Photochemical Smog Formation. Processes 2025, 13, 1384. [Google Scholar] [CrossRef]
- Yao, T.; Li, X.; Li, Z.; Yang, X.; Zhang, J.; Wang, Y.; Guo, J.; Li, J. Investigation of the Earliest Ozone Pollution Events in Hangzhou Bay, China Based on Observations and ERA5 Reanalysis Data. Toxics 2025, 13, 99. [Google Scholar] [CrossRef]
- Zhao, X.; Tian, W.; Chen, D. Impacts of Thermal Power Industry Emissions on Air Quality in China. Sustainability 2025, 17, 441. [Google Scholar] [CrossRef]
- Zhang, X.; Wei, Y.; Wang, T.; Shen, J.; Zhao, T.; Dong, L. Spatial correlation network on synergy between carbon reduction and pollution control in key areas for air pollution prevent and control. J. Clean. Prod. 2025, 491, 144777. [Google Scholar] [CrossRef]
- Wang, X.; Xu, X.; Yang, C.; Yang, X.; Zhao, X.; Wan, Z.; Xu, Y.; Guo, Q.; Sun, H.; Chen, D.; et al. Spatio-temporal variation of air quality and its driving factors in Jinan and Qingdao during 2014–2022. J. Hazard. Mater. 2025, 486, 137065. [Google Scholar] [CrossRef]
- Wang, Y.; Qu, S.; Li, T.; Chen, L.; Yang, L. Association between ambient air pollution and outpatient visits of cardiovascular diseases in Zibo, China: A time series analysis. Front. Public Health 2025, 12, 1492056. [Google Scholar] [CrossRef]
- Zhang, Z.; Bird, A.; Zhang, C.; Dong, Z. Not all gravel deserts in northern China are sources of regionally deposited dust. Atmos. Environ. 2022, 273, 118984. [Google Scholar] [CrossRef]
- Fan, L.; Wang, Y.; He, B.; Cao, C. Spatio-temporal distribution and transport pathways analysis of sand and dust weather in North China. Nat. Hazards 2024, 121, 7425–7445. [Google Scholar] [CrossRef]
- Oliveira, D.A.; Teodoro, L.; de Matos, D.M. GroundCap: A Visually Grounded Image Captioning Dataset. arXiv 2025, arXiv:2502.13898. [Google Scholar] [CrossRef]
- Wu, S.; Ma, X.; Zhang, X.; Chen, J.; Yao, Y.; Li, D. Investigation into hydrogen induced fracture of cable bolts under deep stress corrosion coupling conditions. Tunn. Undergr. Space Technol. 2024, 147, 105729. [Google Scholar] [CrossRef]
- Wu, S.; Hao, W.; Yao, Y.; Li, D. Investigation into durability degradation and fracture of cable bolts through laboratorial tests and hydrogeochemical modelling in underground conditions. Tunn. Undergr. Space Technol. 2023, 138, 105198. [Google Scholar] [CrossRef]
- Wu, S.; Zhang, Z.; Chen, J.; Yao, Y.; Li, D. Characterisation of stress corrosion durability and time-dependent performance of cable bolts in underground mine environments. Eng. Fail. Anal. 2023, 150, 107292. [Google Scholar] [CrossRef]
- Wang, X.; Qiu, Z.; Gu, Q.; Wang, H.; Guo, J.; Li, X.; Deng, K.; Zhang, Y.; Zhang, C.; Jiang, H.; et al. Wear failure of pipelines transporting cemented paste backfill: A review. Phys. Fluids 2025, 37, 071309. [Google Scholar] [CrossRef]
Disclaimer/Publisher’s Note: The statements, opinions and data contained in all publications are solely those of the individual author(s) and contributor(s) and not of MDPI and/or the editor(s). MDPI and/or the editor(s) disclaim responsibility for any injury to people or property resulting from any ideas, methods, instructions or products referred to in the content. |
© 2025 by the authors. Licensee MDPI, Basel, Switzerland. This article is an open access article distributed under the terms and conditions of the Creative Commons Attribution (CC BY) license (https://creativecommons.org/licenses/by/4.0/).