Article

Determinants of Odor-Related Perception: Analysis of Community Response

by
Franciele Ribeiro Cavalcante
1,
Milena Machado
2,*,
Valdério Anselmo Reisen
1,
Bruno Furieri
1,
Elisa Valentim Goulart
1,
Antonio Ponce de Leon
3,
Neyval Costa Reis, Jr.
1,
Séverine Frère
4 and
Jane Meri Santos
1
1
Department of Environmental Engineering, Federal University of Espirito Santo (UFES), Vitória 29075-910, Brazil
2
Federal Institute of Education, Science and Technology of Espirito Santo (IFES), Guarapari 29216-795, Brazil
3
Department of Epidemiology, State University of Rio de Janeiro (UERJ), Rio de Janeiro 20550-013, Brazil
4
Maison de la Recherche em Science de l′Homme, Universite du Littoral Cote d’Opale, 59 375 Dunkerque Cedex 1, France
*
Author to whom correspondence should be addressed.
Atmosphere 2025, 16(10), 1176; https://doi.org/10.3390/atmos16101176
Submission received: 7 September 2025 / Revised: 28 September 2025 / Accepted: 1 October 2025 / Published: 11 October 2025
(This article belongs to the Special Issue Atmospheric Pollutants: Monitoring and Observation (2nd Edition))

Abstract

This study intends to identify and quantify the individual, perceptual, and contextual factors associated with odor-related perception and to assess the perception of odor sources according to meteorological conditions. Two face-to-face seasonal community surveys were conducted using stratified random sampling with proportional allocation, yielding representative samples of residents in a southern Brazilian city, where mild constant temperatures throughout the year and shifting prevailing wind directions expose residents to different odor sources. Chi-Square tests were applied to assess associations between odor perception and qualitative variables, while logistic regression was used to identify predictors of higher annoyance. Results showed that prevailing wind direction influenced source attribution, with steel industry and sewage-related sites most frequently cited. Proximity to the steel plant increased both source recognition and annoyance levels. Reported impacts included closing windows and reducing outdoor activities. Self-reported respiratory problems consistently predicted higher annoyance levels in both surveys. The statistical methods were effective in analyzing the likelihood of odor-related perception and its relationship with explanatory variables. These findings highlight the value of a data-driven approach—specifically, integrating wind direction, source proximity, and community-based perception—to support urban environmental management and guide odor mitigation strategies.

1. Introduction

Different industrial sectors, such as wastewater treatment plants (WWTPs), food processing industries, pulp and paper mills, and steel and petrochemical plants, emit unpleasant odors that can significantly impact both the health and quality of life of the exposed populations [1,2]. Odor perception arises when volatile chemicals (such as sulfur, nitrogen compounds, and other volatile organic compounds) or their mixtures come into contact with the olfactory epithelium in the nasal cavities [3,4]. Depending on their chemical composition and concentration, exposure to these substances can negatively affect physical health, causing symptoms like headaches, eye irritation, nausea, shortness of breath, and exacerbation of asthma and bronchitis [5,6].
Exposure to odors can have psychological effects, ranging from mild annoyance to more serious conditions like anxiety, irritability, and depression [7,8]. Annoyance is a subjective feeling of discomfort or irritation [9]. It is a psychological reaction to a stimulus, perceptual and subjective. This is distinguishable from nuisance, which refers to long-term intermittent exposure to odors that cause a negative appraisal in the individual concerned. It often has legal or regulatory implications [10]. Both nuisance and annoyance refer to forms of discomfort that can impact an individual’s overall well-being, whether in response to a short-term event or a long-term condition [11]. In this context, they align with the World Health Organization’s definition of health as “a state of complete physical, mental, and social well-being and not merely the absence of disease or infirmity” [12].
Diverse statistical techniques have been used in the literature to analyze annoyance caused by odor. For instance, a univariate logistic model was employed to examine the relationship between the level of exposure to odor (in odor units) and annoyance levels in a residential area impacted by sewage odor [13]. The model was found effective in capturing this relationship, particularly when using odor concentration time series data collected during summer afternoons and evenings—periods when residents are more likely to be outdoors. This temporal focus was especially relevant given the study’s setting in Northern China, where notably harsh winters affect social behavior. However, this study did not explore other factors that might influence odor impact and perception beyond odor concentration.
Odor perception can be influenced by qualitative factors regarding the individuals’ perception and sociodemographic factors [14,15]. To analyze these factors, community research is the most appropriate evaluation tool, as it evaluates annoyance according to psychological stress and its effects on quality of life [16]. Several studies have investigated qualitative factors affecting the degree of annoyance due to odor perception by applying questionnaires to communities in different countries and have suggested the use of various statistical techniques for data analysis [17,18,19]. One such study examined community changes in odor perception, annoyance levels, and self-reported health status before and after the implementation of an odor reduction plan at a local petroleum refinery, using health surveys and odds ratio estimates to illustrate the influence of explanatory variables on the outcomes [17]. The results revealed a decrease in negative perceptions and concerns following the emission reduction measures, supporting the effectiveness of the odor management plan. Another study applied path analysis to questionnaire data and found that the level of exposure to odorous gases did not fully explain the reported annoyance; rather, this association was mediated by perceptions of pollution and health risks [18]. A third study identified factors associated with odor impacts in a region where the majority of odor observations were primarily linked to wastewater treatment plants (WWTPs). The authors applied Pearson’s Chi-Square test to evaluate the causes of odor perception and found that the concerns towards the odor source management, the local odor legislation, and the ownership of the house affect the community perception of odor. However, they did not quantify the effect of each qualitative factor on the response variable [19].
This study aims to identify and quantify the individual, perceptual, and contextual factors associated with odor-related annoyance. We also plan to assess how the perception of odor sources changes in different meteorological conditions.
We propose the Chi-Square test of independence to assess whether the odor-related perception is associated with specific qualitative explanatory variables such as odor perception frequency, perceived source, demographic profile, and self-reported health conditions and the multiple logistic regression to estimate odds ratios, which helps to quantify how much more likely a given explanatory variable is to be associated with a particular level of reported annoyance. The proposed statistical tools are crucial for supporting odor management efforts by environmental agencies and industries. By providing a deeper understanding of how community perceptions, awareness of odor sources, and sociodemographic factors are associated with the level of annoyance, this research offers insights that can guide more effective mitigation strategies.

2. Materials and Methods

2.1. Community Survey

2.1.1. Region and Period of Study

The study region consists of an industrialized urban area located in the Greater Vitória Region (GVR), in the tropical coastal zone of southeastern Brazil. There are different potential sources of odorous gases in the region. Figure 1 shows the location and typology of the main industrial and non-industrial sources of odor compounds and the delimitation of the region of interest. The main industrial sources are steel, chemical, food, and cement industries, paint and ceramic manufacturing, as well as the operation of heavy vehicles and machinery in the industrial sites. Non-industrial sources are sewage pumping and treatment plants, fuel storage areas, and gas stations [20]. These odor sources predominantly emit volatile organic compounds and reduced sulfur compounds, as indicated in the emission inventory provided in [21]. Steelmaking is the largest individual source in the area.
The study area has a humid tropical climate, characterized by marked precipitation seasonality and relatively stable temperatures throughout the year. The rainy season extends from October to March, peaking between November and January, while the dry season occurs from May to September, with minimum rainfall in July. Easterly to northeasterly winds predominate in the region; however, southerly winds may occur between April and September, typically associated with the passage of cold fronts [20]. Therefore, the selection of the survey periods was based on the need to capture community responses under these two distinct meteorological scenarios, particularly related to prevailing wind directions, which could influence odor perception depending on the spatial relationship between sources and residences. The sources in the steel industry can potentially affect the communities when winds blow from the south–southwest quadrant. Other sources may affect the region when winds blow from the north–northeast quadrant. Due to their proximity to respondents, gas stations and raw sewage pumping stations may be associated with odor perception events for any weather condition.

2.1.2. Data Set and Sample Size

Two surveys were conducted, the first from April to May 2019, and the second from November 2021 to February 2022. The second survey was initially scheduled to be carried out in 2020; however, it had to be postponed due to the COVID-19 pandemic. Wind data were obtained from the Vitória Airport meteorological station (SBVT 83649; UTM coordinates: 366,351 m E, 7,759,475; 40 m S; 10 m height), located approximately 6 km from the study area. Operated by INMET and compliant with World Meteorological Organization (WMO) standards [22], the station provided hourly data and is representative of the study region, as both locations are at sea level with no topographical barriers. The wind roses in Figure 2 show the directions and speeds of the prevailing winds in the months when the opinion surveys were conducted.
The structured questionnaire was adapted from a previously developed version [19] and administered face-to-face. It included a total of 23 questions, including sub-items organized on construct and theme [23] research, which used a similar questionnaire in the same study region. These constructs were organized into sections covering demographic factors (such as gender, age, occupation, and education level), lifestyle behaviors (e.g., tobacco use), self-reported health conditions, environmental perceptions (including the presence of dust, reduced visibility, and odors), and odor perception (including the degree of annoyance, perceived odor sources and odor characteristics, frequency of unpleasant smells, and effects on quality of life). The full questionnaire is presented as Supplementary Material.
A simple random sampling technique with proportional allocation was employed, with statistical definitions and procedures in accordance with standard sampling methodology [24]. The sample size estimation considered the total population of the region (N = 51,743) and the populations of individual neighborhoods (Ni) [25]. The overall sample size for the study region ( n ) was calculated using Equation (1), while the sample size for each neighborhood (sub-region) ( n i ) was determined by Equation (2), following the approach described in [26].
n N 1 + N 1 P ( 1 P ) d z α 2 1
in which z α is the standardized normal variable associated with the 95% confidence level, P is the true probability of the event (here assumed to be 0.5), and d is the 5% margin of error.
n i = N i N × n
Based on these calculations, the minimum sample size estimated for the study region was 400 respondents, ensuring statistical representativeness of the population. In practice, 505 valid responses were obtained in 2019 and 400 in 2022, with a total sample size of 905 respondents, which met or exceeded the required minimum sample size. To ensure greater spatial coverage and avoid clustering, households were selected with a minimum interval of three residences between them. The eligibility criteria for participants included residency within the study area and being over 16 years of age. Due to the random nature of the sampling, the same individuals were not intentionally selected across both surveys. Therefore, the respondents in the two surveys are not the same individuals but are considered to be representative samples of the study area.

2.2. Statistical Techniques

The variable of interest is the degree of annoyance due to odor (obtained through the survey), measured as a scale number (from 1 to 10) and turned into a binary variable. As in previous studies [27,28], responses from 1 to 6 were classified as “slightly annoyed” and coded as 0, and responses from 7 to 10 were classified as “very annoyed” and coded as 1. Respondents who reported not perceiving odors were excluded from the analysis.
The proposed explanatory variables derived from the questionnaire are presented in Table 1, as well as their type (binary, categorical, or ordinal scale) and coding used. The answers to the categorical variables “perceived odor source”, “characteristic of the perceived odor”, “age group”, and “schooling level” were grouped to produce answers which were chosen by 5 or more interviewees in order to satisfy the restriction of the method.

2.2.1. Chi-Square Test

The Chi-Square test of independence was applied to identify whether the degree of annoyance caused by odors is associated with any of the qualitative variables presented in Table 1 [29]. For this purpose, the responses of each of the surveys were evaluated separately. The hypothesis to be tested is defined as
H 0 : p 0 = p 1 H 1 : p 0 p 1
The null hypothesis ( H 0 ) assumes no difference in the proportion of slightly and very annoyed respondents, and the alternative hypothesis ( H 1 ) assumes a difference in the proportion of slightly and very annoyed respondents, in which p 0 represents the proportion of respondents slightly annoyed and p 1 represents the proportion of respondents very annoyed.
The assumptions of the Chi-Square test were met. In cases where the expected frequency in any cell was below 5, alternative tests such as Fisher’s Exact Test and the asymptotic normal approximation were applied, which yielded equivalent results and ensured the robustness of the analysis.

2.2.2. Logistic Regression

Logistic regression was applied to identify the explanatory variables of “annoyed” responses. Logistic regression is a tool widely used in studies that aim to describe the relationship between a binary response variable and one or more explanatory variables [30].
Let X = ( X 1 , X 2 , , X p ) be a vector representing p explanatory variables, and Y be the binary response variable, in which the Bernoulli distribution is assumed. Here, Y = 1 (very annoyed) or Y = 0 (slightly annoyed). The probabilities of outcomes as a function of vector X are described by P Y = 1 = π ( X ) and P Y = 0 = 1 π ( X ) , respectively. The multiple logistic regression model is presented in Equation (3).
P Y = 1 = π X = e β 0 + β 1 X 1 + + β p X p 1 + e β 0 + β 1 X 1 + + β p X p   or ln π X 1 π X = β 0 + β 1 X 1 + β 2 X 2 + + β p X p
Probabilities are nonlinear functions of parameters β β 0 , β 1 , β 2 , β p , which are the unknown regression parameters to be estimated from the sample data by maximum likelihood [31]. Further details on obtaining maximum likelihood coefficients β ^ can be found in [30].
One of the methods of interpretation of the estimated parameters in the regression model is the odds ratio (OR), given by Equation (4) [32]. This measure is an effect-size statistic, which allows demonstrating how much a certain variable/characteristic impacts the chances of an event occurring [33]. OR = 1 shows that the explanatory variable does not affect the chances of the outcome (feeling very annoyed by the odor), whereas OR > 1 shows that the explanatory variable increases the chances of the outcome, and OR < 1 shows that the explanatory variable decreases the chances of the outcome [34].
O R ^ = e x p β ^
The logistic regression model’s key assumptions were verified to ensure the validity of the analysis [34]. These include, for example, the independence of observations (ensured by the survey design, in which each participant responded only once) and the absence of multicollinearity among explanatory variables (verified prior to modeling). These verifications support the robustness and reliability of the regression results.

2.2.3. Quality of the Prediction Model

The accuracy or quality of the prediction model is assessed using a classification board, also known as the confusion matrix. This board compares the actual (observed) responses regarding annoyance levels with the values predicted by the model. Essentially, it shows how well the model was able to correctly classify or predict different levels of annoyance, providing insight into the model’s performance. High agreement between observed and predicted values indicates a good model fit. Therefore, the effectiveness of the logistic regression model in predicting odor annoyance levels is evaluated by comparing what it predicted to what people actually reported in the survey.

3. Results

3.1. Sociodemographic Factors

Table 2 presents the demographic characteristics of the respondents for both surveys. The percentage of men and women was similar for both surveys, i.e., there were more females (52%) than males (48%), which was expected due to the regional socio-economic population profile. The percentage of individuals who were employed was 38% in 2019 and 31% in 2022, and the percentage of individuals unemployed was 7% in 2019 and 13% in 2022. During the pandemic period, this increase was expected in many regions. Most respondents were between 25–44 and 45–64 age groups and have at least a high school/secondary and post-secondary education completed, as expected according to the regional socio-economic population profile.

3.2. Perceived Odor and Odor-Related Sources

Table 3 shows the percentage of respondents who reported annoyance by odorous gases, that is, 36% and 26%, respectively, in 2019 and 2022. The percentage of very annoyed people was 29% in 2019 and 20% in 2022.
Given the community’s location, fewer individuals were expected to report annoyance between December and February, when prevailing winds from the north/northeast carry odorant gases from the nearby steel plant away from the residential area. Although wastewater treatment plants and sewage pumping stations are scattered throughout the region, the wind patterns during this period likely decrease the impact of emissions from the steel industry. In addition, it is important to consider that during the pandemic period, industries were forced to decrease their production rate and, therefore, decrease the pollutant emissions [35].
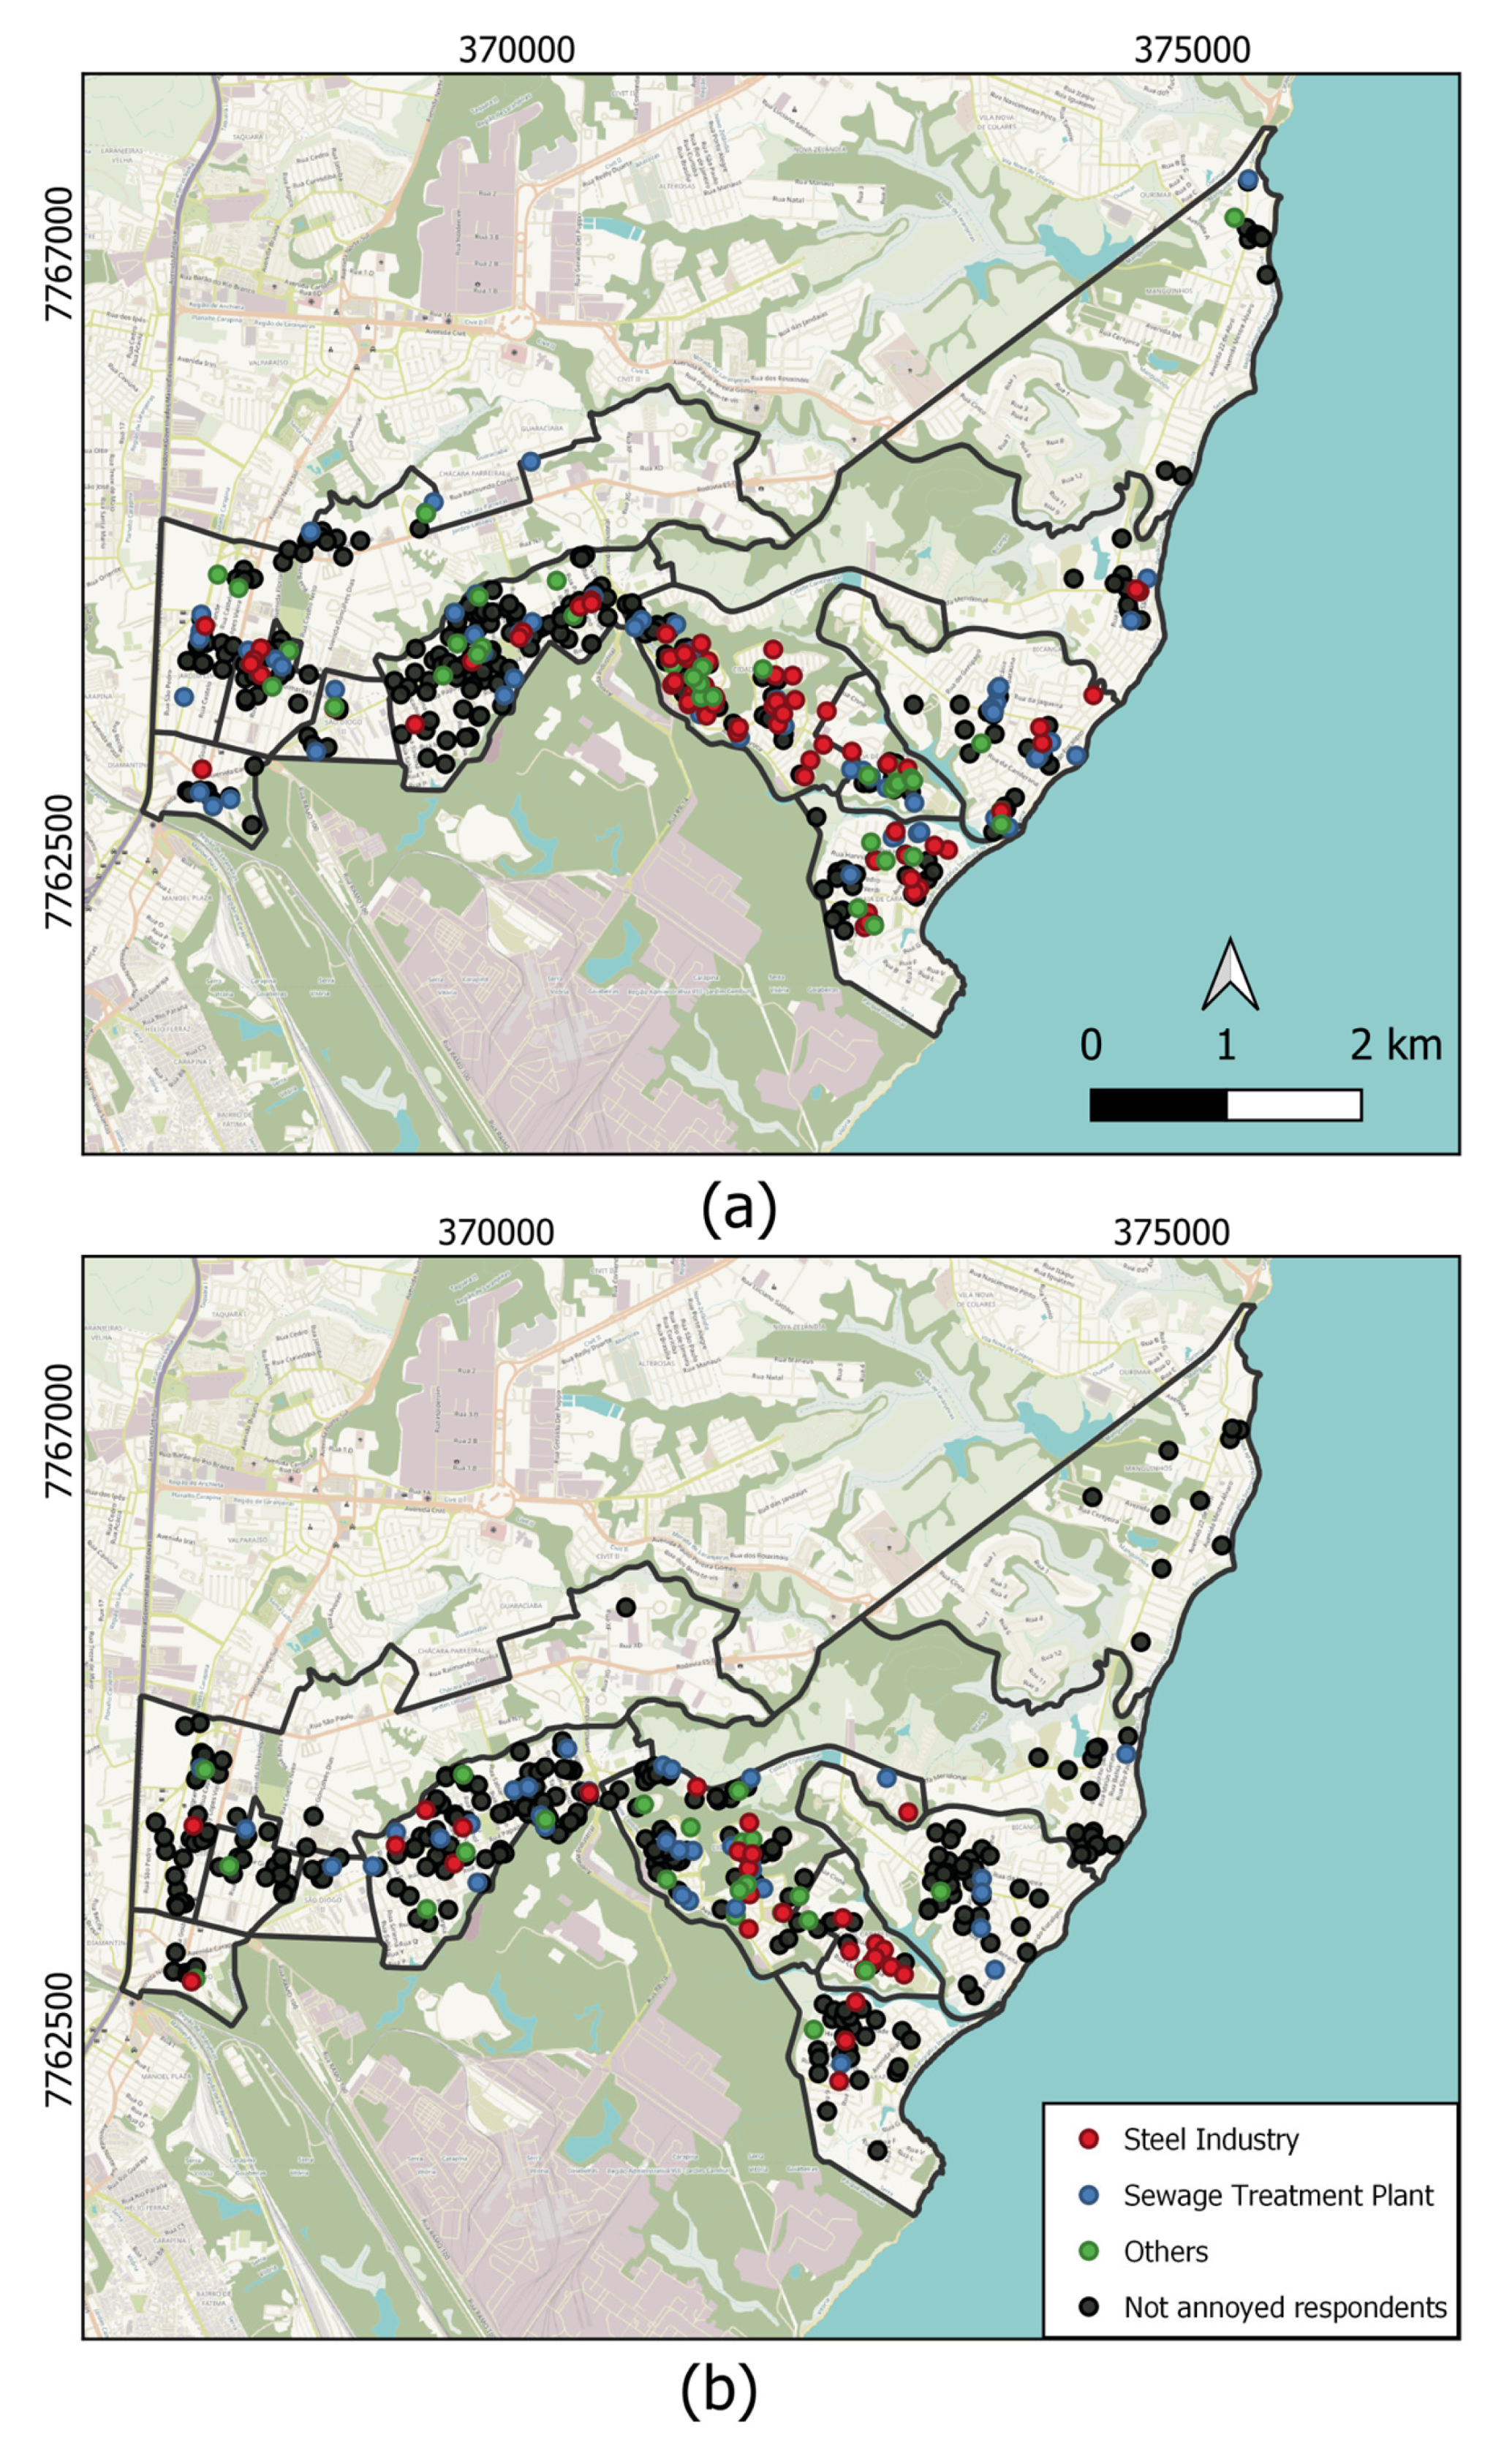
Figure 3 illustrates the spatial distribution of respondents according to their perception of odor sources. Respondents who reported no annoyance are depicted in black, while those who reported annoyance are colored according to the source they identified: red for the steel industry, blue for sewage treatment plants, and green for other sources. In 2019 (Figure 3a), annoyed respondents—especially those attributing the odor to the steel industry—were more concentrated in the southeastern area, whereas in 2022 (Figure 3b), black markers became more prominent, and the perceived sources were more spatially dispersed. This shift in spatial patterns is consistent with seasonal variations in wind direction (Figure 2) and reinforces the relationship between source proximity and odor perception.
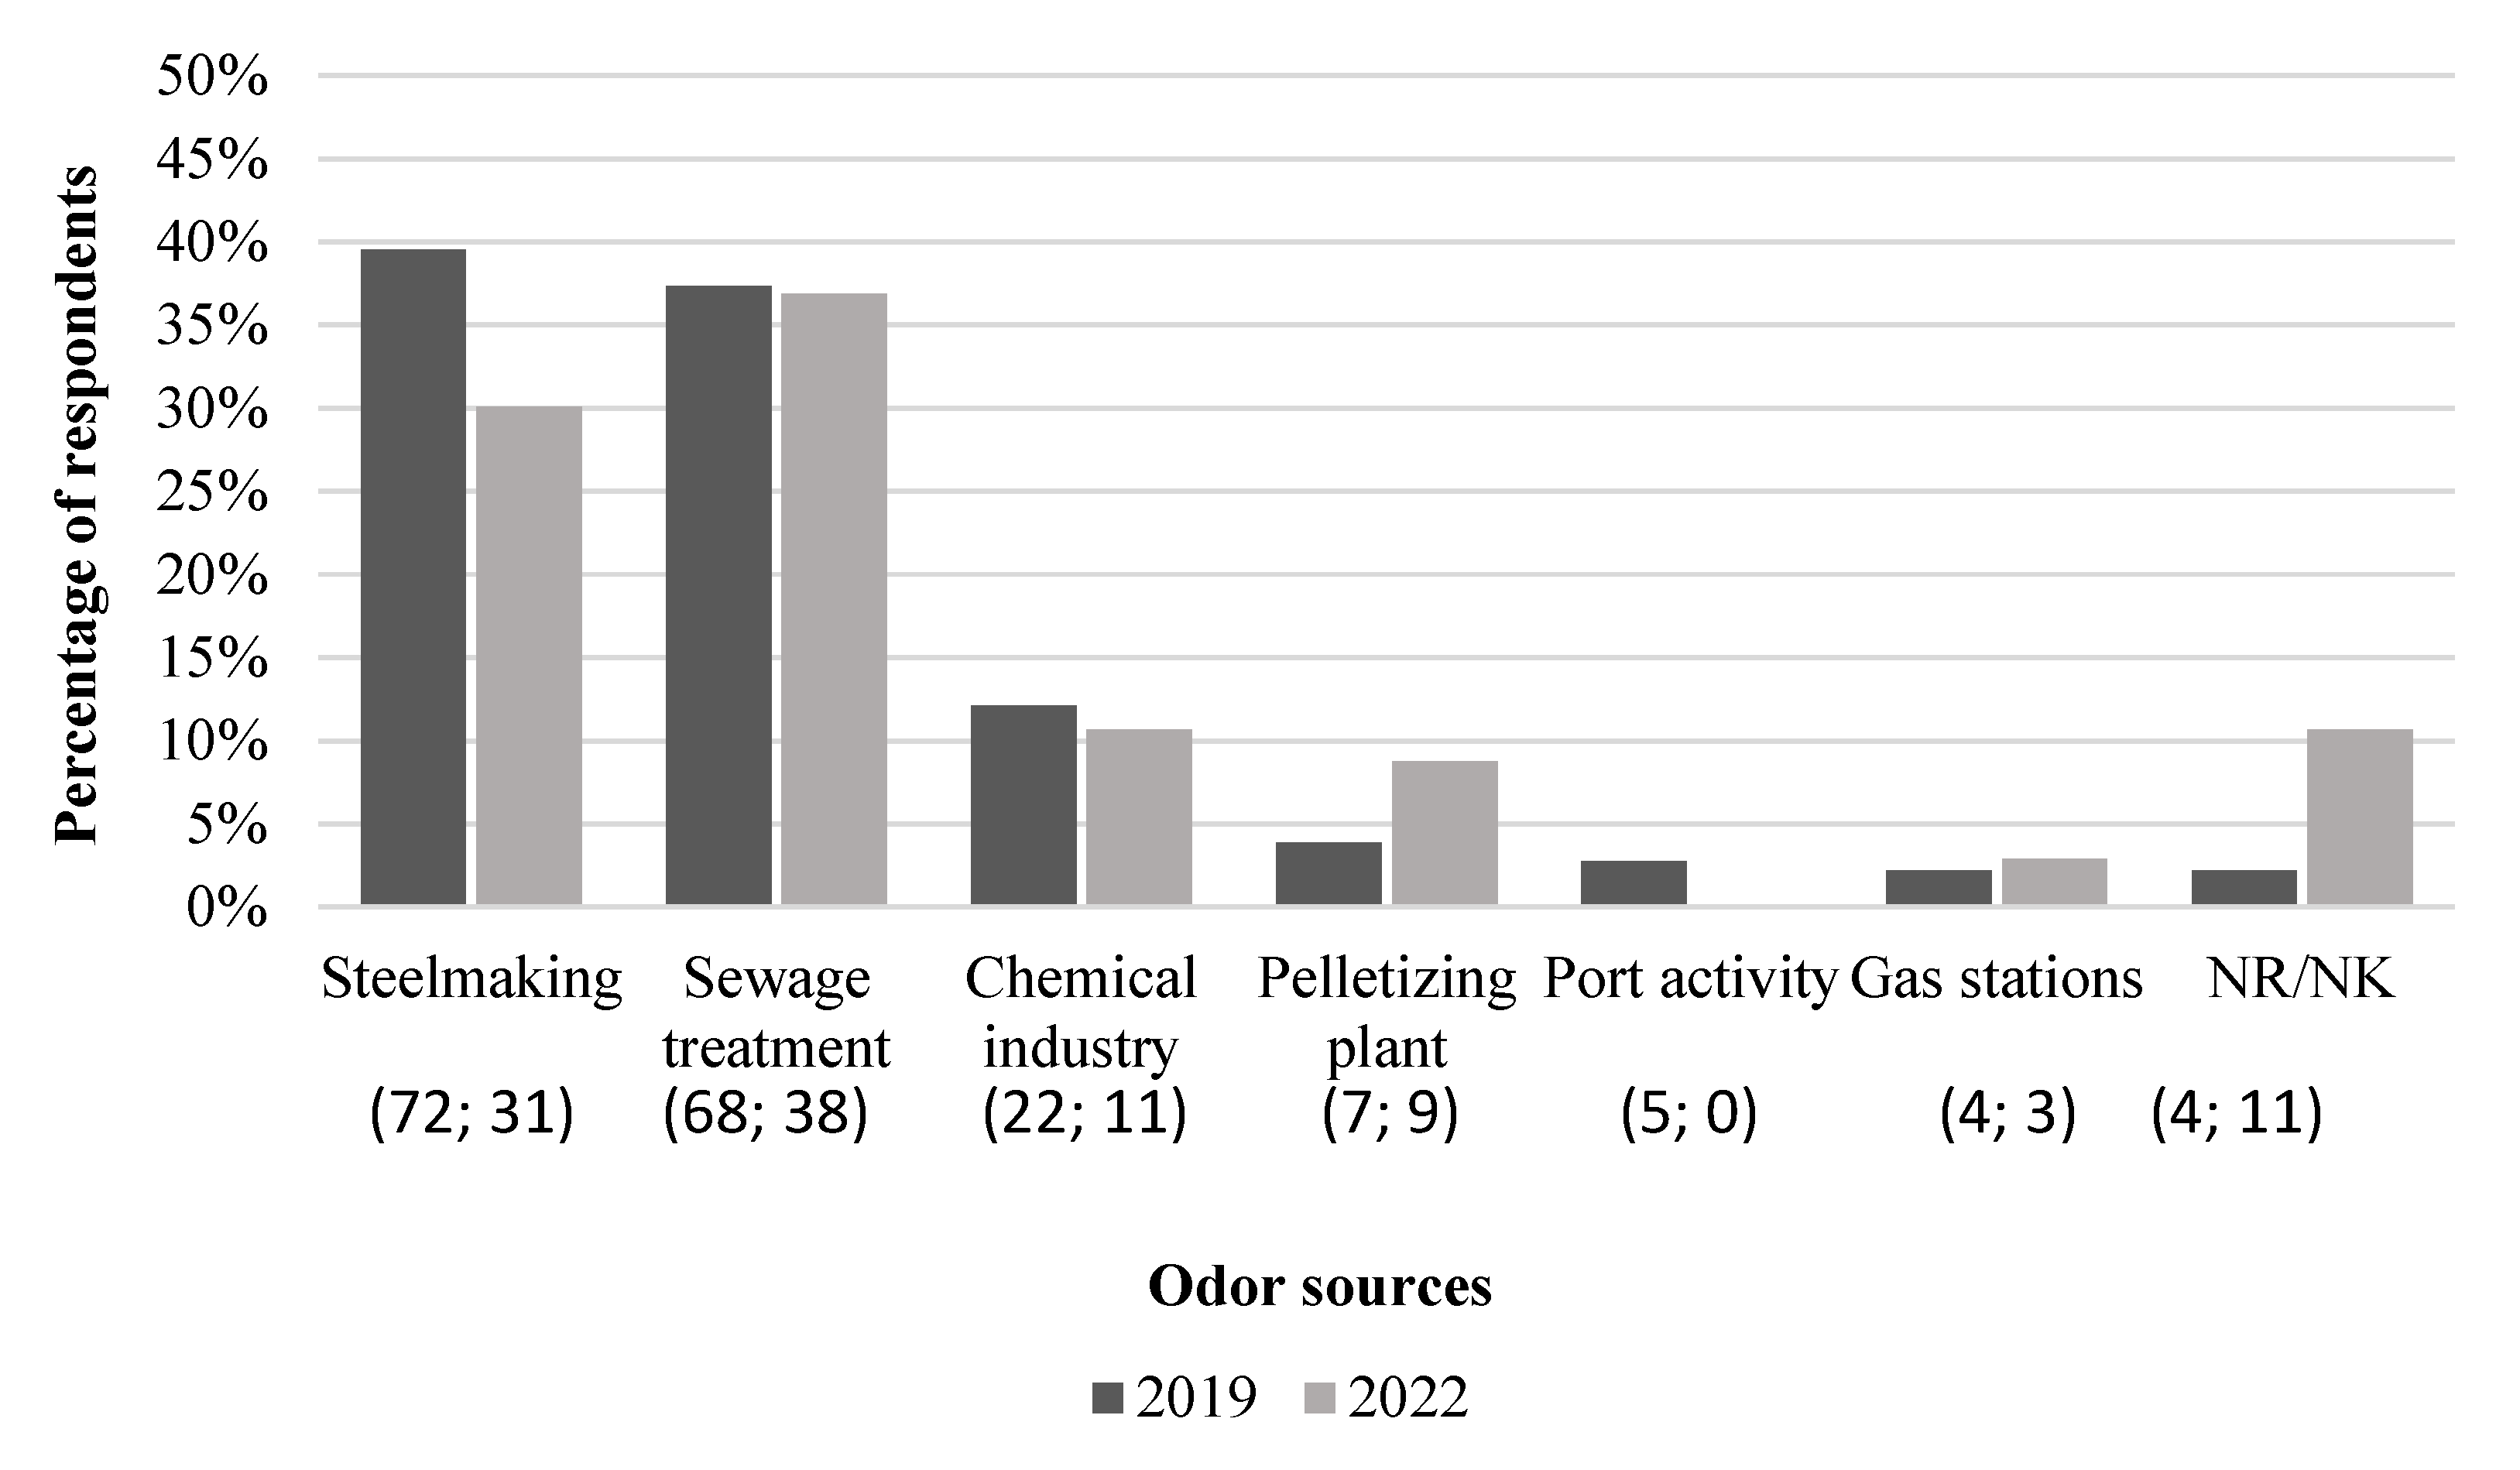
Figure 4 presents the proportional distribution of responses regarding the main sources identified by the community. While the perception of sewage-related sources was stable at 37%, the proportion of respondents attributing odors to the steel industry was lower in 2022. The respondents were more likely to associate odors with the steel industry during the period when prevailing winds blew from the southeast and southwest quadrants (Figure 2).
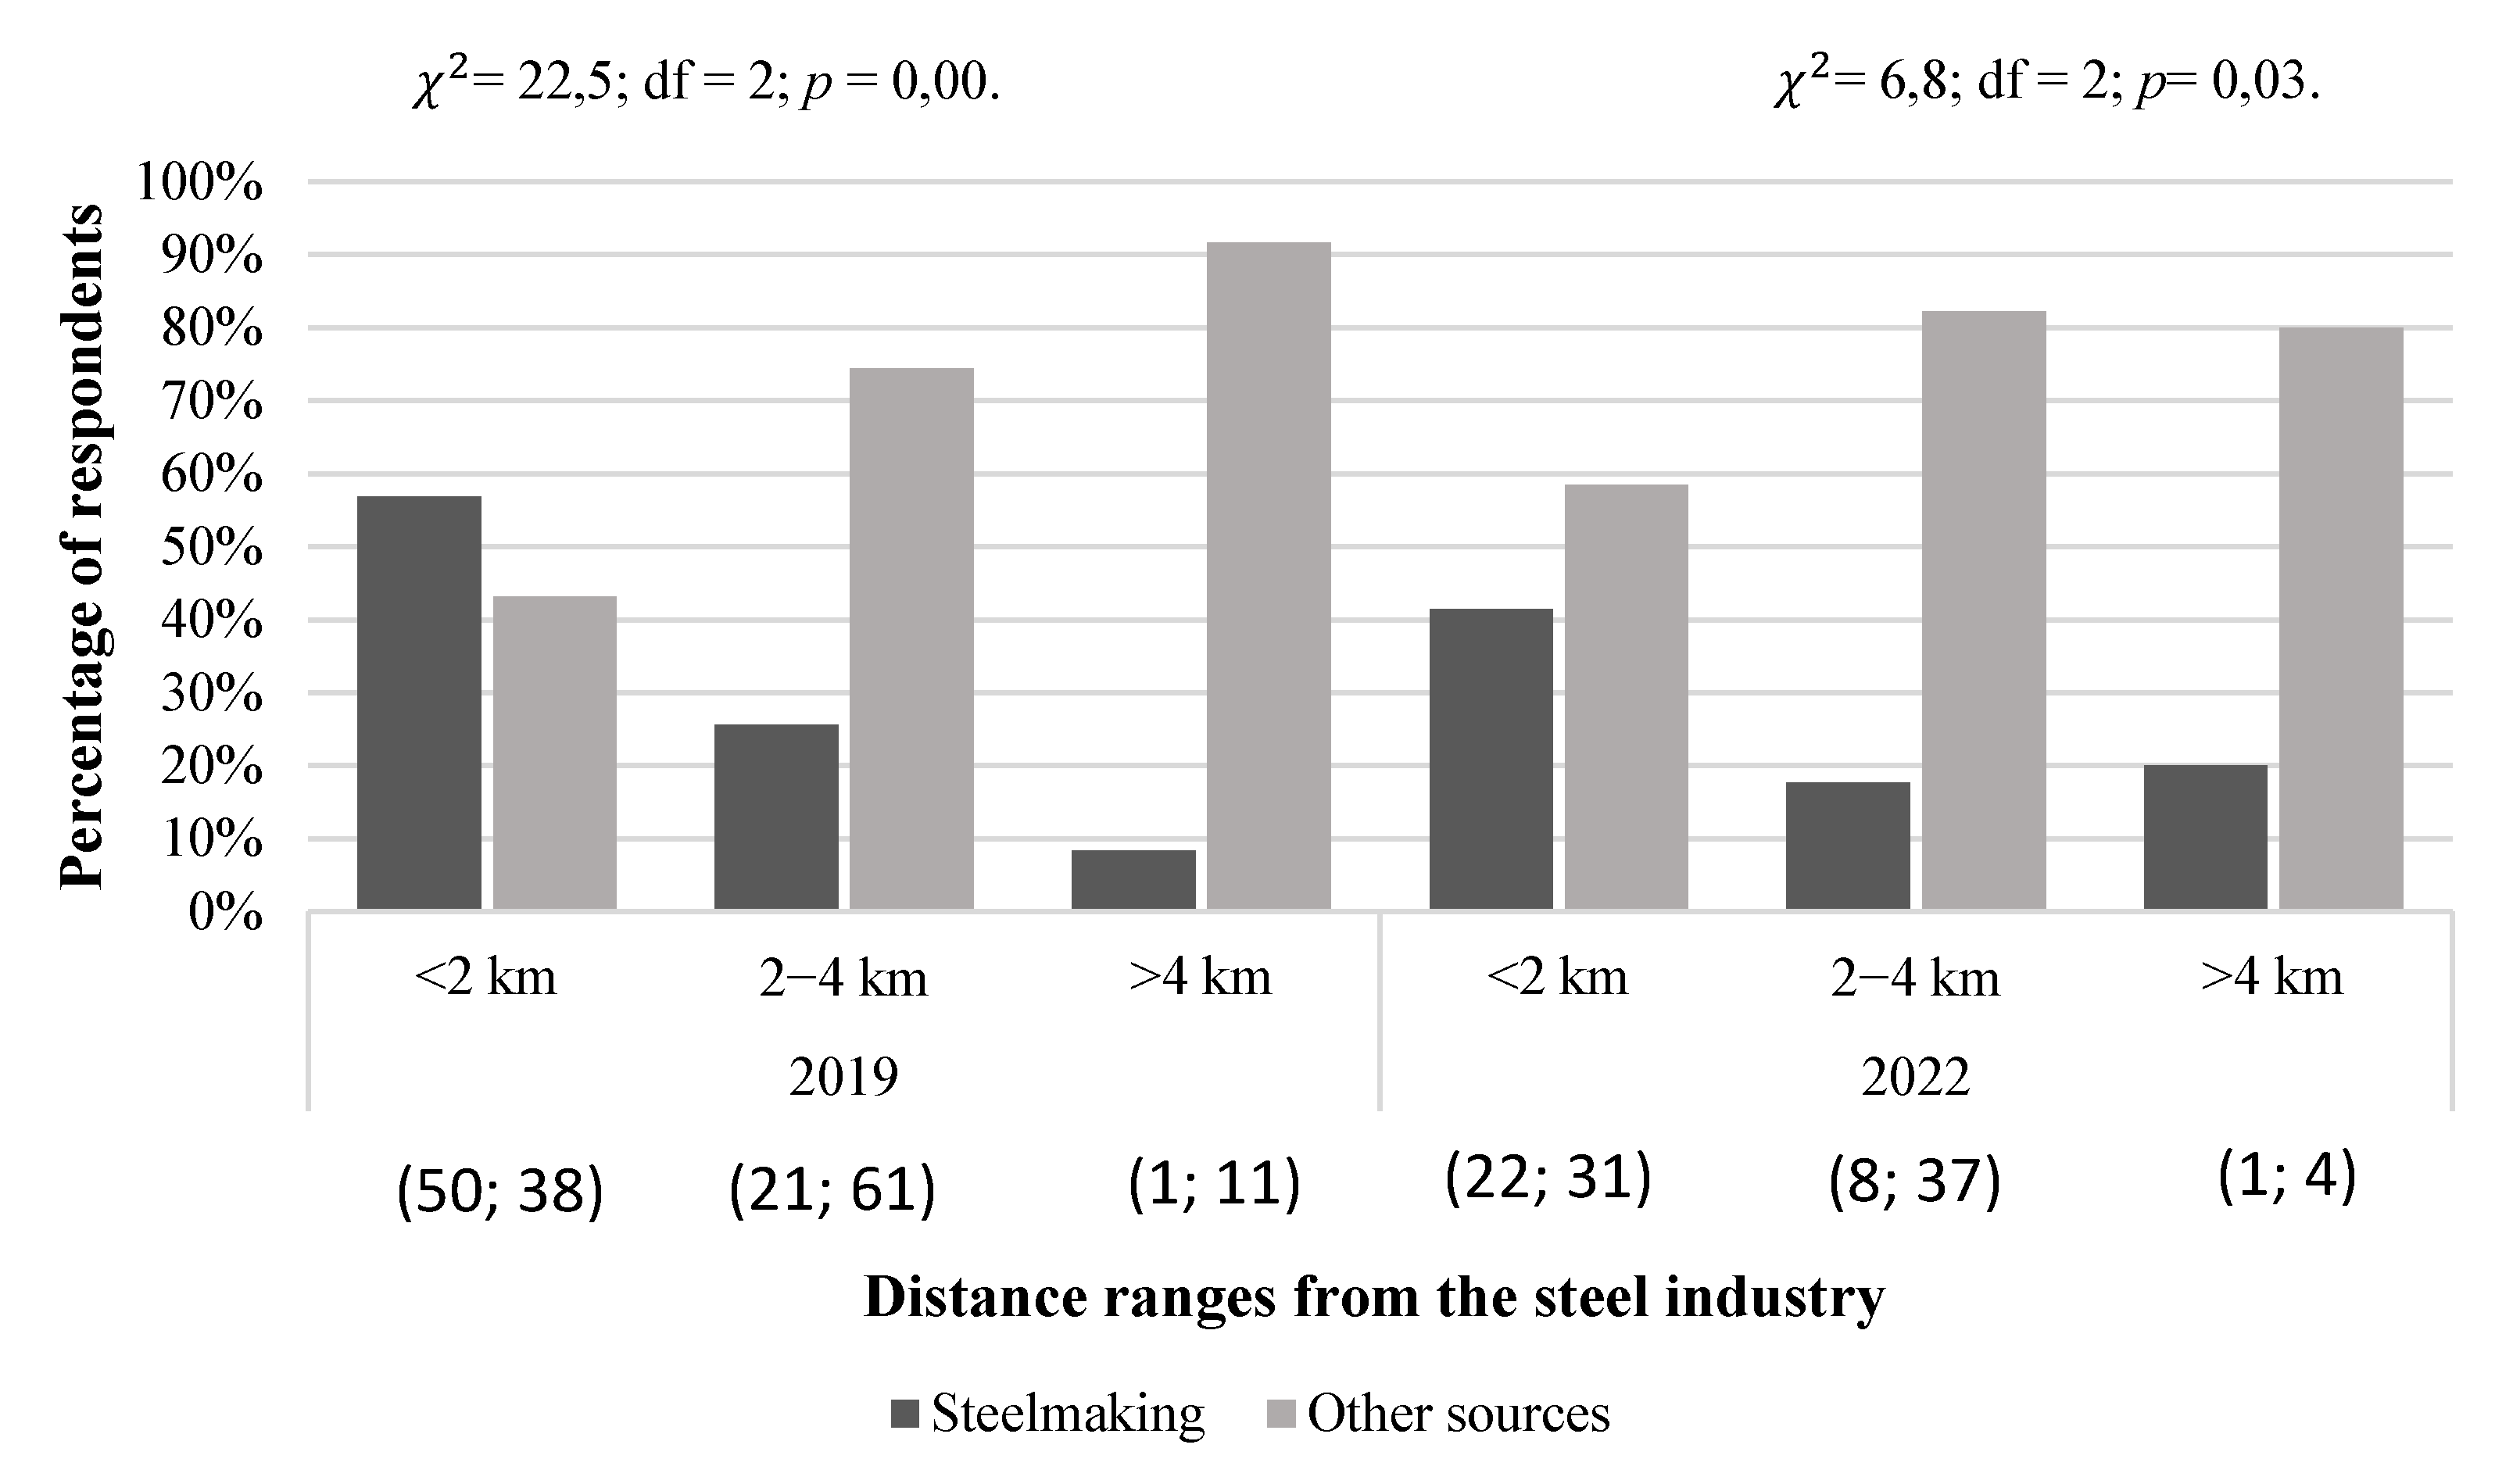
Figure 5 presents the identification of the odor’s source regarding three distance ranges to the steel industry, taken as a reference location, as the sewage treatment plants were dispersedly located in the region. In both surveys, it is possible to observe that the larger the distance from the steel industry, the greater the percentage of other sources of odors cited by the respondents. The Chi-Square test of independence was applied, which confirmed that the responses of the source and the distance were associated in both surveys (p < 0.001 and p = 0.03).
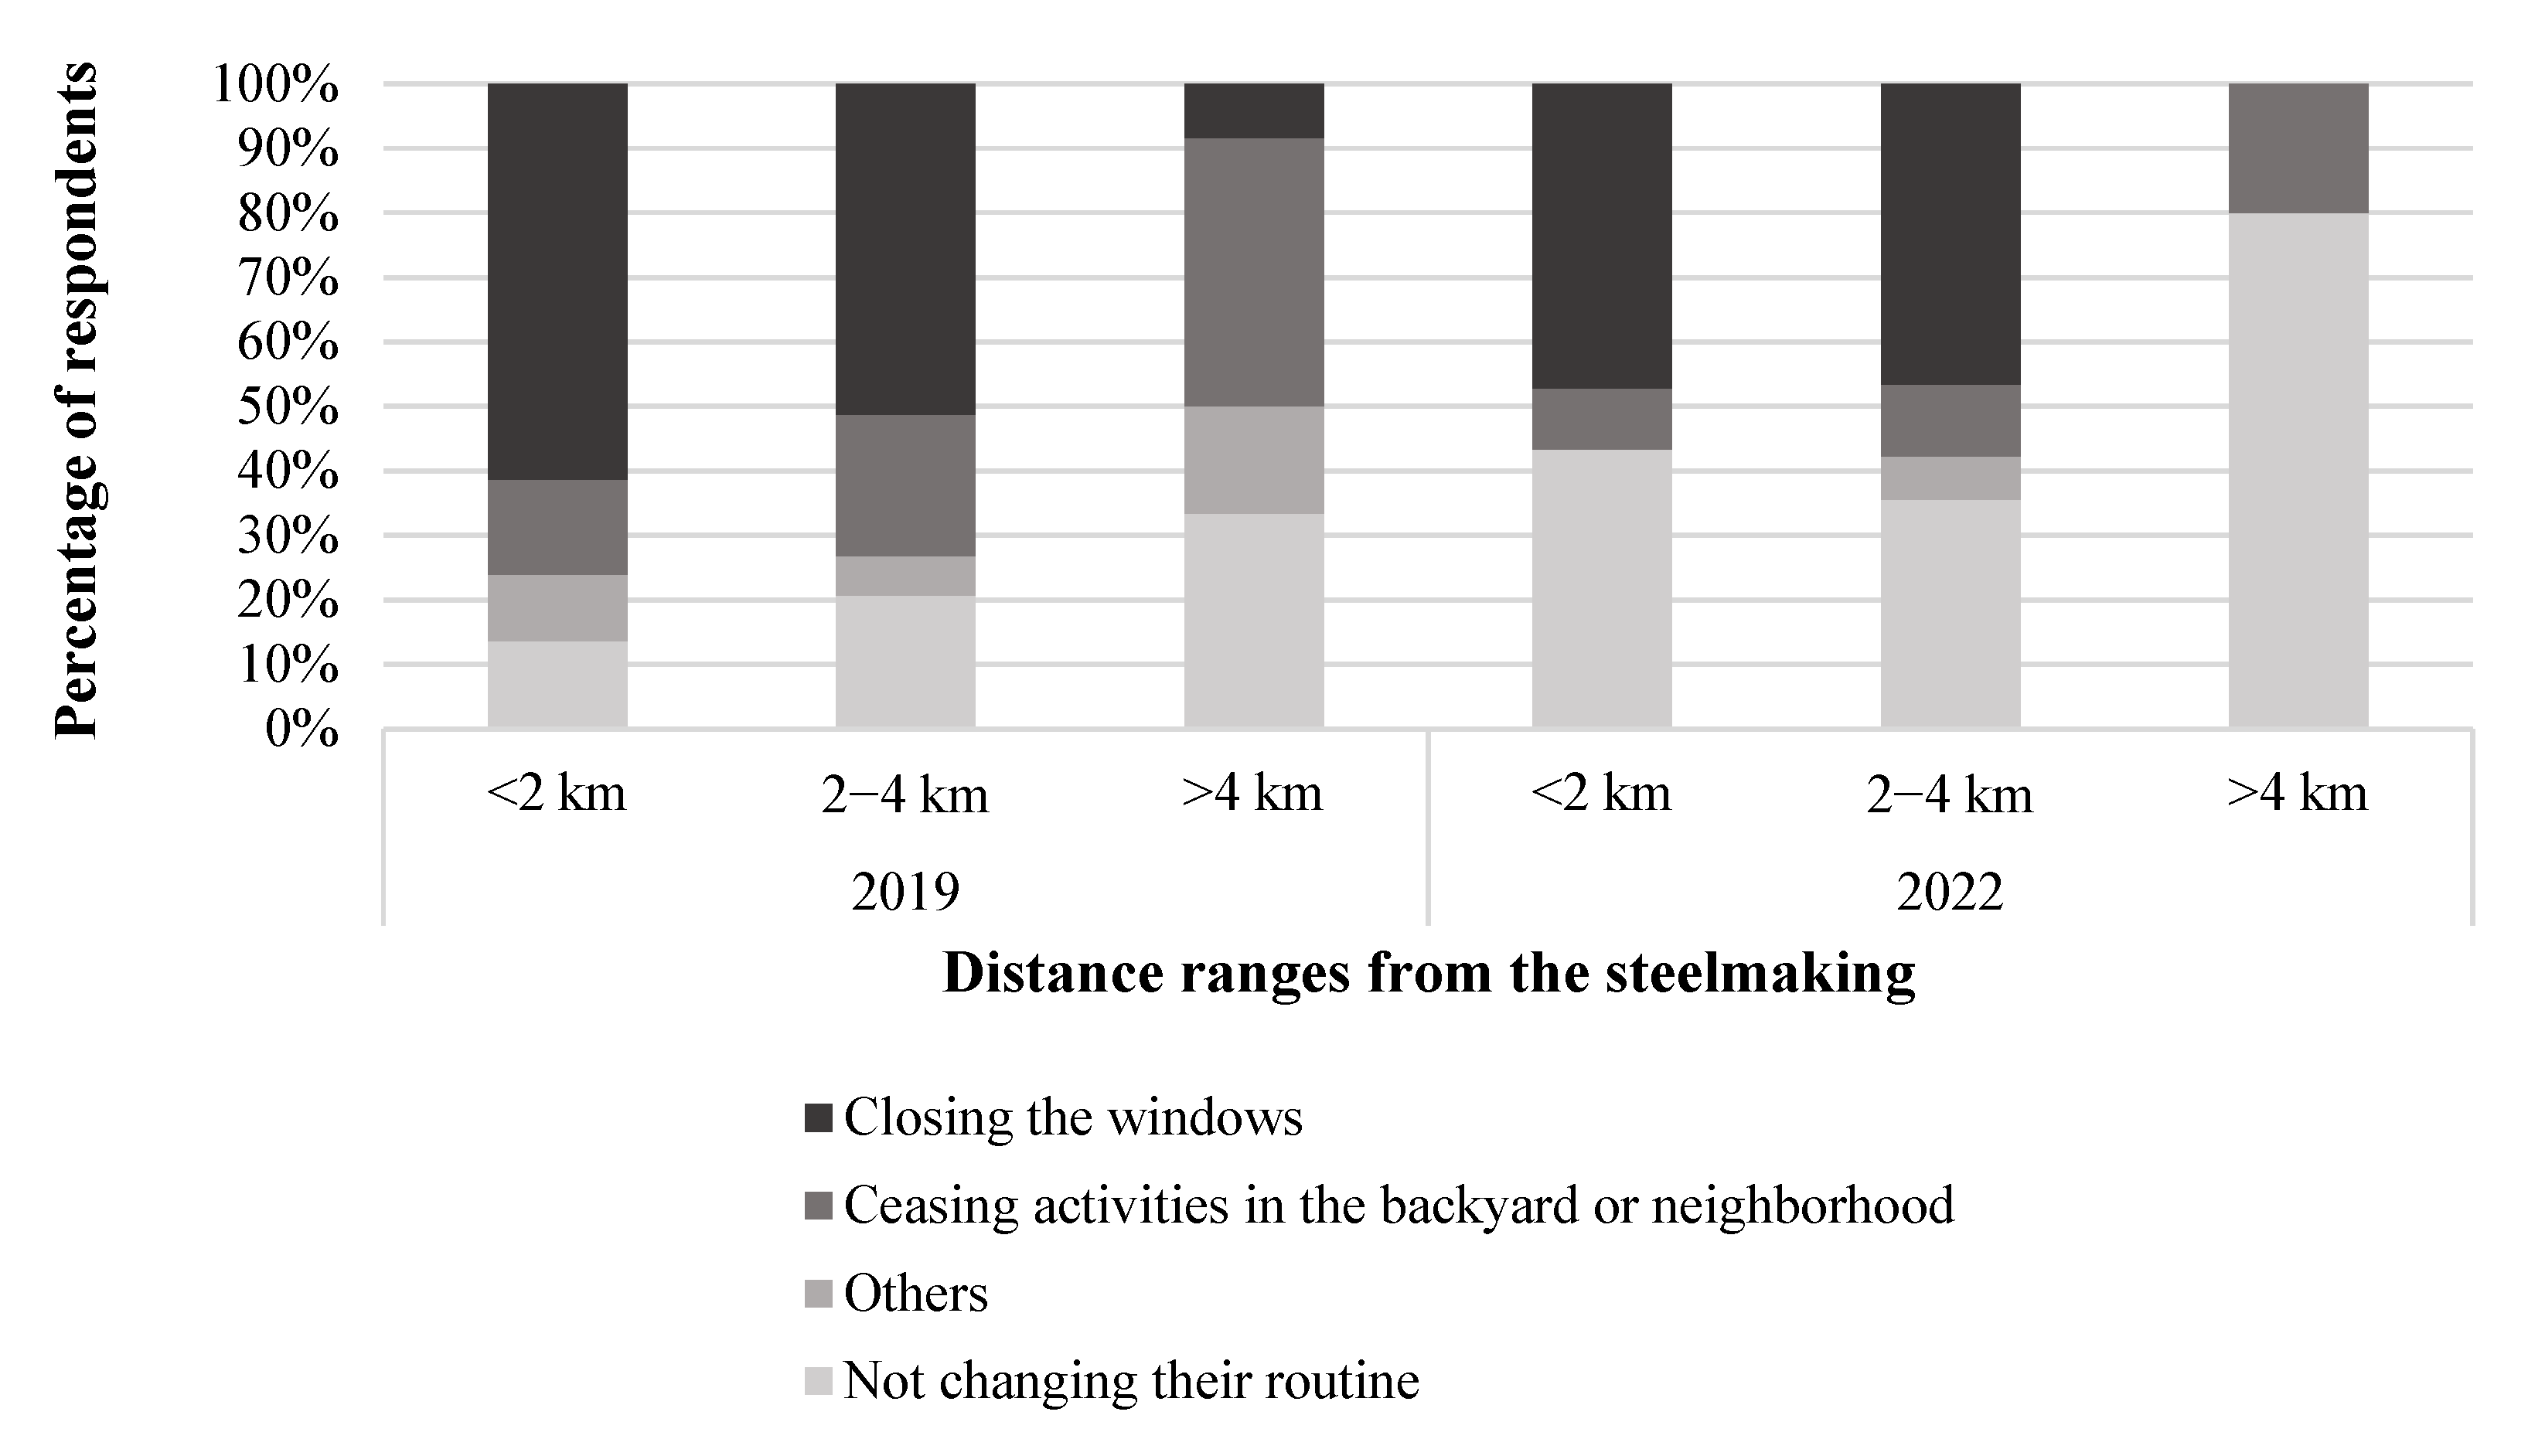
Figure 6 shows the effect of the odor on the respondents’ daily activities according to the distance range from the reference location (steelmaking). The responses are consistent with the results presented in Figure 5. In both surveys, the majority of the respondents located in the first distance range reported “closing the windows to avoid perceived odor” (as their first choice). Other effects mentioned as the first option by respondents were “failing to do activities in the backyard or in the neighborhood,” such as not going to the bakery and not performing gardening or social activities, such as a barbecue.

3.3. Determination of the Odds Ratio for the Explanatory Variables of Odor Perception

Table 4 shows the Chi-Square test for both surveys, considering the respondents who reported feeling annoyed and perceived odors. The explanatory variables in Table 4 were selected to be included in the multiple logistic regression model, regarding the dichotomized degree of annoyance as a response. Observations with missing data, identified as missing at random (MAR), were excluded from the analyses. For each explanatory variable, the estimated OR and respective 95% confidence intervals (CIs) were calculated.
In 2019, the statistically significant variables were perception of air pollution related to dust presence and loss of visibility, as well as being a woman and having self-reported respiratory problems in the previous six months. In 2022, the variables associated with odor perception were the frequency with which one senses sewage smell, age, and having self-reported respiratory problems in the previous six months. The only common explanatory variable between the two surveys is related to participants’ self-reported respiratory problems.
Although age was associated with high levels of annoyance in the 2022 survey, it showed no impact on the increasing chances of annoyance due to odor. The OR suggests that with increasing age, the chances of being very annoyed by odors are lower; however, this relationship was only found for one age group, in which individuals between 45 and 54 years old reported feeling less annoyed.
Table 5 presents the confusion matrix used to assess the accuracy of the logistic regression model’s predictions. The target category of interest is the “very annoyed” category, considered as the positive class, and the “slightly annoyed” category is considered as the negative class. True positive (TP) and true negative (TN) results represent the responses that were correctly classified by the model. True positive occurs when the model correctly classifies a response in the “very annoyed” category, and true negative correctly classifies as “slightly annoyed.” However, false positives (FPs) and false negatives (FNs) show that the classification was incorrectly predicted by the model. A false positive occurs when an answer is incorrectly classified as “very annoyed” and the false negative is classified as “slightly annoyed”. The overall precision of the model (accuracy) is given by the total number of correctly classified responses (TN + TP) divided by the total number of observations [36]. The cutoff value for classifying predicted responses was set at 0.5 (i.e., when the probability is equal to at least 0.5, the response is classified as 1 = positive class).
Both models correctly classified annoyance level responses in over 90% of the cases.

4. Discussion

4.1. Influence of Meteorological Conditions

The differences observed between the 2019 and 2022 surveys can be partly explained by the prevailing wind directions during the study periods. In 2019, southerly winds carried emissions from the steel plant toward the community, increasing reports of annoyance. In 2022, northeasterly winds prevailed, and the impact of steel industry emissions on the community was lower (Figure 2). Similar patterns have been documented in the same metropolitan region, where reports of annoyance due to particulate matter also coincided with periods of stronger wind direction influence [37,38]. These results reinforce that meteorological conditions are a key driver of odor perception and annoyance and must be considered in community-based studies.

4.2. Source Identification and Proximity

Distance-stratified results (Figure 5), together with the map inspection of respondents’ locations (Figure 3), indicate that proximity to the steel plant influenced both source attribution and reported annoyance. In 2019, annoyance was concentrated in the southeastern area, where respondents more often attributed odors to the steel industry. In 2022, sources cited were more dispersed, reflecting the wind direction influence (Figure 2). The Chi-Square test confirmed the association between distance and perceived source (2019: p < 0.001; 2022: p = 0.03). These results are consistent with previous studies showing that distance to emission sources is a determinant of odor perception and annoyance [17,19,28].
Reported impacts on daily routine included closing windows, avoiding outdoor activities, and limiting social gatherings. Similar findings have been described in other studies, where respondents reported not hanging laundry, avoiding gardening, and interrupting recreational or social activities due to odor exposure [19,39]. These results demonstrate that odorous pollution can significantly interfere with daily routines and well-being.

4.3. Role of Explanatory Variables on Odor-Related Annoyance

The relationship between odor annoyance and self-reported health effects may be explained by several factors. Individuals with pre-existing respiratory conditions may be more aware of ambient air quality [40], and their knowledge of pollution sources and potential health risks may amplify the occurrence of health symptoms [41].
In the 2019 survey, individuals with self-reported respiratory problems had an OR of 1.8 for being extremely annoyed by odors compared to those without such conditions. In 2022, this association was even stronger, with an OR of 3.37, potentially influenced by heightened health sensitivity following the COVID-19 pandemic. A similar study showed that individuals who rated their health as “poor” were twice as likely to feel uncomfortable with odors [28]. In the context of particulate matter, an increased likelihood of annoyance (OR = 1.2) was also observed among individuals with health problems [37]. These findings underscore the significant role of respiratory health in shaping the perception of odorous pollution and suggest that pre-existing conditions are key associated factors in odor-related annoyance.
It is important to note that our statistical design does not establish causality between odor exposure and health effects. Nevertheless, external evidence supports such causal relationships. For instance, prolonged exposure to odorous mixtures has been linked to chronic health conditions such as asthma, dermatitis, and neurological impacts [5]. In addition, a systematic review and meta-analysis confirmed increased risks of headache, nausea, and cough among exposed communities [2].
In 2019, the perception of pollutants related to dust and reduced visibility can be attributed to the prevailing wind direction during the survey period—southerly winds that carried emissions from the steel industrial site toward the residential area. Reports of annoyance due to particulate matter originating from industrial activities in the same metropolitan region have been documented in the literature [37,38]. Individuals who reported being annoyed by dust were approximately 2.8 times more likely to be extremely annoyed by odor. In contrast, in 2022, the frequency of sewage odor emerged as a significant explanatory variable for odor annoyance. People who perceive sewage odor in the region have 1.3 times more chance to feel annoyed. During this period, the prevailing winds blew emissions from the steel industrial site away from the community, thereby reducing its impact. Consequently, odors from local sewage treatment facilities and pumping stations had a more pronounced effect on residents’ perception of air quality.
An interesting finding is that in 2019, gender (female) emerged as a significant explanatory variable, whereas this was not the case in 2022. Notably, in 2019, the highest odds ratio (OR = 2.88) was associated with the covariate “woman.” Higher levels of annoyance from air pollution among women, compared to men, have also been reported in previous research [37,38,39,42]. A likely explanation for the difference between the two surveys may involve cultural norms and the impact of the pandemic. In the local context, women are traditionally the primary homemakers and tend to be more concerned with household welfare, spending more time at home. However, during the pandemic, the entire population was largely confined to their homes, which may have reduced gender-based differences in exposure or perception. It is therefore crucial to consider the influence of social and cultural factors, as well as seasonal or climatic conditions, when analyzing explanatory variables across different time periods or regions.
The accuracy of the adjusted models was satisfactory compared to other studies that also applied logistic regression for prediction [17,19]. A regression model used to predict annoyance levels due to odors achieved an 84.7% correct classification rate in one study [17]. In another, the estimated accuracy was 87%, with 96% of correct predictions for “no” and 56.7% for “yes” [19].

4.4. Methodological Limitations

Certain methodological limitations must be recognized in relation to the design and scope of this study. The length of the questionnaire restricted the inclusion of additional explanatory variables, as it was already extensive (23 items) for a face-to-face survey conducted at participants’ residences. To minimize selection bias, interviews were performed randomly. Furthermore, the approach to odor source identification was based solely on self-reported perception, which can lead to misattribution in an area with multiple emission sources. The study design also did not allow us to capture differences in individual local exposure, and monitoring data that could support this type of analysis were not available. However, the main objective of this research was to evaluate community perception under real living conditions, rather than using trained panels or sensory experts. Within this scope, self-reported perception provides valuable insights into how residents experience and interpret odorous pollution in their daily lives. Despite these limitations, the statistical methods applied were robust and appropriate for the research objectives.
Future studies should consider using Geographically Weighted Regression (GWR) to better associate participants’ residential locations with reported perceived sources. Additionally, focusing on a smaller study area would allow for the training of participants using sniffing sticks or other sensory evaluation methods.

5. Conclusions

This study identified key factors associated with odor-related perception in two seasonal community surveys conducted in southern Brazil. Odor annoyance was more frequently reported in 2019 than in 2022, and steel plant emissions together with sewage-related sources were consistently perceived as the main contributors. Proximity to the steel plant strongly influenced both source attribution and annoyance levels, while self-reported respiratory problems emerged as the most consistent predictor of higher annoyance across both surveys.
These findings emphasize the need to integrate meteorological conditions, source proximity, and health indicators when assessing odor impacts. They also suggest the importance of further specifying the types of respiratory conditions reported and of considering additional variables—such as housing ownership or tenancy status—to better explain odor-related perception in the studied region.
This research is particularly vital for regions with similar issues, such as industrialized and port areas, which often face frequent odor-related complaints without systematic ways to connect perceptions to sources and environmental conditions. By moving beyond anecdotal evidence, this study provides an evidence-based framework for environmental managers and regulatory bodies to design targeted interventions that improve air quality and, ultimately, the quality of life for affected residents.

Supplementary Materials

The following supporting information can be downloaded at https://www.mdpi.com/article/10.3390/atmos16101176/s1, S1 = Questionnaire.

Author Contributions

Conceptualization, J.M.S., M.M. and F.R.C.; methodology, J.M.S., M.M., V.A.R. and A.P.d.L.; formal analysis, F.R.C.; data curation, B.F., E.V.G., N.C.R.J. and S.F.; writing—original draft preparation, F.R.C., J.M.S. and M.M.; writing—review and editing, N.C.R.J. All authors have read and agreed to the published version of the manuscript.

Funding

This research received financial support from CNPq (National Council for Scientific and Technological Development), CAPES (Coordination for the Improvement of Higher Education Personnel) and FAPES (Foundation to Support Research and Innovation of the State of Espírito Santo).

Informed Consent Statement

Informed consent was obtained from all subjects involved in the study.

Data Availability Statement

Data will be provided upon request.

Acknowledgments

The results presented here are part of the Master’s thesis of the first author under the supervision of Jane M. Santos, Valderio A. Reisen and Milena M. in the Department of Environmental Engineering at the Federal University of Espirito Santo in 2023. The authors would like to thank CNPq (National Council for Scientific and Technological Development), CAPES (Coordination for the Improvement of Higher Education Personnel), and FAPES (Foundation to Support Research and Innovation of the State of Espírito Santo), which are Brazilian governmental agencies for technology development and scientific research, for their financial support. The authors would also like to thank Paulo Roberto Prezotti Filho from the Federal Institute of Education, Science and Technology of Espirito Santo (IFES) for his support in the statistical analysis.

Conflicts of Interest

The authors declare no conflicts of interest.

References

  1. Bokowa, A.; Diaz, C.; Koziel, J.A.; McGinley, M.; Barclay, J.; Schauberger, G.; Guillot, J.M.; Sneath, R.; Capelli, L.; Zorich, V.; et al. Summary and overview of the odour regulations worldwide. Atmosphere 2021, 12, 206. [Google Scholar] [CrossRef]
  2. Guadalupe-Fernandez, V.; De Sario, M.; Vecchi, S.; Bauleo, L.; Michelozzi, P.; Davoli, M.; Ancona, C. Industrial odour pollution and human health: A systematic review and meta-analysis. Environ. Health 2021, 20, 108. [Google Scholar] [CrossRef] [PubMed]
  3. Herz, R.S. The role of odor-evoked memory in psychological and physiological health. Brain Sci. 2016, 6, 22. [Google Scholar] [CrossRef]
  4. Kurian, S.M.; Naressi, R.G.; Manoel, D.; Barwich, A.S.; Malnic, B.; Saraiva, L.R. Odor coding in the mammalian olfactory epithelium. Cell Tissue Res. 2021, 383, 445–456. [Google Scholar] [CrossRef]
  5. Piccardo, M.T.; Geretto, M.; Pulliero, A.; Izzotti, A. Odor emissions: A public health concern for health risk perception. Environ. Res. 2022, 204, 112121. [Google Scholar] [CrossRef]
  6. Zhang, Q.; Ruan, S.; Zhang, R.; Zhashiquzong Wu, W. Odor nuisance, environmental impact and health risk of priority-controlled VOCs generated from three decentralized aerobic biological modes in treating rural perishable waste. Environ. Sci. Pollut. Res. 2025, 32, 11040–11051. [Google Scholar] [CrossRef] [PubMed]
  7. Sucker, K.; Berresheim, H.; Ramcke-Krüll, H.; Schulze, P.; Brüning, T.; Bünger, J. Approach to characterize a sub-group susceptible to odour annoyance. Chem. Eng. Trans. 2011, 23, 99–104. [Google Scholar] [CrossRef]
  8. Conti, C.; Guarino, M.; Bacenetti, J. Measurements techniques and models to assess odor annoyance: A review. Environ. Int. 2020, 134, 105261. [Google Scholar] [CrossRef]
  9. Berglund, B.; Berglund, U.; Lindvall, T. Measurement and control of annoyance. Dev. Toxicol. Environ. Sci. 1987, 15, 29–43. [Google Scholar]
  10. Van Harreveld, A.P. From odorant formation to odour nuisance: New definitions for discussing a complex process. Water Sci. Technol. 2001, 44, 9–15. [Google Scholar] [CrossRef]
  11. Lindvall, T.; Radford, E.P. Measurement of annoyance due to exposure to environmental factors: The fourth Karolinska institute symposium on environmental health. Environ. Res. 1973, 6, 1–36. [Google Scholar] [CrossRef] [PubMed]
  12. World Health Organization—WHO. Life in the 21st century: A Vision for all. In The World Health Report; WHO: Geneva, Switzerland, 1998. [Google Scholar]
  13. Zhang, Y.; Yang, W.; Schauberger, G.; Wang, J.; Geng, J.; Wang, G.; Meng, J. Determination of dose–response relationship to derive odor impact criteria for a wastewater treatment plant. Atmosphere 2021, 12, 371. [Google Scholar] [CrossRef]
  14. Blanes-Vidal, V.; Suh, H.; Nadimi, E.S.; Løfstrøm, P.; Ellermann, T.; Andersen, H.V.; Schwartz, J. Residential exposure to outdoor air pollution from livestock operations and perceived annoyance among citizens. Environ. Int. 2012, 40, 44–50. [Google Scholar] [CrossRef]
  15. Egondi, T.; Kyobutungi, C.; Ng, N.; Muindi, K.; Oti, S.; van de Vijver, S.; Ettarh, R.; Rocklöv, J. Community perceptions of air pollution and related health risks in Nairobi slums. Int. J. Environ. Res. Public Health 2013, 10, 4851–4868. [Google Scholar] [CrossRef] [PubMed]
  16. Hayes, J.E.; Stevenson, R.J.; Stuetz, R.M. The impact of malodour on communities: A review of assessment techniques. Sci. Total Environ. 2014, 500, 395–407. [Google Scholar] [CrossRef]
  17. Luginaah, I.N.; Taylor, S.M.; Elliott, S.J.; Eyles, J.D. Community reappraisal of the perceived health effects of a petroleum refinery. Soc. Sci. Med. 2002, 55, 47–61. [Google Scholar] [CrossRef]
  18. Claeson, A.S.; Lidén, E.; Nordin, M.; Nordin, S. The role of perceived pollution and health risk perception in annoyance and health symptoms: A population-based study of odorous air pollution. Int. Arch. Occup. Environ. Health 2013, 86, 367–374. [Google Scholar] [CrossRef]
  19. Hayes, J.E.; Stevenson, R.J.; Stuetz, R.M. Survey of the effect of odour impact on communities. J. Environ. Manag. 2017, 204, 349–354. [Google Scholar] [CrossRef]
  20. Santos, J.M.; Reis, N.C., Jr.; Galvão, E.S.; Silveira, A.; Goulart, E.V.; Lima, A.T. Source apportionment of settleable particles in a mining-impacted urban and industrialized region in Brazil. Environ. Sci. Pollut. Res. 2017, 24, 22026–22039. [Google Scholar] [CrossRef]
  21. Monticelli, D.F.; Furieri, B.; Lavor, V.F.; Goulart, E.V.; Santos, J.M.; Reis, N.C., Jr.; Galvão, E.S.; Lopes, E.; Melo, M.M. Odorous compounds emissions in an urban and industrialized area. In Proceedings of the OLORES19 Conference, Santiago, Chile, 6–9 October 2020. [Google Scholar]
  22. World Meteorological Organization (WMO). Guide to Instruments and Methods of Observation (WMO-No. 8); Volume I—Measurement of Meteorological Variables; World Meteorological Organization (WMO): Geneva, Switzerland, 2021. [Google Scholar]
  23. Machado, M.; Santos, J.M.; Reisen, V.A.; Reis, N.C.; Mavroidis, I.; Lima, A.T. A new methodology to derive settleable particulate matter guidelines to assist policymakers on reducing public nuisance. Atmos. Environ. 2018, 182, 242–251. [Google Scholar] [CrossRef]
  24. Cochran, W.G. Sampling Techniques, 3rd ed.; Wiley: New York, NY, USA, 1977; ISBN 047116240X. [Google Scholar]
  25. Morettin, P.A.; Bussab, W.O. Estatística Básica, 6th ed.; Editora Saraiva: São Paulo, Brazil, 2010. [Google Scholar]
  26. Barnett, V. Sample Survey: Principles and Methods, 3rd ed.; Wiley: Chichester, UK, 2002; ISBN 9780470685907. [Google Scholar]
  27. Rotko, T.; Oglesby, L.; Künzli, N.; Carrer, P.; Nieuwenhuijsen, M.J.; Jantunen, M. Determinants of perceived air pollution annoyance and association between annoyance scores and air pollution (PM2. 5, NO2) concentrations in the European EXPOLIS study. Atmos. Environ. 2002, 36, 4593–4602. [Google Scholar] [CrossRef]
  28. Wroniszewska, A.; Zwoździak, J. Odor annoyance assessment by using logistic regression on an example of the municipal sector. Sustainability 2020, 12, 6102. [Google Scholar] [CrossRef]
  29. Agresti, A. An introduction to Categorical Data Analysis, 2nd ed.; Wiley: New York, NY, USA, 2007. [Google Scholar]
  30. Abraham, B.; Ledolter, J. Introduction to Regression Modeling; Thomson Brooks/Cole: New Jersey, NJ, USA, 2006. [Google Scholar]
  31. Hosmer, D.W., Jr.; Lemeshow, S.; Sturdivant, R.X. Applied Logistic Regression; John Wiley & Sons: New Jersey, NJ, USA, 2013. [Google Scholar] [CrossRef]
  32. Baxter, L.; Finch, S.; Lipfert, F.; Yu, Q. Comparing estimates of the effects of air pollution on human mortality obtained using different regression methodologies. Risk Anal. 1997, 17, 273–278. [Google Scholar] [CrossRef] [PubMed]
  33. McHugh, M.L. The odds ratio: Calculation, usage, and interpretation. Biochem. Medica 2009, 19, 120–126. [Google Scholar] [CrossRef]
  34. Domínguez-Almendros, S.; Benítez-Parejo, N.; Gonzalez-Ramirez, A.R. Logistic regression models. Allergol. Immunopathol. 2011, 39, 295–305. [Google Scholar] [CrossRef]
  35. Rudke, A.P.; De Almeida, D.S.; Alves, R.A.; Beal, A.; Martins, L.D.; Martins, J.A.; Hallak, R.; Albuquerque, T.T.A. Impacts of strategic mobility restrictions policies during 2020 COVID-19 outbreak on Brazil’s regional air quality. Aerosol Air Qual. Res. 2022, 22, 210351. [Google Scholar] [CrossRef]
  36. Kuhn, M.; Johnson, K. Applied Predictive Modeling; Springer: New York, NY, USA, 2013. [Google Scholar]
  37. Machado, M.; Santos, J.M.; Reisen, V.A.; Silva, A.F.P.; Reis, N.C., Jr.; Bondon, P.; Mavroidis, I.; Prezotti Filho, P.R.; Frere, S.; Lima, A.T. Parameters influencing population annoyance pertaining to air pollution. J. Environ. Manag. 2022, 323, 115955. [Google Scholar] [CrossRef]
  38. Machado, M.; Santos, J.M.; Frere, S.; Chagnon, P.; Reisen, V.A.; Bondon, P.; Ispány, M.; Mavroidis, I.; Reis, N.C., Jr. Deconstruction of annoyance due to air pollution by multiple correspondence analyses. Environ. Sci. Pollut. Res. 2021, 28, 47904–47920. [Google Scholar] [CrossRef]
  39. Wojnarowska, M.; Plichta, G.; Sagan, A.; Plichta, J.; Stobiecka, J.; Sołtysik, M. Odour nuisance and urban residents’ quality of life: A case study in Kraków’s in Plaszow district. Urban Clim. 2020, 34, 100704. [Google Scholar] [CrossRef]
  40. Blanes-Vidal, V. Air pollution from biodegradable wastes and non-specific health symptoms among residents: Direct or annoyance-mediated associations? Chemosphere 2015, 120, 371–377. [Google Scholar] [CrossRef] [PubMed]
  41. Orru, K.; Nordin, S.; Harzia, H.; Orru, H. The role of perceived air pollution and health risk perception in health symptoms and disease: A population-based study combined with modelled levels of PM10. Int. Arch. Occup. Environ. Health 2018, 91, 581–589. [Google Scholar] [CrossRef] [PubMed]
  42. Axelsson, G.; Stockfelt, L.; Andersson, E.; Gidlof-Gunnarsson, A.; Sallsten, G.; Barregard, L. Annoyance and worry in a petrochemical industrial area—Prevalence, time trends and risk indicators. Int. J. Environ. Res. Public Health 2013, 10, 1418–1438. [Google Scholar] [CrossRef] [PubMed]
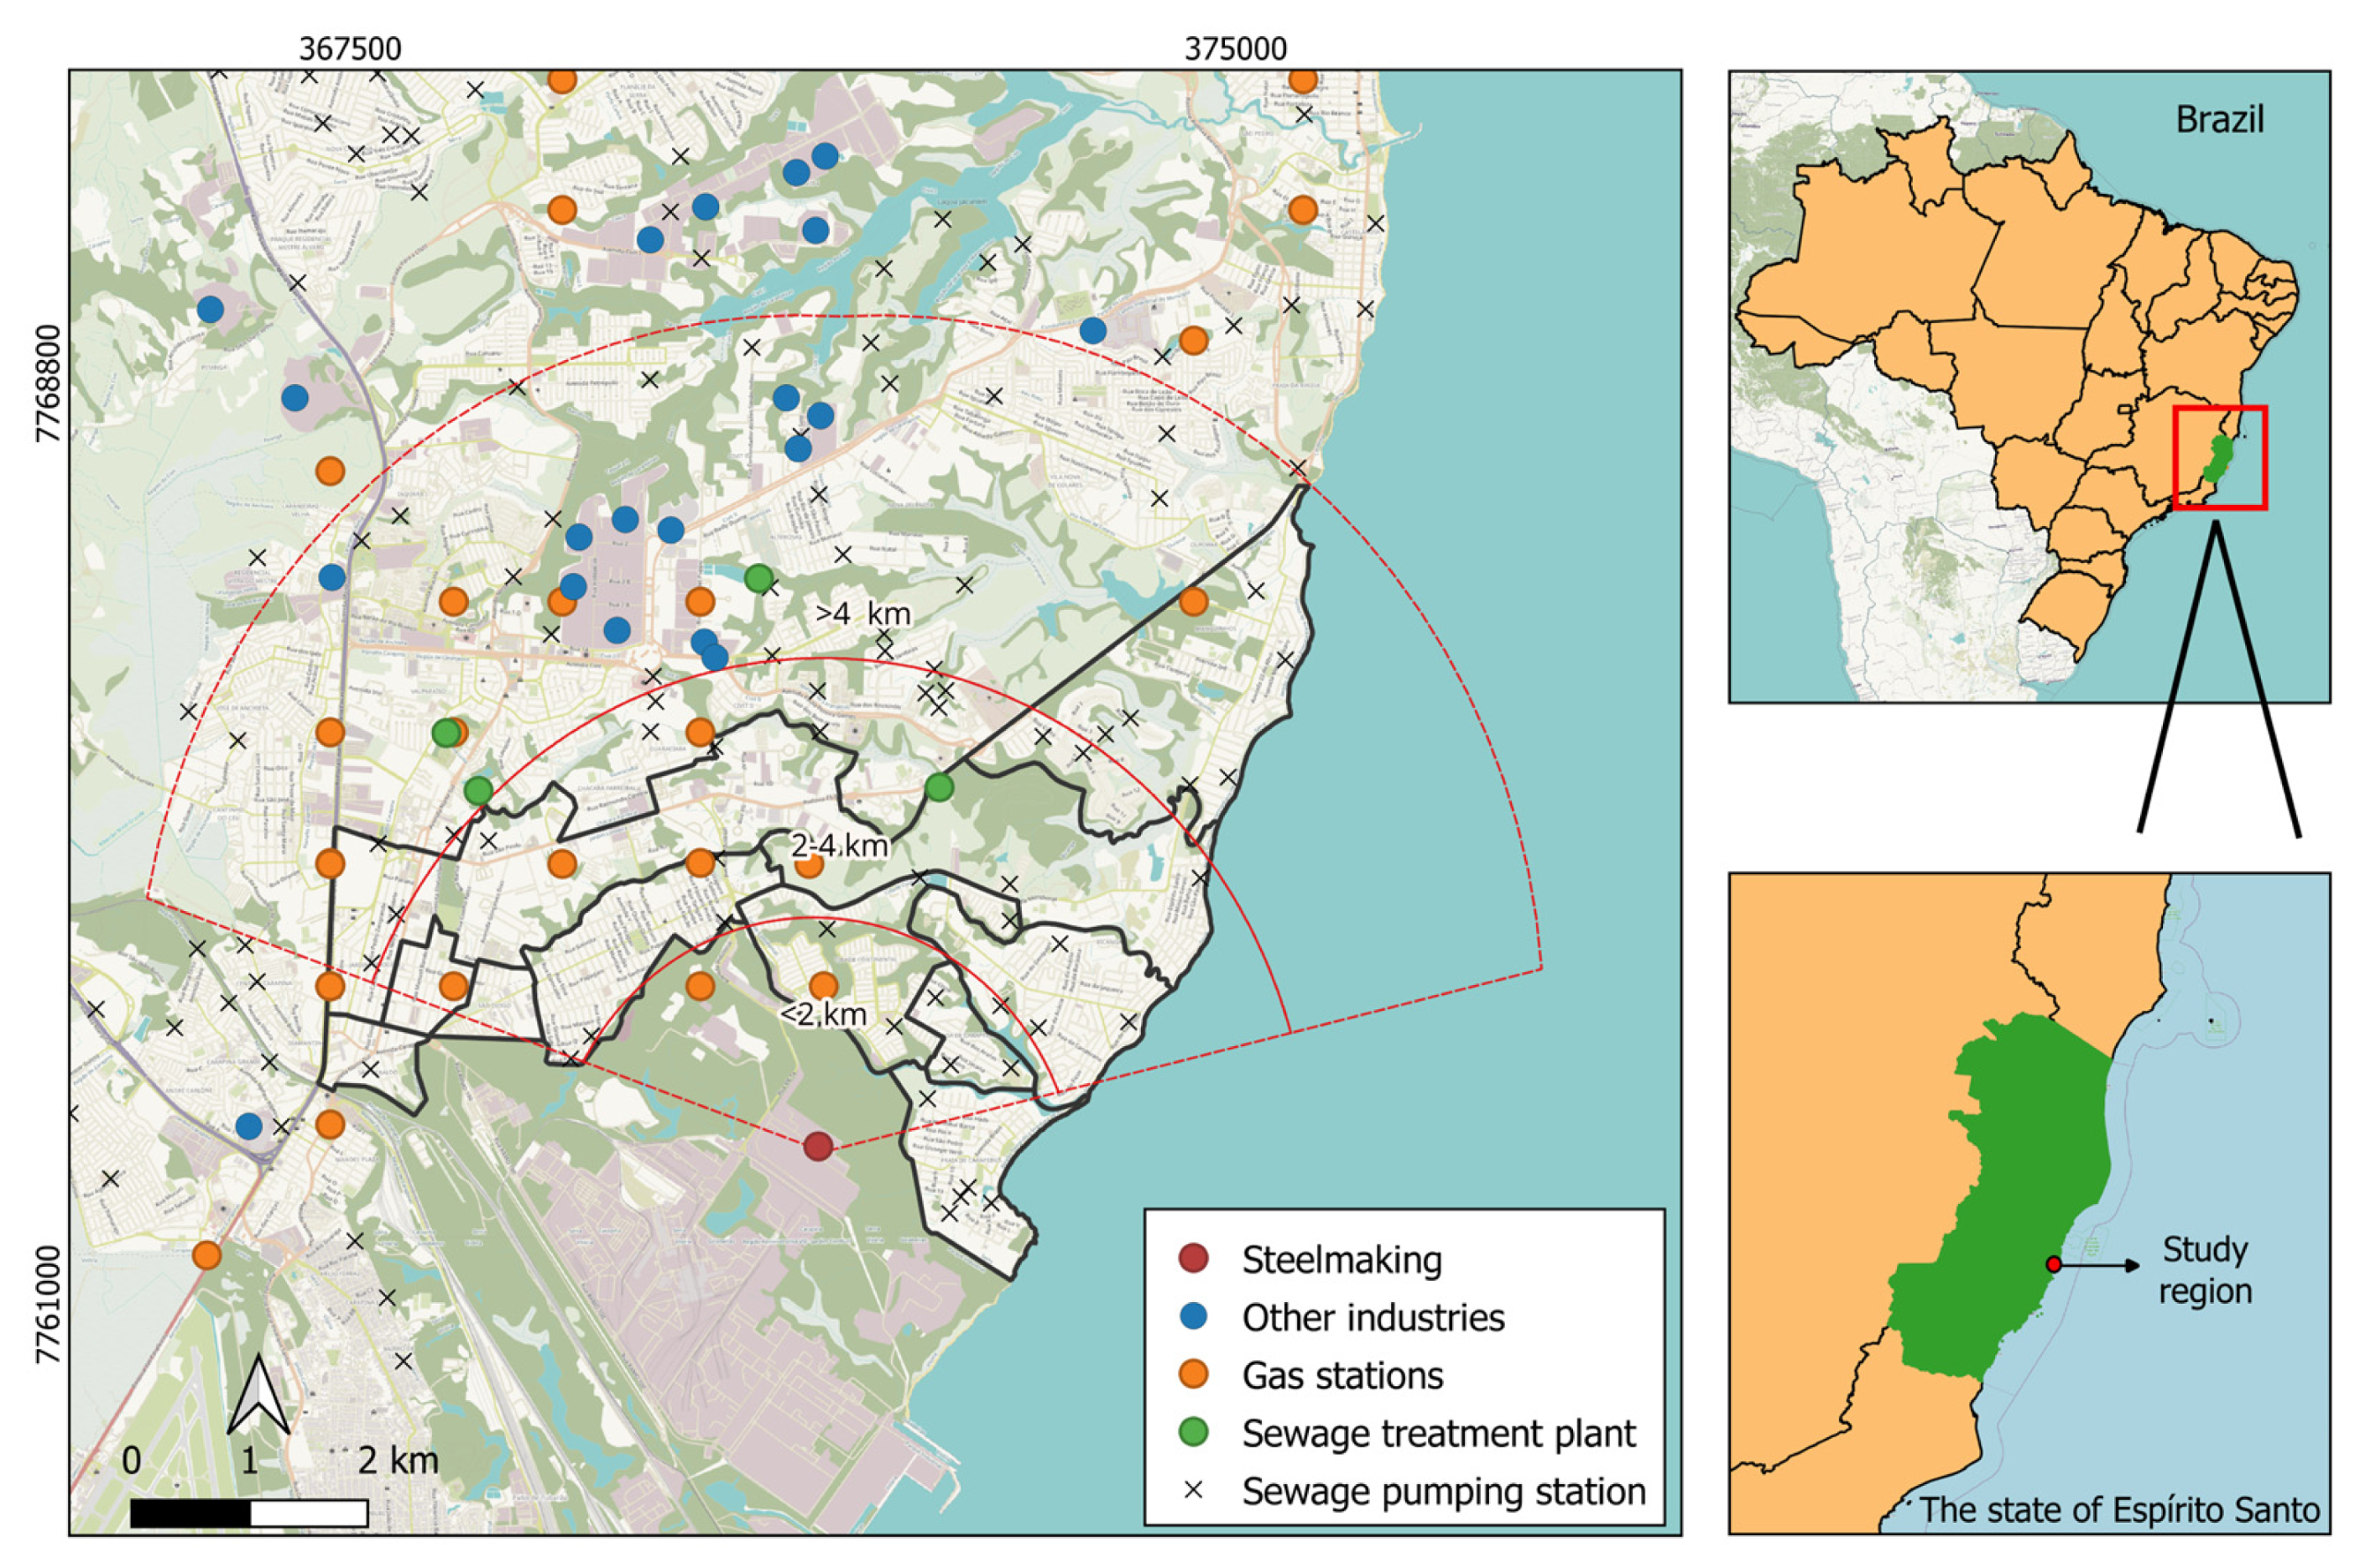
Figure 1. Study region (marked with dark black lines) and potential emission sources of odorous gases.
Atmosphere 16 01176 g001
Figure 2. Wind rose from the periods when the surveys were carried out: (a.1) April 2019; (a.2) May 2019; (b.1) December 2021; (b.2) January 2022; (b.3) February 2022.
Atmosphere 16 01176 g002
Figure 3. Spatial distribution of respondents across the study area, indicating odor annoyance perception and the main source identified. Respondents who did not report annoyance are shown in black. Colored markers represent those who perceived odors and identified the main source: red = steel industry, blue = sewage treatment plants, and green = other sources; (a) 2019 survey; (b) 2022 survey.
Atmosphere 16 01176 g003
Figure 4. Sources of odors perceived by respondents in the two survey periods (2019 and 2022). The values in parentheses below each bar indicate the actual number of respondents (n) who reported each source.
Atmosphere 16 01176 g004
Figure 5. Sources of odors perceived by respondents at three distance ranges from the steel industry (used as the reference location) in 2019 and 2022. The values in parentheses below each bar indicate the actual number of respondents (n). Chi-Square test confirmed the association between source and distance (2019: p < 0.001; 2022: p = 0.03).
Atmosphere 16 01176 g005
Figure 6. Reported impact of odor perception on daily activities by distance ranges from the steel industry in 2019 and 2022.
Atmosphere 16 01176 g006
Table 1. Proposed explanatory variables derived from the questionnaire.
VariableTypeCoding
More than two years of residenceBinary0 = no;
1 = yes.
Air pollution is the most disliked aspect of the region
Air pollution is the most concerning issue
Air pollution perceived through dust accumulation
Air pollution perceived through reduced visibility
Odors interfere with daily activities
Self-reported respiratory problems within the past six months
Respondent’s gender: female
Being a smoker
Frequency of occurrence of solvent smellOrdinal scale1 = never;
2 = rarely;
3 = sometimes;
4 = often;
5 = always.
Frequency of occurrence of urine smell
Frequency of occurrence of sewage smell
Frequency of occurrence of plastic or burned asphalt smell
Frequency of occurrence of aggressive smell
Perceived odor sourceCategorical1 = pelletizing, steel, and chemical industries;
2 = sewage treatment plant;
3 = gas stations and others.
Characteristics of the perceived odor1 = solvent, burned asphalt, and aggressive plastic;
2 = urine and sewage;
3 = others.
Professional occupation1 = employee;
2 = unemployed;
3 = retired;
4 = student;
5 = self-employed;
6 = homemaker.
Age group1 = 16–24 years;
2 = 25–44 years;
3 = 45–64 years;
4 = ≥65 years.
Schooling level1 = no formal education;
2 = elementary school;
3 = high/secondary;
4 = higher education.
Table 2. Respondent demographics stratified by gender (values in percentages).
Profile2019 (n = 505)2022 (n = 400)
ManWomanTotalManWomanTotal
Professional occupation
Employed384039332931
Unemployed676101513
Retired21121622714
Student434999
Self-employed312327252625
Homemaker01480147
Declined to answer010101
Age
16–24 years122016241620
25–44 years334238264234
45–64 years382933343736
≥65 years1571116510
Declined to answer222000
Education level
No formal education434122
Elementary/primary school2522232225234
High/secondary school535554614653
Higher education1519171627212
Declined to answer312101
Table 3. Percentage of respondents by annoyance level and corresponding total sample size.
SurveySlightly Annoyed
Scale 1 to 6
Very Annoyed
Scale 7 to 10
Total of Annoyed IndividualsTotal of Survey’s Participants
201934 (7%)148 (29%)182 (36%)505 (100%)
202225 (6%)78 (20%)103 (26%)400 (100%)
Table 4. Chi-Square test and logistic regression results for explanatory variables associated with high levels of odor-related annoyance in 2019 and 2022. ORs and 95% CI are presented for the variables included in the models.
SurveyVariables χ 2 p-ValueORCI
2019Air pollution perceived through dust accumulation3.350.072.781.0–11.3
Air pollution perceived through reduced visibility4.330.041.731.0–4.0
Female gender9.270.012.881.3–6.9
Self-reported respiratory problems3.690.051.821.0–4.5
2022Frequency of occurrence of sewage smell12.220.021.321.0–2.0
Age group6.090.110.840.4–1.7
Self-reported respiratory problems6.450.013.371.2–9.8
Table 5. Confusion matrix comparing observed and predicted annoyance levels (slightly or very annoyed) based on logistic regression models.
ObservedPrediction
Slightly Annoyed (0)Very Annoyed (1)Percentage of Correct Answers
2019Slightly annoyed (0)29 (TN)2 (FP)93.5%
Very annoyed (1)3 (FN)135 (TP)97.8%
Overall percentage 97%
2022Slightly annoyed (0)20 (TN)2 (FP)90.9%
Very annoyed (1)4 (FN)66 (TP)94.3%
Overall percentage 93.5%
Cutoff value: 0.5. TN = true negative; FN = false negative; FP = false positive; TP = true positive.
Disclaimer/Publisher’s Note: The statements, opinions and data contained in all publications are solely those of the individual author(s) and contributor(s) and not of MDPI and/or the editor(s). MDPI and/or the editor(s) disclaim responsibility for any injury to people or property resulting from any ideas, methods, instructions or products referred to in the content.