Article

Sources and Reactivity of Ambient VOCs on the Tibetan Plateau: Insights from a Multi-Site Campaign (2012–2014) for Assessing Decadal Change

1
State Key Laboratory of Atmospheric Boundary Layer Physics and Atmospheric Chemistry (LAPC), Institute of Atmospheric Physics, Chinese Academy of Sciences, Beijing 100029, China
2
State Key Laboratory of Atmospheric Environment and Extreme Meteorology, Institute of Atmospheric Physics, Chinese Academy of Sciences, Beijing 100029, China
3
Atmosphere Sub-Center of Chinese Ecosystem Research Network, Institute of Atmospheric Physics, Chinese Academy of Sciences, Beijing 100029, China
*
Author to whom correspondence should be addressed.
Atmosphere 2025, 16(10), 1148; https://doi.org/10.3390/atmos16101148
Submission received: 25 August 2025 / Revised: 24 September 2025 / Accepted: 29 September 2025 / Published: 30 September 2025

Abstract

Investigating atmospheric volatile organic compounds (VOCs) is critical for understanding their sources, chemical reactivity, and impacts on air quality, climate, and human health, especially in remote regions like the Tibetan Plateau where baseline data remains scarce. In this study, ambient VOCs species were simultaneously measured at four remote background sites on the Tibetan Plateau (Nyingchi, Namtso, Ngari, and Mount Everest) from 2012 to 2014 to investigate their concentration, composition, sources, and chemical reactivity. Weekly integrated samples were collected and analyzed using a Gas Chromatograph-Mass Spectrometer/Flame Ionization Detector (GC-MS/FID) system. The total VOC mixing ratios exhibited site-dependent variability, with the highest levels observed in Nyingchi, followed by Mount Everest, Ngari and Namtso. The VOC composition in those remote sites was dominated by alkanes (25.7–48.5%) and aromatics (11.4–34.7%), followed by halocarbons (19.1–28.1%) and alkenes (11.5–18.5%). A distinct seasonal trend was observed, with higher VOC concentrations in summer and lower levels in spring and autumn. Source analysis based on correlations between specific VOC species suggests that combustion emissions (e.g., biomass burning or residential heating) were a major contributor during winter and spring, while traffic-related emissions influenced summer VOC levels. In addition, long-range transport of pollutants from South Asia also significantly impacted VOC concentrations across the plateau. Furthermore, reactivity assessments indicated that alkenes were the dominant contributors to OH radical loss rates, whereas aromatics were the largest drivers of ozone formation potential (OFP). These findings highlight the complex interplay of local emissions and regional transport in shaping VOC chemistry in this high-altitude background environment, with implications for atmospheric oxidation capacity and secondary pollutant formation.

1. Introduction

Volatile Organic Compounds (VOCs) refer to a broad group of organic chemicals characterized by high vapor pressure, low boiling points, small molecular weights, and high volatility at ambient conditions. These compounds encompass diverse chemical classes, including alkanes, alkenes, aromatic hydrocarbons, oxygenated VOCs (OVOCs: e.g., alcohols, aldehydes, ketones, and organic acids), nitrogen- and sulfur-containing VOCs, and halogenated hydrocarbons. VOCs play a pivotal role in atmospheric chemistry, which are important precursors of ozone (O3), and can be oxidized into secondary organic aerosols (SOAs) and peroxyacyl nitrates (PAN) [1]. Moreover, VOC transformations modulate atmospheric oxidative capacity by influencing the concentrations of hydroxyl (OH) and peroxy radicals (HO2, RO2), thereby regulating the lifetimes of other pollutants. Beyond their indirect environmental effects, many VOCs pose direct health risks. For instance, benzene, formaldehyde, and 1,3-butadiene are recognized carcinogens, mutagens, or teratogens, with chronic exposure linked to central nervous system damage [2]. Thus, understanding and controlling VOCs are critical for air quality improvement, public health protection, and climate mitigation.
High concentrations of volatile organic compounds (VOCs) have been widely detected in urban areas across the globe, posing substantial environmental and public health risks. These urban ambient VOCs primarily originate from anthropogenic sources, including oil and natural gas operations, fossil fuel combustion, solvent use, and chemical manufacturing processes [3]. However, only a few VOCs observations are conducted in the background regions [4,5], and very sparse measurement data are available for high-altitude regions [6], with fewer research efforts and the complex logistics required as causes [7]. A review of pollutant measurements at background mountain sites concluded that local photochemistry experiences minimal natural and anthropogenic perturbations, though long-range transport of long-lived species remains significant [8]. In contrast, highland cities exhibit pronounced anthropogenic disturbances in photochemistry and air pollution. While studies in such regions have extensively analyzed aerosol distributions, long-lived source tracers, and their connections to industrial and construction activities, far less attention has been given to reactive species like volatile organic compounds (VOCs). Their sources, photochemical behavior, and contributions to O3 pollution accumulation remain understudied.
The Tibetan Plateau (TP), situated in southwestern China, represents the most extensive high-altitude landmass in low-to-mid latitudes, spanning 2.5 million km2 with a mean elevation of 4200 m above sea level. This region has traditionally been regarded as a pristine atmospheric environment due to limited anthropogenic emissions and low population density. However, emerging evidence demonstrates significant transboundary transport of persistent organic pollutants (POPs) and heavy metals to the TP via atmospheric circulation patterns, particularly from South and Central Asian sources [9]. In addition, a gradual increase (0.2–0.3 ppbv/yr) of ozone concentration during spring and autumn for the periods of 1994–2013 was observed at the Waliguan (WLG) Global Baseline Watch Station, which located along the edge of the northeastern boundary of the TP, strengthened the impression of natural and anthropogenic emissions [10]. These observations clearly demonstrated the increasing influence of long-range transport along the edge of the TP boundary and the promotion of the O3 photochemistry by transported VOCs has not been carefully explored.
This investigation presents a three-year observational dataset (2012–2014) of weekly canister samples collected at four background stations—the first comprehensive VOC characterization study in TP’s remote atmosphere, which was conducted as part of the Campaign on Atmospheric Aerosol Research network of China (CARE-China) [11]. Although those VOCs data could not reflect the current VOC levels, it represents a foundational and pivotal dataset that provides a snapshot of atmospheric composition during a specific period. Our research objectives were to: (1) quantify ambient VOC mixing ratios, speciation profiles, and seasonal dynamics; (2) evaluate chemical reactivity through OH loss rate calculations and maximum incremental reactivity (MIR) analysis; and (3) apportion emission sources using molecular tracer correlation analysis. The study provides novel insights into VOC atmospheric chemistry under the unique photochemical conditions of high-altitude environments, and it offers a benchmark for assessing the impact of recent environmental regulations on protecting the Tibetan Plateau’s atmosphere.

2. Materials and Methods

2.1. Sampling Sites

Ambient air samples were collected weekly from January 2012 to December 2014 at four remote background sites across the Tibetan Plateau (Figure 1). The Nyingchi site (29.77° N, 94.73° E; Altitude 2800 m), situated 75 km east of Bayi Town in the Lulang Valley, occupies grassland near a river confluence, with the nearest national highway 6 km west. This region features high-altitude ecosystems including glaciers, alpine meadows, and forests, with minimal local emissions primarily from tourism and limited agriculture. The Namtso station (30.77° N, 90.98° E; Altitude 4700 m), established on the southeastern shore of Tibet’s largest alpine lake (the world’s highest major lake), represents a pristine pastoral environment where residents practice yak and sheep herding, yielding negligible anthropogenic pollution. The Ngari site (32.52° N, 79.89° E; Altitude 4300 m) located west of Rutog County at the Desert Environment Observation and Research Station, is characterized by sandy soils with sparse vegetation in a gravel-dominated landscape. The Mount Everest site (28.21° N, 86.56° E; Altitude 4700 m), positioned on Mt. Qomolangma’s northern slope, similarly exhibits sandy-gravel terrain with scant grass cover. Due to its extreme elevation and isolation from industrial/urban centers, this location experiences virtually no local pollution emissions. All background sites were selected for their minimal anthropogenic influence, enabling the study of regional atmospheric processes.

2.2. Sampling Procedure and Analysis Methods

Ambient air samples were collected using a standardized protocol for trace gas measurements. A PFA-Teflon sampling line (¼ in. outer diameter) was connected to a high-purity diaphragm pump, with air drawn through the inlet at a controlled flow rate of 1 L/min−1. Samples were collected in 1 L electropolished stainless steel canisters (SilcoCan® or equivalent), which were pre-evacuated to <10−3 Torr prior to deployment. Sampling was conducted at 14:00 (Local Standard Time) each day, which was designed to capture the period of peak photochemical activity across the Tibetan Plateau sites, allowing for a consistent comparison of aged air masses between locations with different emission sources and meteorological conditions. However, it also means our measurements somewhat underestimate the concentrations of primary anthropogenic VOCs and their initial reactivity, while potentially overrepresenting the contribution of secondary OVOCs. The canisters were filled to an absolute pressure of 60 psig following EPA Compendium Method TO-15 protocols. Immediately after pressurization, canister valves were sealed using PTFE-faced diaphragms and transported under temperature-controlled conditions to our laboratory for analysis within 7 days to minimize storage artifacts. Before sampling, all of the canisters were cleaned and examined for contamination. The evacuated canisters were filled with pure N2 and stored in the laboratory for at least 24 h. The canisters were then checked using the same VOC analytical method to ensure that none of the targeted compounds were found, or they were under the method detection limit (MDL).
The VOC samples were analyzed using a Gas Chromatograph-Mass Spectrometer/Flame Ionization Detector (GC-MS/FID) system. The details of the analytical procedure have been reported in our previous studies [12]. Briefly, VOC samples were concentrated in the Model 7100 pre-concentrator (Entech Instruments Inc., Simi Valley, CA, USA) and transferred to the GC column. The chromatographic conditions were as follows: a HP-5MS column (60 m × 0.25 mm) was used with the GC temperature program: −35 °C (5 min); −35–35 °C at a rate of 15 °C min−1; 35 °C (1 min); 35–250 °C at a rate of 15 °C min−1. The carrier gas was helium at a constant pressure of 137 kPa. The mass range m/z from 20 to 200 was used for quantitative determination with the full scan mode. The source temperature was 250 °C. The electron multiplier voltage was 1287 eV (autotune). Each target compound was identified by its retention time and standard gas (Spectra To-14, Spectra PAMS Calibration Mix), with concentrations of 10 ppbv and prepared by the gravimetric method (Spectra gases, Branchburg, NJ, USA). Calibration was performed before and after the campaign by injecting standard gas with different concentrations. Five-point calibration curves including 0.5 ppbv, 2.5 ppbv, 5.0 ppbv, 10.0 ppbv, and 20.0 ppbv were made, yielding R2 values between 0.995 and 0.999 for the measured compounds. Concentrations of the target VOCs were obtained by interpolating from the 5-point calibration curve made at the beginning. It was found that the relative mean deviation was within 15% for the target compounds in all five duplicates and the MDL of the VOC ranged from 7 ppt to 40 ppt for all measured VOCs.

2.3. The Propylene-Equivalent Concentration and the MIR Method

The VOC reactivity and VOCs related to O3 formation were also studied. In this study, OH radical loss rate (LOH) and O3 formation potential (OFP) are both used to calculate the reactivity of various VOC species and describe their contribution to O3 production. Specifically, LOH assesses the kinetic reactivity (how fast the process starts), while OFP assesses the ozone-forming potential (how much ozone is ultimately produced). Their concurrent use provides a comprehensive view of VOC impacts. The OH radical loss rate was calculated by the following equation [13]:
LOH = [VOC]i × KiOH
Here, [VOC]i was defined as the ppb concentration of species i; KiOH was the reaction rate of individual VOC species i with OH radicals; and kOH constants were according to Atkinson and Arey (2003) [14]. The OFP is commonly calculated with the following equation [6]:
OFP (i) = [VOC]i × MIR (i)
where MIR is the maximum incremental reactivity constant obtained from the California Code of Regulations 2010 [15], and [VOC]i is the concentration of each VOC component in parts per billion.
Quantifying the uncertainties in the hydroxyl radical loss rate (LOH) and ozone formation potential (OFP) calculations is crucial for a robust interpretation of our results. The total uncertainty in our calculated LOH and OFP values stems from two primary sources: the first one is the uncertainty in VOC concentration measurements, which includes the precision of the GC-MS/FID system, the uncertainty in calibration curves, and the reproducibility of standards. For our instrument, the relative uncertainty for individual VOC species is estimated to be between 5% and 15%. The other one is the uncertainty in reaction rate coefficients (kOH) and MIR scales for OFP, and these values typically range from 10% to 30% as recommended by authoritative sources like the IUPAC data evaluations [16]. Then, the overall relative uncertainty for the LOH of a single VOC species was estimated using the root sum of squares method considering the two uncertainty primary sources as independent, and the relative uncertainty for the LOH contribution of individual VOC species was estimated to be between approximately 11% and 34%, while the relative uncertainty for the total LOH ranged from 15% to 25% in this study.

3. Results and Discussion

3.1. General Characteristics of Measured VOCs

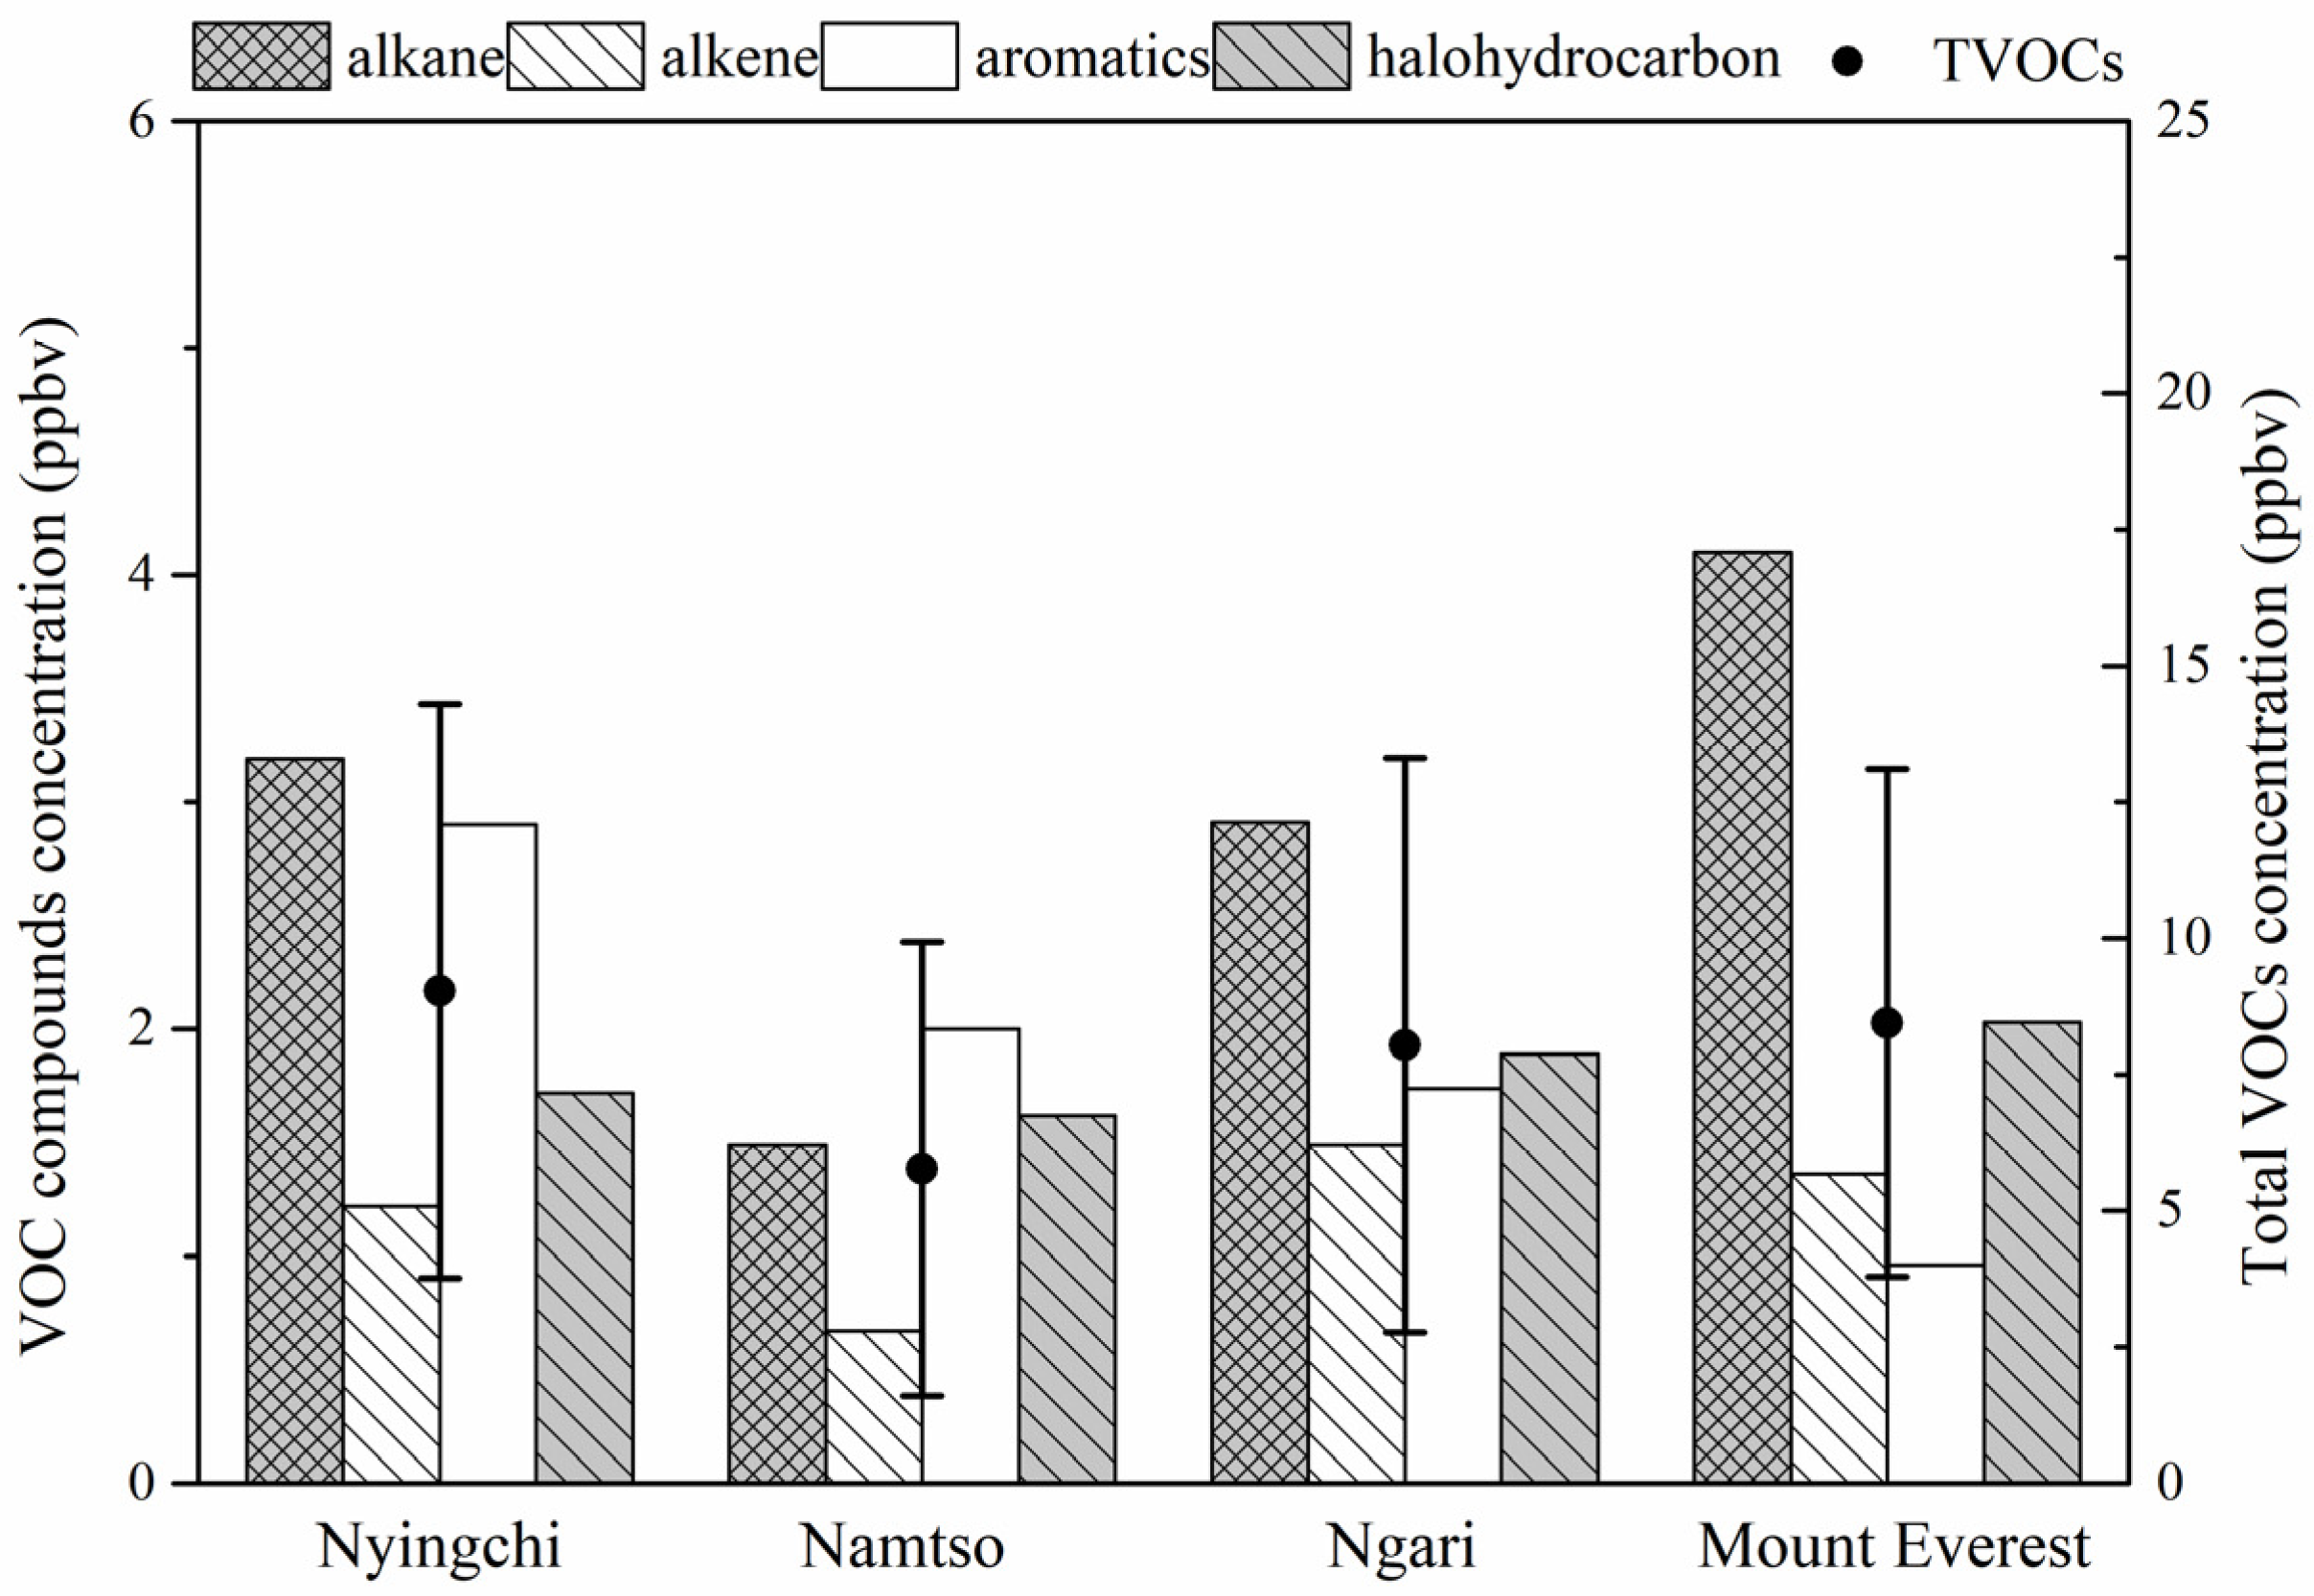
During the three year observation period. the total VOC concentrations exhibited significant spatial variability among the four remote sites. As shown in Figure 2, the averaged total VOCs (TVOCs) concentration was highest at the Nyingchi site (9.03 ± 5.27 ppbv), followed by Mount Everest site (8.45 ± 4.66 ppbv), Ngari site (8.04 ± 5.26 ppbv) and Namtso site (5.77 ± 4.17 ppbv). Chemically, the VOC mixture was dominated by alkanes (25.7–48.5% of TVOC), followed by aromatics (11.4–34.7%), halocarbons (19.1–28.1%) and alkenes (11.5–18.5%) among the four remote sites (Figure 1). The ten most abundant species accounted for nearly half (46–52%) of total TVOCs, with propane (τOH = 8.5 days for an OH concentration of 1.5 × 10⁶ molecules cm−3), n-butane (τOH = 4 days for an OH concentration of 1.5 × 10⁶ molecules cm−3), and toluene being particularly significant across the four sites (Figure S1). These long-lived species, along with i-butane, styrene, and xylenes, form a distinct chemical fingerprint that may likely point to multiple anthropogenic sources which are further discussed in Section 3.4. The spatial distribution of these compounds reveals an interesting paradox: while absolute concentrations decrease with increasing remoteness, the chemical signatures maintain remarkable consistency, suggesting that even the most remote sites are affected by similar emission sources, albeit at different intensities.
Comparative analysis of VOC concentrations across high-altitude monitoring sites are summarized and presented in Table 1. The four remote plateau sites exhibited significantly elevated mixing ratios for most VOC species compared to background stations at Waliguan and Mt. JF, while showing comparable levels with Mt. Tai (Table 1). Notably, Namtso site demonstrated enhanced concentrations of short-chain alkanes (butane: 0.24 ppbv; pentane: 0.11 ppbv), likely reflecting regional transport patterns. The anthropogenic alkane signature (C3–C5) at Mount Everest showed remarkable similarity to Mt. Gongga, suggesting comparable source influences. Biogenic VOC measurements revealed that isoprene concentrations at Nyingchi (0.30 ppbv) substantially exceeded those at most mountain sites except Mt. JF (0.48 ppbv) and Mt. Gongga (0.40 ppbv), consistent with its forested ecosystem. In contrast, aromatic compounds (benzene: 0.64–1.01 ppbv; toluene: 0.21–1.81 ppbv) showed 2–4 times higher concentrations at eastern China mountain sites (Lin’an, Mt. Tai), indicative of strong anthropogenic influence from industrial and urban emissions. These findings demonstrate that even remote Tibetan Plateau sites show measurable impacts from anthropogenic hydrocarbons. Note that the comparative analysis requires consideration of sampling time effects, as all measurements were conducted at 14:00 LST when photochemical production typically peaks [17]. This temporal bias likely results in 15–25% higher reported values compared to diurnal averages, particularly for reactive species like isoprene and alkenes.

3.2. Seasonal Variation Patterns of VOCs

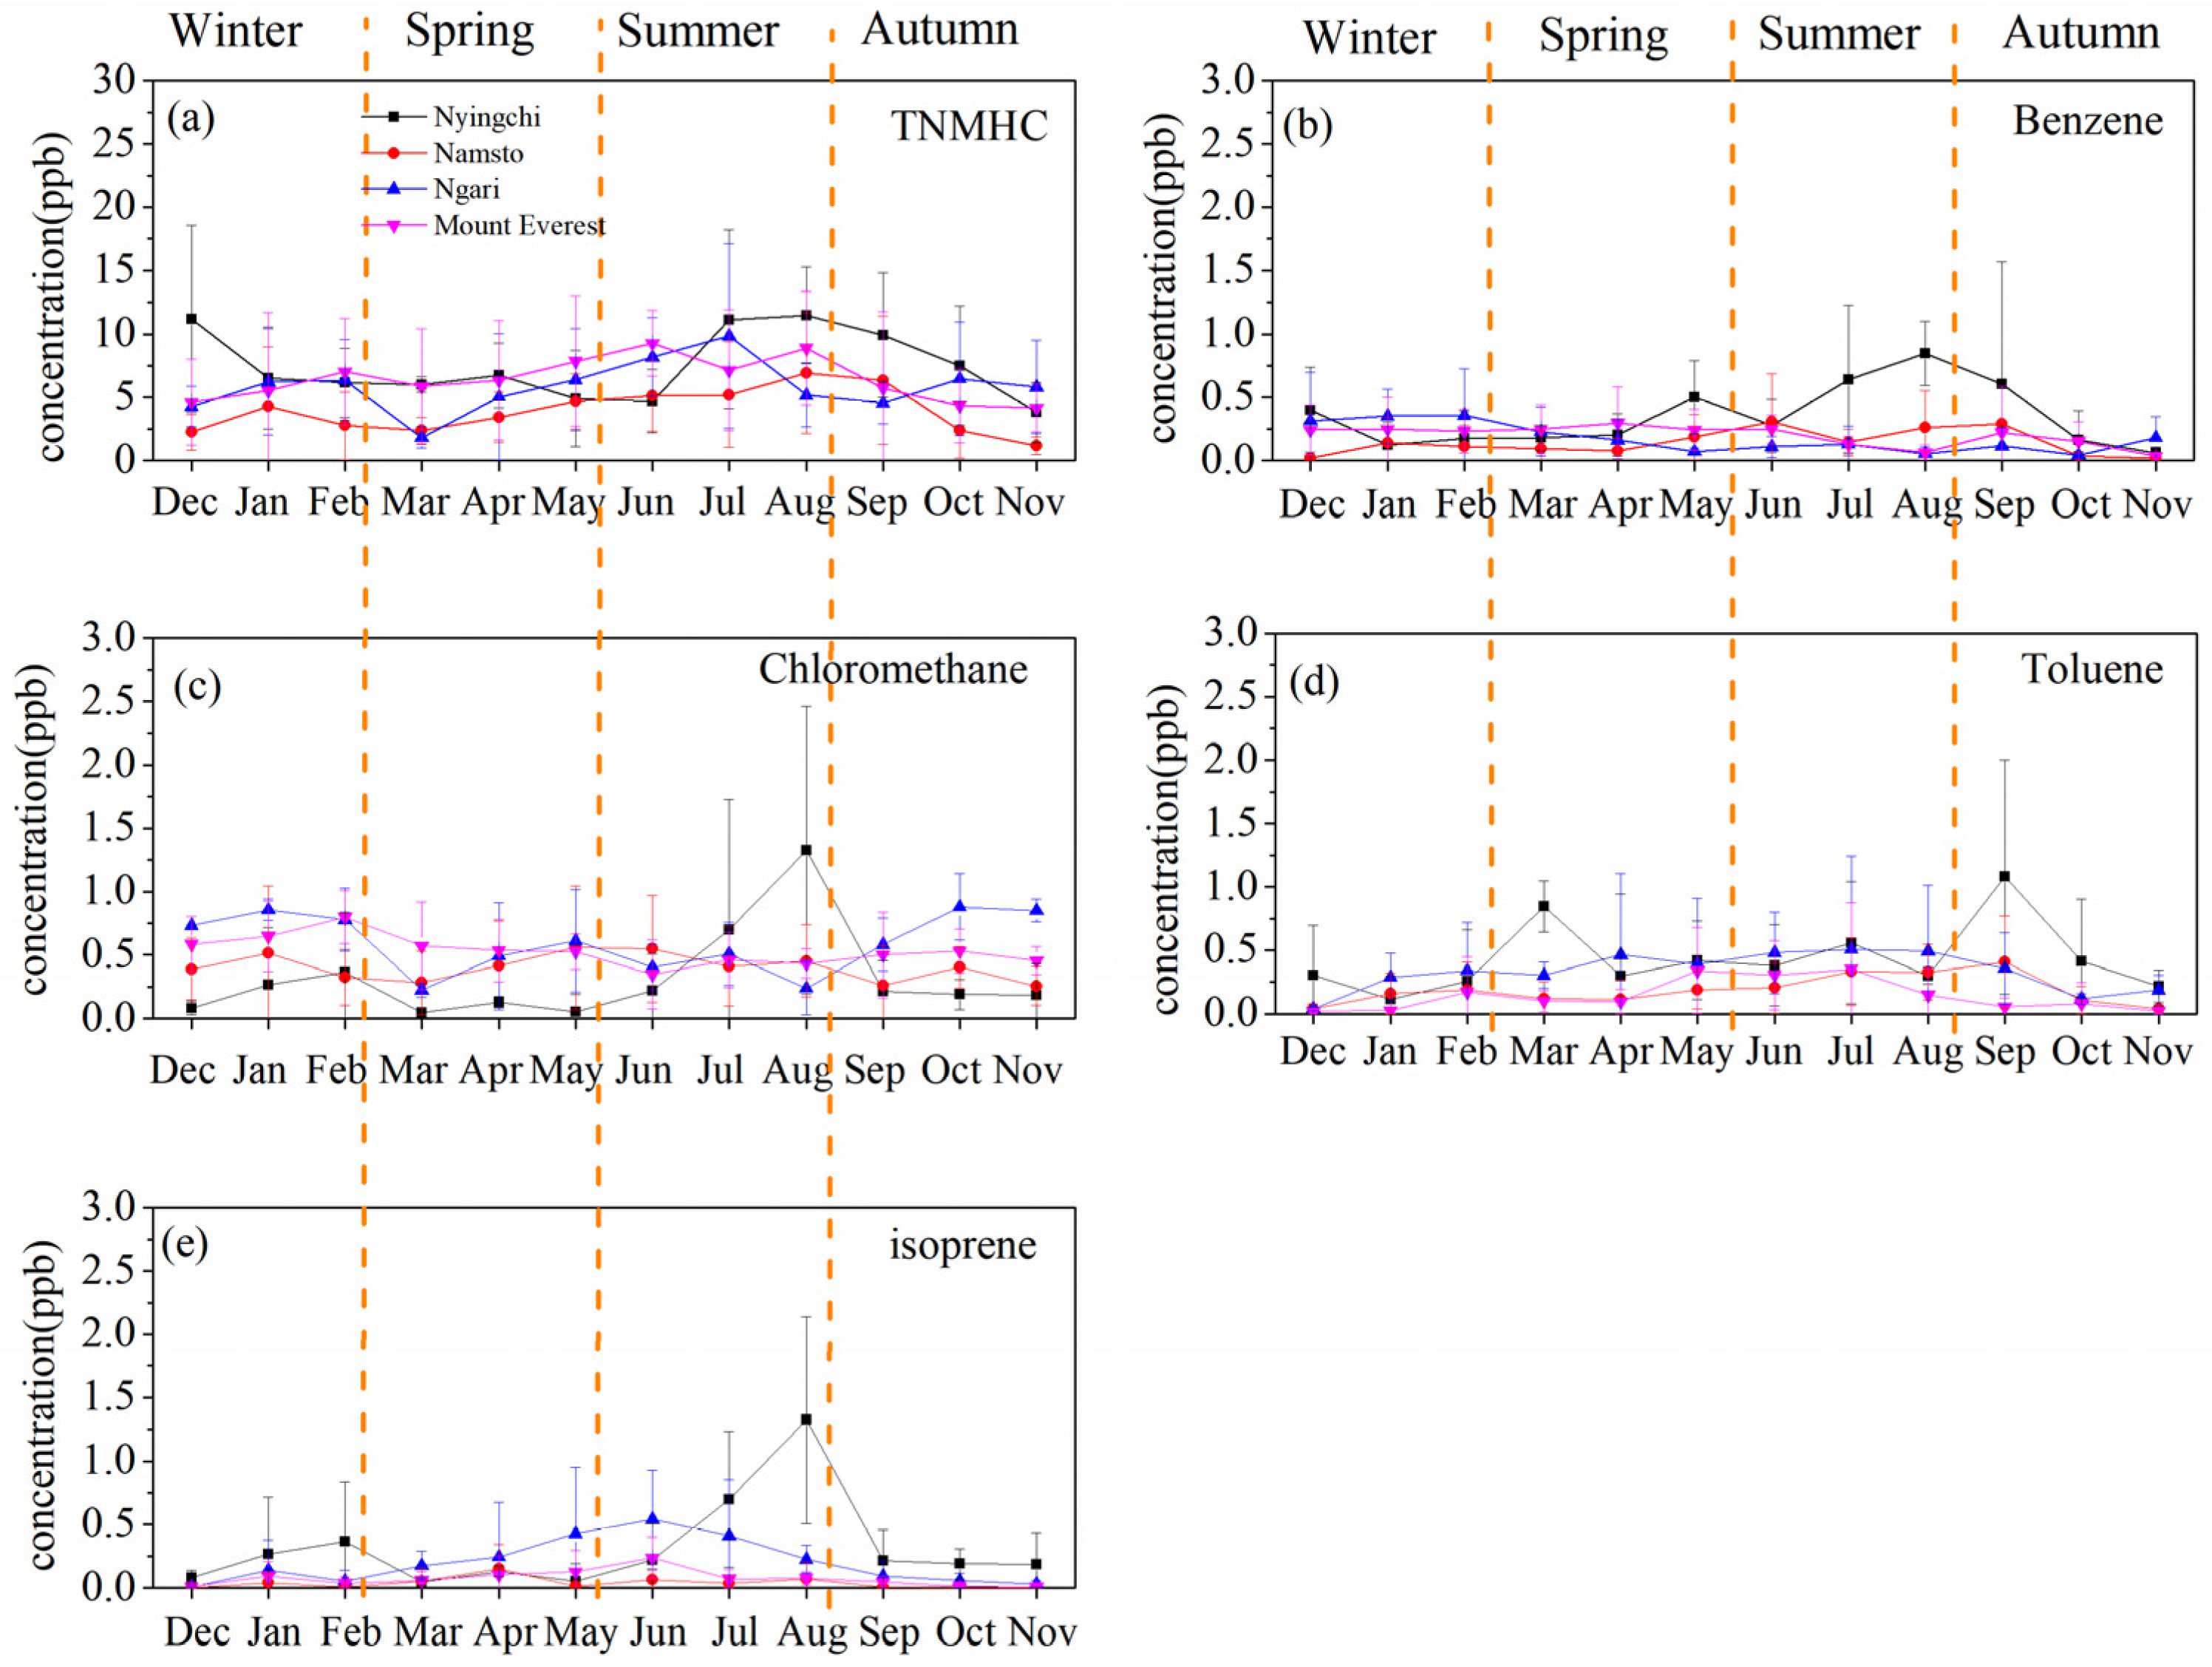
The seasonal trends of volatile organic compounds (VOCs) provide critical insights into atmospheric transport mechanisms and photochemical processes. In this study, seasons were classified as follows: winter (December–February), spring (March–May), summer (June–August), and autumn (September–November). As illustrated in Figure 3, the mixing ratios of total non-methane hydrocarbons (TNMHC) and key VOC species exhibited distinct seasonal patterns across the four sampling sites. TNMHC concentrations peaked during early spring months (March–April) and early summer months (June–July), consistent with observations at Mt. Gongga, a high-altitude background site in southwestern China [12]. Specifically, toluene demonstrated pronounced summer maxima (0.51–0.63 ppbv) at Ngari, Mount Everest and Namtso (p < 0.05), while a more pronounced autumn peak of toluene was observed at Nyingchi. Similar seasonal pattern of Benzene was also observed at Nyingchi, which presents a more pronounced peak in summer than in autumn compared with toluene (Figure 3b). Note that Benzene exhibited significantly elevated winter concentrations at Ngari and Mount Everest (p < 0.05), totally different with those of Toluene, which may relate to enhanced emissions during winter months at these two sites. In contrast, there was no statistically significant seasonal variation in benzene levels at Namtso (p > 0.05), though a summer enhancement trend was observed, possibly linked to increased volatilization at higher temperatures. Chloromethane (CH3Cl), a well-characterized biomass burning tracer [21], showed parallel seasonal trends to benzene at Nyingchi, with summer mixing ratios (0.25–1.4 ppbv) exceeding other seasons by 35–45%. Note that the summer peak of CH3Cl was absent in other three remote sites; this phenomenon may indicate the enhanced local sources at the Nyingchi site during summertime. In addition, the biogeographical distribution of isoprene (C5H8) confirmed expected patterns, characterized by significantly elevated summer concentrations as a result of temperature-dependent biosynthesis [22]. This was particularly evident at the Nyingchi site (Figure 3e), which represents a forest ecosystem.
The seasonal trends of VOC mixing ratios across the Tibetan Plateau reflect a complex interplay of anthropogenic, biogenic, and meteorological influences that collectively override conventional photochemical depletion patterns observed in urban environments [23]. While enhanced OH radical oxidation and planetary boundary layer expansion during warmer seasons would typically reduce VOC concentrations, the plateau exhibits reversed trends due to compensating factors. The observed summer VOC maxima coincided with a ~14-fold increase in annual visitors (2000–2011), which were driven by heightened emissions from tourism-related sources such as vehicular exhaust and solvent use, which offset concurrent photochemical consumption. This finding provides a crucial baseline for evaluating the atmospheric impact of future anthropogenic expansion, underscoring the need for integrated long-term monitoring of VOCs and tourism metrics to quantify human activity–air quality linkages in this fragile region. Concurrently, winter/early spring shows secondary peaks at Ngari and Mount Everest, characterized by elevated benzene and CH3Cl mixing ratios that fingerprint biomass/biofuel combustion, corroborated by the higher loadings of carbonaceous aerosols in the pre-monsoon season at Qomolangma were most likely affected by the biomass burning (agricultural and forest fires) in northern India and Nepal [9].

3.3. VOCs Reactivity and Ozone Formation Potential

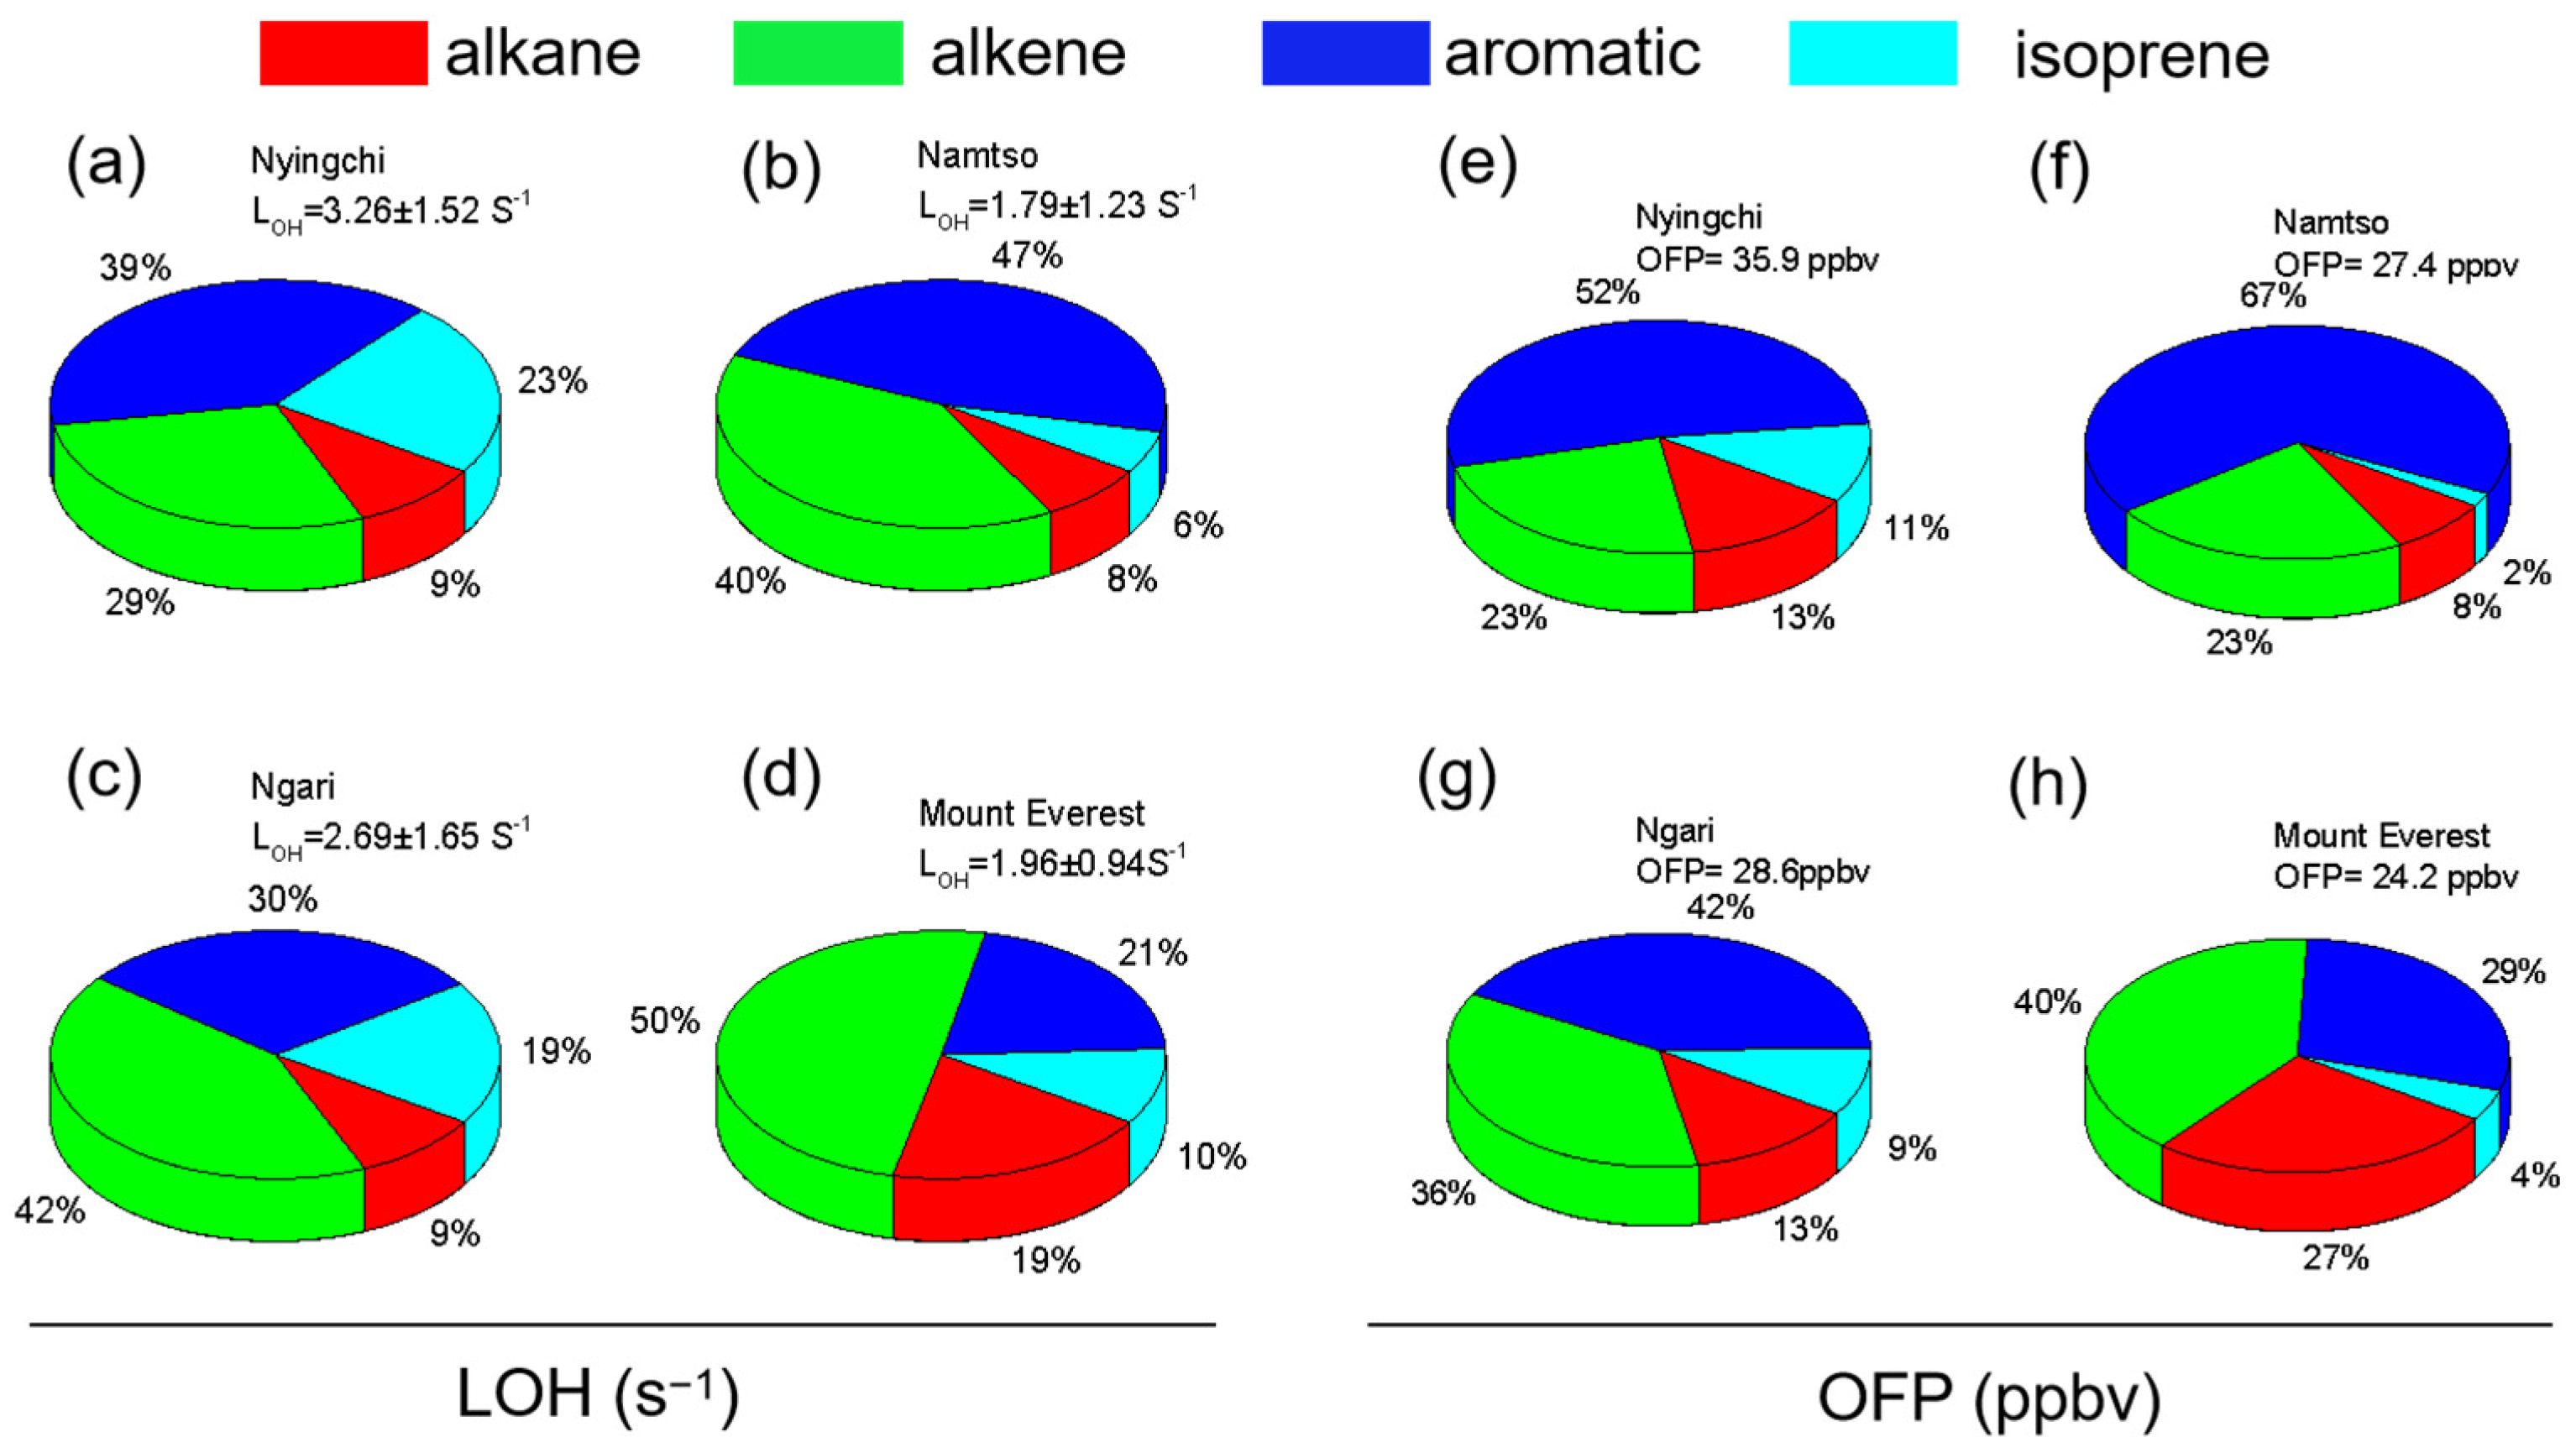
The ozone formation potential (OFP) and OH radical loss rate (LOH) serve as critical metrics for evaluating the atmospheric reactivity of NMHCs, particularly in understanding ground-level ozone production dynamics. Using the Maximum Incremental Reactivity (MIR) scale coupled with measured VOC mixing ratios, we quantified that alkenes and aromatics dominated the chemical reactivity budget, collectively contributing 68–87% of total LOH and 69–90% of OFP across all the four remote sites (Figure 4). The LOH was calculated based on VOC-specific OH reaction rate coefficients (kOH), revealing that isoprene played a disproportionately significant role at Nyingchi due to its elevated biogenic emissions and high reactivity. Among alkenes, C4species (butenes) exhibited the highest LOH contribution, followed by propene and pentenes (Table S1). For aromatics, C9 compounds-particularly 1,2,4-trimethylbenzenedemonstrated the greatest OFP, with C8 aromatics (xylenes) and toluene as secondary contributors (Table S1). These findings underscore the dual influence of molecular structure (carbon number/branching) and emission sources (biogenic vs. anthropogenic) in driving ozone production efficiency, with reactive alkenes and alkyl-substituted aromatics acting as key precursors for secondary pollutant formation in high-altitude environments.

3.4. Source Implications of VOCs

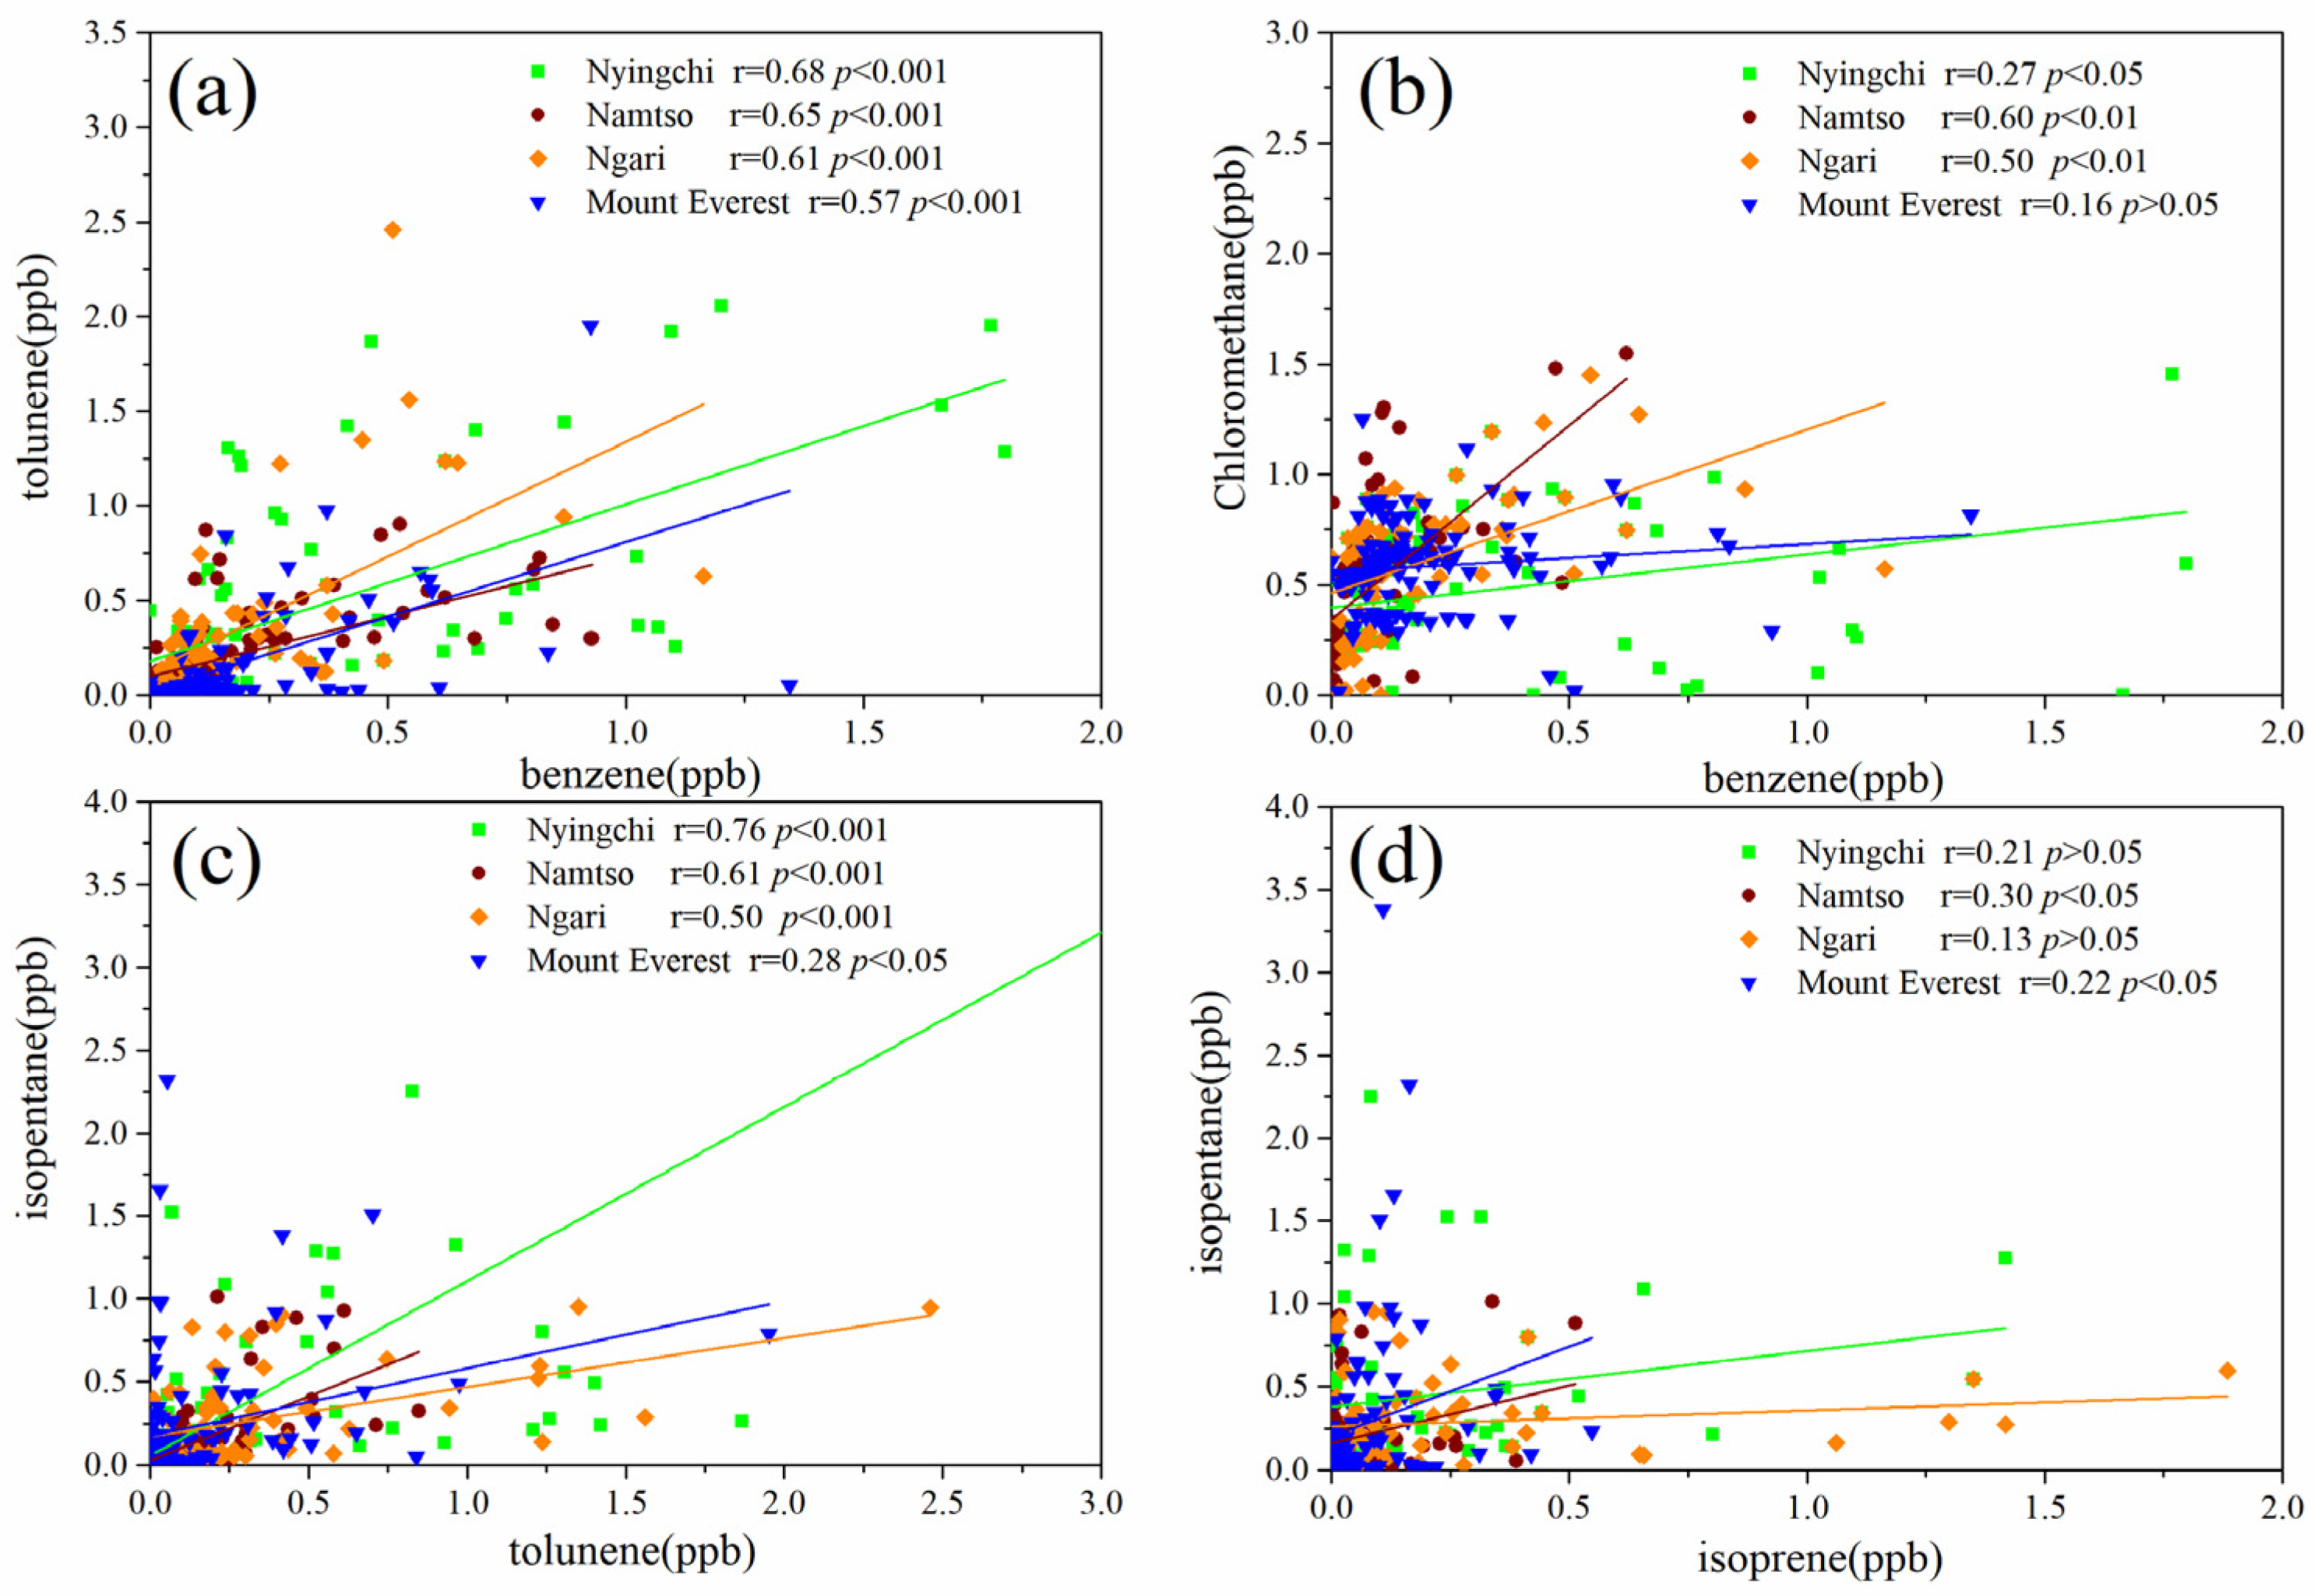
To further explore the potential sources of VOCs at the four remote sites, the toluene-to-benzene ratio (T/B) was analyzed which serves as a diagnostic tool for source apportionment [24]. As shown in Figure 5a, significant linear correlations were observed between benzene and toluene concentrations (p < 0.001) across all four sites. The correlation coefficients were similar (r = 0.68, 0.65, 0.61, and 0.57 for Nyingchi, Namtso, Ngari, and Mount Everest, respectively), indicating a common emission source for these aromatic compounds [25]. Note that the derived T/B slopes at Namsto, Ngari, and Mount Everest (0.82, 0.64, and 0.62, respectively) fall within the documented range for biomass/biofuel combustion (0.23–0.72) [26] and coal combustion (0.13–0.71) [27], indicating mixed contributions from these combustion processes at these sites. In contrast, the elevated T/B ratio at Nyingchi (1.22) aligns closely with vehicular emission signatures (~1.6) [28], implying a dominant influence from traffic-related sources.
Chloromethane, a tracer for incomplete biomass/biofuel combustion, exhibited significant correlations with benzene at Namsto and Ngari (r = 0.60 and 0.50, respectively; p < 0.001) (Figure 5b), further corroborating the prevalence of combustion-derived emissions in these regions. Isopentane, a well-established marker for vehicular emissions [29], demonstrated strong correlations with toluene at Nyingchi, Namsto, and Ngari (Figure 5c), reinforcing the impact of traffic-related sources. Isoprene, a highly reactive biogenic volatile organic compound (BVOC), is conventionally employed as a tracer for natural emissions. However, vehicular exhaust has also been identified as a potential source in urbanized settings. Figure 5d reveals weak correlations between isoprene and isopentane at Nyingchi, Ngari, and Mount Everest (r = 0.21, 0.16, and 0.06, respectively; p > 0.05), suggesting minimal anthropogenic influence and a predominantly biogenic origin for isoprene at these sites. This interpretation is further supported by the observed seasonal variability in isoprene concentrations (Figure 3e).
Correlations between benzene, toluene, chloromethane, and isopentane were further analyzed across different seasons (Table 2). At the Nyingchi, Ngari, and Mount Everest sites, winter and spring samples exhibited strong correlations (r > 0.5, p < 0.01) between benzene and chloromethane, indicative of shared emission sources during colder months. In contrast, the Namsto site displayed a particularly robust correlation (r = 0.89, p < 0.001) in autumn, suggesting seasonal variability in dominant emission processes. During spring, the benzene-to-chloromethane (B/CM) slope at Nyingchi, Ngari, and Mount Everest (0.90, 0.78, and 0.29, respectively) aligned with reported values for agricultural residue burning (0.24–0.91) [30] and closely matched the slope of 0.72 observed during biomass burning episodes at Mt. Tai in June 2006 [18]. This consistency reinforces the influence of biomass combustion during spring. In addition, strong correlations between toluene and isopentane (r = 0.90, 0.79, and 0.83; p < 0.001) were observed in summer across Nyingchi, Namsto, Ngari, and Mount Everest sites (Table 2), implicating vehicular emissions as the predominant source of toluene during this season. Given Tibet’s status as a major tourist destination, summer-the peak travel period-experiences heightened traffic activity, leading to elevated contributions from mobile sources to the local VOC budget.
The ratios of volatile organic compounds (VOCs) with differing photochemical lifetimes serve as effective tracers for evaluating atmospheric processes, including air mass transport history and degree of photochemical aging [31]. In this study, we employ the m,p-xylene/ethylbenzene (X/E) ratio as a robust indicator of atmospheric processing, as these compounds typically share common emission sources in urban atmospheres while exhibiting distinct reaction kinetics with OH radicals (the rate constant for m,p-xylene is approximately three times greater than that for ethylbenzene) [32]. Figure S2 presents the X/E ratio scatter plots for the Nyingchi, Namsto Ngari, and Mount Everest sites. Notably, Mount Everest exhibited the highest slope (0.85), indicating significantly more aged air masses compared to other three sites (0.60–0.72). In addition, the derived X/E ratios at Nyingchi (0.60), Namsto (0.72), and Ngari (0.70) substantially exceeded typical vehicular emission signatures (0.3) [33], but aligned closely with biomass burning plumes (0.65) [34]. These elevated ratios, compared to urban observations [35], collectively demonstrate the prevalence of photochemically processed air masses throughout the study region. This finding highlights the distinct influences of plateau-specific photochemistry and meteorological conditions on VOC evolution. The elevated X/E ratio at Mount Everest signifies substantially more aged air masses, a phenomenon driven primarily by the intense ultraviolet radiation and low aerosol loading characteristic of high-altitude environments [36]. These conditions foster high concentrations of hydroxyl (OH) radicals, which accelerate the photochemical oxidation of volatile organic compounds (VOCs). Given that m,p-xylene reacts with OH radicals approximately three times faster than ethylbenzene, the higher ratio indicates a greater degree of photochemical processing. This is consistent with studies from other high-altitude backgrounds, such as Menyuan station, where strong solar irradiation promotes significant oxidative aging of anthropogenic VOCs during long-range transport [37].
The variation among sites, however, highlights the critical role of meteorological mechanisms. Mount Everest and the Ngari site, influenced by the westerlies and the South Asian monsoon, are receptors of pre-processed air masses originating from pollutant sources in South Asia. During prolonged transport, these air masses undergo extensive photochemical aging, leading to the depletion of the more reactive m,p-xylene and thus a higher X/E ratio. In contrast, the Nyingchi site, situated in a forested valley of southeastern Tibet, experiences strong localized emissions of biogenic VOCs. The rapid replenishment of fresh VOCs from the forest ecosystem dilutes the aging signal, resulting in a lower X/E ratio. Furthermore, the complex local topography and valley breezes facilitate efficient dispersion, reducing the residence time of air parcels and limiting the extent of photochemical processing. The intermediate ratio at Namtso may be attributed to its lake environment, where potential aqueous-phase oxidation and cloud processing could alter the VOC degradation pathways [38]. This gradient in photochemical aging has profound implications for atmospheric chemistry on the Tibetan Plateau. The aged air masses at Mount Everest, indicated by the high X/E ratio, suggest a regime where the formation of secondary pollutants like peroxyacetyl nitrate (PAN) and secondary organic aerosols (SOA) is enhanced. The oxidation products of aromatic compounds like m,p-xylene are key precursors for these species. Consequently, the background regions of the plateau may act as significant receptors and reactors for secondary pollution, influenced by a combination of intense local photochemistry and the import of anthropogenic precursors. These findings underscore the unique interplay between extreme radiative forcing and complex atmospheric dynamics in shaping the fate of VOCs over the “Third Pole,” providing a critical baseline for understanding regional air quality and climate impacts.

3.5. Comprehensive Analysis of Air Mass Trajectories and VOC Source Characterization

The HYSPLIT trajectory model driven by NCEP/GDAS meteorological data was employed to investigate the long-range transport pathways influencing VOC concentrations across the Tibetan Plateau. The five-day backward trajectories (2006–present) were systematically classified into three distinct categories (Figure S3) based on their geographical origins and transport characteristics:
(i) NW-type trajectories: These air masses originated from West Asia and traversed the middle troposphere (approximately 3–5 km altitude) over the sparsely populated northwest China region at relatively high velocities. The clean continental nature of these airflows resulted in the lowest observed TNMHC concentrations (3.30–6.69 ppbv) among all trajectory types (Table 3), consistent with previous findings by Xue et al. (2013) [4] regarding the minimal anthropogenic influence in this transport pathway.
(ii) West-type trajectories: Characterized by their passage through the heavily industrialized Indo-Gangetic Plain, including major urban centers like New Delhi (population >30 million) and Bareilly. These air masses exhibited moderate VOC loading (4.97–6.89 ppbv) with particularly elevated toluene levels at both Ngari (0.38 ppbv) and Nyingchi (0.45 ppbv) stations. The toluene enrichment serves as a distinct chemical fingerprint of industrial/vehicular emissions from the densely populated regions along the transport route.
(iii) South-type trajectories: Representing low-altitude (<1.5 km) flows from the biomass-burning intensive regions of northeast India and Nepal. These slow-moving air parcels accumulated the highest VOC concentrations (5.45–7.78 ppbv), featured with enhanced benzene and isopentane from fossil fuel combustion, and remarkably high CH3Cl levels, a well-established biomass burning tracer [39].
The chemical differentiation between trajectory types reveals important regional pollution dynamics. The West-type’s toluene dominance contrasts sharply with South-type’s combustion markers, illustrating how trajectory analysis can disentangle competing pollution sources. The persistent CH3Cl signal in South-type air masses provides compelling evidence for large-scale biomass burning impacts, corroborating findings from Liu et al. (2013) [40] and Cong et al. (2015) [9] regarding trans-Himalayan pollutant transport. These findings have important implications for understanding the atmospheric chemistry of high-altitude regions. The persistence of polluted air masses at extreme altitudes (>5000 m asl at Mount Everest) challenges conventional assumptions about vertical pollutant confinement and highlights the need for revised atmospheric transport models in mountainous regions. Future work should incorporate these trajectory-resolved observations into regional climate models to better predict long-range pollution impacts on the Tibetan cryosphere.

4. Conclusions

Volatile Organic Compounds (VOCs) have drawn significant scientific attention due to their dual impacts on human health and atmospheric chemistry, particularly their crucial roles in ozone formation, secondary organic aerosol (SOA) production, and photochemical reactions. This study presents the first comprehensive dataset of atmospheric VOCs across four remote high-altitude sites in the Tibetan Plateau, quantifying up to 87 VOC species with averaged total mixing ratios ranging from 5.77 ± 4.17 ppbv (Namtso site) to 9.03 ± 5.27 ppbv (Nyingchi site). The VOC composition at all sites exhibited a consistent pattern, with alkanes and aromatics constituting the dominant categories (accounting for approximately 60–70% of total VOCs), followed by halocarbons (19.1–28.1%) and alkenes (11.5–18.5%). Distinct seasonal variations were observed: total VOCs (TVOCs) and toluene displayed maximum concentrations during summer (June–August) and minimum levels in autumn (September–November). In contrast, benzene and chloromethane showed an inverse seasonal pattern at Ngari and Mount Everest sites, peaking in winter (December–February) and reaching their lowest levels in summer. To evaluate the atmospheric reactivity and environmental impacts of these VOCs, we calculated two key parameters: OH radical loss rates (LOH) and ozone formation potentials (OFP), and revealed that Alkenes, despite their relatively low abundance, contributed disproportionately (40–55%) to the total OH reactivity due to their high reaction rate constants with OH radicals. Particularly, C4 alkenes (e.g., 1-butene, isobutene) accounted for over 60% of the total alkene reactivity. Aromatics emerged as the dominant contributors (50–65%) to OFP, with C9 aromatics (e.g., trimethylbenzenes) showing the highest ozone-forming potential per molecule. Furthermore, source apportionment through diagnostic ratio analysis (benzene/toluene correlations) and tracer-based approaches identified two major emission regimes, suggested combustion sources (biomass burning and residential heating) dominated during winter and early spring, evidenced by elevated correlations with chloromethane, while traffic-related emissions became predominant in summer, supported by strong toluene–isopentane correlations. Our study highlights the significant influence of long-range transported pollutants from South Asia (particularly Nepal, India and Myanmar), which substantially affect both source characteristics and seasonal variations in VOCs across the Tibetan Plateau. These findings establish an important baseline for understanding atmospheric chemistry in this ecologically sensitive region. By identifying the sources and transformation processes of VOCs, which were key precursors to ozone and secondary organic aerosols, this study provides a critical benchmark for assessing the effectiveness of environmental regulations aimed at safeguarding both the fragile ecosystems and public health on the Tibetan Plateau and in broader Asia. Future studies should incorporate these results into regional atmospheric models to better predict air pollution transport and transformation processes across the Himalayan region.

Supplementary Materials

The following supporting information can be downloaded at: https://www.mdpi.com/article/10.3390/atmos16101148/s1, Figure S1: The 10 most abundant species measured at four remote sites; Figure S2. Scatter plots of (a) ethylbenzene versus m,p-Xylene at the four remote sites. Figure S3. The main air masses arrived at the four remote sites. Table S1. OH reactivity and OFP of major NMHC at four remote sites.

Author Contributions

Investigation, J.S. and Y.W.; writing—original draft preparation, F.W.; writing—review and editing, Z.L. All authors have read and agreed to the published version of the manuscript.

Funding

This research was funded by the National Natural Science Foundation of China (Grant No. 42375108), the Strategic Priority Research Program of the Chinese Academy of Sciences (Grant No. XDB0760200) and CAS Strategic Priority Research Program (Grant No. XDA05100100).

Institutional Review Board Statement

Not applicable.

Informed Consent Statement

Not applicable.

Data Availability Statement

Data will be made available on request to the corresponding author (liuzirui@mail.iap.ac.cn).

Acknowledgments

We acknowledge the tremendous efforts of all the scientists and technicians involved in the many aspects of the Campaign on Atmospheric Aerosol Research network of China (CARE-China).

Conflicts of Interest

The authors declare that they have no known competing financial interests or personal relationships that could have appeared to influence the work reported in this paper.

References

  1. Seinfeld, J.H.; Pandis, S.N. Atmospheric Chemistry and Physics: From Air Pollution to Climate Change; John Wiley & Sons: Hoboken, NJ, USA, 2012. [Google Scholar]
  2. Khan, A.; Kanwal, H.; Bibi, S.; Mushtaq, S.; Khan, A.; Khan, Y.H.; Mallhi, T.H. Volatile Organic Compounds and Neurological Disorders: From Exposure to Preventive Interventions. In Environmental Contaminants and Neurological Disorders; Emerging Contaminants and Associated Treatment Technologies, Akash, M.S.H., Rehman, K., Eds.; Springer: Cham, Switzerland, 2021. [Google Scholar] [CrossRef]
  3. Han, J.; Liu, Z.; Hu, B.; Zhu, W.; Tang, G.; Liu, Q.; Ji, D.; Wang, Y. Observations and explicit modeling of summer and autumn ozone formation in urban Beijing: Identification of key precursor species and sources. Atmos. Environ. 2023, 309, 119932. [Google Scholar] [CrossRef]
  4. Xue, L.K.; Wang, T.; Guo, H.; Blake, D.R.; Tang, J.; Zhang, X.C.; Saunders, S.M.; Wang, W.X. Sources and photochemistry of volatile organic compounds in the remote atmosphere of western China: Results from the Mt. Waliguan Observatory. Atmos. Chem. Phys. 2013, 13, 8551–8567. [Google Scholar] [CrossRef]
  5. Xu, Y.; Yan, Y.; Duan, X.; Peng, L.; Wu, J.; Zhang, X.; Wei, X.; Liu, Z.; Zhang, D.; Wei, X. Diurnal variation and source analysis of NMHCs at a background site of Nam Co (4730 m a.s.l.) in the interior area of Tibetan Plateau. Atmos. Pollut. Res. 2022, 13, 101520. [Google Scholar] [CrossRef]
  6. Xue, X.; Zha, F.; Wang, Y.; Zhang, Y.; Wang, Y.; Shen, Y.; Kang, Y.; Yao, D.; Tang, G.; Bian, J.; et al. Vertical distributions of VOCs in the Tibetan Plateau background region. Atmos. Ocean. Sci. Lett. 2024, 17, 100516. [Google Scholar] [CrossRef]
  7. Ye, C.; Guo, S.; Lin, W.; Tian, F.; Wang, J.; Zhang, C.; Chi, S.; Chen, Y.; Zhang, Y.; Zeng, L.; et al. Measurement report: Source apportionment and environmental impacts of volatile organic compounds (VOCs) in Lhasa, a highland city in China. Atmos. Chem. Phys. 2023, 23, 10383–10397. [Google Scholar] [CrossRef]
  8. Okamoto, S.; Tanimoto, H. A review of atmospheric chemistry observations at mountain sites. Prog. Earth Planet. Sci. 2016, 3, 34. [Google Scholar] [CrossRef]
  9. Cong, Z.; Kang, S.; Kawamura, K.; Liu, B.; Wan, X.; Wang, Z.; Gao, S.; Fu, P. Carbonaceous aerosols on the south edge of the Tibetan Plateau: Concentrations, seasonality and sources. Atmos. Chem. Phys. 2015, 15, 1573–1584. [Google Scholar] [CrossRef]
  10. Xu, W.; Xu, X.; Lin, M.; Lin, W.; Tarasick, D.; Tang, J.; Ma, J.; Zheng, X. Long-term trends of surface ozone and its influencing factors at the Mt Waliguan GAW station, China—Part 2: The roles of anthropogenic emissions and climate variability. Atmos. Chem. Phys. 2018, 18, 773–798. [Google Scholar] [CrossRef]
  11. Liu, Z.; Gao, W.; Yu, Y.; Hu, B.; Xin, J.; Sun, Y.; Wang, L.; Wang, G.; Bi, X.; Zhang, G.; et al. Characteristics of PM2.5 mass concentrations and chemical species in urban and background areas of China: Emerging results from the CARE-China network. Atmos. Chem. Phys. 2018, 18, 8849–8871. [Google Scholar] [CrossRef]
  12. Zhang, J.; Sun, Y.; Wu, F.; Sun, J.; Wang, Y. The characteristics, seasonal variation and source apportionment of VOCs at Gongga Mountain, China. Atmos. Environ. 2014, 88, 297–305. [Google Scholar] [CrossRef]
  13. Qin, G.; Gao, S.; Fu, Q.; Fu, S.; Jia, H.; Zeng, Q.; Fan, L.; Ren, H.; Cheng, J. Investigation of VOC characteristics, source analysis, and chemical conversions in a typical petrochemical area through 1-year monitoring and emission inventory. Environ. Sci. Pollut. Res. 2022, 29, 51635–51650. [Google Scholar] [CrossRef] [PubMed]
  14. Atkinson, R.; Arey, J. Atmospheric degradation of volatile organic compounds. Chem. Rev. 2003, 103, 4605–4638. [Google Scholar] [CrossRef] [PubMed]
  15. Carter, W.P. Development of ozone reactivity scales for volatile organic compounds. Air Waste 1994, 44, 881–899. [Google Scholar] [CrossRef]
  16. Atkinson, R.; Baulch, D.L.; Cox, R.A.; Crowley, J.N.; Hampson, R.F.; Hynes, R.G.; Jenkin, M.E.; Rossi, M.J.; Troe, J.; IUPAC Subcommittee. Evaluated kinetic and photochemical data for atmospheric chemistry: Volume II-gas phase reactions of organic species. Atmos. Chem. Phys. 2006, 6, 3625–4055. [Google Scholar] [CrossRef]
  17. Tang, J.H.; Chan, L.Y.; Chan, C.Y.; Li, Y.S.; Chang, C.C.; Liu, S.C.; Wu, D.; Li, Y.D. Characteristics and diurnal variations of NMHCs at urban, suburban, and rural sites in the Pearl River Delta and a remote site in South China. Atmos. Environ. 2007, 41, 8620–8632. [Google Scholar] [CrossRef]
  18. Suthawaree, J.; Kato, S.; Okuzawa, K.; Kanaya, Y.; Pochanart, P.; Akimoto, H.; Wang, Z.; Kajii, Y. Measurements of volatile organic compounds in the middle of Central East China during Mount Tai Experiment 2006 (MTX2006): Observation of regional background and impact of biomass burning. Atmos. Chem. Phys. 2010, 10, 1269–1285. [Google Scholar] [CrossRef]
  19. Tang, J.-H.; Chan, L.-Y.; Chan, C.-Y.; Li, Y.-S.; Chang, C.-C.; Liu, S.-C.; Li, Y.-D. Nonmethane hydrocarbons in the transported and local air masses at a clean remote site on Hainan Island, south China. J. Geophys. Res. 2007, 112, 1–12. [Google Scholar] [CrossRef]
  20. Tang, J.H.; Chan, L.Y.; Chang, C.C.; Liu, S.; Li, Y.S. Characteristics and sources of non-methane hydrocarbons in background atmospheres of eastern, southwestern, and southern China. J. Geophys. Res. 2009, 114, 1–18. [Google Scholar] [CrossRef]
  21. Blake, N.J.; Blake, D.R.; Sive, B.C.; Chen, T.-Y.; Rowland, F.S.; Collins, J.E.; Sachse, G.W.; Anderson, B.E. Biomass burning emissions and vertical distribution of atmospheric methyl halides and other reduced carbon gases in the South Atlantic region. J. Geophys. Res. Atmos. 1996, 101, 24151–24164. [Google Scholar] [CrossRef]
  22. Iwasa, Y.; Hayashi, R.; Satake, A. Optimal seasonal schedule for the production of isoprene, a highly volatile biogenic VOC. Sci. Rep. 2024, 14, 12311. [Google Scholar] [CrossRef]
  23. Guo, H.; So, K.L.; Simpson, I.J.; Barletta, B.; Meinardi, S.; Blake, D.R. C1–C8 volatile organic compounds in the atmosphere of Hong Kong: Overview of atmospheric processing and source apportionment. Atmos. Environ. 2007, 41, 1456–1472. [Google Scholar] [CrossRef]
  24. Mula, V.; Bogdanov, J.; Petreska Stanoeva, J.; Zeneli, L.; Mehmeti, V.; Gelmini, F.; Daci, A.; Berisha, A.; Zdravkovski, Z.; Beretta, G. Semi-Quantitative Characterization of Volatile Organic Compounds in Indoor and Outdoor Air Using Passive Samplers: A Case Study of Milan, Italy. Atmosphere 2025, 16, 1088. [Google Scholar] [CrossRef]
  25. Pinthong, N.; Thepanondh, S.; Kondo, A. Source Identification of VOCs and their Environmental Health Risk in a Petrochemical Industrial Area. Aerosol Air Qual. Res. 2022, 22, 210064. [Google Scholar] [CrossRef]
  26. Zhang, Z.; Wang, X.; Zhang, Y.; Lu, S.; Huang, Z.; Huang, X.; Wang, Y. Ambient air benzene at background sites in China’s most developed coastal regions: Exposure levels, source implications and health risks. Sci. Total Environ. 2015, 511, 792–800. [Google Scholar] [CrossRef]
  27. Kaushik, N.; Mishra, A.K.; Das, R.M. Assessment of benzene and toluene emissions in National Capital Region (NCR): Implications for health risks and ozone formation. Air Qual. Atmos. Health 2024, 17, 3015–3029. [Google Scholar] [CrossRef]
  28. Ho, K.F.; Lee, S.C.; Ho, W.K.; Blake, D.R.; Cheng, Y.; Li, Y.S.; Ho, S.S.H.; Fung, K.; Louie, P.K.K.; Park, D. Vehicular emission of volatile organic compounds (VOCs) from a tunnel study in Hong Kong. Atmos. Chem. Phys. 2009, 9, 7491–7504. [Google Scholar] [CrossRef]
  29. Leuchner, M.; Rappenglück, B. VOC source–receptor relationships in Houston during TexAQS-II. Atmos. Environ. 2010, 44, 4056–4067. [Google Scholar] [CrossRef]
  30. McMeeking, G.R.; Kreidenweis, S.M.; Baker, S.; Carrico, C.M.; Chow, J.C.; Collett, J.L.; Hao, W.M.; Holden, A.S.; Kirchstetter, T.W.; Malm, W.C. Emissions of trace gases and aerosols during the open combustion of biomass in the laboratory. J. Geophys. Res.-Atmos. 2009, 114, 5577–5594. [Google Scholar] [CrossRef]
  31. Xu, J.; Ma, J.Z.; Zhang, X.L.; Xu, X.B.; Xu, X.F.; Lin, W.L.; Wang, Y.; Meng, W.; Ma, Z.Q. Measurements of ozone and its precursors in Beijing during summertime: Impact of urban plumes on ozone pollution in downwind rural areas. Atmos. Chem. Phys. 2011, 11, 12241–12252. [Google Scholar] [CrossRef]
  32. Wang, H.L.; Chen, C.H.; Wang, Q.; Huang, C.; Su, L.Y.; Huang, H.Y.; Lou, S.R.; Zhou, M.; Li, L.; Qiao, L.P.; et al. Chemical loss of volatile organic compounds and its impact on the source analysis through a two-year continuous measurement. Atmos. Environ. 2013, 80, 488–498. [Google Scholar] [CrossRef]
  33. Song, Y.; Shao, M.; Liu, Y.; Lu, S.; Kuster, W.; Goldan, P.; Xie, S. Source apportionment of ambient volatile organic compounds in Beijing. Environ. Sci. Technol. 2007, 41, 4348–4353. [Google Scholar] [CrossRef] [PubMed]
  34. Liu, Y.; Shao, M.; Fu, L.; Lu, S.; Zeng, L.; Tang, D. Source profiles of volatile organic compounds (VOCs) measured in China: Part I. Atmos. Environ. 2008, 42, 6247–6260. [Google Scholar] [CrossRef]
  35. Liu, J.; Mu, Y.; Zhang, Y.; Zhang, Z.; Wang, X.; Liu, Y.; Sun, Z. Atmospheric levels of BTEX compounds during the 2008 Olympic Games in the urban area of Beijing. Sci. Total Environ. 2009, 408, 109–116. [Google Scholar] [CrossRef] [PubMed]
  36. Wang, Y.; Fang, F.; Li, J.; Zhang, P.; Ji, Z.; Shi, J.; Huang, J. High effective supersaturation offsets low aerosol hygroscopicity to promote orographic cloud formation over the southern Tibetan Plateau. npj Clim. Atmos. Sci. 2025, 8, 231. [Google Scholar] [CrossRef]
  37. Zhao, R.; Dou, X.; Zhang, N.; Zhao, X.; Yang, W.; Han, B.; Yu, H.; Azzi, M.; Wang, Y.; Bai, Z. The characteristics of inorganic gases and volatile organic compounds at a remote site in the Tibetan Plateau. Atmos. Res. 2020, 234, 104740. [Google Scholar] [CrossRef]
  38. Zhang, Y.; Xu, W.; Zhou, W.; Li, Y.; Zhang, Z.; Du, A.; Qiao, H.; Kuang, Y.; Liu, L.; Zhang, Z.; et al. Characterization of organic vapors by a Vocus proton-transfer-reaction mass spectrometry at a mountain site in southeastern China. Sci. Total Environ. 2024, 919, 170633. [Google Scholar] [CrossRef]
  39. Andreae, M.O.; Merlet, P. Emission of trace gases and aerosols from biomass burning. Glob. Biogeochem. Cycles 2001, 15, 955–966. [Google Scholar] [CrossRef]
  40. Liu, B.; Kang, S.; Sun, J.; Zhang, Y.; Xu, R.; Wang, Y.; Liu, Y.; Cong, Z. Wet precipitation chemistry at a high-altitude site (3326 m a.s.l.) in the southeastern Tibetan Plateau. Environ. Sci. Pollut. Res. Int. 2013, 20, 5013–5027. [Google Scholar] [CrossRef]
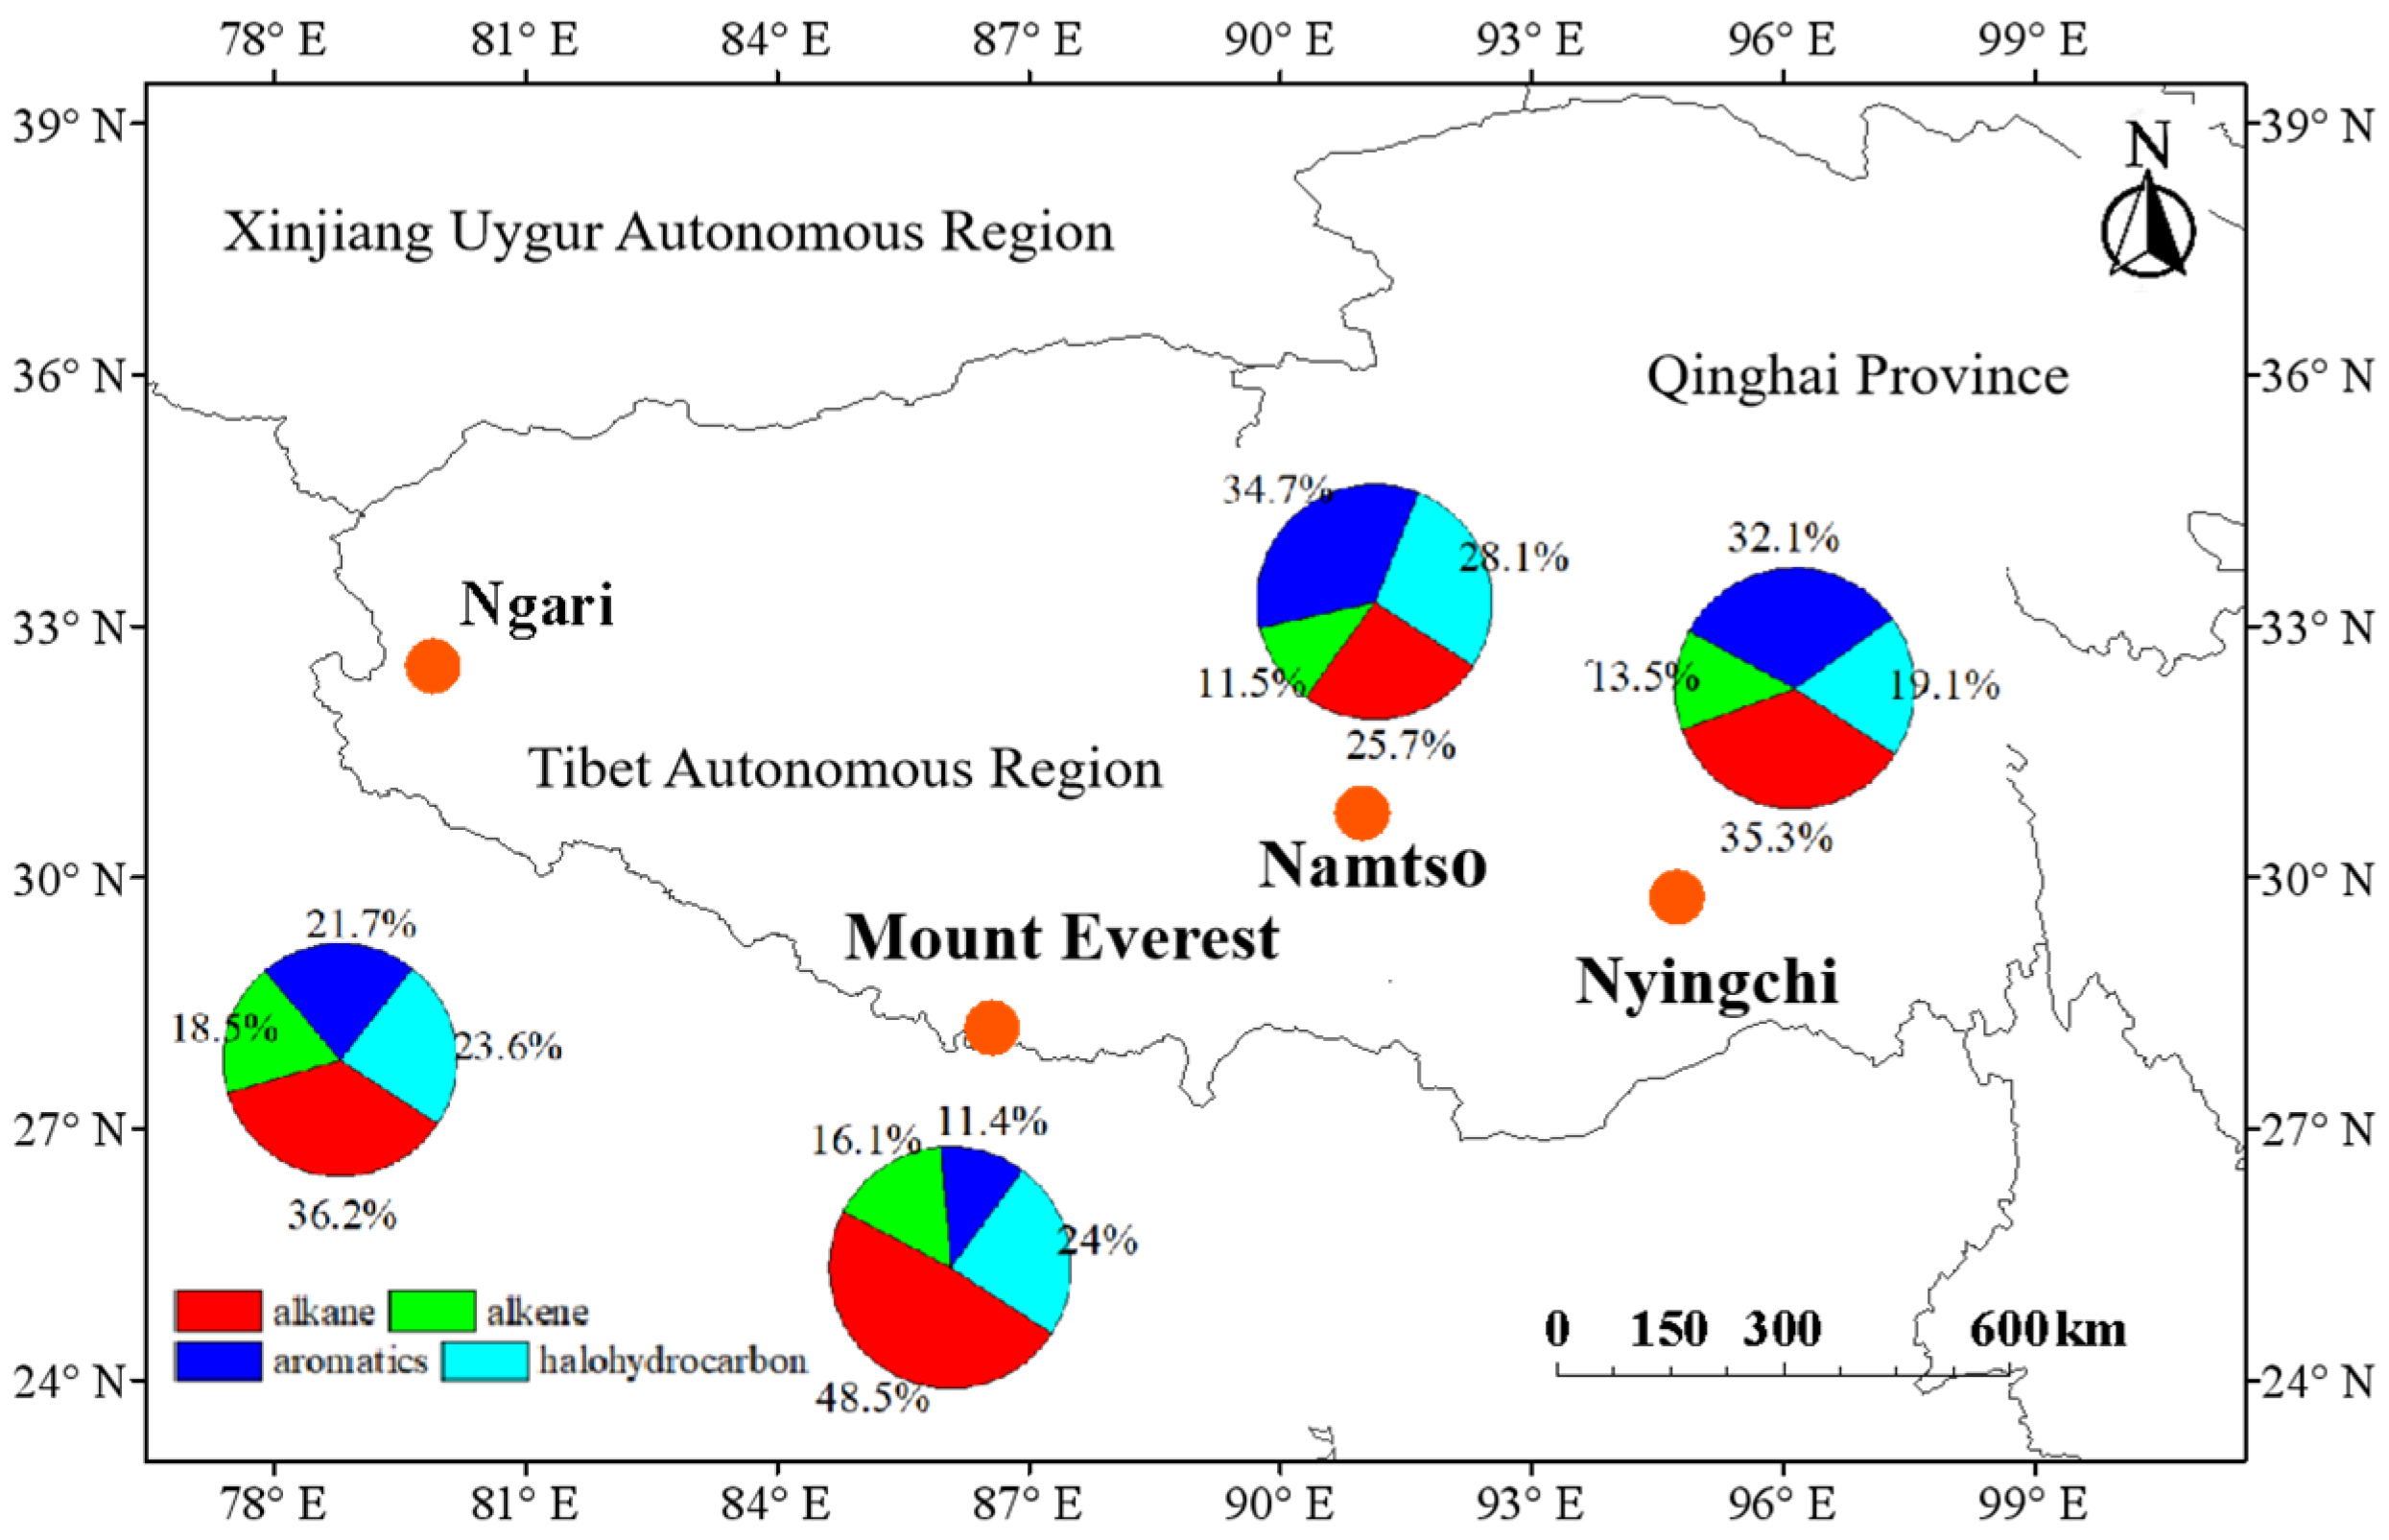
Figure 1. Location of the four samples sites in the Tibet plateau and the averaged chemical composition of VOCs during the observation period.
Atmosphere 16 01148 g001
Figure 2. Average concentration of TVOCs and specific VOCs (alkane, alkene, aromatics and halohydrocarbon) at the four remote sites.
Atmosphere 16 01148 g002
Figure 3. The monthly average mixing ratio of (a) the Total Non-Methane Hydrocarbons (TNMHC) and (be) the four major VOC species at the four remote sites.
Atmosphere 16 01148 g003
Figure 4. Percentage contributions of alkanes, alkenes, aromatics and biogenic to total LOH (ad) and OFP (eh) at the four remote sites.
Atmosphere 16 01148 g004
Figure 5. Scatter plots (a) benzene versus toluene (b) benzene versus chloromethane; (c) toluene versus isopentane and (d) isoprene versus isopentane at the four remote sites. r is the correlation coefficient and p is the significance level. r > 0.5 and p < 0.05 were used as critical values for significant correlations.
Atmosphere 16 01148 g005
Table 1. Comparison of major hydrocarbon levels at four remotes with observations at other remote sites in China.
NyingchiNamtsoNgariMount EverestMt.Gongga aMt. Tai bMT.
JM c
Waliguan dLin’an eTM f
HydrocarbonApril 2012–October 2014 (n = 80)January 2012–October 2014 (n = 102)April 2012–February 2014 (n = 71)January 2012–November 2014 (n = 131)2008–2011June 2006;7–13 and 16–18 April 20052003 (spring)2003 (summer)April–May 2004April–May 2004
propane0.210.190.430.36 0.62 (0.33)0.32 (0.19)0.28 (0.11)0.15 (0.04)1.24 (0.56)0.23 (0.07)
Isobutane0.440.250.170.290.27 (0.26)0.16 (0.08)0.07 (0.05)0.06 (0.05)0.03 (0.02)0.42 (0.26)0.03 (0.010)
Butane0.270.240.320.200.20 (0.16)0.21 (0.14)0.10 (0.09)0.07 (0.04)0.04 (0.02)0.47 (0.26)0.06 (0.03)
isopentane0.270.120.270.230.47 (0.50)0.17 (0.09)0.08 (0.04)0.06 (0.06)0.07 (0.08)0.31 (0.28)0.15 (0.12)
Pentane0.140.110.130.070.22 (0.23)0.09 (0.05)0.04 (0.04)0.02 (0.01)0.02 (0.01)0.15 (0.11)0.12 (0.04)
propene0.120.050.320.23 0.11 (0.05)0.13 (0.07)0.03 (0.02)0.03 (0.02)0.34 (0.30)0.17 (0.07)
isoprene0.300.040.200.080.40 (0.59)0.17 (0.18)0.48 (0.47)0.006 (0.02)0.13 (0.29)0.23 (0.52)0.16 (0.05)
Benzene0.340.160.180.200.72 (0.64)0.64 (0.35)0.21 (0.11)0.09 (0.05)0.07 (0.04)1.01 (0.63)0.24 (0.07)
Toluene0.460.200.340.150.44 (0.33)0.21 (0.12)0.09 (0.06)0.18 (0.27)0.06 (0.06)1.81 (1.60)0.16 (0.10)
Ethylbenzene0.190.200.100.050.28 (0.42)0.06 (0.08)0.02 (0.01)0.02 (0.04)0.007 (0.006)0.21 (0.16)0.03 (0.04)
m/p-Xylene0.170.260.140.070.28 (0.42)0.04 (0.07)0.04 (0.02)0.120.01 (0.01)0.500.06 (0.10)
o-Xylene0.140.230.120.050.31 (0.43)0.08 (0.07)0.02 (0.01)0.05 (0.08)0.009 (0.007)0.15 (0.14)0.03 (0.05)
a Zhang et al. (2014) [12]. b Suthawaree et al. (2010) [18]. c,e,f Tang et al. (2007a,b) [17,19]; Tang et al. (2009) [20]. d Xue et al. (2013) [4].
Table 2. Pearson’s correlations between benzene, toluene and typical tracers of emission sources at each sampling site during the four seasons. r is the correlation coefficient and p is the significance level. r > 0.5 and p < 0.05 were used as critical values for significant correlations.
SiteSeasonToluene/BenzeneChloromethane/BenzeneIsopentane/TolueneSiteSeasonToluene/Benzene
rprprp
Nyingchiwinter0.84p < 0.0010.71p < 0.001−0.01p > 0.05
spring0.38p < 0.050.54p < 0.010.56p < 0.01
summer0.51p < 0.01−0.47p > 0.050.90p < 0.001
autumn0.90p < 0.0010.57p < 0.0010.53p < 0.01
Namstowinter0.88p < 0.0010.40p < 0.050.45p < 0.05
spring0.80p < 0.0010.43p < 0.050.57p < 0.05
summer0.38p > 0.050.13p > 0.050.79p < 0.001
autumn0.83p < 0.0010.89p < 0.0010.69p < 0.001
Ngariwinter0.64p < 0.0010.70p < 0.001−0.11p > 0.05
spring0.58p < 0.010.52p < 0.0010.74p < 0.001
summer0.91p < 0.0010.32p > 0.050.83p < 0.001
autumn0.81p < 0.0010.41p < 0.050.51p < 0.01
Mount Everestwinter0.78p < 0.0010.52p < 0.010.31p > 0.05
spring0.60p < 0.0010.50p < 0.010.51p < 0.01
summer0.60p < 0.001−0.24p > 0.050.77p < 0.001
autumn0.30p > 0.050.12p > 0.05−0.01p > 0.05
Table 3. Classification of selected VOCs in different air mass groups at four remote sites.
Site Nyingchi Namsto Ngari Mount Everest
Species (ppb)NW (10%)West (24%)South (66%)NW (30%)West (53%)South (27%)NW (13%)West (59%)South (28%)NW (15%)West (62%)South (23%)
Benzene0.100.280.420.120.200.180.100.200.200.150.220.22
Toluene 0.310.450.590.140.250.270.190.380.360.100.210.08
Ethylbenzene0.180.150.270.160.190.350.070.110.040.040.060.03
m/p-Xylene0.130.150.320.170.280.510.110.150.100.050.070.08
o-Xylene0.110.110.210.170.240.400.090.130.100.030.060.05
isoprene0.190.320.310.040.040.040.080.200.160.040.090.06
propane0.11 0.30 0.210.130.080.030.410.410.670.310.320.77
isopentane0.240.280.400.110.120.190.190.280.320.210.210.27
Chloromethane0.410.540.610.400.460.430.490.580.680.450.560.64
alkane3.593.033.281.301.771.561.883.412.523.433.995.26
alkene0.761.241.330.570.730.860.811.591.901.041.431.64
aromatics2.342.653.171.382.473.031.161.891.340.801.040.85
NMHC6.696.917.783.304.975.453.856.895.765.276.457.75
Disclaimer/Publisher’s Note: The statements, opinions and data contained in all publications are solely those of the individual author(s) and contributor(s) and not of MDPI and/or the editor(s). MDPI and/or the editor(s) disclaim responsibility for any injury to people or property resulting from any ideas, methods, instructions or products referred to in the content.