Article

Excitation of ULF, ELF, and VLF Resonator and Waveguide Oscillations in the Earth–Atmosphere–Ionosphere System by Lightning Current Sources Connected with Hunga Tonga Volcano Eruption

by
Yuriy G. Rapoport
1,*,
Volodymyr V. Grimalsky
2,*,
Andrzej Krankowski
1,
Asen Grytsai
3,
Sergei S. Petrishchevskii
3,
Leszek Błaszkiewicz
1 and
Chieh-Hung Chen
4
1
Space Radio-Diagnostics Research Centre, University of Warmia and Mazury in Olsztyn, 10-719 Olsztyn, Poland
2
Center of Investigations on Engineering and Applied Science (CIICAp), Institute of Investigations on Basic and Applied Science (IICBA), Autonomous University of State Morelos (UAEM), Cuernavaca 62209, Mexico
3
Faculty of Physics, Taras Shevchenko National University of Kyiv, 03022 Kyiv, Ukraine
4
State Key Laboratory of Geohazard Prevention and Geoenvironment Protection, Chengdu University of Technology, Chengdu 610059, China
*
Authors to whom correspondence should be addressed.
Atmosphere 2025, 16(1), 97; https://doi.org/10.3390/atmos16010097
Submission received: 19 November 2024 / Revised: 20 December 2024 / Accepted: 7 January 2025 / Published: 16 January 2025
(This article belongs to the Special Issue Feature Papers in Upper Atmosphere (2nd Edition))

Abstract

:
The simulations presented here are based on the observational data of lightning electric currents associated with the eruption of the Hunga Tonga volcano in January 2022. The response of the lithosphere (Earth)–atmosphere–ionosphere–magnetosphere system to unprecedented lightning currents is theoretically investigated at low frequencies, including ultra low frequency (ULF), extremely low frequency (ELF), and very low frequency (VLF) ranges. The electric current source due to lightning near the location of the Hunga Tonga volcano eruption has a wide-band frequency spectrum determined in this paper based on a data-driven approach. The spectrum is monotonous in the VLF range but has many significant details at the lower frequencies (ULF, ELF). The decreasing amplitude tendency is maintained at frequencies exceeding 0.1 Hz. The density of effective lightning current in the ULF range reaches the value of the order of 10−7 A/m2. A combined dynamic/quasi-stationary method has been developed to simulate ULF penetration through the lithosphere (Earth)–atmosphere–ionosphere–magnetosphere system. This method is suitable for the ULF range down to 10−4 Hz. The electromagnetic field is determined from the dynamics in the ionosphere and from a quasi-stationary approach in the atmosphere, considering not only the electric component but also the magnetic one. An analytical/numerical method has been developed to investigate the excitation of the global Schumann resonator and the eigenmodes of the coupled Schumann and ionospheric Alfvén resonators in the ELF range and the eigenmodes of the Earth–ionosphere waveguide in the VLF range. A complex dispersion equation for the corresponding disturbances is derived. It is shown that oscillations at the first resonance frequency in the Schumann resonator can simultaneously cause noticeable excitation of the local ionospheric Alfvén resonator, whose parameters depend on the angle between the geomagnetic field and the vertical direction. VLF propagation is possible over distances of 3000–10,000 km in the waveguide Earth–ionosphere. The results of simulations are compared with the published experimental data.

1. Introduction

The eruption of the Hunga Tonga–Hunga Ha’apai volcano in January 2022 had such a strong and global impact on the lithosphere (Earth)–atmosphere–ionosphere–magnetosphere (LEAIM) system that it broke the cognitive barrier in the field of research of coupling in the LEAIM. For about 30 years, there were debates between two groups of investigators. The investigators from the first of these groups stated that the space weather in near-Earth space is formed only by influences “from above”, that is, from the Sun, the solar wind, and the magnetosphere. The investigators of the second group argued that the influences “from below”, i.e., from powerful tropical cyclones/typhoons, volcanoes, and earthquakes, can also have a formative effect, particularly on ionospheric space weather [1,2,3,4]. After the recent eruption of the Hunga Tonga volcano, this dispute can be resolved in favor of the specialists of the second group.
This is supported, in particular, by the statement presented on the NASA website (Thomas, V. NASA Mission Finds Tonga Volcanic Eruption Effects Reached Space; 2022. Available online: https://www.nasa.gov/missions/icon/nasa-mission-finds-tonga-volcanic-eruption-effects-reached-space/, accessed on 1 January 2025) and by [5]. The greatest impact of this, one of the most powerful explosions of the modern era, on space weather is due to the enormous electrification at mesospheric altitudes. This electrification was ensured by reaching mesospheric heights by an umbrella cloud connected with the interaction of magma and water in an underwater vent [6,7,8].
The powerful explosion and the subsequent plume generated acoustic-gravity waves (AGW), which were detected by ground-based instruments around the world [9]. A rich collection of remarkable nonlinear phenomena in the ionospheric plasma was also observed. They include traveling ionospheric disturbances (TIDs), in particular electrified medium-scale TIDs excited by electric dynamo fields with a response in the magnetic conjugated region, electron density holes around the volcano, plasma bubbles, and 4-min fluctuations in the plasma flow associated with the acoustic resonance. Note that in this case, disturbances can be transmitted from the southern to the northern hemisphere to the magnetically conjugated point by the electric field and not by an acoustic wave, which emphasizes the importance of the electromagnetic (EM) interaction in connection with the propagation of disturbances in the atmosphere–ionosphere [8].
The exceptional speed of the massive eruption (>5 × 10⁹ kg/s) and the rapid expansion of the umbrella cloud, entraining large amounts of seawater which evaporated as a result of the interaction of magma and water in the submarine vent, led to super-intense thunderstorm activity with unprecedented lightning intensity and rate (>2600 flashes per minute), at an altitude of approximately 30 km in the atmosphere, where they were observed [7]. This lightning rate significantly exceeded that of usual intensive thunderstorms (120 flashes per minute in accordance with [10]). In previously published works devoted to lightning discharges associated with the Hunga Tonga eruption, the characteristics, including spectral, of low-frequency sources of lightning currents, including those simultaneously in the ULF, ELF, and VLF ranges, were not determined (see, for example [6,7,11]). Such characteristics are carried out in this article.
The characteristics of the ionospheric response to the low-frequency EM radiation from unprecedented lightning sources associated with the Hunga Tonga volcano eruption (LCSHTE) in January 2022 have not yet been systematically determined. This response is expected to be significant, making its investigation an important part of studying wave coupling in the LEAIM. In particular, low-frequency EM excitation includes ULF fields generated by lightning currents and penetrating through the atmosphere–ionosphere, ELF excitations in the Schumann resonator (SR) and coupled global Schumann and local ionospheric Alfvén resonators (CSIAR), and VLF EM waves in the waveguide Earth–ionosphere (WGEI) [6,8,10,11,12,13,14,15]. Note that the experimental data characterizing lightning discharges associated with the eruption of the Hunga Tonga volcano were published, for example, in [7]. In previous works associated with the Hunga Tonga eruption, excitations by lightning current low-frequency sources, including simultaneously the excitations in the ULF, ELF, and VLF ranges, were not determined (see, for example, [6,7,11]). This is presented for the first time in this paper.
In connection with the research, within the framework of low frequency, in particular ULF EM excitations by lightning currents, there is a need to solve one fundamental problem of atmospheric electricity. One of the key questions of the theory of atmospheric electricity, important for many practical applications, is an adequate description of electric fields at the frequencies corresponding to the lower frequency part of the ULF range [16,17,18,19,20,21,22]. Applications may include monitoring space weather [23,24], reducing the potential harm to humanity caused by severe magnetic storms [25], tropical cyclones/typhoons [26], earthquakes [27,28], volcanoes [14], and ionospheric monitoring of severe thunderstorms [29]. For geophysics, it is important to search for an influence on LEAIM of the powerful sources there, such as the solar terminator and typhoons [30]. Determining the role of local and global sources of atmospheric electricity in influencing the ionosphere [31,32,33,34] and constructing equivalent circuits are essential for practical calculations both for the Sun–solar wind and magnetosphere–ionosphere–atmosphere–Earth system in general and for the Earth–atmosphere–ionosphere in particular. Thunderstorms and other sources [33,34], such as charged clouds [35], convection generators of atmospheric electricity [36], etc., should be considered there.
In general, in the upper part of LEAIM, namely in the upper atmosphere–magnetosphere, the only adequate upper boundary condition for the Earth–atmosphere–ionosphere subsystem compatible with the principle of causality [21] is the condition of the radiation into the overlying regions of the ionosphere–magnetosphere. This condition accounts for the presence of regions with open geomagnetic field lines. The adequate model for representing the field in the above-mentioned subsystem of LEAIM is the dynamic one. This was substantiated in detail in [21]. Thus, the upper part of LEAIM can be called a “dynamic” region, according to the model that describes the field in this region. However, in the same frequency range in the lower isotropic part of LEAIM, the fields, both magnetic and electric ones, are quasi-stationary in nature, namely quasi-electrostatic and quasi-magnetostatic for electric and magnetic fields, respectively [37]. Therefore, it is natural to call this region quasi-stationary. The boundary between the dynamic and quasi-stationary regions is located, and accordingly, the boundary conditions are formulated at an altitude z = Lz within the range of altitudes (70–120) km. Then, two methodological questions arise in connection with ULF excitations. The first of these questions concerns a combined approach that takes into account the characteristics of the field in the dynamic and quasi-stationary regions. The second question concerns the possibility of a limiting transition in the region of the lower frequency part of the ULF range to a quasi-stationary representation in the atmosphere, taking into account both the electric and magnetic field components.
Consider the first of these questions. The system of differential equations for the EM field in the (upper) dynamic region of LEAIM reduces to the system of two second-order equations for tangential components, for example, of the electric Ex,y (or magnetic Hx,y) field [38]. Moreover, for the correct formulation of the problem of determining the EM field in the inhomogeneous LEAIM, two independent field components must be present both in the upper dynamic and in the lower quasi-stationary regions. As shown below in Section 4.1.1, it is convenient to choose the electrostatic potential φ and the vertical component of the magnetic field Hz. This critical aspect of atmospheric electricity has been largely overlooked, leaving a notable gap in its theoretical framework [21,38]. Note that purely dynamic models of the propagation of ULF fields were applied for LEAIM [39,40,41], including two independent components of the EM field. Electrostatic models with a single independent quantity, namely the electrostatic potential, were developed as the basis of the theory of atmospheric electricity [31,32,42,43,44]. The question is, can we combine the dynamical approach for the ionosphere and magnetosphere and the quasi-stationary approach for the atmosphere into a single, properly coupled model?
Consider the second of the nontrivial issues formulated above, namely the very existence of a limit transition from the dynamic approach to the quasi-stationary one. The importance of such a limit transition results from the fact that the permittivity of the medium changes by many orders of magnitude in the lower region of LEAIM from Earth’s surface to the lower part of the ionosphere E-region. This problem is nontrivial not only physically but also mathematically because it reduces to the so-called “stiff” problem for solving differential equations [45]. The question is, may this problem be solved by using a quasi-stationary approach to the atmospheric EM field in the ULF range? We conclude that, for adequate modeling of the penetration in the lower part of the frequency range of ULF waves through LEAIM, it is necessary to develop a special method. This method should combine the representation of the electromagnetic field in the ionosphere and the representation of both quasi-stationary electric and (the previously unaccounted) quasi-stationary magnetic fields in the atmosphere. Such a model must also include matching the ULF fields at the boundary between relevant dynamic and quasi-stationary regions and an adequate definition of the boundary mentioned above. Such a method has not yet been developed; see, for example, [17,46]. This gap in the theory of ULF waves propagating through LEAIM and, at the same time, in the theory of atmospheric electricity as a whole is filled in this article.
One of the most striking manifestations of the influence of the Hunga Tonga volcano eruption in January 2022 was the modulation of oscillations of SR [12,13]. The main approach to modeling the oscillations of SR has been based, until recently, on the spherical resonator model using spherical functions of mathematical physics [47]. In this case, Earth is considered spherically symmetric, and when taking into account the influence of the ionosphere on the effective impedance at the upper boundary of SR, the ionosphere is considered a homogeneous plasma medium [47]. In particular, the aforementioned model does not take into account the latitudinal and longitudinal inhomogeneities of the Earth–atmosphere–ionosphere system. The dependence of ionospheric parameters on height is not taken into account, and therefore, within the framework of such a model, it is impossible to consider the IAR; also, the difference between the shape of the Earth and the sphere is not accounted for. Currently, models based on the finite element method [48] are also being developed. To our knowledge, both classical [47] and recent studies on SR oscillations [13,48,49,50,51] have not addressed these questions. The models developed in this work enable a qualitative exploration of these issues.
The excitation of the CSIAR will be considered, and the quality factor Q will be evaluated for the Schumann resonance. The near-Earth space environment hosts multiple resonators [52], with this study focusing on SR oscillations. Results from [53] reveal a new possibility for our research, showing that Alfvén resonator disturbances are highly broadband. At the same time, the quality factor of the Alfvén resonator in the frequency range coinciding with the resonant frequencies of the SR is quite high for geophysical resonators; namely, it reaches values Q~(5 ÷ 20). Note also that the IAR, whose parameters depend on the angle between the geomagnetic field and the vertical axis [52,53], is a local resonator, unlike the global SR. Therefore, in addition to examining the excitation of SR by lightning current sources associated with the Hunga Tonga volcano eruption, we also consider the excitation of CSIAR. To our best knowledge, the dependence of the eigenfrequencies of CSIAR on the tilt of the geomagnetic field, taking into account the leakage of the electromagnetic field of the resonator into the upper ionosphere, as well as the possibility of effective resonant excitation of CSIAR through oscillations in the Schumann resonator, both in day and night conditions, have not been studied in previous works [51,54,55]. These results are presented in this article.
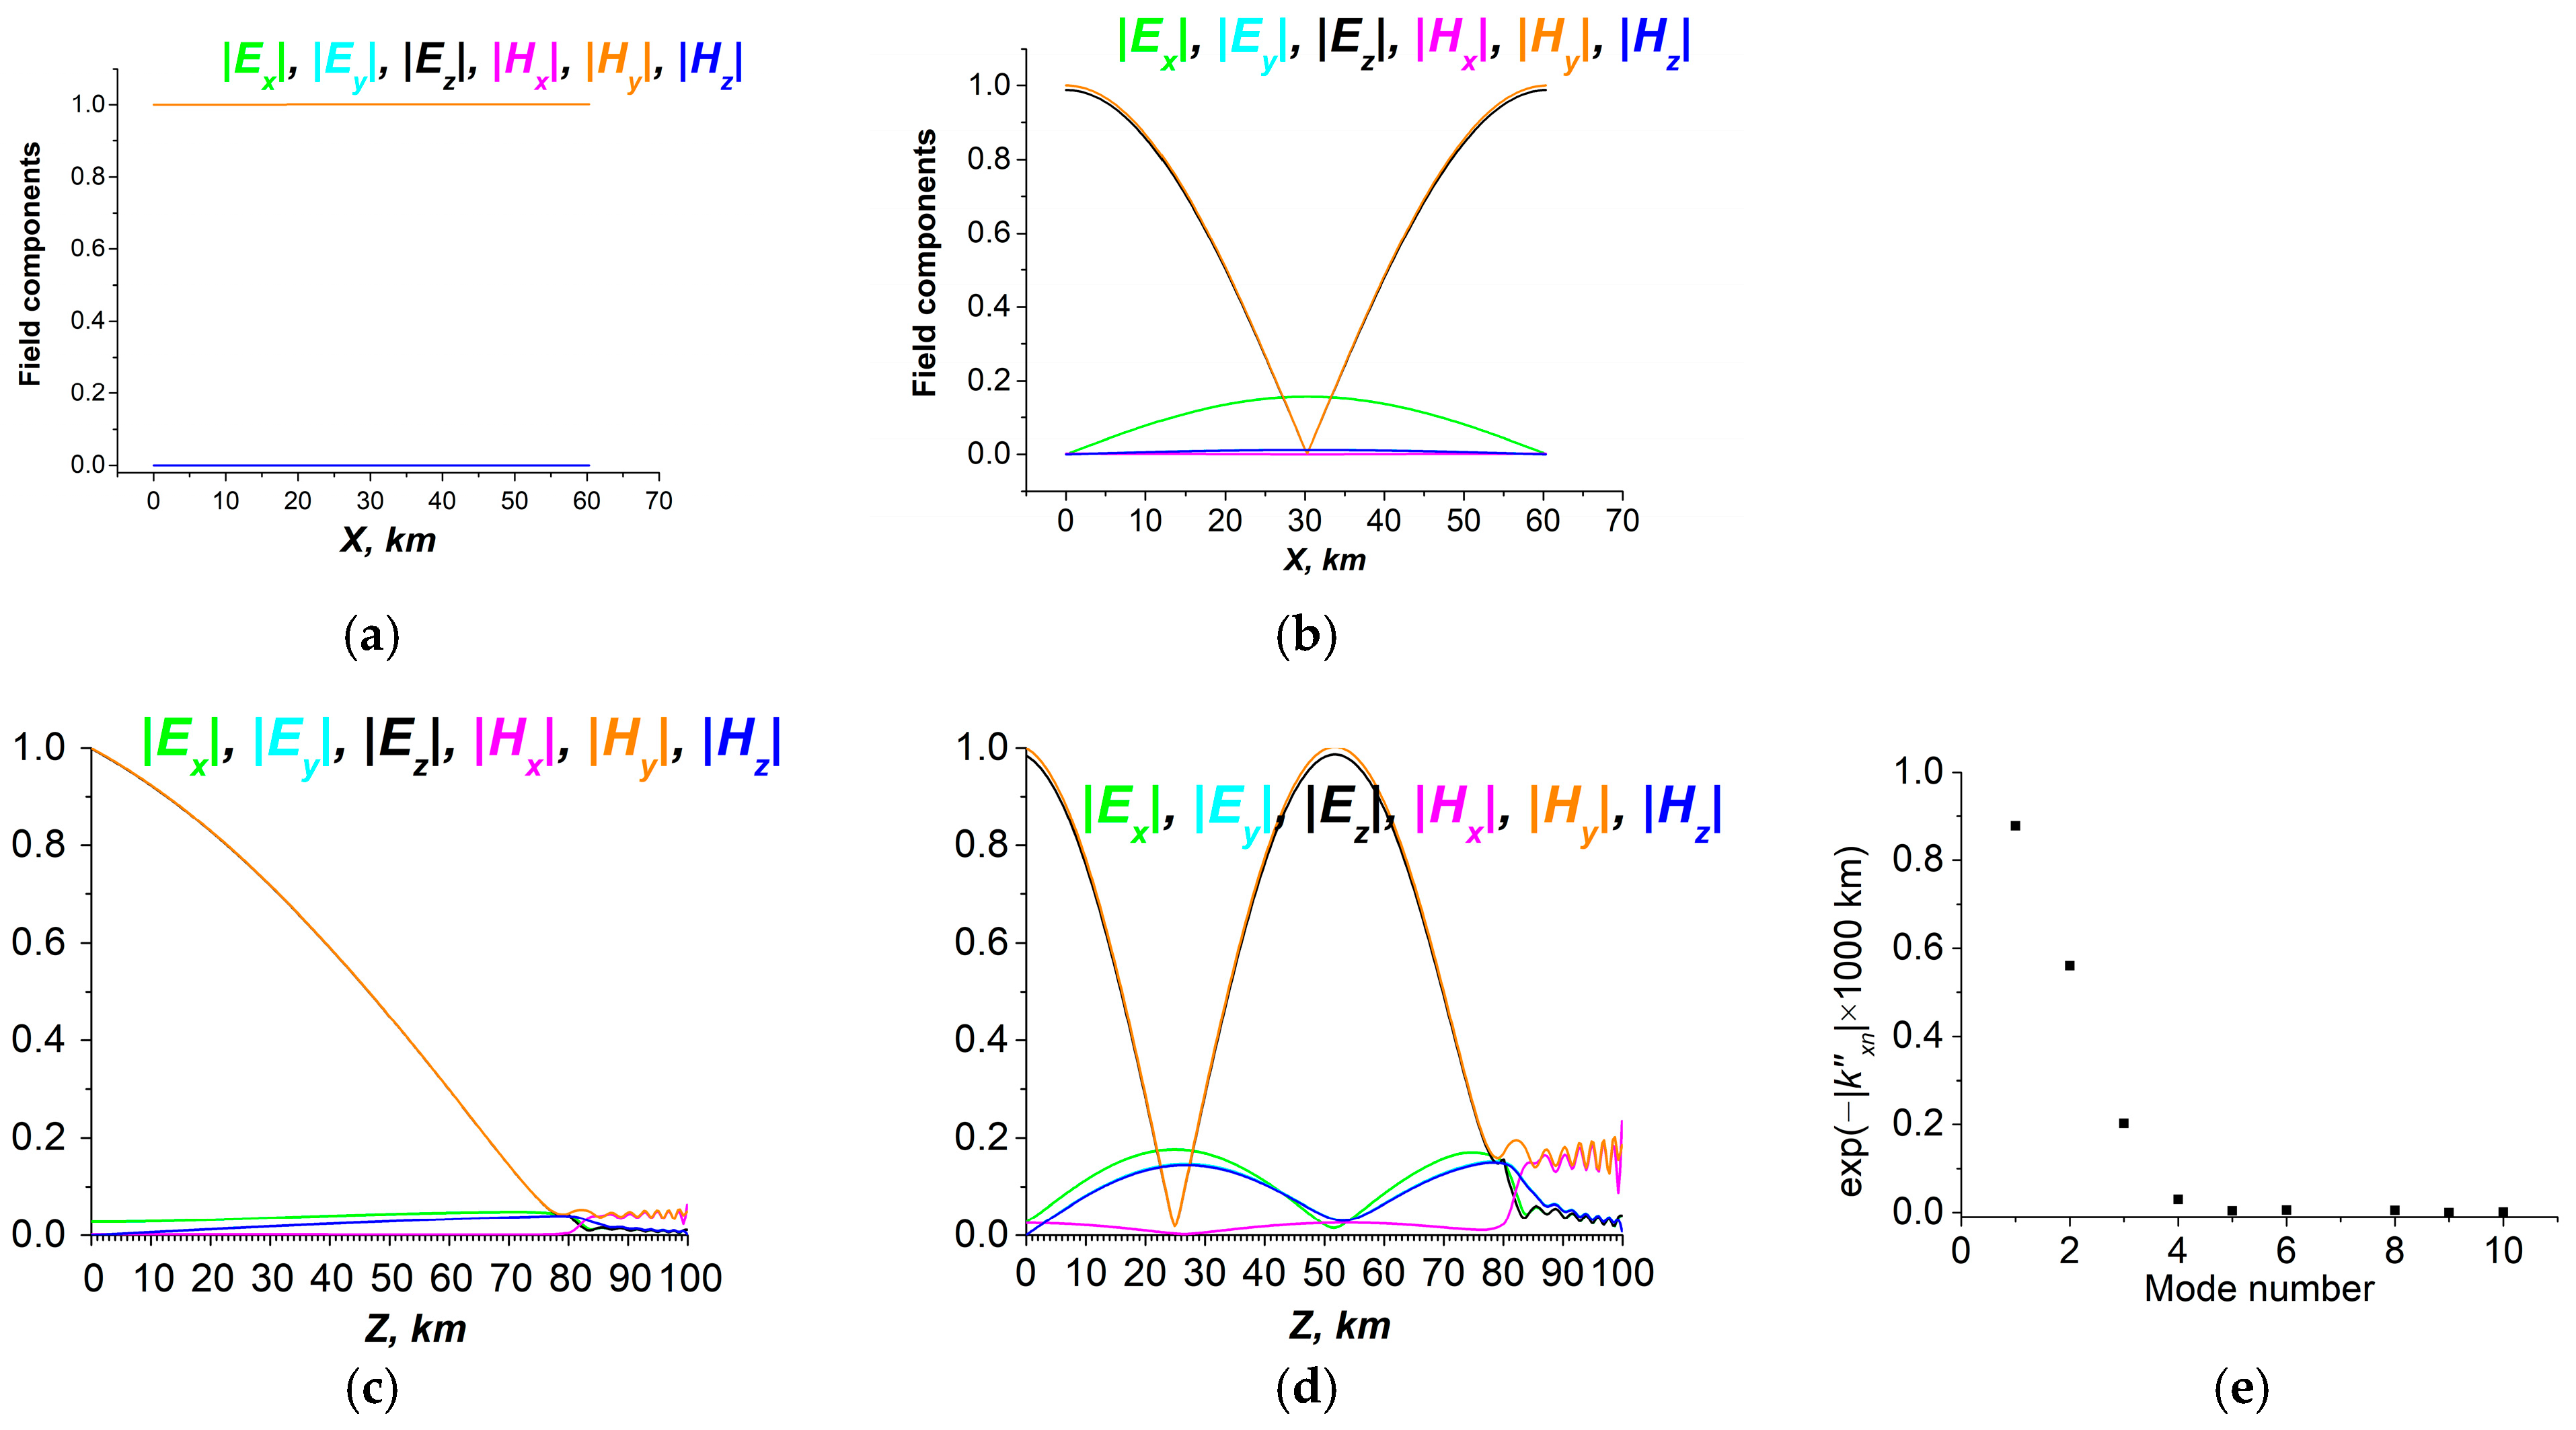
Finally, using models based on the tensor impedance method in multi-layered gyrotropic waveguides [56] and applying beam and eigenmode approaches, the excitation characteristics of VLF EM waves in WGEI by lightning current sources associated with the Hunga Tonga volcano eruption are determined. Note that the characteristics of the propagation of VLF disturbances in WGEI, simultaneously taking into account the leakage of the electromagnetic field into the upper ionosphere, obliqueness of the geomagnetic field, and vertical inhomogeneity of the ionospheric plasma, have not been previously studied with a comparison of results obtained by (i) the beam method in WGEI with a tensor impedance boundary condition at the upper boundary of WGEI and (ii) the complex mode method in WGEI, and with comparison with observations of VLF disturbances generated by current sources associated with eruptions of the Hunga Tonga volcano (see, for example [56,57,58]). The corresponding results are presented in this work.
The theoretical methods we investigate are applicable to radio diagnostics. Radio diagnostics is an important method of monitoring ionospheric space weather events. There are influences on the ionosphere “from above”, like solar flares [59], the strongest magnetic storms [60], etc. Some processes develop inside the ionosphere, including the nonlinear stage of plasma instabilities and turbulence. The influences “from below” include the strongest tropical cyclones/hurricanes, earthquakes, and the strongest volcano eruptions, such as Hunga Tonga [61,62]. Radio diagnostics can utilize, for example, VLF [63], GNSS, and LOFAR systems [64,65]. A complex approach, including radio diagnostics, is important for the search for the physical phenomena that determine ionospheric space weather perturbations, such as perturbations in TEC, geomagnetic fields, penetration from the lower atmosphere to the ionosphere of the ULF AGW, ULF EM fields, the formation of plasma bubbles and ion holes, strong lightning discharges, etc. [8,66].
The subject of the research in this work is low-frequency oscillations excited by the extraordinary lightning current source associated with the Hunga Tonga eruption (LCSHTE). We investigate low-frequency perturbations of ULF, ELF, and VLF ranges due to these current sources. The analysis of low-frequency excitations is an integral part of the multi-parametric and multi-range approach to coupling in LEAIM [3,4,19,27,38]. Typical wavelengths of the global disturbances, ULF in the ionosphere, ELF, and VLF, correspond by order of magnitude to the ionosphere thickness, the size of the SR or CSIAR, and the width of WGEI, respectively.
The primary goal of this paper is to determine the main characteristics of the low-frequency disturbances in LEAIM caused by LCSHTE, while the LCSHTE are characterized with a data-driven approach. For this purpose, the proper numerical simulations are based on a developed unified methodology. The theoretical results should be compared with published observational data. Due to the complexity of the problems, a more detailed formulation of the specific goals of the work is given in Section 2.
The determination of characteristics of the effective lightning currents in ULF, ELF, and VLF ranges based on a data-driven approach utilizing data published in [7] is presented in Section 3. The excitation of LEAIM by the ULF current source and penetration of ULF electric fields into the ionosphere accounted for all the issues described above (general formulation, the problem of stiffness, the approach to the quasi-stationary region, tensor impedance boundary condition between the quasi-stationary and dynamic regions, numerical simulation of penetration of ULF field into the ionosphere) are presented in Section 4.1 (Section 4.1.1, Section 4.1.2, Section 4.1.3, Section 4.1.4 and Section 4.1.5). The generation of the resonant oscillations/eigenmodes in the SR and the CSIAR in the ELF range is shown in Section 4.2 (Section 4.2.1 and Section 4.2.2). The simulation of propagation of EM waves in the WGEI in the VLF range, based on mode and beam presentations, is described in Section 4.3 (Section 4.3.1 and Section 4.3.2). Discussion, including comparison between theoretical and experimental data, and Conclusions are presented in Section 5 and Section 6, respectively.

2. Goals of the Work and the Corresponding Methodological Approaches

(1) The specific goals of the article and its purpose are as follows. They are to show, based on a unified, integrated approach, the global response of the atmosphere–ionosphere system, as a part of LEAIM, to the low-frequency excitations generated by LCSHTE and the effects of low-frequency EM waves and their waveguide and resonator excitations in LEAIM. All main low-frequency EM field ranges are included, namely ULF, ELF, and VLF.
We consider four aspects related to simulations of EM excitations in the aforementioned low-frequency ranges: (i) excitation of EM fields of these three low-frequency ranges by LCSHTE, (ii) penetration of ULF EM fields through LEAIM when excited by a current lightning source in the lower atmosphere, taking into account guided propagation along the geomagnetic field lines in the form of magnetohydrodynamic (MHD) EM waves in the upper ionosphere and the magnetosphere; (iii) an estimation of the ELF EM excitation of the SR, and the estimations of the excitation characteristics of the coupled global SR and local IAR; (iv) excitation and propagation of EM waves in WGEI in the VLF range.
The following hypotheses are tested in the paper. (i) The excitation of the lowest modes of SR by the current sources can be simulated based on an approximate representation of SR as a 2D local plane periodic resonator with the periods in the horizontal directions equal to the length of Earth’s equator. (ii) Due to the exceptional characteristics, both in size and value, of LCSHTE, the corresponding responses in LEAIM are of global character and significantly exceed the disturbances characterizing “normal” lightning activity in the ionosphere, SR, and in WGEI for ULF, ELF, and VLF disturbances, respectively.
(2) The methodology is briefly presented below. It is optimized for the subject of the study given in the Introduction and Section 2, as well as for particular and specific goals.
The study of disturbances in three low-frequency ranges excited by LCSHTE is carried out in the context of a modern multiparametric and, in fact, synergetic approach [3,4,19,27,38,67,68,69,70,71,72].
The data-driven approach for the determination of the current sources for ULF, ELF, and VLF ranges is described in Section 3.
The penetration of ULF waves excited by the lightning current source through LEAIM is simulated using the combined dynamic-quasi-stationary method described in Section 4.1.1, Section 4.1.2 and Section 4.1.3. This method is utilized in Section 4.1.5 for the simulation of ULF EM fields excited by a current source in the lower atmosphere and penetrating through LEAIM; the quasi-stationary approach and the dynamic one are applied for the ULF field in the atmosphere and ionosphere, respectively. It is the original method.
The method of the complex tensor impedance for the derivation of the boundary conditions [21,57,73,74] is described in Section 4.1.4 and Appendix A and Appendix B. The complex impedance boundary conditions are used (i) for ULF EM field between dynamic (ionosphere) and quasi-stationary (atmosphere) regions; the simulations are presented in Section 4.1.5; (ii) for ELF oscillations at the upper boundary of coupled SR-IAR; the simulations are presented in Section 4.2.2; (iii) for VLF waves propagating in WGEI using eigenmode and beam approaches; the simulations are presented in Section 4.3.1 and Section 4.3.2.
The beam method is used to determine the VLF field in WGEI; the results of numerical simulations are shown in Section 4.3.2.
Considering that low-frequency excitations are investigated in anisotropic, gyrotropic, lossy, and open LEAIM, the following analytical–numerical methods are adequate for simulations.
(i) The combined spectral–finite-difference method [56,74] is used in Section 4.1.3, Appendix A and Appendix B. This method is utilized to find the ULF field penetrating through LEAIM; the simulations are presented in Section 4.1.5; for finding the ELF field in SR, the simulations are presented in Section 4.2.1.
(ii) The method of iterations is described in Appendix C. It is used to find eigenvalues characterizing ELF and VLF excitations. Namely, it concerns (a) complex frequencies with a given real wavenumber for ELF oscillations in CSIAR; the simulations are presented in Section 4.2.2; (b) complex wavenumbers with a given real frequency for VLF modes of WGEI; the simulations are presented in Section 4.3.1 and Section 4.3.2).
(iii) Matrix elimination method is mentioned in Section 4.1.3, Section 4.2.1 and Section 4.3.2, and Appendix B and is described in Appendix A. This method is used (a) for simulations of the penetration of ULF field through LEAIM; the results are presented in Section 4.1.5; (b) for determination of ELF field in SR and coupled CSIAR; the results obtained using this method are included in Section 4.2.1 and Section 4.2.2; (c) for simulation of VLF waves in WGEI; the corresponding results are presented in Section 4.3.1 and Section 4.3.2.

3. Current Sources Due to Lightning Connected to Hunga Tonga Eruption in ULF, ELF, and VLF Ranges. Values and Spectral Characteristics

To evaluate the spectral characteristics of disturbances generated by lightning connected with the Hunga Tonga volcanic eruption in January 2022, we have considered the current data from the supplement to the paper [7]. The data include flash events in the region of Hunga Tonga volcano over 13–15 January 2022 (UTC). In particular, columns of the table contain information on the time of the flash, its duration and multiplicity (if there are a few flashes), peak current, and latitude and longitude of the lightning. It is important that lightning currents are predominantly vertical [69,75,76]. We have interpreted a current signal as a rectangle, supposing
I j t = I 0 j , t 0 t t 0 + τ 0 , t < t 0 t > t 0 + τ
where
I j is the value of the current I 0 j from jth row of the data table [7] for the time t;
t 0 is the time of lightning (column 2 of the data table [7]);
τ is the duration of the flash.
In the following, we insert the discrete time values tk with a constant time step Δt. The resulting current is determined by the sum of all the currents connected to the elementary strokes:
I t k = j = 1 n I j t k
Obtaining the time series of the currents, we apply the fast Fourier transform (FFT) algorithm to realize the discrete Fourier transform, which can be realized for the whole observational interval or for its parts (separate windows). It takes the following form:
F m = 1 n k = 0 n 1 I k e i 2 π m k n ,
where complex amplitudes are calculated at the frequencies ν m = m / ( n Δ t ) .
The described procedure requires significant computational resources if the time step is small (and the frequency of discretization is high). Lightning activity presented in the data table [7] lasted for two days. Analyzing this time range, we can use a discretization with the time step~1 s; however, it is unrealistic to take smaller, for example, 10−5 s time steps for the whole two-day range, as this would create >1010 values for FFT. Therefore, for FFT, the total time range was separated into rectangular windows of, e.g., 50 s duration. The spectra were calculated for every window with simultaneous averaging of their amplitudes.
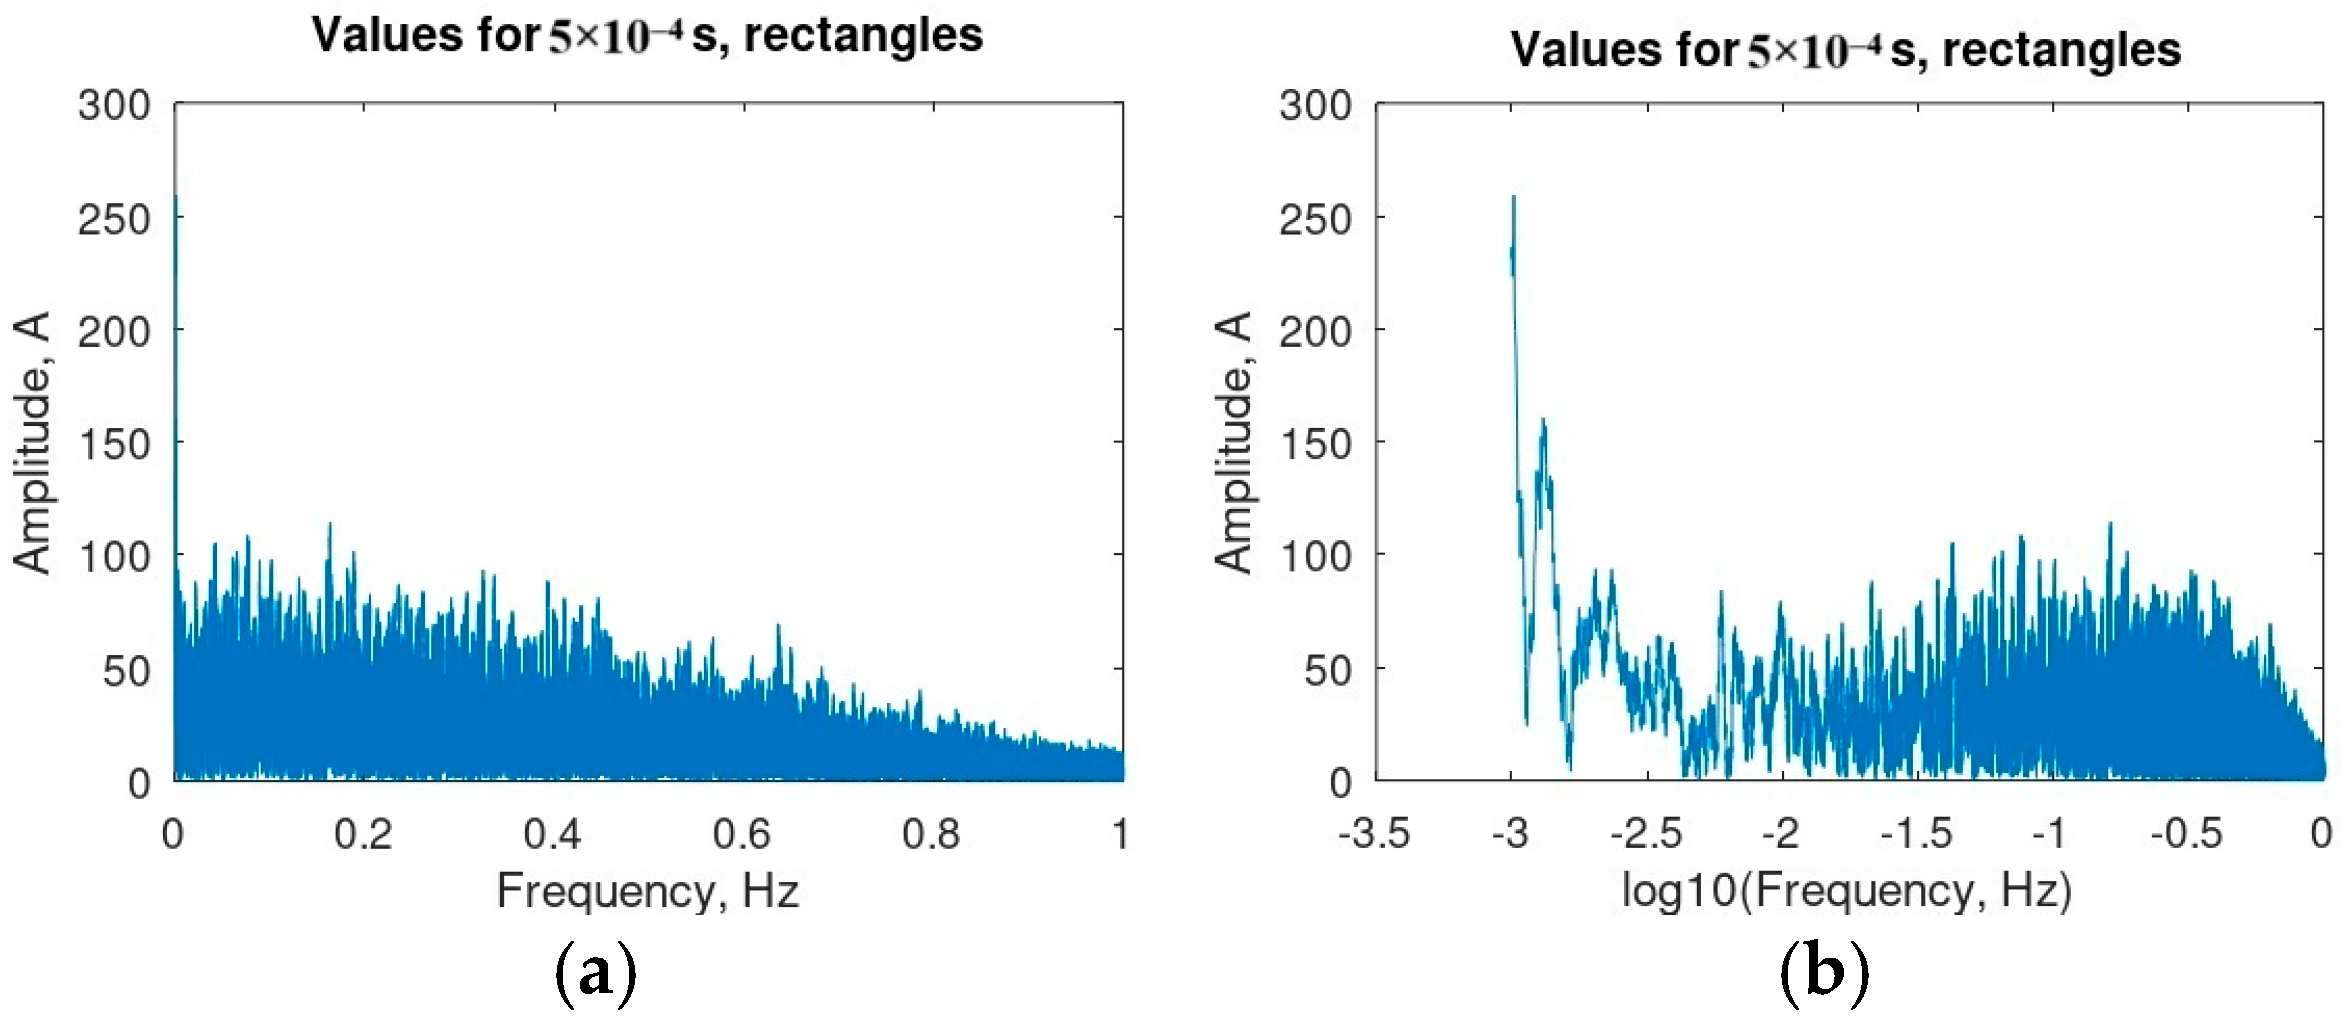
Lightning connected with the Hunga Tonga eruption occurred on 13–15 January 2022 (UTC). The maximum values of electric current observed on 15 January exceeded 106 A (Figure 1). During usual storms, the peak current reaches only an order of 104 A [10].
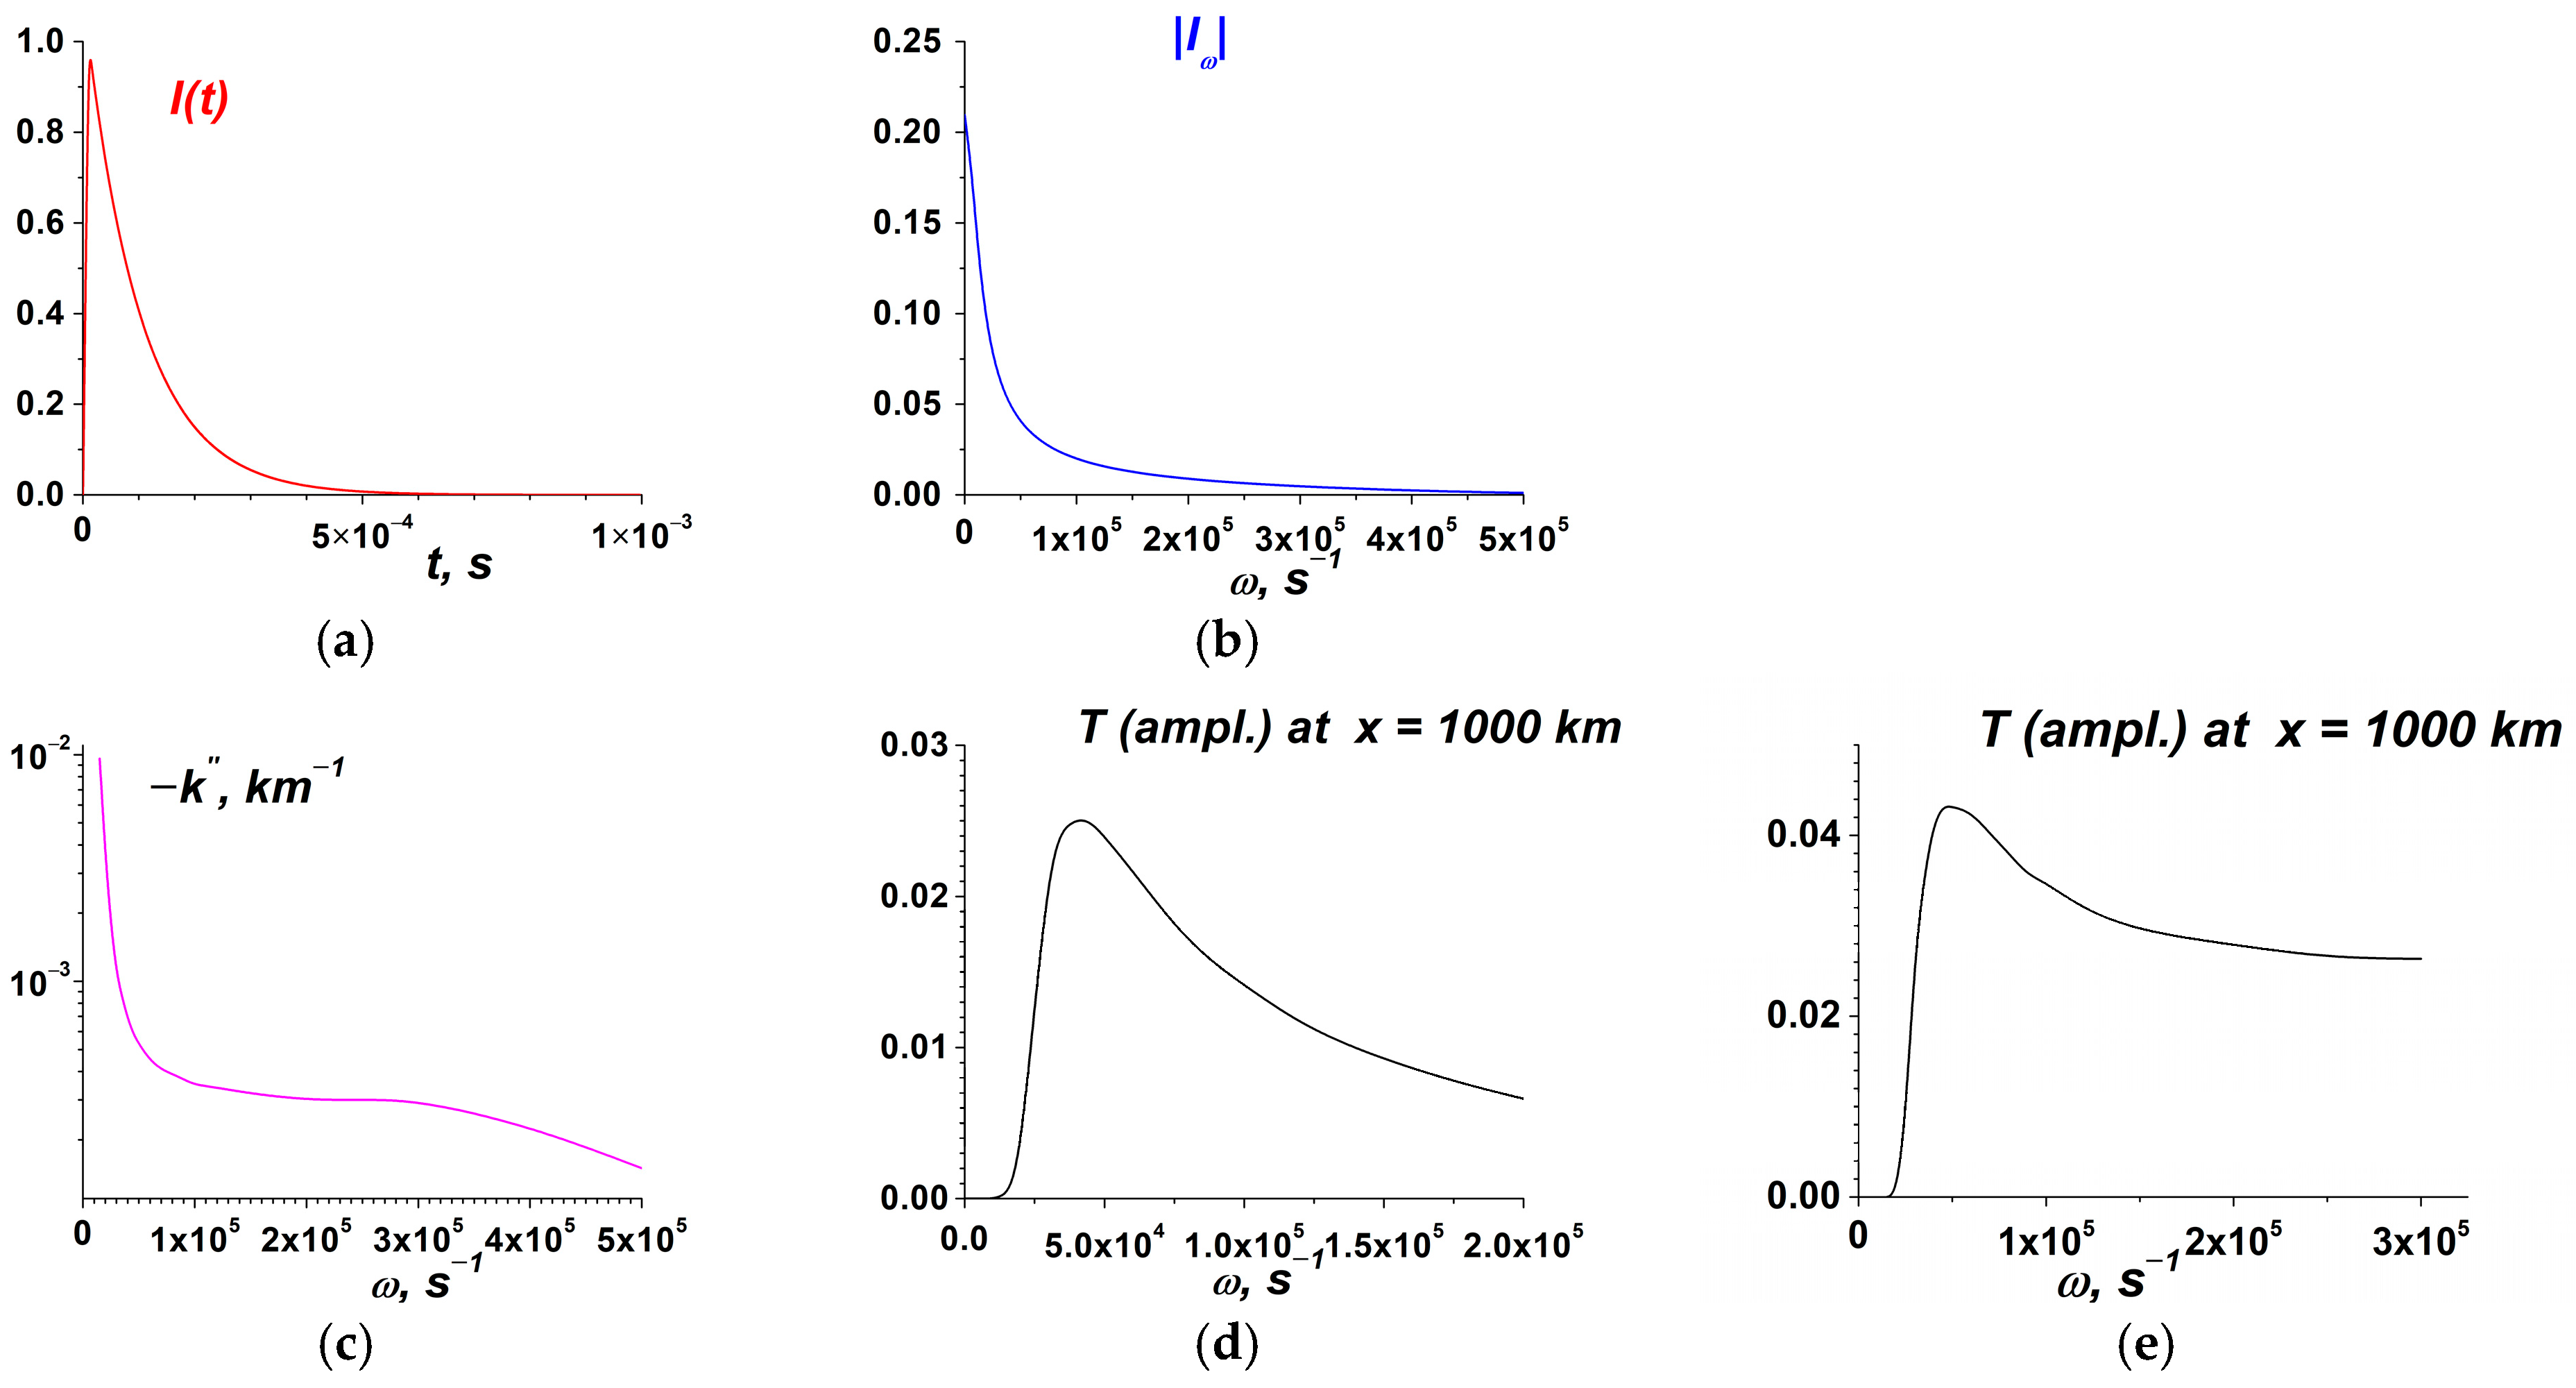
The spectra calculation at frequencies lower than 1 Hz does not require too fine temporal resolution. We choose the time step as 5 × 10⁻⁴ s, which allows us to obtain a spectrum for the whole 2-day interval. The spectra are shown in Figure 2.
The maximum amplitude of the Fourier components was found at the frequencies near 0.1 Hz. The amplitudes decrease toward the higher frequencies. The frequencies f > 1.6 × 10⁻³ Hz are not used to compute the penetration of an almost stationary ULF EM field into the ionosphere, as mentioned in Section 4.1.5.
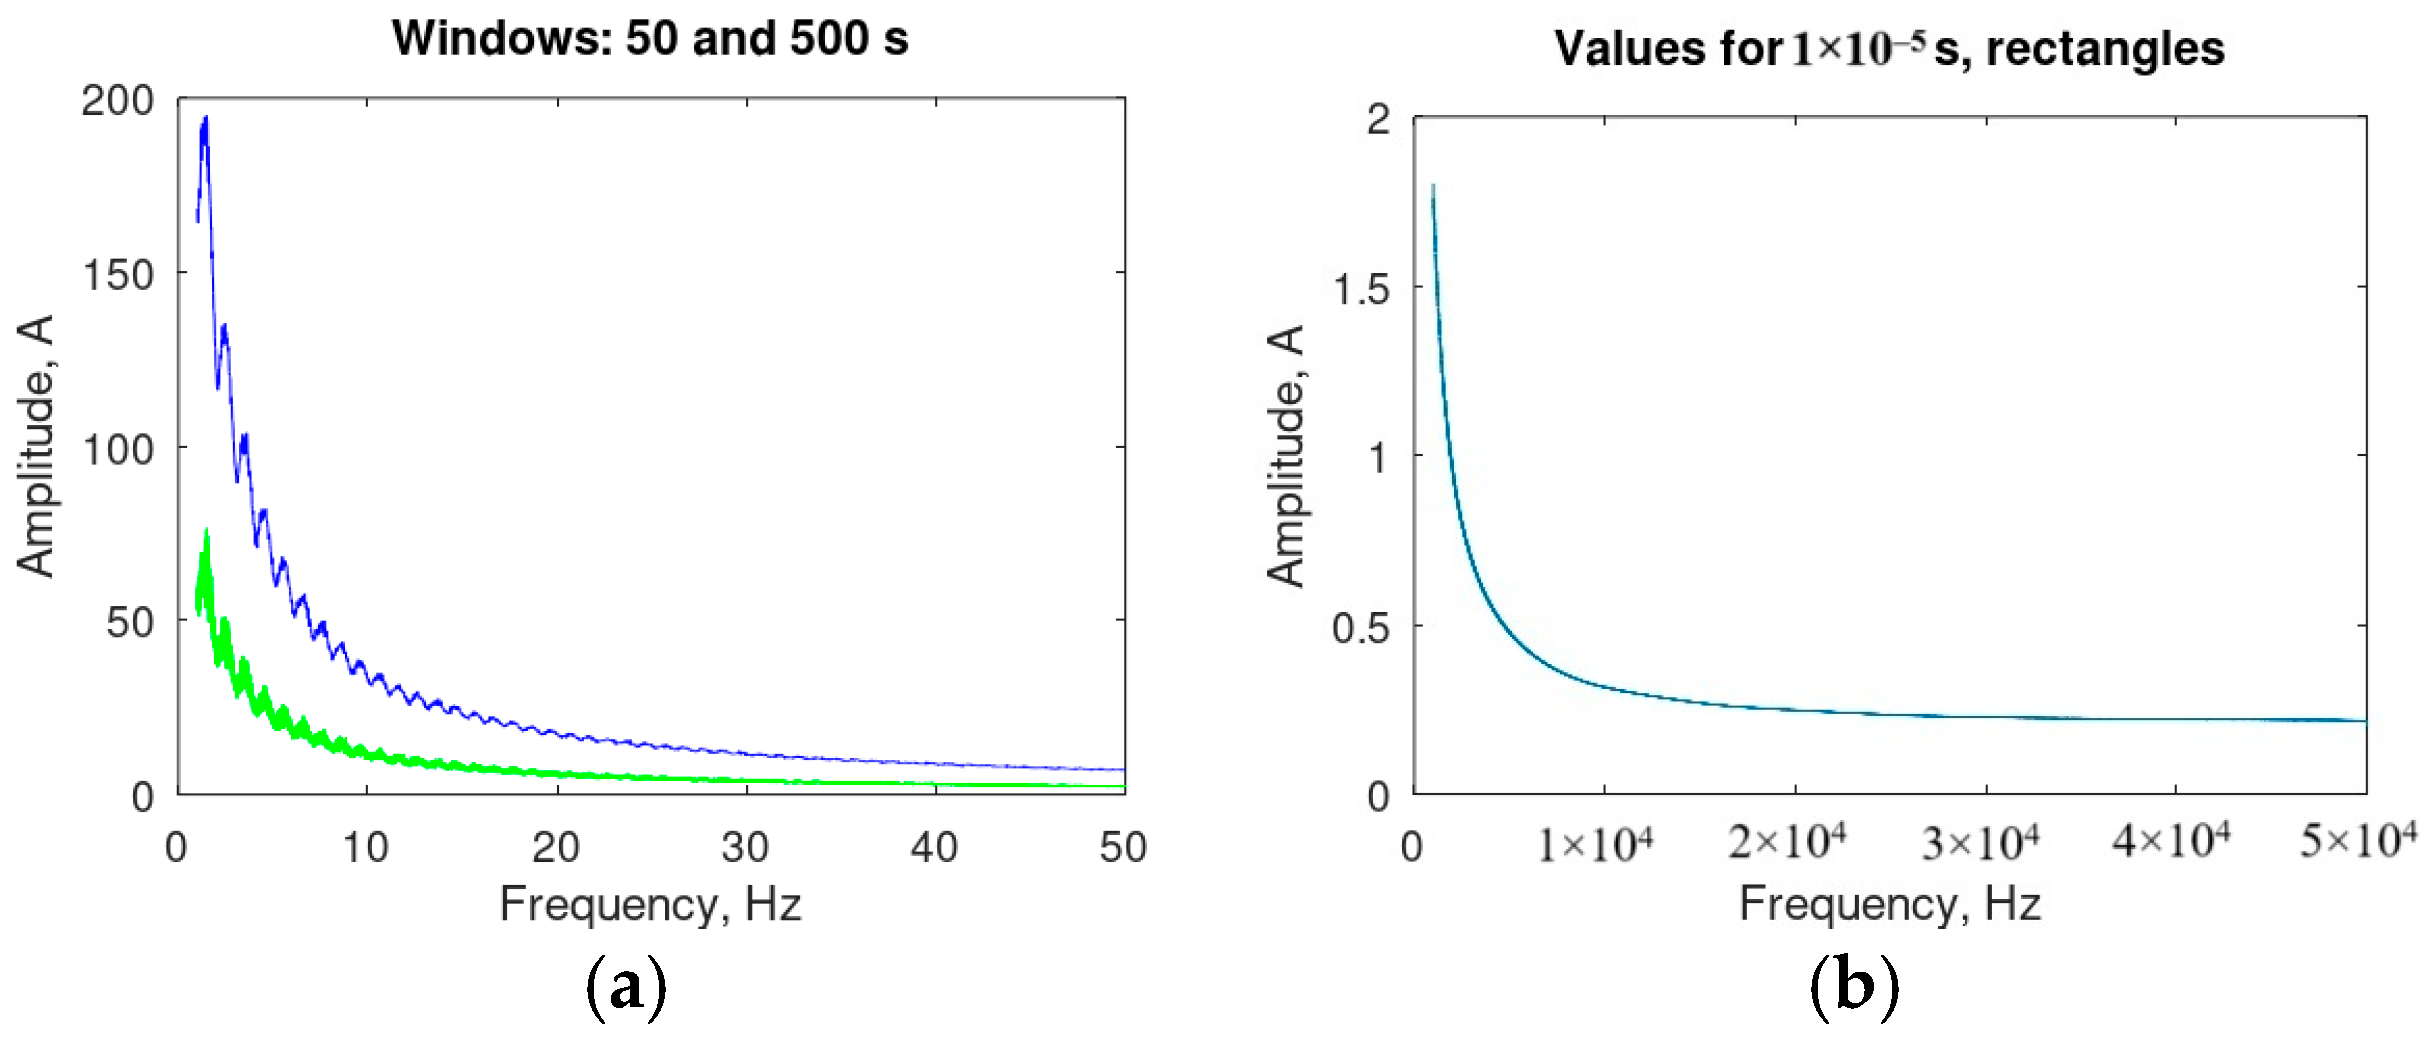
Figure 3 shows the spectra of lightning determined in the ELF (Figure 3a) and VLF ranges (Figure 3b), time step 10−5 s. It is found that the spectral dependency is noticeably simpler than for the ULF range in Figure 2. The spectrum in Figure 3 seems less noisy compared to Figure 2. The amplitude excursions in the ELF range are no more than 10%, compared to 50% in ULF at f > 0.01 Hz. There are signs of oscillations at the frequencies of several Hz. The amplitudes of the signals decrease with increasing frequency.
An important question is whether anisotropy exists in the spatial distribution of current sources. To address this, we present simulation results below. Notably, phase differences are significant only in the VLF range, not in the ULF and ELF ranges. Thus, we focus on anisotropy for current sources in the VLF range. The vector-potential A determines the anisotropy of the EM field, in particular, the electric field E = ( 1 / c ) ( A / t ) . Consider the 2D case (see Figure 4a) and suppose that the points of observations K are placed on the circle with the center O (average coordinates of the lightning, corresponding to the volcano location with a precision of several kilometers) and the radius r = r 0 . We suppose that the radius r is large enough to consider any point K placed at the circle with the radius r as one belonging to the far zone of the source; practically, we put r0 = 1000 km. The detailed consideration shows that under the assumptions formulated above, the angular dependence of z—component of the EM vector potential is determined as
A z = 1 c r 0 S ( r 0 , α , τ ) 1 c r 0 j I j ( r j , τ R j r 0 c ) .
In Equation (4), c, I j , and S ( r 0 , α , τ ) are the speed of light, values of the currents, with a number denoted by index j, placed at the points with a radius-vector r j (see Figure 4a) and VLF form-factor, respectively. Additionally, τ is the time of EM wave propagation from the point O to the circle of the radius r 0 , and R j = r α r j is the distance between a lightning location and the point at the circle. For the same data and using the same method of describing the current signal, which corresponds to Figure 3b, the spectrum of lightning in the VLF range was examined for several characteristic time periods lasting 1 s, associated with high thunderstorm activity near the Hunga Tonga volcano. Distinct from ULF and ELF spectral ranges, the effect of the signal delay (see the second term on the right-hand side of Equation (4)) was taken into account when the signal propagated from the flash location to different points at a distance of 1000 km from the approximate epicenter of the lightning flash activity. The corresponding radiation pattern of the signal under consideration, calculated on the base of relation (4), is presented in Figure 4.
Figure 4. (a) Geometry of the 2D problem of determination of directional diagram for VLF radiation from lightning sources; O, K, α , and r j are the center of coordinates, corresponding to the volcano, the observation point, the angle between the radius-vector r , and the dot line which is supposed to point at the north, and the radius-vector of the elementary current with the number j , respectively; F is the circle with the radius r 0 150   km , inside of which the most of elementary currents are placed; (b,c) are directional diagrams for the Fourier components of the lightning current source, averaged in the frequency ranges of, respectively, 10,000 ± 250 Hz (black color, solid line), 20,000 ± 250 Hz (red, dashed), 40,000 ± 250 Hz (blue, dotted). The observation points lie on the circle with the center O with the radius r 0 = 1000   km ; time step 10−7 s. Arbitrary intervals of time with a duration of 1 s in the neighborhood of high lightning activity are considered: 15 January 2022 05:02:52 (b), 15 January 2022 04:57:23 (c). The data on lightning activity are taken from [7,77]. The directional diagram is calculated with the 30 angular steps.
Atmosphere 16 00097 g004
FFT of the time series defined using Equation (4) was carried out. It is important to characterize the directivity of the effective current source. The directional diagrams were built at the VLF frequencies of 10,000 Hz, 20,000 Hz, and 40,000 Hz. The Fourier amplitudes for frequencies of ±250 Hz in the vicinity of the corresponding frequencies were averaged. The choice of such a band is due to the fact that (1) in this band, the spectral components have the same amplitudes with an accuracy of 5%, and (2) for a smaller band, the contribution of fluctuations becomes noticeable. The directional diagrams are depicted in Figure 4b,c. The time step value used was 10−7 s. The spectra were determined with the time windows of 1 s.
On the basis of the approach and calculations (using Equation (4)) presented in Figure 4, the conclusion is drawn on the isotropic character of VLF radiation from the lightning current source in the whole VLF range of interest. We assume the isotropic radiation of each source separately, and Figure 4 shows isotropic patterns due to averaging over many sources. For ELF and ULF ranges, the isotropic character of radiation is obtained in the same approximation for the isotropy of each separate source due to a large wavelength and the absence of phase shifts of the radiation from different sources.

4. Excitation of LEAIM by ULF, ELF, and VLF Current Sources

Below, we investigate sequentially, in the order of increasing frequency, disturbances in LEAIM in ULF, ELF, and VLF ranges (in Section 4.1, Section 4.2, and Section 4.3, respectively).

4.1. Penetration of ULF Electric Fields into the Ionosphere

4.1.1. Formulation and Geometry of the Problem—The Model and Basic Equations

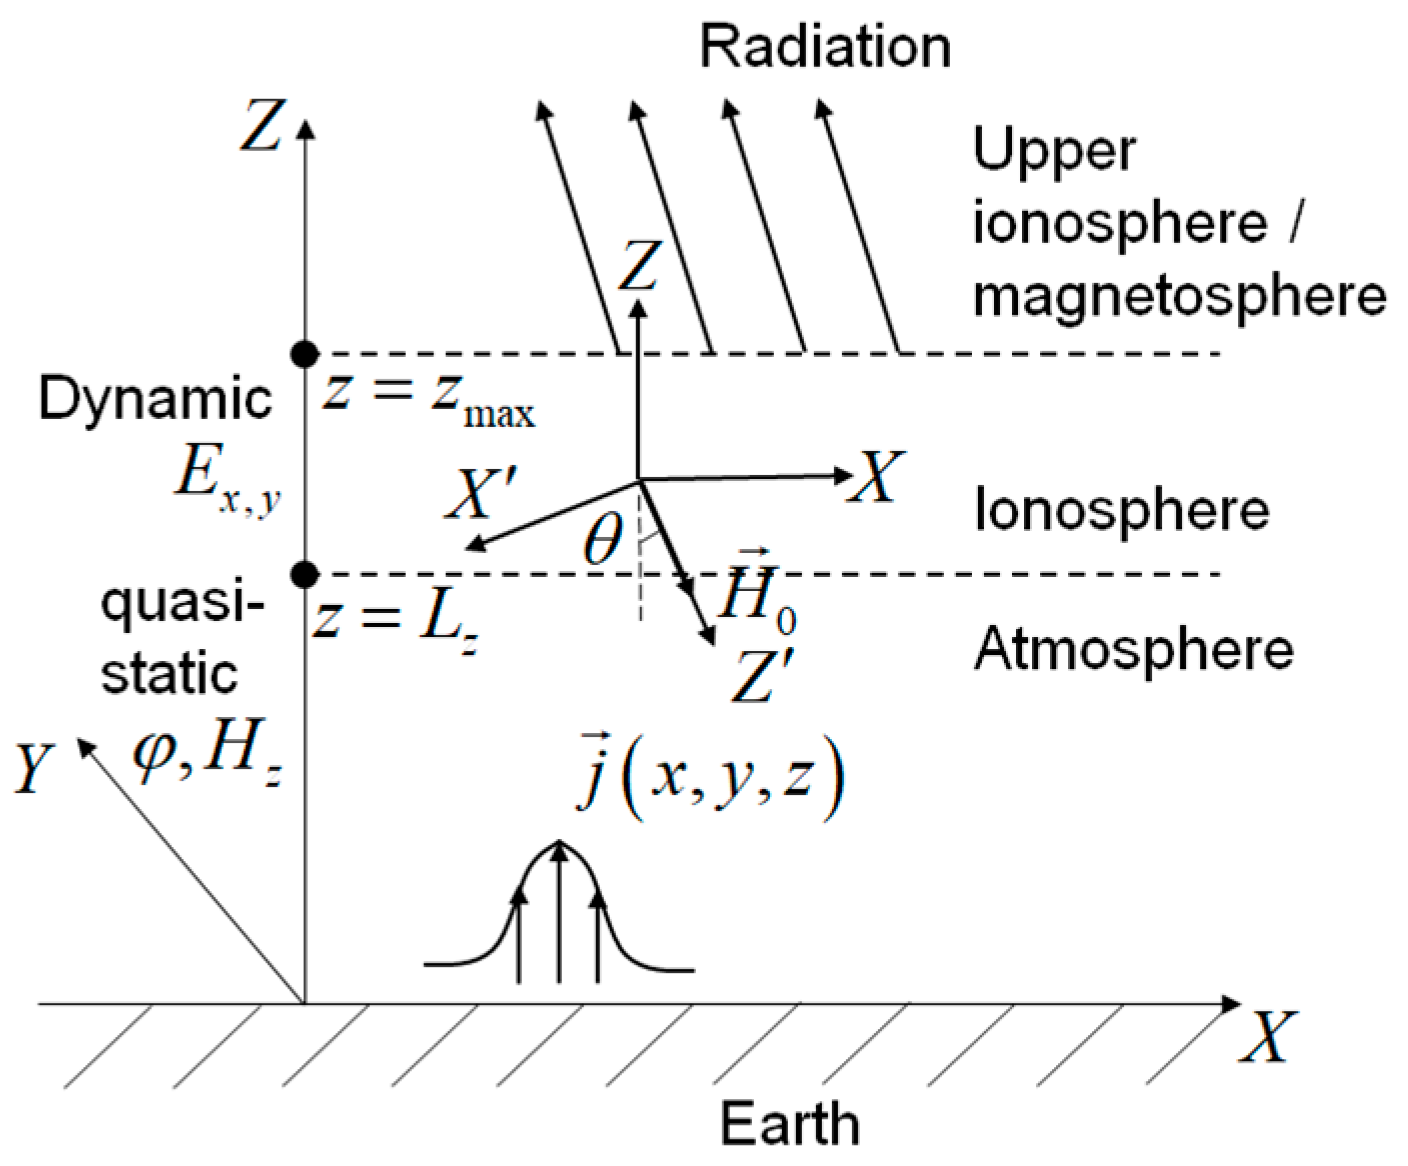
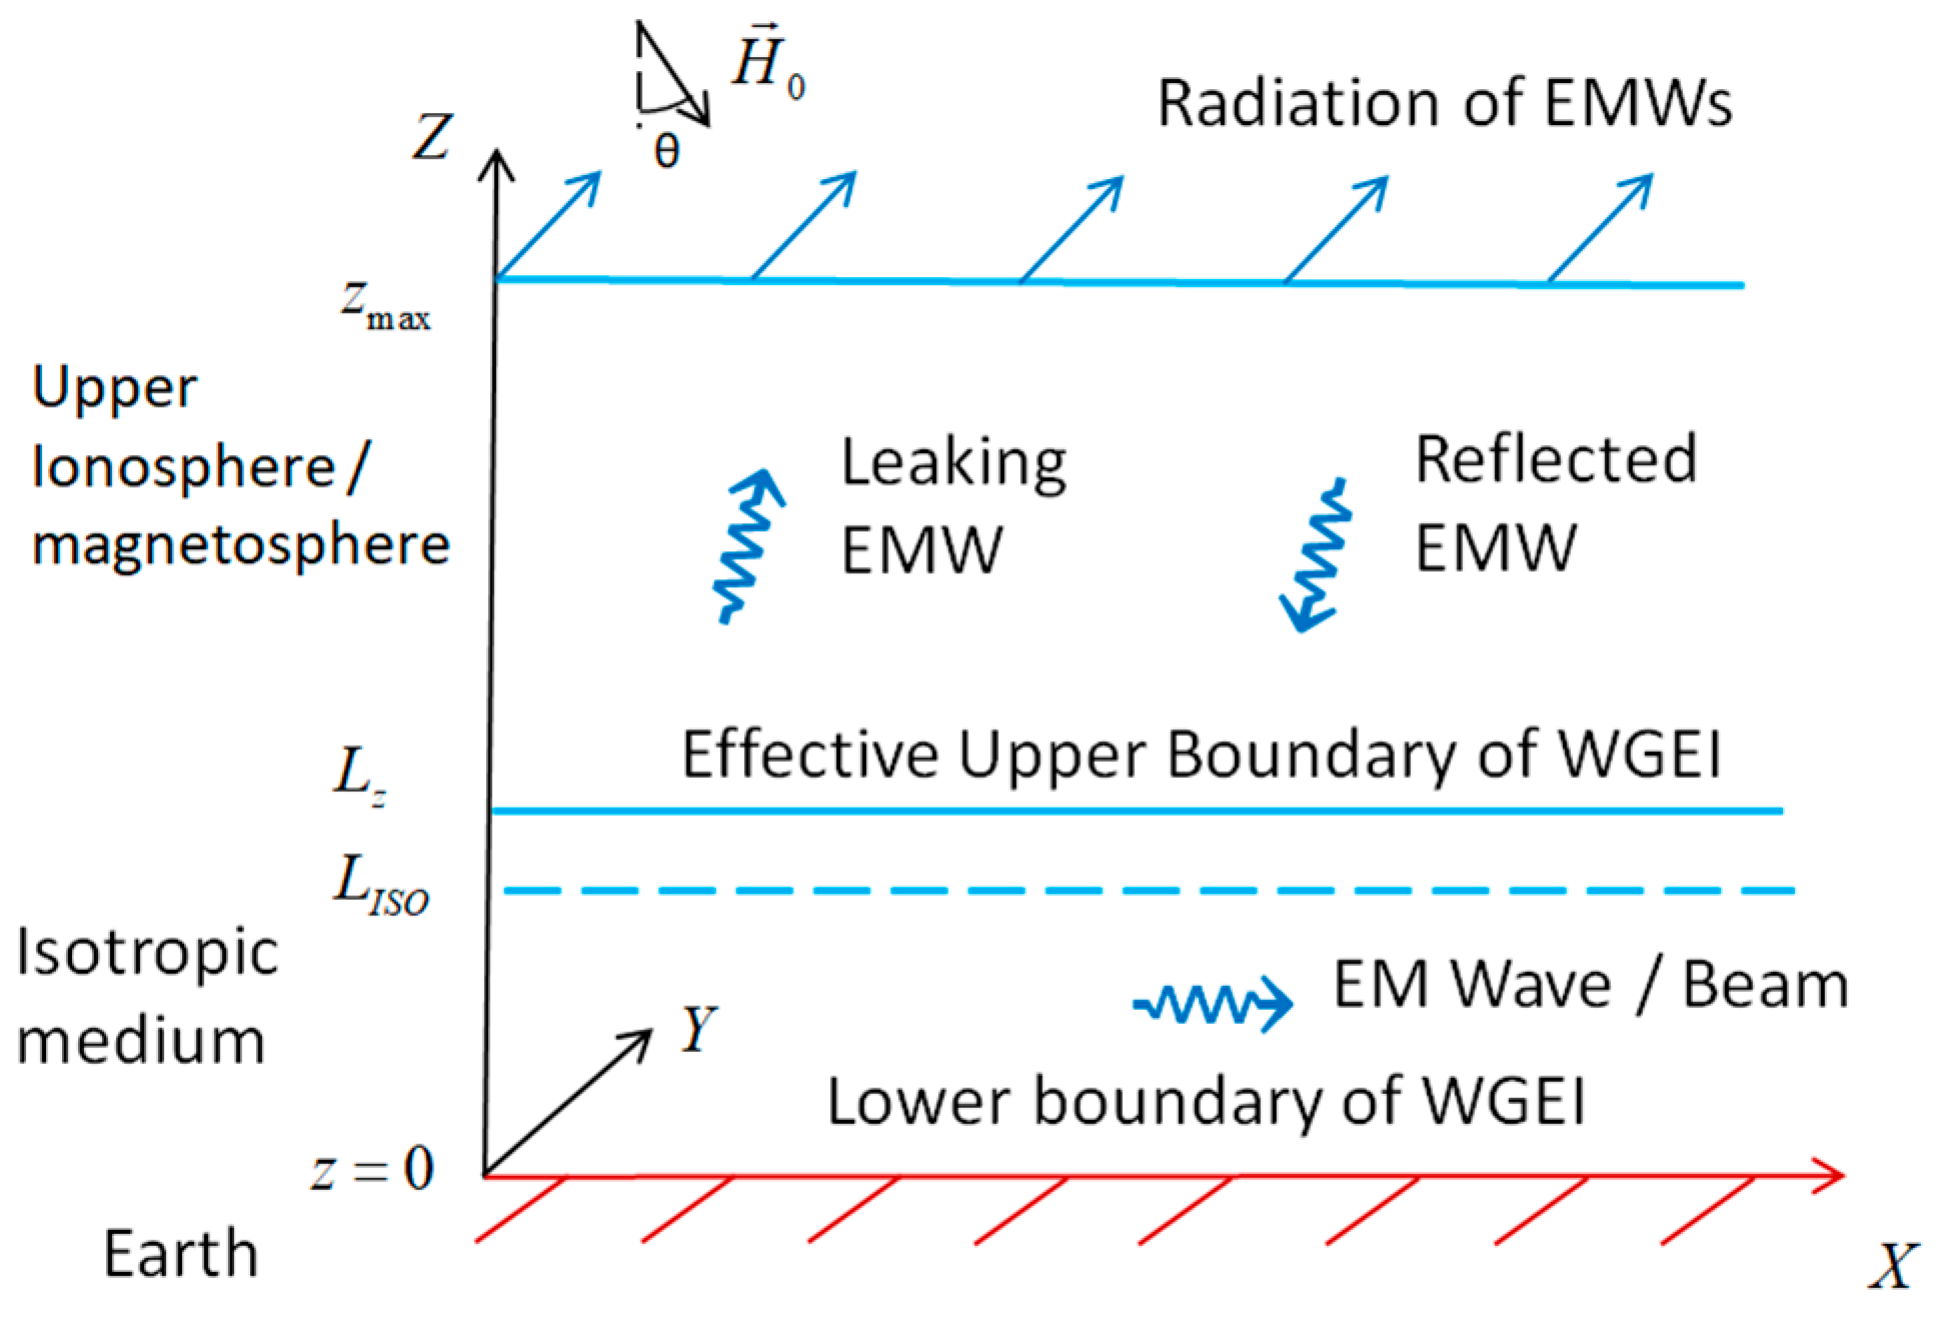
The geometry of the problem considered in this model is shown in Figure 5 and explained in the figure caption.
The basic equations for the EM field in anisotropic non-uniform media with current sources are written in the spectral representation using absolute units:
× H = i k 0 ε ^ ( ω , r ) E + 4 π c j e x t 4 π c j ; × E = i k 0 H ; k 0 ω c .  
Here, the density of current j includes both the conductivity and displacement parts. The dependencies of E , H are~exp(iωt), where ω and t are frequency and time, respectively. The external current, which is the source of the EM field, is localized in the atmosphere in our simulations.
The circular frequency ω is ω ≤ 0.1 s−1, and the sizes of the current sources are about 200 km in the horizontal plane XOY and about 20 km in the vertical OZ direction. Thus, the quasi-stationary approximation is valid surely up to the heights z ≤ 100–120 km. At the upper heights, the dynamic consideration based on the Maxwell equations should be applied generally because the vertical sizes are comparable with the wavelengths of MHD waves there.
The relation between the complex permittivity ε ^ ( ω , r ) and anisotropic conductivity σ ^ ( ω , r ) is
ε ^ ( ω , r ) 1 4 π i ω σ ^ ( ω , r ) .
The detailed definition of the elements of the tensor σ ^ will be given below based on the definition of the corresponding values introduced for the coordinate frame connected with the geomagnetic field.
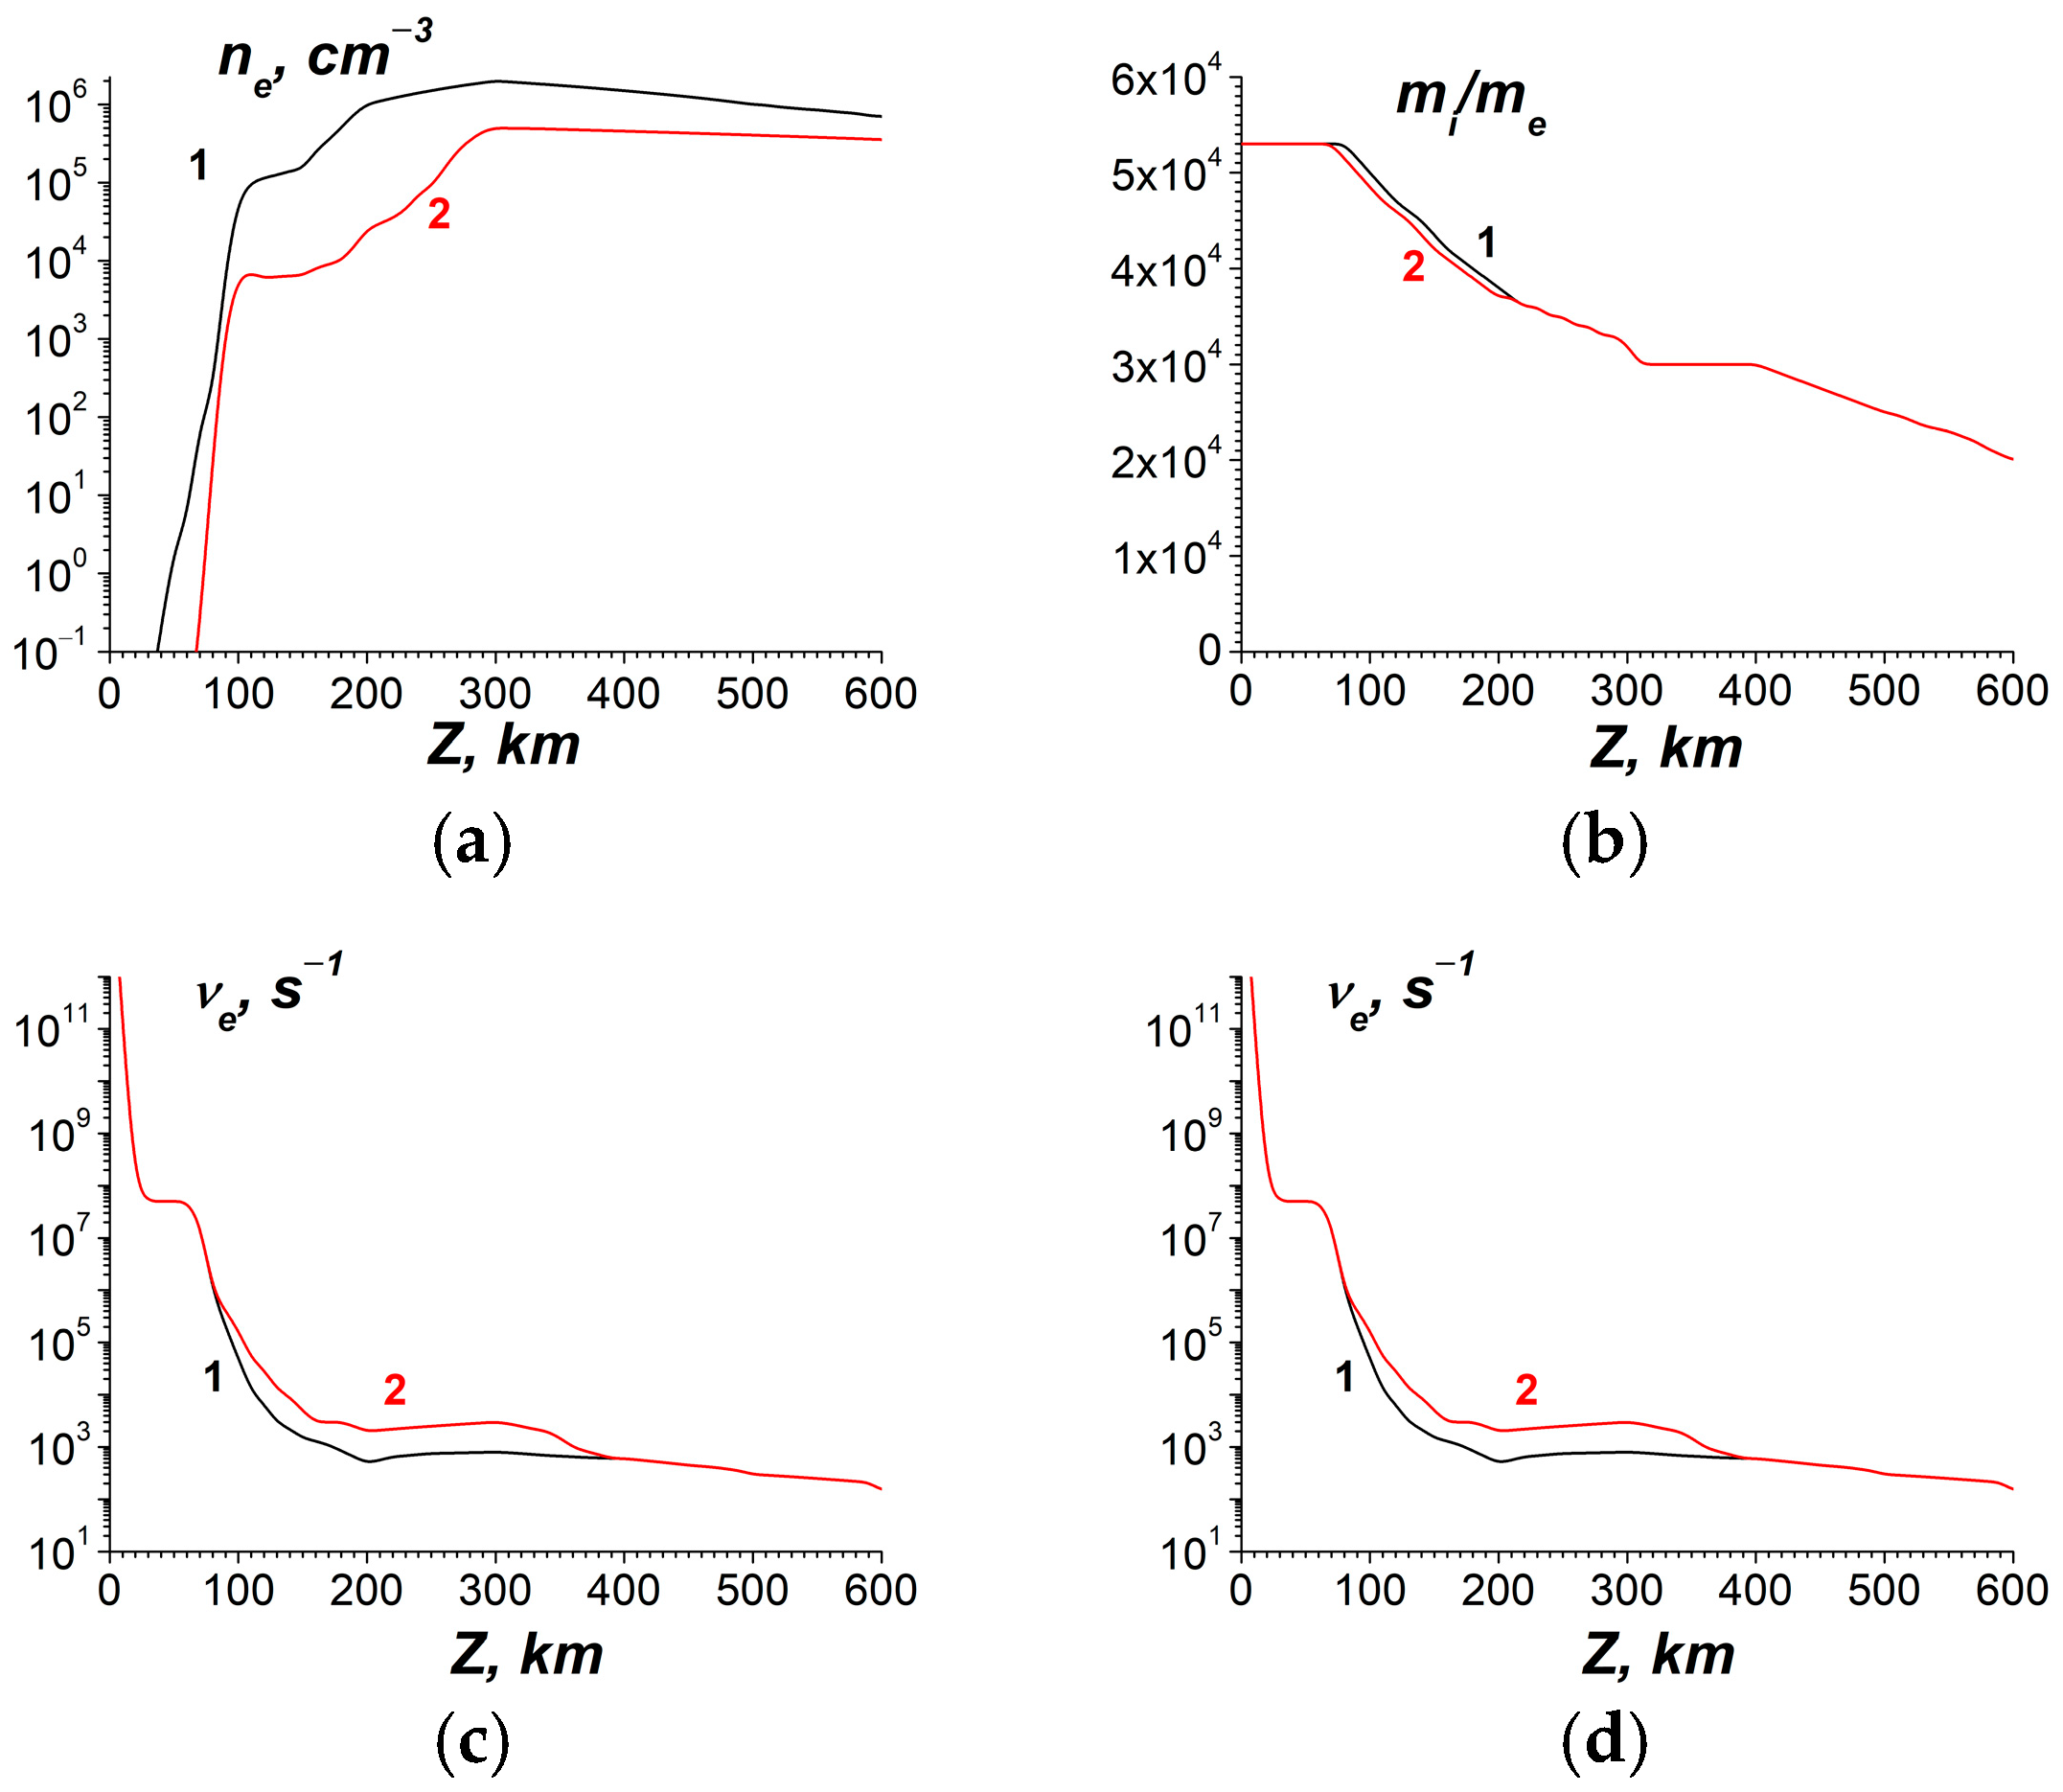
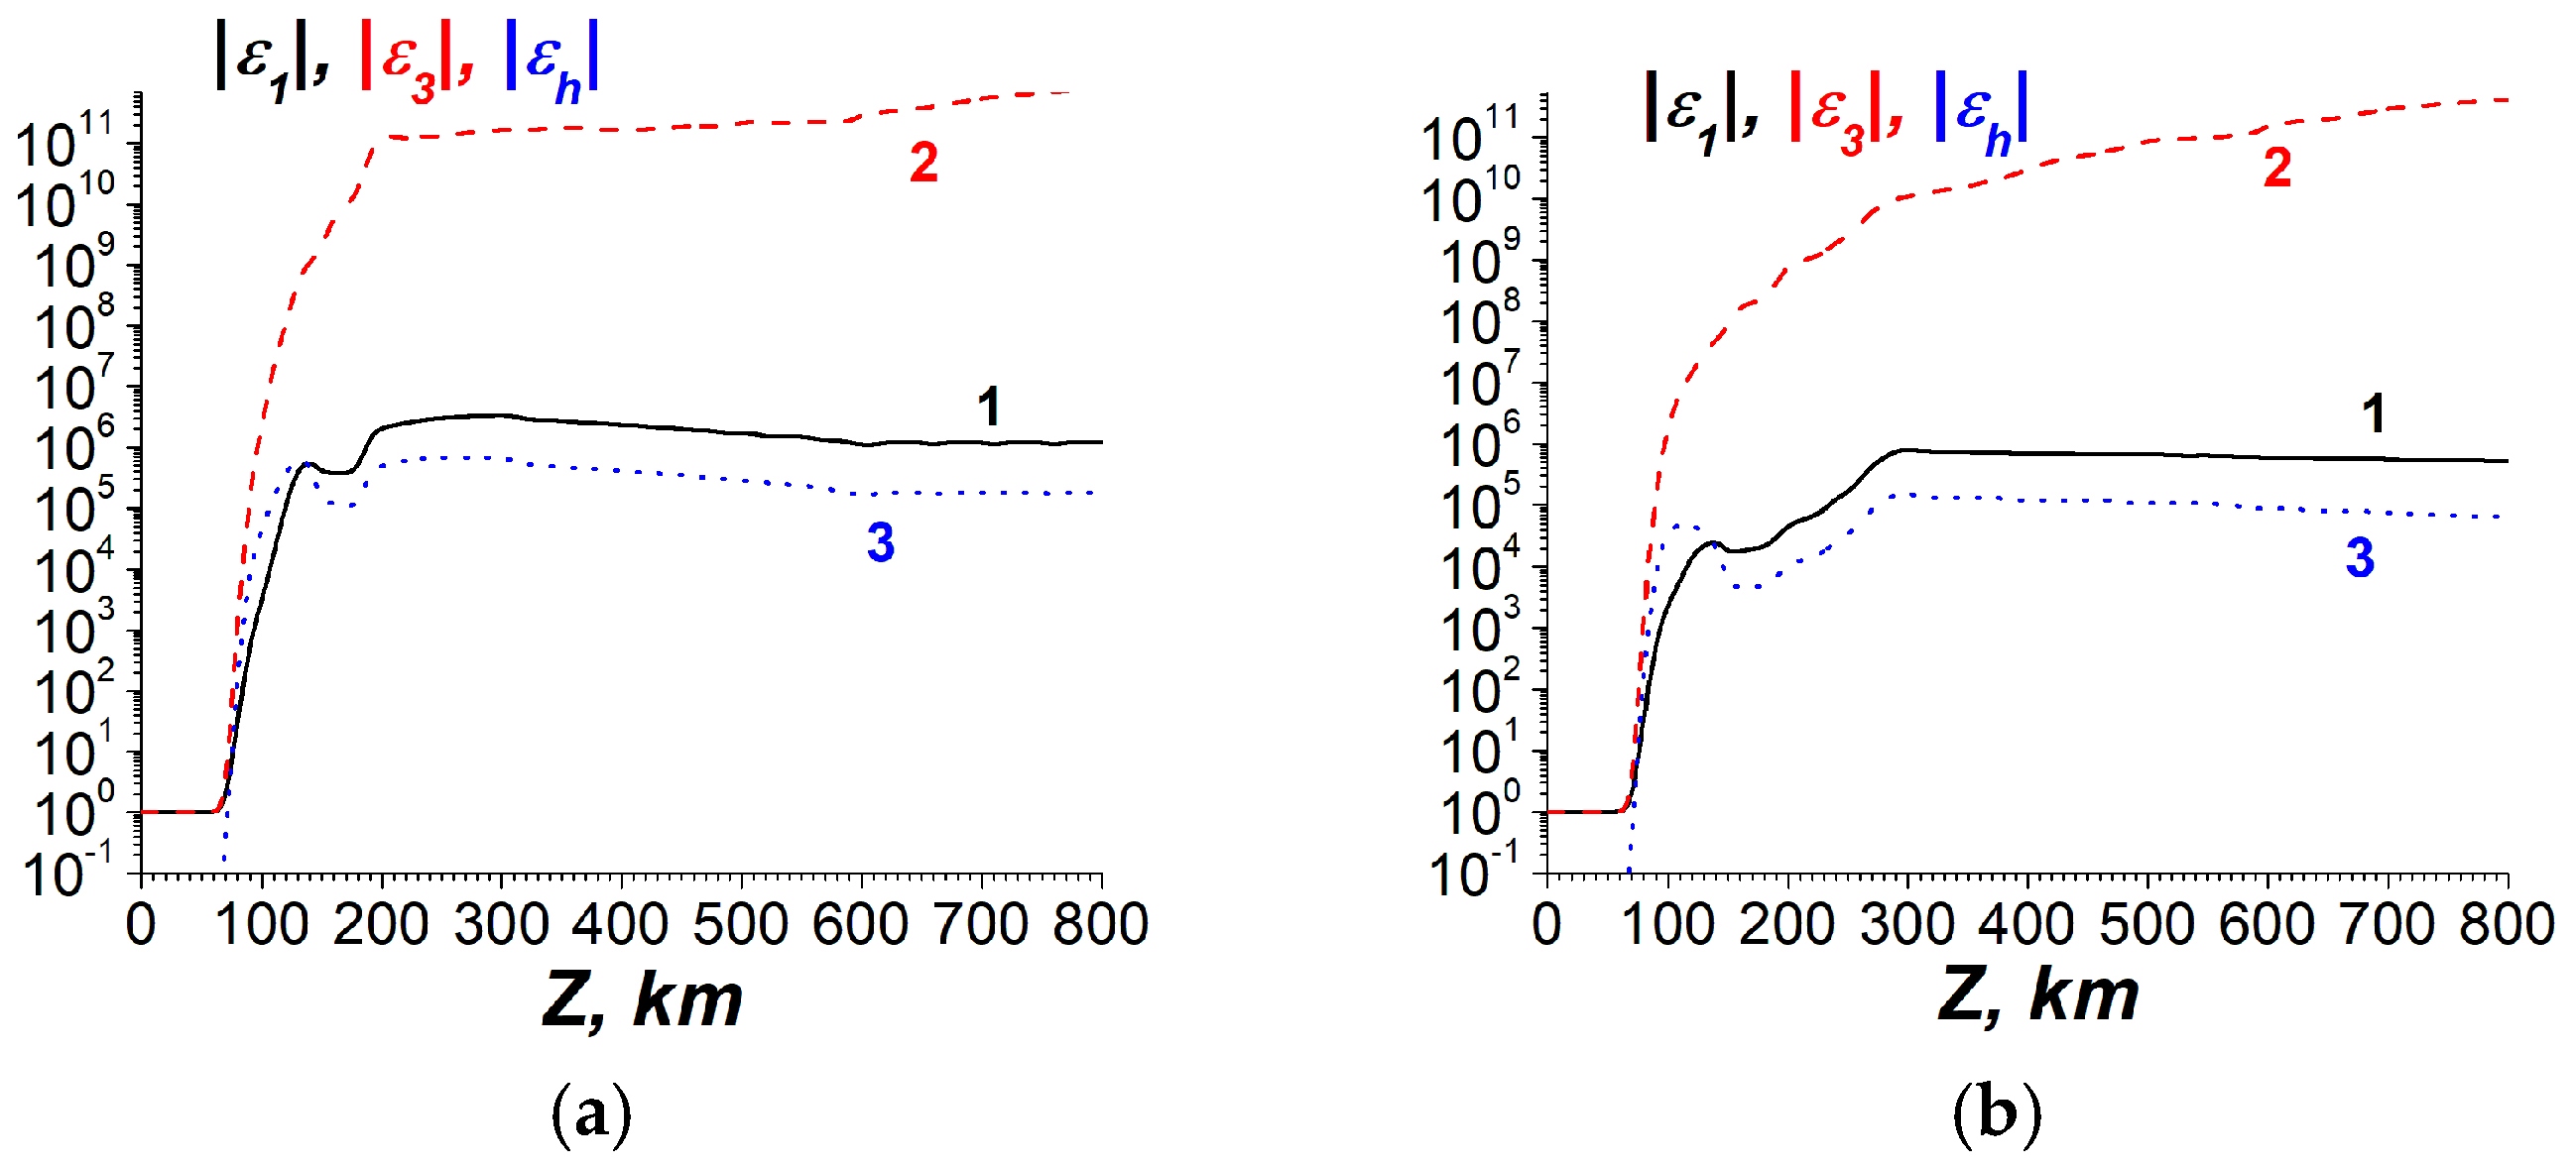
The parameters of the ionosphere used in simulations are given in Figure 6.
Small deviations from the used parameters have a negligible impact, but the quantitative difference between the daytime and nighttime parameters is essential for the excitation and propagation of EM oscillations and waves in ELF and VLF ranges.
In the coordinate frame X’Y’Z’ associated with the geomagnetic field H 0 , the permittivity tensor has the form [79,82]:
ε ^ ω , z = ε 1 ε h 0 ε h ε 1 0 0 0 ε 3 .
We would like to emphasize that the prime in the definition of the tensor ε ^ ω , z corresponds to the primes in the coordinate frame X’Y’Z’, where the tensor ε ^ ω , z is presented. In Equation (7), the following elements are used:
ε 1 = 1 ω p i 2 ( ω i ν i ) ( ( ω i ν i ) 2 ω H i 2 ) ω ω p e 2 ( ω i ν e ) ( ( ω i ν e ) 2 ω H e 2 ) ω ; ε 3 = 1 ω p i 2 ( ω i ν i ) ω ω p e 2 ( ω i ν e ) ω ; ε h i g ; g = ω p i 2 ω H i ( ( ω i ν i ) 2 ω H i 2 ) ω ω p e 2 ω H e ( ( ω i ν e ) 2 ω H e 2 ) ω .
The following notations are used:
ω p e 2 = 4 π e 2 n e 0 m e , ω p i 2 = 4 π e 2 n e 0 m i , ω H e = e H 0 m e c , ω H i = e H 0 m i c .
In (8) and (9), mi, me, ne0, ωpe, ωpi, ωHe, ωHi, νe, νi, H0 are the masses of the positive ions and electrons, the concentration of electrons, the plasma frequencies of electrons and positive ions, their cyclotron frequencies, the collision frequencies for electrons and ions, and the values of the geomagnetic field, respectively [79,82]. These values depend on the height (see Figure 6).
In the coordinate frame associated with Earth’s surface, the expression for the permittivity tensor is obtained using (7) by rotating the coordinate frame in the XOZ plane [21]:
ε ^ ( ω , z ) = ε 11 ε 12 ε 13 ε 21 ε 22 ε 23 ε 31 ε 32 ε 33 ; ε l m l , m α l l α m m ε l m ;   where α ^ = cos θ 0 sin θ 0 1 0 sin θ 0 cos θ .
Here, α ^ is the rotation matrix in the XOZ plane (see Figure 5); ε l m are the components of the tensor ε ^ from Equation (7). The corresponding components of the conductivity tensor σ ^ ( ω , r ) σ ^ ( ω , z ) can be obtained from Equation (6).
In the lower atmosphere, the conductivity tensor becomes practically isotropic, and the resulting tensor takes the form σ i j = σ δ i j or σ ^ = σ I ^ , where I ^ is the identity matrix.
Solving the problem of the lowest frequency excitations in the ionosphere, as an important part of the problem formulated in this work, dictates the need to move from a dynamic approach to a quasi-stationary one. In this case, the dynamic and quasi-stationary approaches mean the use of the MHD approximation and the quasi-stationary approximation correspondingly, taking into account both the electric and magnetic components of the EM field when propagating EM fields through LEAIM, in particular through the atmosphere–ionosphere.
As shown in [21], based on numerical calculations, the problem of calculating EM fields using a dynamic approach is mathematically stiff. This manifests itself in the form of ripples that appear in the calculations for EM fields penetrating from the atmosphere into the ionosphere, with a decrease in the ULF frequency of the current sources located in the lower atmosphere. In the same work [21], purely qualitative considerations were provided to explain the stiffness.
The important frequency subrange of ULF EM fields is the lowest. However, as discussed in [21], if we do not consider such long periods of ULF, at which it becomes necessary to consider changes in the environment, then we can conditionally assume that the smallest frequencies, which should be considered, correspond to ω ≥ 10−3 s−1.
As stated below in Section 4.1.2, at sufficiently low frequencies the system of the Maxwell equations (5) reduces to two independent systems of quasi-stationary equations for electric (11) and magnetic (12) fields. However, in the ionosphere, only the dynamic model is adequate for determining EM fields in the general case, which includes the possibility of the presence of open geomagnetic field lines along which EM fields penetrate into the upper ionosphere and magnetosphere. This is because, as detailed in [21], only the dynamic model agrees with the principle of causality, considering the radiation of ULF fields into the magnetosphere in the form of MHD waves.
As shown in Section 4.1.2, the ratio | H y / E x | at the frequency ω ≈ 10−2 s−1 in the lower atmosphere, in particular at Earth’s surface at z = 0 , is 10−5 by order of magnitude. At the same time, the direct numerical calculation given in Section 4.1.5 shows that the ratio | H y / E x | at the altitudes z ≥ 80 km is of order of magnitude 10 4 . Thus, from Earth’s surface in the lower atmosphere to an altitude of 80 km in the lower ionosphere, the ratio | H y / E x | changes by 9 orders of magnitude. This indicates that the problem is stiff in a mathematical sense.
This qualitative conclusion also corresponds to an approximate numerical estimation for the ratio at an altitude of about 80 km. In addition, as the analysis of dynamic equations for ULF fields shows (see Equation (22)), the coefficients for the corresponding current source on the right-side increase noticeably in the region of the lowest frequencies of the ULF range; see details in Section 4.1.5. This property of the source, as one might expect, can further enhance the stiffness effect.
Two consequences result from this.
(i)
The dynamic model, as explained above, should be used in the ionosphere. Mathematically, this model can be described by a system of two second-order differential equations with respect to the horizontal components of the electric field (the corresponding matrix Equation (22) is given in Section 4.1.3). This means that in the lower part of LEAIM, i.e., in the atmosphere, including the region near Earth’s surface, at the lowest frequencies of the ULF range, both potential electric and magnetic quasi-stationary fields must be taken into account. Thus, an advantage of our approach is the “restoration” of the magnetic component of the quasi-stationary EM field. That component was lost in most works on atmospheric electricity and the theory of the global electrical network (see, for example, [70]).
(ii)
There is a decrease by many orders of magnitude in the ratio of magnetic and electric fields at the lowest frequencies of the ULF range in the lower atmosphere near Earth’s surface. Consequently, when attempting to apply a dynamic model not only in the ionosphere but also in the atmosphere, a significant decrease in accuracy may occur when calculating field components corresponding to a “weak” magnetic mode against the background of a “strong” quasi-stationary electrical mode. At the same time, all the above-mentioned fields, both in the ionosphere and in the atmosphere, ultimately should be coupled into a single system of equations with coefficients varying in height.
Returning to our task, for the same purpose to guarantee that there is no loss of accuracy in numerical calculations, we had to propose a special combined method. The stiffness effect manifests itself in the fact that even when the step of the numerical scheme is reduced in a purely dynamic approach, ripples appear when determining the EM field. Utilizing the appropriate combined method, this disadvantage is overcome (see Section 4.1.5). The combined dynamic–quasi-stationary method proposed in this article is as follows. We use a dynamic model in the ionosphere and a quasi-stationary model to calculate EM fields in the atmosphere. The corresponding matching of the fields within both these regions is carried out at a certain boundary between them. The details regarding the selection of this boundary are given in Section 4.1.5.

4.1.2. Quasi-Stationary Region

As we have noted above, in the atmosphere and in the lower ionosphere, the quasi-stationary approximation for EM fields is valid. Under this approximation, there is E φ ,   or   × E 0 . In this case, the application of operation to the first equation in the system (5) results in
( ε ^ ( ω , r ) φ ) 4 π ρ e x t ; ρ e x t i ω j e x t .
This equation is widely used for the simulations of penetration of the electric field into the upper atmosphere and the ionosphere. However, in the general case, ω ≠ 0 EM field should be described by two independent components. Therefore, let us consider also the quasi-stationary equations for the magnetic field H :
× H = 4 π c j ; H = 0 .  
Note that in Equation (12), there is the total current density j , not j e x t , i.e., j = σ ^ E + j e x t , where σ ^ is the conductivity tensor. For Hz component, the equation is
Δ H z = 4 π c ( j y x j x y ) .
Equations (11) and (13) are fundamental for the quasi-stationary case. The components Hx, Hy can be expressed through Hz and j . Using the spatial–spectral expansion as~exp(−ikxxikyy), Equation (13) can be rewritten as
d 2 H z d z 2 ( k x 2 + k y 2 ) H z = 4 π c i ( k x j y k y j x ) .
The equations for Hx, Hy are obtained from Equation (12):
k y H x k x H y = 4 π i c j z ; k x H x + k y H y = i d H z d z .
Thus, the expressions for Hx, Hy are
H x = i k t 2 ( 4 π c k y j z + k x d H z d z ) ;   H y = i k t 2 ( 4 π c k x j z k y d H z d z ) ; k t 2 k x 2 + k y 2 .
For the situation when the properties of the atmosphere and the ionosphere depend on the vertical coordinate z only, Equation (11) can be rewritten as:
d d z ( ε 33 d φ d z ) i ( k x ε 13 + k y ε 23 ) d φ d z i d d z ( ( k x ε 31 + k y ε 32 ) φ ) ( k x 2 ε 11 + k x k y ( ε 12 + ε 21 ) + k y 2 ε 22 ) φ 4 π ρ e x t ; ρ e x t 1 ω ( k x j x e x t + k y j y e x t + i d j z e x t d z ) .
In (14) and (17), the components of the external current source, j x , y , z e x t are, in fact, the components of the effective lightning currents connected with the Hunga Tonga volcano eruption, exciting the ULF EM field under investigation. At Earth’s surface z = 0 the approximate boundary conditions are φ = 0, Hz = 0 in the case of high conductivity of the solid Earth. The simulations have also been provided for finite values of the conductivity of the solid Earth, and the changes of the ULF field distributions are ≤1%.
Let us carry out a qualitative analysis of Equations (12) and (17) using a rough estimation that the amplitudes of the fields are determined by the amplitudes of the principal Fourier modes. For these modes, the horizontal wave numbers are determined by the horizontal span of the surface external current source, as well as that j x e x t = j y e x t = 0 ;   j z e x t 0 . We have obtained that in this case, indeed, as follows from qualitative considerations in Section 4.1.1, there is an estimation of the ratio of magnetic and electric field components near Earth’s surface, z ≈ 0, from the quasi-stationary Maxwell equation −∂Hy/∂z ≈ (/c)σ(z ≈ 0)Ex. This yields the ratio |Hy|/|Ex|~(4πσ(z ≈ 0)/c)z1~ 10 5 . Here, σ(z ≈ 0)~10−1 s−1, z1~20 km are used, where z1 is the characteristic scale of the external current source in z-direction, σ ( z = 0 ) is the atmospheric conductivity near Earth’s surface. The same estimation has been obtained for the atmosphere region containing the current source, where the integral Maxwell equation for the total current has been applied, or the Ampère law.
Moreover, although the ratio | H y | / | E x | in the lower atmosphere is much less than unity, the equations are split due to the adequate use of the quasi-stationary approximation into two separate equations. Therefore, the chosen method permits solving a mathematically stiff problem of determining the EM field in LEAIM without loss of accuracy, even in the presence of the field components in the ionosphere, which differ from those in the atmosphere by many orders of magnitude.

4.1.3. The Dynamic Region—Ionosphere and Magnetosphere Waveguide Propagation and the Upper Boundary Conditions

In this subsection, the dynamic equations for Ex, Ey components of the electric field are derived. The dynamic approach uses, in particular, the combined spectral–finite-difference method [73,74]. The ionosphere is supposed to be homogeneous in the horizontal direction. Respectively (spectral) FFT method is applied in horizontal directions, while the finite-difference method is used in vertical direction. Note that the same method is also used in Appendix A and Appendix B. The above-mentioned dynamic equations are valid in the whole simulation region; however, in the lower part of the ULF range at the frequencies ω ≤ 10−2 s−1, there are problems in numerical simulations within the atmosphere region z < 70 km.
After the exclusion of H from the Maxwell equations, the equation for the electric field is
( E ) + Δ E + k 0 2 D = 4 π i k 0 c j ¯ e x t ; D ε ^ ( ω , r ) E .
It is assumed that there are no sources in the ionosphere. Equation (18) can be written in components as
( x )   2 E x z 2 k y 2 E x + k x k y E y + i k x E z z + k 0 2 D x = 4 π i k 0 c j x e x t ,
( y )   2 E y z 2 k x 2 E y + k x k y E x + i k y E z z + k 0 2 D y = 4 π i k 0 c j y e x t ,
( z )   ( k x 2 + k y 2 ) E z + k 0 2 D z + i k x E x z + i k y E y z = 4 π i k 0 c j z e x t .
By substituting (21) in (20) and (19) and denoting ε 33 t ε 33 k t 2 / k 0 2 , kt2kx2 + ky2, one can get a system of Equation (22) for the components Ex, Ey:
z ( A ^ 1 F z ) + z ( B ^ 01 F ) + B ^ 02 z ( F ) + B ^ F F = Q ;   F E x E y .
Equation (22) is the base of the dynamic method. This equation is equivalent to the Maxwell equations in the spectral domain. In Equation (22), the following notation is used:
Q x = 4 π k x ω z ( j z e x t ε 33 t ) 4 π i k 0 2 ε 13 ω j z e x t ε 33 t + 4 π i k 0 c j x e x t ; Q y = 4 π k y ω z ( j z e x t ε 33 t ) 4 π i k 0 2 ε 23 ω j z e x t ε 33 t + 4 π i k 0 c j y e x t .
The corresponding matrix coefficients are:
A ^ 1 = 1 ε 33 t ε 33 k y 2 / k 0 2 k x k y k 0 2 k x k y k 0 2 ε 33 k x 2 / k 0 2 ,
B ^ 01 = i k x ε 31 ε 33 t i k x ε 32 ε 33 t i k y ε 31 ε 33 t i k y ε 32 ε 33 t , B ^ 02 = i k x ε 13 ε 33 t i k y ε 13 ε 33 t i k x ε 23 ε 33 t i k y ε 23 ε 33 t ,
B ^ F = k 0 2 ε 11 ε 13 ε 31 ε 33 t k y 2 k 0 2 ε 12 ε 13 ε 32 ε 33 t + k x k y k 0 2 ε 21 ε 23 ε 31 ε 33 t + k x k y k 0 2 ε 22 ε 23 ε 32 ε 33 t k x 2 .
Equations (14), (17) and (22) have been approximated by the finite differences with respect to the variable z. The details of the algorithm for solving Equation (22), which is based on the matrix elimination method, are presented in Appendix A. The finite-difference version of Equation (22), reproduced, for convenience, in Appendix A as Equation (A1), is presented as Equation (A2) there. The number of nodes is Nz ≥ 2 × 10⁴ for Equation (22). The elimination method [74] has been applied, which is appropriate for solving this kind of differential equation with boundary conditions.
The stiffness of Equation (22) can also be demonstrated from an analysis of the matrix of coefficients A1 (Equation (23)). The values of the component of the permittivity |ε33| vary from ≈1 in the lower atmosphere to 109 and more in the ionosphere at the frequencies ω ≤ 10−2 s−1. Therefore, the values of the components of A1 also vary strongly with the growth of the vertical coordinate z. The strongest variations of the components of A1 occur at the altitudes z < 70 km in the upper atmosphere. At higher altitudes in the ionosphere, these variations are smooth. Moreover, these components depend essentially on the transverse spatial wave numbers kx, ky; there is a principal difference between the case of kx = ky = 0 and kx,y ≠ 0, especially where |ε33| is small. At the values kx,y ≠ 0, the changes of the coefficients A1 on z are more essential than in the case kx = ky = 0. This results in more expressed stiffness and the generation of ripples in the dependencies of EM fields on the transverse coordinates x, y, as seen in Section 4.1.5. Note that Equations (14) and (17) for the quasi-stationary region do not possess the stiffness due to the structure of coefficients there. In Equations (14) and (17), the combinations like ε33kt2/k02 are absent.
The upper boundary conditions for the dynamic equations depend on the geomagnetic field line configurations near the region of current sources. For field lines extending into the far magnetosphere, the radiation conditions apply, assuming the absence of incoming waves. For field lines returning to Earth’s surface, reflective boundary conditions are used [21]. Note that in the magnetosphere and the upper ionosphere, there is the ULF Alfvén mode, which propagates along the geomagnetic field lines and behaves as an effective waveguide mode.
For the dynamic region, the lower boundary conditions are in the ionospheric D-layer or lower E-layer [52]. The boundary conditions in this region require the continuity of the tangential components of the EM field at z = Lz (see Figure 5). Note that the algorithm presented in Section 4.1.3 is also used for ELF wave consideration in Section 4.2.

4.1.4. Tensor Impedance and Quasi-Stationary Boundary Conditions

The partial solutions of the dynamic equations at z > Lz and of quasi-stationary ones at z < Lz are matched at z = Lz by requiring a continuity of the tangential components Ex,y, Hx,y.
When considering the dynamic equation jointly with the upper boundary conditions, it is possible to get the following relations at z = Lz + 0 with the tensor impedance components Zαβ  ( α , β = 1 , 2 ) :
E x = Z 21 H x + Z 22 H y ;   E y = Z 11 H x Z 12 H y .
Tensor impedance components Zαβ are described in Appendix A (see Equation (A11)). Note that the method of the derivation of the components of tensor impedance presented in Appendix B is applicable for all the low frequencies, namely the ULF, ELF, and VLF ranges. Upon further investigation, we will consider a situation in which EM current sources are located in the atmosphere only. Respectively, the vertical component of the current is of the form adopting both the gyrotropy and anisotropy characterizing the electric properties of the ionospheric E-region:
j σ ^ E + j e x t ,
where the vertical component of the external current source in the ionosphere, j e x t = 0 . Then, Equation (27) can be rewritten taking into account Equation (28), and the following relations can be obtained:
E x = i k x φ ,   E y = i k y φ ,   E z = d φ d z .
Finally, from Equation (27) and accounting for Equations (28), (29) and (16), we get the following relations, which are used as the boundary conditions for the system of Equations (14) and (17) for φ and Hz at the boundary between the regions:
φ 1 i k t 2 4 π c ( Z 21 k y Z 22 k x ) σ 31 k x i k t 2 4 π c ( Z 21 k y Z 22 k x ) σ 32 k y = = 1 k t 2 4 π c ( Z 21 k y Z 22 k x ) σ 32 d φ d z + 1 k t 2 ( Z 21 k x + Z 22 k y ) d H z d z ; φ 1 + i k t 2 4 π c ( Z 11 k y Z 12 k x ) σ 32 k y + i k t 2 4 π c ( Z 11 k y Z 12 k x ) σ 31 k x = = 1 k t 2 4 π c ( Z 11 k y Z 12 k x ) σ 33 d φ d z 1 k t 2 ( Z 11 k x + Z 12 k y ) d H z d z .
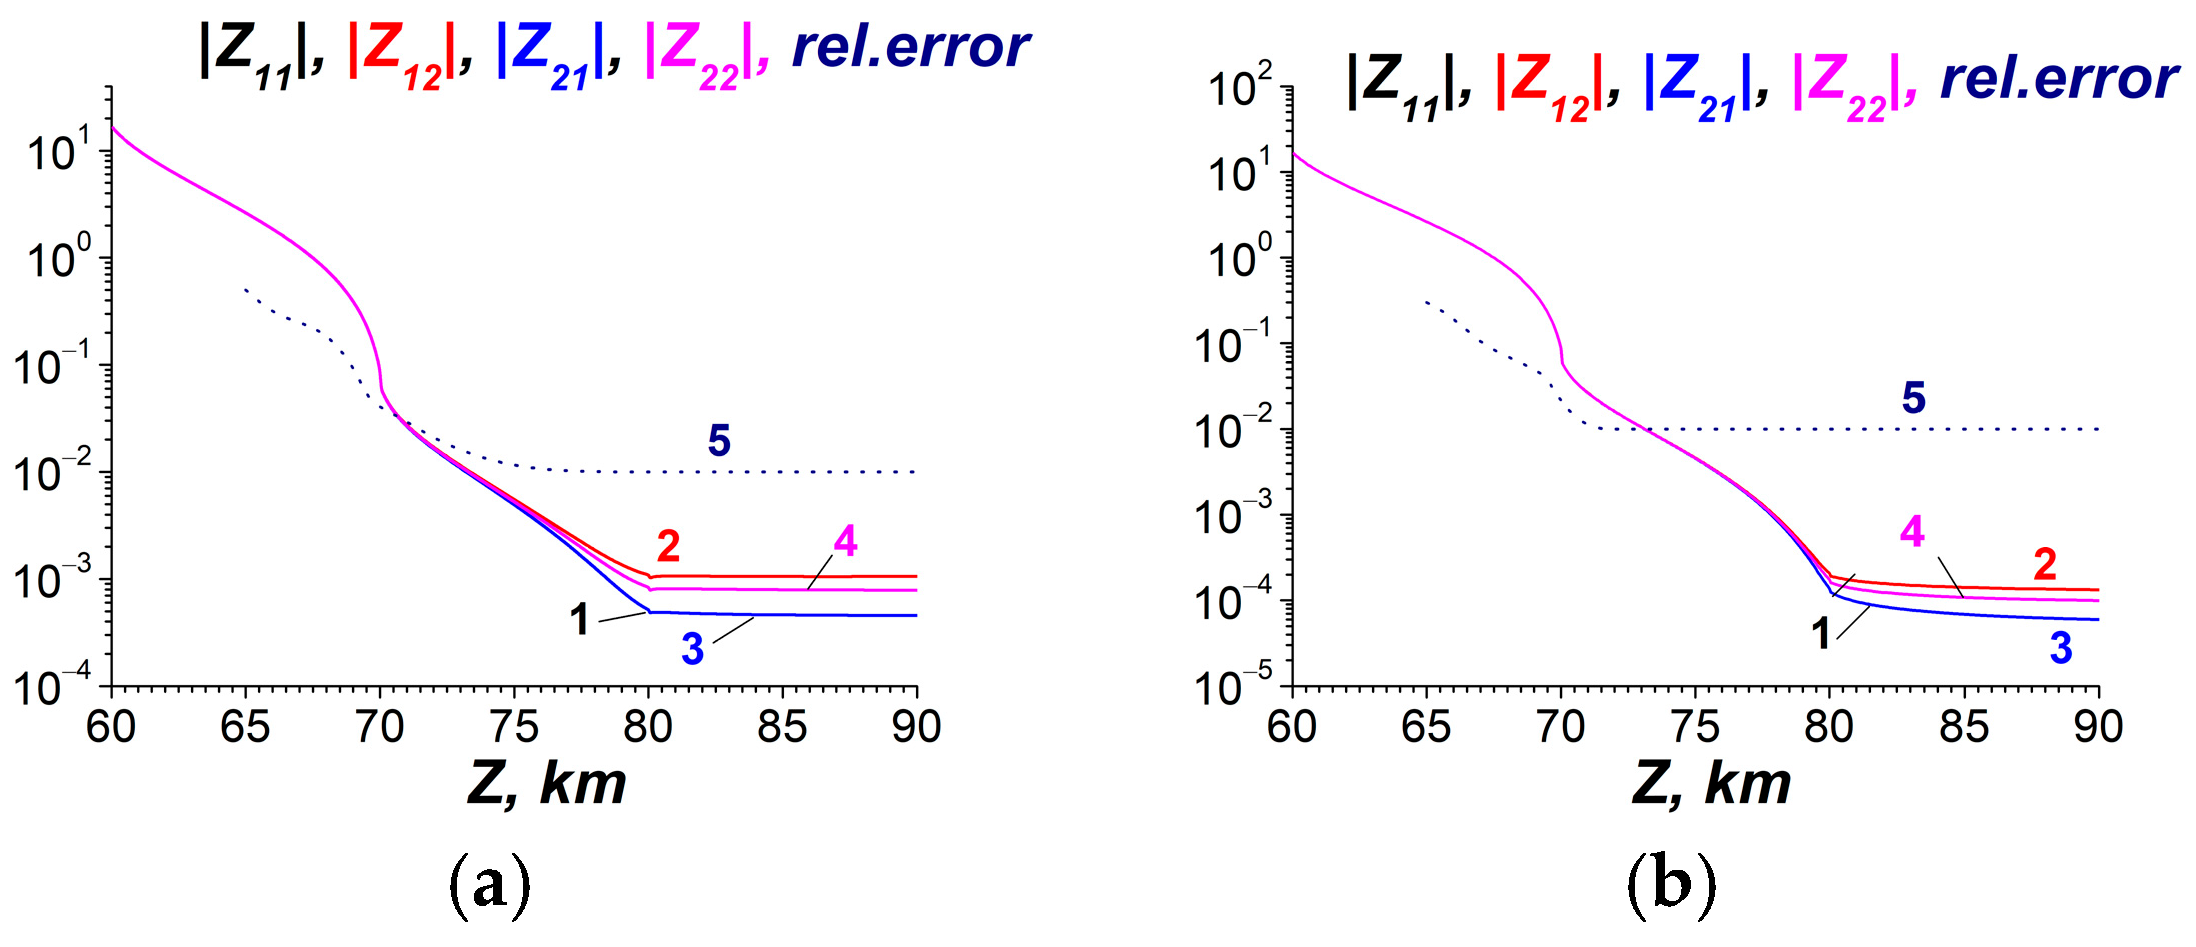
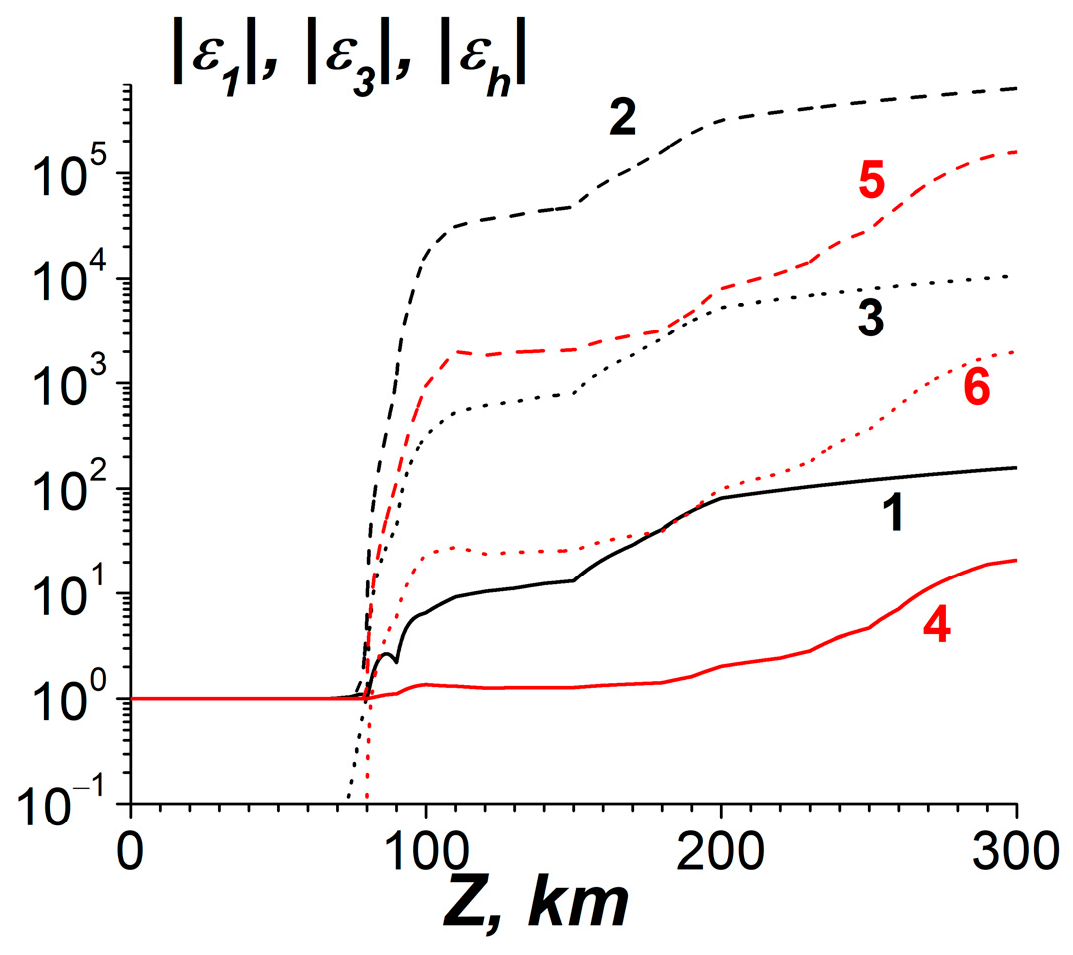
The boundary conditions (30) should be applied at the height z = Lz, which is defined in the following manner. In the boundary conditions (30), there are the components of the tensor impedance Zαβ that are obtained in Appendix A (see Equation (A11)) using dynamic equations (22). The absolute values of the components increase with the decreasing altitude z. As our simulations have demonstrated, to ensure the accuracy of the results of the combined problem, the components of the tensor impedance of the ionosphere should be small, |Zαβ| ≤ 0.5. This is the applicability condition of the concept of the impedance itself [83,84]. This condition for the tensor impedance is satisfied at Lz ≥ 70 km, as seen in Figure 7.
Also, the errors for solutions of the dynamic equations for the impedance should be small. As already mentioned above, at small frequencies ω ≤ 0.01 s−1, there are some problems with the generation of errors at smaller heights z ≤ 65 km. The generation of errors at smaller heights results in errors in the whole simulation region, including z ≥ 70 km. Thus, the matching boundary conditions can be realized at the heights Lz = 70–120 km, where the condition of the quasi-stationarity is valid, and the numerical solution of the dynamic equations can be realized with small errors simultaneously.
The estimated errors of the solution for the penetration of ULF EM fields are depicted in Figure 7, Curve 5. The relative errors have been estimated as the ratio of the residual of Equation (22) after solving to the biggest term in its left-hand side. It is found that at the altitudes of the matching Lz ≤ 65 km, the relative error increases catastrophically. Generally, the mentioned above error does not exceed in our simulations a few percent (see Figure 7).
After solving the quasi-stationary problem, the values of Ex, Ey at z = Lz are known. Then, the values of Ex, Ey, and all other components of the EM field can be obtained at z > Lz from the dynamic Equation (22).

4.1.5. Numerical Simulations on Penetration of ULF Electric Fields into the Ionosphere— Possible Action in the Ionosphere and Comparison with Observations and Other Investigations

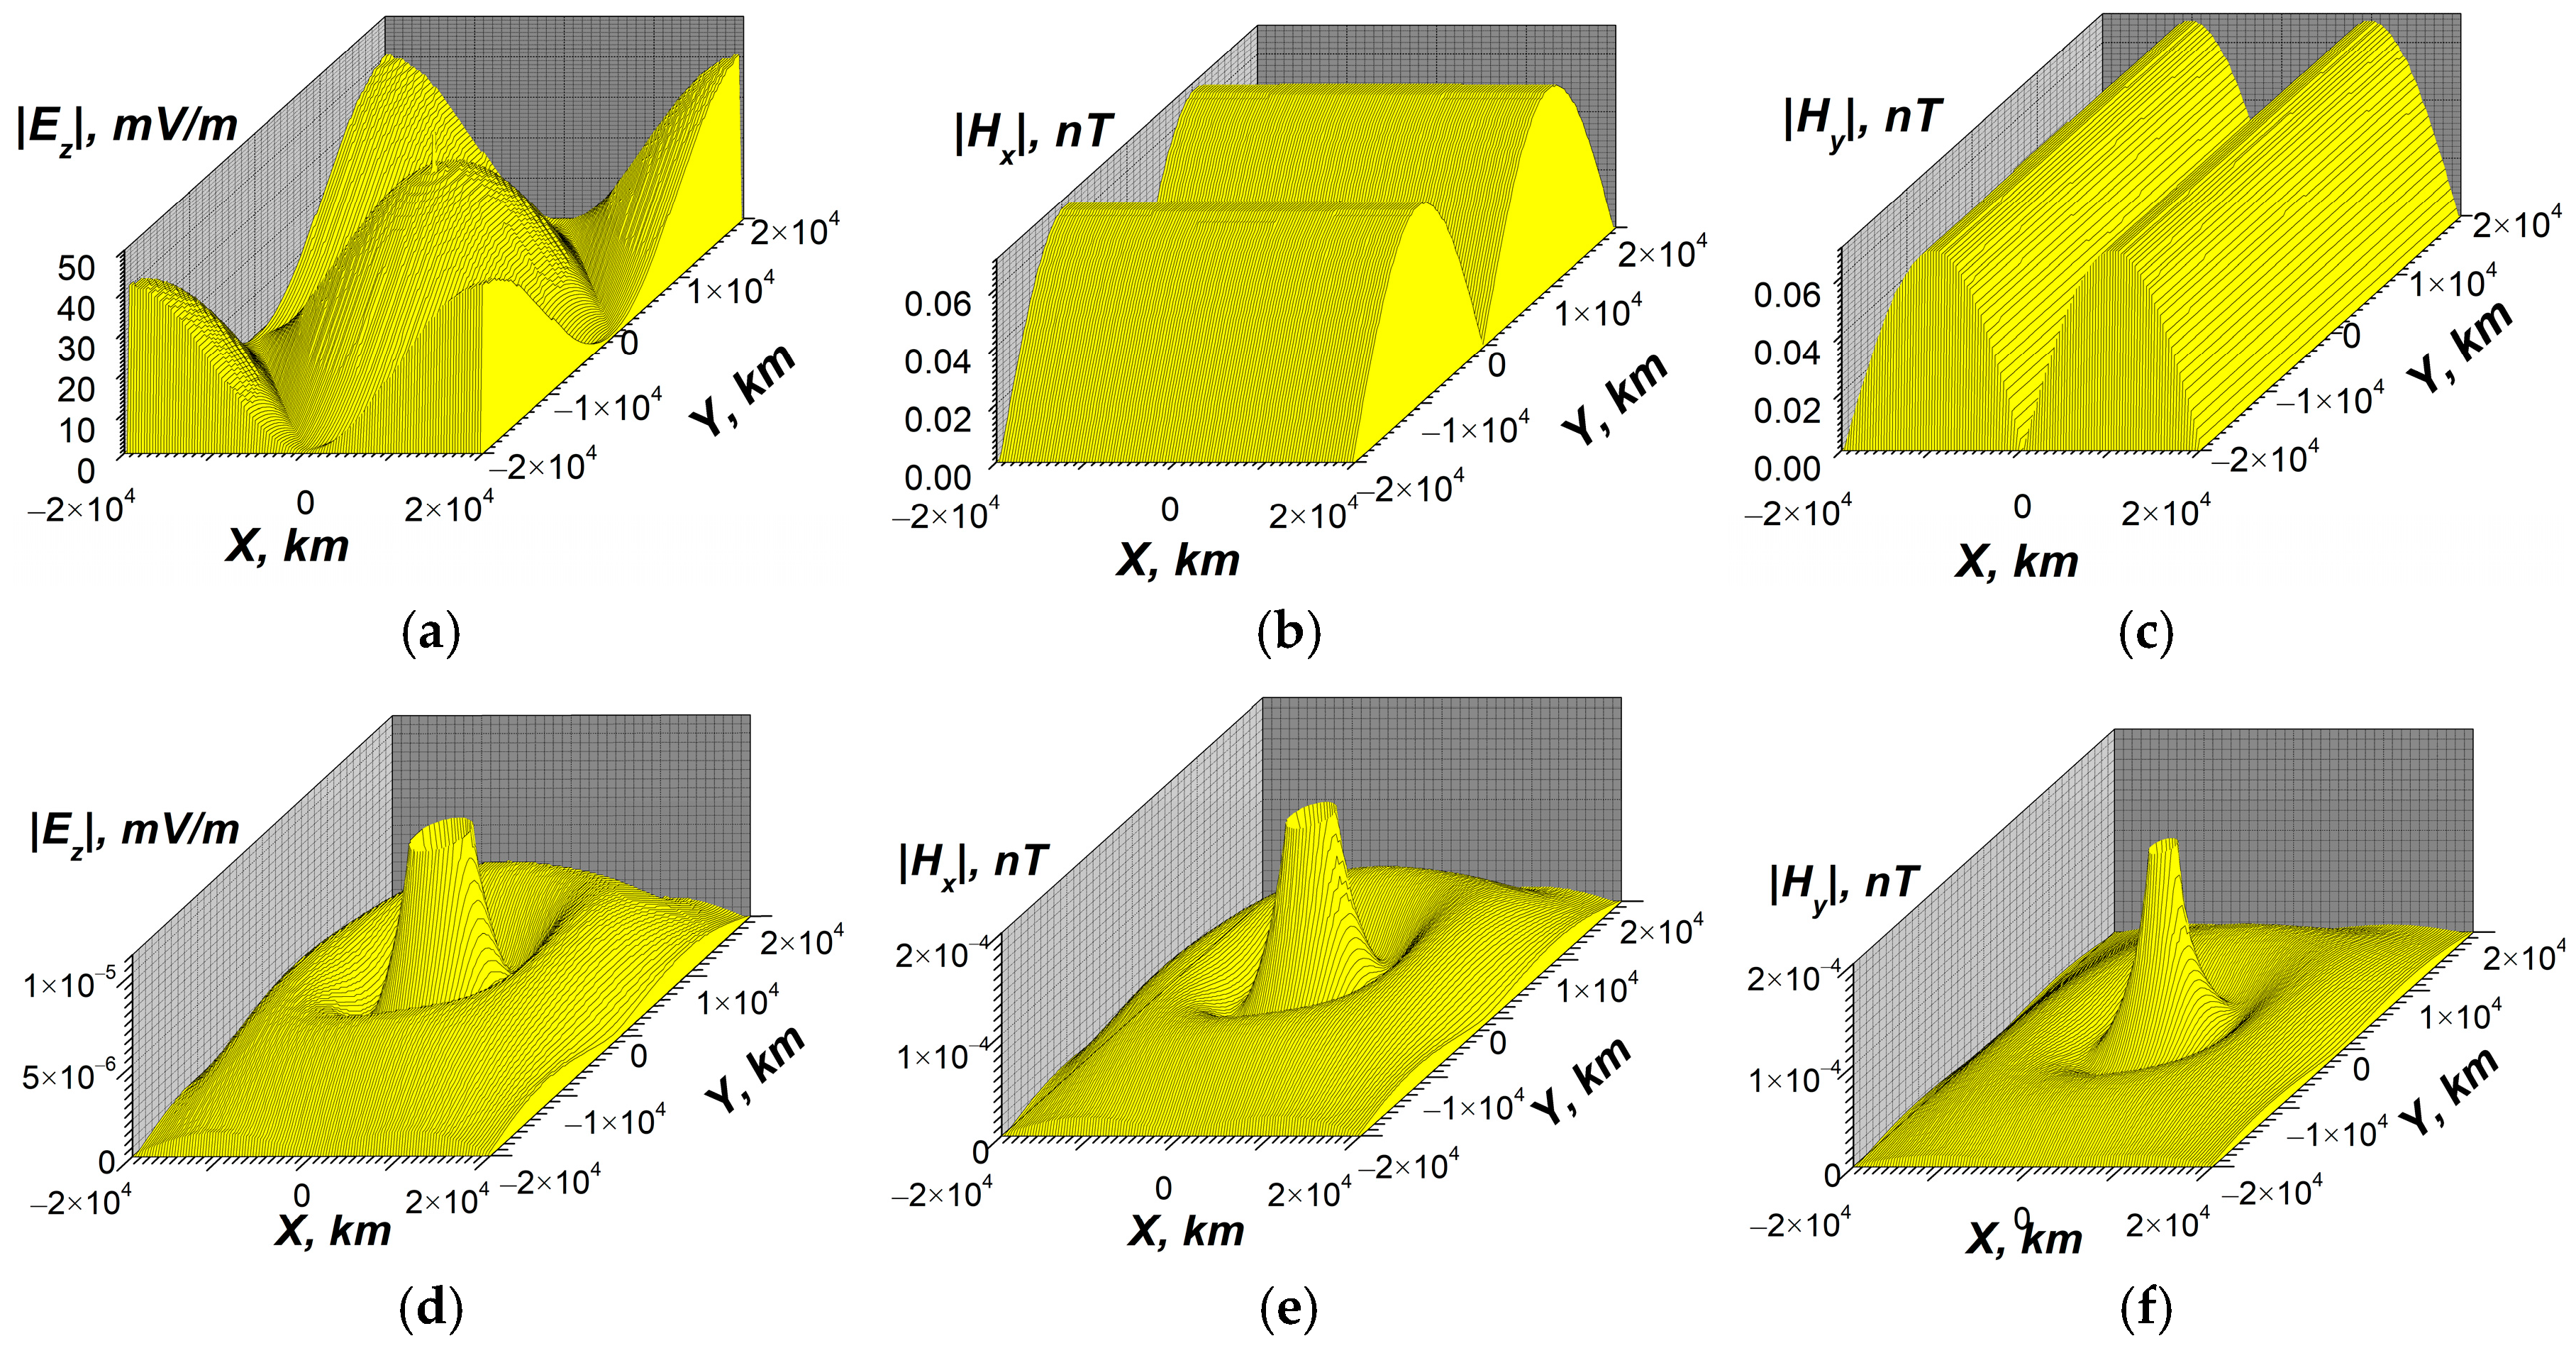
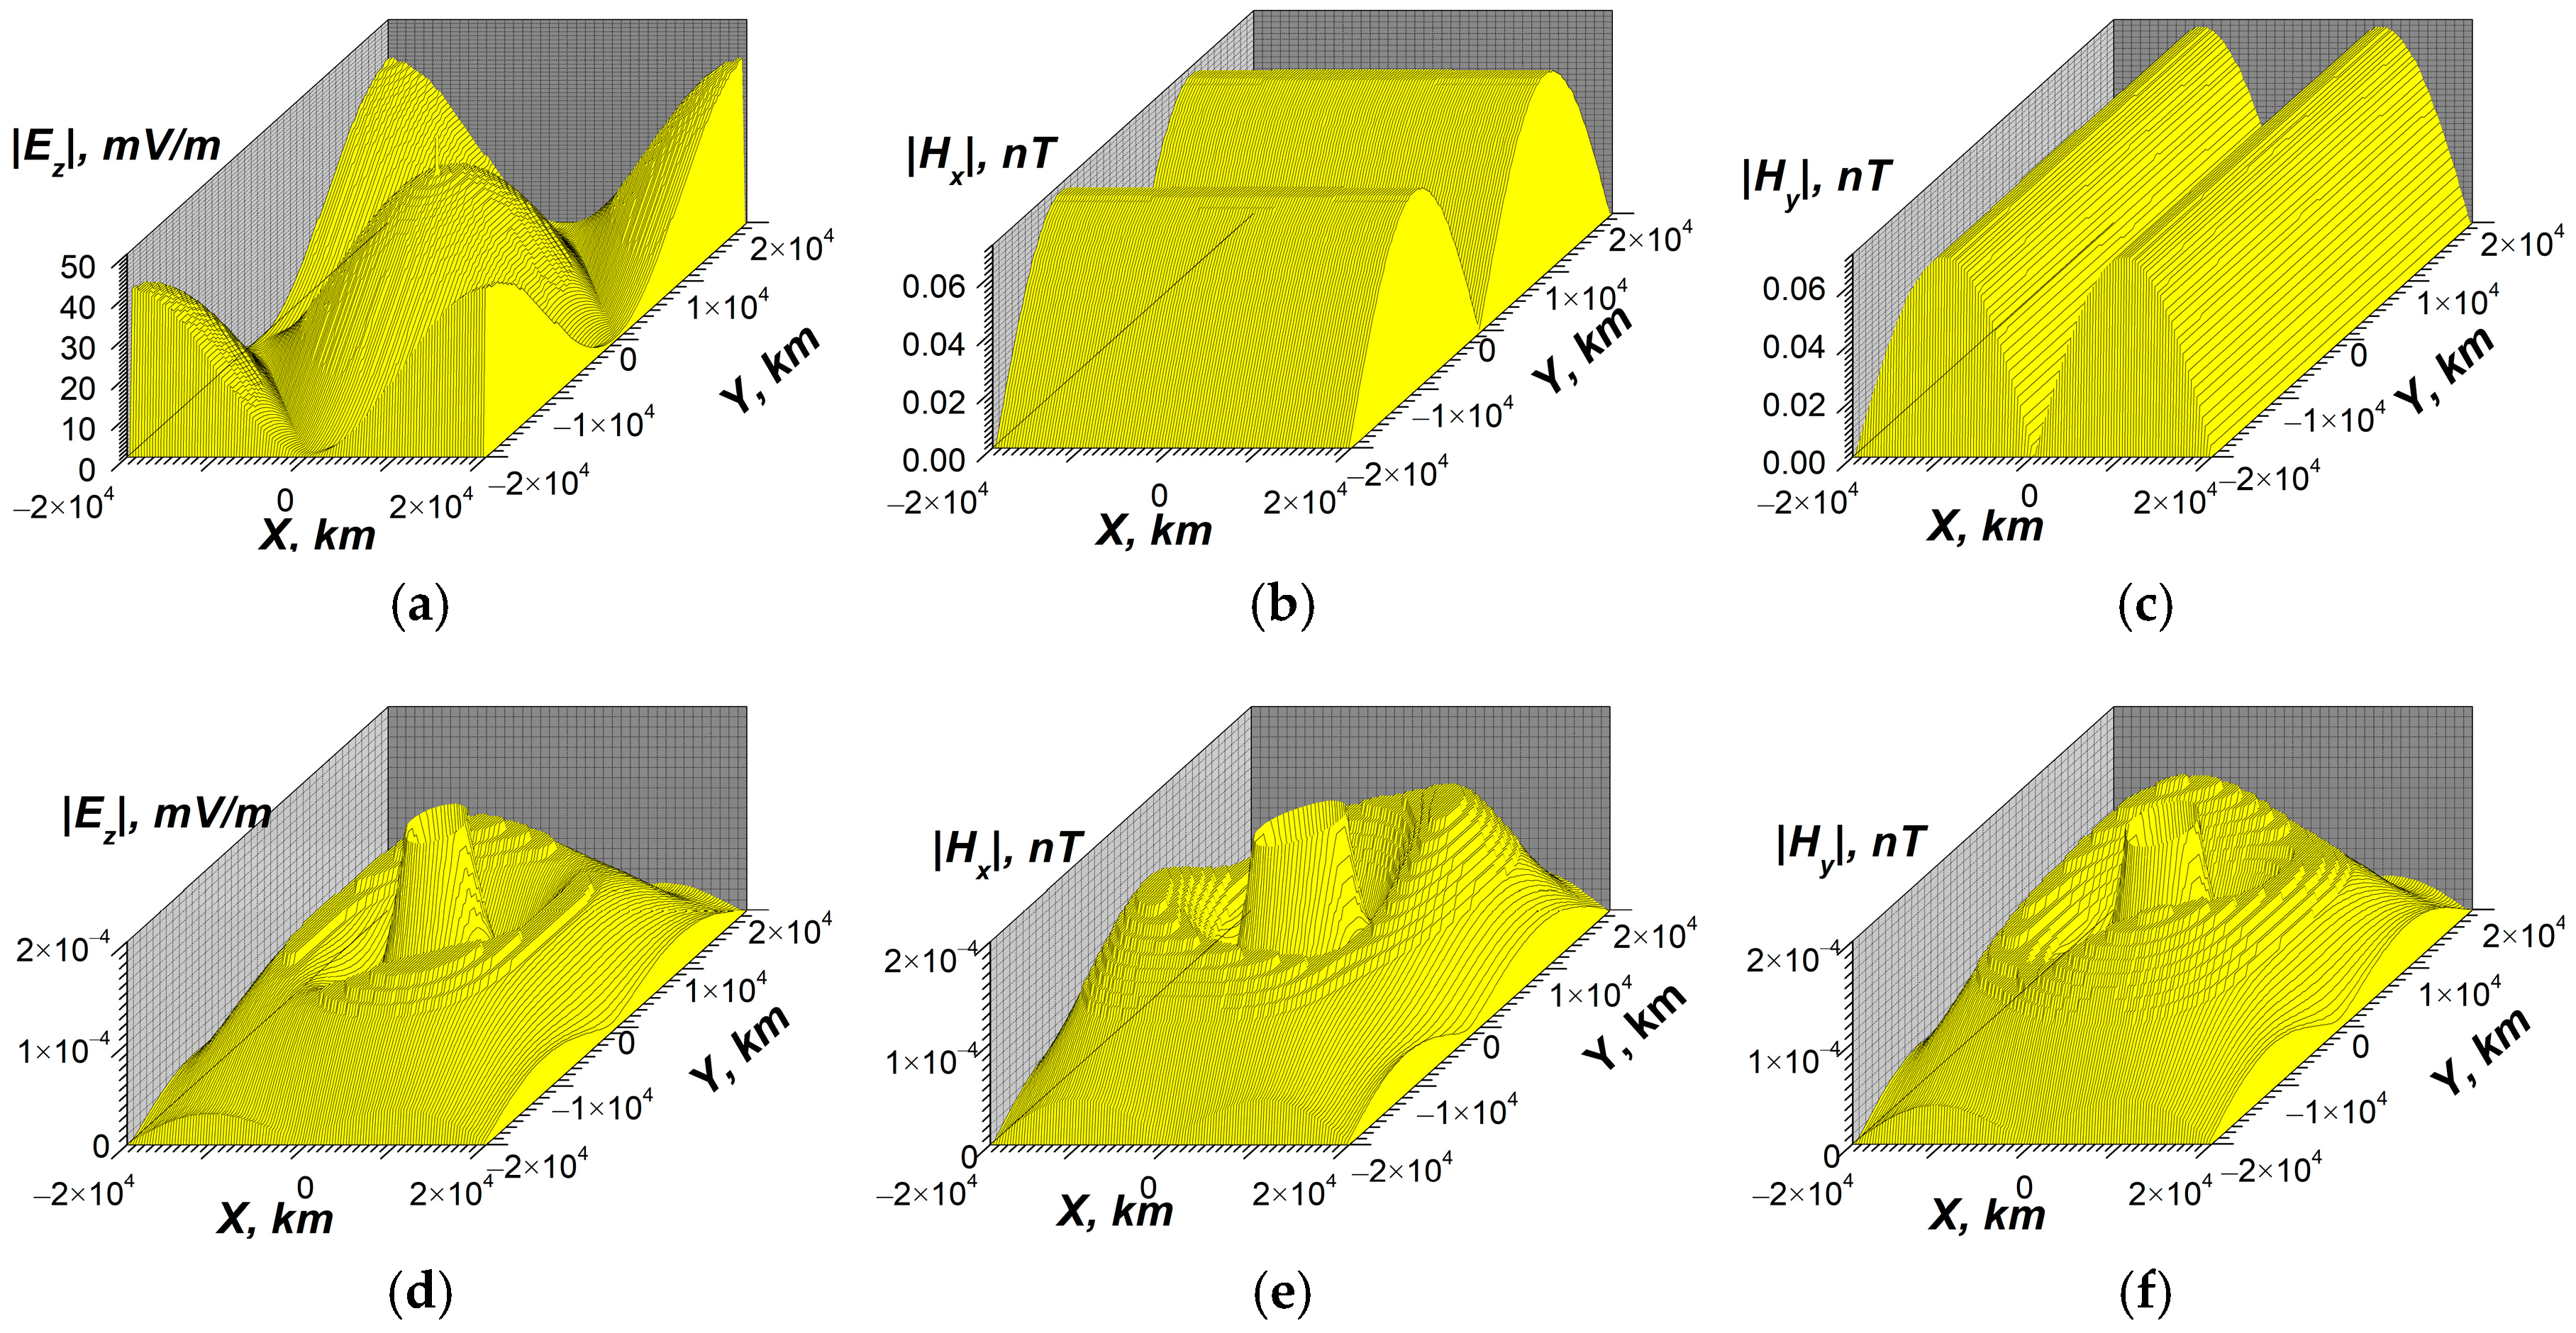
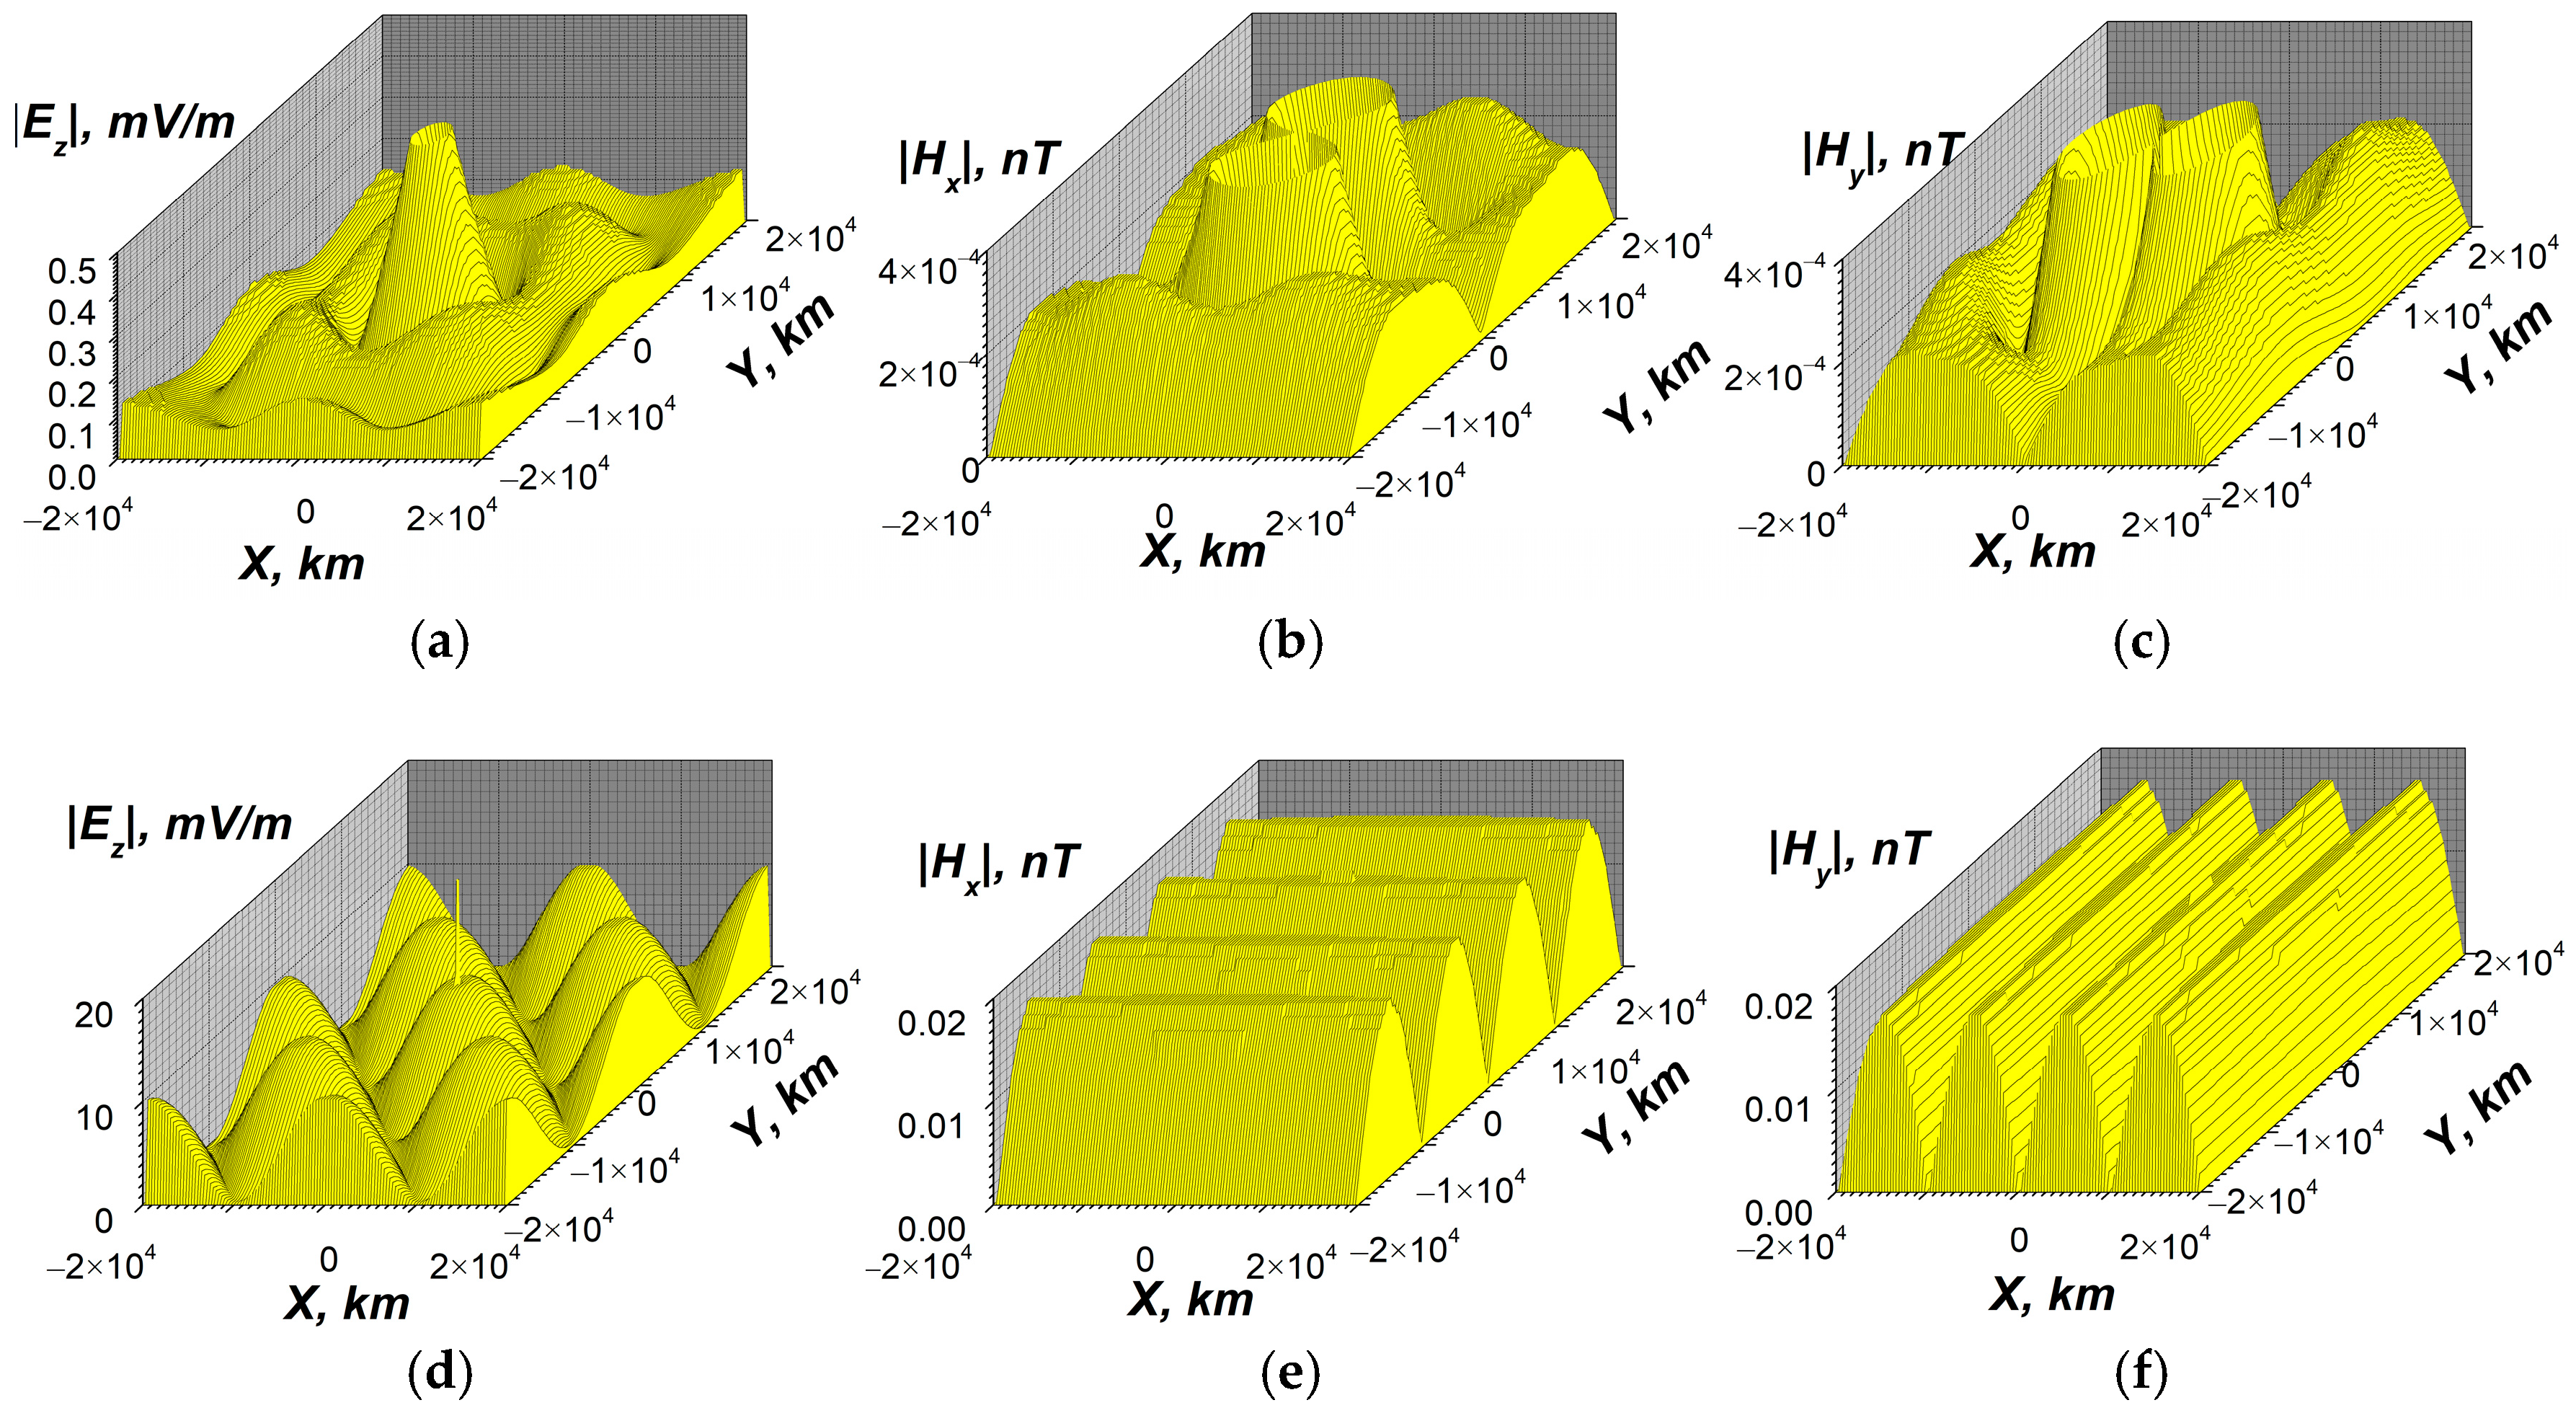
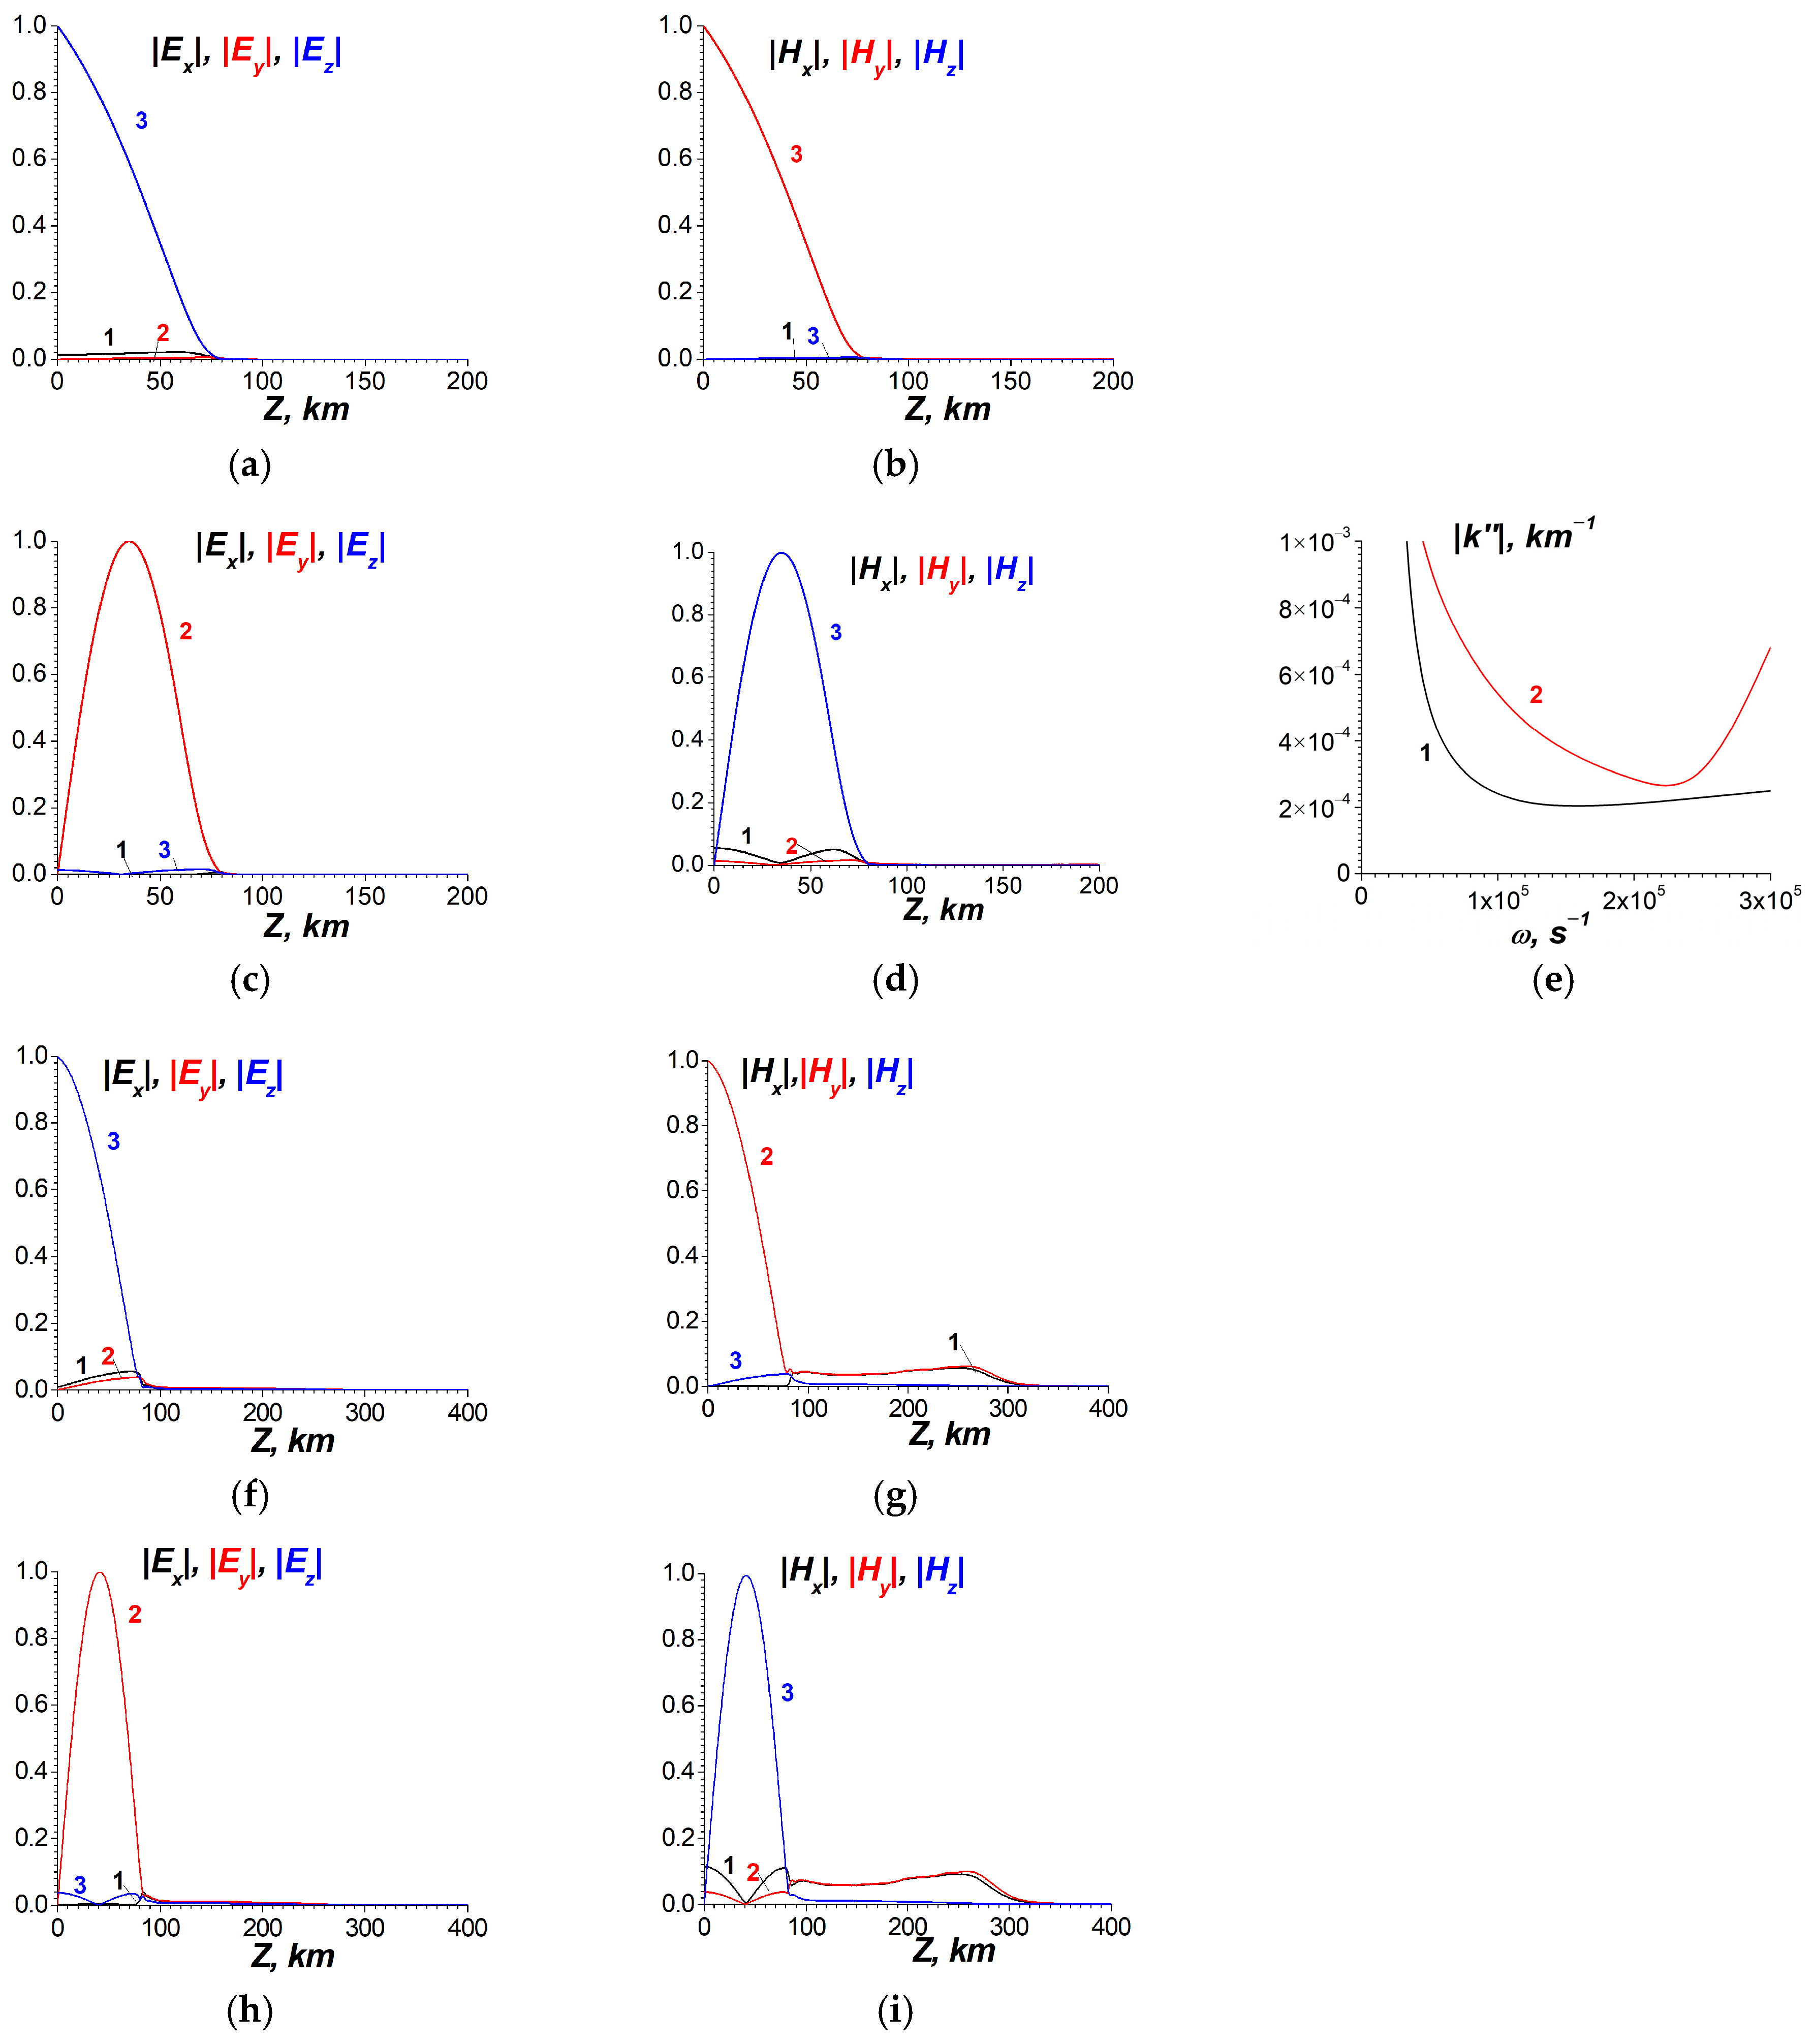
Consider the results on the penetration of ULF EM fields through LEAIM (Figure 8, Figure 9, Figure 10 and Figure 11 below) in the presence of ULF external currents in the lower atmosphere (Figure 5). The characteristics of the external currents have been obtained from the observation data on ULF lightning strokes connected with the Hunga Tonga eruption; see Figure 2 in Section 3.
In the atmosphere, the ULF current source possesses the vertical component only ( j x , y e x t = 0 ) , [75]:
j z e x t = j 0 exp ( ( x 0.5 L x x 0 ) 2 ( y 0.5 L y y 0 ) 2 ( z z 1 z 0 ) 2 ) .
Here, x0, y0, z0 are the sizes of the source, j0 is the amplitude of the exciting current; 0 ≤ xLx, 0 ≤ yLy where Lx, Ly are the sizes of the region of simulations. In the simulations, they are Lx = Ly = 6000 km. These sizes are large enough to reduce the influence of the periodic boundary conditions on the results of simulations. Because FFT is used for the variables x and y, the spatial wavenumbers kx, ky should be equal to the powers of 2. In our simulations, they are Nx = Ny = 512 or 1024. At smaller values of Nx, Ny, the spatial resolution of ULF fields is not sufficient, whereas at higher values the simulation time is rather long.
The parameters of the source current density are x0 = y0 = 150 km, z1 = 25 km, z0 = 20 km. The maximum values of kx, ky are kmax ≡ (/Lx)(Nx/2) ≈ 0.15 km−1 at Nx = 512, so there is the product kmax × x0 ≈ 20. This value provides sufficient spatial resolution for ULF fields. The vertical size of the source (40–50 km) has been chosen from the observational data on the volcanic gas and dust cloud; therefore, it is specific for the Hunga Tonga eruption. The vertical size exceeds the typical height of thunderclouds, 10–15 km [10], by several times. The angle between the geomagnetic field and the vertical axis z is θ = 30°. The dependence of the simulation results on θ also has been investigated and is discussed below. The geomagnetic field is H0 = 0.46 Oe at Earth’s surface, or B0 = 4.6 × 10⁻⁵ T. The parameters of the ionosphere correspond to the nighttime. The units for the output electric field and magnetic field are mV/m and nT, respectively, in all figures.
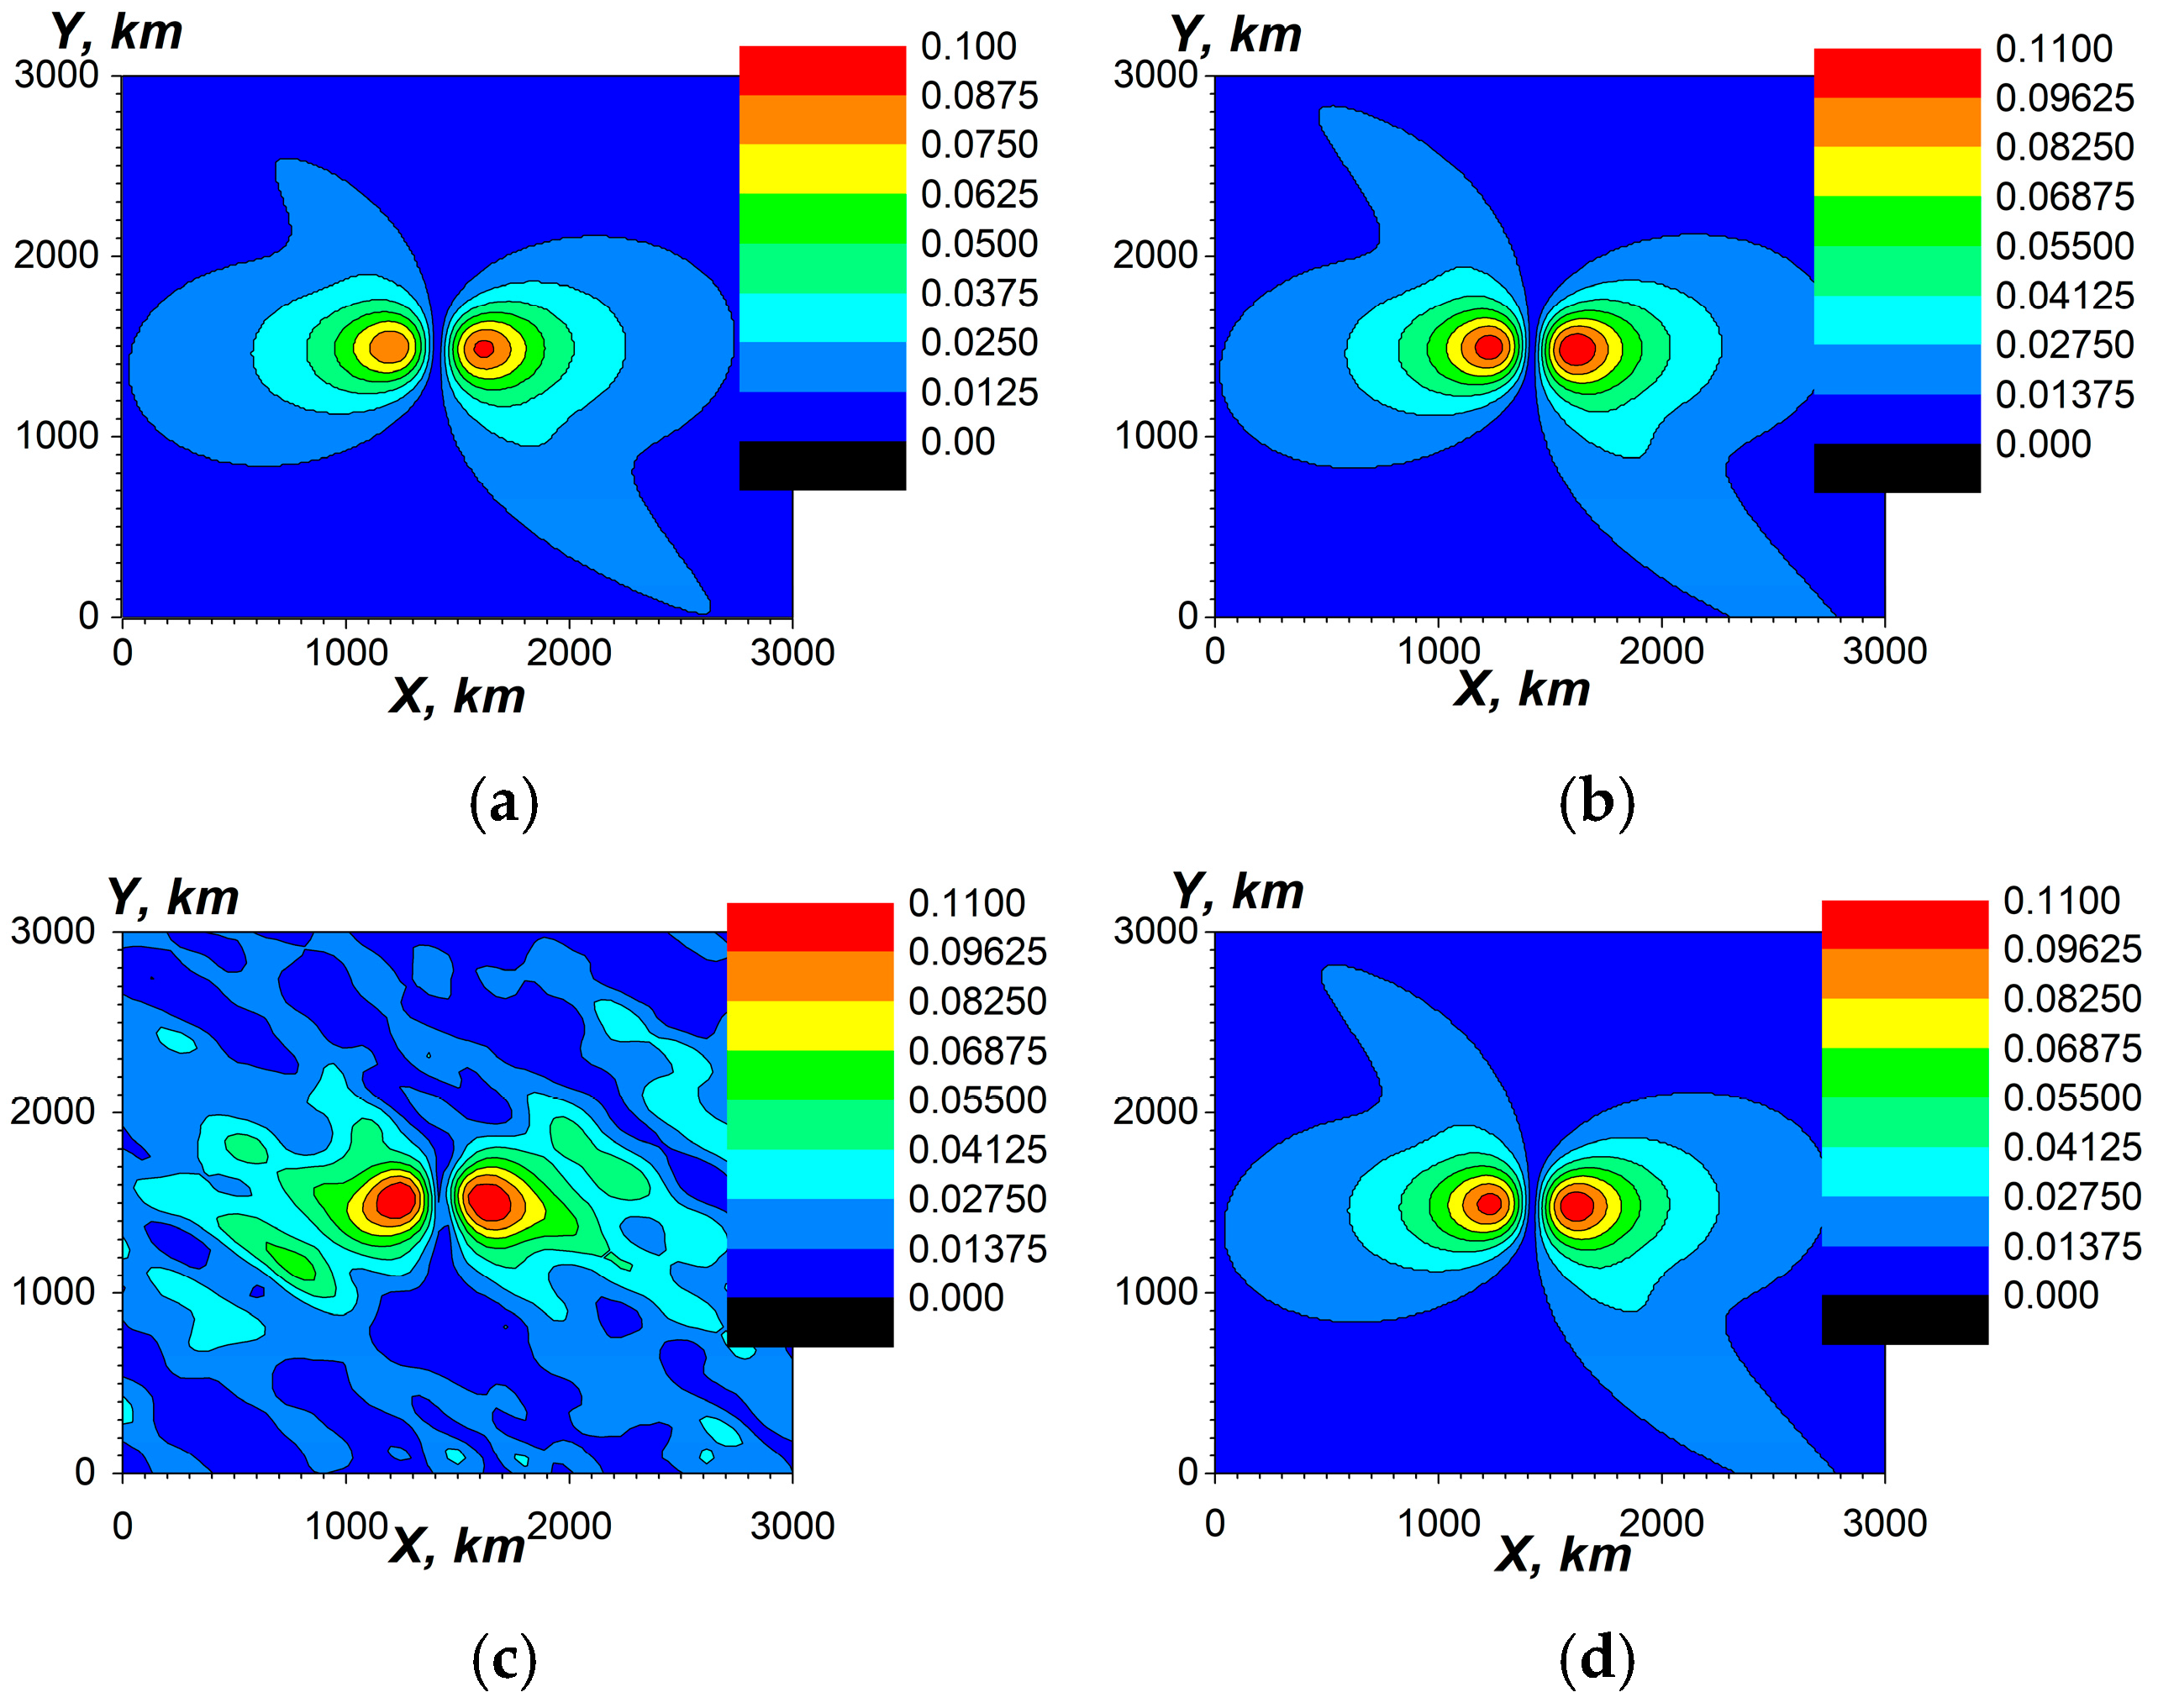
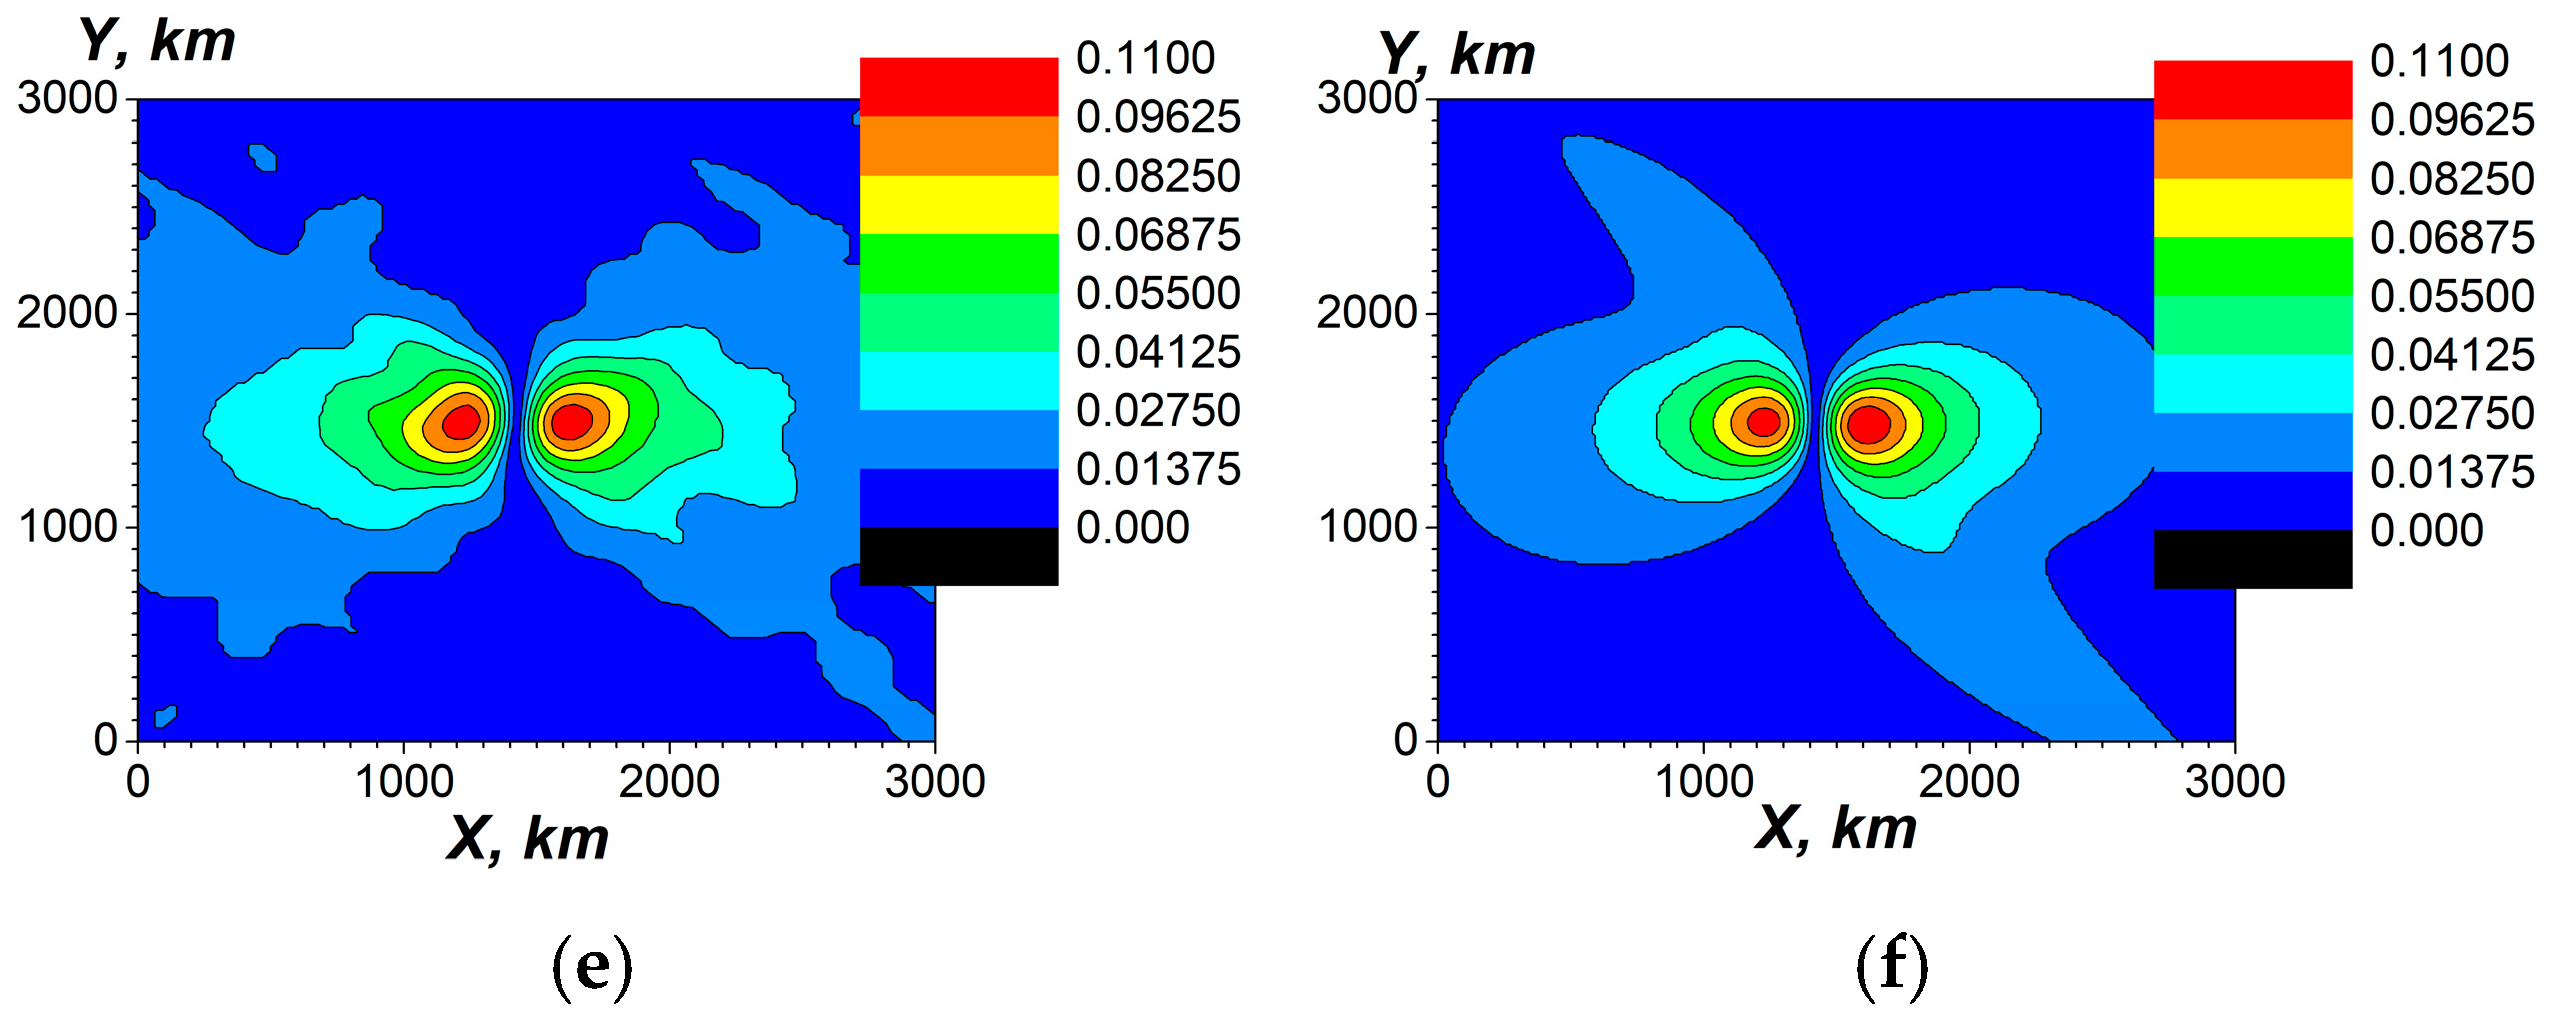
The primary goal of this subsection is to compare the generation of EM fields by the current sources at different frequencies. The results of the simulations are presented in Figure 8. The frequency range is 10−3 s−1 < ω < 10−1 s−1. The dependence of the spectral components of the current induced by lightning strokes on frequency is weak in this frequency range, as evident in Figure 2; therefore, the amplitudes are assumed as the same, j0 = 10−8 A/m2. This value corresponds to the spectral values of the current density with the used discretization of the frequency. In Figure 8, Figure 9, Figure 10 and Figure 11, the central part of the simulation region is presented, 0 < x < 3000 km, 0 < y < 3000 km, with the shift 1500 km of the center of the simulation region. Thus, the center of the current source is in the point x = y = 1500 there.
At the frequency range ω < 0.025 s−1, the pure dynamic simulations yield results with essential errors due to the features pointed out above. Therefore, only the combined simulations have been applied there. At higher frequencies ω ≥ 0.025 s−1, both pure dynamic simulations and the combined ones have been realized with small relative errors. The upper boundary conditions have been applied at zmax = 2000 km; see Figure 5. Under the combined simulations, the matching of the quasi-stationary and the dynamic approaches depends weakly on the altitude in the range of altitudes 70 km ≤ Lz ≤ 120 km. For the simulations presented below, it is Lz = 75 km.
From Figure 8c, it is seen that at the frequencies ω ≤ 0.025 s−1, there are ripples in ULF field distributions simulated by the direct dynamic approach. These ripples are caused by the stiffness of the dynamic Equation (22), as discussed above.
The principal result is that the dependencies of the generated ULF electric fields on the frequency of the exciting currents are weak in the frequency range 10−3 s−1ω ≤ 0.1 s−1. These distributions are practically the same both in the atmosphere and the ionosphere at all frequencies given above. The results obtained both by the direct dynamic and combined simulations are similar when the frequency of the current source is ω 0.025   s 1 . The ripples are absent in the spatial electric field distributions obtained by the combined dynamic–quasi-stationary approach.
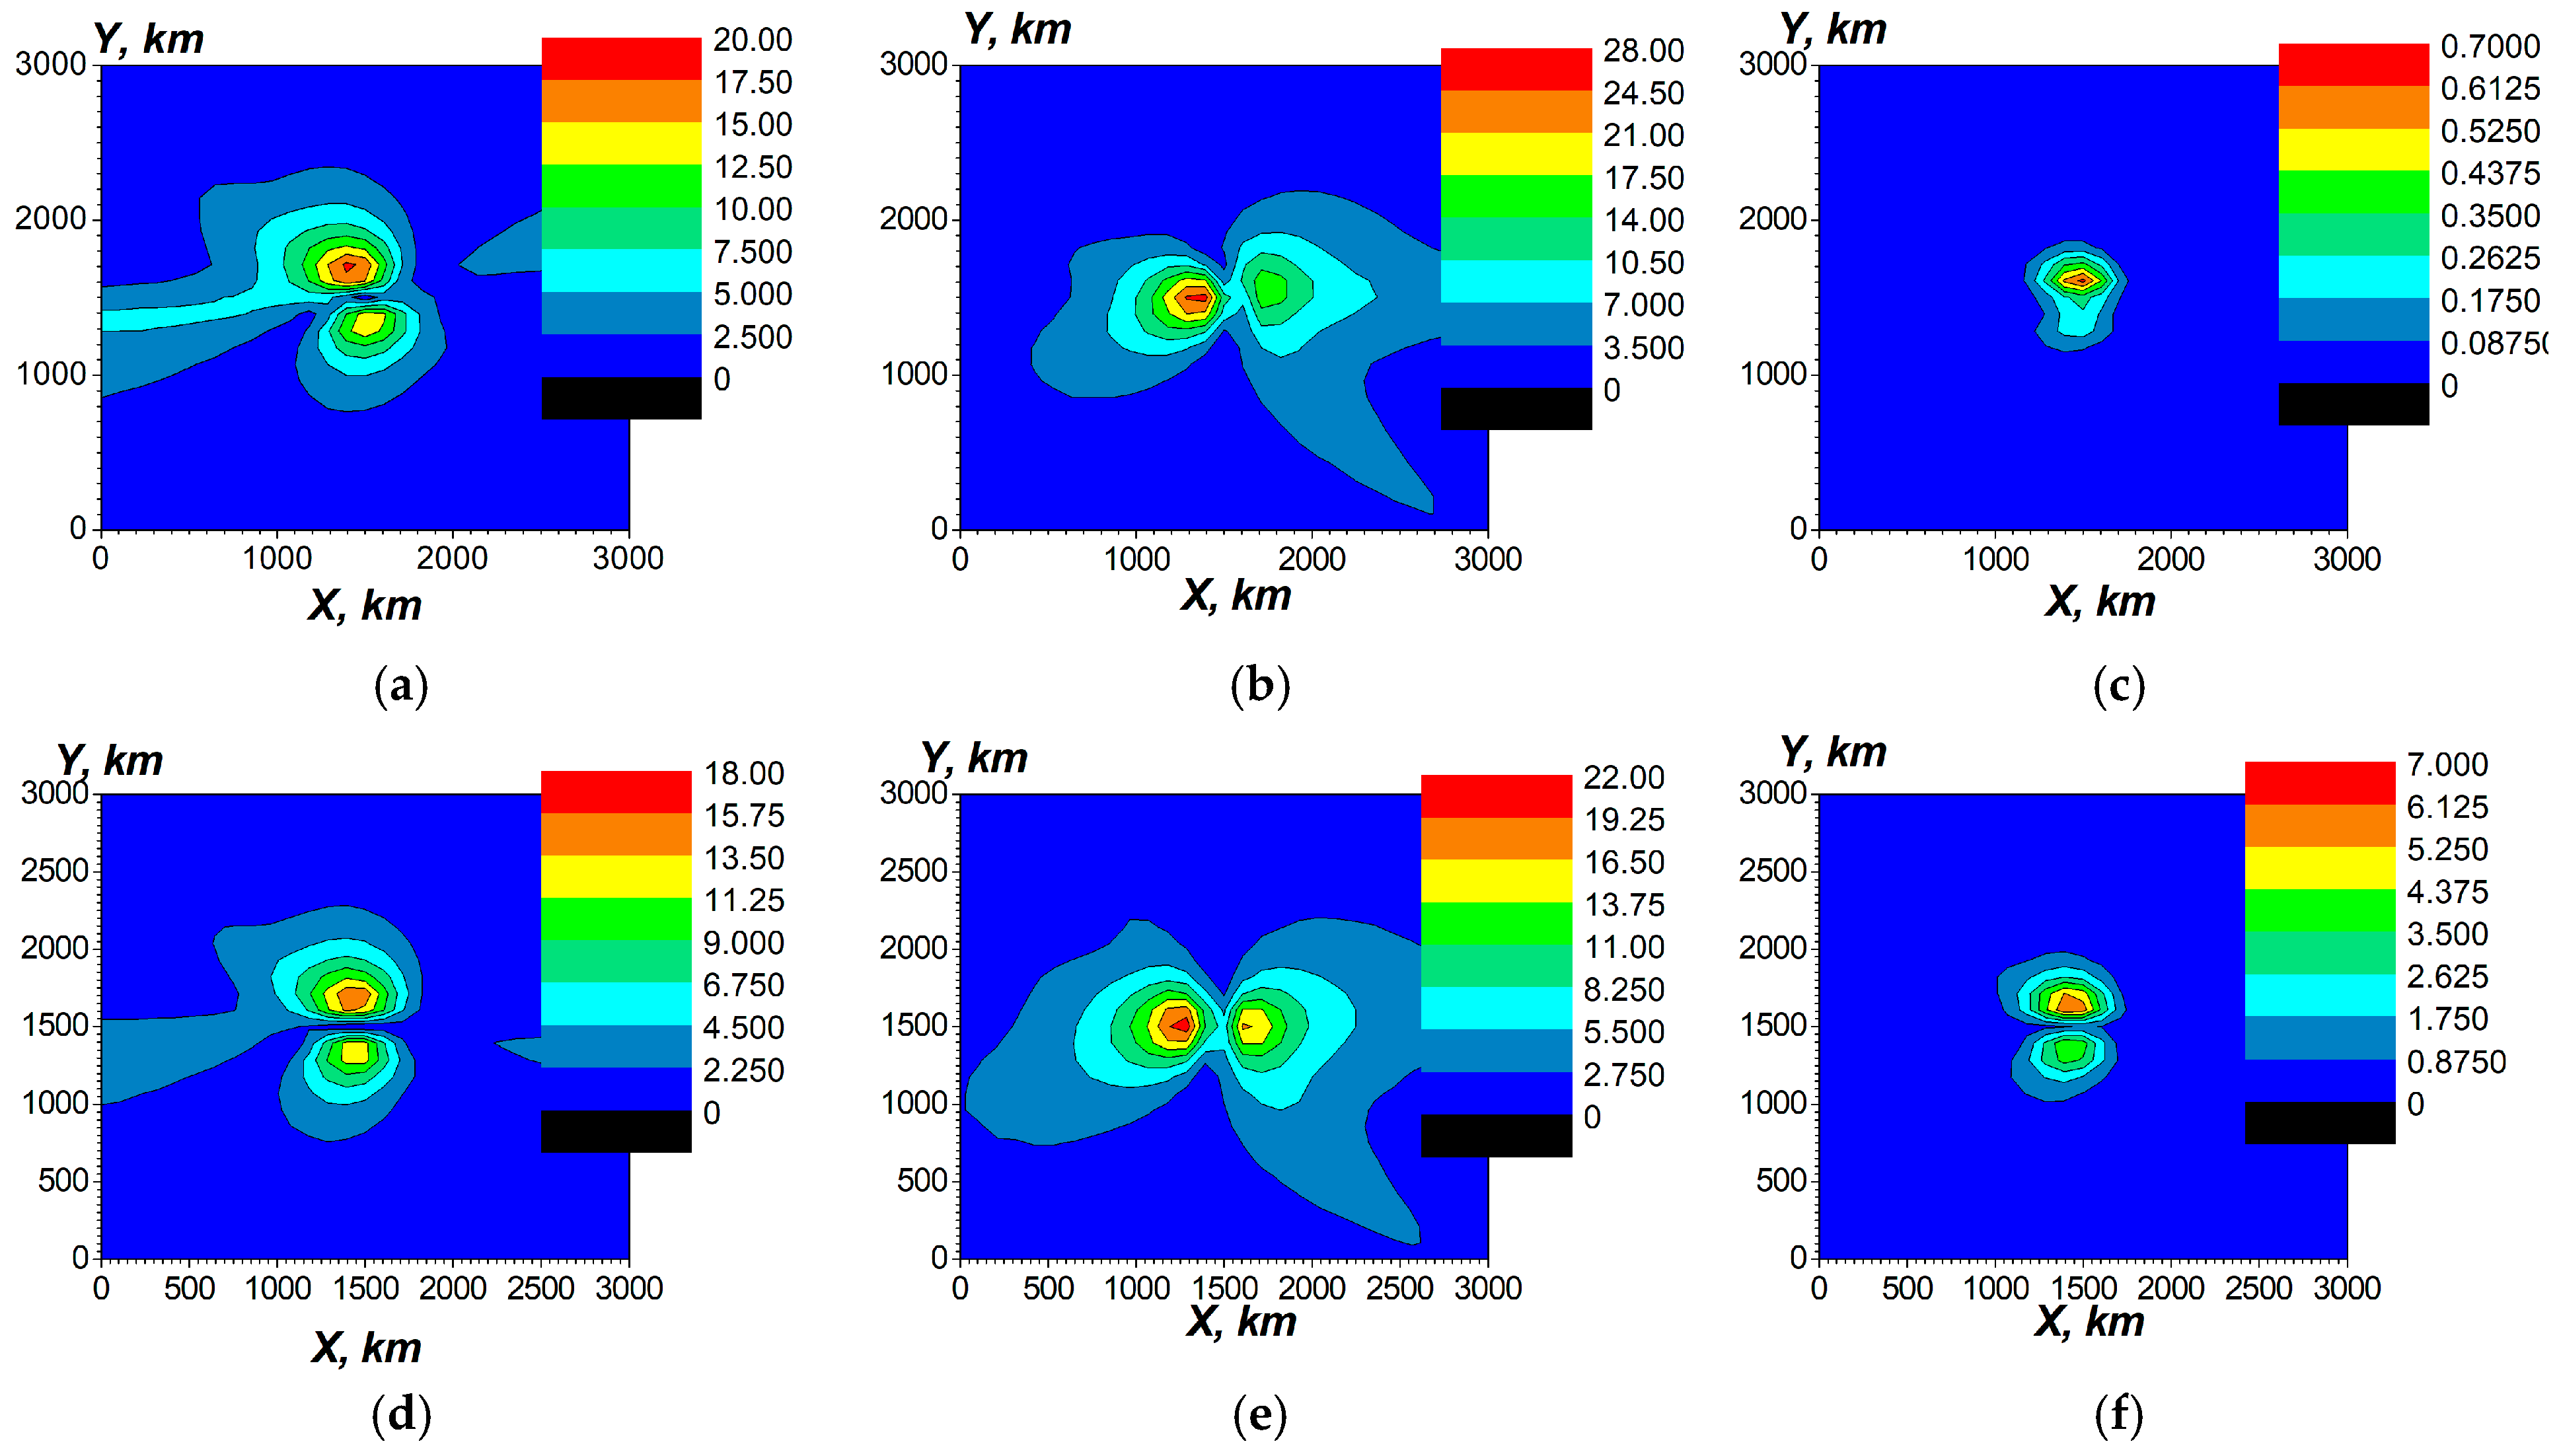
The coincidence of the distributions of the electric field in the wide ULF frequency range allows us to estimate the values of ULF electric fields penetrating into the ionosphere from the current sources due to lightning. Figure 9 shows the results of simulations for the penetration of the electric field components generated by the total density of electric current in the frequency range 10−3 s−1ω ≤ 10−2 s−1 (1.6 × 10⁻⁴ Hz ≤ f ≤ 1.6 × 10⁻³ Hz). The calculated total maximal amplitude of the current density is j0 = 4.7 × 10⁻⁷ A/m2. It was obtained by summing up all the spectral components in the frequency range given above. Thus, this value is determined by the parameters of the Hunga Tonga lightning. Summing up the spectral FFT components of current in the lower part of the ULF range, ω ≤ 0.01 s−1, is possible due to almost the same initial phases of these components, as our investigations have demonstrated. Note that this source current does not include the electric currents that were not accompanied by light flashes, so our estimations are from below; in reality, the electric fields in the ionosphere may be even bigger. It is interesting to note that the amplitude of effective ULF current lightning Hunga Tonga source is of the same order of value as the currents in the strongest tropical cyclones and earthquake preparation regions, namely j0~10−7 A/m2 [3,21,85].
In Figure 9, the distributions of electric field components are presented in the ionosphere at the altitudes 80 km ≤ z ≤ 200 km. Our simulations have demonstrated that at lower altitudes, the dominating component is the vertical one, Ez. At the altitudes z = 80 km–90 km the vertical component decreases rapidly, and the dominating components are the horizontal ones, Ex, Ey. More precisely, these are the components in the plane perpendicular to the geomagnetic field lines, as shown in [21]. It is interesting to note the qualitative change of the distribution of |Ez|, namely from the monopolar with a single maximum to a dipole-like one with two maxima. At z ≥ 100 km, the values of the ULF electric field components are practically the same, as seen in Figure 9. Specifically, the electric field distributions at z = 400 km are practically the same as at z = 200 km. The values of the electric fields shown in Figure 9 correspond to the magnitudes of the ion drift velocities observed in the ionosphere before a strong earthquake [86].
The magnitudes of the ULF electric field near the current source in the atmosphere depend essentially on the conductivity there. However, as our simulations have demonstrated, a change in the conductivity of the atmosphere near the source by 2 orders leads to a change of ULF electric field in the ionosphere at z ≥ 80 km within 10%.
Our simulations have shown that the penetration of the ULF electric field into the ionosphere depends on the times of day and the solar activity. The maximum values of the electric field in the ionosphere E- and F-regions are 1–10 mV/m. In the daytime, they are smaller, whereas at night, they are higher because the conductivity of the ionosphere is lower at nighttime.
We obtained the results of the simulations of the penetration of the ULF electromagnetic field under different angles between the vertical direction and geomagnetic field. As an example, in Figure 10 there are the results for θ = 50° Only the results for z = 200 km are presented in Figure 10 because there is no qualitative difference in the distributions of the EM field components from the ones presented in Figure 9 at the altitudes 80 km ≤ z ≤ 200 km. A small quantitative difference occurs compared with the case of θ = 30°, Figure 9, namely in the increase in the vertical component |Ez|.
The results for the magnetic component obtained in the simulation of the ULF electromagnetic fields generated by the total electric current sources are presented in Figure 11. It is seen that in the ionosphere F-layer, the magnitudes of the ULF magnetic field are ≥20 nT. The dominating components are in the plane perpendicular to the geomagnetic field line. At the altitudes 100 km ≤ z ≤ 400 km, the magnitudes of the ULF magnetic field are almost independent of the altitude, as our simulations have demonstrated.
In [87], measurements were provided for the global geomagnetic disturbances obtained at ground-based stations of the INTERMAGNET system. Relative variations of the total magnetic field were observed of about 20 nT for four stations located at distances of 2776, 3992, 5220, and 15,291 km from the volcano. The period of the variations was about 0.5 h. As a possible mechanism of generation of these magnetic variations, the internal gravity waves were proposed, based on the time delays of the registration of the perturbations. Our simulations in Figure 11 have demonstrated that there is an alternative mechanism for the generation of ULF magnetic fields due to the direct generation of EM fields by the electric current sources located in the atmosphere. The simulated values are also of about 20 nT in the ionosphere at the heights z > 120 km. This direct mechanism is expressed at relatively small horizontal distances from the current source x, y < 3000 km, so at higher distances, the mechanism of generation of the magnetic field perturbations is rather by the internal gravity waves.
Note that the previously (see the text in the second paragraph after Equation (17) in Section 4.1.2) mentioned relation |Hy/Ex| at z = 80 km can be determined using Figure 11b and the distribution for z = 80 km in the left panel of Figure 9. After recalculation of the maximum values of the corresponding field components into the absolute system of units, one can obtain |Hy/Ex|~104.
There is a reason to compare the values of ULF magnetic fields generated by the dynamo-electric currents due to AGWs [87] in the ionosphere with the corresponding ionospheric magnetic fields calculated based on our model (Figure 11). It is the fact that ULF magnetic fields penetrating from the ionosphere into the atmosphere, including Earth’s surface, weakly depend on altitude. Therefore, ULF magnetic fields generated by the dynamo currents and measured at Earth’s surface are approximately the same as ones in the ionosphere.

4.2. Generation of the Resonant Oscillations/Eigenmodes: Schumann Resonators—Ionospheric Alfvén Resonator for ELF Oscillations

In Section 4.2.1, the excitation of the SR in the ELF range has been investigated using a method similar to the one utilized in Section 4.1 for the ULF range. Then, in Section 4.2.2, the eigenoscillations in the CSIAR have been investigated by the mode method.

4.2.1. Simplified Model of Excitation of the Schumann Resonator by Current Sources of the Volcanic Origin

We consider the problem of excitation of the SR by means of the external ELF current connected with the Hunga Tonga eruption (Figure 12).
In Section 2, it has been stated that SR, which possesses spherical geometry, can be approximated, at least for rough estimations, by the local plane geometry due to the smallness of the gap between Earth’s surface and the lower ionosphere in comparison to Earth’s radius. Thus, in our simulations, the simplified model of SR is used. Such a model includes the planar waveguide with radiative upper boundary condition in the magnetosphere, which reduces, based on the impedance approach, to the form (A24) (see Appendix B). The distinctive feature is that the effective periodic boundary conditions are used in the horizontal plane XOY with the period equal to Earth’s equator LLx,y = 2πRE, where RE is Earth’s radius. In this subsection, we consider ELF EM fields excited by effective current sources (see Section 4.1.5). The spectral interval for the current sources in the ELF range has been used Δf = 0.05 Hz near the central frequency for each case. The possibility of utilizing the simplified models is a hypothesis that should be checked by comparison with the experimental data. The corresponding methods and algorithms suitable for ULF, ELF, and VLF ranges are described in Appendix A and Appendix B. In particular, the matrix elimination method used for the derivation of the finite-difference form of the differential matrix equation for EM field components is described in Appendix A. This algorithm has been applied for the ULF range field. For the ELF range (see Section 4.2), the matrix elimination procedure has been applied for Equation (A2) within both the atmosphere and the ionosphere, i.e., at 0 < z < zmax.
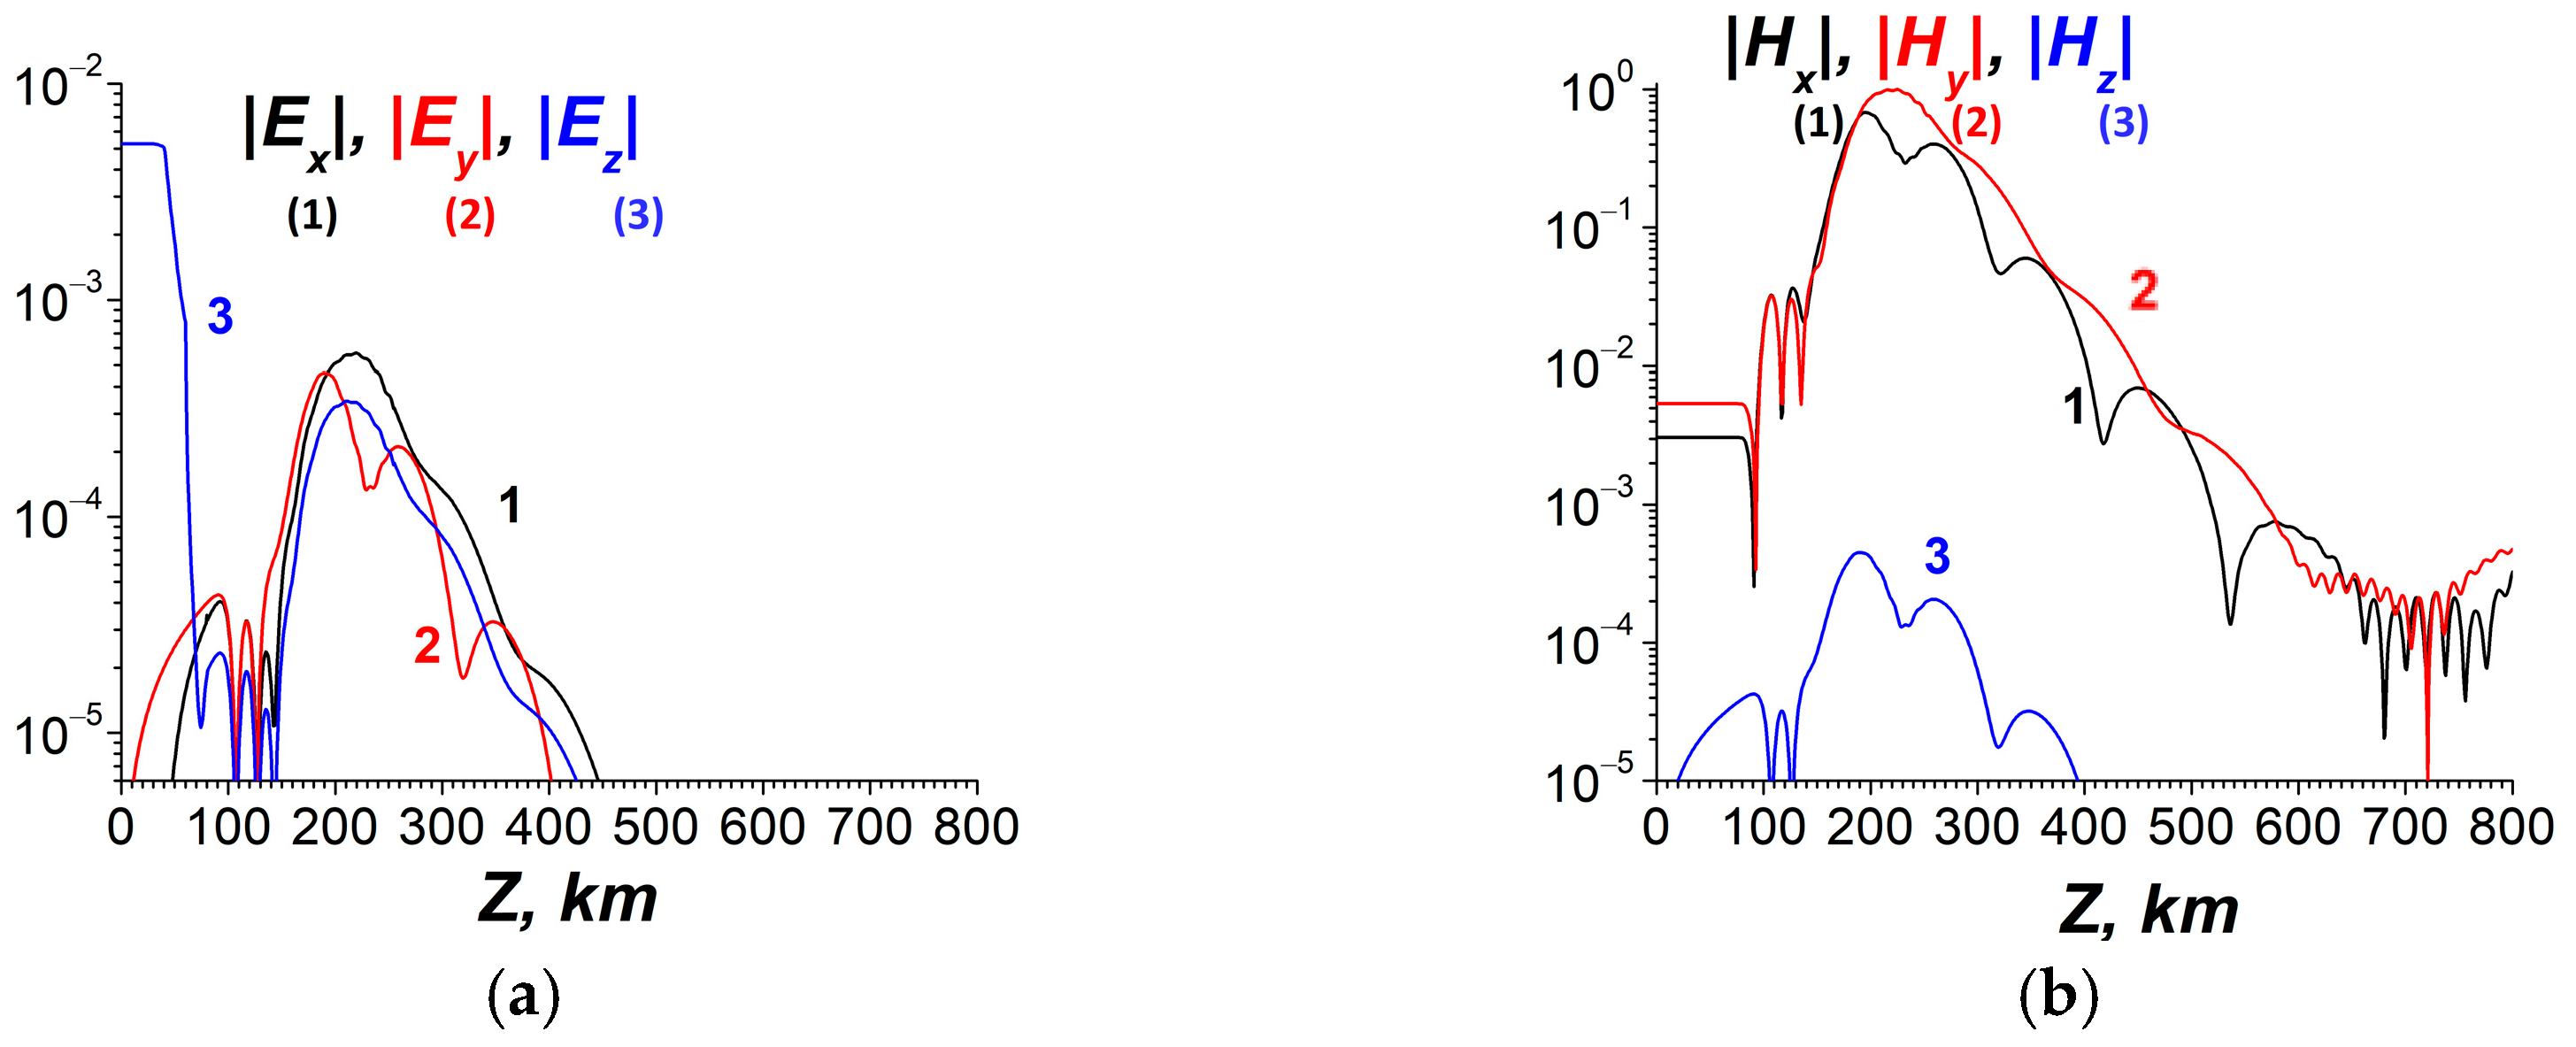
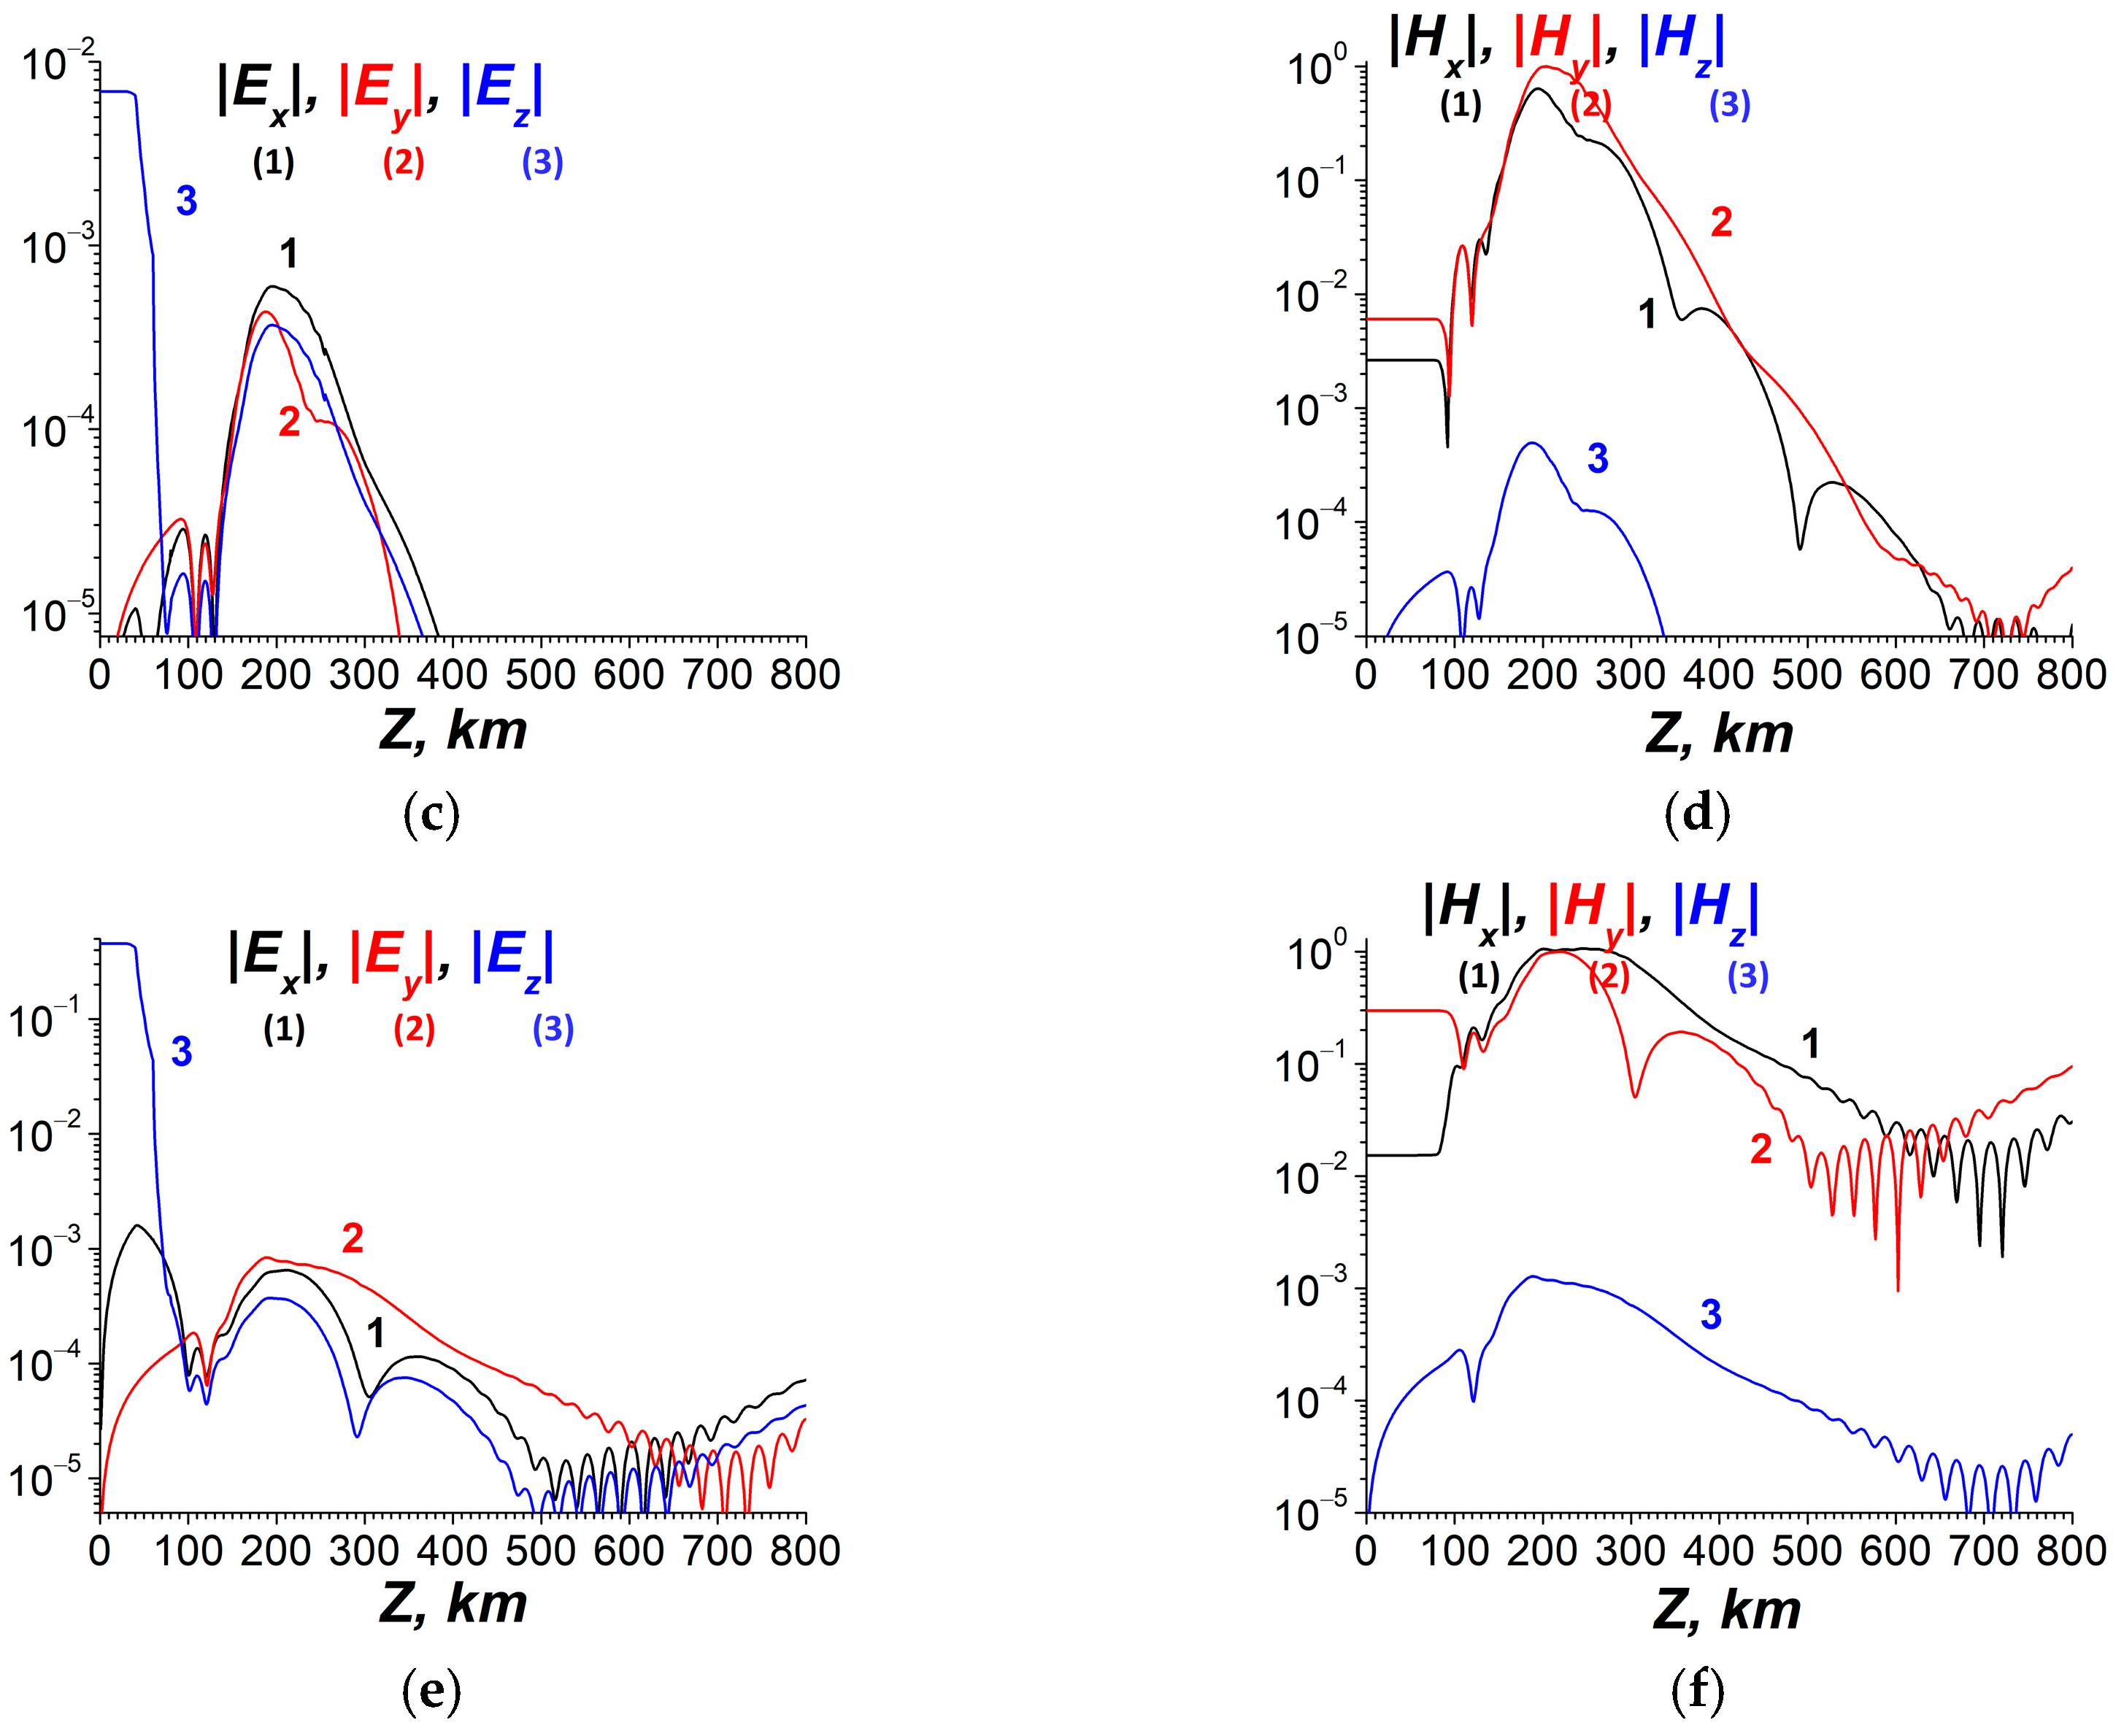
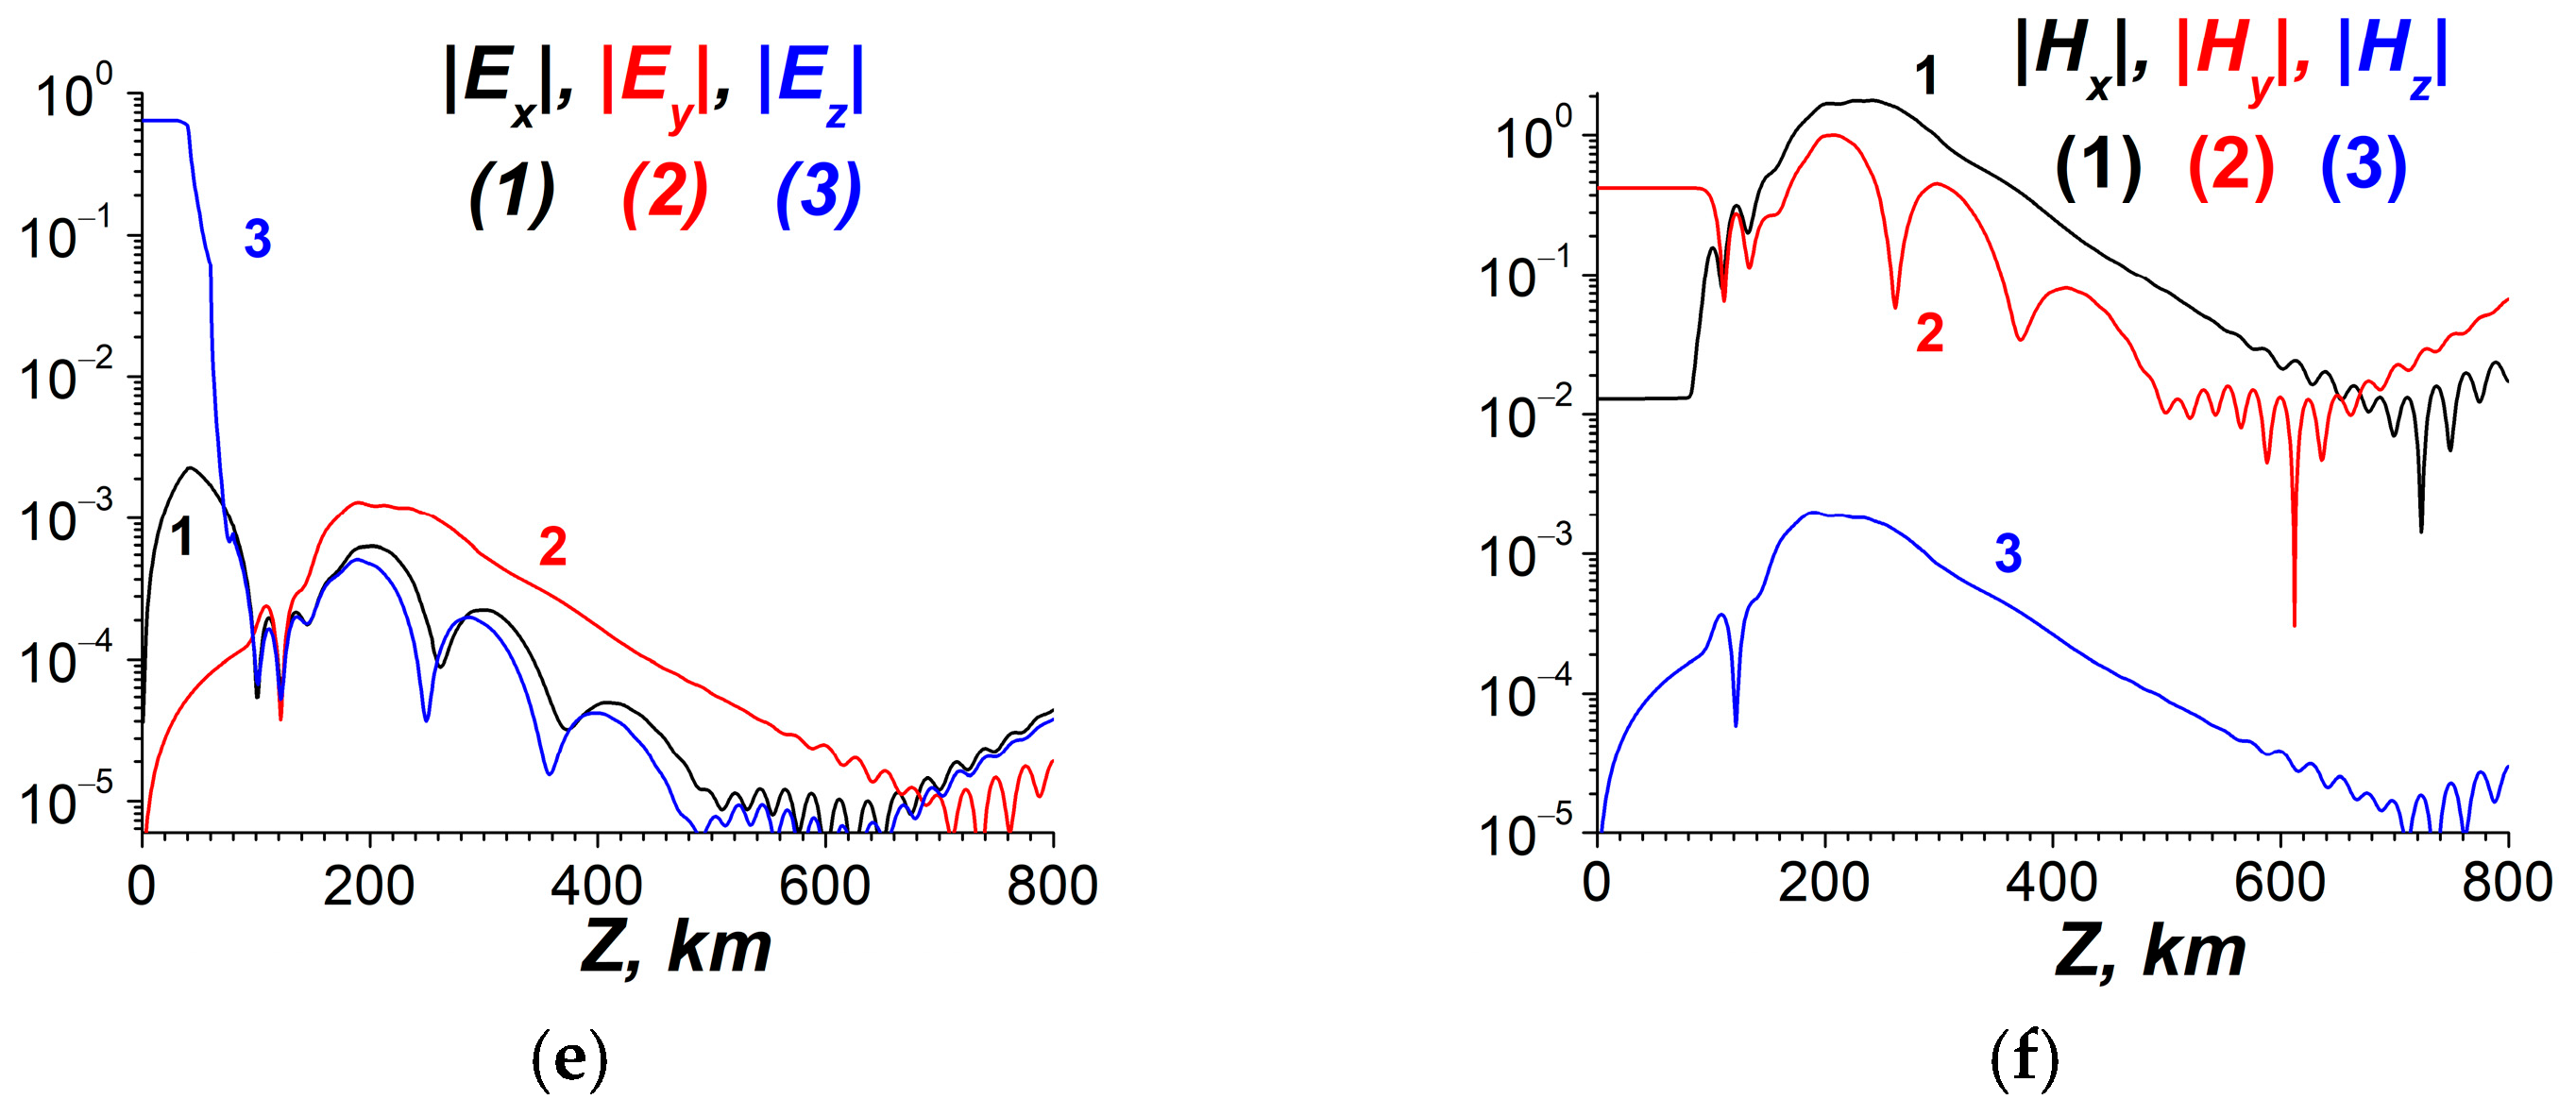
The dependencies of the components of the ionosphere permittivity at the 1st resonant frequency of the Schumann resonance are given in Figure 13.
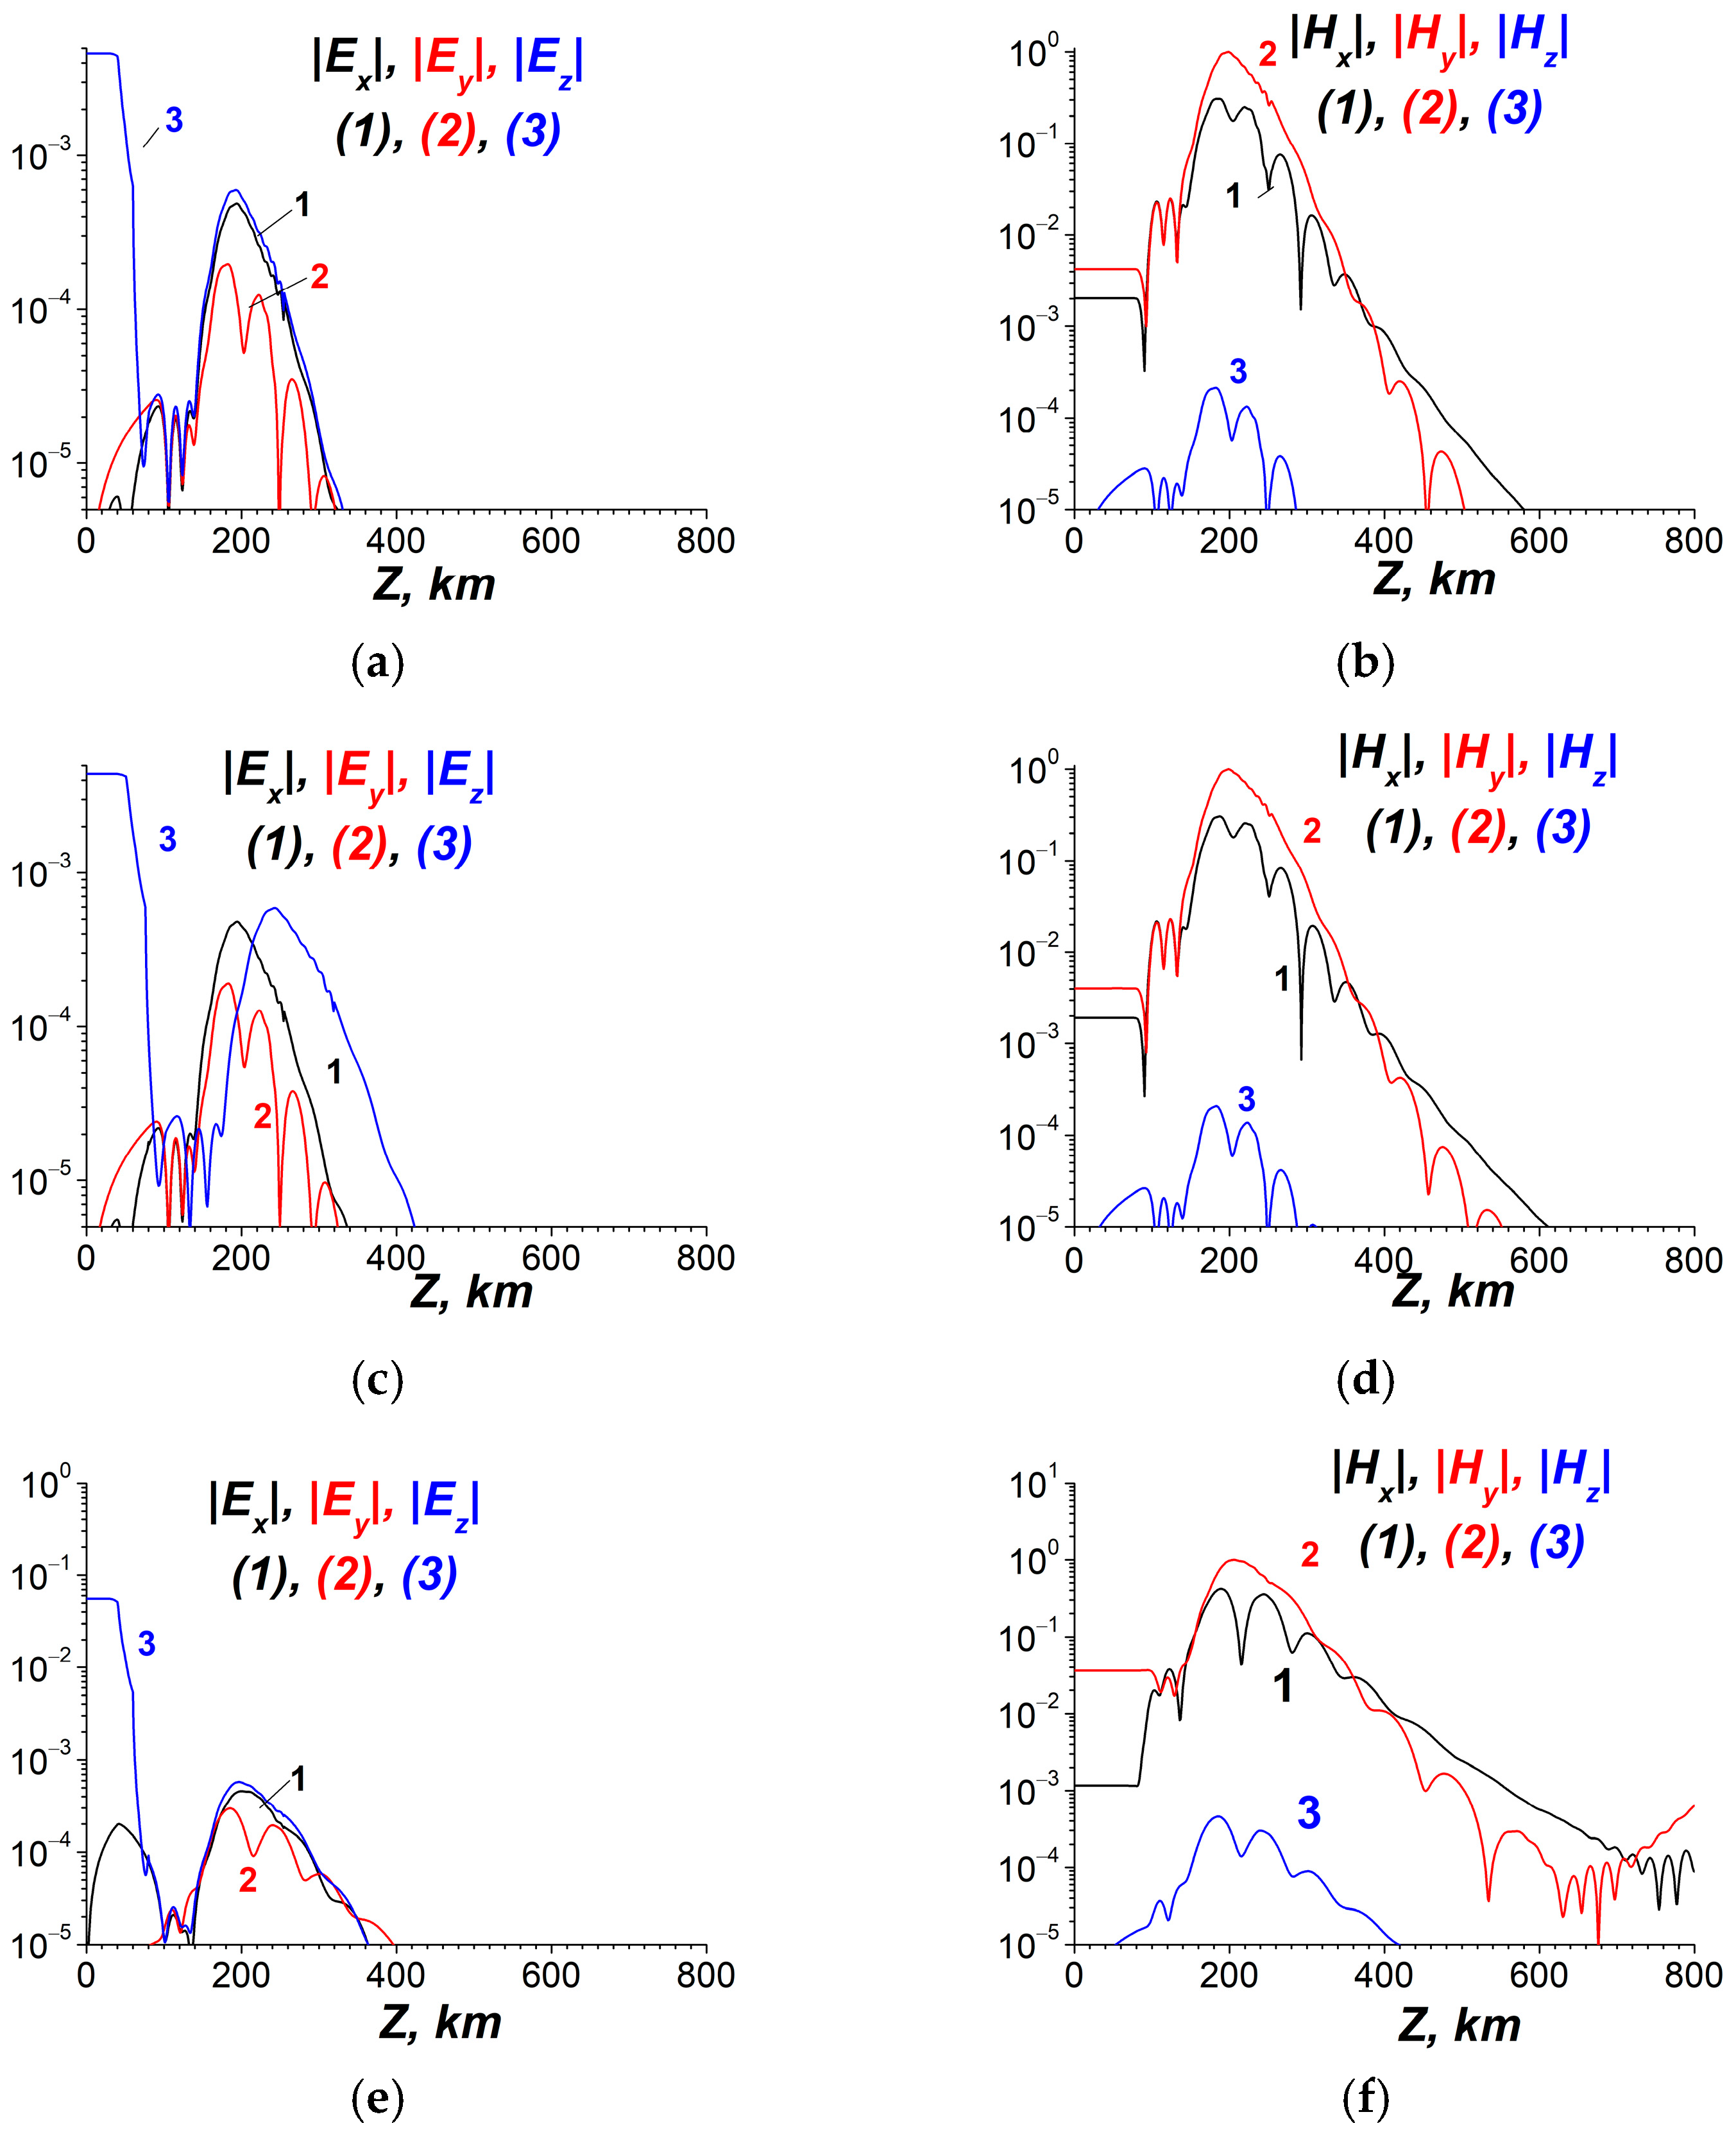
The results of the simulations of excitation of the SR by ELF data-driven effective current source connected with the Hunga Tonga eruption are presented in Figure 14, Figure 15, Figure 16, Figure 17, Figure 18 and Figure 19. The problem of finding ELF EM fields inside the resonator is solved with a given current source with a maximum value located in the horizontal coordinates x = 0, y = 0, and with a given frequency. The algorithm used for the simulations illustrated in Figure 14, Figure 15, Figure 16, Figure 17, Figure 18 and Figure 19 is based on the dynamic Equation (22) presented in Section 4.1.3. At the boundaries surrounding the simulation region, besides the mentioned above periodicity in horizontal (X, Y) directions, the ideal conductivity at Earth’s surface z = 0, and the radiation conditions at z = zmax = 1500 km at the magnetosphere are used. It is known [47] that the finite conductivity of the solid Earth results in the small perturbations ≈ 1%.
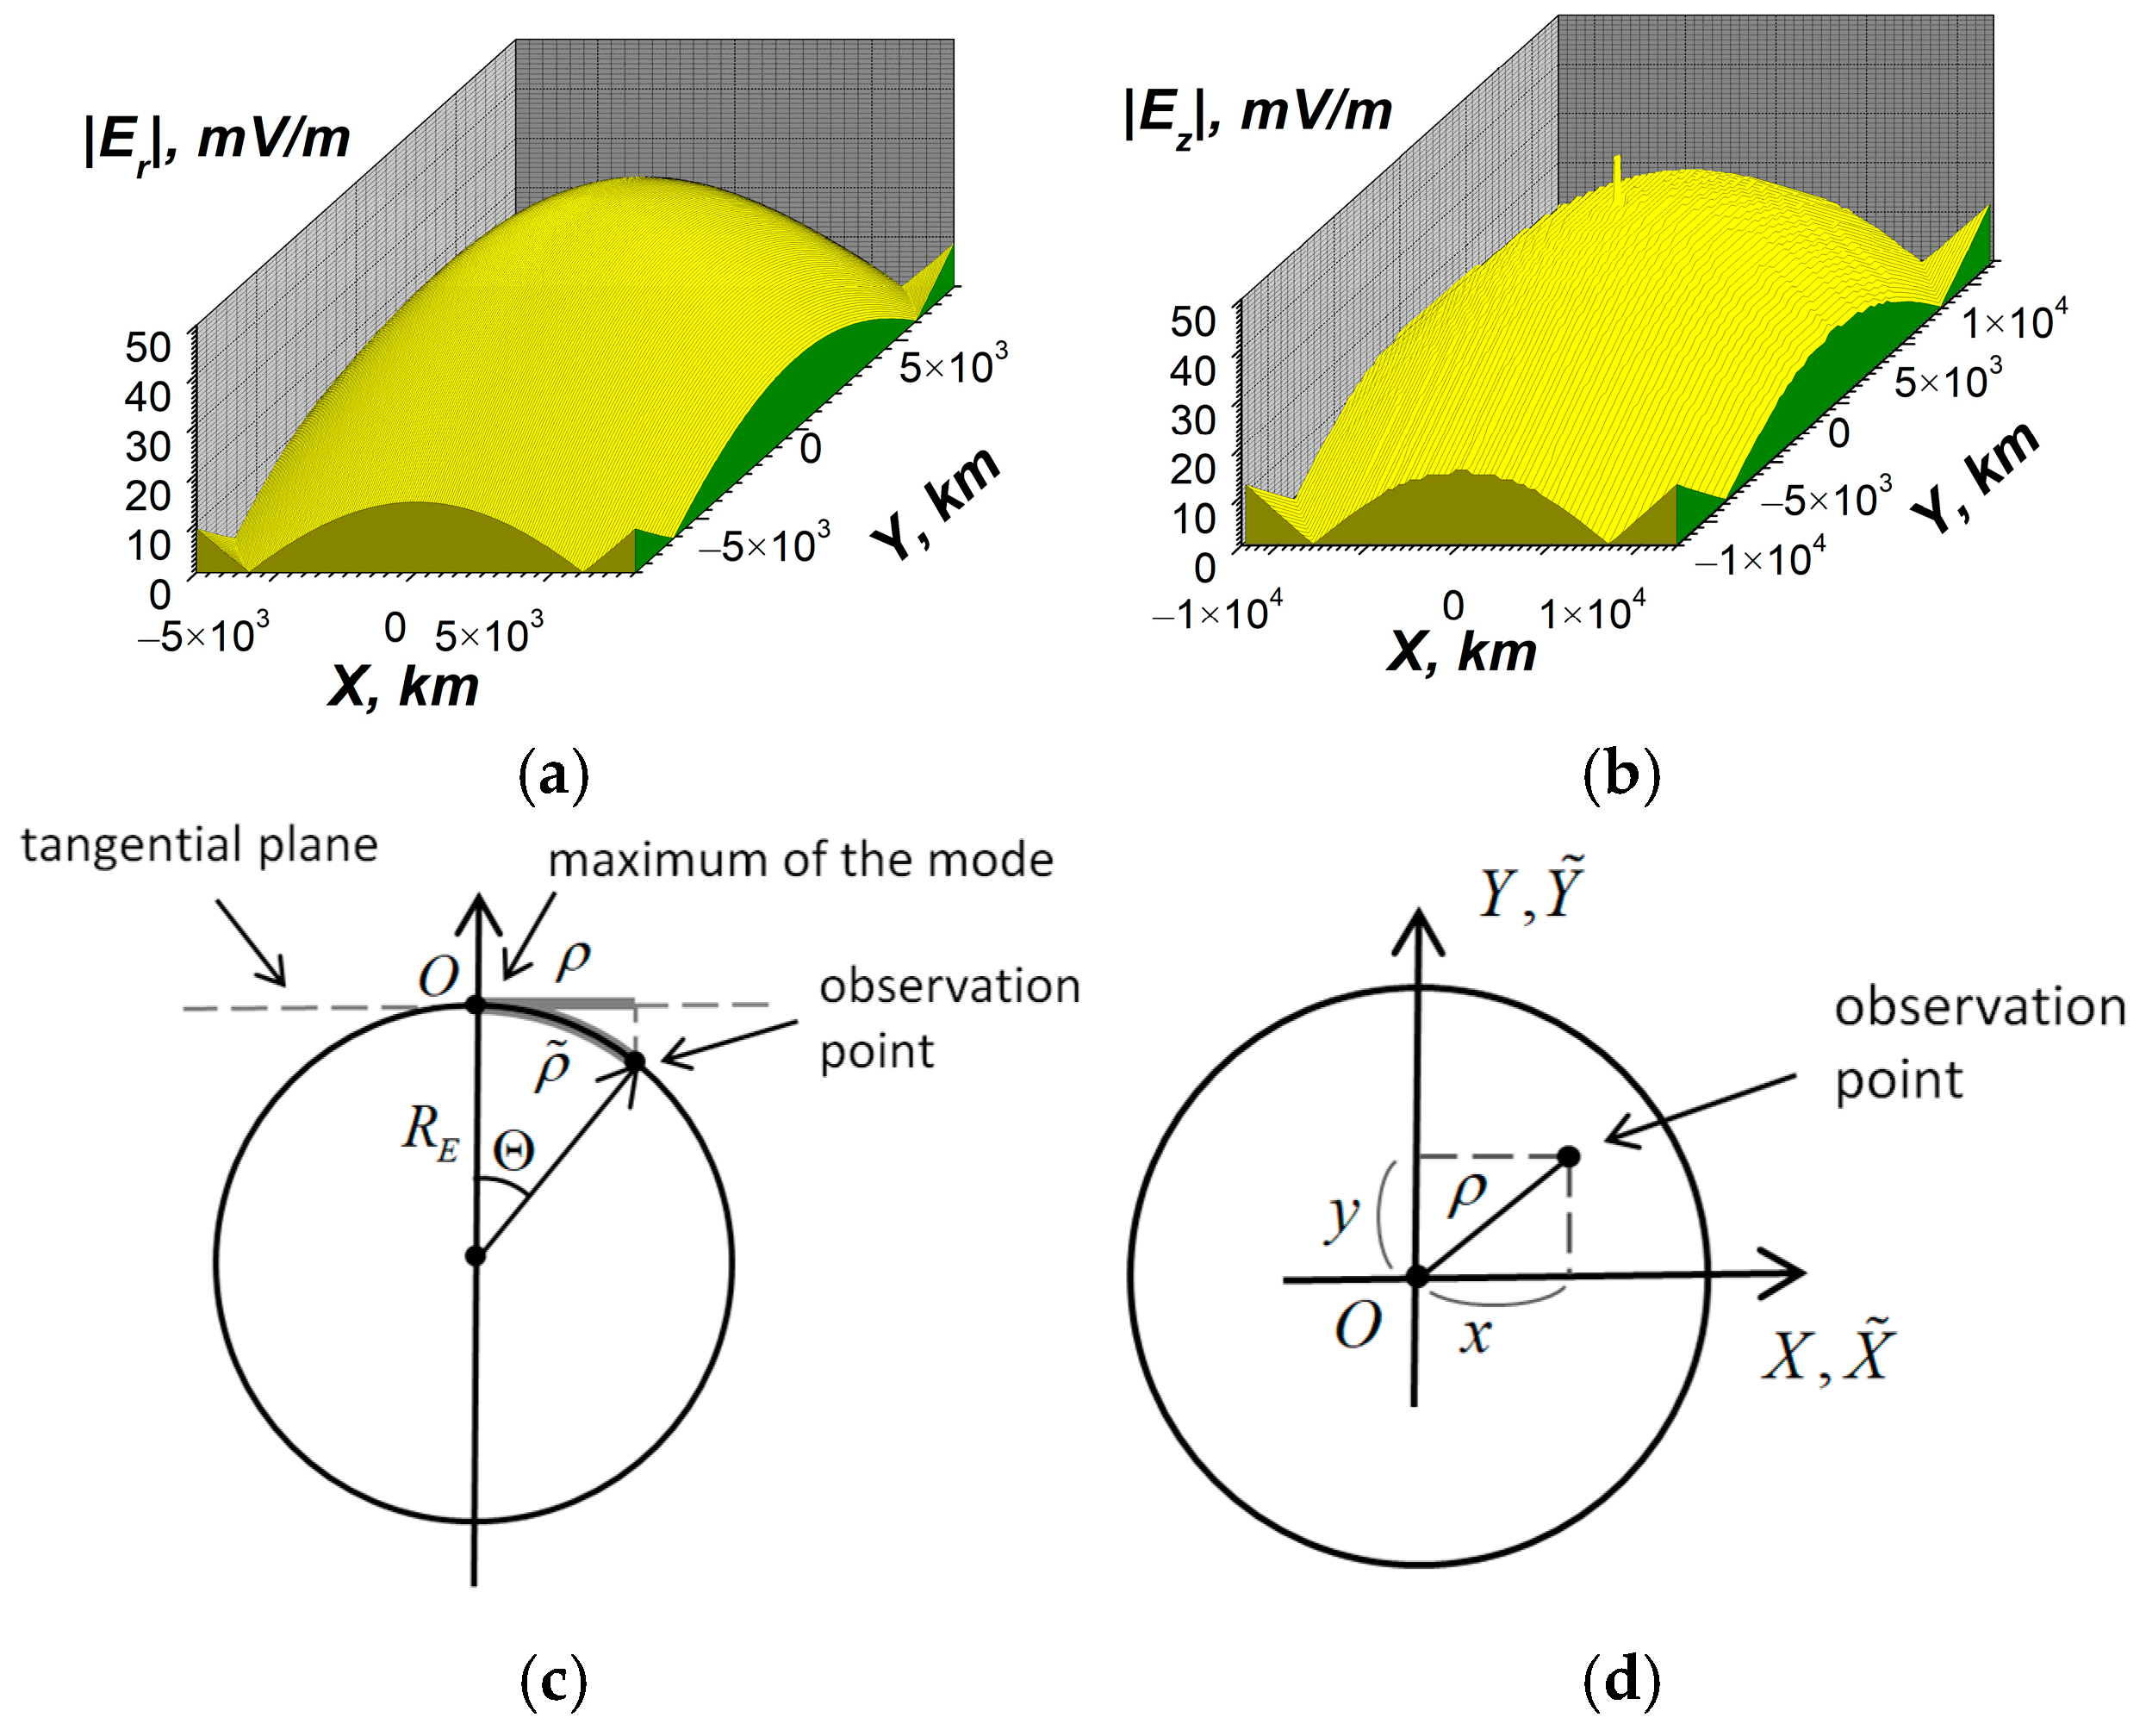
To check the validity of the used local plane approximation, a comparison has been conducted between the distributions of the vertical electric field component of the 1st resonant Schumann mode in the spherical geometry |Er| and the vertical component |Ez| in the local plane geometry. The results of the simulations are shown in Figure 17. Note that the narrow peak in the center of Figure 16a, as well as in Figure 14a and Figure 15a, and in Figure 17b, Figure 18b and Figure 19d, is associated with the effect of the current source in its vicinity. In contrast to this, the calculations in Figure 17a are made for SR eigenmode in the absence of a current source. The vertical component Er in the spherical geometry has been calculated (see Equation (2.26) therein [47]):
| E r ( r = R E ) | = E 0   P n = 1 m = 0 ( cos Θ   ) = E 0   cos Θ   ; Θ = ρ ˜ R E , ρ ˜ ( x ˜ 2 + y ˜ 2 ) 1 / 2 ρ ( x 2 + y 2 ) 1 / 2 .
Here, x, y are the Cartesian coordinates in the tangential plane to the sphere; x ˜ , y ˜ are the coordinates on the surface of the sphere along the meridians and the parallels (see Figure 17c,d). The coordinate lines of x ˜ , y ˜ are mutually perpendicular in the center x = y = 0, the point O in Figure 17c. The curvilinear axes X ˜ , Y ˜ are projected to X, Y in the view from above, Figure 17d. The distance between the center and the observation point is the arc ρ ˜ on the surface of the sphere, Figure 17c. The value E0 = 50 mV/m is the maximum value of the electric field of the mode; it is the same both for the spherical geometry and for the local plane one. Equation (32) is valid near the center where ρ ˜ πRE/4, or for the angles Θπ/4. Near the center, it is possible to write down x ˜ x , y ˜ y , the difference is within 10%. Namely at the angle Θ = π/4 there are ρ ˜ = RE × π/4 ≈ 0.785RE, Figure 17c; whereas ρ = RE cos(π/4) ≈ 0.71RE, Figure 17d.
It is seen that near the maximum, the dependencies of |Er| and |Ez| are similar, with the differences localized at the periphery. Thus, the local plane geometry can be used not only to get the correct values of the resonant frequencies of the Schumann resonances but also for estimations of the EM field distributions near the maxima.
When 0 < θ ≤ 45°, the dependence of the resonant frequency for the 1st Schumann mode is unessential; see Figure 15, Figure 16 and Figure 18. However, when the angle between the vertical direction and geomagnetic field is θ > 45°, the excitation of the resonator becomes weaker, as our simulations have demonstrated.
Figure 14, Figure 15, Figure 16, Figure 17, Figure 18 and Figure 19 illustrates the effects of excitation of SR by a given current source. The effects are as follows.
  • It is possible to get the correct, within an accuracy of 3%, resonant frequencies of the 1st and 2nd Schumann modes using the simplified local plane model where the periodic boundary conditions of the period equal to Earth’s equator are applied in the horizontal plane. In the spherical geometry with the ideal boundary conditions, the error is 1 order bigger and is ≥20% [47]. For both daytime and nighttime conditions, as well as for the angles between the vertical direction and geomagnetic field lying in the range from 0 to 50°, the values of the resonant frequencies of the 1st mode of SR possess a small difference of about 5%.
  • In the local plane model, it is also possible to estimate the maximum values and the spatial distributions of ELF EM fields of the Schumann resonances caused by the electric current excitation at the resonant frequencies. The resonant horizontal components of the ELF magnetic field at z = 0 reach a value of about 60 pT (Figure 15b,c, Figure 16b,c, and Figure 18b,c). There is an effective excitation of oscillations, particularly the 1st mode of SR, both in daytime and nighttime conditions, as well as highly efficient excitation of SR as a whole close to resonant frequency (see Figure 15, Figure 16 and Figure 18). This indicates qualitatively the possibility of propagation of ELF excitations along Earth’s surface over long distances.
  • At the same time, taking into account calculations for | E z | ( z = 0 ) for several frequencies, as illustrated in Figure 14a, Figure 15a, Figure 16a, and Figure 18a, the estimations for the quality factor Q of the Schumann resonance at the 1st mode yield a value of it Q ≥ 50, which is one order higher than the measured value. The quality factor has been estimated as the ratio of the maximum amplitudes of Ez component of the electric field at the resonant frequency ω = 47.1 s−1 (f = 7.50 Hz) and at the frequency between the 1st and the 2nd Schumann modes ω = 70.5 s−1 (f = 11.22 Hz). The estimations have also been conducted by means of the spectral width of the excitation of Ez near the resonance. To obtain correct values of the quality factors, it is necessary to account for the dependencies of the ionospheric plasma parameters in the vertical direction on the spherical angles Θ, φ, or on the local horizontal coordinates x, y.
Accordingly to the calculations shown for the different angles θ between the geomagnetic field and vertical axis OZ, (see in particular Figure 15, Figure 16 and Figure 18), the excitation of SR is relatively weakly dependent on θ at θ ≤ 45°, whereas at θ > 45°, the excitation efficiency of SR decreases.

4.2.2. Possible Coupled Oscillations in the Schumann Resonator and Ionospheric Alfvėn Resonator

In Section 4.2.1, the excitation of the SR has been considered with periodic boundary conditions in horizontal directions by an external current source associated with lightning caused by the eruption of the Hunga Tonga volcano at a given frequency. In contrast to the approach used in Section 4.2.1, another approach is used to study the CSIAR; it is the method of modes, and the excitation of CSIAR by external currents is not considered in this work. In this case, the 2D CSIAR model is used; the geomagnetic field and the corresponding angle between the vertical direction and geomagnetic field θ are in the same plane with the geomagnetic field line (XZ). The approximation of the local planar resonator here is well justified because the ionospheric Alfvén resonators are local; their sizes in the horizontal plane are about 1000–2000 km [52], and therefore, Earth’s surface can be approximated as a local plane. The upper boundary condition of ELF field radiation into the upper ionosphere–magnetosphere, which takes the form of the tensor impedance boundary condition (A24) (see Appendix B), has been used.
In this paper, the unified approach has been applied for 2 cases. The 1st case is the coupling of the global SR with the local ionospheric Alfvėn resonators of the ELF range (see Section 4.2.2); the 2nd case is the propagation of VLF modes in WGEI (Section 4.3). In both cases, the dispersion equations have been derived to characterize EM excitations (Equations (A38) and (A42) in Appendix B). Then, the complex roots with small imaginary parts have been searched. The approach is common to these problems and is described in Appendix B. The difference between these two cases is as follows.
In the 1st case, the real longitudinal wave number is assumed as known and the complex resonant frequency is searched. Its real part is connected to the period of the resonant oscillations, whereas the imaginary part corresponds to the quality factor of the resonance. In the 2nd case, the real frequency of the waveguide mode is given, and the longitudinal complex wave number is searched. Its real and imaginary parts correspond to the wavelength and the decrement of the waveguide mode. The numerical methods to determine the complex roots with relatively small imaginary parts are similar. In Appendix C, the method for the 1st case only is shown. The accuracy < 0.001 of determining the complex eigenvalues for both cases is reached.
The component of the wave vector in the horizontal direction X is assumed to be equal to kx = 1/RE, which corresponds to the periodicity that should occur for a high-quality local plane CSIAR model. Some difference of kx from this value does not change the results qualitatively. When inhomogeneity of the medium in LEAIM in altitude is taken into account, as well as dissipation, anisotropy, and gyrotropy, the complex eigenfrequencies of natural ELF modes are obtained using the original algorithm for searching the complex roots of the dispersion equation given in Appendix C.
The components of the permittivity tensor in the coordinate frame associated with the geomagnetic field direction are presented in Figure 13 [78,79,80,81] for the frequency of the 1st Schumann resonance mode ω = 47.1 s−1 (f = 7.50 Hz).
In Figure 20, Figure 21 and Figure 22, there are several modes with the principal field components (Ez, Hy, Hx); |Hz| << |Hx|, |Hy|, so these modes are almost transverse magnetic ones. Three modes for daytime are presented. The simulations have been performed also for nighttime, θ = 30°, and the frequencies equal to ω1 = 51.75 + 1.26i, ω2 = 49.75 + 5.268i and ω3 = 43.98 + 5.02i, in s−1. The corresponding figure is not presented here for the sake of the compactness of the presentation of the material. The resonant frequencies are in the vicinity of the resonant frequency ωS1 ≈ 47.1 s−1 (f = 7.50 Hz) of the 1st Schumann mode of the global resonator Earth–ionosphere. These resonant frequencies can be both greater than ωS1, e.g., the 1st mode in Figure 20, and the 1st and 2nd ones obtained in the simulations for nighttime conditions (not presented here as mentioned above), and smaller, e.g., 2nd and 3rd modes in Figure 20 and 3rd mode obtained in the simulation performed for the nighttime conditions. The maxima of the dominating electric component Ez are near Earth’s surface. The maxima of the magnetic components of the ionospheric resonator are in the F-layer; however, these components penetrate down to Earth’s surface and possess sufficiently high values there.
CSIAR can be realized under different parameters in the ionosphere and the different inclinations of the geomagnetic field (Figure 20a,b). Several resonant frequencies change weakly with changing the angle between the vertical direction and geomagnetic field θ. Because the variations of the resonant frequencies are smaller than their imaginary parts, the values of their imaginary parts can be considered the same. Nevertheless, some frequencies disappear at higher values of θ; for example, the first resonant frequency in Figure 20a is absent in Figure 20b.
There is an important consequence from the modeling illustrated in Figure 20, Figure 21 and Figure 22 and the simulations performed for the nighttime conditions mentioned above. Namely, the resonant excitation of the CSIAR includes both magnetic field components (Hx, Hy) with maxima in the ionosphere and electric field (Ez) with maxima near Earth’s surface. This demonstrates that the Hunga Tonga current sources were capable of providing ELF excitations in CSIAR under both daytime and nighttime conditions.
We have estimated the ELF excitation of the coupled ELF CSIAR by external currents due to lightning. The same simulation method has been applied for the excitation as in the previous subsection. The frequency of the excitation is equal to the real part of the eigenfrequency of the coupled resonator simulated in Figure 20, Figure 21 and Figure 22 and the simulation performed for the nighttime conditions mentioned above. At the height z = 200 km, where the maxima of the magnetic field of CSIAR modes occur, the excited ELF fields are |E| ≈ 3 × 10⁻⁵ mV/m, |B| ≈ 3 × 10⁻⁴ nT for the 1st eigenfrequencies ω1 given in Figure 20, Figure 21 and Figure 22. The fields of the same order have also been obtained for other resonant frequencies presented in Figure 20, Figure 21 and Figure 22 and obtained in the simulations performed for the night conditions mentioned above. At Earth’s surface z = 0, the excited magnetic fields within CSIAR are notably bigger than those in the ionosphere. As the quality factors of the modes of CSIAR are about 10, the current sources can be added in the vicinity of the resonant frequency, and the resulting estimated magnetic fields can be higher, of about (1–2)×10−3 nT. In the ELF range, these fields are well detectable [88] (Chapter 5.3.2. Observations of the IAR Spectra, pp. 166–171). Note that our qualitative estimations of ELF magnetic fields in the ionosphere are from below, and the more exact results on the excitation of CSIAR need further investigation.

4.3. Propagation of Electromagnetic Waves in the Waveguide Earth—Ionosphere in VLF Range; Mode and Beam Presentations

Two approaches are considered to study VLF disturbances in WGEI (see Figure 23). Section 4.3.1 presents several lower modes and shows that in the case of an ideal waveguide with ideally conducting walls, these modes are reduced to the classical ones of a planar waveguide [83,84]. The results are presented for the propagation of lower eigenmodes in WGEI. The method to simulate the VLF waveguide modes in Section 4.3.1 is similar to the one used in Section 4.2.2 for ELF oscillations. In Section 4.3.2, the transformation of VLF beams due to the anisotropy and gyrotropy in the waveguide Earth–ionosphere with the anisotropic boundary condition is considered.
Integration of the equations describing the EM field propagation allows us to obtain effective impedance boundary conditions at the upper boundary of the effective WGEI (z = Lz). Such boundary conditions include the wave propagation in the covering layer and the radiation (at z = zmax) into the external region (z > zmax) (Figure 23). The leakage of VLF waves from WGEI into the upper ionosphere and magnetosphere is included in different ways. Namely, using either (i) upper boundary conditions (at z = zmax) and without impedance boundary conditions at z = Lz when the mode method is used (see Section 4.3.1); (ii) using effective impedance boundary conditions at z = Lz when the beam method is applied (see Section 4.3.2). In any case, both the wave leaking from the WGEI propagating upwards and the corresponding wave reflecting from the ionosphere and propagating downwards are supposed to be present in the Lz < z < zmax region. Then the region of the upper atmosphere–ionosphere, z > zmax, is considered as one with slowly varying parameters, and EM wave reflection is neglected in this region. Therefore, it is supposed that at z > zmax, only outgoing EM waves exist.
Section 4.3.1 demonstrates the excitation of WGEI by a given VLF current in the beam representation [56] (Figure 23) and illustrates the possibilities of (i) long-range propagation of VLF EM beams, (ii) mutual conversion of beams with different polarizations and (iii) penetration/leakage of VLF fields from WGEI into the upper ionosphere–magnetosphere.

4.3.1. The Mode Excitation in the Waveguide Earth–Ionosphere

The mode structure of WGEI VLF excitations was determined using the original analytical/numerical method for finding eigenvalues of waves in inhomogeneous lossy anisotropic and gyrotropic media (the details are in Appendix B) considering the features of LEAIM. Anisotropy, gyrotropy, and dissipation were taken into account in the medium filling the WGEI, contributing mainly in the lower part of the ionosphere E region LISO < z < Lz (Figure 23). However, since the WGEI is open, it is influenced by the plasma located in the region z > Lz, the upper part of the E region, and in the F region of the ionosphere, as well as in the region z > zmax (Figure 23). If the value of zmax is less than ≈1000 km, which approximately corresponds to the ionosphere–magnetosphere boundary, then the region Lz < z < zmax includes the upper part of region E and a part of region F of the ionosphere.
Despite the presence of leakage from the WGEI, the main part of the energy of VLF EM waves under consideration is concentrated in the region of WGEI, 0 < z < Lz. As only a relatively small part of WGEI, the region LISO < z < Lz, includes the anisotropic and gyrotropic ionospheric plasma, the wavenumber of EMW in the horizontal direction, kx, is close to the value of the wavenumber of the free space, k x k 0 ω / c . Therefore, the difference between k x and k 0 can be found using the method of iterations. The details of the method for finding the eigennumbers characterizing VLF EM waves are provided in Appendix B and Appendix C.
In Figure 24, the results for a test calculation of the first two EM modes of an ideal planar waveguide corresponding to WGEI (Figure 24a,b) are shown [85,86,92]. First and second modes are shown; only (0, Hy, Ez) and (Hx, Hy, Ez) components of the first and second modes, respectively, are non-zero, as expected for a planar waveguide. In this case, the upper boundary of the waveguide is located at an altitude of z = 60 km, this boundary possesses the ideal conductivity. This means that the upper part of the gyrotropic and anisotropic plasma, which does not correspond to the special case of an ideal planar waveguide, is excluded.
Figure 24c,d show the 1st and 2nd modes, including all six components of the EM field in the real WGEI. In this case, the anisotropic and gyrotropic plasma filling the upper part of WGEI is included in the model. In Figure 24c–e, it is illustrated how the EM field, defined in the modal approximation, leaks from the waveguide into the ionosphere. In Figure 24e, the exponential factor characterizing field losses at a distance of 1000 km is shown. As it follows from Figure 24e, typically, only the first two modes would survive after propagation of some VLF field excitation at a distance of 5000 km and more.
In Figure 25, the propagation of two lower VLF modes in WGEI during daytime (Figure 25a–e) and at nighttime (Figure 25f–i) is illustrated. It is shown, in particular, that (i) VLF lower mode can propagate in WGEI for 3000 km and more (Figure 25a–d and Figure 25f–i show the vertical distributions of the field components at daytime and nighttime, respectively, and Figure 25e shows the frequency dependence of the wave losses) and (ii) leakage of VLF modes into the upper atmosphere is larger in nighttime than in daytime (compare Figure 25a–e and Figure 25f–i, respectively).
The permittivity tensor components in the coordinate frame associated with the geomagnetic field direction are presented in Figure 26 for the VLF frequency ω = 105 s−1.

4.3.2. Qualitative Picture of the Transformation of VLF Beams Due to the Anisotropy and Gyrotropy in the Waveguide Earth–Ionosphere with Anisotropic Boundary Condition

This subsection discusses the propagation of a VLF beam excited by a strong current in WGEI based on the model developed and described in detail in [56]. The purpose of this calculation is to qualitatively characterize three important properties of VLF beams: (i) their long-range propagation in WGEI, (ii) the polarization transformation during beam propagation, namely the transformation between transverse magnetic and transverse electric polarizations, and (iii) a weak leakage of VLF beams into the upper ionosphere. The classification of polarization is along the OY axis.
Typical results of VLF beam propagation are given in Figure 27. The VLF beam is excited at x = 0 by an external current, which may be associated with lightning discharges caused by the eruption of powerful volcanoes. The frequency is ω = 105 s−1. These calculations, as well as our additional calculations, taking into account the results presented in [56], allow us to draw the following conclusions: (i) VLF beams excited by external current sources can propagate in WGEI over a distance 10,000 km, and (ii) an effective transformation of the beam with transverse magnetic polarization Hy into a beam with transverse electric polarization Ey occurs at a distance of about 500–1000 km, as seen from Figure 27b,c.
Figure 28 depicts the characteristics of VLF waves in WGEI emitted by a typical lightning discharge with timing characteristics like those reported in [63,94]. The results are presented in Figure 28, obtained similarly to those shown in Figure 24 and Figure 25, using the method of deriving and solving the dispersion equation described in Appendix B and Appendix C. Strictly speaking, the corresponding characteristics for the unprecedented lightning connected to the eruption of the Hunga Tonga volcano should be studied separately due to the strong nonlinearity of the corresponding physical processes in lightning discharges. Here, the currently available characteristics of lightning discharges are used to study the propagation of VLF waves in WGEI. The calculated spectral characteristic of the current source is presented in Figure 28b.
The frequency dependence of the VLF attenuation for the lowest waveguide mode is given in Figure 28c; it corresponds to Figure 25e, Curve 1. When combining Figure 28, parts b and c, it is concluded that the transmission coefficient of VLF EM waves in WGEI has a maximum value at optimal frequency ω ≈ 5 × 10⁴ s−1, f ≈ 8.5 kHz; see Figure 28d. The attenuation coefficient, which corresponds to this frequency, equals to k″ ≈ 4 × 10⁻⁴ km−1, Figure 28c. Analogous estimations have been done for the VLF electric current spectrum, Figure 3b, from LCSHTE. The corresponding dependence of the transmission coefficient is depicted in Figure 28e, it is like one presented in Figure 28d. Thus, VLF waves in WGEI can propagate to distances of 5000–10,000 km. The same result is obtained from both the beam and mode approaches to the propagation of VLF waves in WGEI. Therefore, an increase in VLF intensity caused by LCSHTE might be expected in observations even at long distances from the volcano [15].
The excitation of the WGEI in the VLF range can be investigated approximately in the following manner (SI units are used in Equations (33)–(35)). For EM fields at distances r > 100 km, the current source due to lightning can be approximated by the variable electric dipole pω at some VLF circular frequency ω:
ω p ω V j z ω d V I ω z 0 .
Here, z0 = 20 km is the vertical size of the current source. The source is localized near z1 = 25 km. As the vertical size of the waveguide is about h = 80–100 km, at the distances in the horizontal plane h < r1 < 2h, or 100 km < r1 < 200 km, the EM excited by the dipole can be calculated as the field radiated within the air in the wave zone [92]:
| E z ( r = r 1 ) | 1 4 π ε 0 k 2 p ω r , | B ( r = r 1 ) | 1 c | E z ( r = r 1 ) | .
Here, k = ω/c. The condition kr1~50 >> 1 is satisfied for the wave zone. Here, the fact is used that the electric dipole radiates preferentially in the perpendicular direction, i.e., in the horizontal plane.
At higher distances from the source r2 > 200 km, the VLF EM field is the lowest waveguide mode that propagates from the center isotropically, see Figure 4. As the mode is localized along the vertical direction, the following relations are valid:
| E z ( r = r 2 ) | | E z ( r = r 1 ) | ( r 1 / r 2 ) 1 / 2 exp ( k r 2 ) ; | B ( r = r 2 ) | | B ( r = r 1 ) | ( r 1 / r 2 ) 1 / 2 exp ( k r 2 ) . .
In the waveguide, there are |Ez|,|B|~r−1/2 under the isotropic propagation due to the conservation of energy (see also Equation (4)). Here, k″ is the imaginary part of the longitudinal wave number of the principal waveguide mode.
The following parameters are used for the estimations. The frequency is f = 15 kHz, ω ≈ 105 s−1, the spectral component of the current is Iω = 0.4 A (see Figure 3b), and the vertical size of the current source is z0 = 20 km. The distances are r1 = 150 km, r2 = 1000 km. The estimated electric fields are |Ez(r = r1)| ≈ 5 mV/m, |Ez(r = r2)| ≈ 2 mV/m, the magnetic inductions are |B(r1)| ≈ 0.017 nT, |B(r2)| ≈ 0.007 nT. At the distance from the center r2 = 1000 km, the influence of the wave dissipation k″ can be neglected.
Here, it is assumed that the reception band of the VLF receiver is narrow. If the reception band is wider, the measured VLF fields may be higher, of about 5–10 mV/m at the distance r = 1000 km from the source. At distances r > 3000 km, the dissipation of the fundamental waveguide mode becomes more pronounced, but even at r = 8000–10,000 km, excited VLF fields are well detectable.
Thus, in Section 4, we have presented the results of simulating ULF, ELF, and VLF excitations connected with the eruption of the Hunga Tonga volcano. We have used the methodologically integrated approach based on the matrix elimination method for the determination of corresponding boundary conditions using the tensor impedance.

5. Discussion—Comparison Between Theoretical and Experimental Results

The current source, associated with the Hunga Tonga lightning activity, results in EM fields of different frequency ranges. In ULF below 1 Hz, the spectra of the current source possess a non-trivial frequency dependence. The local spectral minimum corresponds to the frequencies close to 0.003–0.005 Hz (see Figure 2b in Section 3). At the higher frequencies, the spectral amplitude rises with a frequency maximum close to 0.1 Hz. Then, the spectral amplitudes decrease 2–3 times toward 1 Hz. In our simulations, the phase shifts between different spectral components may be neglected and their influences can be added up. In the ELF range of 1–50 Hz, there are two main features, including a monotonous amplitude decrease with frequency and low-amplitude oscillations on its background (see Figure 3a). The spectrum in Figure 3a includes oscillations with many local frequency maxima separated by approximately 1 Hz. The ratio of amplitudes near 1 Hz and near the first Schumann resonance 8 Hz is about 4. This dependence of the spectral amplitudes is confirmed by the results of measurements of excitation of the global resonator Earth–ionosphere [6,12,13,87,95]. Namely, an intense excitation of this resonator at the frequencies of about 1–2 Hz was observed, the well-expressed excitation of the 1st Schumann mode f1 ≈ 7.5 Hz, and a weaker excitation of the 2nd mode f2 ≈ 14.5 Hz.
In distinction to the ULF and ELF ranges, a simpler pattern is retrieved for the VLF range (see Figure 3b). The spectral amplitude decreases several times from 1 kHz to 10 kHz with a slower change in amplitude at the frequencies to 50 kHz.
The values of the ULF electric fields obtained in the combined quasi-stationary–dynamic simulations are of about (1–10) mV/m in the ionosphere F-layer and in the lower magnetosphere (Section 4.1). In the region near the boundary between the atmosphere and the ionosphere z = 60–70 km, the electric fields are of about (1–10) V/m. The external electric current sources have maximum values of order 10−7 A/m2, as obtained on the basis of a data-driven approach [7]. There is a good agreement of these results with those obtained by the direct dynamic approach, at the frequencies where this approach is valid. Note that we assumed the conductivity of the atmosphere to be uniform in the horizontal plane.
The simulated values of electric fields could stimulate the development of ionospheric plasma instabilities and nonlinear plasma structures, i.e., plasma bubbles at low and middle latitudes, TEC disturbances of 10% and more, etc., observed by satellites and at ground-based observatories [96,97,98]. The plasma bubbles were observed [8] after the eruption of the Hunga Tonga volcano. In this work we did not investigate any nonlinear plasma dynamic processes associated with lightning sources and the Hunga Tonga volcano eruption. Such research may be the subject of future work. However, we conclude that the simulated ULF fields can at least be considered among other possible drivers of the observed nonlinear phenomena [8]. The ionospheric electric fields of similar values of 1–10 mV/m are caused by the currents generated by tropical cyclones [85] or seismogenic processes, such as the preparation of the most powerful earthquakes [96].
Generally, the conductivity of the atmosphere may depend on three coordinates.; In the case of the 3-dimensional dependence of the atmospheric conductivity, the above-combined method is perspective because it includes solving the Poisson equation for the scalar electric potential in the atmosphere. The numerical methods are well-developed for it [74]. In the ionosphere, the dynamic equations are utilized preferentially with the application of FFT with respect to the horizontal coordinates x, y when the ionosphere may be considered uniform in the horizontal plane.
The obtained results on the combined quasi-stationary–dynamic method for EM fields in the atmosphere and ionosphere are important for the general theory of atmospheric electricity. The need to apply this method for ULF EM fields is due to the following physical considerations.
(1)
It is reasonable to assume that the lowest frequency part of the ULF range is limited from below by a frequency of about 10−4 Hz. This is due to both the non-stationarity of any real current source, including the ULF part of LCSHTE, as well as the diurnal changes in the parameters of the ionospheric plasma [21].
(2)
As shown in [21,38], both quasi-stationary and dynamic approaches to simulating ULF electric fields are adequate in the case of closed geomagnetic field lines. However, for open geomagnetic field lines, the dynamic approach is only applicable in the ionosphere with the radiation condition into the magnetosphere.
(3)
It is impossible to ignore the quasi-stationary magnetic field in the lower atmosphere. This clearly follows from the fundamental impossibility of matching electric fields by using two independent components, for example, horizontal components of the electric field in the ionosphere and a single component of the quasi-stationary potential electric field in the atmosphere. This problem has been solved completely, including the necessary numerical calculations of EM fields using the proposed analytical/numerical method. This method restores the quasi-stationary magnetic component, lost in most works on atmospheric electricity and the global electric circuit.
The eruption of the Hunga Tonga volcano resulted in variations of the terrestrial ULF magnetic fields with magnitudes of about 20 nT [87]. According to [87], the magnetic perturbations were generated in the ionosphere due to AGW propagation and then penetrated down to Earth’s surface practically with the same magnitudes and were detected by several ground stations of the INTERMAGNET system. The experimental results on the long-distance propagation of AGWs from the Hunga Tonga eruption were presented in [99]. In our model (Figure 11 (Section 4.1)), the direct excitation of the ULF magnetic fields of similar magnitudes in the ionosphere also occurs due to the electric current sources caused by the lightning discharges connected with the eruption. Our simulations have demonstrated a possibility of two channels of interaction and transfer of ULF fields, namely through the EM field directly and AGW. The direct mechanism is important at smaller horizontal spatial scales of about 3000 km.
In this paper we attempted to investigate the excitation of the lowest modes of the SR in the approximation of the equivalent local planar resonator (Section 4.2.1). The approximation is based on the following facts. The local horizontal spatial scale along Earth’s surface and the vertical scale differ by 2 orders of magnitude (the horizontal scale is about RE = 6400 km, while the vertical scale is about 100 km). The horizontal periodic boundary conditions and radiation boundary conditions in the upper ionosphere have been used. The structure of the EM field in the vicinity of the field maximum of the local planar resonator is close to that determined using the spherical model (see Figure 16 in Section 4.2.1). For coupling the EM field of the SR with the IARs, the approximation of the equivalent planar resonator seems natural due to the local characteristics of IAR.
The simulated values of the ELF magnetic field amplitudes at Earth’s surface are equal to 60 pT (Figure 15, Figure 16 and Figure 18). To compare the simulations with observational results, the data from monitoring the Schumann resonance at the Akademik Vernadsky station (65.25° S, 64.25° W) [12] have been used. In addition to the SR noise-like signals, waveforms produced by powerful lightning discharges, known as Q-bursts (transient events), were observed during the periods, not connected with the Hunga Tonga volcano eruption. Maximal amplitudes of horizontal ELF magnetic field in the transient events reached 20 pT [100] or even 30 pT [12]. Thus, the amplitude of the regular transient events [12,100] was approximately half the amplitude of the fields generated by LCSHTE (Figure 15, Figure 16 and Figure 18). This is supported by Figure 5a [12], where the intensity of the first Schumann mode increases by 15 dB, which means an approximately 4-fold rise in intensity and doubling the amplitude.
Note that the fields generated due to the Hunga Tonga volcano eruption were almost continuous for several hours, but the regular transient events occurred approximately once every 10 s and had a duration of only about 0.1 s. Therefore, the power of the fields associated with the Hunga Tonga volcano eruption significantly exceeds the power caused by strong lightning discharges/Q-bursts observed during the periods not associated with this eruption. Finally, the results of our model correspond to the experimental ones and explain increasing magnetic fields in the ELF range at distances of thousands of kilometers from the volcano area.
ELF EM excitations caused by LCSHTE are of qualitative and even quantitative agreement with the results of the measurements of the characteristic parameters of the lowest Schumann resonant modes, see Table 1.
The values of the 1st and 2nd resonant frequencies obtained in Section 4.2.1 are close to those presented in Table 1, while the simulated quality factor possesses the overestimated values, Q > 50, for the following reasons.
(1)
The model we used does not take into account the curvature of Earth, and the plane Earth model is used jointly with periodic conditions in the horizontal direction, with a period L = 2πRE (Figure 12).
(2)
For each specific calculation, the planar resonator approximation has been used, which is homogeneous in the horizontal directions with a constant value of the angle between the geomagnetic field and the vertical axis and other parameters in these directions. Ignoring the inhomogeneities, simultaneous daytime and nighttime conditions in different parts of the real SR may lead to the overestimation of the quality factor. The simulated values of magnetic fields at Earth’s surface during the resonance are twice bigger than the corresponding experimental values. The quality factors obtained on the base of the developed model exceed the corresponding experimental values by one order of magnitude. Finally the qualitative estimations given above (see Section 4.2.1) show that the horizontal inhomogeneity is the most important reason that can reduce the quality factor of SR.
The model with plane geometry has been used for the CSIAR. The coupling of these resonators is determined by a quasi-plane region with horizontal sizes of the order of 1000 km and is simulated using the model of coupled planar resonators.
The calculations carried out for CSIAR (Section 4.2.2) show that IAR can be noticeably excited at frequencies corresponding to the 1st resonant mode of SR. In this case, the electric field of the corresponding disturbances is achieved in the SR at Earth’s surface, while the magnetic field reaches a maximum at ionospheric altitudes, namely within IAR. The characteristics of the IAR depend on the angle between the geomagnetic field and the vertical axis and, therefore, IAR is fundamentally local. Thus, the excitation of a local IAR occurs through oscillations in the global SR, which is coupled with this IAR. As our estimations show, the excited magnetic fields at the ionospheric heights of 200 km are about 10−3 nT (Section 4.2.1). In the ELF range, these excitations can be easily detected. At Earth’s surface, the magnetic perturbations are within SR and may reach the values of 30–50 nT. Therefore, (1) the resonant excitations in CSIAR caused by the LCSHTE are significant and detectable by either ground-based or satellite facilities [89]; (2) corresponding excitations in CSIAR may be observed globally.
Verification has been conducted of the methods of wave beams and the waveguide modes, used to simulate the propagation of VLF waves in WGEI. An application of these methods, jointly with the previous results on the modification of the ionosphere by seismogenic electric fields [43,44,55], leads to the outcomes, which agree with the experimental data [103] on the seismogenic increasing losses of VLF wave beam propagation in WGEI.
The estimations have been conducted for the amplitudes of VLF perturbations in the WGEI (Section 4.3.2). The VLF fields are about 5–10 mV/m at the distance r = 1000 km from the source. At distances r > 3000 km, the influence of the fundamental waveguide mode dissipation becomes important; however, the excited VLF fields are well detectable even at distances of r = 8000–10,000 km. They are estimated to be about 1 mV/m there.
The peak values of VLF magnetic fields caused by the lightning activity not associated with the Hunga Tonga eruption, observed in [100], are close to B ≈ 20 pT. During the Hunga Tonga eruption, atmospherics are observed much more frequently (increasing by 15 times relative to the preceding period), with the spectral density rising by 10 times as calculated for the magnetic field in [57].
To compare our results for electric fields with the ones for magnetic fields in [100], the following estimations are provided. The magnetic field value corresponds to the VLF electric field EcB ≈ 6 mV/m for EM wave [92]. Therefore, our results qualitatively and by order of magnitude correspond to the observations [57].
The analytical/numerical methods have been developed and used to simulate the EM fields of ULF, ELF, and VLF ranges in LEAIM. These methods may have wider applications and are promising to simulate various linear and even nonlinear ionospheric plasma wave structures. The developed methods may be useful for modern radio diagnostics of the ionosphere using data from GNSS and Low-Frequency Array (LOFAR) radio telescopes [104,105] for ionospheric monitoring of catastrophic events, terrestrial and cosmic radio communications, astrophysical observations, and the physics of instabilities and nonlinear phenomena in ionospheric plasmas.
ULF, ELF, and VLF excitations caused by LCSHTE are sufficient to generate quite remarkable excitation in the F region of the ionosphere, in SR and CSIAR, and in WGEI.
This work is devoted to the propagation of waves of a wide range, from ULF to VLF frequencies. We used only a linear approximation and considered only the direct generation of EM oscillations and waves by external (determined on the basis of data and considered given) lightning currents in the corresponding frequency ranges.
Modification of the spectrum of the excitations we are considering, for example, VLF waves in WGEI, can be caused by a number of different nonlinear effects [106,107]. In particular, VLF spectral components, in addition to the spectrum of linear excitations, can arise as combination frequencies during the nonlinear interaction of excited high-frequency EM fields. However, in this article, we are limited from above only to the frequencies of the VLF range, and the excitation of high-frequency EM fields was not considered as such. To assess one of the effects potentially leading to spectrum modification, namely the generation of harmonics, we assumed that the effective height of WGEI is 70 km ω 10 5   s 1 ( f 16   k H z ) and the field magnitude is several mV/m, as estimated at the end of Section 4.3.2. The obtained amplitude of the third harmonic VLF, in any case, does not exceed 10% of the level of the fundamental harmonic, which does not contradict the linear approximation we used. In general, the study of nonlinear wave effects requires special work and is beyond the scope of this article.
The methodology and the results presented in this article stimulate an integrated approach for coupling in LEAIM in the presence of powerful sources, particularly in the lower atmosphere. Note that EM excitations of these frequency ranges are included in modern multi-parameter experimental ground-based and satellite studies [57,100,108,109,110,111].

6. Conclusions

(1)
The simulations presented in this paper are based on the observational data of lightning electric currents associated with the eruption of the Hunga Tonga volcano in January 2022. Based on a data-driven approach, the characteristics of effective current sources have been obtained in ULF (mHz), ELF (Hz), and VLF (kHz) ranges. The obtained sources have been used to calculate the corresponding EM excitations captured in resonators or having waveguiding characteristics in the atmosphere–ionosphere. The spectra of current sources decrease monotonously in the VLF range but have many significant details, including local oscillations in the ELF range and a local maximum in the ULF range. The current sources in ELF and ULF, and even in VLF ranges, possess practically isotropic directional diagrams in the horizontal plane.
(2)
In the ULF range, the dynamic method should be used in the general case to investigate the penetration of EM fields into the ionosphere due to the principle of causality, the non-stationary nature of any geophysical source, and diurnal changes in the environment. The dynamic method is equivalent to the Maxwell equations in the spectral domain. The use of the dynamic method in the atmosphere and the lower ionosphere causes mathematical problems connected with the stiffness of the system of the dynamic differential equations. The combined dynamic–quasi-stationary method has been developed to simulate ULF field penetration through the LEAIM system. This method is suitable for frequencies down to 10−4 Hz (~10−3 s−1), which is a reasonable minimum value of the ULF frequency. The EM field is determined from a dynamic approach in the ionosphere and from a quasi-stationary one in the atmosphere. In the atmosphere, not only the electric field components but also the magnetic ones are taken into account. The combined method includes a proper choice of the altitude where EM fields in the atmosphere and ionosphere are matched, 70–120 km. As a result of the application of the combined method, the pointed above mathematically stiff problem has been solved successfully.
(3)
There is a methodological unity of approaches to ULF, ELF, and VLF disturbances generated by lightning currents associated with the eruption of the Hunga Tonga volcano. The investigated fundamental modes are either captured in the corresponding resonators, ELF oscillations or propagate in the WGEI, like VLF waves. The excited ULF fields in LEAIM propagate in the upper ionosphere–magnetosphere and are directed along the geomagnetic field lines. This property determines the upper boundary condition for ULF waves, which satisfies the principle of causality. The proposed method for derivation of the tensor impedance boundary conditions is applicable to ULF, ELF, and VLF ranges. These boundary conditions have differences in their physical meaning for excitation in each of these frequency ranges. Nevertheless, the method for the derivation of the tensor impedance is unified. To solve the differential equations for the EM field in different frequency ranges in the plasma-like system LEAIM, the combined spectral–partial difference method is applied based on the matrix elimination method.
The excitation of SR in the ELF range has been realized within the model of the local planar resonator. The applicability of this model has been checked. In the local planar resonator model, 2D periodicity with the spatial period equal to Earth’s equator is assumed. The simulated 1st and 2nd resonant frequencies coincide with the corresponding observed values. The simulated structure of EM fields is close to that obtained using the spherical resonator model in the vicinity of the maximum of the 1st mode of SR. For future work, EM fields near the source may be investigated within the local plane approximation, and the simulations of the global field of the total resonator should take into account Earth’s curvature and, most importantly, the inhomogeneity of the ionospheric characteristics both in the vertical direction and along Earth’s surface.
An analytical/numerical method has been developed to find the resonant frequencies of the SR and CSIAR in the ELF range and the longitudinal wave numbers of WGEI in the VLF range. The mode method for VLF waves agrees with the beam method, including the conversion of transverse-magnetic to transverse-electric polarizations at distances of about 500–1000 km. The given parameter is either the real frequency or the longitudinal real wave number in the horizontal direction. The unknown quantity is either the complex longitudinal wave number or the complex frequency, respectively. This method involves the derivation of a complex dispersion equation for low-frequency EM excitations. The dispersion equation is determined based on an analytical/numerical procedure, which utilizes the elimination method with tridiagonal matrices and field matching inside the corresponding Earth–ionosphere waveguide/resonator.
(4)
The work presents an integrated approach to the low-frequency part of global excitations in LEAIM generated by LCSHTE. Low-frequency excitations include the ULF, ELF, and VLF frequency ranges. The integrated approach is supported by the following factors: the common current source, the unity of approaches to their description, including analytical and numerical methods, and all the above excitations occur in LEAIM simultaneously and have large values.
The amplitudes of the excited ULF fields turn out to be sufficient at least to consider these fields among other possible drivers of highly nonlinear phenomena observed in the ionospheric F region. In the case of ELF and VLF disturbances in the SR, CSIAR, and the WGEI, the lightning source associated with the eruption causes intense disturbances, even at significant distances from the volcano area, of 10,000 km. The intensities of such disturbances exceed from several times to one order of magnitude the intensities corresponding to ordinary lightning activity.
The system of simultaneous strong effects in the three low frequency ranges due to the same unprecedented lightning source results in the possibility of combining ULF, ELF, and VLF responses in monitoring ionospheric space weather connected with powerful sources like tropical cyclones/hurricanes, earthquakes, and volcanoes. Practically, corresponding improvement in the quality of monitoring of ionospheric space weather is important, in particular, for communication systems, the reliability of power lines and human health. The simultaneous presence of the corresponding, rather strong, ionospheric response in the abovementioned frequency ranges will be investigated as a nonlinear interaction between the corresponding disturbances in LEAIM. This may indicate the presence of sufficiently powerful sources and should be involved in the analysis using multi-parameter monitoring systems. A possible nonlinear synergetic interaction between the excitations in the three considered frequency ranges may be a subject of future work.

Author Contributions

Conceptualization, Y.G.R., A.K., V.V.G., A.G., C.-H.C. and S.S.P.; methodology, Y.G.R., A.G., S.S.P. and L.B.; software, V.V.G. and S.S.P.; validation, A.G., V.V.G., L.B. and S.S.P.; formal analysis, Y.G.R., A.G., V.V.G., S.S.P., C.-H.C., A.K. and L.B.; investigation, Y.G.R., V.V.G., S.S.P. and A.G.; data curation, V.V.G., A.G. and S.S.P.; comparison between theoretical and experimental data, Y.G.R., V.V.G., S.S.P. and A.G.; interpretation of results, all authors; writing—original draft preparation, Y.G.R. and V.V.G.; writing—review and editing, Y.G.R., V.V.G., A.G., S.S.P. and A.K.; visualization, V.V.G., S.S.P. and A.G.; supervision, Y.G.R., V.V.G. and A.K.; project administration, Y.G.R. and V.V.G.; funding acquisition, Y.G.R. and A.K. All authors have read and agreed to the published version of the manuscript.

Funding

Y.R., A.K. and L.B. acknowledge the National Science Centre, Poland, for granting “Modern radio-diagnostics of the ionosphere using LOFAR and GNSS data” in the OPUS-25 funding initiative under project number UMO-2023/49/B/ST10/03465. UWM would like to thank the Ministry of Science and Higher Education of Poland for granting funds for the Polish contribution to the International LOFAR Telescope, LOFAR2.0 upgrade (decision number: 2021/WK/2) and for maintenance of the LOFAR PL-612 Bałdy, station (decision number: 28/530020/SPUB/SP/2022).

Institutional Review Board Statement

Not applicable.

Informed Consent Statement

Not applicable.

Data Availability Statement

The parameters for computation (see Figure 6 and Figure 28) of disturbances in the ULF, VLF, ELF ranges are taken from [78,79,80,81]. The dataset of lightning characteristics used for effective current computation is taken from [77].

Acknowledgments

We are grateful to S. Shelyag, from Flinders University, Australia, for assistance with extensive English editing.

Conflicts of Interest

The authors declare no conflict of interest.

Abbreviations

AbbreviationMeaning
AGWacoustic-gravity waves
CSIARcoupled global Schumann and local ionospheric Alfvén resonators
EMelectromagnetic
IARionospheric Alfvén resonator
ELFextremely low frequency
FFTfast Fourier transform
LCSHTElightning current source associated with the Hunga Tonga eruption
LOFARLow-Frequency Array (radio telescope)
MHDmagnetohydrodynamic
LEAIMLithosphere (Earth)–Atmosphere–Ionosphere–Magnetosphere
SRSchumann resonator
TIDstraveling ionospheric disturbances
ULFultra-low frequency
VLFvery low frequency
WGEIwaveguide Earth–ionosphere

Appendix A. The Matrix Elimination Method for the Dynamic Problem in the Ionosphere

Here, the numerical method is described for solving Equation (22) in Section 4.1.3. For the reasons stated at the beginning of Section 4.1.3, we use in Appendix A and Appendix B combined spectral-finite-difference method. Namely, we apply FFT in horizontal (X, Y) directions and finite-difference approach in Z direction. Equation (22) possesses the following matrix structure:
z ( A ^ 1 F z ) + z ( B ^ 01 F ) + B ^ 02 z ( F ) + B ^ F F = Q ;   F E x E y
The upper boundary conditions, which allow outgoing MHD waves only, are set at z = zmax in the magnetosphere. Note that similar boundary conditions for ELF and VLF ranges are considered in detail in Appendix B.
Finite differences [68] are applied to approximate Equation (A1) at the altitudes Lz < z < zmax. As a result, the following set of the matrix equations is obtained:
α ^ j ( ) F j 1 + α ^ j ( 0 ) F j + α ^ j + 1 ( + ) F j + 1 = Q j ;   z ( A ^ 1 F z ) 1 h ( A ^ 1 j + 1 / 2 F j + 1 F j h A ^ 1 j 1 / 2 F j F j 1 h ) ;   z ( B ^ 01 F ) 1 2 h ( B ^ 01 j + 1 F j + 1 B ^ 01 j 1 F j 1 ) ;   z ( F ) 1 2 h ( F j + 1 F j 1 ) .
The step along OZ axis is h. The matrix coefficients α ^ j ( ) , α ^ j ( 0 ) , α ^ j ( + ) are expressed through the matrices A ^ 1 , B ^ 01 , B ^ 02 , B ^ F . In Equation (A2) it is j = Nm−1, … Na+1; the grid node j = Nm corresponds to the magnetosphere altitude z = zmax and j = Na corresponds to z = Lz, i.e., at the boundary between the atmosphere and lower ionosphere.
The approximated upper boundary conditions at z = zmaz are:
α ^ N m ( ) F N m 1 + α ^ N m ( 0 ) F N m = 0 .
The matrix elimination method [74] is used for solving Equation (A2). The idea of this method relates to the Gauss’ one for solving the system of linear equations [74] by an elimination method. This method provides reduction of the matrix partial differential equations in finite differences to (tri-) diagonal form and its efficient solution. Namely, the following elimination procedure is applied:
F j = ξ ^ j F j 1 + r j .
From Equation (A3) the values of ξ ^ N m , r N m are computed:
ξ ^ N m = ( α ^ N m ( 0 ) ) 1 α ^ N m ( ) ; r ¯ N m = 0 .
Then ξ ^ j , r j are computed sequentially within the cycle j = Nm−1, … Na+1
M ^ F j = α ^ j ( ) F j 1 + Q j α ^ j ( + ) r j + 1 ; M ^ α ^ j ( 0 ) + α ^ j ( + ) ξ ^ j + 1 ; ξ ^ j = M ^ 1 α ^ j ( ) , r j = M ^ 1 ( Q j α ^ j ( + ) r j + 1 ) .
Then, the surface tensor impedance is computed at z = Lz, or at j = Na. For this purpose, the components Hx, Hy are expressed through Ex, Ey, ∂Ex/∂z, ∂Ey/∂z from the Maxwell equations:
H x = k y k 0 ε 31 E x + ε 32 E y Δ i k 0 Δ { k x k y k 0 2 E x z + ( ε 33 k x 2 k 0 2 ) E y z } ; H y = k x k 0 ε 31 E x + ε 32 E y Δ + i k 0 Δ { k x k y k 0 2 E y z + ( ε 33 k y 2 k 0 2 ) E x z } .
Here, Δ ε 33 k t 2 k 0 2 ,   k t 2 k x 2 + k y 2 . Because the current sources in the ionosphere are not implemented in these investigations, for the sake of simplicity they are not used in Equations (A7) and below. It is assumed that the current sources are present in the atmosphere only due to the volcanic activity. The derivatives in Equations (A7) are computed at j = Na as:
E x z E x N a + 1 E x N a h = ξ 11 1 h E x N a + ξ 12 h E y N a ; E y z E y N a + 1 E y N a h = ξ 21 h E x N a + ξ 22 1 h E y N a .
Thus, the relations between Hx, Hy and Ex, Ey are at j = Na:
H x = C 11 E x + C 12 E y ; H y = C 21 E x + C 22 E y .
The coefficients C11, etc., can be computed from Equations (A7) and (A8) and are not given here due to complexity. From Equations (A9), it is possible to get the inverse relations:
E x = 1 D ( C 22 H x C 12 H y ) Z 21 H x + Z 22 H y ; E y = 1 D ( C 11 H y C 21 H x ) Z 11 H x Z 12 H y .
Here D C 11 C 22 C 12 C 21 .
Therefore, the components of the tensor impedance Zαβ of the ionosphere are:
Z 21 = C 22 D ; Z 22 = C 12 D ; Z 11 = C 11 D ; Z 12 = C 21 D .
Then, these components are used in the boundary conditions at z = Lz for the electric potential φ and the magnetic field component Hz.
The scalar equations for φ and Hz are solved by the elimination method similar to Equation (A4). The scalar elimination method is applied there. The cycle of the elimination is realized from z = 0 up to z = Lz, i.e., for j = 1, …Na−1. The boundary conditions with the surface impedance at z = Lz make it possible to compute φ and Hz at j = Na. In turn, the values of φ and Hz are computed within the inverse cycle for j = Na−1, , 1.
Finally, the electric field components Ex, Ey and all other components of EM field Ez, Hx,y,z are computed within the ionosphere for j = Na+1, , Nm using Equation (A4).
The algorithm described above has been applied for ULF range, Section 4.1. For ELF range, Section 4.2.1, the matrix elimination procedure has been applied for Equation (A2) within both the atmosphere and the ionosphere, i.e., at all altitudes 0 < z < zmax.

Appendix B. The Analytical/Numerical Method for the Derivation of Dispersion Equation for the Eigenvalues of Waves in Inhomogeneous Lossy Anisotropic and Gyrotropic Media: Application for Simulating ELF and VLF Modes. Method for Derivation of the Complex Tensor Impedance for ELF and VLF Ranges

Here, the algorithm to simulate VLF and ELF modes in the WGEI and the CSIAR is described. The vertical coordinate is z, the ones in the horizontal plane are x, y.
In VLF range, Section 4.3.1 and Section 4.3.2, Figure 28, the principal problem is to get the complex wavenumber kx of the propagating waveguide mode for the known real frequency, e.g., ω~105 s−1, i.e., kxkx(ω). In ELF range, Section 4.2.2, the problem is to get the complex frequency ωω′ + ″, ω~(30–100) s−1, which depends on the real wavenumber kx~1/RE, where RE ≈ 6400 km is Earth’s radius. The ELF modes of the vertical ionosphere resonator are searched that can be effectively coupled with the Schumann modes of the global resonator Earth–ionosphere. The quality factor of these modes is supposed to be quite large, ω′/ω″ ≥ 5.
Thus, it is assumed that the EM field E , H in WGEI depends on time t and x as:
E , H   ~   e i ω t i k x x .
The set of the Maxwell equations takes the form:
H y z = i k 0 D x , H x z + i k x H z = i k 0 D y , i k x H y = i k 0 D z ,
E y z = i k 0 H x ,   E x z + i k x E z = i k 0 H y , i k x E y = i k 0 H z .
The notation k 0 ω c is used.
The following notations are introduced:
ε ˜ 22 = ε 22 + ε 21 ( ε 13 ε 32 ε 12 ε 33 ) Δ + ε 23 ( ε 31 ε 12 ε 32 ε 11 ) Δ ,
γ 21 ε 23 ε 31 ε 21 ε 33 Δ , γ 23 ε 21 ε 13 ε 23 ε 11 Δ , γ 12 ε 13 ε 32 ε 12 ε 33 Δ , γ 32 ε 31 ε 12 ε 32 ε 11 Δ
β ˜ 33 ε 33 Δ ,   β ˜ 13 ε 13 Δ ,   β ˜ 31 ε 31 Δ ,   β ˜ 11 ε 11 Δ ,   Δ = ε 11 ε 33 ε 13 ε 31 .
The permittivity tensor ε ^ of the ionosphere takes the form (10). The inverse tensor is denoted as β ^ = ε ^ 1 . The tensor ε ^ is given in the laboratory coordinate frame x, y, z. It is obtained from the tensor ε ^ in the coordinate frame associated with the geomagnetic field by means of rotation.
From (A13), it is possible to get the following system of equations for the components Ey, Hy:
2 E y z 2 + k 0 2 ε ˜ 22 k x 2 i k 0 γ 21 H y z + k 0 k x γ 23 H y = 0 , z β ˜ 33 H y z i k 0 z ( γ 12 E y ) i k x z ( β ˜ 13 H y ) i k x β ˜ 31 H y z + k 0 k x γ 32 E y k x 2 β ˜ 11 H y + k 0 2 H y = 0 .
Equation (A16) are supplemented by the boundary conditions. At z = zmax~800 km, i.e., at the upper boundary of the ionosphere, the concept of the tensor impedance is applied. Only the outgoing waves are at z > zmax, i.e., in the magnetosphere. As in the magnetosphere, the components of the permittivity tensor are |εlm| >> 1; the following simplification can be used: / x = / y 0 . Under such a simplification, we have:
D z 0 ;   E x = β 11 D x + β 12 D y ;   E y = β 21 D x + β 22 D y .
Here, βlm are the components of the inverse permittivity tensor. The following set of equations for Hx,y can be written down:
β 22 2 H x z 2 + k 0 2 H x β 21 2 H y z 2 = 0 ;   β 11 2 H y z 2 + k 0 2 H x β 12 2 H x z 2 = 0 .
The solution of (A18) is searched as H x , y ~ e i k z , and the vertical wavenumbers satisfy the equation:
( β 11 β 22 β 12 β 21 ) k 4 ( β 11 + β 22 ) k 0 2 k 2 + k 0 4 = 0 .
The proper solution of (A18) is ( z zzmax):
H x = A 1 e i k 1 z + α 2 A 2 e i k 2 z ,   H y = α 1 A 1 e i k 1 z + A 2 e i k 2 z , E x = k 0 ( α 1 k 1 A 1 e i k 1 z + 1 k 2 A 2 e i k 2 z ) ,   E y = k 0 ( 1 k 1 A 1 e i k 1 z + α 2 k 2 A 2 e i k 2 z ) .
The outgoing waves satisfy the following condition: Re ( k 1 , 2 ) > 0 , and the coefficients α1,2 are:
α 1 = β 21 1 ( β 22 k 0 2 k 1 2 ) , α 2 = β 12 1 ( β 11 k 0 2 k 2 2 ) .
At z = zmax there are the relations:
H x = A 1 + α 2 A 2 ,   H y = α 1 A 1 + A 2 .
Therefore, one can get:
A 1 = 1 1 α 1 α 2 ( H x α 2 H y ) ,   A 2 = 1 1 α 1 α 2 ( H y α 1 H x ) .
Expressions for Ex,y are:
E x = k 0 1 α 1 α 2 [ α 1 k 1 ( H x α 2 H y ) + 1 k 2 ( H y α 1 H x ) ] Z 21 H x + Z 22 H y , E y = k 0 1 α 1 α 2 [ 1 k 1 ( H x α 2 H y ) + α 2 k 2 ( H y α 1 H x ) ] Z 11 H x Z 12 H y ; Z 11 = k 0 ( 1 α 1 α 2 ) ( 1 k 1 α 1 α 2 k 2 ) ;   Z 12 = k 0 α 2 ( 1 α 1 α 2 ) ( 1 k 2 1 k 1 ) Z 21 = k 0 α 1 1 α 1 α 2 ( 1 k 1 1 k 2 ) ; Z 22 = k 0 1 α 1 α 2 ( 1 k 2 α 1 α 2 k 1 )
Thus, Equation (A24) yield the components of the tensor impedance Zαβ of the magnetosphere.
ELF oscillations in SR/CSIAR, Section 4.2, are also solved using the effective upper boundary conditions of radiation, formulated at the altitude of the upper ionosphere. Those boundary conditions are reduced using the impedance method to the form like (A24).
Using Equation (A16), it is possible also to get the relations between Ex, Ey and Hx, Hy at the upper boundary of the VLF WGEI z = Lz = (70–120) km, Section 4.3.2, in the same form as (A24). The procedure of the recalculation of the effective complex tensor impedance (A24) determined at z = z max to the effective tensor impedance at the upper boundary of WGEI z = L z is described in detail in [56]. The algorithm of the recalculation of the tensor impedance for the ULF field, used in Section 4.1, is presented in Appendix A, Equations (A4)–(A11). It is based on the matrix elimination method. The tensor impedance of the ionosphere can be used to simulate the propagation of VLF waves by means of the beam method, as demonstrated in Section 4.3.2.
The expressions for the horizontal components Ex, Hx at zzmax are:
H x i k 0 E y z , E x γ 12 E y + i β ˜ 33 k 0 E y z + β ˜ 13 H y .
Finally, the boundary conditions at z = zmax are as follows:
E y i k 0 Z 11 E y z + Z 12 H y = 0 ;   γ 12 E y + i k 0 Z 21 E y z + ( β ˜ 13 Z 22 ) H y + i β ˜ 33 k 0 H y z = 0 .
The boundary conditions at z = 0 are given as:
E y i k 0 Z E y z = 0 , i k 0 H y z Z H y = 0 .
In (A27), Z is the scalar impedance of the boundary atmosphere–lithosphere. Note that the utilized approach to simulate VLF, Section 4.3.1, and ELF, Section 4.2.2, modes in the WGEI and SR, respectively, is an analytical/numerical one. This means that for the eigenmode simulations for the waveguide or the resonator, the combination of Equation (A16) and boundary conditions (A26) and (A27) is initially given analytically. Then, the finite difference approximations and the matrix elimination method with tridiagonal matrix coefficients are applied [74]. This numerical procedure is described below.
Let us denote:
C E y H y .
The approximated boundary conditions (A26) at z = zmax are
α ^ ( ) C N 1 + α ^ ( 0 ) C N = 0 .
In (A29), grid node with number N corresponds to the altitude z = zmaz. The finite difference equations for the internal nodes that are within WGEI are:
α ^ j ( ) C j 1 + α ^ j ( 0 ) C j + α ^ j + 1 ( + ) C j + 1 = 0 ,
where j = N − 1,…,1, and grid node j = 0 corresponds to the altitude z = 0.
The matrix coefficients in Equation (A30), for a given index j, are:
α 11 ( ) = α 11 ( + ) = 1 h z 2 , α 11 ( 0 ) = 1 2 α 11 ( ) + [ k 0 2 ( ε ˜ 22 ) j k x 2 ] , α 12 ( ) = i k 0 2 h z ( γ 21 ) j 1 , α 12 ( + ) = α 12 ( ) , α 12 ( 0 ) = k 0 k x ( γ 23 ) j , α 21 = i k 0 2 h z γ 21 j 1 , α 21 + = i k 0 2 h z γ 12 j + 1 , α 21 0 = k 0 k x γ 32 j α 22 = 1 h z 2 β ˜ 33 j 1 / 2 + i k x 2 h z β ˜ 13 j 1 + β ˜ 31 j ; α 22 + = 1 h z 2 β ˜ 33 j + 1 / 2 i k x 2 h z β ˜ 13 j + 1 + β ˜ 31 j . α 22 + = 1 h z 2 β ˜ 33 j + 1 / 2 i k x 2 h z β ˜ 13 j + 1 + β ˜ 31 j ; α 22 0 = 1 h z 2 β ˜ 33 j 1 / 2 + β ˜ 33 j + 1 / 2 + k 0 2 k x 2 β ˜ 11 j
Note that in Equation (A31), the index j for the matrix coefficients α ^ j ( ) , α ^ j ( 0 ) , α ^ j + 1 ( + ) is omitted. From Equation (A30) it is possible to realize the matrix elimination:
C j = ξ ^ j C j 1 .
In (A32), ξ ^ j are elements of the matrix elimination procedure [74]. At z = 0 (j = 0) it is:
E y 0 i k 0 h z Z ( E y 1 E y 0 ) = 0 .
Taking into account the boundary conditions at the upper boundary of WGEI, one can get the connection between the values (AN, BN) and (AN−1, BN−1) (z = zmax, j = N):
A N = 1 Δ C 01 A N 1 C 12 C 02 A N 1 + C 03 B N 1 C 22 = C 01 C 22 C 02 C 12 Δ A N 1 C 03 C 12 Δ B N 1 , B N = 1 Δ C 11 C 01 A N 1 C 21 C 02 A N 1 + C 03 B N 1 = 1 Δ C 02 C 11 C 01 C 21 A N 1 + C 03 C 11 Δ B N 1 .
In (A34), AN,N−1, BN,N−1 are the amplitudes that correspond to the components Ey, Hy, respectively. In the nodes N, N − 1 there are:
C 11 = 1 i k 0 h z Z 11 , C 12 = Z 12 , C 21 = γ 12 + i Z 21 k 0 h z , C 22 = β ˜ 13 Z 22 + i β ˜ 33 k 0 h z , C 01 = i Z 11 k 0 h z ,   C 02 = i Z 21 k 0 h z ,   C 03 = i β ˜ 33 k 0 h z .
In (A35), hz is the step of the numerical grid along z.
The boundary conditions (A27) at z = 0 are reduced to:
( 1 + i Z k 0 h z ) E y 0 i Z k 0 h z [ ξ 1 ( 1 , 1 ) E y 0 + ξ 1 ( 1 , 2 ) H y 0 ] = 0 , 1 ε k 0 h z ξ 1 ( 2 , 1 ) E y 0 + H y 0 [ Z + i ε k 0 h z ( 1 ξ 1 ( 2 , 2 ) ) ] = 0 .
Note that in (A36), ξ 1 ( i , j ) ;   i , j = 1 , 2 , are the elements of the matrix ξ ^ 1 . Equation (A36) are represented as:
  C 11 E y 0 + C 12 H y 0 = 0 ,   C 21 E y 0 + C 22 H y 0 = 0
Considering (A37), the dispersion equation for the complex modes of WGEI is:
F det ( C ^ ) C 11 C 22 C 12 C 21 = 0 .
In (A38), F is the dispersion function, determined here in the course of the described above analytical/numerical procedure. This dispersion equation yields the eigenmodes of WGEI.
Alternatively, to determine the dispersion function and, thus, to derive the dispersion equation, the variant of the matrix elimination called the counter-elimination, or ongoing one, has been applied. This approach has been used to check the simplest variant described above, Equation (A38), and to avoid the loss of several roots. Also, for several VLF propagating modes of WGEI and for several ELF resonator modes, this approach yields more exact results in the case of a small impedance Z of the boundary atmosphere—the solid Earth. The algorithm of the counter-elimination is:
C j = ξ ^ j C j 1 , j = N , , j 0 + 1 ;   C j = ξ ^ j C j + 1 , j = 0 , , j 0 1 .
Here 0 < z0 < zmax (j0z0/hz), z0~20–200 km is an intermediate point located within the atmosphere or the ionosphere. After the realization of (A39) in the node j = j0 there is:
α ^ j 0 ( ) C j 0 1 + α ^ j 0 ( 0 ) C j 0 + α ^ j 0 + 1 ( + ) C j 0 + 1 = 0 .
Thus we have the following dispersion equation, instead of (A38):
M ^ C j 0 ( α ^ j 0 ( ) ξ ^ j 0 1 + α ^ j 0 ( 0 ) + α ^ j 0 + 1 ( + ) ξ ^ j 0 + 1 ) C j 0 = 0 ,
F det ( M ^ ) = 0 .
For checking the numerical simulations, it is advantageous to combine the elimination in the single direction with the counter-elimination, where several simulations are realized with various values of z0. Complex roots of the dispersion Equation (A38) or (A42) are found using the procedure described in Appendix C. The dispersion equations in the forms (A38) and (A42) have been derived and used both for ELF eigenmodes in CSIAR, Section 4.2.2, and VLF eigenmodes in WGEI, Section 4.3.1.

Appendix C. Numerical Solution of Dispersion Equation: Application for the ELF and VLF Perturbations

The goal is to solve the dispersion equation that connects the frequency ω and the wave number kx. The solution of the Maxwell equations is searched in the form ~ e i ( ω t k x x ) . This dispersion equation is defined from the set of uniform differential equations added by uniform boundary conditions, as described in Appendix B. Symbolically, it is presented as
F ( ω , k x ) = 0 .
In (A43), the function F ( ω , k x ) is determined as described in Appendix B (see (A38) and (A42)). In the case of ELF ionospheric resonators, kx = 1/RE is given as real, and the problem in Section 4.2.2 is to get the complex eigenfrequencies ωω′ + ″. The values of ω to find are with sufficiently large quality factors ω′/ω″ ≥ 5. The real part of the eigenfrequency ω′ should be in the vicinity of the 1st Schumann mode, ω′~30 s−1–50 s−1.
The iteration procedure has been built in the following manner. Let ω(s) is the sth iteration. Equation (A43) is equivalent to
F ( ω ( s ) + δ ω , k x ) = 0 .
The initial value of the eigenfrequency ω(0) is obtained from the condition of the local minimum of | F ( ω , k x ) | , ω(0) is assumed as real. Equation (A44) is approximated as
F ( ω ( s ) , k x ) + F ω δ ω + 1 2 F ω ω ( δ ω ) 2 = 0 .
In Equation (A45), ω ( 0 ) ω ( s = 0 ) .The quadratic equation has 2 roots, the smallest one |δω| is used with the positive imaginary part δω″ > 0, and the next iteration value is
ω ( s + 1 ) = ω ( s ) + δ ω .
The obtained solutions are considered as satisfactory when the quality factor is sufficiently large and the resonant mode is well localized in the ionosphere and possesses small values of EM field components in the upper ionosphere/magnetosphere, z ≥ (600–800) km.
The partial derivatives in Equation (A45) are computed using central difference approximations of~(Δω)4 order of accuracy
F ω F ω F ( ω + Δ ω ) F ( ω Δ ω ) 2 Δ ω F ( ω + 2 Δ ω ) 2 F ( ω + Δ ω ) + 2 F ( ω Δ ω ) F ( ω 2 Δ ω ) 12 Δ ω ; F ω ω 2 F ω 2 F ( ω + Δ ω ) 2 F ( ω ) + F ( ω Δ ω ) 2 ( Δ ω ) 2 F ( ω + 2 Δ ω ) 4 F ( ω + Δ ω ) + 6 F ( ω ) 4 F ( ω Δ ω ) + F ( ω 2 Δ ω ) 12 ( Δ ω ) 2 .
The value of the step Δω is about Δω ≈ 0.01ω(0)ω″.
The analogous method has been developed for simulations of the modes of the waveguide Earth–ionosphere in Section 4.3.2. In this case, the real values of the frequency ω are given and the complex values of the longitudinal wavenumber kxkx+ ikx″ should be obtained, kx′ ≈ ω/c, kx″ < 0, |kx″| << kx′.

References

  1. Kamide, Y.; Chian, A. (Eds.) Handbook of the Solar-Terrestrial Environment; Springer: Berlin/Heidelberg, Germany, 2007; 539p. [Google Scholar] [CrossRef]
  2. Hapgood, M. Space Weather; IOP Publishing Ltd.: Bristol, UK, 2017; 33p. [Google Scholar] [CrossRef]
  3. Chernogor, L.F. A Tropical Cyclone or Typhoon as an Element of the Earth–Atmosphere–Ionosphere–Magnetosphere System: Theory, Simulations, and Observations. Remote Sens. 2023, 15, 4919. [Google Scholar] [CrossRef]
  4. Chernogor, L.F.; Rozumenko, V.T. Earth—Atmosphere—Geospace as an Open Nonlinear Dynamical System. Radio Phys. Radio Astron. 2008, 13, 120–137. [Google Scholar]
  5. Harding, B.J.; Wu, Y.J.; Alken, P.; Yamazaki, Y.; Triplett, C.C.; Immel, T.J.; Gasque, L.C.; Mende, S.B.; Xiong, C. Impacts of the January 2022 Tonga volcanic eruption on the ionospheric dynamo: ICON-MIGHTI and Swarm observations of extreme neutral winds and currents. Geophys. Res. Lett. 2022, 49, e2022GL098577. [Google Scholar] [CrossRef]
  6. Bór, J.; Bozóki, T.; Sátori, G.; Williams, E.; Behnke, S.A.; Rycroft, M.J.; Buzás, A.; Silva, H.G.; Kubicki, M.; Said, R.; et al. Responses of the AC/DC global electric circuit to volcanic electrical activity in the Hunga Tonga-Hunga Ha’apai eruption on 15 January 2022. J. Geophys. Res. Atmos. 2023, 128, e2022JD038238. [Google Scholar] [CrossRef]
  7. Van Eaton, A.R.; Lapierre, J.; Behnke, S.A.; Vagasky, C.; Schultz, C.J.; Pavolonis, M.; Bedka, K.; Khlopenkov, K. Lightning rings and gravity waves: Insights into the giant eruption plume from Tonga’s Hunga Volcano on 15 January 2022. Geophys. Res. Lett. 2023, 50, e2022GL102341. [Google Scholar] [CrossRef]
  8. Shinbori, A.; Otsuka, Y.; Sori, T.; Nishioka, M.; Septi, P.; Tsuda, T.; Nishitani, N.; Kumamoto, A.; Tsuchiya, F.; Matsuda, S.; et al. New aspects of the upper atmospheric disturbances caused by the explosive eruption of the 2022 Hunga Tonga–Hunga Ha’apai volcano. Earth Planets Space 2023, 75, 175. [Google Scholar] [CrossRef]
  9. Chum, J.; Sindelarova, T.; Koucka, P.K.; Podolska, K.; Rusz, J.; Base, J.; Nakata, H.; Hosokawa, K.; Danielides, M.; Schmidt, C.; et al. Atmospheric and ionospheric waves induced by the Hunga eruption on 15 January 2022: Doppler sounding and infrasound. Geophys. J. Int. 2023, 233, 1429–1443. [Google Scholar] [CrossRef]
  10. Rakov, V.A.; Uman, M.A. Lightning: Physics and Effects; Cambridge University Press: Cambridge, UK, 2003; ISBN 978-0521035415. [Google Scholar]
  11. Chandrasekhar, N.P.; Archana, R.; Arora, K. Lightning and gravity wave signatures produced by the Hunga-Tonga volcanic eruption on global geomagnetic data. J. Geophys. Res. Space Phys. 2023, 128, e2023JA031767. [Google Scholar] [CrossRef]
  12. Koloskov, O.; Jayachandran, P.T.; Yampolski, Y. On the performance of CARISMA—Akademik Vernadsky station Schumann resonance monitoring. Ukr. Antarct. J. 2023, 21, 37–54. [Google Scholar] [CrossRef]
  13. Mezentsev, A.; Nickolaenko, A.P.; Shvets, A.V.; Galuk, Y.P.; Schekotov, A.Y.; Hayakawa, M.; Romero, R.; Izutsu, J.; Kudintseva, I.G. Observational and model impact of Tonga volcano eruption on Schumann resonance. J. Geophys. Res. Atmos. 2023, 128, e2022JD037841. [Google Scholar] [CrossRef]
  14. Gavrilov, B.G.; Poklad, Y.V.; Ryakhovsky, I.A.; Ermak, V.M.; Achkasov, N.S.; Kozakova, E.N. Global electromagnetic disturbances caused by the eruption of the Tonga volcano on 15 January 2022. J. Geophys. Res. Atmos. 2022, 127, e2022JD037411. [Google Scholar] [CrossRef]
  15. Shvets, A.V.; Hobara, Y.; Hayakawa, M.; Shvets, A.A.; Koloskov, O.V.; Yampolsky, Y.M. Estimation of Lightning Strokes Count from Measurements of VLF Atmospherics During the Eruption of Hunga Tonga-Hunga Ha’apai Volcano on 15 January 2022. In Proceedings of the URSI GASS 2023, Sapporo, Japan, 19–26 August 2023. [Google Scholar] [CrossRef]
  16. Holzworth, R.H. Quasistatic Electromagnetic Phenomena in the Atmosphere and Ionosphere. In Handbook of Atmospheric Electrodynamics; Volland, H, Ed.; CRC Press: Boca Raton, FL, USA, 1995; pp. 235–266. [Google Scholar] [CrossRef]
  17. Sorokin, V.M.; Chmyrev, V.M.; Hayakawa, M. A Review on Electrodynamic Influence of Atmospheric Processes to the Ionosphere. Open J. Earthq. Res. 2020, 9, 113–141. [Google Scholar] [CrossRef]
  18. Denisenko, V.V.; Nesterov, S.A.; Boudjada, M.Y.; Lammer, H. A mathematical model of quasistationary electric field penetration from ground to the ionosphere with inclined magnetic field. J. Atmos. Sol. Terr. Phys. 2018, 179, 527–537. [Google Scholar] [CrossRef]
  19. Hayakawa, M.; Schekotov, A.; Izutsu, J.; Nickolaenko, A.P.; Hobara, Y. Seismogenic ULF/ELF Wave Phenomena: Recent Advances and Future Perspectives. Open J. Earthq. Res. 2023, 12, 45–113. [Google Scholar] [CrossRef]
  20. Kalinin, A.V.; Slyunyaev, N.N.; Mareev, E.A.; Zhidkov, A.A. Stationary and Nonstationary Models of the Global Electric Circuit: Well-Posedness, Analytical Relations, and Numerical Implementation. Izv. Atmos. Ocean. Phys. 2014, 50, 314–322. [Google Scholar] [CrossRef]
  21. Yutsis, V.; Rapoport, Y.; Grimalsky, V.; Grytsai, A.; Ivchenko, V.; Petrishchevskii, S.; Fedorenko, A.; Krivodubskij, V. ULF Activity in the Earth Environment: Penetration of Electric Field from the Near-Ground Source to the Ionosphere under Different Configurations of the Geomagnetic Field. Atmosphere 2021, 12, 801. [Google Scholar] [CrossRef]
  22. Rapoport, Y.; Reshetnyk, V.; Grytsai, A.; Grimalsky, V.; Liashchuk, O.; Fedorenko, A.; Hayakawa, M.; Krankowski, A.; Błaszkiewicz, L.; Flisek, P. Spectral Analysis and Information Entropy Approaches to Data of VLF Disturbances in the Waveguide Earth-Ionosphere. Sensors 2022, 22, 8191. [Google Scholar] [CrossRef]
  23. Khazanov, G.V. (Ed.) Space Weather Fundamentals; CFS Press: Keswick, UK, 2016; ISBN 978-1498749077. [Google Scholar]
  24. Cander, L.R. Ionospheric Space Weather; Springer: Berlin/Heidelberg, Germany, 2019. [Google Scholar] [CrossRef]
  25. Shi, X.; Hartinger, M.D.; Baker, J.B.H.; Murphy, B.S.; Bedrosian, P.A.; Kelbert, A.; Rigler, E.J. Characteristics and sources of intense geoelectric fields in the United States: Comparative analysis of multiple geomagnetic storms. Space Weather 2022, 20, e2021SW002967. [Google Scholar] [CrossRef]
  26. Zheng, Y.; Chernogor, L.F.; Garmash, K.P.; Guo, Q.; Rozumenko, V.T.; Luo, Y. Disturbances in the ionosphere and distortion of radio wave characteristics that accompanied the super typhoon Lekima event of 4–12 August 2019. J. Geophys. Res. Space Phys. 2022, 127, e2022JA030553. [Google Scholar] [CrossRef]
  27. Ouzounov, D.; Pulinets, S.; Hattori, K.; Taylor, P. Pre-Earthquake Processes. A Multidisciplinary Approach to Earthquake Prediction Studies; Wiley: Hoboken, NJ, USA, 2018. [Google Scholar] [CrossRef]
  28. Chen, C.-H.; Sun, Y.Y.; Lin, K.; Zhou, C.; Xu, R.; Qing, H.; Gao, Y.; Chen, T.; Wang, F.; Yu, H.; et al. New Instrumental Array in Sichuan, China, to Monitor Vibrations and Perturbations of the Lithosphere, Atmosphere, and Ionosphere. Surv. Geophys. 2021, 42, 1425–1442. [Google Scholar] [CrossRef]
  29. Kolmašová, I.; Santolík, O.; Kašpar, P.; Popek, M.; Pizzuti, A.; Spurný, P.; Borovička, J.; Mlynarczyk, J.; Manninen, J.; Macotela, E.L.; et al. First observations of elves and their causative very strong lightning discharges in an unusual small-scale continental spring-time thunderstorm. J. Geophys. Res. Atmos. 2021, 126, e2020JD032825. [Google Scholar] [CrossRef]
  30. Chernogor, L.F.; Garmash, K.P.; Guo, Q.; Rozumenko, V.T.; Zheng, Y. Effects of the super-powerful tropospheric western Pacific phenomenon of September–October 2018 on the ionosphere over China: Results from oblique sounding. Ann. Geophys. 2023, 41, 173–195. [Google Scholar] [CrossRef]
  31. Rycroft, M.J.; Harrison, R.G.; Nicoll, K.A.; Mareev, E.A. An Overview of Earth’s Global Electric Circuit and Atmospheric Conductivity. Space Sci. Rev. 2008, 137, 83–105. [Google Scholar] [CrossRef]
  32. Williams, E.; Mareev, E. Recent Progress on the Global Electrical Circuit. Atmos. Res. 2014, 135, 208–227. [Google Scholar] [CrossRef]
  33. Jánsky, J.; Pasko, V.P. Charge balance and ionospheric potential dynamics in time-dependent global electric circuit model. J. Geophys. Res. Space Phys. 2014, 119, 203. [Google Scholar] [CrossRef]
  34. Debnath, M. Electromagnetic terrestrial environment and the contribution of the main emission sources. Brainwave Multidiscip. J. 2022, 3, 238–252. [Google Scholar]
  35. Dementyeva, S.O.; Mareev, E.A. On the Contribution of Turbulence to the Electrification of Thundercloud. Izv. Atmos. Ocean. Phys. 2018, 54, 25–31. [Google Scholar] [CrossRef]
  36. Morozov, V.N. The influence of convective current generator on the global current. Nonlinear Process. Geophys. 2006, 13, 243–246. Available online: https://npg.copernicus.org/articles/13/243/2006/ (accessed on 1 January 2025). [CrossRef]
  37. Alexandrov, A.F.; Bogdankevich, L.S.; Rukhadze, A.A. Fundamentals of Plasma Electrodynamics, 2nd ed.; Springer: Berlin/Heidelberg, Germany, 1988. [Google Scholar]
  38. Rapoport, Y.; Grimalsky, V.; Krankowski, A.; Pulinets, S.; Fedorenko, A.; Petrishchevskii, S. Algorithm for modeling electromagnetic channel of seismo-ionospheric coupling (SIC) and the variations in the electron concentration. Acta Geophys. 2020, 68, 253–278. [Google Scholar] [CrossRef]
  39. Knudsen, D.J. Alfvén Waves and Static Fields in Magnetosphere/Ionosphere Coupling: In-situ Measurements and a Numerical Model. Ph.D. Thesis, Cornell University, Ithaca, NY, USA, 1990; 195p. Available online: https://apps.dtic.mil/sti/tr/pdf/ADA356871.pdf (accessed on 1 January 2025).
  40. Molchanov, O.A.; Hayakawa, M.; Rafalsky, V.A. Penetration characteristics of electromagnetic emissions from an underground seismic source into the atmosphere, ionosphere and magnetosphere. J. Geophys. Res. 1995, 100, 1691–1712. [Google Scholar] [CrossRef]
  41. Grimalsky, V.V.; Kremenetsky, I.A.; Rapoport, Y.G. Excitation of electromagnetic waves in the Lithosphere and their penetration into ionosphere and magnetosphere. J. Atmos. Electr. 1999, 19, 101–117. [Google Scholar]
  42. Anagnostopoulos, G. On the Origin of ULF Magnetic Waves Before the Taiwan Chi-Chi 1999 Earthquake. Front. Earth Sci. 2021, 9, 730162. [Google Scholar] [CrossRef]
  43. Rapoport, Y.; Grimalsky, V.; Hayakawa, M.; Ivchenko, V.; Juarez-R, D. Change of ionospheric plasma parameters under the influence of electric field which has lithospheric origin and due to radon emanation. Phys. Chem. Earth Parts A/B/C 2004, 29, 579–587. [Google Scholar] [CrossRef]
  44. Rapoport, Y.G.; Gotynyan, O.E.; Ivchenko, V.N.; Hayakawa, M.; Grimalsky, V.V.; Koshevaya, S.V.; Juarez-R, D. Modeling electrostatic-photochemistry seismoionospheric coupling in the presence of external currents. Phys. Chem. Earth Parts A/B/C 2006, 31, 437–446. [Google Scholar] [CrossRef]
  45. Hairer, E.; Wanner, G. Solving Ordinary Differential Equations II. Stiff and Differential-Algebraic Problems; Springer: Berlin/Heidelberg, Germany, 1996. [Google Scholar] [CrossRef]
  46. Shinbori, A.; Otsuka, Y.; Sori, T.; Nishioka, M.; Perwitasari, S.; Tsuda, T.; Nishitani, N. Electromagnetic conjugacy of ionospheric disturbances after the 2022 Hunga Tonga-Hunga Ha’apai volcanic eruption as seen in GNSS-TEC and SuperDARN Hokkaido pair of radars observations. Earth Planets Space 2022, 74, 106. [Google Scholar] [CrossRef]
  47. Bliokh, P.V.; Nikolaenko, A.P.; Filippov, Y.F. Schumann Resonances in the Earth-Ionosphere Cavity; IEEE Publishing: London, UK, 1980; p. 164. [Google Scholar]
  48. Marchenko, V.; Kulak, A.; Mlynarczyk, J. Finite-difference time-domain analysis of ELF radio wave propagation in the spherical Earth–ionosphere waveguide and its validation based on analytical solutions. Ann. Geophys. 2022, 40, 395–406. [Google Scholar] [CrossRef]
  49. Hayakawa, M.; Izutsu, J.; Schekotov, A.Y.; Nickolaenko, A.P.; Galuko, Y.P.; Kudintseva, I.G. Anomalies of Schumann resonances as observed near Nagoya associated with two huge (M~7) Tohoku offshore earthquakes in 2021. J. Atmos. Sol.–Terr. Phys. 2021, 225, 105761. [Google Scholar] [CrossRef]
  50. Constable, C.; Constable, S. A grand spectrum of the geomagnetic field. Phys. Earth Planet. Inter. 2023, 344, 107090. [Google Scholar] [CrossRef]
  51. Liu, J.; Huang, J.; Li, Z.; Zhao, Z.; Zeren, Z.; Shen, X.; Wang, Q. Recent Advances and Challenges in Schumann Resonance Observations and Research. Remote Sens. 2023, 15, 3557. [Google Scholar] [CrossRef]
  52. Guglielmi, A.V.; Pokhotelov, O.A. Geoelectromagnetic Waves; Taylor & Francis: Abingdon, UK, 1996; ISBN 978-0750300520. [Google Scholar]
  53. Grimalsky, V.; Koshevaya, S.; Kotsarenko, A.; Chavez, M.A.C. Simulation of Modes of Ionosphere Alfvén Resonator with High Quality Factors in the Case of Oblique Geomagnetic Field. J. Electromagn. Anal. Appl. 2012, 4, 192–198. [Google Scholar] [CrossRef]
  54. Dudkin, D.; Pilipenko, V.; Korepanov, V.; Klimov, S.; Holzworth, R. Electric field signatures of the IAR and Schumann resonance in the upper ionosphere detected by Chibis-M microsatellite. J. Atmos. Sol. Terr. Phys. 2014, 117, 81–87. [Google Scholar] [CrossRef]
  55. Ermakova, E.N.; Ryabov, A.V. Influence of ionospheric resonators on daily dynamics of the first Schumann resonance spectral parameters according to data from a meridional chain of ULF magnetometers. Sol.-Terr. Phys. 2024, 10, 62–73. [Google Scholar] [CrossRef]
  56. Rapoport, Y.; Grimalsky, V.; Fedun, V.; Agapitov, O.; Bonnell, J.; Grytsai, A.; Milinevsky, G.; Liashchuk, A.; Rozhnoi, A.; Solovieva, M.; et al. Model of the propagation of very low-frequency beams in the Earth–ionosphere waveguide: Principles of the tensor impedance method in multi-layered gyrotropic waveguides. Ann. Geophys. 2020, 38, 207–230. [Google Scholar] [CrossRef]
  57. Shvets, A.; Hobara, Y.; Hayakawa, M.; Shvets, A.; Koloskov, O.; Yampolsky, Y. Investigation of anomalous lightning activity during the January 15, 2022 Tonga volcano eruption based on measurements of the VLF and ELF electromagnetic fields. J. Atmos. Sol. Terr. Phys. 2024, 264, 106344. [Google Scholar] [CrossRef]
  58. Kuzichev, I.V.; Vasko, I.Y.; Malykhin, A.Y.; Soto-Chavez, A.R. On the ionospheric propagation of VLF waves generated by currents in the lower ionosphere. J. Atmos. Sol.-Terr. Phys. 2018, 179, 138–148. [Google Scholar] [CrossRef]
  59. Maurya, A.K.; Tripathi, G.; Singh, S.B.; Singh, R.; Singh, A.K. Chapter 16—Low-latitude upper atmosphere remote sensing using very low frequency (VLF) waves. In Earth Observation, Atmospheric Remote Sensing; Singh, A.K., Tiwari, S., Eds.; Elsevier: Amsterdam, The Netherlands, 2023; pp. 283–306. [Google Scholar] [CrossRef]
  60. Tsurutani, B.T.; Zank, G.P.; Sterken, V.J.; Shibata, K.; Nagai, T.; Mannucci, A.J.; Malaspina, D.M.; Lakhina, G.S.; Kanekal, S.G.; Hosokawa, K.; et al. Space Plasma Physics: A Review. IEEE Trans. Plasma Sci. 2023, 51, 1595–1655. [Google Scholar] [CrossRef]
  61. Muafiry, I.N.; Meilano, I.; Heki, K.; Wijaya, D.D.; Nugraha, K.A. Ionospheric Disturbances after the 2022 Hunga Tonga-Hunga Ha’apai Eruption above Indonesia from GNSS-TEC Observations. Atmosphere 2022, 13, 1615. [Google Scholar] [CrossRef]
  62. Chernogor, L.F. Physical effects from the powerful Tonga volcanic eruption of January 15, 2022, in the earth–atmosphere–ionosphere–magnetosphere system. J. Atmos. Sol. -Terr. Phys. 2023, 253, 106157. [Google Scholar] [CrossRef]
  63. Somu, V.B.; Rakov, V.A.; Haddad, M.A.; Cumm, S.A. A study of changes in apparent ionospheric reflection height within individual lightning flashes. J. Atmosph. Sol. Terr. Phys. 2015, 136, 66–79. [Google Scholar] [CrossRef]
  64. Dorrian, G.; Fallows, R.; Wood, A.; Themens, D.R.; Boyde, B.; Krankowski, A.; Bisi, M.; Dąbrowski, B.; Vocks, C. LOFAR observations of substructure within a traveling ionospheric disturbance at mid-latitude. Space Weather 2023, 21, e2022SW003198. [Google Scholar] [CrossRef]
  65. Boyde, B.; Wood, A.; Dorrian, G.; Fallows, R.A.; Themens, D.; Mielich, J.; Elvidge, S.; Mevius, M.; Zucca, P.; Dabrowski, B.J. Lensing from small-scale travelling ionospheric disturbances observed using LOFAR. J. Space Weather Space Clim. 2022, 12, 34. [Google Scholar] [CrossRef]
  66. Pradipta, R.; Lai, P.-C. Observations of Ionospheric Disturbances Associated with the 4 August 2020 Port Beirut Explosion by DMSP and Ionosondes. ANGEO 2024, 42, 301–312. [Google Scholar] [CrossRef]
  67. Haken, H. Information and Self-Organization: A Macroscopic Approach to Complex Systems, 3rd ed.; Springer Nature: Dordrecht, The Netherlands, 2006. [Google Scholar] [CrossRef]
  68. Pulinets, S. The synergy of earthquake precursors. Earthq. Sci. 2011, 24, 535–548. [Google Scholar] [CrossRef]
  69. Wu, L.; Qi, Y.; Mao, W.; Lu, J.; Ding, Y.; Peng, B.; Xie, B. Scrutinizing and rooting the multiple anomalies of Nepal earthquake sequence in 2015 with the deviation–time–space criterion and homologous lithosphere–coversphere–atmosphere–ionosphere coupling physics. Nat. Hazards Earth Syst. Sci. 2023, 23, 231–249. [Google Scholar] [CrossRef]
  70. Potirakis, S.M.; Eftaxias, K.; Schekotov, A.; Yamaguchi, H.; Hayakawa, M. Criticality features in ultra-low frequency magnetic fields prior to the 2013 M6.3 Kobe earthquake. Ann. Geophys. 2016, 59, S0317. [Google Scholar] [CrossRef]
  71. Ouzounov, D.; Pulinets, S.; Davidenko, D.; Rozhnoi, A.; Solovieva, M.; Fedun, V.; Dwivedi, B.N.; Rybin, A.; Kafatos, M.; Taylor, P. Transient Effects in Atmosphere and Ionosphere Preceding the 2015 M7.8 and M7.3 Gorkha–Nepal Earthquakes. Front. Earth Sci. 2021, 9, 757358. [Google Scholar] [CrossRef]
  72. De Santis, A.; Perrone, L.; Calcara, M.; Campuzano, S.A.; Cianchini, G.; D’Arcangelo, S.; Di Mauro, D.; Marchetti, D.; Nardi, A.; Orlando, M.; et al. A comprehensive multiparametric and multilayer approach to study the preparation phase of large earthquakes from ground to space: The case study of the June 15 2019, M7.2 Kermadec Islands (New Zealand) earthquake. Remote Sens. Environ. 2022, 283, 113325. [Google Scholar] [CrossRef]
  73. Marchuk, G.I. Splitting and Alternating Direction Methods. In Handbook of Numerical Analysis, Vol. I. Finite Difference Methods (Part I)-Solution of Equations in R” (Part 1); Ciarlet, P.G., Lions, J.L., Eds.; Elsevier: Amsterdam, The Netherlands, 1990; pp. 203–462. [Google Scholar]
  74. Samarskii, A.A. The Theory of Difference Schemes; Marcel Dekker, Inc: New York, NY, USA, 2001; 761p, ISBN 0-8247-0468-1. [Google Scholar]
  75. MacGorman, D.R.; Rust, W.D.; Williams, E.R. The Electrical Nature of Storms; Oxford University Press: New York, NY, USA, 1998. [Google Scholar]
  76. Harrison, R.G.; Carslaw, K.S. Ion-aerosol-cloud processes in the lower atmosphere. Rev. Geophys. 2003, 41, 5536. [Google Scholar] [CrossRef]
  77. Van Eaton, A.; Behnke, S.; Lapierre, J.; Vagasky, C.; Schultz, C.; Pavolonis, M.; Bedka, K.; Khlopenkov, K. Lightning and volcanic plume data from the climactic eruption of Hunga Volcano, Tonga, in January 2022. Zenodo 2023, 50, e2022GL102341. [Google Scholar] [CrossRef]
  78. Al’pert, Y.L. Propagation of Electromagnetic Waves and the Ionosphere; Nauka: Moscow, Russia, 1972. (In Russian) [Google Scholar]
  79. Alperovich, L.S.; Fedorov, E.N. Hydromagnetic Waves in the Magnetosphere and the Ionosphere; Springer: Dordrecht, The Netherlands, 2007. [Google Scholar] [CrossRef]
  80. Jursa, A.S. (Ed.) Handbook of Geophysics and the Space Environment; Air Force Geophysics Lab.: Hanscom AFB, MA, USA, 1985. [Google Scholar]
  81. Kelley, M.C. The Earth’s Ionosphere Plasma Physics and Electrodynamics; Academic Press: Amsterdam, The Netherlands, 2009. [Google Scholar]
  82. Shokri, B.; Rukhadze, A.A. Electrodynamics of Conducting Dispersive Media; Springer: Berlin/Heidelberg, Germany, 2019. [Google Scholar] [CrossRef]
  83. Collin, R.E. Field Theory of Guided Waves; Wiley-IEEE Press: Hoboken, NJ, USA, 1991; ISBN 978-0879422370. [Google Scholar]
  84. Vainstein, L.A. Electromagnetic Waves; Moscow Izdatel Radio i Sviaz: Moscow, Russia, 1988. (In Russian) [Google Scholar]
  85. Chernogor, L.F. The Earth–Atmosphere–Geospace System: Main Properties and Processes. Int. J. Remote Sens. 2011, 32, 3199–3218. [Google Scholar] [CrossRef]
  86. Liu, J.Y.; Chang, F.Y.; Chen, Y.I.; Chang, L.C.; Wen, Y.C.; Wu, T.Y.; Chao, C.K. Pre-earthquake Ionospheric Anomalies and Ionospheric Storms Observed by FORMOSAT-5/AIP and GIM TEC. Surv. Geophys. 2023, 45, 577–602. [Google Scholar] [CrossRef]
  87. Gorbunova, E.M.; Ryakhovskiy, I.A.; Gavrilov, B.G.; Poklad, Y.V.; Petukhova, S.M.; Besedina, A.N. Variations in Geophysical Fields during the Tonga Volcanic Eruption According to the Data of the Mikhnevo Large-Scale Research Facility. Izv. Atmos. Ocean. Phys. 2022, 58, 1350–1366. [Google Scholar] [CrossRef]
  88. Surkov, V.; Hayakawa, M. Ultra and Extremely Low Frequency Electromagnetic Fields; Springer: Berlin/Heidelberg, Germany, 2014. [Google Scholar] [CrossRef]
  89. Senior, T.B.A.; Volakis, J.L. Approximate Boundary Conditions in Electromagnetics; IEEE Publishing: London, UK, 1995; ISBN 978-0852968499. [Google Scholar]
  90. Wait, J.R. Electromagnetic Waves in Stratified Media; McMillan: New York, NY, USA, 1979. [Google Scholar]
  91. Hayakawa, M. Earthquake Prediction with Radio Techniques. Wiley: Singapore, 2015; 294p. [Google Scholar]
  92. Jackson, J.D. Classical Electrodynamics, 3rd ed.; John Wiley & Sons: Hoboken, NJ, USA, 1998; ISBN 978-0471309321. [Google Scholar]
  93. Kong, J.A. Electromagnetic Wave Theory; John Wiley & Sons: New York, NY, USA, 1990; ISBN 978-0471522140. [Google Scholar]
  94. Dumaeva, L.V.; Ezaova, A.G. Numerical model return stroke of lightning. Fundam. Res. 2015, 9, 440–443. (In Russian) [Google Scholar]
  95. D’Arcangelo, S.; Regi, M.; De Santis, A.; Perrone, L.; Cianchini, G.; Soldani, M.; Piscini, A.; Fidani, C.; Sabbagh, D.; Lepidi, S.; et al. A multiparametric-multilayer comparison of the preparation phase of two geophysical events in the Tonga-Kermadec subduction zone: The 2019 M7.2 Kermadec earthquake and 2022 Hunga Ha’apai eruption. Front. Earth Sci. 2023, 11, 1267411. [Google Scholar] [CrossRef]
  96. Liu, J.-Y.; Chao, C.-K. An observing system simulation experiment for FORMOSAT-5/AIP detecting seismo-ionospheric precursors. Terr. Atmos. Ocean. Sci. 2017, 28, 117–127. [Google Scholar] [CrossRef]
  97. Namgaladze, A.A.; Zolotov, O.V.; Zakharenkova, I.E.; Shagimuratov, I.I.; Martynenko, O.V. Ionospheric total electron content variations observed before earthquakes: Possible physical mechanism and modeling. Proc. MSTU 2009, 12, 308–315. [Google Scholar]
  98. Kuo, C.L.; Huba, J.D.; Joyce, G.; Lee, L.C. Ionosphere plasma bubbles and density variations induced by pre-earthquake rock currents and associated surface charges. J. Geophys. Res. Space Phys. 2011, 116, A10317. [Google Scholar] [CrossRef]
  99. Madonia, P.; Bonaccorso, A.; Bonforte, A.; Buonocunto, C.; Cannata, A.; Carleo, L.; Cesaroni, C.; Currenti, G.; De Gregorio, S.; Di Lieto, B.; et al. Propagation of Perturbations in the Lower and Upper Atmosphere over the Central Mediterranean, Driven by the 15 January 2022 Hunga Tonga-Hunga Ha’apai Volcano Explosion. Atmosphere 2023, 14, 65. [Google Scholar] [CrossRef]
  100. Nickolaenko, A.P.; Koloskov, A.V.; Yampolsky, Y.M.; Budanov, O.V.; Shvets, A.A. Low-frequency (ELF–VLF) radio atmospherics study at the Ukrainian Antarctic Akademik Vernadsky station. Ukr. Antarct. J. 2019, 1, 116–127. [Google Scholar] [CrossRef]
  101. Nickolaenko, A.P.; Schekotov, A.Y.; Hayakawa, M.; Romero, R.; Izutsu, J. Electromagnetic manifestations of Tonga eruption in Schumann resonance band. J. Atmos. Sol.-Terr. Phys. 2022, 237, 105897. [Google Scholar] [CrossRef]
  102. Kubisz, J.; Gołkowski, M.; Ostrowski, M.; Młynarczyk, J.; Michalec, A. New Method for Determining Azimuths of ELF Signals Associated with the Global Thunderstorm Activity and the Hunga Tonga Volcano Eruption. J. Geophys. Res. Atmos. 2024, 129, e2023JD040318. [Google Scholar] [CrossRef]
  103. Rozhnoi, A.; Solovieva, M.; Parrot, M.; Hayakawa, M.; Biagi, P.-F.; Schwingenschuh, K.; Fedun, V. VLF/LF signal studies of the ionospheric response to strong seismic activity in the Far Eastern region combining the DEMETER and ground-based observations. Phys. Chem. Earth 2015, 85–86, 141–149. [Google Scholar] [CrossRef]
  104. Forte, B.; Fallows, R.A.; Bisi, M.M.; Zhang, J.; Krankowski, A.; Dabrowski, B.; Rothkaehl, H.; Vocks, C. Interpretation of radio wave scintillation observed through LOFAR radio telescopes. Astrophys. J. Suppl. Ser. 2022, 263, 36. [Google Scholar] [CrossRef]
  105. Rapoport, Y.; Grimalsky, V.; Petrishchevskii, S.; Grytsai, A.; Liashchuk, O.; Krankowski, A. Modelling Wave Structures in the Earth-Atmosphere-Ionosphere and Radiodiagnostics of Ionospheric Space Weather (ISW). In Proceedings of the International Conference on Recent Trends in Geoscience Research and Applications 2023, Belgrade, Serbia, 23–27 October 2023; pp. 11–12. [Google Scholar]
  106. Gurevich, A.V. Nonlinear Phenomena in the Ionosphere; Springer: New York, NY, USA, 1978; 372p. [Google Scholar]
  107. Kadomtsev, B.B. Collective Phenomena in Plasma; Nauka: Moscow, Russia, 1988; 304p. (In Russian) [Google Scholar]
  108. Zhima, Z.; Huang, J.; Shen, X.; Xia, Z.; Chen, L.; Piersanti, M.; Yang, Y.; Wang, Q.; Zeng, L.; Lei, J.; et al. Simultaneous Observations of ELF/VLF Rising-Tone Quasiperiodic Waves and Energetic Electron Precipitations in the High-Latitude Upper Ionosphere. J. Geophys. Res. Space Phys. 2020, 125, 5. [Google Scholar] [CrossRef]
  109. Zhao, S.; Zhou, C.; Shen, X.; Zhima, Z. Investigation of VLF Transmitter Signals in the Ionosphere by ZH-1 Observations and Full-Wave Simulation. J. Geophys. Res. Space Phys. 2019, 124, 4697–4709. [Google Scholar] [CrossRef]
  110. Lv, F.; Hu, Y.; Zhima, Z.; Sun, X.; Lu, C.; Yang, D. The upward propagating ionospheric hiss waves during the seismic time observed by the China seismoelectromagnetic satellite. Front. Astron. Space Sci. 2023, 10, 1127738. [Google Scholar] [CrossRef]
  111. Zhima, Z.; Yan, R.; Lin, J.; Wang, Q.; Yang, Y.; Lv, F.; Huang, J.; Cui, J.; Liu, Q.; Zhao, S.; et al. The Possible Seismo-Ionospheric Perturbations Recorded by the China-Seismo-Electromagnetic Satellite. Remote Sens. 2022, 14, 905. [Google Scholar] [CrossRef]
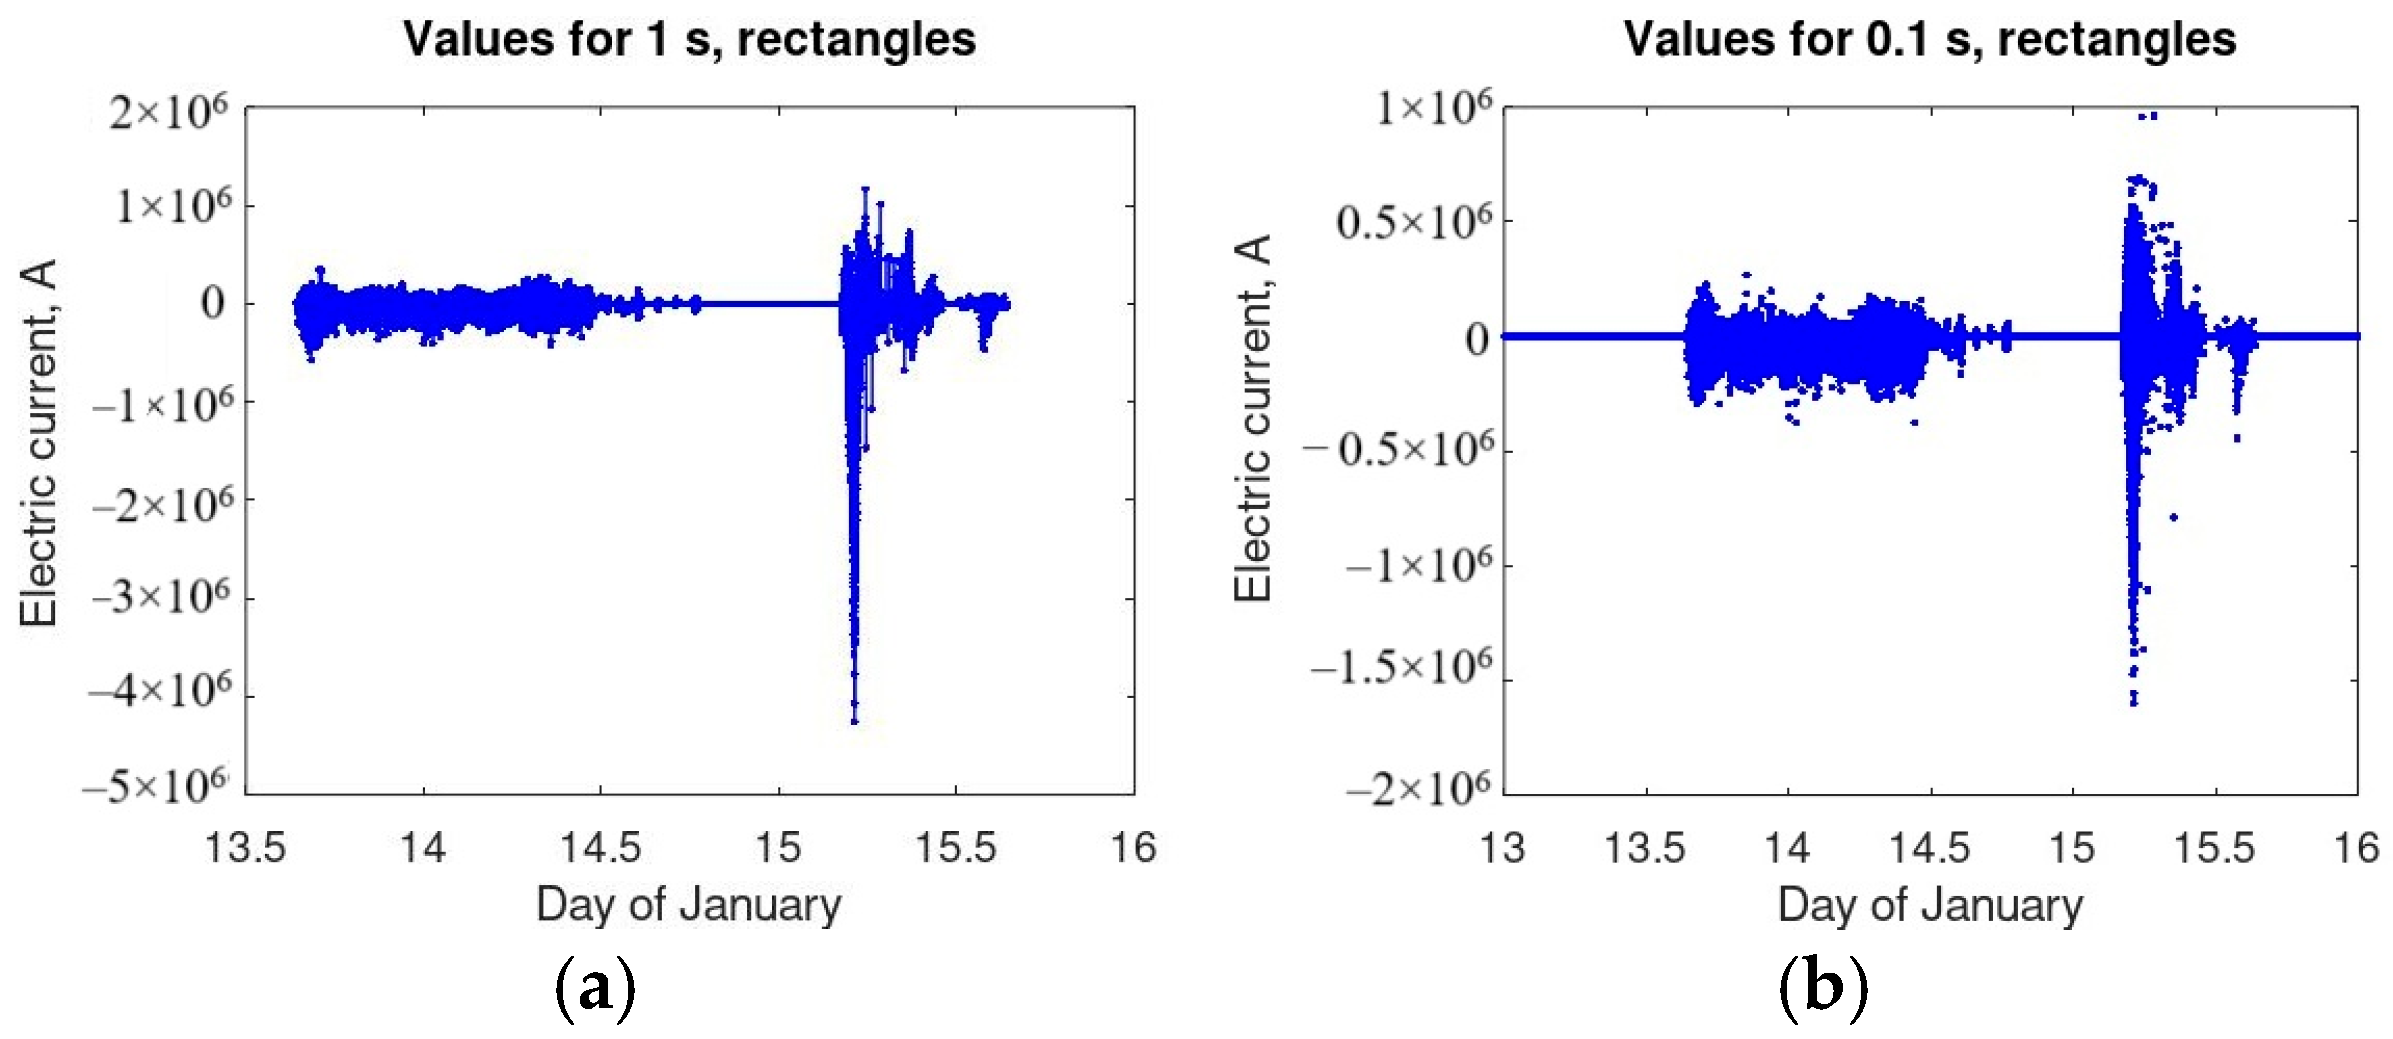
Figure 1. Electric current in the vicinity of the Hunga Tonga eruption, measured on 13–15 January 2022 (UTC). Time steps of (a) 1 s and (b) 0.1 s are considered.
Atmosphere 16 00097 g001
Figure 2. Spectral features of Hunga Tonga lightning on 13–15 January 2022 (UTC). Ultra-low frequencies f < 1 Hz are presented with the plots in (a) linear and (b) logarithmic scale.
Atmosphere 16 00097 g002
Figure 3. The spectra of electric current variations in the ranges (a) of tens of Hz, ELF (blue color—window 50 s, green color—window 500 s), and (b) tens of thousands Hz, VLF (window 1 s).
Atmosphere 16 00097 g003
Figure 5. Geometry of the problem: Penetration of EM fields excited by an external current source of ULF range through LEAIM. In 0 z L z and L z z z max regions, the quasi-stationary and dynamic approaches are used, respectively. There is radiation from the boundary z = z max into the magnetosphere region z > z max . θ is the angle between the geomagnetic field H 0 and vertical axis OZ. The height z = Lz is about 70–120 km. The coordinate frame, where the coordinates are denoted with primes, relates to the geomagnetic field; the coordinates of the laboratory frame are denoted without primes. Directions of the X and Y axes correspond to meridional and longitudinal directions, respectively.
Atmosphere 16 00097 g005
Figure 6. Parameters of the ionosphere used in simulations. Part (a) is the electron concentration, (b) is the ion-to-electron mass ratio, (c) is the electron collision frequency, (d) is the ion collision frequency. Curves 1 (black) and 2 (red) are the daytime and nighttime parameters, respectively. The data were taken from [78,79,80,81].
Atmosphere 16 00097 g006
Figure 7. The simulated ULF tensor impedance components of the ionosphere. The frequency is ω = 0.01 s−1 (f ≈ 1.6 × 10⁻³ Hz). Curve 1 is |Z11|, 2 is |Z12|, 3 is |Z21|, 4 is |Z22|, Curve 5 is the estimated relative error of simulations of the dynamic equations. Part (a) is for nighttime, (b) is for daytime (kx = ky = 0).
Atmosphere 16 00097 g007
Figure 8. The distributions of the electric field |Ex(x,y)| generated by ULF current sources at different frequencies at the height z = 200 km. The parameters of the ionosphere correspond to the nighttime. Panel (a) corresponds to the frequency ω = 0.001 s−1 (f ≈ 1.6 × 10⁻⁴ Hz), (b) is at 0.01 s−1 (f ≈ 1.6 × 10⁻³ Hz), the combined simulations only. Panels (c,d) are for the frequency ω = 0.025 s−1 (f ≈ 0.004 Hz), simulated by both the direct dynamic and combined approaches; panels (e,f) are the same as (c,d), but at ω = 0.05 s−1 (f ≈ 0.008 Hz). The center of the current source is at x = y = 1500 km, and the angle between the vertical direction and geomagnetic field is θ = 30°.
Atmosphere 16 00097 g008aAtmosphere 16 00097 g008b
Figure 9. The nighttime distributions |Ex,y,z(x,y)| (left, central, and right panels) with all their frequency components for ω ≤ 0.01 s−1 (ω2πf) summed up, mV/m units. The source amplitude is j0 = 4.7 × 10⁻⁷ A/m2. Matching the quasi-stationary and dynamic problems is at z = 75 km. The altitude from z = 80 km to z = 200 km. The center of the current source is at x = y = 1500 km, and the angle between the vertical direction and geomagnetic field is θ = 30°.
Atmosphere 16 00097 g009
Figure 10. The nighttime distributions |Ex,y,z(x,y)| (left, central, and right panels) with all their frequency components for ω ≤ 0.01 s−1 (ω2πf) summed up, mV/m units. The source amplitude is j0 = 4.7 × 10⁻⁷ A/m2. Matching the quasi-stationary and dynamic problems is at z = 75 km. The altitude z = 200 km. The center of the current source is at x = y = 1500 km, and the angle between the vertical direction and geomagnetic field is θ = 50°.
Atmosphere 16 00097 g010
Figure 11. Magnetic field components |Hx| (a,d), |Hy| (b,e), |Hz| (c,f), excited by Hunga Tonga total ULF lightning current source (see Section 3), on x, y at altitudes z = 80 km (ac) and z = 200 km (df). The units are nT. The center of the current source is at x = y = 1500 km, and the angle between the vertical direction and geomagnetic field is θ = 30°.
Atmosphere 16 00097 g011
Figure 12. Planar model of excitation of eigenmodes in the Schumann resonator (SR) by external ELF current connected with the Hunga Tonga eruption. Radiation of EM waves into the upper ionosphere is taken into account (see arrows in the Figure at the boundary z = zmax). SR is presented as a one period L of a periodical system. SR occupies the altitude region 0 z L z . Radiation conditions are formulated at the altitude z = z max . j e x t = j e x t ( ω , x , y , z ) is the external current source, in particular lightning current associated with the Hunga Tonga volcano eruption.
Atmosphere 16 00097 g012
Figure 13. The dependencies of the components of the permittivity in ELF range at ω = 47.1 s−1 (f = 7.50 Hz). Panel (a) is the daytime, (b) is the nighttime. The ionosphere parameters correspond to Figure 6 [78,79,80,81].
Atmosphere 16 00097 g013
Figure 14. Excitation of the SR by ELF effective Hunga Tonga current source taken from Figure 3a. The used model of SR is a planar waveguide with radiative upper boundary conditions at the magnetosphere; effective periodical boundary conditions are applied in the horizontal (X, Y) directions with the period L = 2πRE; daytime, z = 0, θ = 30°; ω = 46.5 s−1 (f = 7.40 Hz). Panel (a) is |Ez|, (b) is |Hx|, (c) is |Hy|.
Atmosphere 16 00097 g014
Figure 15. Excitation of SR by ELF effective Hunga Tonga current source taken from Figure 3a, the 1st Schumann mode. Daytime; ω = 47.1 s−1 (f = 7.50 Hz), θ = 30°; z = 0 (ac) and z = 200 km (df).
Atmosphere 16 00097 g015
Figure 16. Excitation of SR by ELF effective Hunga Tonga current source taken from Figure 3a, the 1st Schumann mode. Nighttime; θ = 30°; ω = 47.1 s−1 (f = 7.50 Hz); z = 0 (ac) and z = 200 km (df). The narrow peak in the center of the figure (a), as well as in Figure 14a and Figure 15a, and in Figure 17b, Figure 18b and Figure 19d, presented in the section below, is associated with the current source effect.
Atmosphere 16 00097 g016
Figure 17. Comparison of the dependencies of the vertical component of the ELF electric field near the maximum in the spherical geometry |Er(r = RE)|, panel (a), and the local plane geometry |Ez(x, y, z = 0)|, panel (b). Panel (b) corresponds to Figure 16a, near the maximum of the electric field. Panel (c) is the cross-section of Earth where the correspondence between the distances ρ and ρ ˜ is seen. Panel (d) is the view from above. The curvilinear axes X ˜ , Y ˜ are projected to the Cartesian ones X, Y in this view.
Atmosphere 16 00097 g017
Figure 18. Excitation of SR by ELF effective Hunga Tonga current source taken from Figure 3a, the 1st Schumann mode. Nighttime; θ = 45°; z = 0, ω = 47.1 s−1 (f = 7.50 Hz). Panel (a) is |Ez|, (b) is |Hx|, (c) is |Hy|.
Atmosphere 16 00097 g018
Figure 19. Excitation of SR by ELF effective Hunga Tonga current source taken from Figure 3a. Daytime; θ = 30°; z = 0; ω = 70.1 s−1 (f = 11.2 Hz) (ac) and the 2nd Schumann mode ω = 94.2 s−1 (f = 15.0 Hz) (df).
Atmosphere 16 00097 g019
Figure 20. ELF eigenmodes of coupled Schumann resonator–ionospheric Alfvén resonator (CSIAR). Almost transverse magnetic mode. Daytime, θ = 30°, |Ex,y,z(z)| (a,c,e), |Hx,y,z(z)| (b,d,f). The 1st (a,b), 2nd (c,d), and 3rd (e,f) modes are presented in the vicinity of the 1st Schumann resonance mode. Their frequencies are ω1 = 47.94 + 3.653i, ω2 = 41.56 + 6.076i, and ω3 = 30.69 + 2.383i, in s−1. Only the modes with ω″/ω′ < 0.25 are presented.
Atmosphere 16 00097 g020aAtmosphere 16 00097 g020b
Figure 21. The same as in Figure 20, |Ex,y,z(z)| (a,c,e), |Hx,y,z(z)| (b,d,f), but θ0 = 40°. The frequencies are ω1 = 46.53 + 4.54i, ω2 = 43.21 + 5.35i, and ω3 = 30.48 + 2.60i, in s−1.
Atmosphere 16 00097 g021aAtmosphere 16 00097 g021b
Figure 22. The same as in Figure 20, |Ex,y,z(z)| (a,c,e), |Hx,y,z(z)| (b,d,f), but θ0 = 50°. The frequencies are ω1 = 43.63 + 5.59i, ω2 = 42.99 + 5.07i, and ω3 = 30.31 + 3.58i, in s−1.
Atmosphere 16 00097 g022
Figure 23. VLF in WGEI and leaking from WGEI into the upper ionosphere–magnetosphere. The tensor impedance method [89] has been developed in [56] and applied for simulating the propagation of electromagnetic beams in a multi-layered/inhomogeneous WGEI. The isotropic medium is at 0 < z < LISO, LISO < Lz, where LISO = 60–70 km, Lz = 80–120 km. Anisotropic/gyrotropic media are at LISO < z < zmax (zmax ≤ 1000 km). The covering layer occupies the region Lz < z < zmax. WGEI [90,91] includes the isotropic region 0 < z < LISO and anisotropic region Lz < z < zmax. At the upper boundary of the covering layer (z = zmax), the radiation of EM waves into the external region (z > zmax) is accounted for by applying radiative boundary conditions. In the region Lz < z < zmax, both the VLF EM waves leaking from the WGEI and propagating upward in a positive z direction and reflected EM waves propagating in a negative z-direction are taken into account. In the region z > zmax, where the upper ionosphere/magnetosphere is placed, the medium is considered as slowly varying, so the reflection of VLF EM waves downwards is neglected, and only EM waves radiated upwards are accounted for.
Atmosphere 16 00097 g023
Figure 24. Typical modes in the planar waveguide model: (a,b) two lower modes of a model planar waveguide [83,84,93] with the ideally conductive upper boundary placed at z = 60 km; (c,d) 1st and 2nd modes of a realistic WGEI, where any “effective upper waveguide boundary” is not prescribed, and the upper boundary condition is radiative in the upper ionosphere at z = 800 km. (e) Exponential factor characterizing field losses at the distance of 1000 km. The normalized absolute values of the field components are shown.
Atmosphere 16 00097 g024
Figure 25. Propagation of the two lowest VLF modes in the WGEI; the angle between the vertical direction and geomagnetic field is θ = 30°. Panels (ae) are for ω = 2.5 × 10⁵ s−1 (f ≈ 4 × 10⁴ Hz); daytime; (fi) are for ω = 1 × 10⁵ s−1 (f ≈ 1.6 × 10⁴ Hz); nighttime. Panels (a,b,f,g) show the distributions of |Ex,y,z(z)|, |Hx,y,z(z)| (curves 1, 2, 3) correspondingly, for the 1st mode; panels (c,d,h,i) show the distributions for the 2nd mode. Panel (e) shows the frequency dependence of the wave losses for the 1st and 2nd modes (Curves 1 and 2, respectively) for daytime.
Atmosphere 16 00097 g025
Figure 26. Dependence of the permittivity tensor components for the ionosphere on the altitude z. The frequency is ω = 105 s−1 (f ≈ 1.6 × 10⁴ Hz). Curves 1, 2, 3 are |ε1|,|ε3|,|εh|, daytime; 4, 5, 6 are for nighttime. The ionospheric parameters correspond to Figure 6 [78,79,80,81].
Atmosphere 16 00097 g026
Figure 27. Propagation and field distributions in WGEI. Spatial field structure for the transversally magnetic beam at the distances from the input of the system x = 0, part (a), and x = 1000 km, parts (b,c). In (a,b), there are |Hy| distributions, and in c, there is |Ey| one. The fields are in CGS. If we assume that the maximum of the electric field is 1 mV/m, then the magnetic field in Figure 27c is 0.03 nT (the problem is linear).
Atmosphere 16 00097 g027
Figure 28. Determination of optimal parameters for propagation in WGEI of VLF modes excited by model lightning discharge [63,94]; (a,b) time dependence of the lightning source current normalized to the maximum value and spectral current density, respectively; (c) frequency dependence of the absorption coefficient of VLF waves in WGEI, daytime; (d) frequency dependence of the transmission coefficient of VLF waves in WGEI (see characteristics shown in (a,b)). (e) Transmission coefficient for VLF waves in WGEI, obtained for VLF current source spectrum (Figure 3b) from LCSHTE.
Atmosphere 16 00097 g028
Table 1. Frequencies and quality factors corresponding to the two lowest Schumann resonant modes excited by the Hunga Tonga volcano eruption, in accordance with the set of published results of the observations (estimated by order of values from figures given in the corresponding papers).
Mode 1, HzMode 2, HzQ-Factor, Mode 1Q-Factor, Mode 2
1. Koloskov et al., 2023 [12]7.51459
2. Bór et al., 2023 [6]7.51457
3. Mezentsev et al., 2023 [13]7.514610
4. Chandrasekhar et al., 2023 [11]7.513.51010
5. Gavrilov at al., 2022 [14]7.514614
6. Nickolaenko et al., 2022 [101]7.814.1913
7. D’Arcangelo et al., 2022 [95]81467
8. Shvets et al., 2024 [57]7.813.858
9. Kubish et al., 2023 [102]81457
Disclaimer/Publisher’s Note: The statements, opinions and data contained in all publications are solely those of the individual author(s) and contributor(s) and not of MDPI and/or the editor(s). MDPI and/or the editor(s) disclaim responsibility for any injury to people or property resulting from any ideas, methods, instructions or products referred to in the content.