Article

Investigation of Vertical Profiles of Particulate Matter and Meteorological Variables up to 2.5 km in Altitude Using a Drone-Based Monitoring System

1
Department of Mechanical Engineering, Hanyang University, 55 Hanyangdaehak-ro, Sangnok-gu, Ansan 15588, Republic of Korea
2
Korea Conformity Laboratories, Jincheon 27872, Republic of Korea
3
Department of Environmental Engineering, Inha University, 100 Inha-ro, Michuhol-gu, Incheon 22212, Republic of Korea
4
Particle Pollution Research and Management Center, Inha University, Incheon 21999, Republic of Korea
5
Program in Environmental and Polymer Engineering, Graduate School of Inha University, Incheon 22212, Republic of Korea
*
Authors to whom correspondence should be addressed.
Atmosphere 2025, 16(1), 93; https://doi.org/10.3390/atmos16010093
Submission received: 9 December 2024 / Revised: 13 January 2025 / Accepted: 13 January 2025 / Published: 16 January 2025
(This article belongs to the Special Issue Cutting-Edge Developments in Air Quality and Health)

Abstract

:
In this study, a drone-based measurement system equipped with miniaturized optical and condensation particle counters was deployed to investigate the vertical distribution of particulate matter and meteorological variables up to 2.5 km in altitude. Measurements captured at various altitudes demonstrated notable vertical variations in particle concentration and significant correlations with meteorological factors, particularly relative humidity (RH). Near the surface, within a well-mixed boundary layer, particle concentrations remained stable despite RH changes, indicating both anthropogenic and natural influences. At higher altitudes, a clear positive relationship between RH and particle number concentration emerged, particularly for smaller particles, while temperature inversions and distinct wind patterns influenced aerosol dispersion. The unmanned aerial vehicle system’s robust performance, validated against standard meteorological tower data, underscores its potential for high-resolution atmospheric profiling. These insights are crucial for understanding particle behavior in diverse atmospheric layers and have implications for refining air quality monitoring and climate models. Future work should incorporate chemical analysis of aerosols to further expand these findings and assess their environmental impact.

1. Introduction

Atmospheric particulate matter (PM) plays a pivotal role in shaping air quality, public health, ecosystems, and climate dynamics, underscoring the importance of its accurate characterization in environmental science [1,2]. Among the various PM fractions, fine particles (PM2.5) are of particular concern due to their ability to penetrate deep into the human respiratory and circulatory systems, significantly increasing the risk of cardiovascular and respiratory diseases [3]. According to the World Health Organization, millions of premature deaths worldwide are attributed annually to ambient air pollution, with PM2.5 exposure linked to conditions such as stroke, heart disease, and lung cancer [4]. As a result, understanding the sources, behavior, and mitigation of PM2.5 is critical for protecting public health and addressing broader environmental challenges.
Traditional ground-based monitoring networks offer a predominantly near-surface perspective of particle concentration and composition. However, these measurements often fail to capture the vertical complexity of the atmosphere, where aerosol properties can vary significantly with altitude due to changes in temperature, humidity, atmospheric stability, and wind patterns [5]. Even within a few hundred meters above ground level, aerosols can undergo dynamic changes driven by meteorological factors and turbulent mixing processes. Ignoring these vertical gradients may lead to an underestimation of human exposure in regions affected by poorly mixed boundary layer conditions or temperature inversions [6,7]. Under such conditions, pollutants can either accumulate near the surface, forming localized hotspots, or be transported aloft, contributing to regional and long-range pollution episodes [8,9]. Understanding these vertical distributions has become increasingly critical, as they play a pivotal role in determining aerosol interactions with solar radiation, their effectiveness as cloud condensation nuclei, and their impact on precipitation patterns. Accurate vertical profiling enhances the ability to model atmospheric chemistry and physics more reliably and supports the development of targeted mitigation strategies to address pollution across different altitudinal layers [10].
Over the past decades, various observational platforms have been employed to assess aerosol presence and behavior above ground level, each with its own strengths and limitations. Aircraft-based field campaigns have provided invaluable insights by enabling in situ sampling across multiple altitudes, revealing critical information on long-range pollutant transport, vertical layering, and aerosol mixing states [11,12,13]. However, the high operational costs, logistical challenges, and limited temporal coverage of piloted aircraft restrict the frequency and spatial representativeness of such measurements [14]. Balloon-borne instruments, including tethered balloons and radiosondes equipped with aerosol sensors, offer a more economical alternative for probing aerosol vertical structures [15,16]. Despite their affordability, these systems are constrained by limited altitude control and positional instability, which can compromise data reliability under variable wind conditions or when precise sampling strategies are required [17]. Remote sensing techniques, such as lidar and satellite observations, have significantly expanded the scope of aerosol monitoring by providing large-scale and long-term data [18,19]. Lidar systems can detect vertical backscatter profiles and isolate aerosol layers [20], while satellites offer global coverage, revealing seasonal and interannual variability in aerosol trends [21]. Nevertheless, these approaches are often hindered by retrieval uncertainties, limited vertical resolution, and challenges in identifying aerosol species, particularly in environments with high humidity or cloud cover [21]. Recognizing these constraints, the scientific community has increasingly turned to unmanned aerial vehicles (UAVs), such as drones, as a versatile and cost-effective solution for upper air aerosol measurements [22]. UAVs offer exceptional deployment flexibility, enabling frequent flights over specific regions and vertical ascents into atmospheric layers that are difficult to access with traditional methods [23]. By bridging the gap between the sparse yet detailed data from aircraft campaigns and the broad but less resolved data from remote sensing techniques, UAVs offer a promising approach for advancing the understanding of aerosol dynamics across different atmospheric layers.
UAV-based measurement systems have greatly benefited from advancements in sensor miniaturization, enabling the integration of optical particle counters and condensation particle counters into compact payloads [24]. Equipped with these instruments, UAVs can simultaneously measure particle number concentrations, size distributions, and key meteorological variables, including temperature, relative humidity (RH), wind speed, and wind direction [25]. By correlating aerosol properties with meteorological parameters, researchers have uncovered how factors like RH influence aerosol hygroscopic growth and phase transitions, thereby altering particle morphology and radiative properties. Several studies have shown that as UAVs ascend beyond the well-mixed boundary layer, distinct aerosol layers emerge, each exhibiting unique concentration levels and particle size distributions [26,27]. These findings highlight the non-uniform vertical structure of the atmosphere, where phenomena such as temperature inversions and shifting wind patterns can result in localized pollutant accumulations or facilitate long-range pollutant transport. Additionally, UAV-based platforms excel in capturing short-term variability in aerosol concentrations, providing rapid responses to changes in emission sources or meteorological conditions [28,29]. Despite these advantages, UAV-based measurements face several challenges. Limited flight endurance, primarily dictated by battery capacity and payload weight, can constrain the achievable altitude range and sampling duration, necessitating strategic flight planning to optimize data quality and coverage. Furthermore, regulatory frameworks governing UAV operations often impose restrictions on flight altitude, location, and time, requiring close coordination with authorities to ensure compliance [30]. Ensuring data accuracy is critical, necessitating regular sensor calibration and validation against established references, such as meteorological towers or laboratory-grade instrumentation, to maintain consistency with traditional datasets [31]. Overcoming these limitations presents significant potential to advance the understanding of aerosol vertical distributions and improve the accuracy of atmospheric modeling, ultimately supporting more effective strategies for air quality management and climate research.
In this study, a UAV-based measurement system designed to investigate the vertical distributions of PM and associated meteorological variables up to 2.5 km in altitude is presented. Miniaturized optical and condensation particle counters were integrated into a UAV platform, and meteorological parameters were validated against a standard meteorological tower to ensure robust and reliable observations. This system enables the precise capture of fine-scale vertical aerosol profiles while concurrently documenting changes in temperature, relative humidity (RH), wind speed, and wind direction. These measurements provide critical insights into how aerosol concentrations correlate with key meteorological drivers beyond the well-mixed boundary layer. Such insights are essential for refining atmospheric models that rely on accurate vertical inputs, improving predictions related to pollutant dispersion, cloud formation, and radiative forcing. Furthermore, the findings provide valuable guidance for policymakers in developing air quality management strategies that consider altitude-dependent variations in PM. By demonstrating the feasibility and advantages of UAV-based vertical profiling, this study establishes a promising pathway for advancing aerosol research. Expanding this approach to include aerosol chemical speciation, the use of data assimilation techniques, or the integration of UAV-based measurements with satellite retrievals and ground-based observations could further enhance the understanding of atmospheric processes. Ultimately, advancing UAV-based aerosol research bridges critical knowledge gaps, supports the development of more effective environmental policies, guides mitigation efforts, and helps safeguard both public health and global climate integrity.

2. Methods

2.1. Particle Measurement Instruments

In this study, the concentrations of atmospheric particles were measured using a UAV equipped with a miniaturized optical particle counter (mini-OPC) for particles in the size range of 0.3 μm < dp < 2.5 μm and a condensation particle counter (mini-CPC) for particles larger than 3 nm, both developed at Hanyang University, South Korea. Figure S1a,b in the Supplementary Material show the mini-OPC and mini-CPC, respectively. The dimensions of the mini-OPC and mini-CPC are 80 × 40 × 40 mm and 80 × 50 × 180 mm, with weights of 230 g and 547 g, respectively. These instruments are significantly more compact and lightweight compared to commercial particle measurement devices typically used in aerosol research. The mini-OPC stores concentration data with a time resolution of 1 s and operates at an inlet flow rate of 1.0 L/min, measuring particle number concentrations across three size channels: 0.3–0.5 μm, 0.5–1.0 μm, and 1.0–2.5 μm. The mini-CPC, with a cut-off size of approximately 3–4 nm [31], also operates at a time resolution of 1 s and an inlet flow rate of 0.12 L/min. Both instruments have been widely used in drone-based aerosol research, with their performance validated in diverse applications across multiple studies [24,25]. To ensure measurement accuracy and minimize potential errors, both the CPC and OPC were calibrated twice during each measurement day: prior to the first flight and after the final flight. These calibrations were conducted using commercial CPC (TSI Inc., Shoreview, MN, USA) and OPC (Grimm Aerosol Technik, Hamburg, Germany) instruments to verify consistency and detect any deviations from expected performance. The images of the OPC and CPC and the calibration systems for both counters used in this study are presented in Figure S1.

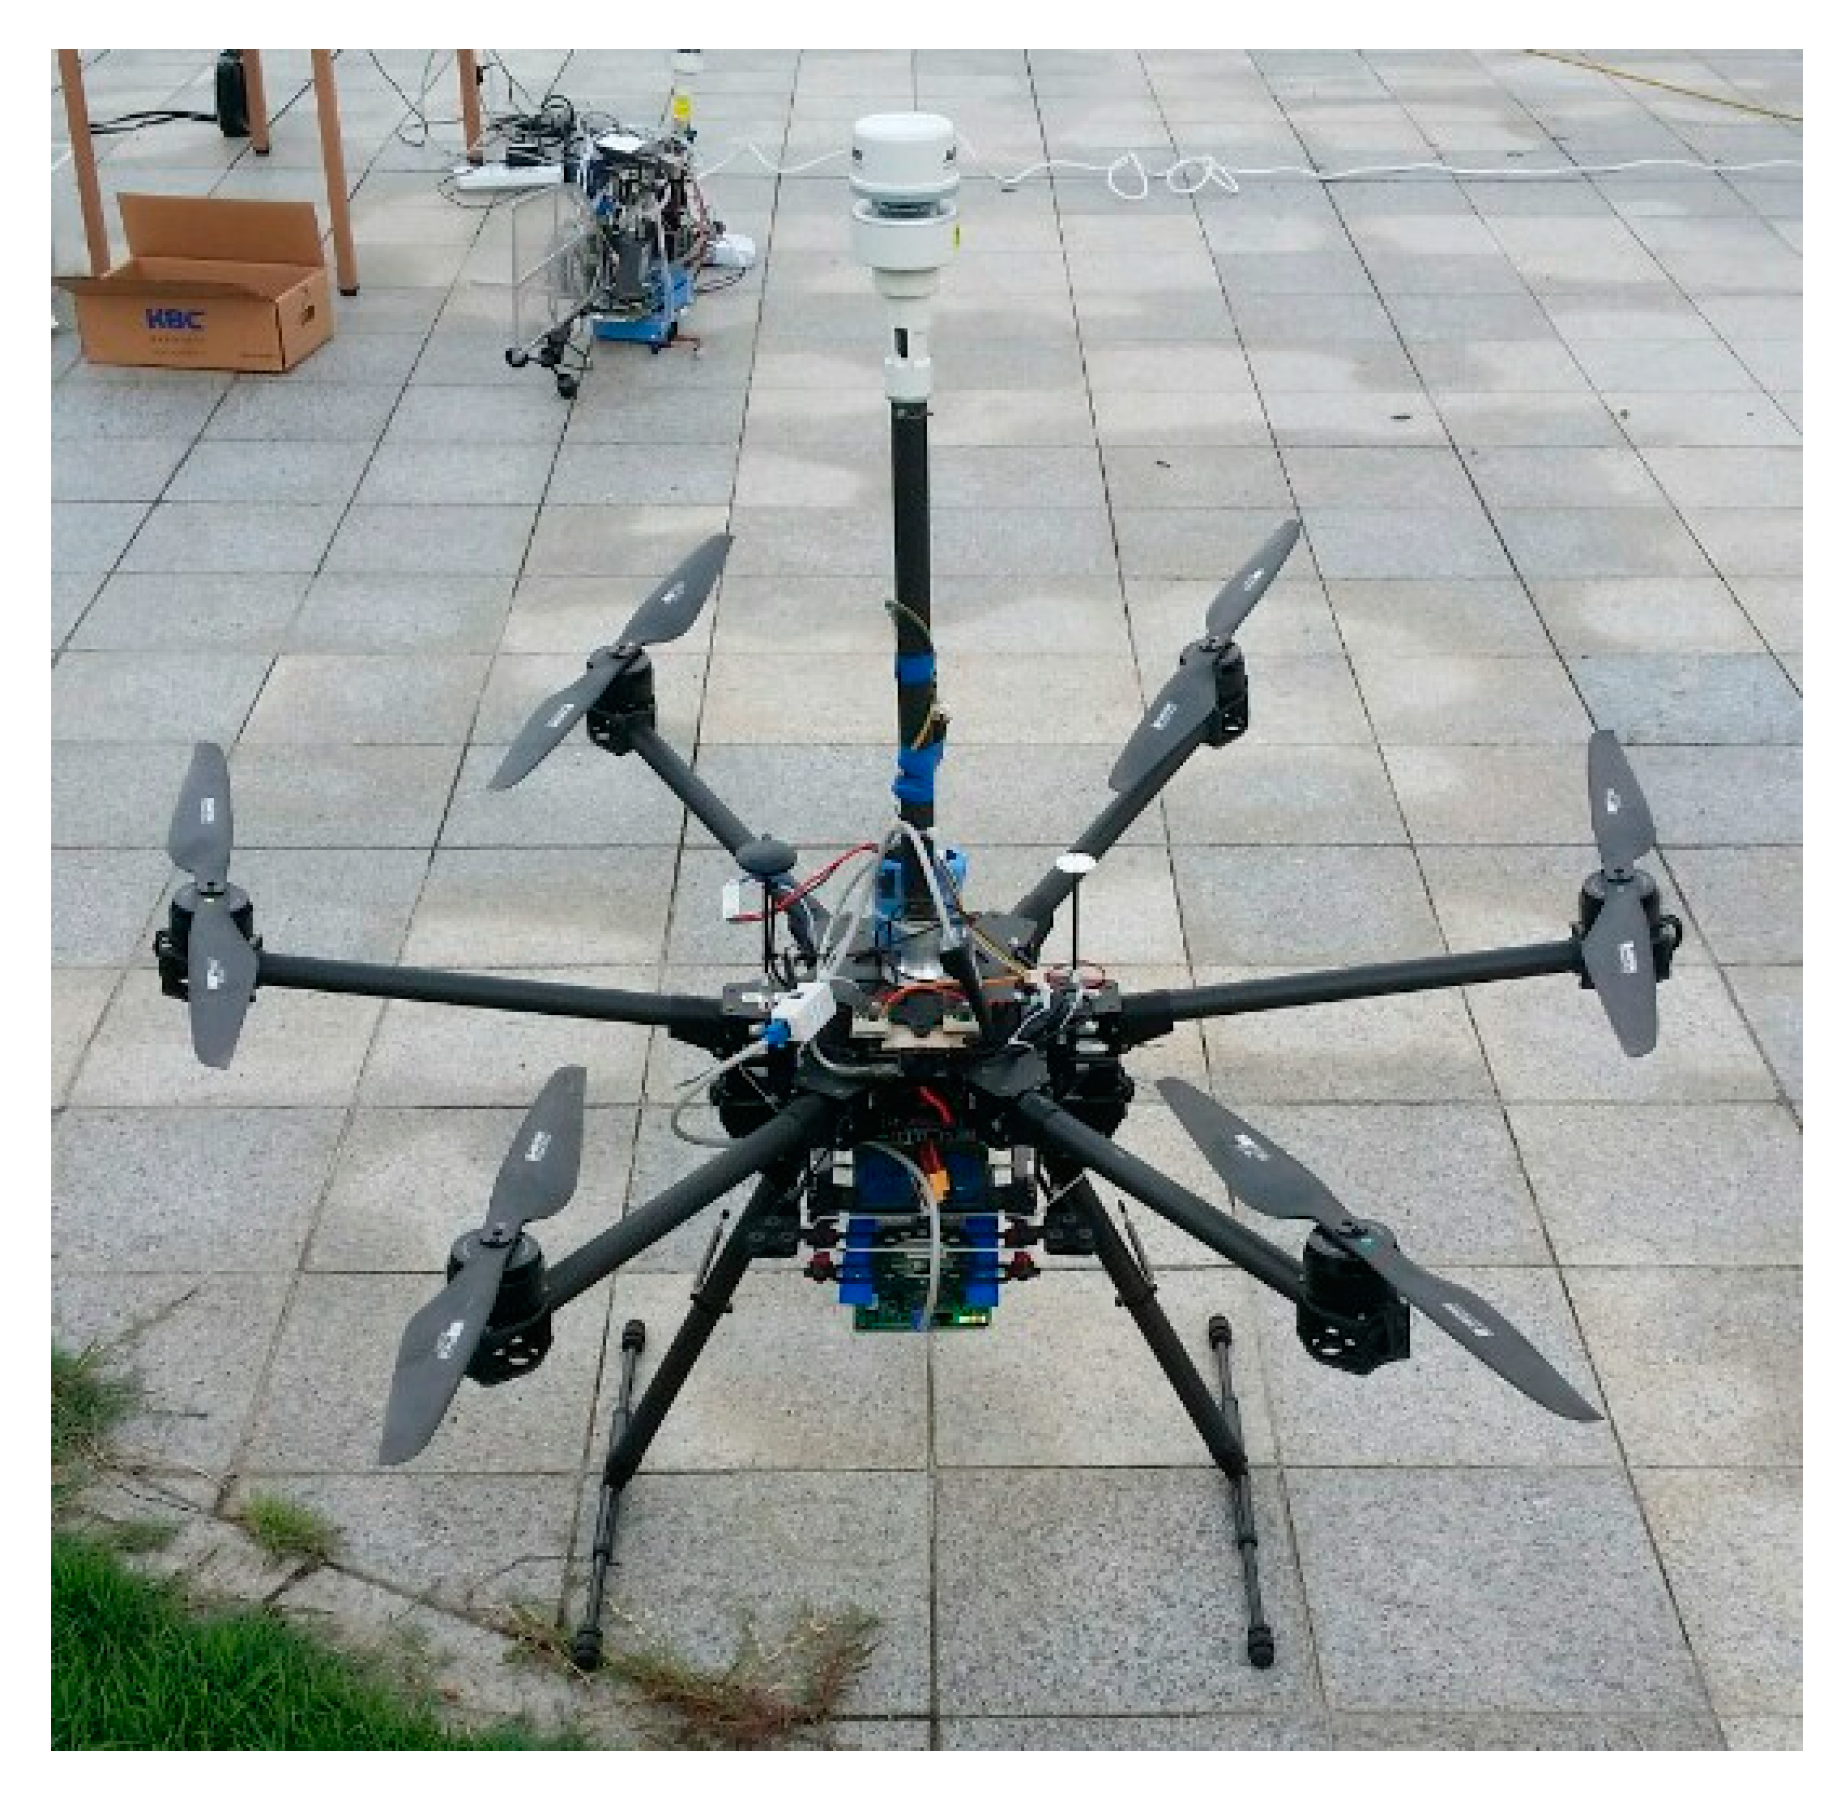
2.2. Unmanned Aerial Vehicle (UAV) System

A UAV system consisting of a hexacopter (3S TECH, Seoul, Republic of Korea) (Figure 1) and an array of sensors was utilized to measure particle number concentration, wind speed (WS), wind direction (WD), ambient temperature (T), and relative humidity (RH). Flight altitudes were monitored using a global positioning system (GPS). Prior to deployment, the WS-WD and T-RH sensors (model FT742, FT Technologies, UK; model SHT85, Sensirion, Stäfa, Switzerland) were calibrated at the Korea Meteorological Institute and the Korea Laboratory Accreditation Scheme, respectively, to ensure measurement accuracy. It should be noted that during drone-based measurements, propeller-induced airflow can significantly influence data accuracy if not properly managed. To minimize this effect, the aerosol sampling inlet was positioned 60 cm above the hexacopter’s rotors, where the airflow is more diffused, and the velocity is lower due to three-dimensional intake dynamics. This strategic positioning effectively reduces measurement disturbances and ensures reliable data collection. The entire instrument package, including the aerosol sensors, was controlled using a wireless remote-control module, allowing precise management of the sampling process throughout the flight.
To ensure the accuracy of all sensors (WS, WD, T, and RH), comprehensive sensor performance evaluations were conducted, with details of the evaluation methods presented in the following section. Accurate operation of the UAV is also critical, particularly when carrying a loaded payload, as imbalance can lead to crashes. To mitigate this risk, an automatic takeoff and landing system was employed, reducing the likelihood of accidents caused by operator error. Additionally, prior to field measurements, a series of safety tests were performed, including wind tunnel tests, motor failure simulations, GPS signal loss scenarios, geo-fencing, and night flight tests, ensuring safe and reliable UAV operations.

2.3. Measurement Site and Strategies

2.3.1. Meteorological Profiles

To ensure the accuracy of the test sensors for measuring wind speed (WS), wind direction (WD), ambient temperature (T), and relative humidity (RH) in the UAV system, tests were conducted at a meteorological tower located in Boseong (34°45′49.1″ N, 127°12′44.6″ E), South Korea (Figure S2a in Supplementary Material). The Boseong meteorological tower, administered by the Korea Meteorological Administration, is a standard weather observatory with a height of 307 m. It is equipped with meteorological sensors installed at 10 altitudes: 20, 40, 60, 80, 100, 140, 180, 220, 260, and 300 m. Each measurement location is equipped with a thermo-hygrometer (model 5628, Fluke, Washington, WA, USA; model HMP155, Vaisala, Vantaa, Finland) and a two-dimensional ultrasonic anemometer (model UA-2D, Thies Clima, Hamburg, Germany; model 05103, R. M. Young, Traverse City, MI, USA). The UAV system, carrying a meteorological sensor package, was operated approximately 30 m away from the tower (Figure S2b) to ensure safety and avoid interference from the tower’s structure. The drone hovered at each altitude for 90 s to collect at least one minute of stable data while optimizing the total flight duration. At each altitude, reference meteorological sensors on the tower measured temperature, RH, WS, and WD, providing benchmark data for comparison with the UAV sensor measurements.

2.3.2. Vertical Profiles of Particulate Matter

The flight was conducted during the summer season at the Korea Global Atmosphere Watch Observatory (36°32′18.9″ N, 126°19′48.2″ E) to investigate the vertical profiles of particle concentration (0.3 μm < dp < 2.5 μm and dp > 3 nm) and meteorological parameters up to approximately 1000 m above sea level (a.s.l.). The observatory, located on a hill at 50 m a.s.l. in Anmyeondo, South Korea (marked in Figure S2a), is situated in a remote area, distant from major cities. The first and second flights were carried out in the afternoon to capture daytime variations in aerosol and meteorological profiles. Additionally, another test was conducted during the winter season in Boseong, South Korea (Figure S2a), to explore variations in particle concentration (0.3 μm < dp < 2.5 μm) and its relationship with meteorological factors at higher altitudes, reaching up to 2500 m a.s.l. This test spanned nearly a full day, with measurements taken between early morning and late evening. The UAV system was launched almost every hour during the test period, with some intervals excluded, to observe diurnal variations in the measurement data. The ascent and descent speeds of the drone were both set to 4 m/s during operation.

3. Results and Discussion

3.1. Evaluation of Sensor Performance

Figure 2 shows a comparison of meteorological parameters obtained from the UAV system and the Boseong meteorological tower at different altitudes. The overall trends and average values of the meteorological data were consistent between the tower-based and UAV-based measurements; however, some discrepancies were observed, likely due to the 30 m horizontal distance between the tower and the UAV’s measurement location. Additionally, slight differences in temperature and humidity readings may have resulted from the placement of the sensor package on the UAV, which could have influenced sunlight exposure, causing minor variations in the data. On the test day, the average wind speed was measured at 2.45 m/s, with wind direction shifting from south to east as altitude increased. Temperature decreased with increasing altitude, while relative humidity exhibited an opposite trend, increasing with altitude. Additional comparison data between tower-based and drone-based measurements, including temperature, relative humidity, wind direction, and wind speed, are provided in Figure S3 for reference, with linear regression equations and R2 values presented. Overall, the comparison test demonstrated acceptable agreement in the measurements of meteorological parameters, validating the reliability of the UAV system for further studies.

3.2. Vertical Profile: Anmyeondo

Figure 3a,b present the vertical profiles of meteorological parameters and particle concentrations up to approximately 1000 m a.s.l., respectively. As illustrated in Figure 3a, a temperature inversion occurred twice, around 300 and 700 m a.s.l. Below 300 m a.s.l. (first temperature inversion), the relative humidity increased from 63% to 80%, then dropped to 55% before reaching 700 m a.s.l. After a slight increase in relative humidity between 600 and 700 m a.s.l., it steadily decreased to approximately 40% at higher altitudes. Wind direction profiles revealed three distinct patterns: northwesterly winds (<300 m a.s.l.), southeasterly winds (300–600 m a.s.l.), and southwesterly winds (>600 m a.s.l.).
For particle number concentration, Figure 3b presents the results for particles in different size ranges, measured using the mini-CPC (>3 nm) and mini-OPC (0.3–0.5 μm, 0.5–1.0 μm, and 1.0–2.5 μm). The vertical profiles of particle number concentrations for all size ranges exhibited a similar trend. From the ground (50 m a.s.l.) to approximately 200 m a.s.l., no significant vertical variation in particle number concentration was observed, indicating a well-mixed atmospheric boundary layer near the surface. Beyond 200 m a.s.l., particle number concentrations increased until 300 m a.s.l., followed by a steady decrease up to 600 m a.s.l. Notably, the particle number concentration closely followed the variation in relative humidity, emphasizing humidity as a key factor influencing aerosol dynamics. At lower altitudes (ground to approximately 350 m a.s.l.), a strong effect of relative humidity on particle concentration was observed, as shown in Figure 4. The steep correlation slope (y = 1098x − 70576) and high linearity (R2 = 0.964) highlight the significant influence of relative humidity in this region, likely due to enhanced hygroscopic growth and condensation processes near the surface. At higher altitudes (350–1030 m a.s.l.), the relationship between relative humidity and particle number concentration was notably weaker, with a gentler slope (y = 95.8x − 873) and reduced linearity (R2 = 0.812). This suggests that as the atmosphere becomes better mixed at higher altitudes, the impact of relative humidity diminishes, potentially due to fewer sources of hygroscopic particle formation and a more stable atmospheric environment.
Near the surface, active anthropogenic pollution sources and natural aerosol generation processes, combined with higher relative humidity, contribute to an increase in particle number concentration. Elevated relative humidity enhances the condensation of water vapor onto aerosol surfaces, leading to growth in both particle size and number. At higher altitudes, the atmosphere is more mixed, and the influence of pollution sources diminishes, which may reduce the effect of relative humidity changes on particle number concentration. Additionally, the presence of temperature inversion layers enhances atmospheric stability, potentially influencing the vertical distribution of particle number concentration. While the exact mechanisms behind these observations were not fully elucidated in this study, similar trends have been reported in previous research [25].

3.3. Vertical Profile: Boseong

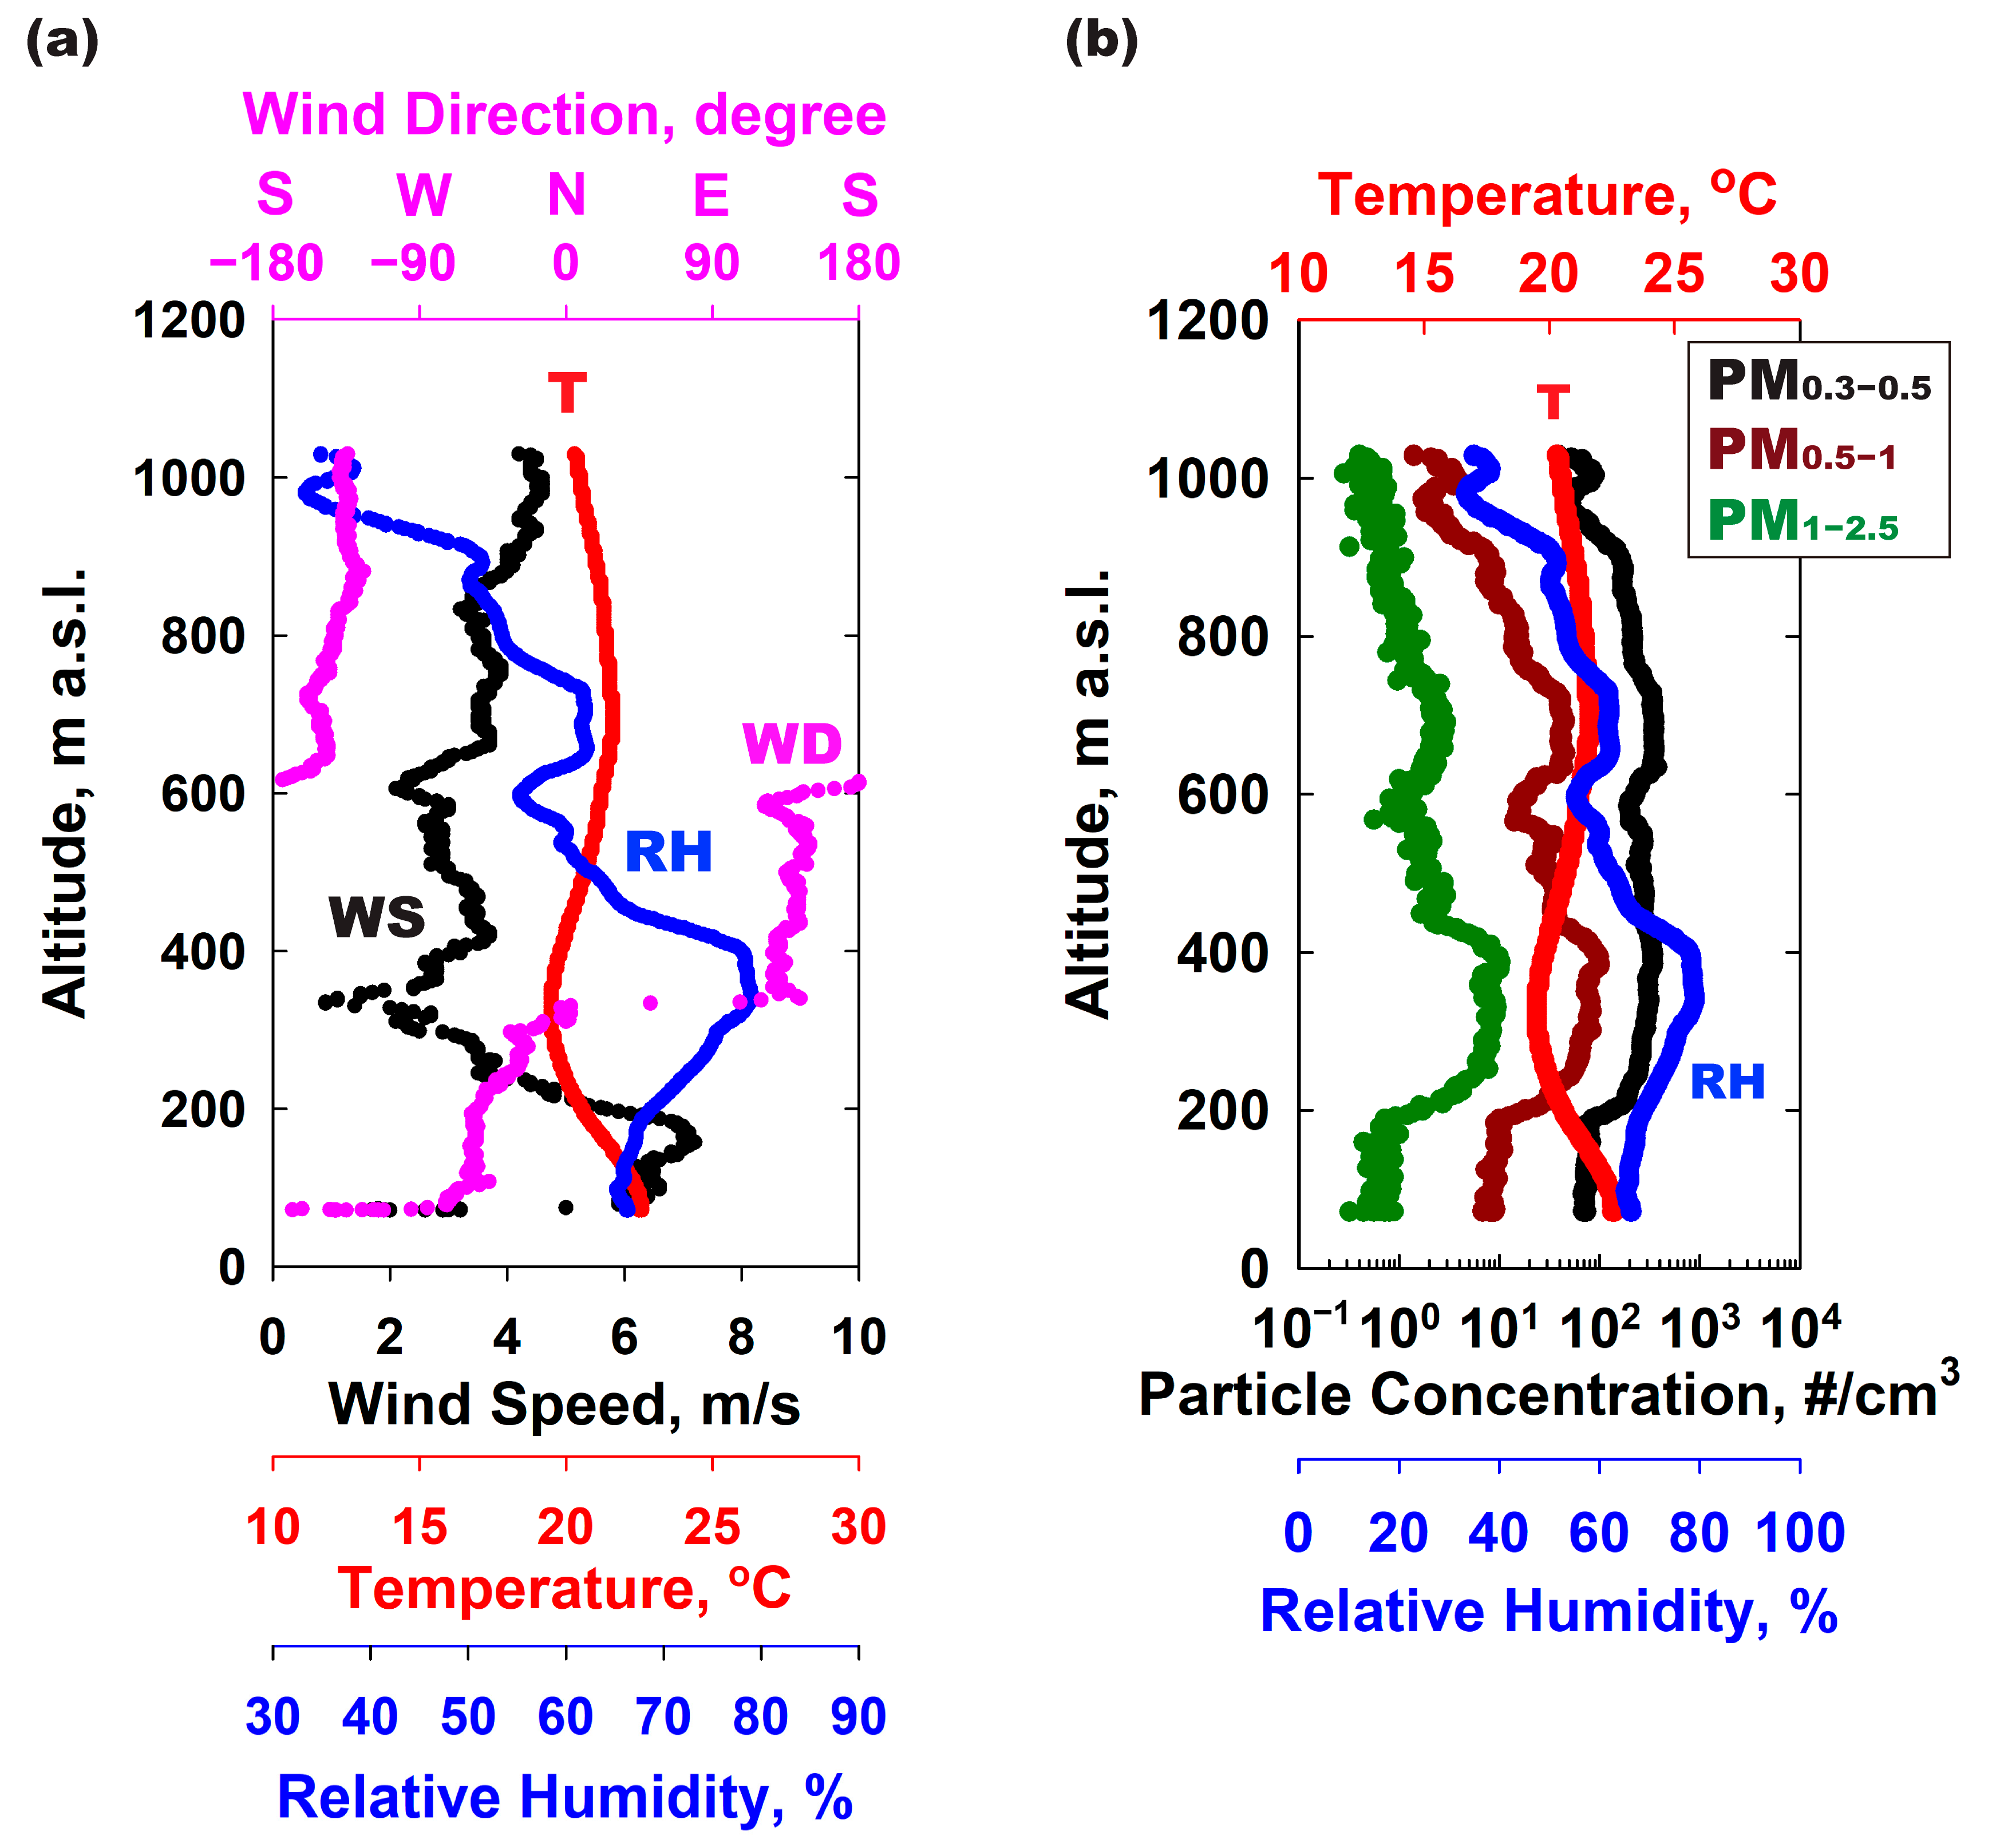
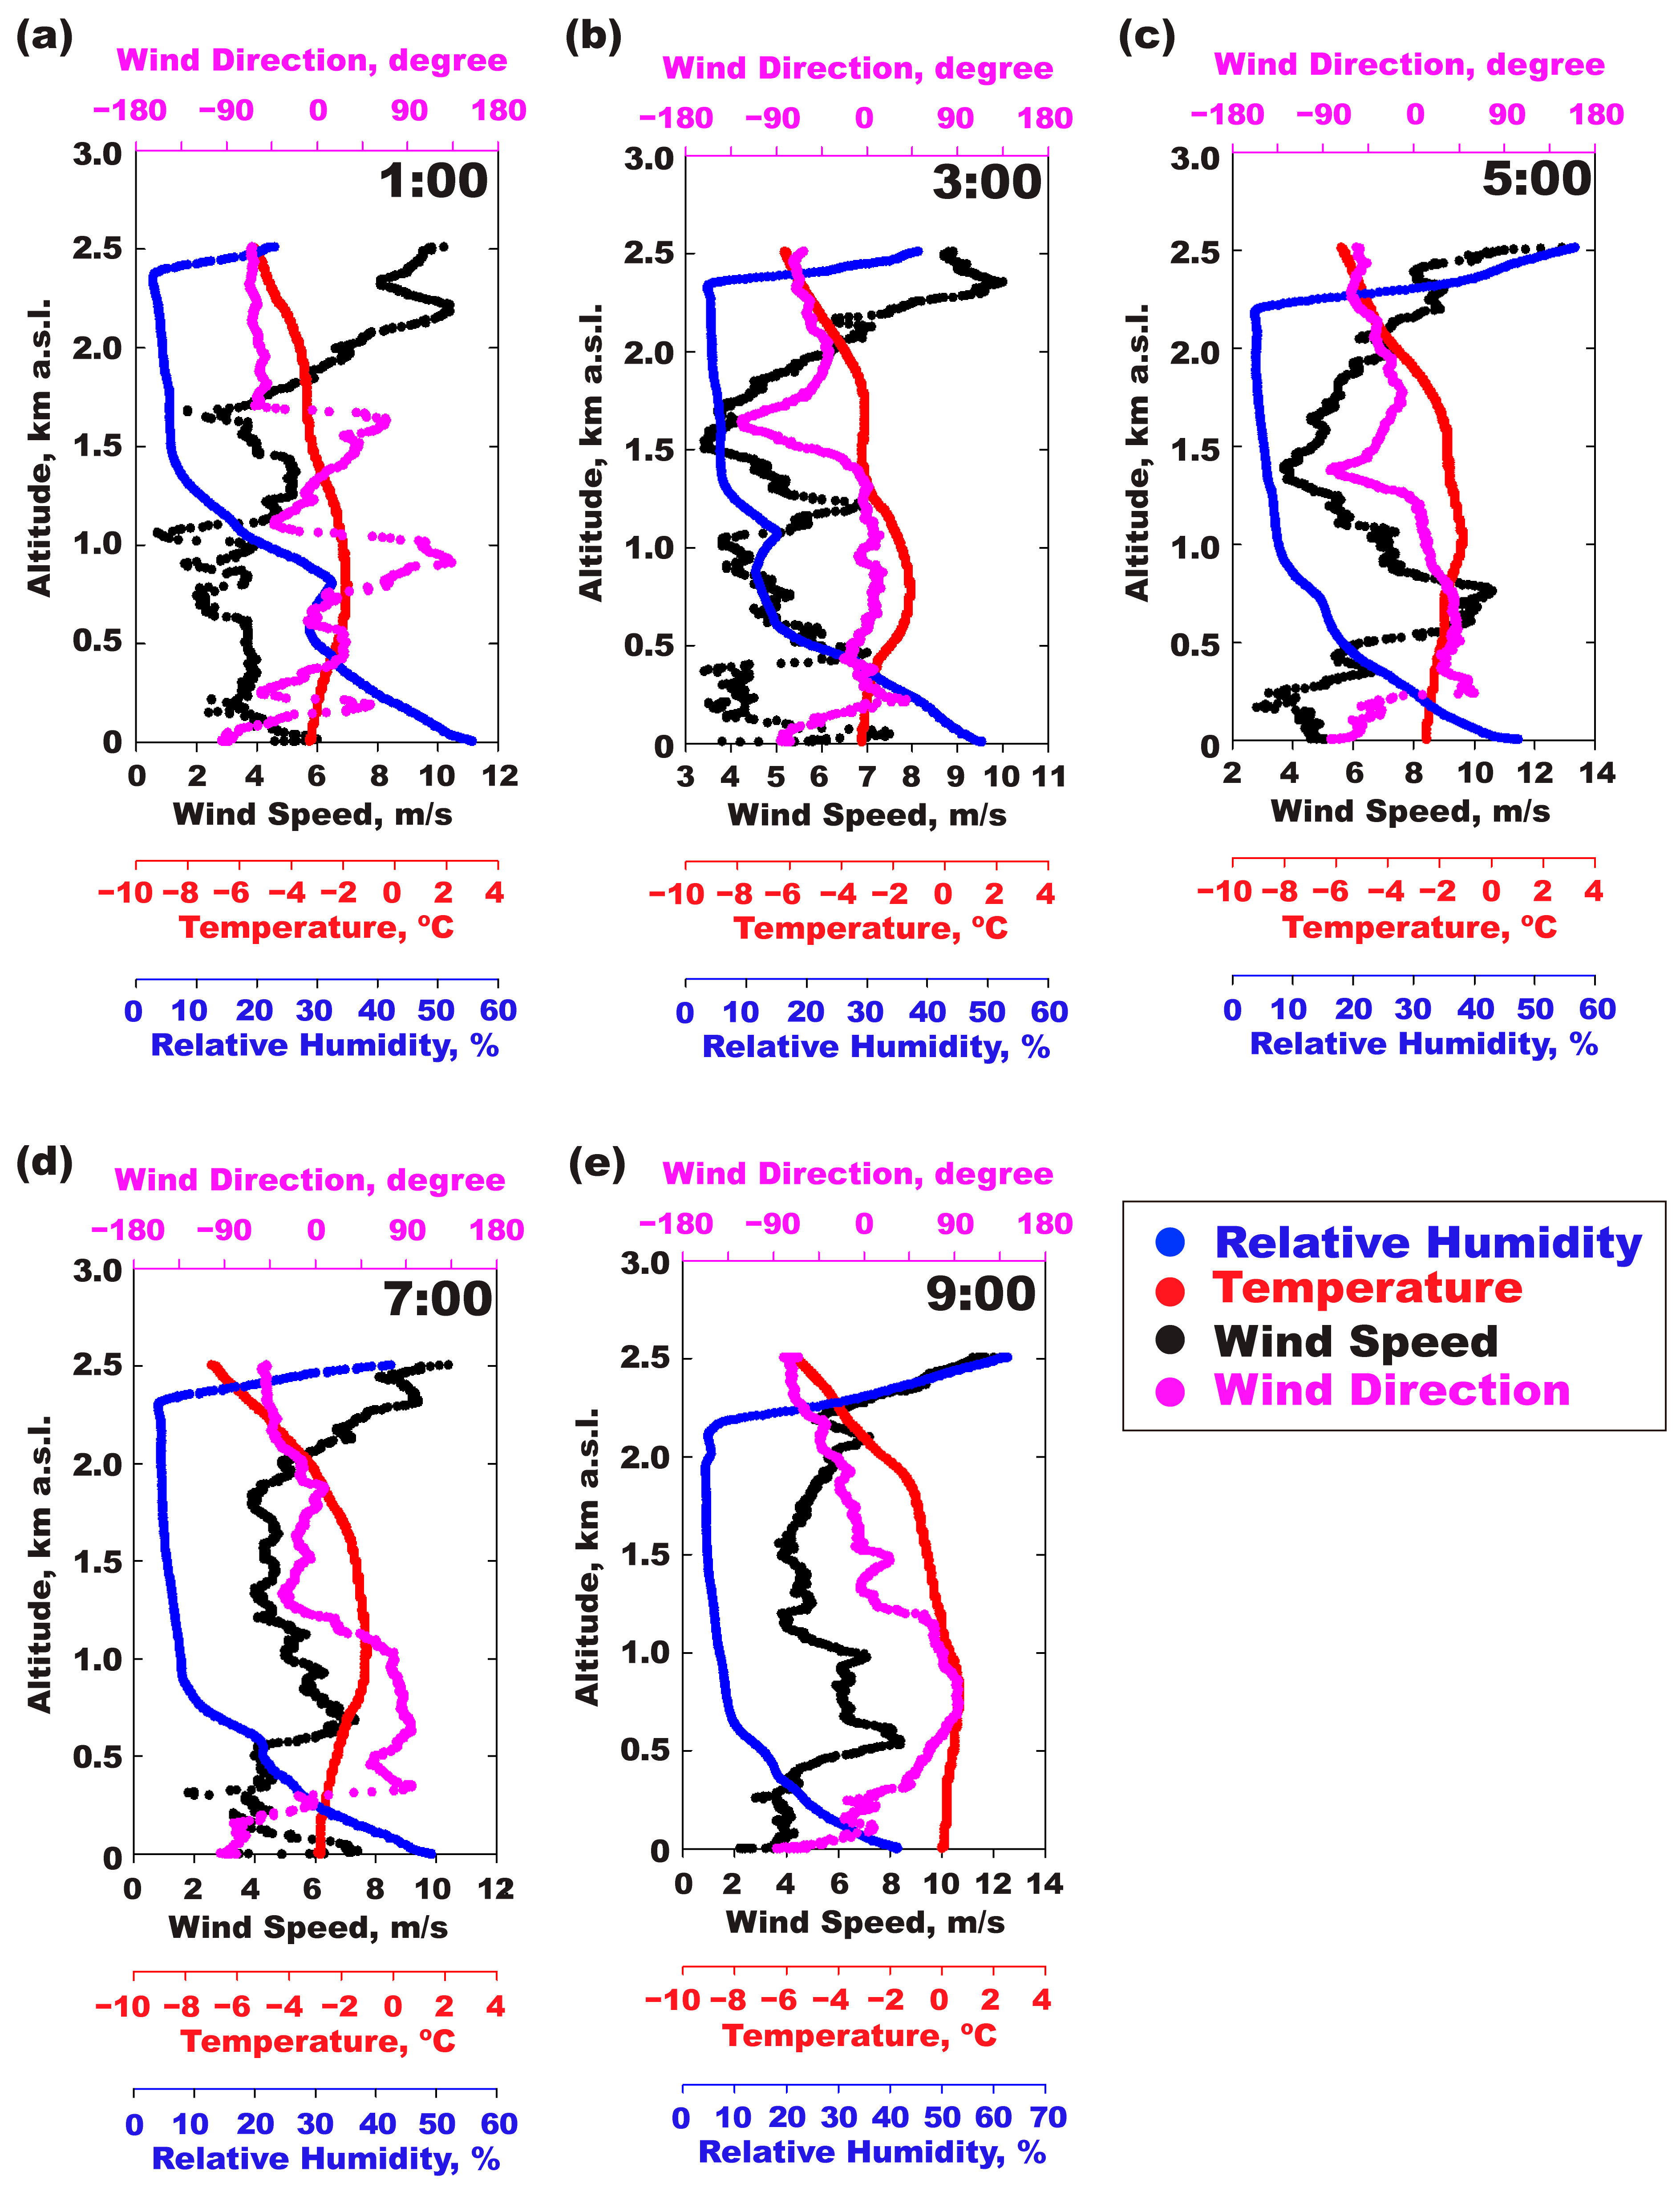
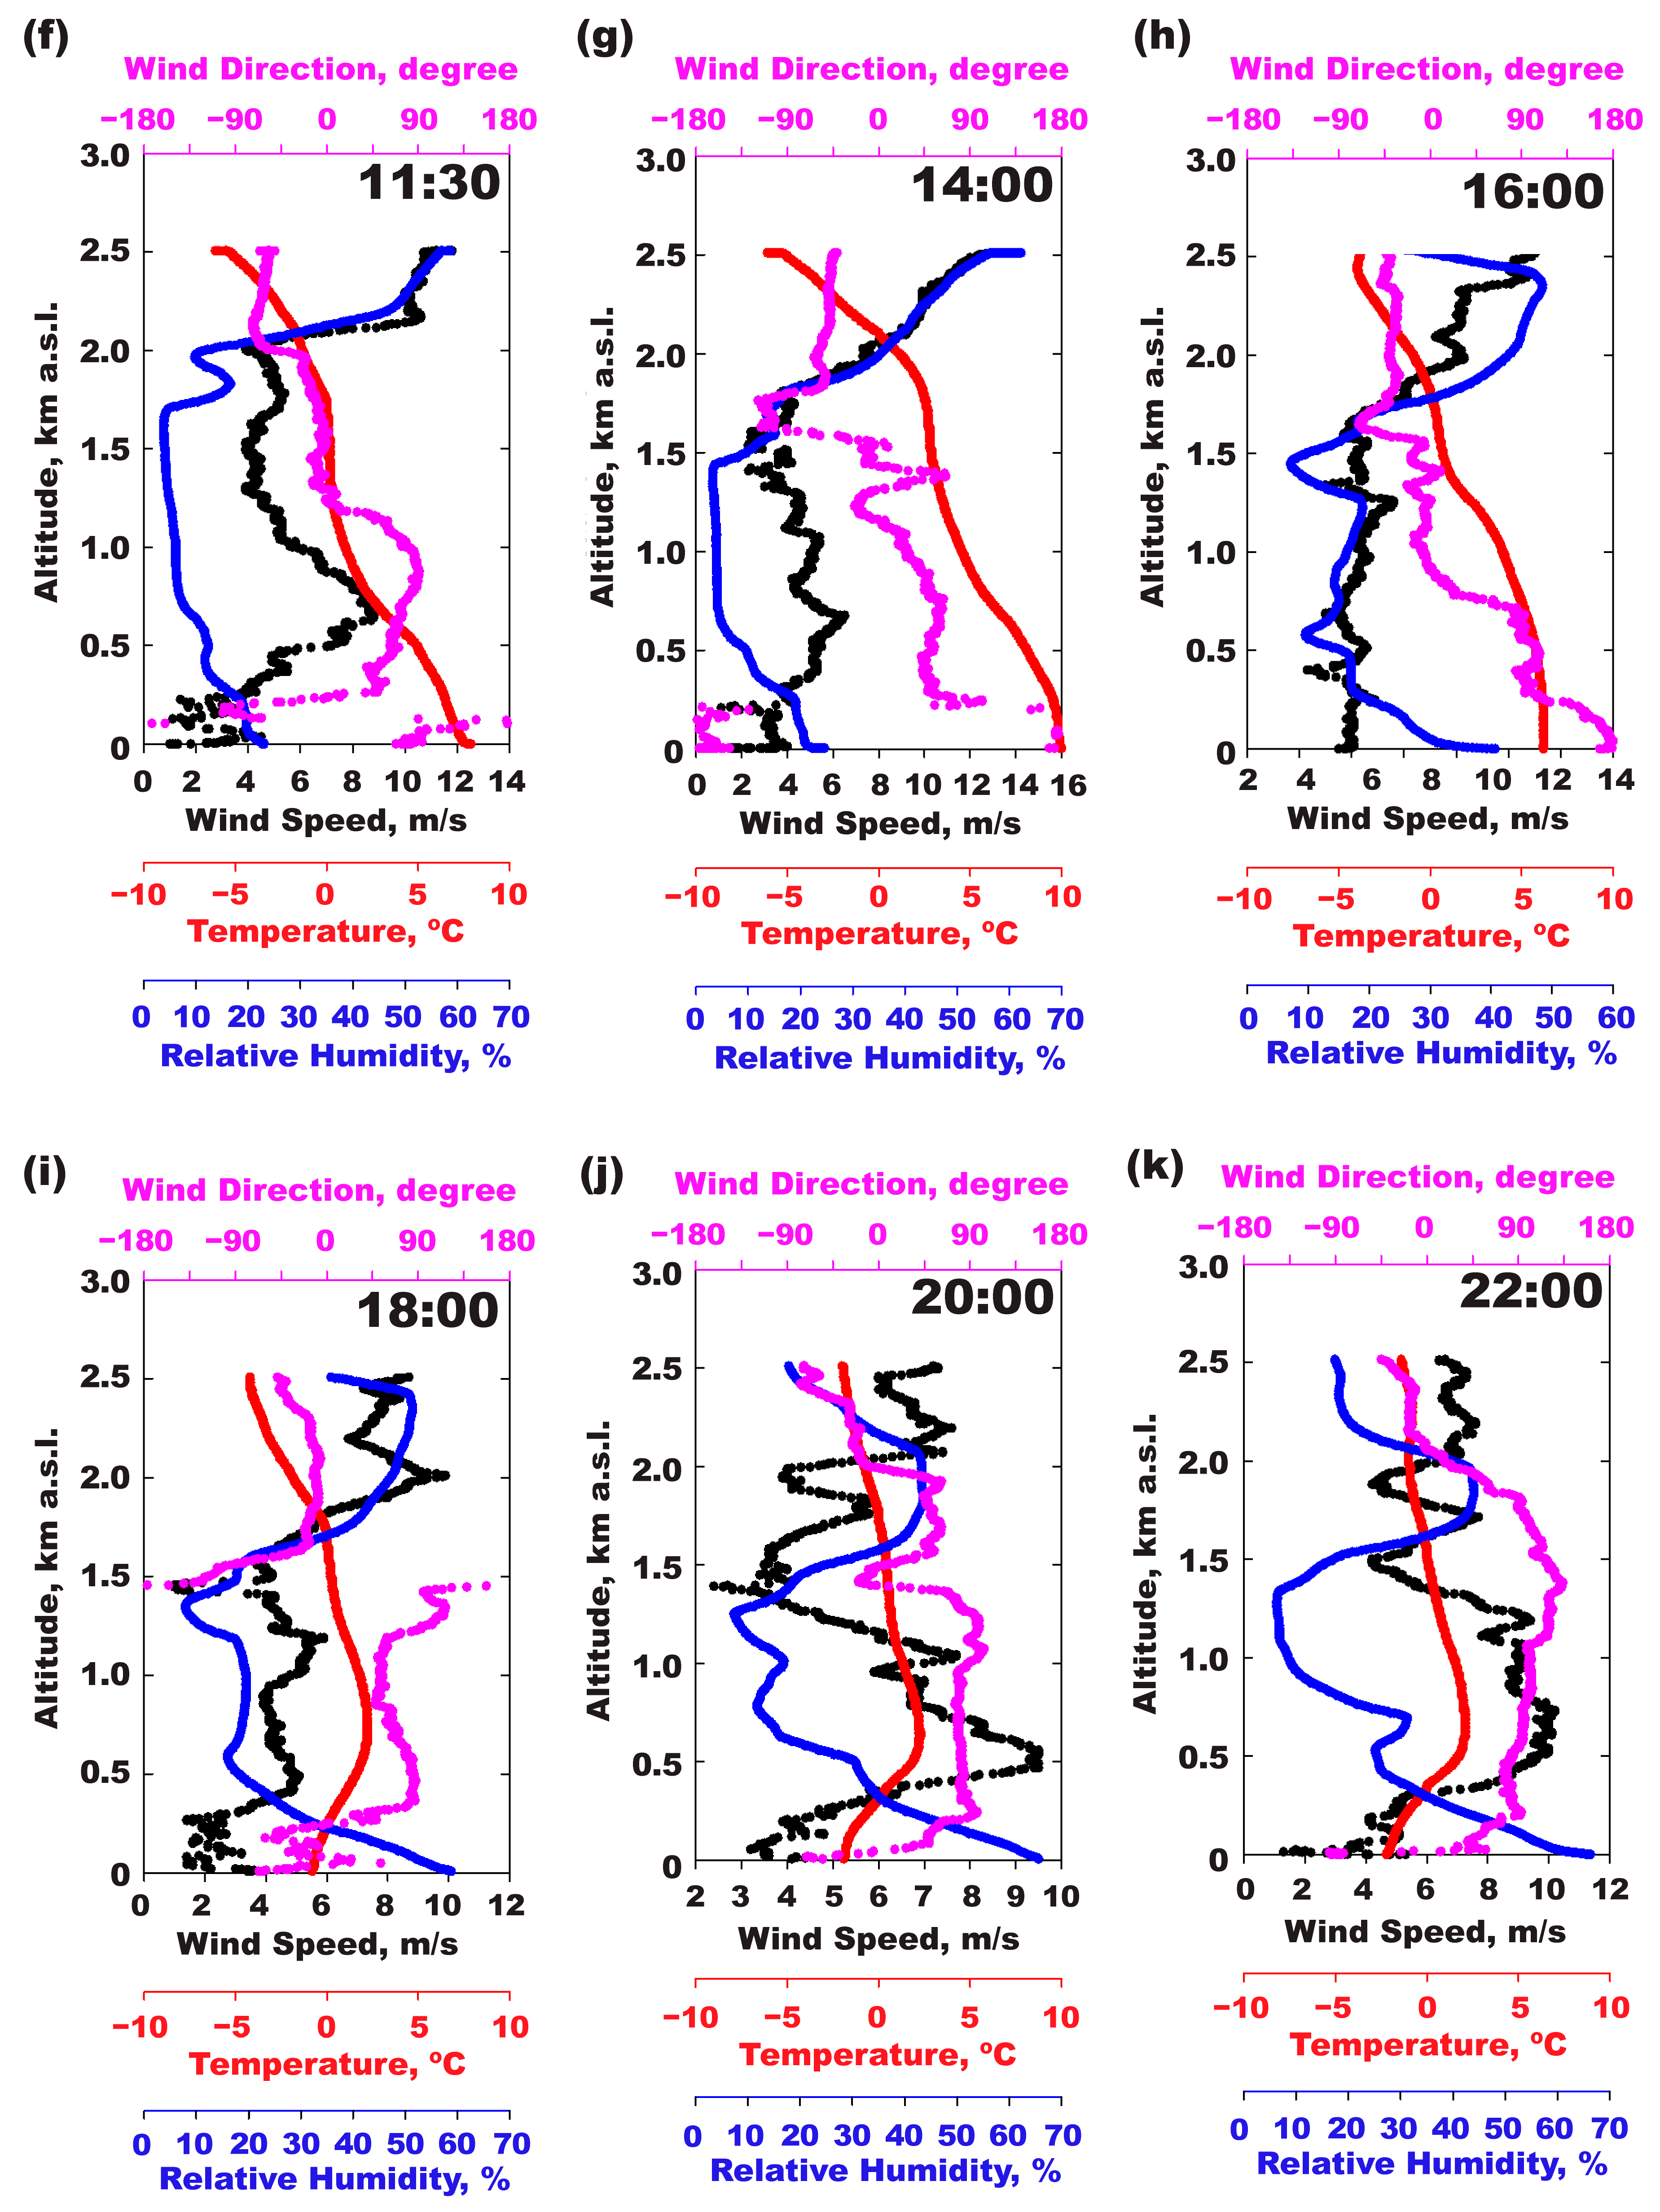
3.3.1. Meteorological Parameters

Figure 5a–k show the diurnal variations in WD, WS, T, and RH with respect to altitude up to 2500 m, while Figure S4 presents the data from all 20 flight measurements. The axes in each figure are labeled, with colors corresponding to the respective data. Wind speed generally increases with altitude, contributing to the formation of a well-mixed atmospheric boundary layer near the ground. Based on these data, the thickness of the planetary boundary layer can be estimated. At lower altitudes, reduced wind speeds and higher RH create a stable air layer, while at higher altitudes, stronger winds and lower RH suggest more active atmospheric mixing. Relative humidity (RH) decreases steadily from the ground to approximately 2300 m during the early morning (1:00–9:00). By noon (11:30 data), a distinct inversion in RH was observed around 2300 m, with this boundary gradually descending to below 1500 m over time. This pattern suggests that air masses at higher altitudes, where RH increases, tend to descend, leading to multiple inflection points in the RH profiles after 16:00. As a result, the air at an altitude of 2500 m exhibits relatively low RH during nighttime. Wind directions throughout the day show no consistent trend, but westward winds dominate at higher altitudes, while eastward winds are more prevalent near the surface.

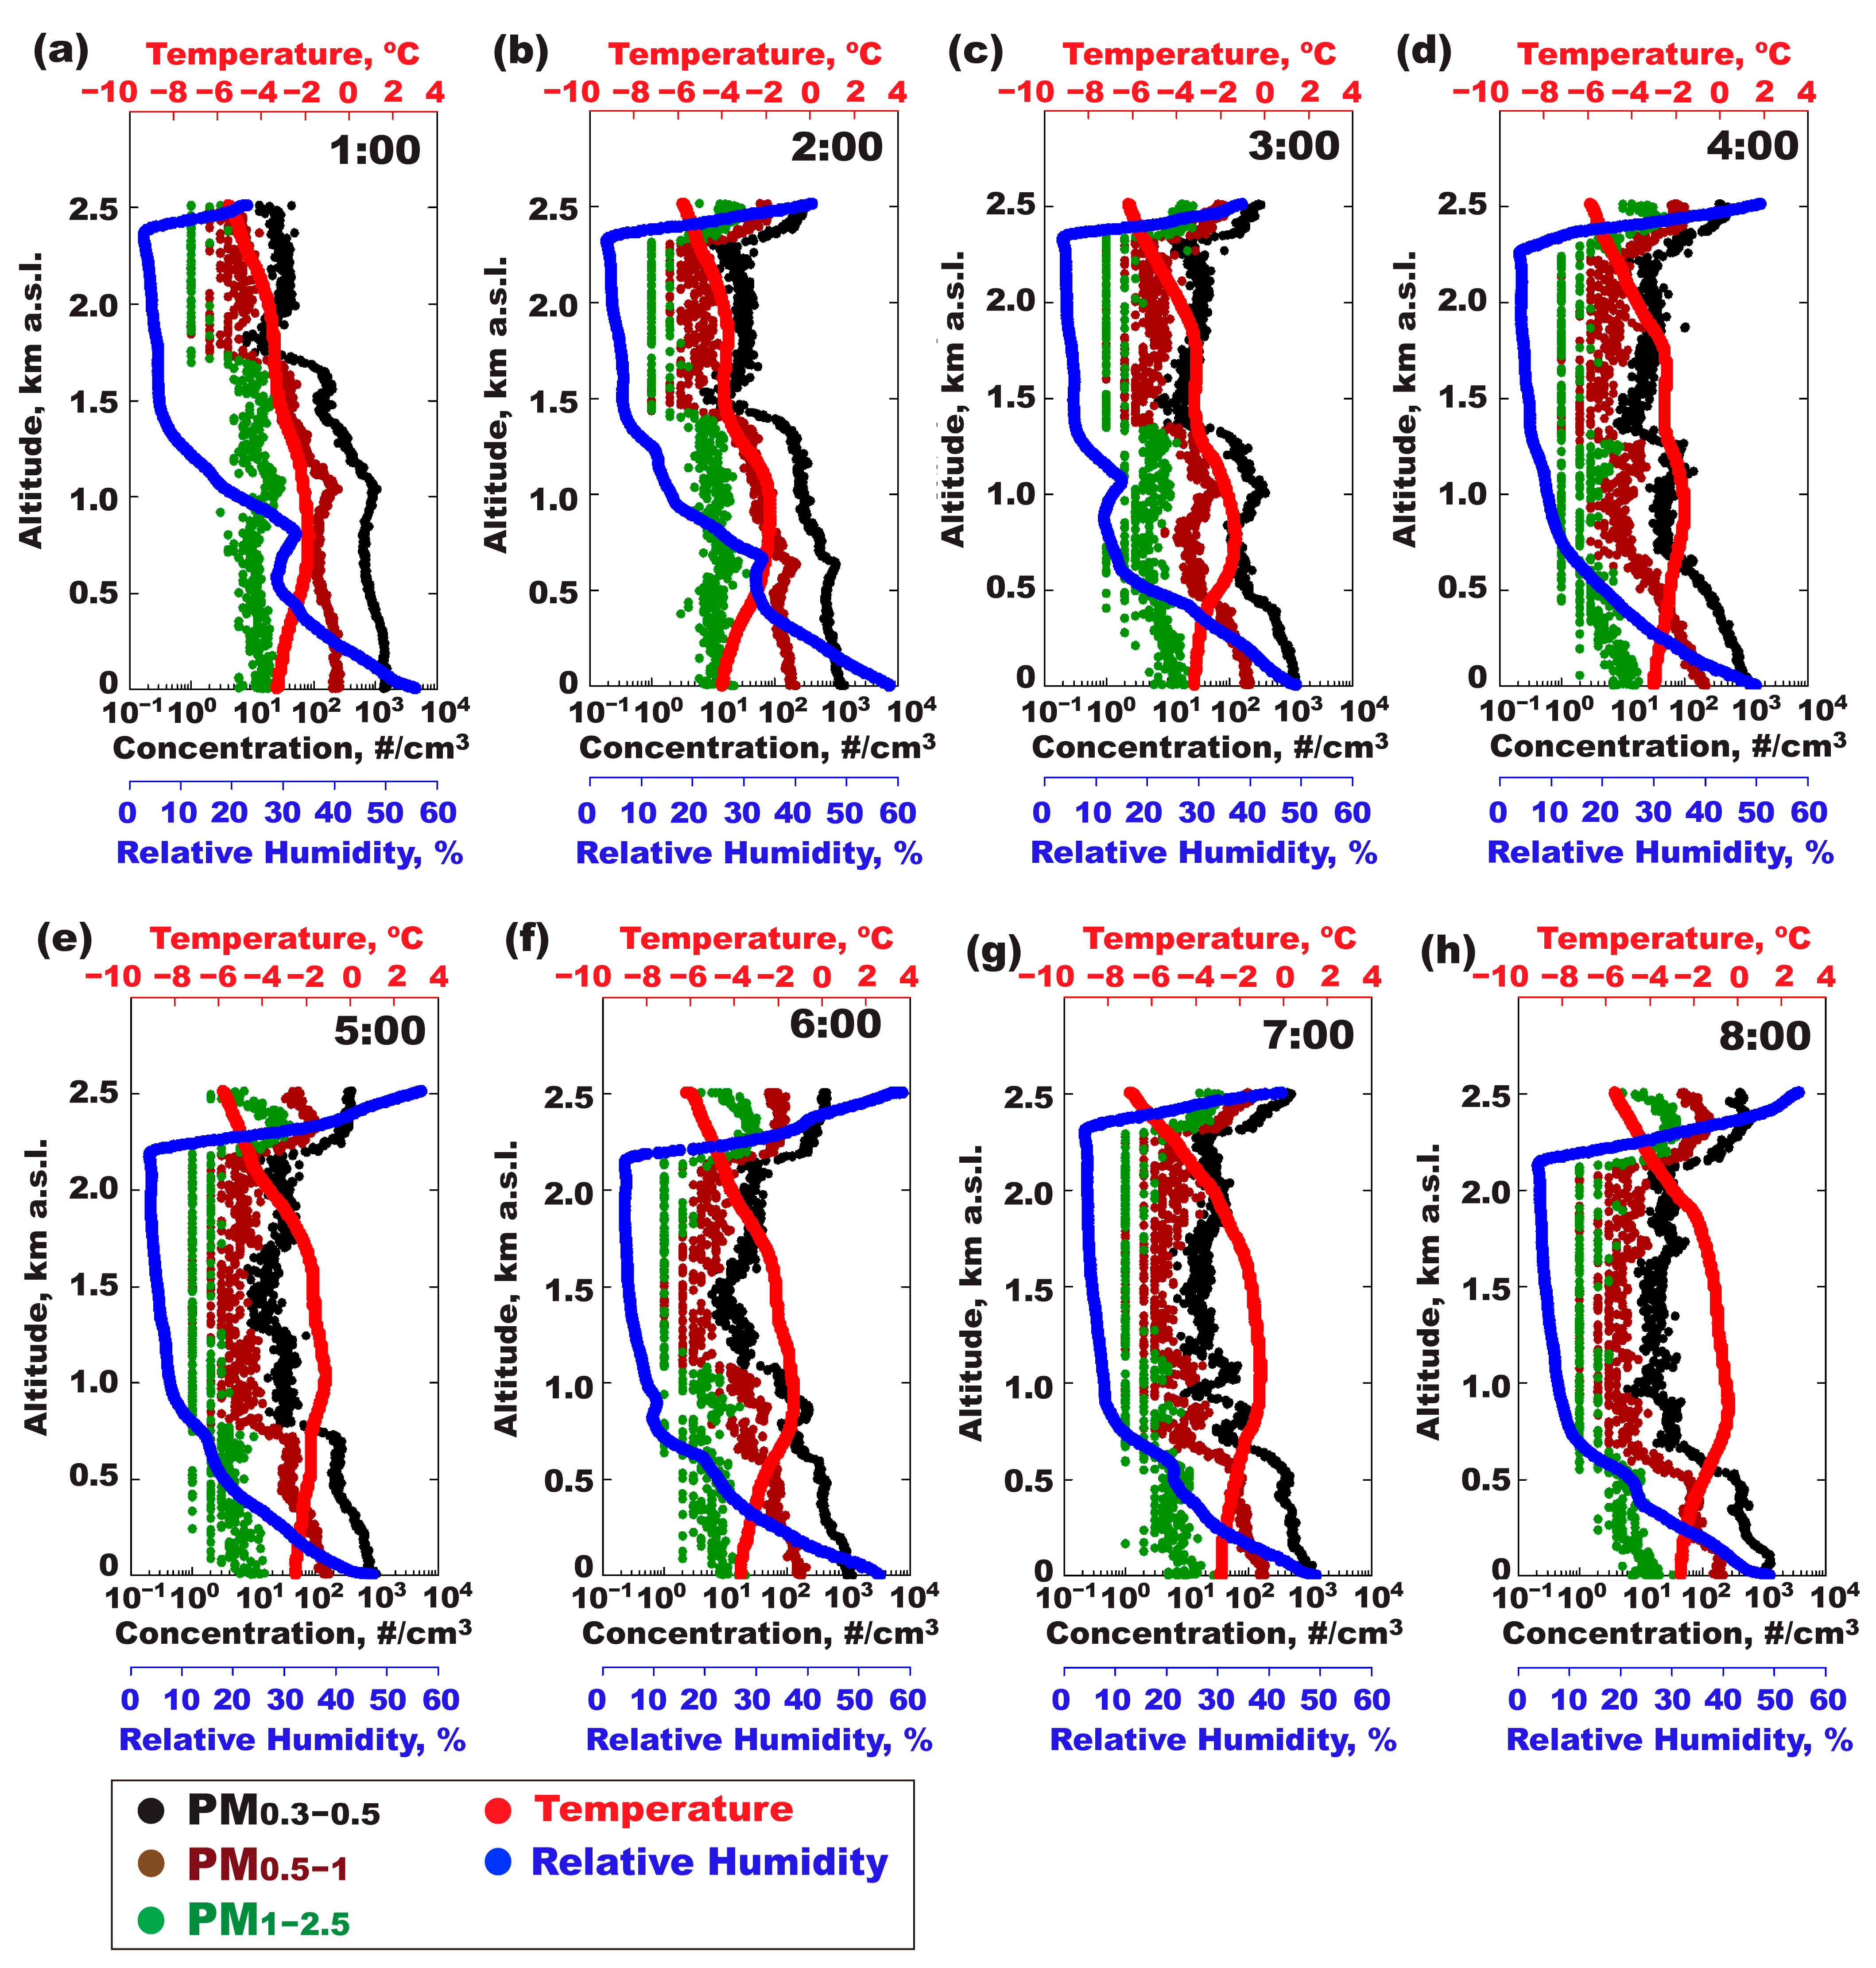
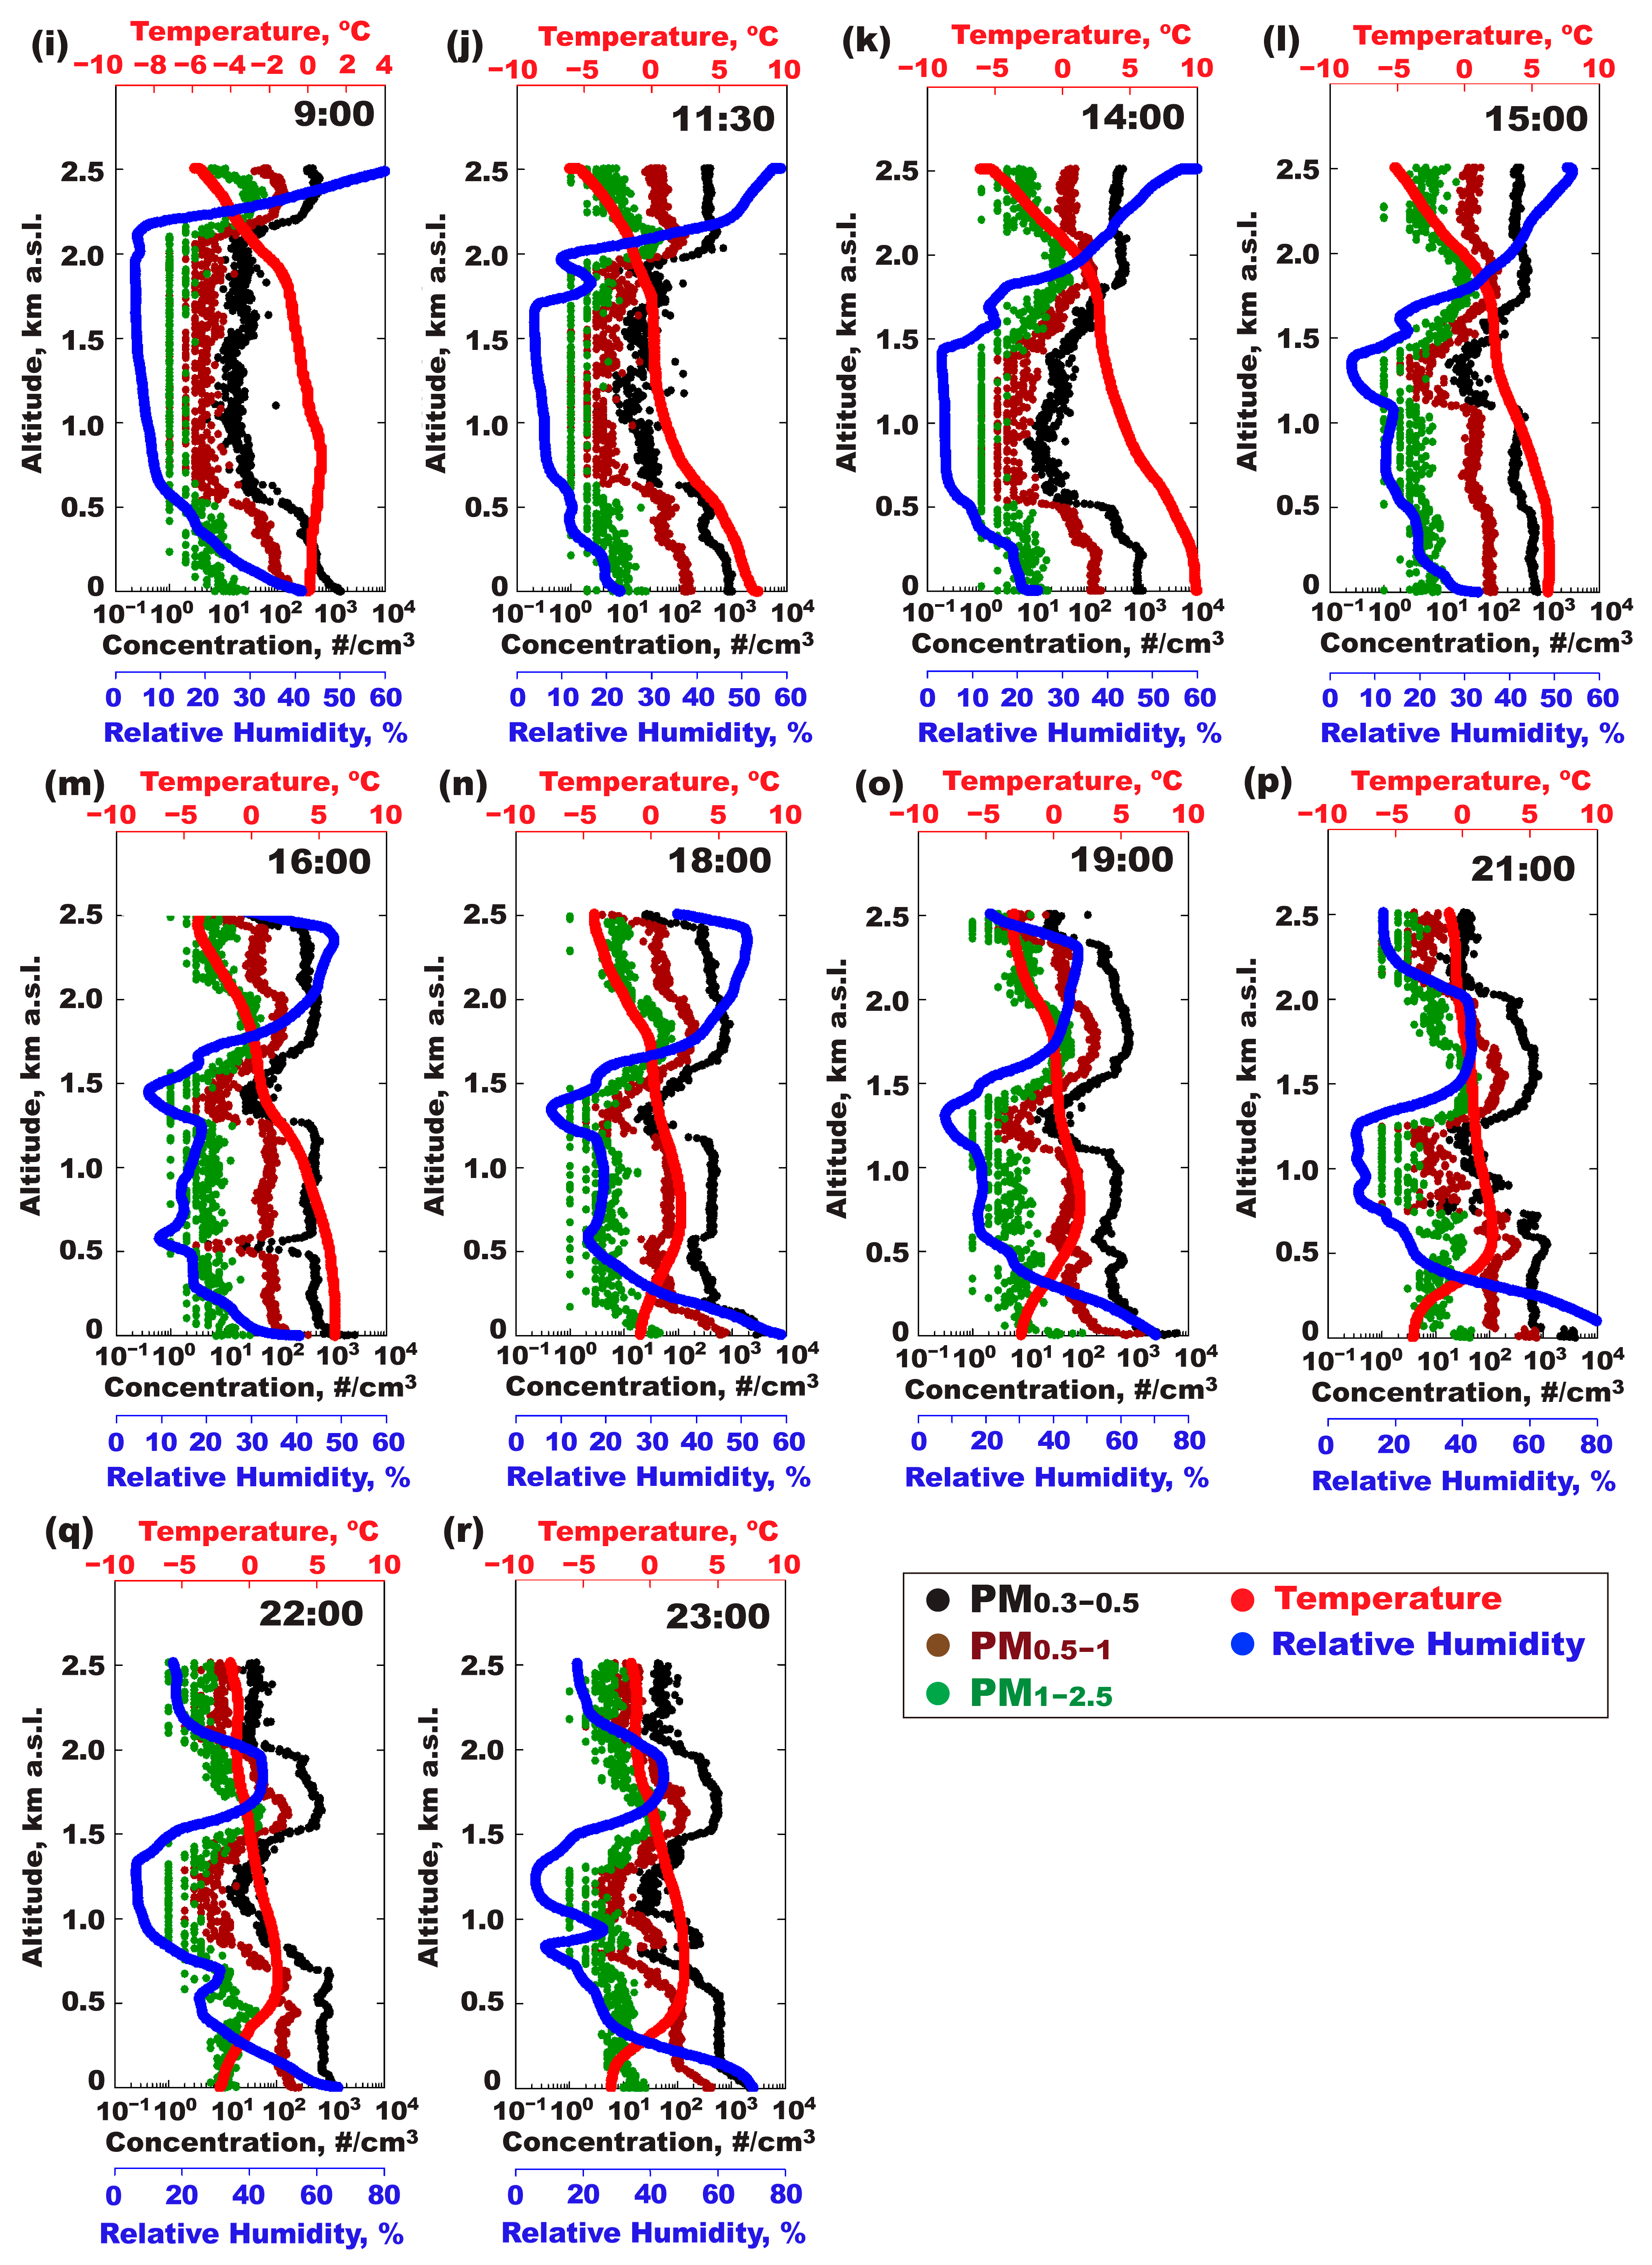
3.3.2. Particle Concentration

Figure 6 illustrates the diurnal variations in PM number concentrations (0.3–0.5 μm, 0.5–1.0 μm, and 1.0–2.5 μm) with respect to altitude. Notably, the trends in PM number concentrations closely align with RH variations. Near the ground (below 500 m), despite a significant decrease in RH, PM number concentrations remain relatively stable or change slowly, indicating the presence of a well-mixed region. This behavior is consistent with the trend shown in Figure 3b. The well-mixed region is also associated with relatively low wind speeds near the surface, as depicted in Figure 5. Above this region, a clear proportional relationship between RH and PM number concentrations emerges. The concentration trends for different particle size ranges exhibit similar patterns, suggesting that the particle size distribution within the 0.3–2.5 μm range remains consistent, while absolute concentrations vary with altitude.
More specifically, at 1:00 (Figure 6a), RH near the ground is relatively high and gradually decreases with altitude, stabilizing below 10% above 1500 m. PM number concentrations for all size ranges remain relatively stable below 1000 m, indicating a well-mixed boundary layer during nighttime. However, as altitude increases, PM concentrations exhibit a sharp decline, particularly above 1500 m, suggesting minimal particle transport at higher altitudes under stable nighttime conditions. From 3:00 to 9:00 (Figure 6c–i), RH near the surface steadily decreases, accompanied by a compression of the stable PM concentration region. The steady PM region, which initially extends up to approximately 1000 m during the early nighttime (Figure 6a), becomes compressed to below 500 m as the night progresses into the early morning hours (Figure 6c–i). This indicates that the altitude range where PM concentrations remain relatively stable decreases over time. The contraction of this region is primarily driven by increasing atmospheric stability during nighttime, caused by radiative cooling near the surface. Radiative cooling reduces turbulence and suppresses vertical mixing, leading to a more stratified atmospheric structure. As a result, the well-mixed boundary layer becomes progressively shallower, confining the steady PM region closer to the ground. By late morning (e.g., 9:00 to 14:00; Figure 6i–k), the temperature near the surface increases significantly, and RH decreases sharply, especially below 500 m. However, PM concentrations for all size ranges near the surface do not exhibit a noticeable increase, suggesting that surface-level activities such as anthropogenic emissions or secondary particle formation are not dominant during this period. Instead, the PM distribution remains relatively stable, which may indicate that vertical transport or atmospheric mixing is insufficient to significantly alter particle concentrations in the lower boundary layer. Above 500 m, PM concentrations remain low, consistent with limited mixing and particle transport into higher altitudes.
During the afternoon hours (i.e., Figure 6k–o), the temperature increases significantly near the surface and stabilizes at higher altitudes, while RH decreases primarily below 500 m. Above 500 m, RH remains relatively stable up to approximately 1500 m, suggesting that surface heating and mixing primarily affect the lower atmosphere. Beyond 1500 m, RH increases sharply with altitude, indicating the presence of a more humid and stratified atmospheric layer. This sharp increase above 1500 m highlights the transition between the convective boundary layer and the more stable, less mixed upper atmospheric region. As convective mixing strengthens, the aerosol mixed region progressively expands upward, reaching approximately 1200 m by the late afternoon. This is evident from the redistribution of PM concentrations, with particles being transported to higher altitudes compared to earlier hours.
As evening approaches and solar heating diminishes (Figure 6p–r), radiative cooling resumes near the surface, leading to the re-establishment of a stable atmospheric layer. By 23:00 (Figure 6r), the PM region near the ground becomes increasingly compressed, with concentrations stabilizing primarily below 500 m. Concurrently, a temperature inversion develops near the surface, further enhancing atmospheric stability and suppressing vertical mixing. These combined effects confine PM concentrations closer to the surface and limit upward transport, reinforcing the stratified structure of the atmosphere during nighttime.

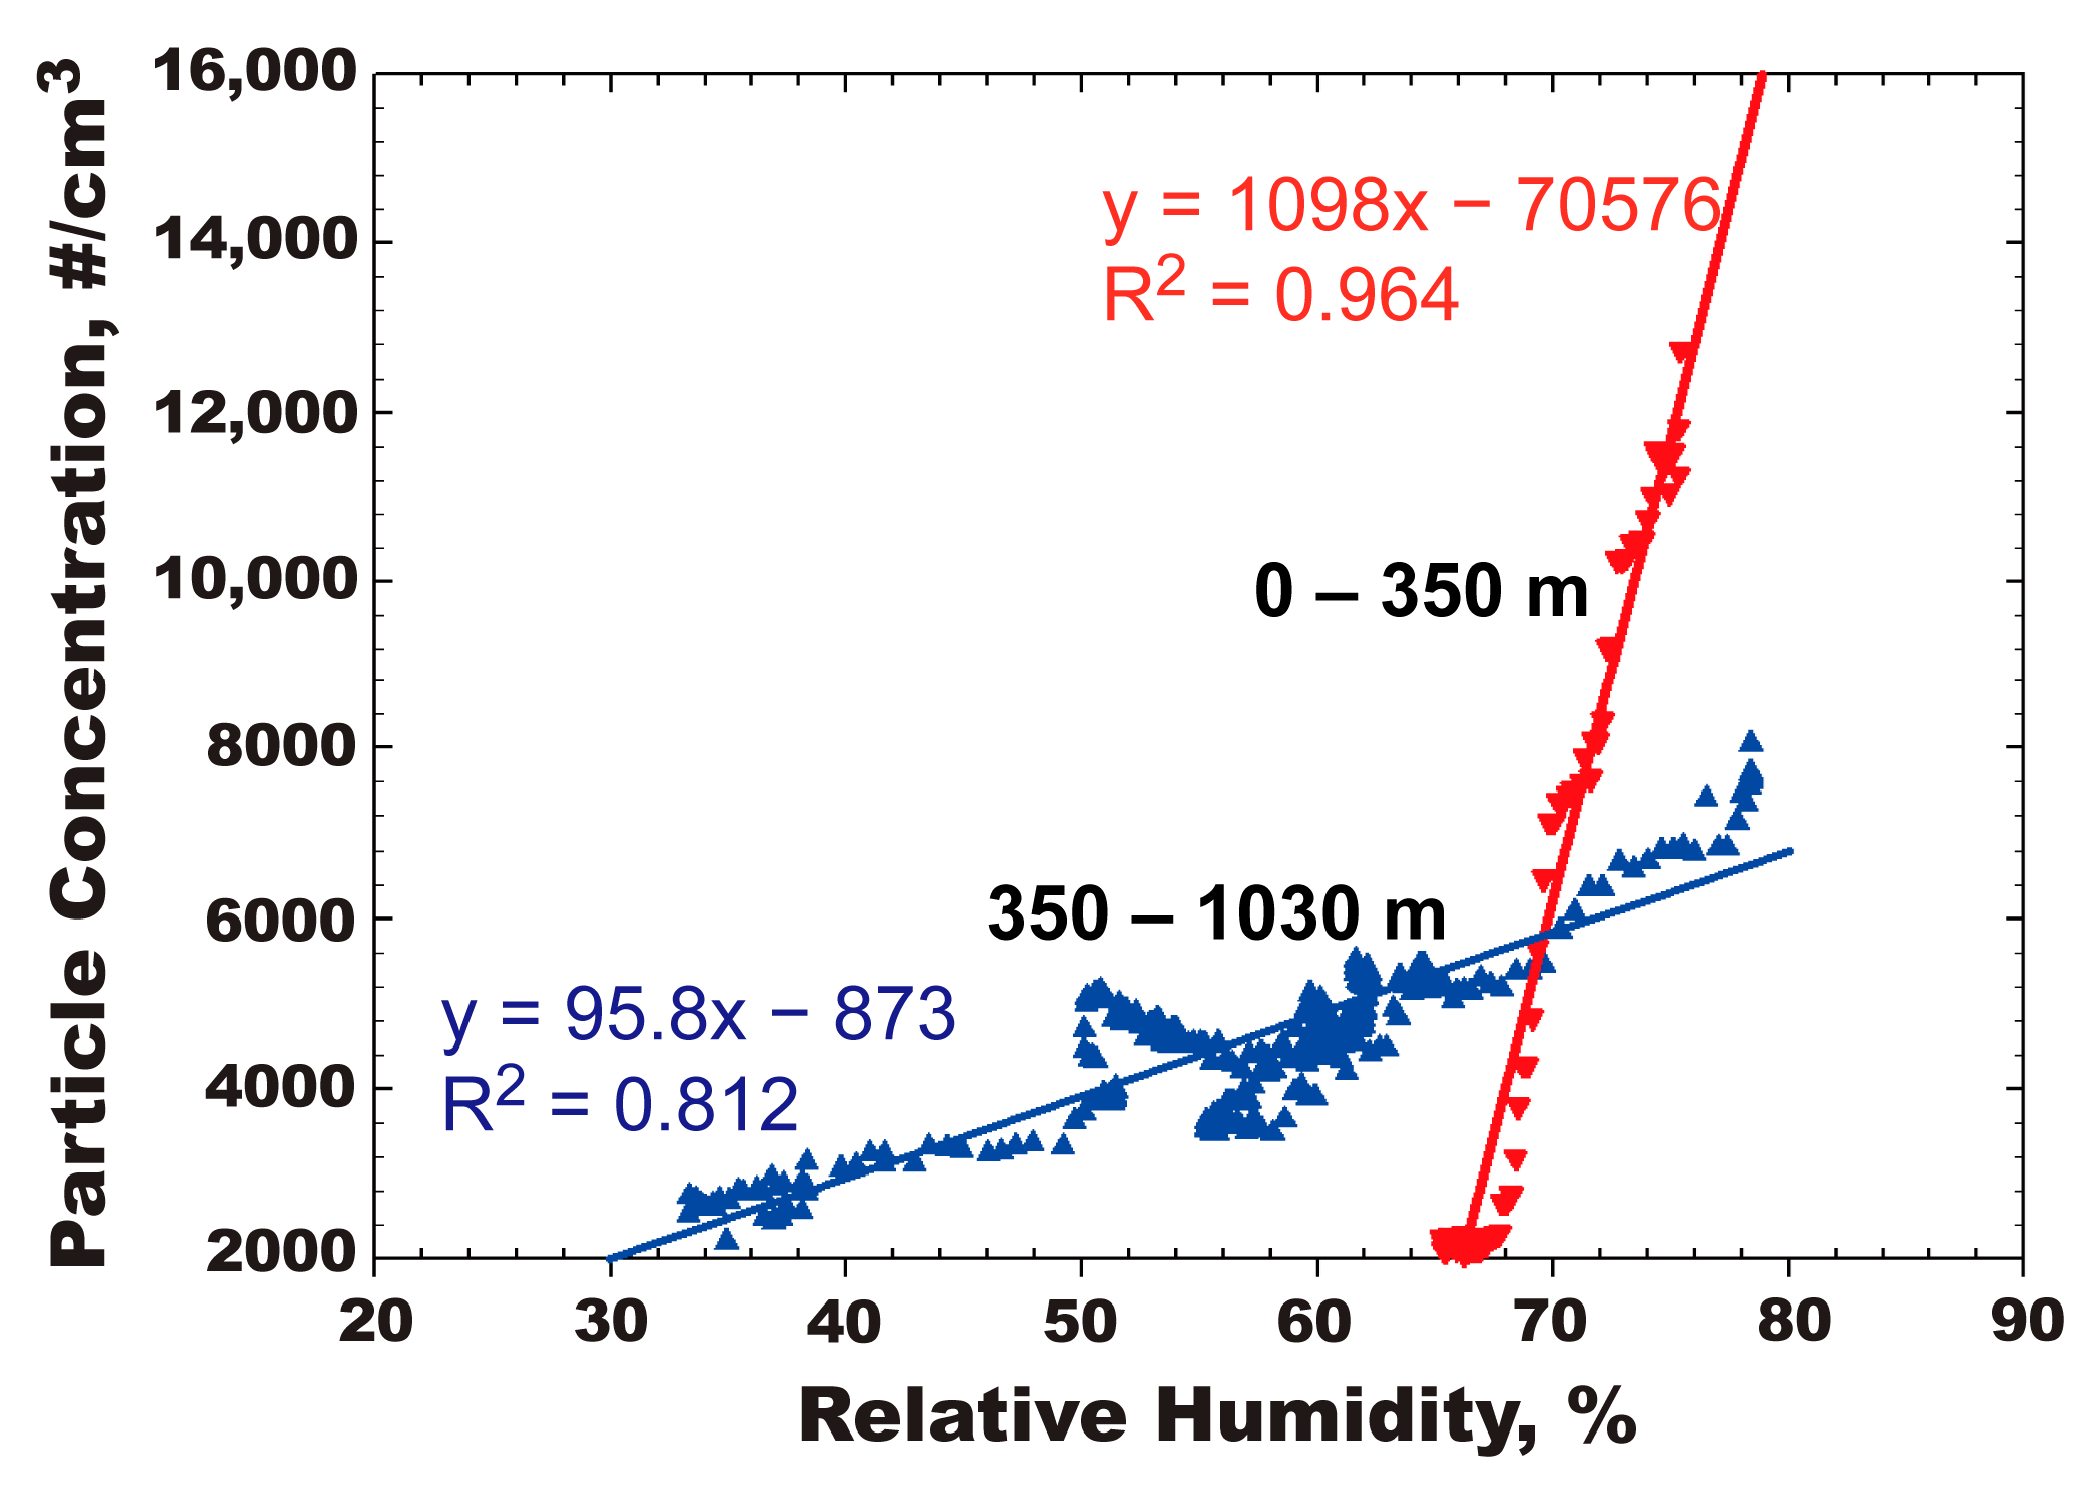
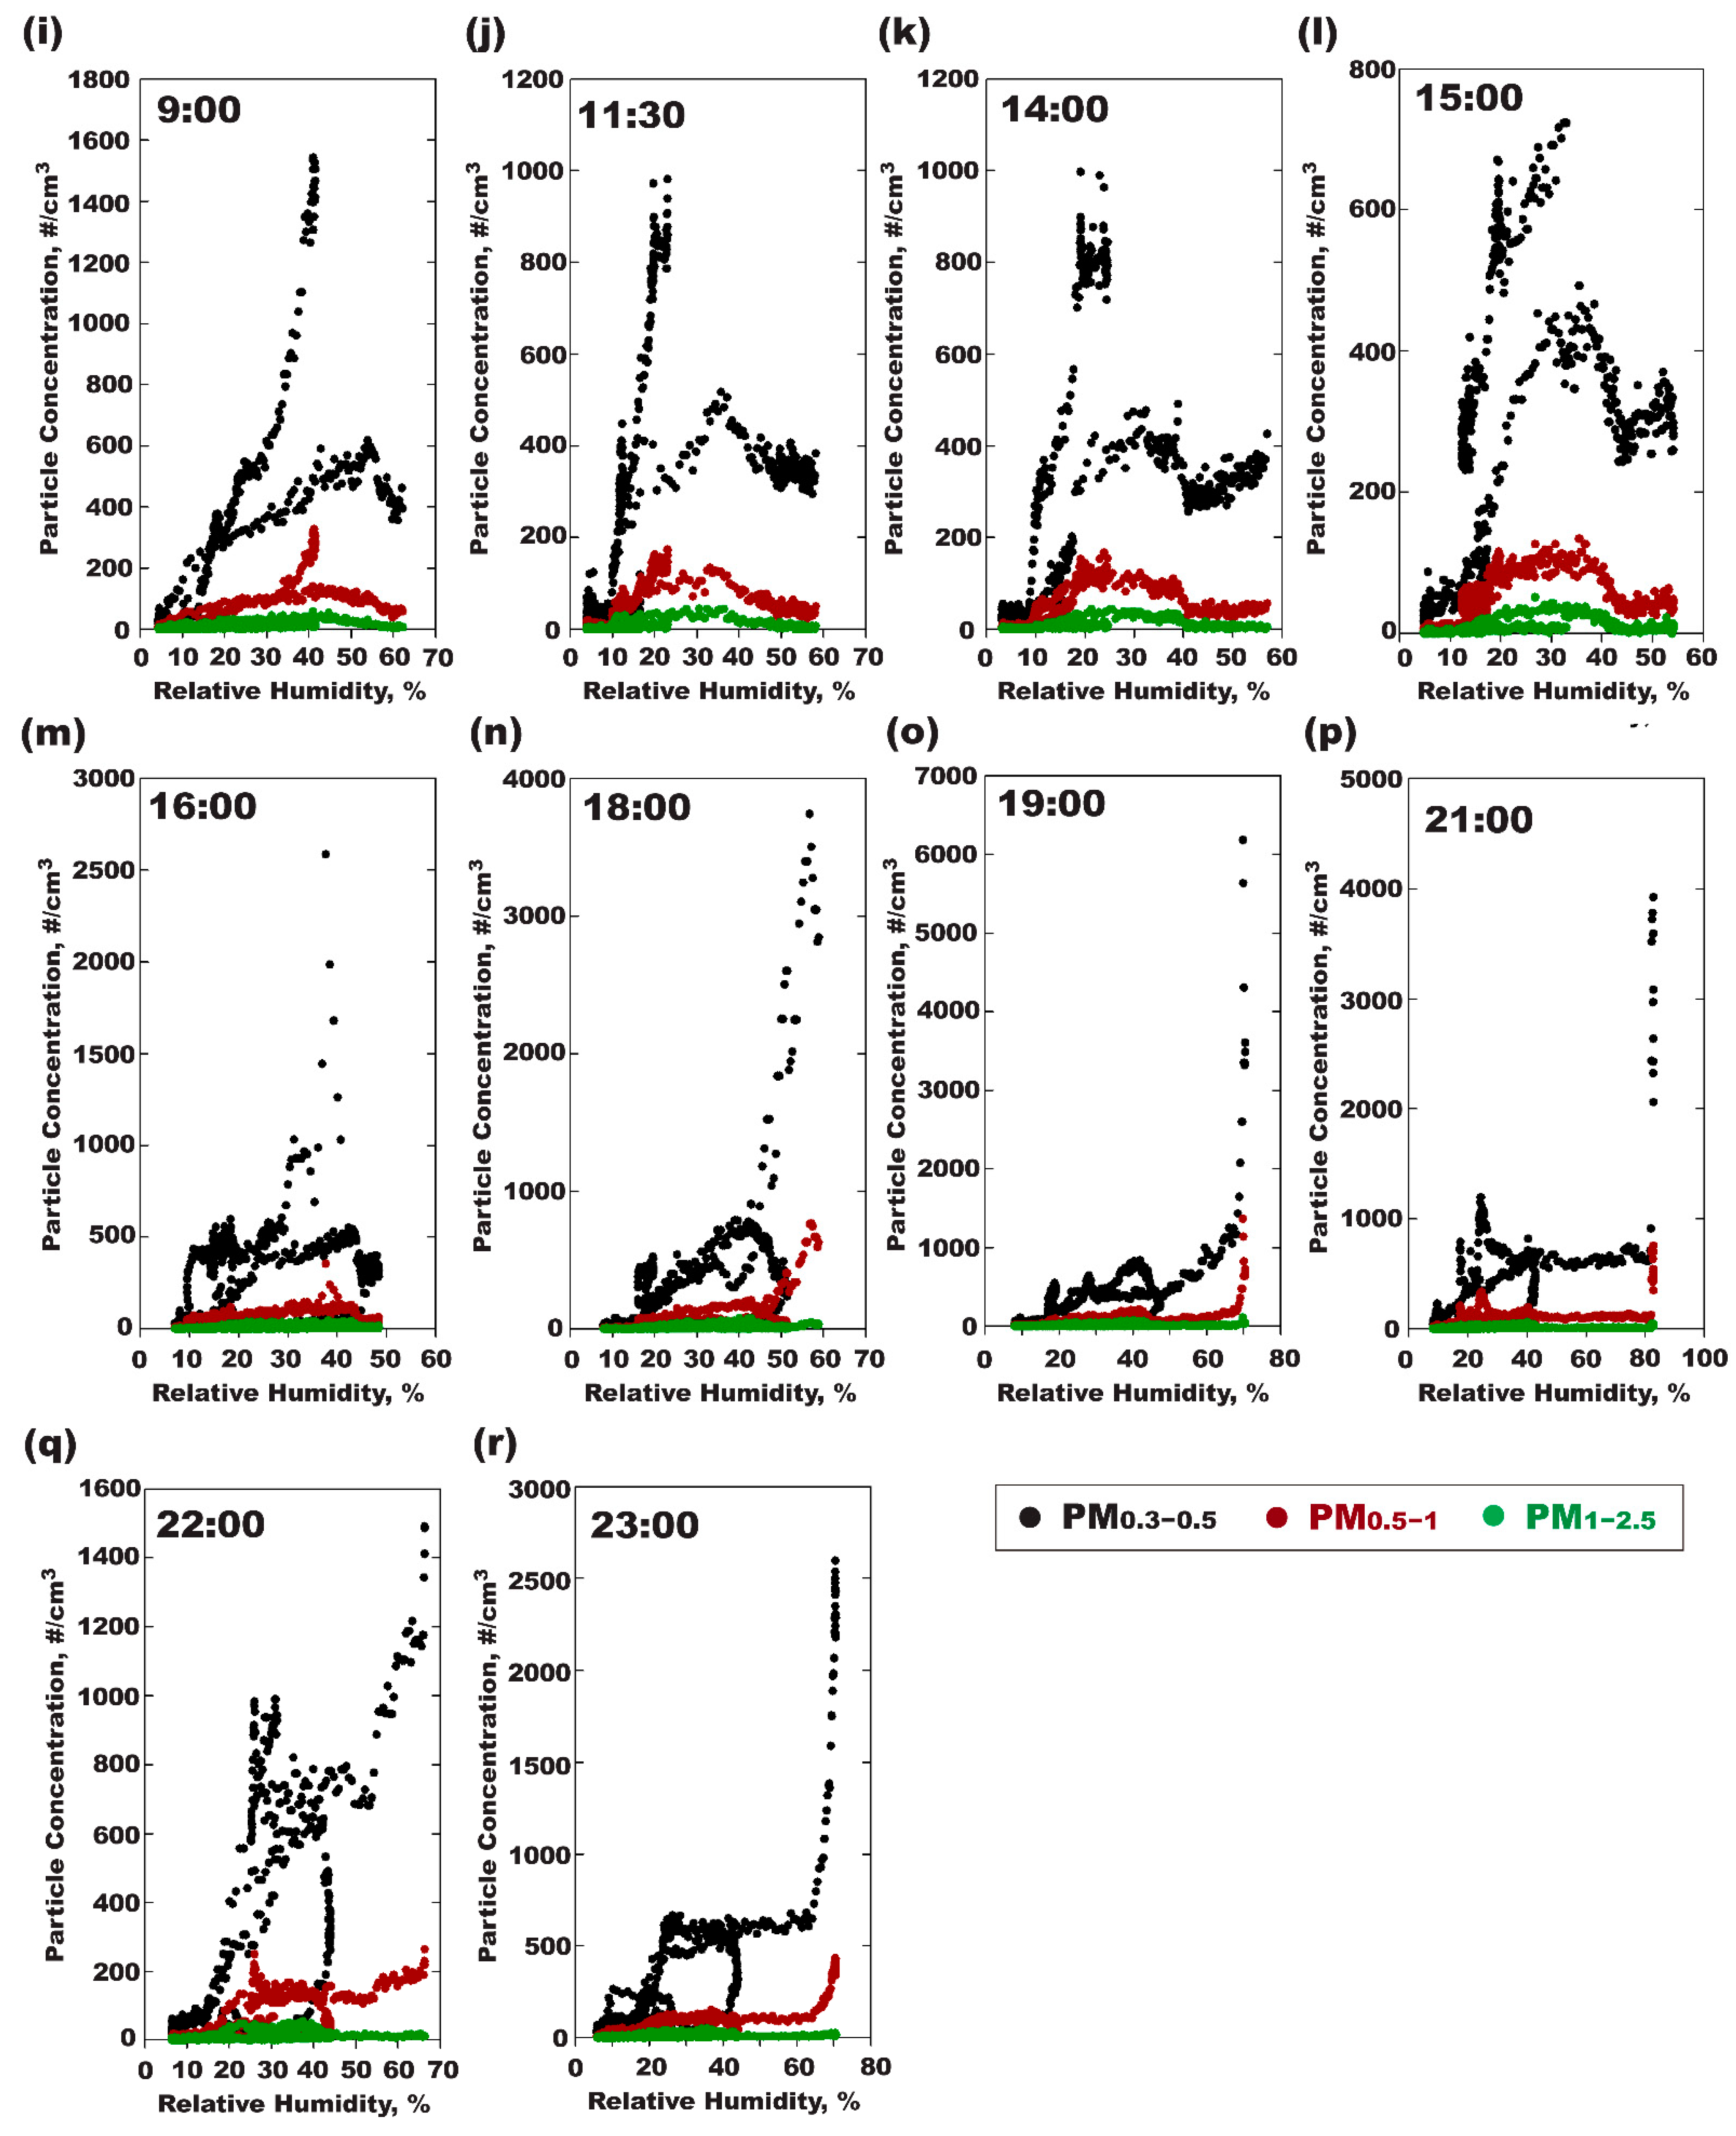
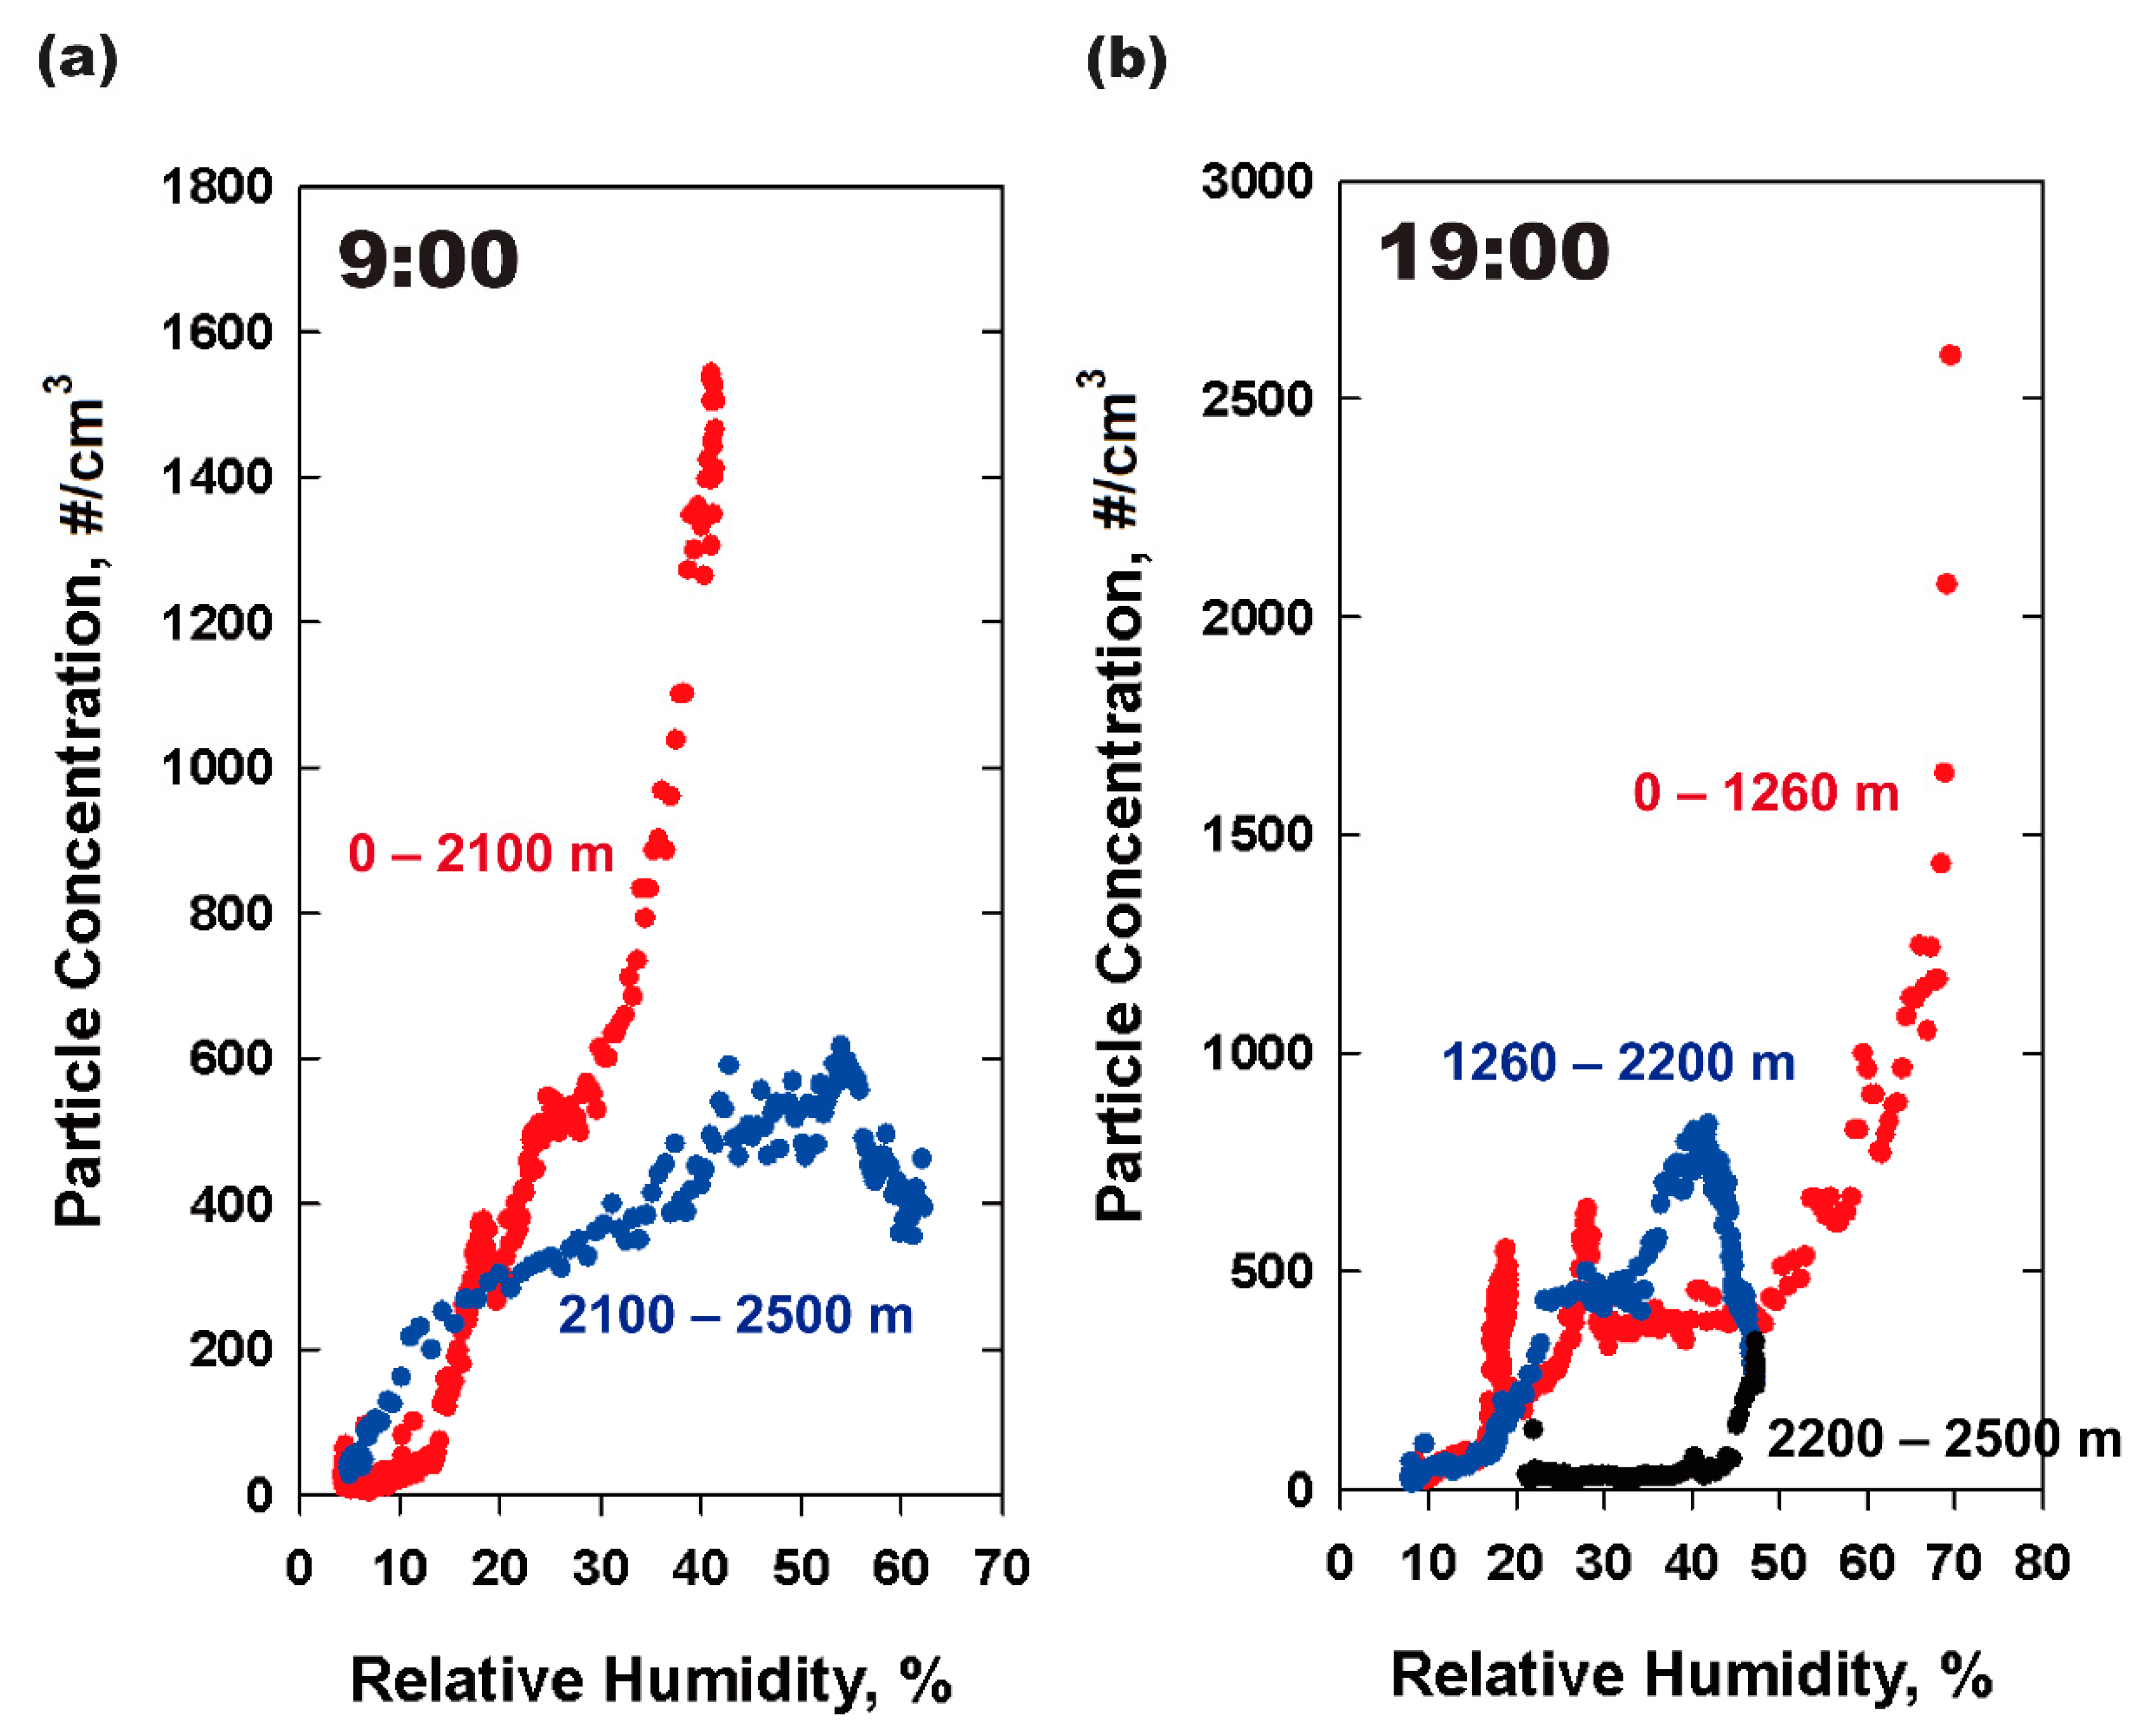
3.3.3. Relationship Between RH and Particle Concentration

To explore the relationship between RH and particle number concentrations, the measured concentrations were plotted against RH in Figure 7. The data indicate a positive correlation between RH and PM concentrations, particularly for smaller particles (i.e., 0.3–0.5 μm), reflecting their higher sensitivity to RH due to hygroscopic growth. This trend is most evident during the late night to early morning hours (e.g., 2:00 to 9:00), where RH variations strongly influence particle concentrations, as shown by the steep slopes in Figure 7b–i. Notably, different slopes are observed across these time periods, suggesting temporal variations in the relationship between RH and particle concentrations. These variations could arise from changes in boundary layer dynamics, atmospheric stability, or aerosol properties. After 16:00 (Figure 7m–o), the trends become less distinct as RH levels decrease near the surface and atmospheric mixing weakens, resulting in the reduced sensitivity of particle concentrations to RH changes.
Figure 8 illustrates the relationship between RH and PM0.3–0.5 number concentrations at two representative time points: (a) 9:00 and (b) 19:00. In Figure 8a (9:00), the data are divided into two distinct altitude regions: 0–2100 m (red) and 2100–2500 m (blue). Below 2100 m, a strong proportional relationship is observed between RH and PM concentrations, reflecting the dominant influence of hygroscopic growth in the well-mixed boundary layer. Above 2100 m, the trend becomes weaker, indicating a transition to a more stable, stratified atmospheric layer with limited vertical mixing. In Figure 8b (19:00), three altitude regions are identified: 0–1260 m (red), 1260–2200 m (blue), and 2200–2500 m (black). The proportional relationship between RH and PM concentrations is strongest in the lowest region (0–1260 m), where RH variations directly influence particle concentrations. In the intermediate region (1260–2200 m), the relationship becomes less consistent, potentially due to weaker mixing and residual effects of earlier convective activity. Above 2200 m, the trend is almost negligible, reflecting the stability of the upper atmospheric layer during the evening. The comparison of these two time points highlights the impact of diurnal boundary layer dynamics on the RH–PM relationship. At 9:00, the morning transition from a nocturnal stable layer to a convective boundary layer results in clear altitude-dependent trends. By 19:00, as radiative cooling re-establishes a stable nocturnal layer, vertical mixing is suppressed, leading to more stratified particle distributions.

4. Conclusions

This study utilized a UAV-based measurement system to capture high-resolution vertical profiles of PM and meteorological parameters above 1 km altitude, addressing critical gaps often overlooked by conventional surface-based and upper air observational platforms. By employing miniaturized particle counters integrated with meteorological sensors, distinct vertical layers were identified where RH significantly influenced aerosol dynamics, particularly through hygroscopic growth. Notably, at an altitude range of approximately 300–600 m, particle number concentrations increased by up to 25% under high RH conditions (R2 = 0.85, p < 0.05). These findings underscore the importance of hygroscopic processes and highlight how changes in wind direction, temperature inversions, and airflow patterns can significantly influence aerosol distributions beyond the well-mixed boundary layer.
This study highlights the effectiveness and advantages of UAV-based vertical profiling for characterizing the vertical distribution of particulate matter and its interaction with meteorological variables in atmospheric regions often underrepresented by conventional platforms, such as ground-based monitoring networks, large-scale aircraft campaigns, and satellite observations. The high-resolution data captured through UAV operations offer unique insights into altitude-specific aerosol behavior, bridging critical gaps in atmospheric measurements where vertical trends and boundary layer dynamics are poorly resolved. The flexibility, cost-effectiveness, and operational frequency of UAV-based observations make them a powerful tool for advancing air quality management, informing targeted pollution control strategies, and validating atmospheric models. Furthermore, the ability of UAVs to capture fine-scale vertical structures can support the refinement of chemical transport models, improve climate impact assessments, and contribute to more effective pollution mitigation efforts by reducing uncertainties in aerosol distribution and transport processes.
While this study demonstrates the significant potential of UAV-based observations, it also acknowledges certain limitations. The measurements were confined to specific seasonal and geographic conditions, and the focus was primarily on particle number concentrations without chemical composition analysis. Additionally, although the UAV reached a maximum altitude of approximately 2.5 km, laboratory or reference-grade validation above 300 m has not yet been fully conducted. Future research should prioritize multi-seasonal and multi-regional campaigns to explore seasonal and spatial variability in aerosol dynamics, as well as expand validation efforts by collaborating with research facilities capable of operating at higher altitudes or utilizing specialized platforms such as balloon-borne methods.

Supplementary Materials

The following supporting information can be downloaded at: https://www.mdpi.com/article/10.3390/atmos16010093/s1, Figure S1: Miniaturized aerosol measurement instruments integrated into the UAV platform; Figure S2: Experimental locations and UAV comparative measurements; Figure S3: Comparison between tower-based and drone-based measurements for temperature, relative humidity, wind direction, and wind speed; Figure S4: Diurnal variations of WD, WS, T, and RH with altitude up to 2500 m, measured hourly from 1:00 to 23:00.

Author Contributions

Conceptualization, W.Y.K. and H.L.; methodology, W.Y.K.; validation, W.Y.K., S.G.L. and H.L.; formal analysis, W.Y.K.; investigation, W.Y.K.; resources, H.L.; data curation, W.Y.K.; writing—original draft preparation, W.Y.K.; writing—review and editing, H.L. and K.-H.A.; visualization, W.Y.K.; supervision, H.L. and K.-H.A.; project administration, H.L.; funding acquisition, K.-H.A. All authors have read and agreed to the published version of the manuscript.

Funding

This research received no external funding.

Institutional Review Board Statement

Not applicable.

Informed Consent Statement

Not applicable.

Data Availability Statement

The original contributions presented in this study are included in the article/Supplementary Materials. Further inquiries can be directed to the corresponding author(s).

Acknowledgments

This work was supported by Inha University research grant.

Conflicts of Interest

The authors declare no conflicts of interest.

References

  1. Dockery, D.W.; Pope, C.A., III; Xu, X.; Spengler, J.D.; Ware, J.H.; Fay, M.E.; Ferris, B.G., Jr.; Speizer, F.E. An association between air pollution and mortality in six US cities. N. Engl. J. Med. 1993, 329, 1753–1759. [Google Scholar] [CrossRef]
  2. Pope, C.A., III; Dockery, D.W. Health effects of fine particulate air pollution: Lines that connect. J. Air Waste Manag. Assoc. 2006, 56, 709–742. [Google Scholar] [CrossRef]
  3. Dominici, F.; Peng, R.D.; Bell, M.L.; Pham, L.; McDermott, A.; Zeger, S.L.; Samet, J.M. Fine particulate air pollution and hospital admission for cardiovascular and respiratory diseases. JAMA 2006, 295, 1127–1134. [Google Scholar] [CrossRef] [PubMed]
  4. Harrison, R.M.; Yin, J. Particulate matter in the atmosphere: Which particle properties are important for its effects on health? Sci. Total Environ. 2000, 249, 85–101. [Google Scholar] [CrossRef]
  5. Zhang, R.; Li, Q.; Zhang, R. Meteorological conditions for the persistent severe fog and haze episode in January 2013 in central-eastern China. Sci. China Earth Sci. 2014, 57, 26–35. [Google Scholar]
  6. Van Donkelaar, A.; Martin, R.V.; Brauer, M.; Kahn, R.; Levy, R.; Verduzco, C.; Villeneuve, P.J. Global estimates of ambient fine particulate matter concentrations from satellite-based aerosol optical depth: Development and application. Environ. Health Perspect. 2010, 118, 847–855. [Google Scholar] [CrossRef]
  7. Wang, X.; Bi, X.; Sheng, G.; Fu, J. Chemical composition and sources of PM10 and PM2.5 aerosols in Guangzhou, China. Environ. Monit. Assess. 2006, 119, 425–439. [Google Scholar] [CrossRef] [PubMed]
  8. Kulmala, M.; Riipinen, I.; Sipilä, M.; Manninen, H.E.; Petäjä, T.; Junninen, H.; Dal Maso, M.; Mordas, G.; Mirme, A.; Vana, M.; et al. Toward direct measurement of atmospheric nucleation. Science 2007, 318, 89–92. [Google Scholar] [CrossRef] [PubMed]
  9. Li, Y.; Yuan, S.; Fan, S.; Song, Y.; Wang, Z.; Yu, Z.; Li, T.; Chen, X.; Wang, W.; Liu, Y. Satellite remote sensing for estimating PM2.5 and its components. Curr. Pollut. Rep. 2021, 7, 72–87. [Google Scholar] [CrossRef]
  10. Ma, Y.; Zhu, Y.; Liu, B.; Li, H.; Jin, S.; Zhang, Y.; Hu, W.; Liang, G.; Wang, L.; Gong, W. Estimation of the vertical distribution of particle matter (PM2.5) concentration and its transport flux from lidar measurements based on machine learning algorithms. Atmos. Chem. Phys. 2021, 21, 17003–17016. [Google Scholar] [CrossRef]
  11. Clarke, A.; Kapustin, V. Hemispheric aerosol vertical profiles: Anthropogenic impacts on optical depth and cloud nuclei. Science 2010, 329, 1488–1492. [Google Scholar] [CrossRef]
  12. Huebert, B.J.; Bates, T.S.; Russell, P.B.; Shi, G.; Seinfeld, J.H.; Albrecht, B.A.; Kim, Y.J.; Kawamura, K.; Carmichael, G.R.; Nakajima, T. An overview of ACE-Asia: Strategies for quantifying the relationships between Asian aerosols and their climatic impacts. J. Geophys. Res. Atmos. 2003, 108, 8633. [Google Scholar] [CrossRef]
  13. Singh, H.B.; Brune, W.H.; Crawford, J.H.; Jacob, D.J.; Russell, P.B. Overview of the summer 2004 Intercontinental Chemical Transport Experiment–North America (INTEX-A). J. Geophys. Res. Atmos. 2006, 111, D24. [Google Scholar] [CrossRef]
  14. Anderson, B.E.; Cofer, W.R.; Crawford, J.; Gregory, G.L.; Vay, S.A.; Brunke, K.E.; Kondo, Y.; Koike, M.; Schlager, H.; Baughcum, S.L.; et al. An assessment of aircraft as a source of particles to the upper troposphere. Geophys. Res. Lett. 1999, 26, 3069–3072. [Google Scholar] [CrossRef]
  15. Deshler, T. A review of global stratospheric aerosol: Measurements, importance, life cycle, and local stratospheric aerosol. Atmos. Res. 2008, 90, 223–232. [Google Scholar] [CrossRef]
  16. Hofmann, D.J. Twenty years of balloon-borne tropospheric aerosol measurements at Laramie, Wyoming. J. Geophys. Res. Atmos. 1993, 98, 12753–12766. [Google Scholar] [CrossRef]
  17. Ansmann, A.; Riebesell, M.; Wandinger, U.; Weitkamp, C.; Voss, E.; Lahmann, W.; Michaelis, W. Combined Raman elastic-backscatter lidar for vertical profiling of moisture, aerosol extinction, backscatter, and lidar ratio. Appl. Phys. B 1992, 55, 18–28. [Google Scholar] [CrossRef]
  18. Sicard, M.; Pérez, C.; Rocadenbosch, F.; Baldasano, J.M.; García-Vizcaino, D. Mixed-layer depth determination in the Barcelona coastal area from regular lidar measurements: Methods, results and limitations. Bound. Layer Meteorol. 2006, 119, 135–157. [Google Scholar] [CrossRef]
  19. Winker, D.M.; Hunt, W.H.; McGill, M.J. Initial performance assessment of CALIOP. Geophys. Res. Lett. 2007, 34, L19803. [Google Scholar] [CrossRef]
  20. Liu, Z.; Omar, A.; Vaughan, M.; Hair, J.; Kittaka, C.; Hu, Y.; Powell, K.; Trepte, C.; Winker, D.; Poole, L.; et al. CALIPSO lidar observations of the optical properties of Saharan dust: A case study of long-range transport. J. Geophys. Res. Atmos. 2008, 113, D07207. [Google Scholar] [CrossRef]
  21. Wang, J.; Martin, S.T. Satellite characterization of urban aerosols: Importance of including hygroscopicity and mixing state in the retrieval algorithms. J. Geophys. Res. Atmos. 2007, 112, D17105. [Google Scholar] [CrossRef]
  22. Villa, T.F.; Salimi, F.; Morton, K.; Morawska, L.; Gonzalez, F. Development and validation of a UAV based system for air pollution measurements. Sensors 2016, 16, 2202. [Google Scholar] [CrossRef] [PubMed]
  23. Altstädter, B.; Platis, A.; Wehner, B.; Scholtz, A.; Wildmann, N.; Hermann, M.; Kästner, U.; Laukert, G.; Bange, J.; Lampert, A. ALADINA–an unmanned research aircraft for observing vertical and horizontal distributions of ultrafine particles within the atmospheric boundary layer. Atmos. Meas. Tech. 2015, 8, 1627–1639. [Google Scholar] [CrossRef]
  24. Kim, N.G.; Jeong, S.B.; Jin, H.C.; Lee, J.; Kim, K.H.; Kim, S.; Park, Y.; Choi, W.; Kwak, K.H.; Lee, H.; et al. Spatial and PMF analysis of particle size distributions simultaneously measured at four locations at the roadside of highways. Sci. Total Environ. 2023, 893, 164892. [Google Scholar] [CrossRef] [PubMed]
  25. Moreno, T.; Reche, C.; Ahn, K.H.; Eun, H.R.; Kim, W.Y.; Kim, H.S.; Fernández-Iriarte, A.; Amato, F.; Querol, X. Using miniaturised scanning mobility particle sizers to observe size distribution patterns of quasi-ultrafine aerosols inhaled during city commuting. Environ. Res. 2020, 191, 109978. [Google Scholar] [CrossRef]
  26. Barrientos, A.; Colorado, J.; Cerro, J.D.; Martinez, A.; Rossi, C.; Sanz, D.; Valente, J. Aerial remote sensing in agriculture: A practical approach to area coverage and path planning for fleets of mini aerial robots. J. Field Robot. 2011, 28, 667–689. [Google Scholar] [CrossRef]
  27. Tomaštík, J.; Mokroš, M.; Surový, P.; Grznárová, A.; Merganič, J. UAV RTK/PPK method—An optimal solution for mapping inaccessible forested areas? Remote Sens. 2019, 11, 721. [Google Scholar] [CrossRef]
  28. Watts, A.C.; Ambrosia, V.G.; Hinkley, E.A. Unmanned aircraft systems in remote sensing and scientific research: Classification and considerations of use. Remote Sens. 2012, 4, 1671–1692. [Google Scholar] [CrossRef]
  29. Anderson, K.; Gaston, K.J. Lightweight unmanned aerial vehicles will revolutionize spatial ecology. Front. Ecol. Environ. 2013, 11, 138–146. [Google Scholar] [CrossRef]
  30. Crilley, L.R.; Shaw, M.; Pound, R.; Kramer, L.J.; Price, R.; Young, S.; Lewis, A.C.; Pope, F.D. Evaluation of a low-cost optical particle counter (Alphasense OPC-N2) for ambient air monitoring. Atmos. Meas. Tech. 2018, 11, 709–720. [Google Scholar] [CrossRef]
  31. Hwang, I.; Ahn, K.H. Performance evaluation of conventional type conductive cooling continuous flow compact water-based CPC (Hy-WCPC). J. Aerosol Sci. 2017, 113, 12–19. [Google Scholar] [CrossRef]
Figure 1. UAV system equipped with various sensors, including a particle counter, wind speed and direction sensors, and temperature and relative humidity sensors.
Atmosphere 16 00093 g001
Figure 2. Comparison of meteorological parameters measured using the UAV system (colored symbols) and the Boseong meteorological tower (black symbol) at various altitudes: (a) Temperature, (b) relative humidity, (c) wind direction, and (d) wind speed.
Atmosphere 16 00093 g002
Figure 3. Meteorological parameters and particle number concentrations measured in Anmyeondo: (a) Temperature (T, red), relative humidity (RH, blue), wind direction (WD, magenta), and wind speed (WS, black) up to 1000 m a.s.l.; (b) particle concentrations for different size ranges (PM0.3–0.5 in black, PM0.5–1.0 in brown, and PM1.0–2.5 in green).
Atmosphere 16 00093 g003
Figure 4. Relationship between relative humidity and particle concentration at different altitude ranges.
Atmosphere 16 00093 g004
Figure 5. Diurnal variations in temperature (red), relative humidity (blue), wind speed (black), and wind direction (magenta) with altitude from (a) 1:00 to (k) 22:00.
Atmosphere 16 00093 g005aAtmosphere 16 00093 g005b
Figure 6. Diurnal variations in temperature (red), relative humidity (blue), and particle concentrations for different size ranges (0.3–0.5 μm in black, 0.5–1.0 μm in brown, and 1.0–2.5 μm in green) with altitude from (a) 1:00 to (r) 23:00.
Atmosphere 16 00093 g006aAtmosphere 16 00093 g006b
Figure 7. Relationship between relative humidity and particle concentrations for different size ranges (0.3–0.5 μm in black, 0.5–1.0 μm in brown, and 1.0–2.5 μm in green) from (a) 1:00 to (r) 23:00.
Atmosphere 16 00093 g007aAtmosphere 16 00093 g007b
Figure 8. Relationship between relative humidity and PM0.3–0.5 number concentrations at different altitudes at (a) 9:00 and (b) 19:00.
Atmosphere 16 00093 g008
Disclaimer/Publisher’s Note: The statements, opinions and data contained in all publications are solely those of the individual author(s) and contributor(s) and not of MDPI and/or the editor(s). MDPI and/or the editor(s) disclaim responsibility for any injury to people or property resulting from any ideas, methods, instructions or products referred to in the content.

