1. Introduction
Hydrogeological and other climate-related hazards, such as floods, storms, and heatwaves, cause significant economic losses due to extensive damage to properties and infrastructure [
1], health and wellbeing degradation, and a considerable number of human fatalities worldwide [
2,
3,
4,
5,
6]. Between 1980 and 2020, weather and climate-related extremes in Europe accounted for 80% of total economic losses caused by natural hazards, amounting to EUR 487 billion [
7].
The Mediterranean region is considered a hot spot of high-impact atmospheric processes, and the literature devoted to their presentation, analysis and climatology is very extensive (e.g., [
8,
9]). The major high-impact characteristic of Mediterranean cyclones is flood-producing heavy precipitation, while heat waves are also a climatological risk that has been considered to be a “silent killer” since this specific weather event is not as violent as storms, floods and hurricanes and does not impact infrastructures but it can result in a large number of fatalities. In addition, wildfires are an additional climate-related hazard, especially in southern Europe, as the Mediterranean climate favors both the ignition and the spread of wildfires. Investigation of the spatiotemporal variability of fire weather conditions over recent decades in the Euro-Mediterranean area has attracted many researchers’ interest (e.g., [
10,
11,
12,
13,
14]). For example, Giannaros T.M. et al. (2020) [
12] have recently provided a spatiotemporal mapping of fire weather conditions in Europe and the Mediterranean, aiming to investigate potential long-term trends of fire weather conditions (period 1987–2016). The authors reported increasing trends of extreme fire weather conditions over the Iberian Peninsula and eastern Balkans and decreasing trends over the southeast Mediterranean. Moreover, Giannaros and Papavasileiou (2023) [
15] studied the changes in fire weather extremes in Europe and found that they have become more frequent in recent decades. They affect increasingly larger areas and occur both earlier and later in the fire season.
Greece lies in the southeast corner of Europe, with a typical Mediterranean climate characterized by relatively mild and wet winters and hot and dry summers. However, the complex topography of the country, together with the prevailing synoptic-scale weather systems, causes significant spatial variability of climatic and weather conditions, even within distances of a few tenths of kilometers. As a result, significant deviations from what is considered a typical Mediterranean climate can be often observed. Greece is suffering from extreme weather events and their impacts, spanning from the “Daniel” storm (4–7 September 2023), classified as a 1-in-200 years weather event that resulted in billions of euros losses and a complete loss of 25% of Thessaly’s primary sector output [
16,
17] and “Ianos” medicane [
18] that also produced the second largest economic impacts mostly in the same area (>30 million EUR of damage on 16–20 September 2020), to the extreme duration of heat waves of summer 2021 and the closely connected increase of burnt areas (>500% increase compared to the average yearly burnt areas). Extreme weather events are expected to increase in the future climate. The literature review shows that the assessments for Greece are quite fragmentary in terms of the spatial and temporal resolutions and periods discussed. Specifically, some findings are provided at a country scale only, and others are for a limited number of Greek cities.
This paper focuses on the analysis of the frequency and trends of severe weather and climate-related events over Greece based on existing literature and exploration of multiple data sources focusing on the most recent period of 2010–2023 when the extended network of surface weather stations in Greece permits analysis at the prefecture level. At the same time, we leverage the use of the longest existing time series of weather data in the center of Athens to span the analysis backward in the past. The aim is to tackle various severe events, from temperature, rainfall, thunderstorms, hail, and tornadoes to wildfires, as well as the societal impacts of weather-related hazards in Greece.
The rest of the paper is articulated as follows:
Section 2 is devoted to a brief description of the data sets analyzed in this work.
Section 3 presents the analysis of severe weather events, starting with the heat waves and high rainfall events recorded in the center of Athens, where the longest uninterrupted time series of meteorological data in Greece.
Section 4 focuses on severe weather events overall in Greek territory, spanning from heat waves, high rainfall, convective events, droughts, and fire weather. The impacts of severe weather events in Greece are discussed in
Section 5, while the last session is devoted to the summary of the analyses.
2. Data
For the analyses performed in the frame of this work various databases have been used. Although these databases have varying durations backward in time, we limited the bulk of analysis to the period 2010–2023 for two main reasons:
- (a)
Representative surface meteorological stations (one per regional unit) from the network of automated weather stations (NOAAN) operated by the METEO unit at NOA across Greece [
19] is possible only after 2010 since NOAAN started its operations after 2007. Unfortunately, until these years, no weather data existed in at least 10 regional units shown later in the results and, therefore, our analysis addresses this lack of information.
- (b)
The analysis permits the assessment of the most recent trends, focusing on the last 14 years when climate change shows an acceleration.
In addition to the above dataset, we also used for the period 2010–2023: (a) for the analysis of the convective events the lightning data from the ZEUS lightning detection network operated by the METEO unit at NOA [
20,
21]; (b) for the analysis of hail incidence hail reports from the European Severe Weather Database (ESWD) [
22]; and (c) for the tornado incidence, the tornado reports also from the ESWD [
22].
For the climatic analysis in the center of Athens, the capital of Greece, the historical climatic series of the National Observatory of Athens (NOA) at Thission, which spans more than 1.5 centuries and comprises uninterrupted observations of a variety of climatic and atmospheric variables are used [
23]. Therefore, only for this specific location, where a large fraction of the Greek population resides, the analysis spans over a very long period (more than a century), highlighting the contribution of the National Observatory of Athens in the climate and weather monitoring capacities in the Greek capital.
Finally, for the analysis of the societal impacts of severe/extreme weather events, the following databases have been used:
- (a)
The HIWE-DB (Database of High-Impact Weather Events) for Greece was developed by the METEO unit of the National Observatory of Athens [
24]. This database is systematically updated and available online (
https://meteo.gr/weather_cases.cfm, accessed on 14 January 2025. The events that are considered are floods and flash floods, windstorms, lightning, tornadoes and snow/frost. A lightning event is considered only if it has provoked a fatality. HIWE-DB does not include records of heatwaves and forest fires as the assessment of their socioeconomic impacts requires a different approach from the one applied to the specific database. Moreover, events that caused only agricultural losses are not considered either;
- (b)
the FFEM-DB (Database of Flood Fatalities from the Euro-Mediterranean region) [
2] that hosts data on 2875 flood fatalities from 12 territories in Europe and the broader Mediterranean region. The FFEM-DB database provides data on fatalities’ profiles, location, and contributing circumstances, allowing researchers and flood risk managers to explore demographic, behavioral, and situational factors, as well as environmental features of flood-related mortality. Specifically for Greece, this database is systematically updated up to the present.
The period of analysis for both datasets spans over the period 2000–2023. The selection of this period was dictated by the fact that high-impact events and fatalities are comparatively rare and exhibit variability influenced by societal and environmental factors. Reducing the impact analysis to a shorter period would result in the loss of statistically significant trends, which is essential for discussing preparedness, identifying weaknesses, and suggesting policies.
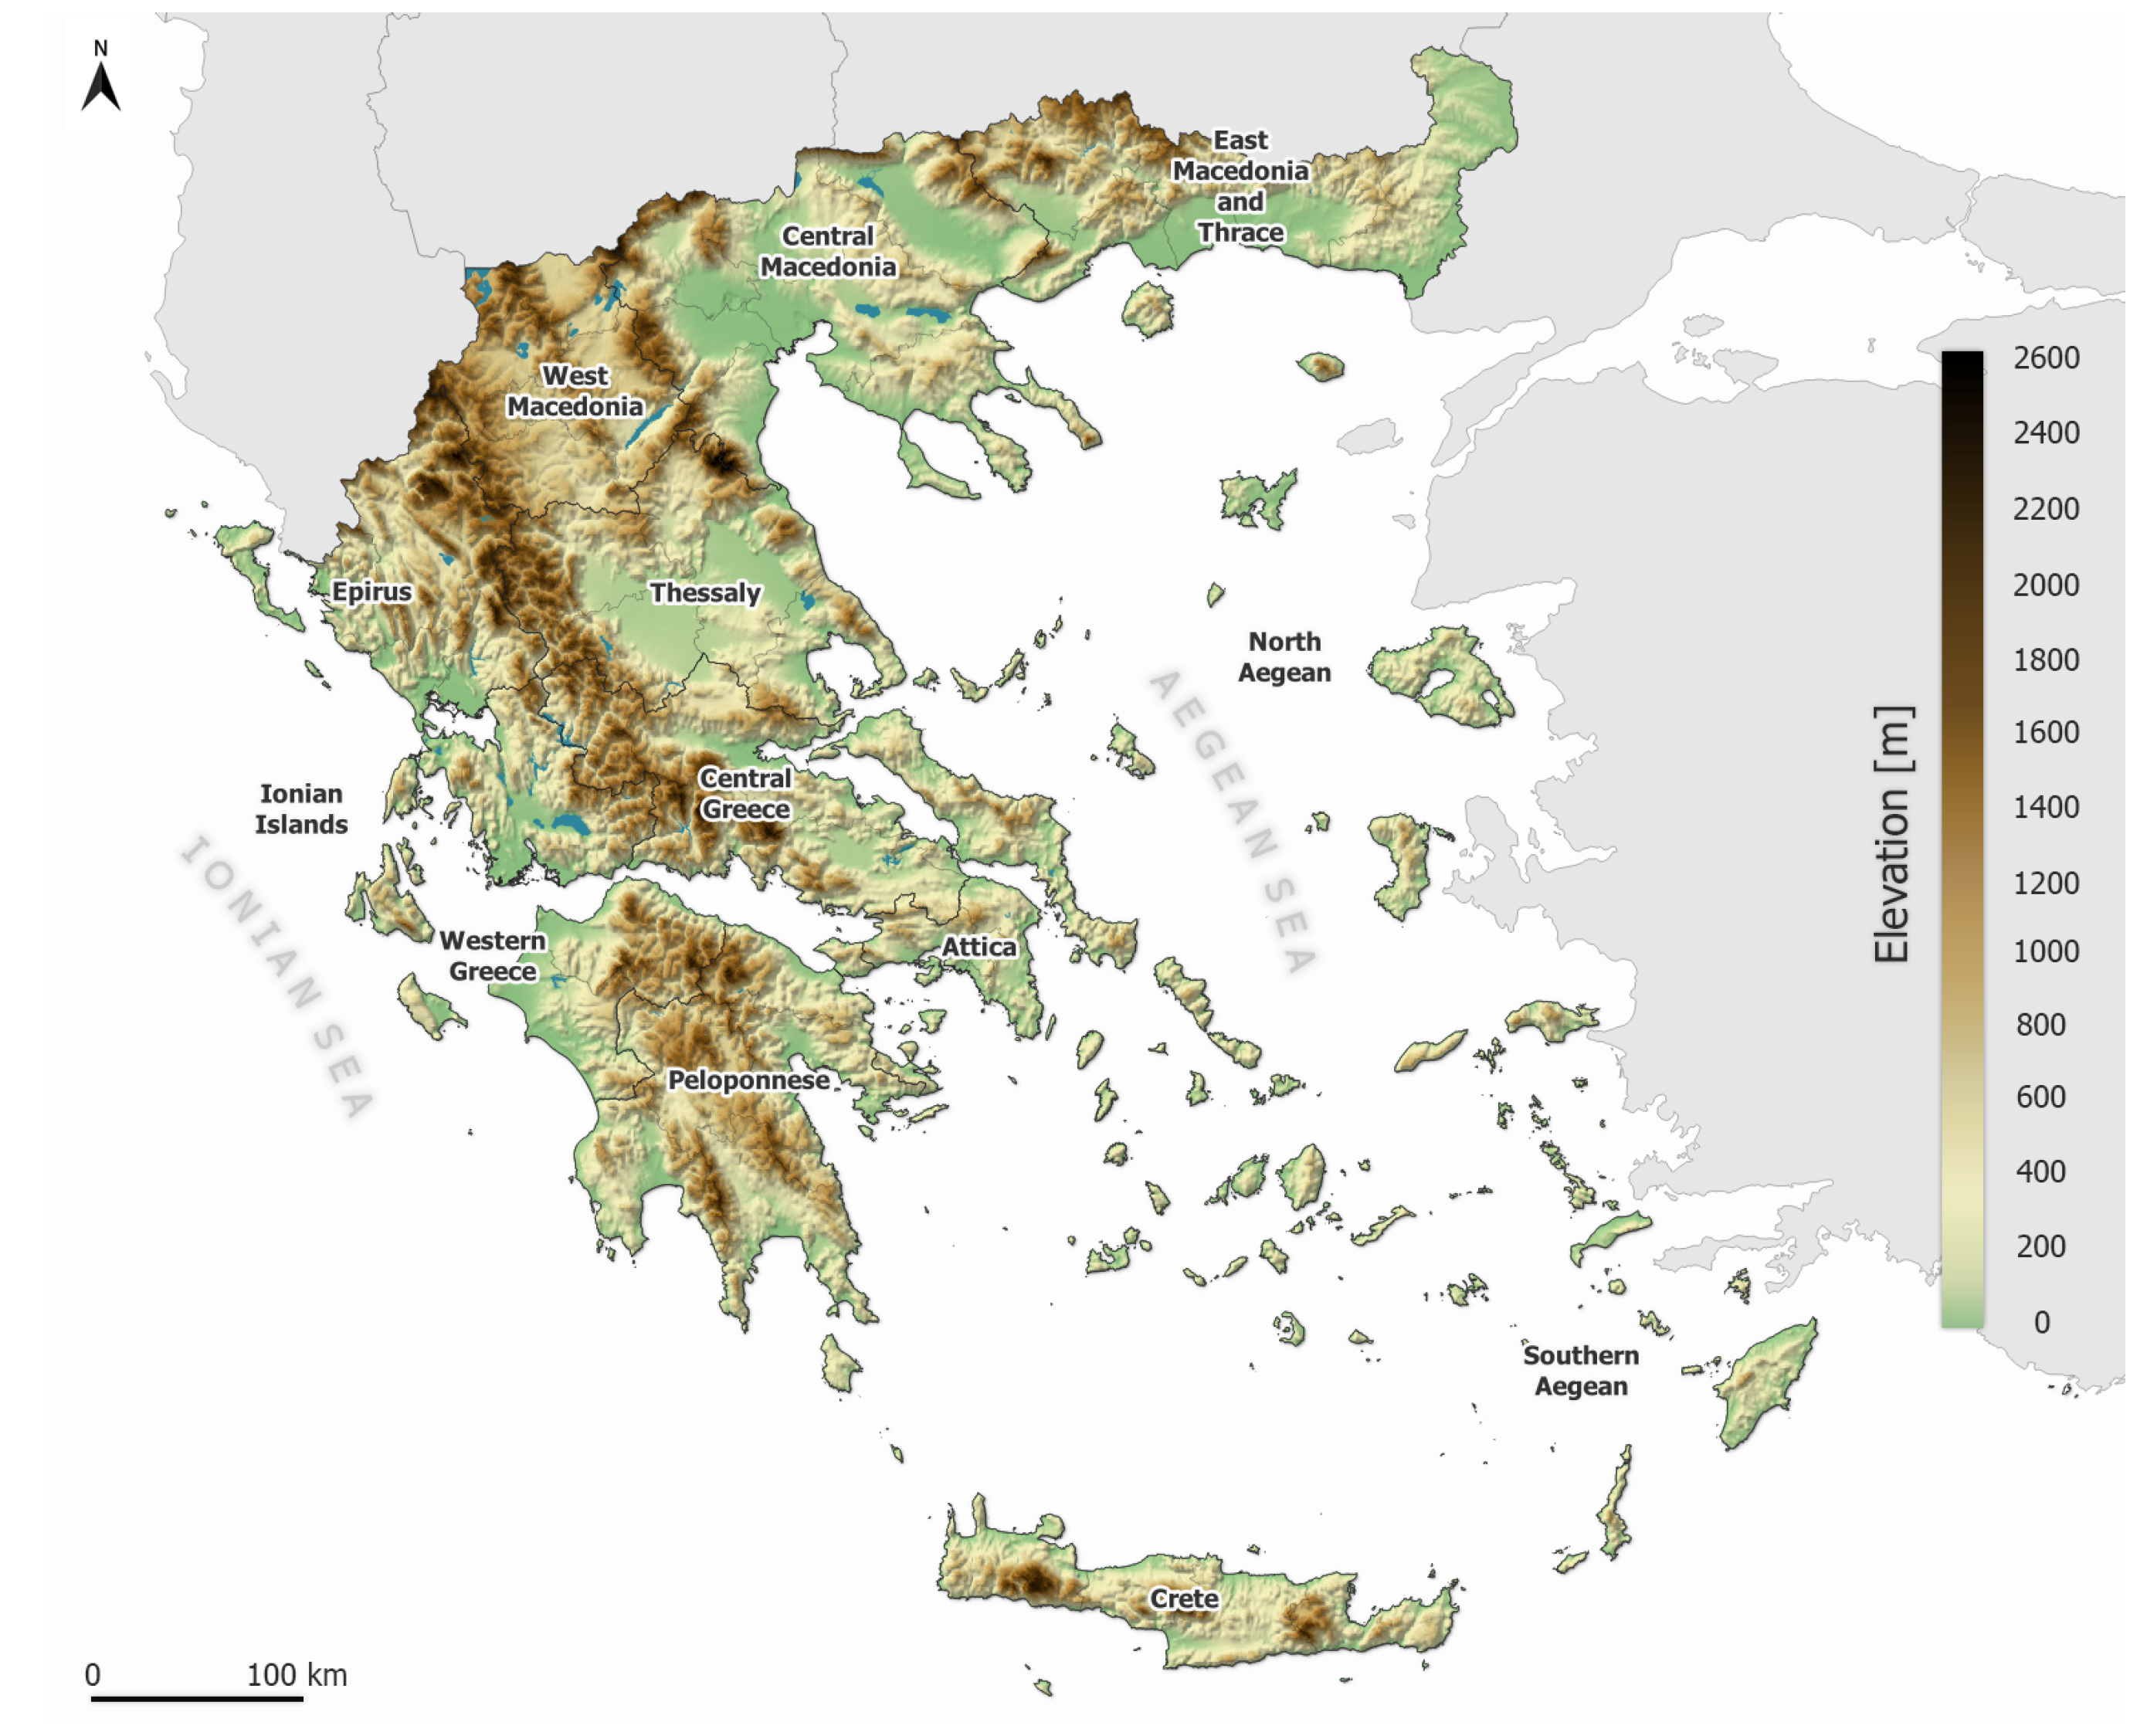
The names of the main locations mentioned in the text, as well as the elevation map of Greece, are shown in
Figure 1.
3. Extreme Climatic Indices in Athens (1901–2023)
The study of climate change in terms of mean values and extremes, in particular, demands the longest and most reliable climatic information. The National Observatory of Athens (NOA) holds in the center of Athens (Thission) the oldest, uninterrupted and most reliable climatic records in Greece [
25], enabling the elaboration of climatic extremes in the area on a centennial scale. Athens has been experiencing a prominent increase in the surface air temperature, especially from the early 1980s onwards, following the general pattern of the eastern Mediterranean warming at rates almost twice as much as the global average. The additive effect of the urban heat island has also enhanced the warming rates in the city [
26]. Notably, Athens belongs to the top-ranked cities of the eastern Mediterranean in terms of future heat-related risk [
27]. The increase in the mean air temperature in Athens has been accompanied by a simultaneous increase in hot extremes.
To gain a better insight into the multiannual changes in extreme temperatures in Athens, the frequency of occurrence of different extreme climatic indices have been aggregated over successive 30-year-long climatic periods spanning more than one century, namely 1901–1930, 1931–1960, 1961–1990, and 1991–2020.
Figure 2 shows the frequency (total number) of extremely hot days, heat waves (HWs) and HW days at Thission station for each climatic period. Hot days are defined as days when the daily maximum temperature (Tmax) is above 37 °C. This threshold value corresponds to the 90th percentile of the summer (June to August) Tmax distribution during the period 1991–2020. As shown in the figure, the frequency of hot days during the more recent climatic period (1991–2020) is higher by a factor of three compared to the average frequency of the past 3 climatic periods.
While hot days may occur individually in summer, they often appear in sequence, representing HW episodes. HWs are defined as a sequence of at least 3 consecutive hot days, namely days when Tmax exceeds 37 °C [
28]. The total number of HW episodes (HWN) along with the frequency of HW days (HWF), namely hot days constituting HW episodes, for each climatic period are also presented in
Figure 2. As shown in the figure, the number of heat waves is very low during the colder periods of the record (1901–1930 and 1961–1990) but higher in the warmer period, 1931–1960. A striking increase in HWN was observed during 1991–2020, which is more than four times higher than the average number of the past three sub-periods. A similar increase is observed in the frequency of HW days during the last climatic period, which is four-fold compared to the average frequency of the past climatic periods. By comparing the frequency of hot days with the frequency of HW days, it is concluded that half of the total number of hot days in summer appears in sequence, constituting organized HW episodes in the more recent climatic period 1991–2020.
In addition to the profound changes in the frequency of hot extremes during recent decades, changes in their seasonality, expressed as earlier onset and later ending of their incidence, have also been found in Athens, resulting in the “expansion” of their season’s length, by up to 5 days/decade since the mid-1970s with respect to the hot days occurrences [
29]. This is further verified by the observed changes in the timing of HWs occurring earlier in the year. While HWs in Athens are common in July and August, they are becoming progressively more frequent in June, especially since 2010.
Athens has witnessed multiple extreme temperature records broken since the beginning of the 21st century. The highest temperature ever recorded at NOA is 44.8 °C which was measured on 26 June 2007, breaking the previous record of 43 °C measured about one century ago (21 June 1916). The year 2010 witnessed the earlier HW ever, while the summer of 2012 was characterized by the largest number of hot days and HW episodes of the record. Greece was hit by very strong and persistent HWs during 2021 and 2023, associated with extreme and catastrophic wildfires in many parts of the country [
30]. Based on the historical climatic records of NOA, the HW of 2021 was ranked first in terms of persistence with a total duration of 10 days, the highest daily minimum (Tmin) and daily average (Tmean) temperatures ever recorded in Athens, with values of 31.6 °C and 36.5 °C, respectively, but also the second highest Tmax of the record (43.9 °C) [
31,
32,
33].
Athens has witnessed marked changes during recent decades, not only in temperature but also in precipitation extremes. According to the historical records of NOA, Athens receives, on average, 400 mm of precipitation per year. Despite the interannual fluctuations, the long-term trend in the annual precipitation amount since 1900 has been found to be almost negligible [
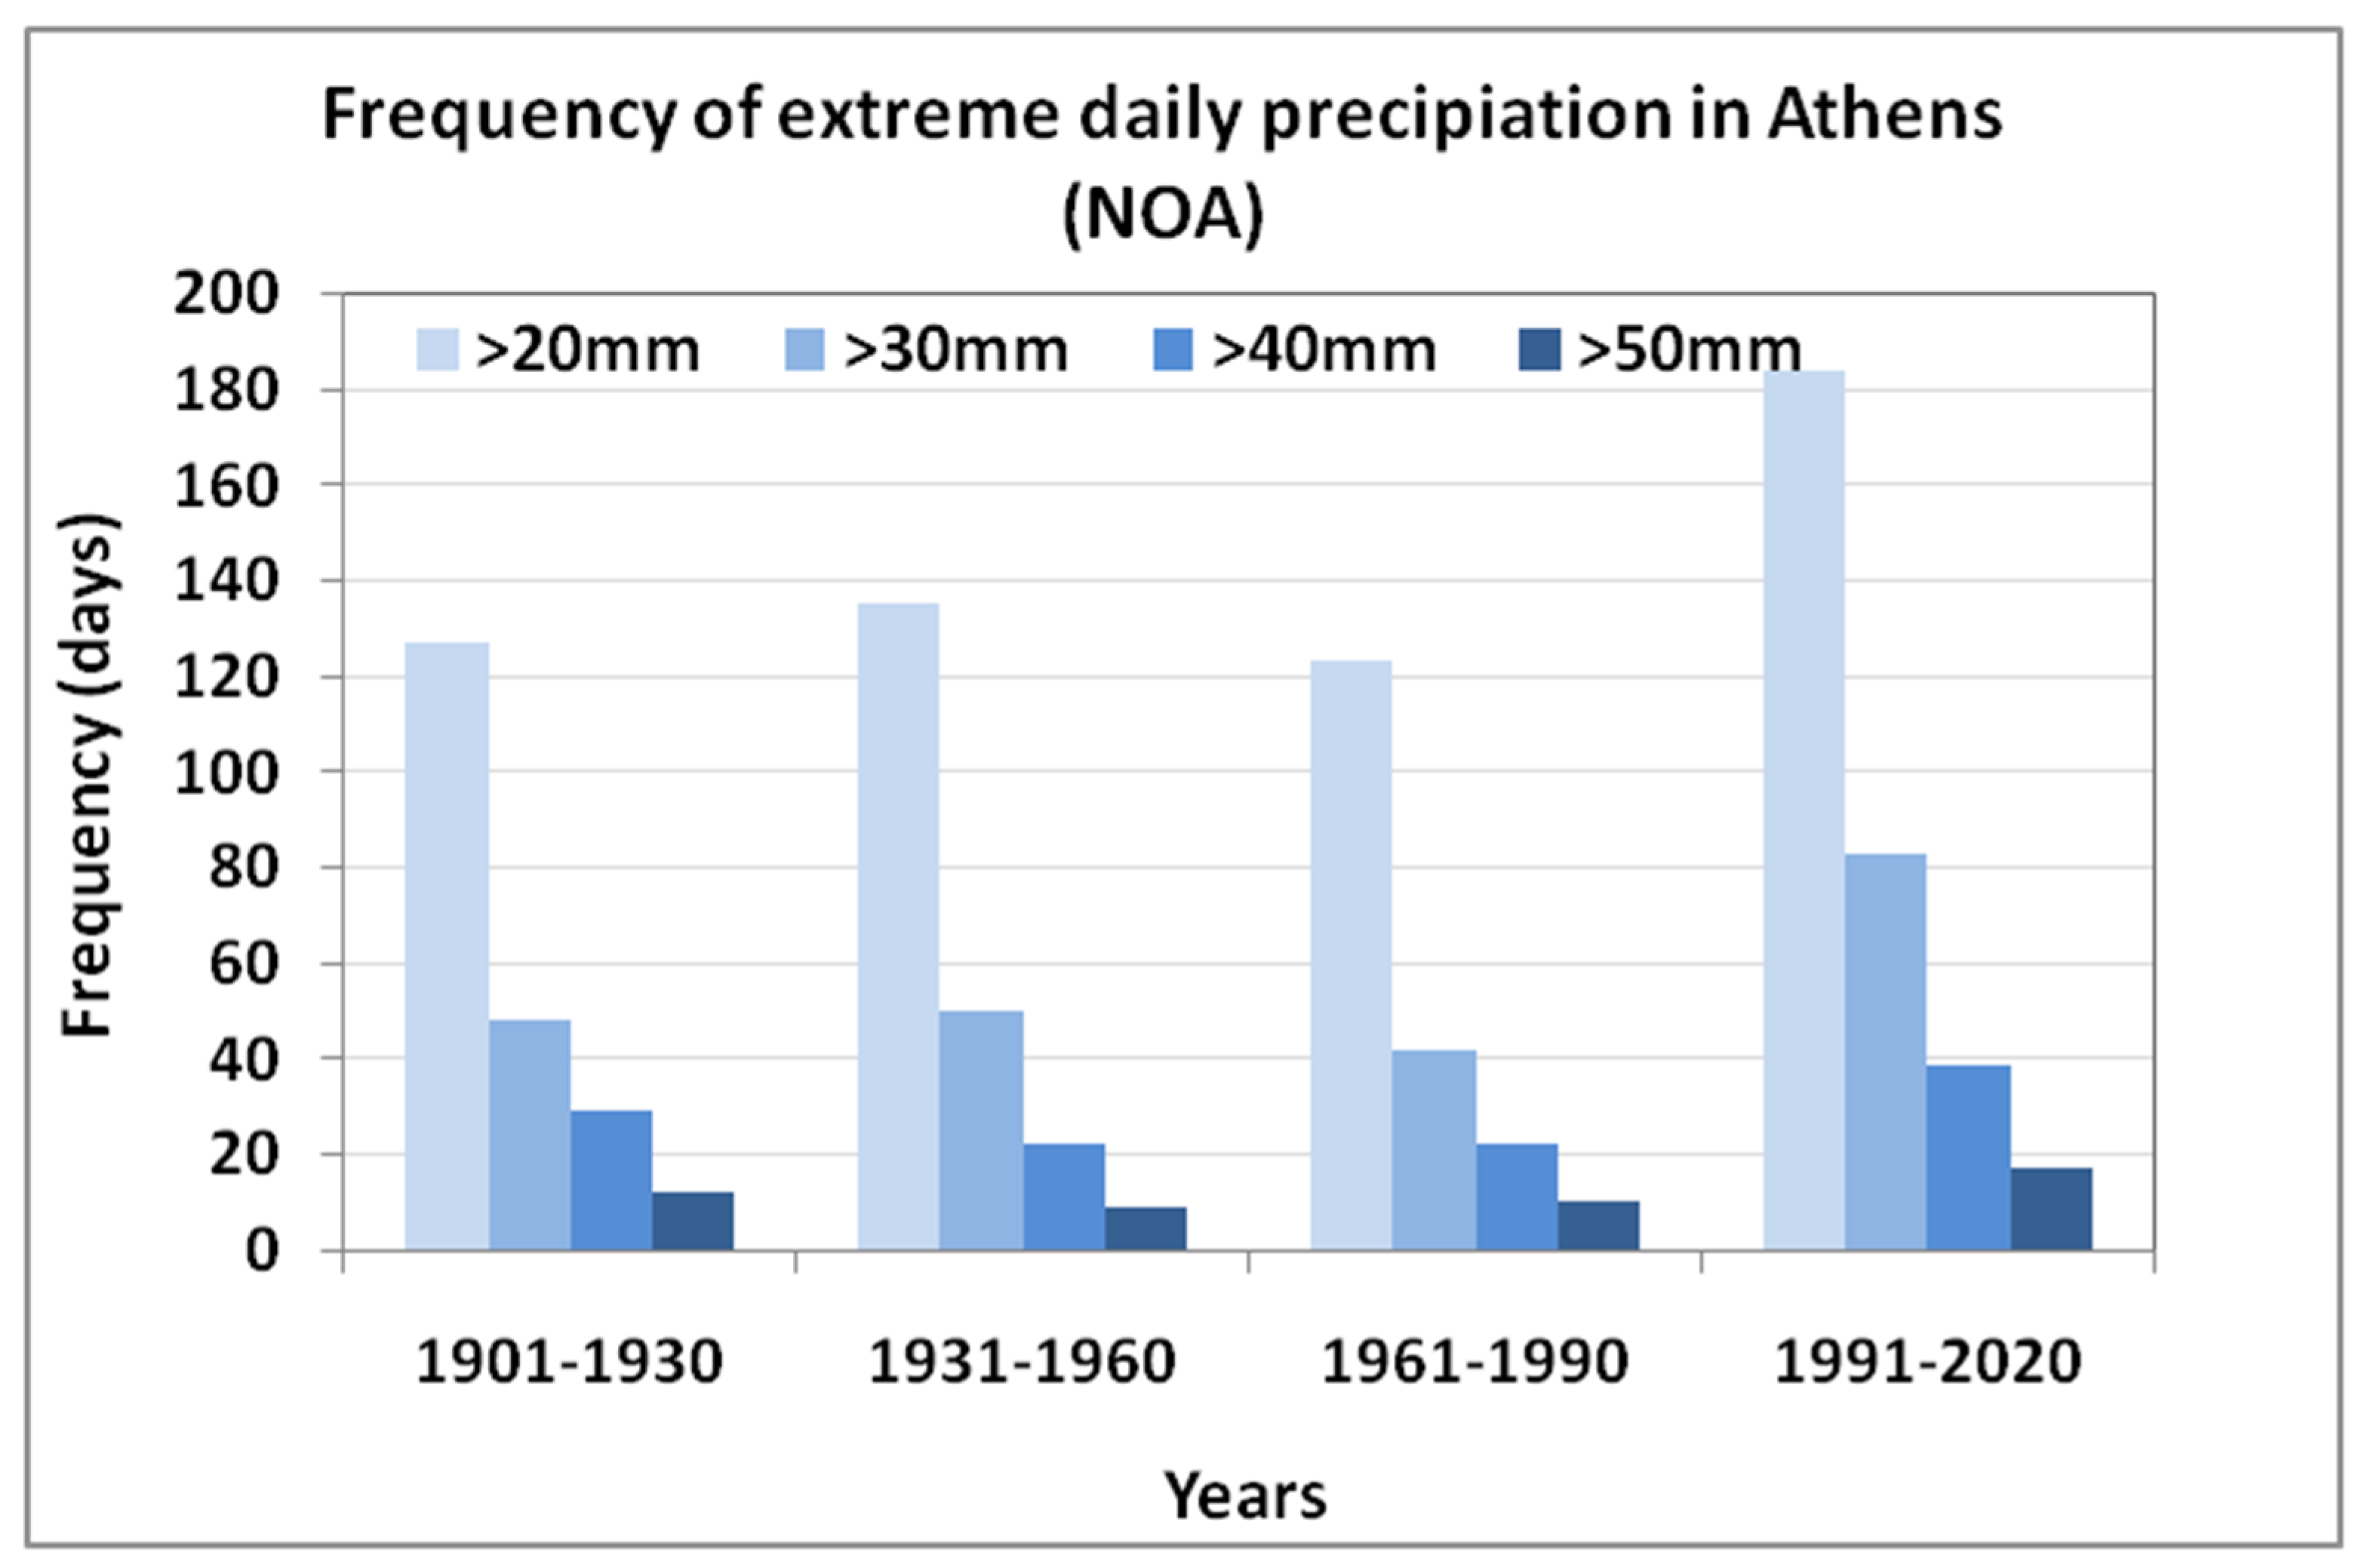
34]. However, extreme precipitation in Athens presents some remarkable changes over the years. In particular, the frequency of heavy or extreme precipitation shows a remarkable increase during the last three decades. As shown in
Figure 3, the cases with daily precipitation >20 mm, >40 mm and >50 mm have increased by approximately 70%, while the cases with daily precipitation >30 mm have almost doubled during the recent climatic period 1991–2020 compared to the average of the past sub-periods. It was also estimated that almost 50% of the total amount of precipitation of the period 1991–2020 was accumulated during episodes of heavy or extreme precipitation (>20 mm/day). This percentage was, on average, much lower (33%) as regards the 3 previous climatic periods.
4. Severe Weather Events in Greece
4.1. Heatwaves
Heat waves (HWs) in the summer months are a common feature of areas characterized by Mediterranean climate, like Greece [
35], especially during July and August. However, in the background of global climate change, the frequency, intensity and duration of HWs in Greece and the greater eastern Mediterranean region have significantly increased in recent decades [
25,
36,
37,
38,
39,
40]. The immediate anthropogenic warming due to the increased greenhouse gas concentrations in the atmosphere has also contributed, to some extent, to the intensification of recent extreme events in the country, such as the late July/early August 2021 heatwave [
32,
33]. These facts are accompanied by increasing observed trends in relevant factors for HWs, including (i) near-surface air temperature and land and sea surface temperature (e.g., [
28,
41,
42]), (ii) indices of temperature extremes (e.g., [
26,
43]), such as hot/warm days—defined as days with daytime maximum temperature exceeding a constant or percentile-based threshold [
44], (iii) human heat stress exposure (e.g., [
45,
46]), and (iv) the period length of hot extremes occurrence (e.g., [
29]).
The strong increase in the trends of HW characteristics is particularly evident after the late 1990s. Kuglitsch et al. (2010) [
39] found that the number, intensity, and length of heat waves have increased by a factor of six to eight in the eastern Mediterranean (statistically significant at various stations over Greece) by comparing the 1960s with the period 1997–2006. Galanaki et al. (2023) [
36], who studied heatwaves’ characteristics and trends in Greece from 1950 to 2020, found that the number of heatwaves has increased by almost 80% since 1990. Furthermore, the areas of Greece that experience at least one heatwave per year have almost doubled after 1990. It is also noteworthy that the number of heatwaves that occurred in June showed an increasing trend during the examined period of study [
36]. In Athens specifically, Founda et al. (2022) [
47] found a statistically significant increase in the frequency, mean, and maximum duration of HWs in Athens (1900–2019) using 15 different HW definitions, but also earlier start and later ending of HWs, resulting to prominent elongation of their season by more than 4 days/decade. Apart from Athens and its greater region, other prone to HWs areas in Greece include the plains of Thessaly, Peloponnese, central and western Macedonia, as well as the western mainland, eastern Aegean islands and Crete [
48].
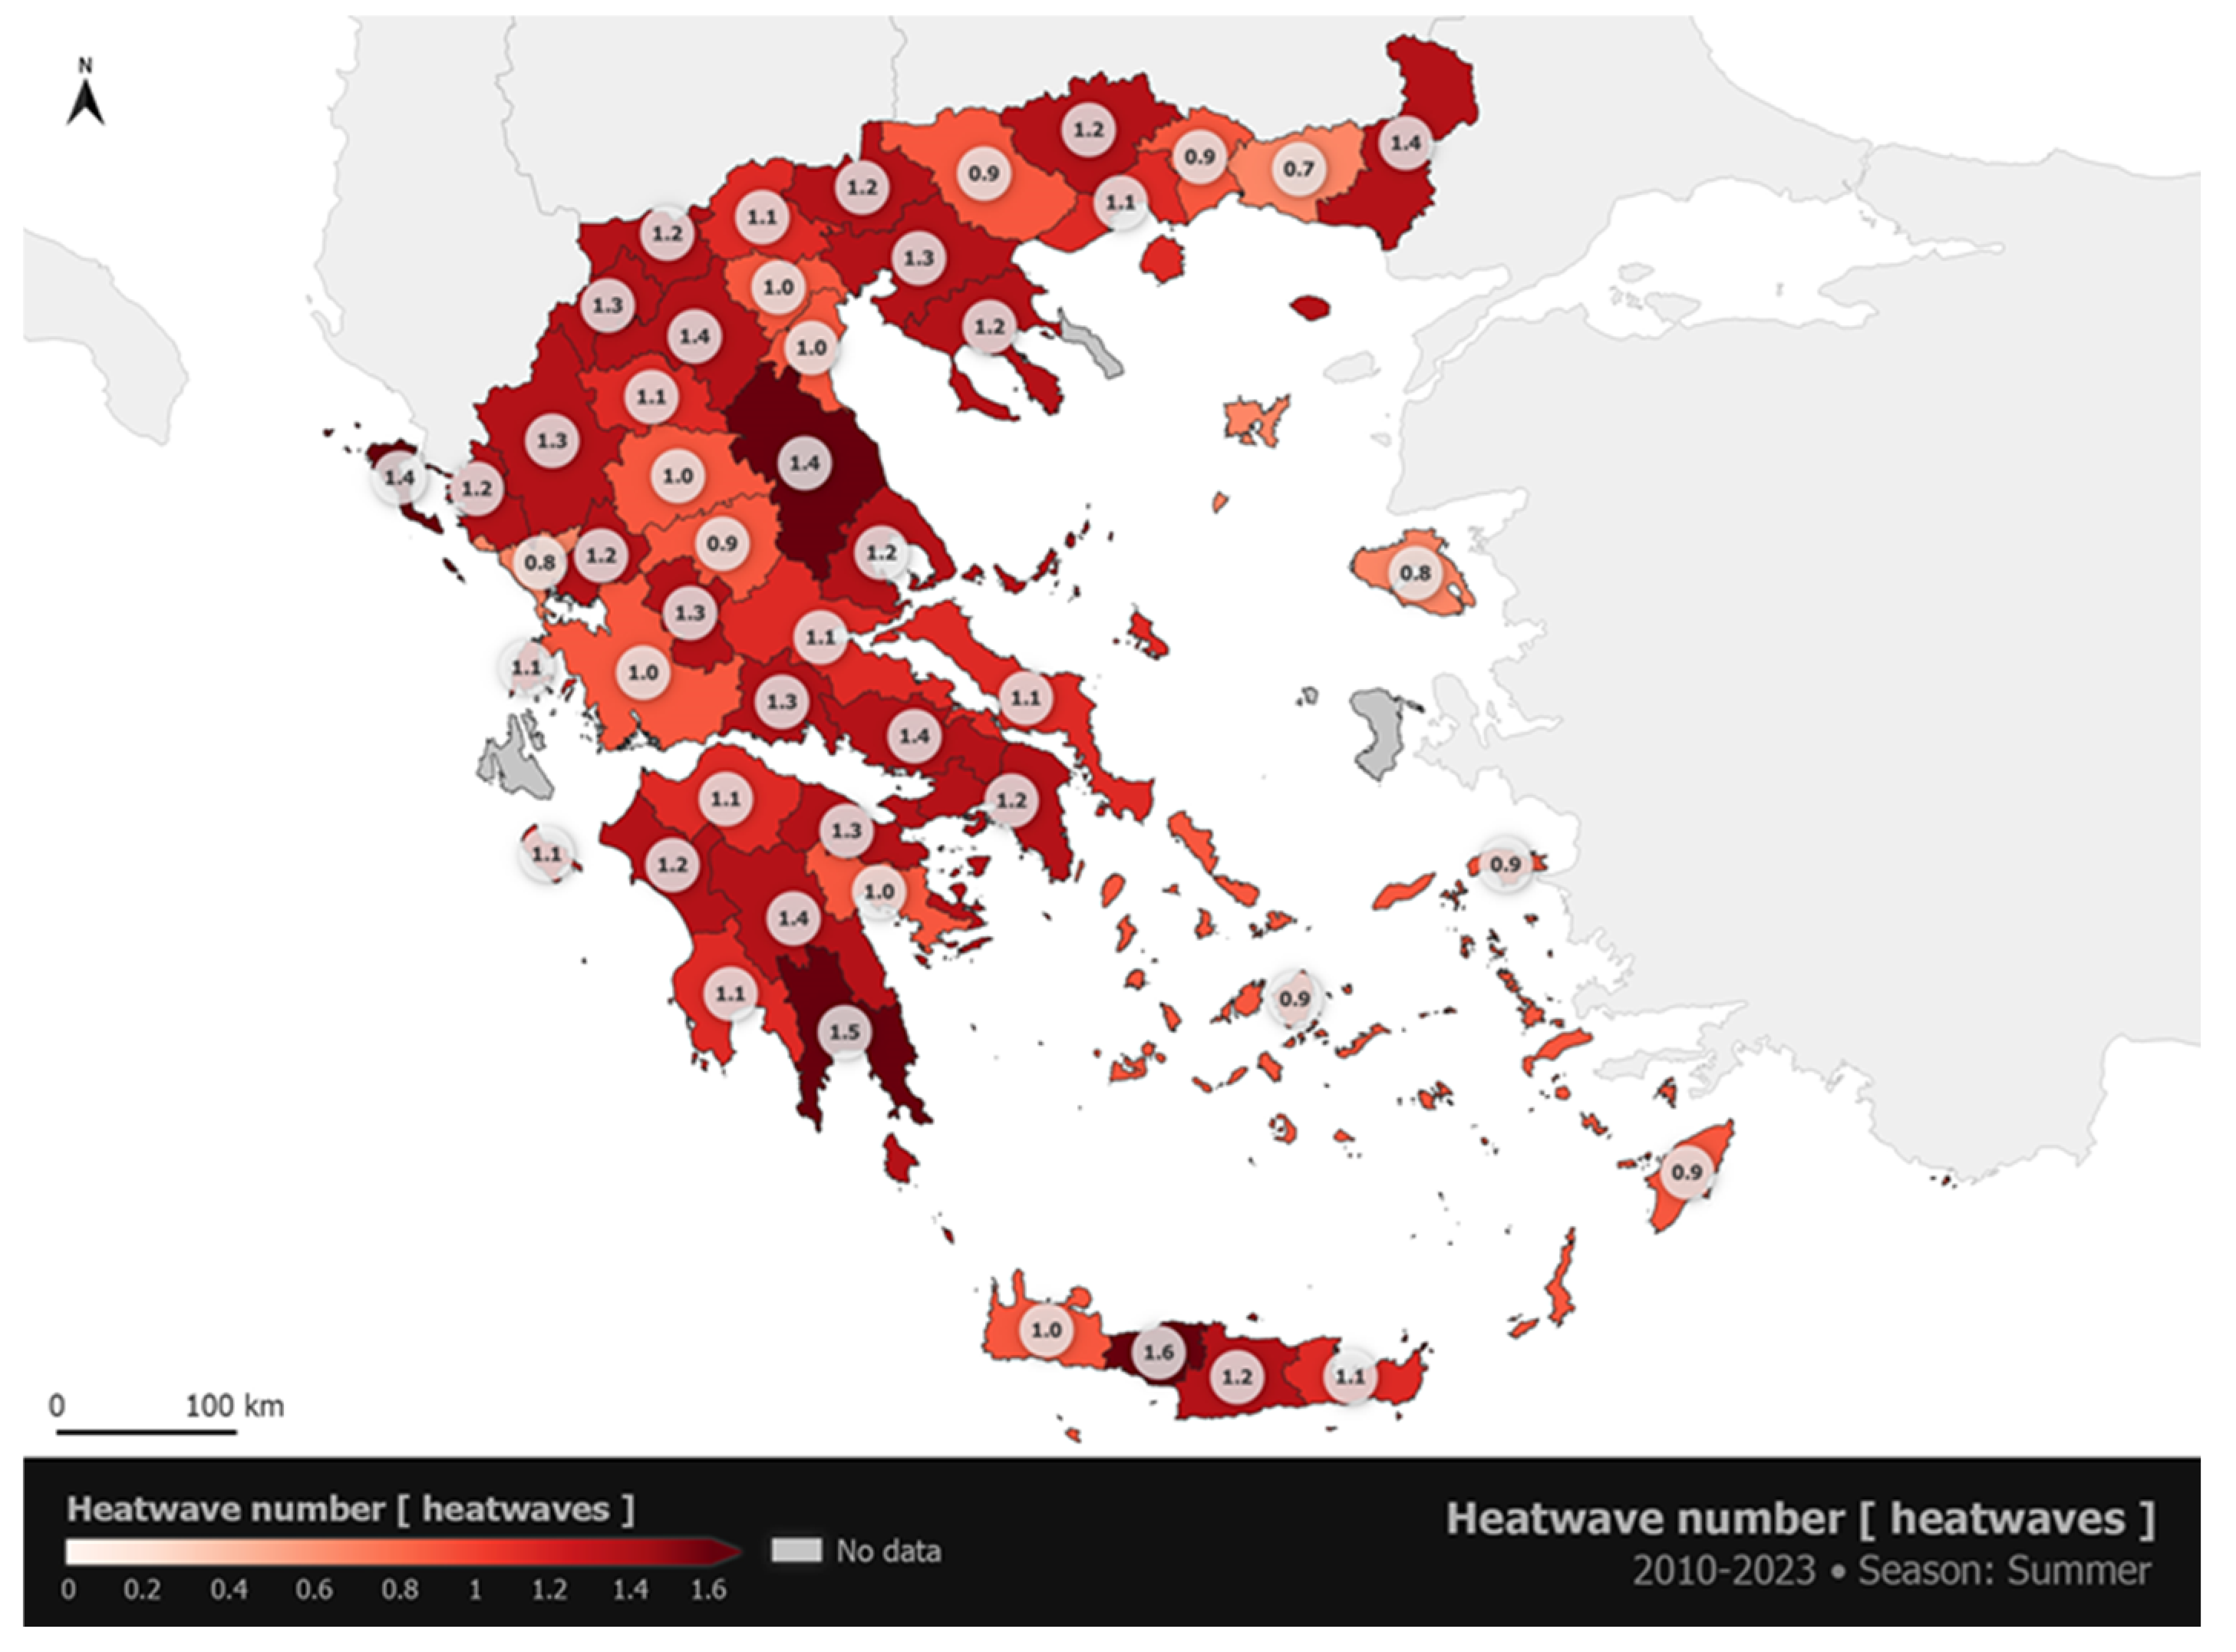
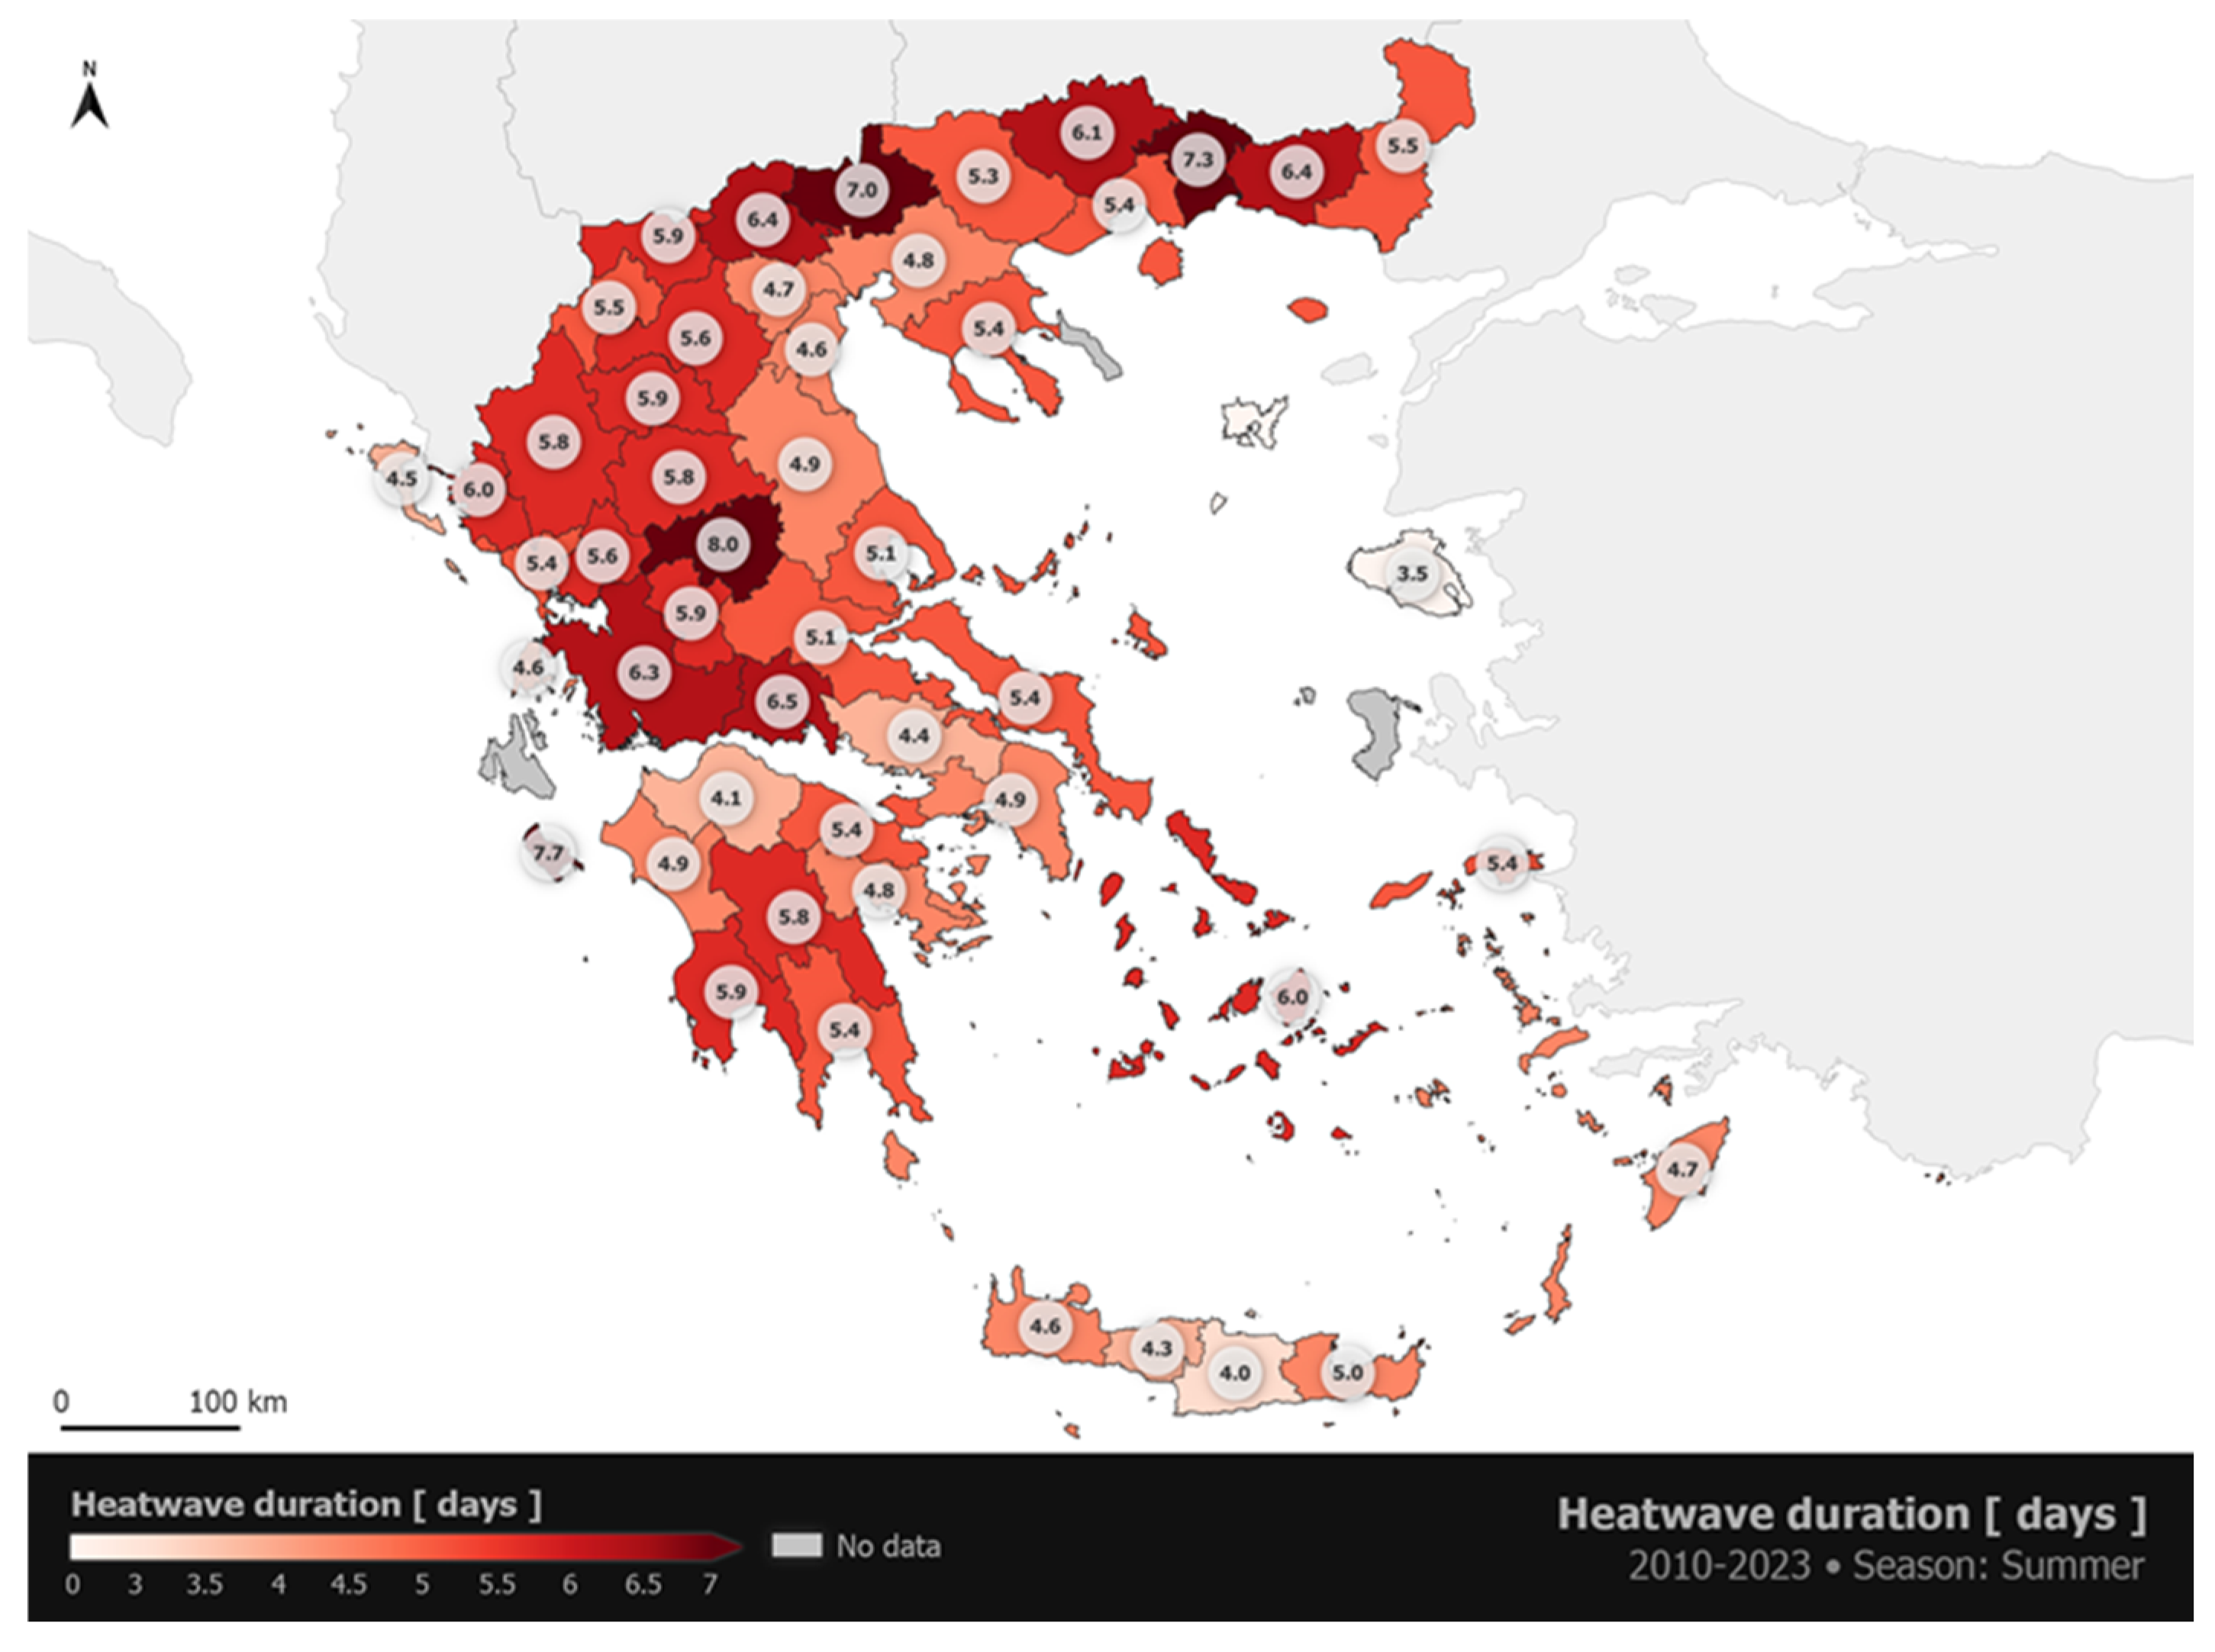
The susceptibility of the above-mentioned areas to HWs is also evident when analyzing HW indices over Greece (
Figure 4,
Figure 5 and
Figure 6) based on temperature observations derived from the dense network of over 500 ground-based weather stations operated by the NOA/meteo.gr research and operational unit [
19]. To identify the HWs, the 90th percentile of the observed maximum temperature (TX90p) averaged during summer (June, July, August) for the period 2010–2023 was computed. The computation was performed over 49 stations at the administration level of regions and regional units. Thus, each region/regional unit is characterized by a unique TX90p index relative to the local climate conditions. The 90th Tmax percentile-based threshold varies between ~30 °C and ~38 °C, highlighting the climate variability of Greece due to the country’s geomorphological complexity. Following previous studies (e.g., [
44]), an HW episode is defined when the daily maximum temperature exceeds the TX90 indicator for more than three consecutive days. For the needs of the analysis, three HW indices are investigated:
Heatwave number (HWN): Number of heat waves per summer.
Heatwave duration (HWD): Duration of the longest heatwave per summer.
Heatwave day frequency (HWF): Number of days meeting the HW criterion relative to the number of days in the summer.
Figure 4 shows the spatial distribution of the average HWN in summer for the period 2010–2023. The HWN ranges from 0.7 to 1.6 HW per summer. The HW hot spots are in the central and south Peloponnese, Thessaly, Attica, and parts of western Macedonia and western Crete, where the average HWN exceeds 1.3 HWs per summer. The lowest values of HWN are found in the Cyclades, the north Aegean, and eastern Macedonia. Furthermore, the longest HWD (>5 days) is found in the central and south Peloponnese and Macedonia, Thrace and Epirus (
Figure 5). In the same areas, more than 10% of days that meet the heat wave criterion, relative to all summer days, are occurring every year. The lowest HWF values are observed mostly in the islands of the Aegean Sea (
Figure 6). Overall, Greece experiences 1.1 heat waves per summer; each of them lasts almost 6 days on average.
The overall assessment of the geographical distribution of all parameters related to HW reveals that parts of continental Greece that are far from the sea as well as in plains between mountains (see also
Figure 1 for the elevation of the area) suffer from a high number of HW number and duration. On the contrary, the Aegean Sea, and especially the Cycladic islands, where the strong northern winds during summer prevail, experience the lowest number of HW during summer.
4.2. Convective Events
This section is devoted to the analysis of convective events and, more specifically, of thunderstorms, hail, and tornadoes.
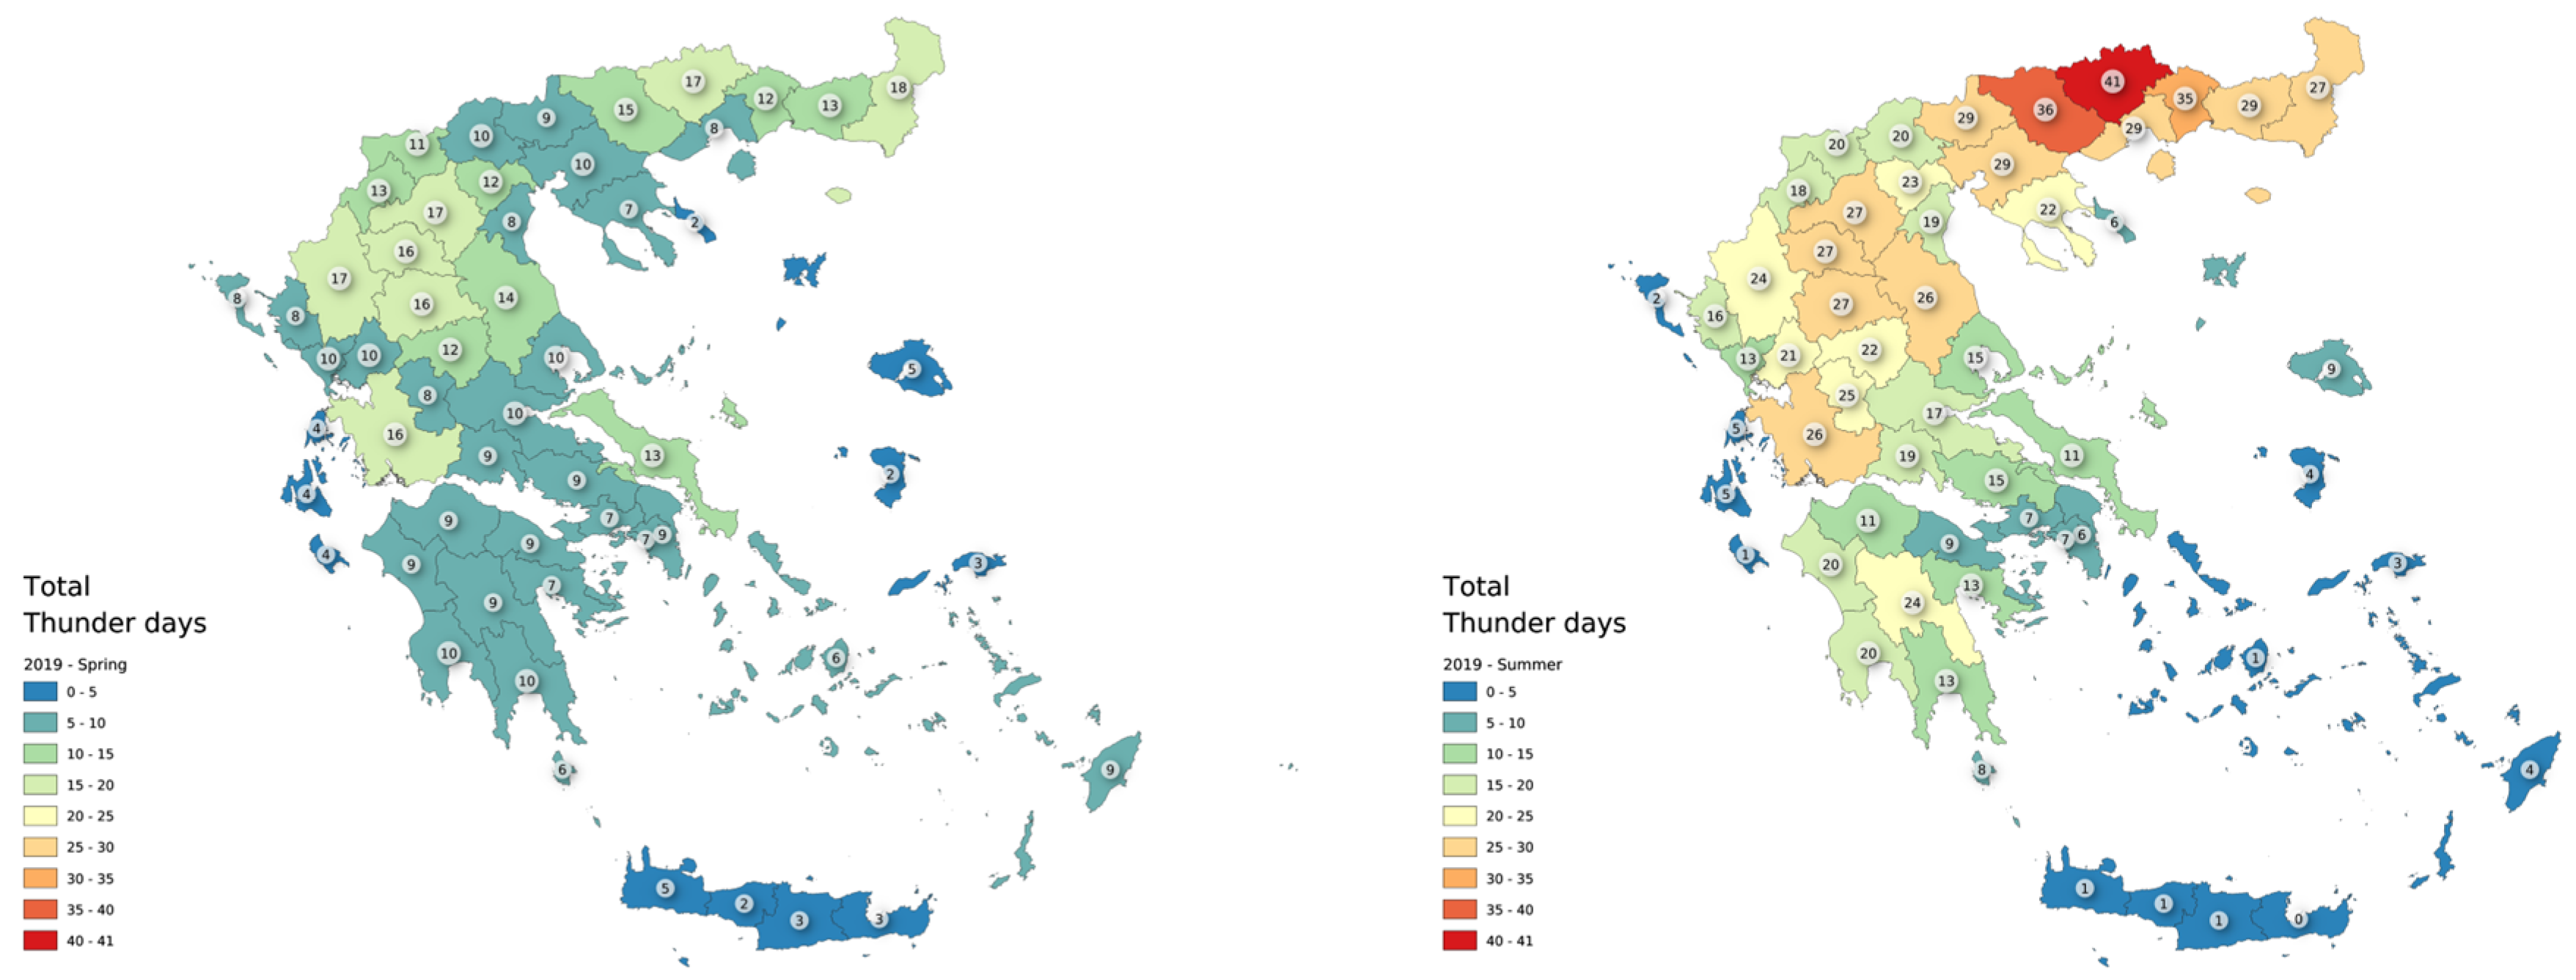
Thunderstorms are a common weather phenomenon in Greece; however, they exhibit substantial spatiotemporal variability around the year. Thunderstorm activity is more pronounced under warm, humid, and unstable atmospheric conditions. Using lightning data from the ZEUS lightning detection network [
21,
22] for the period 2005–2023 as a proxy for thunderstorm activity, we find that thunderstorms are more frequent during spring and summer (
Figure 7). More specifically, we find that most of the thunderstorms occur over the mainland of Greece, particularly over northern, central, and western Greece. Based on the same analysis, thunderstorm activity reaches its maximum over the northern parts of Greece during the summer months, with an average of 41 days of thunderstorm occurrence. The month that the thunderstorm activity peaks over the northern parts of the country is June, with an average of 14 days of thunderstorm occurrence.
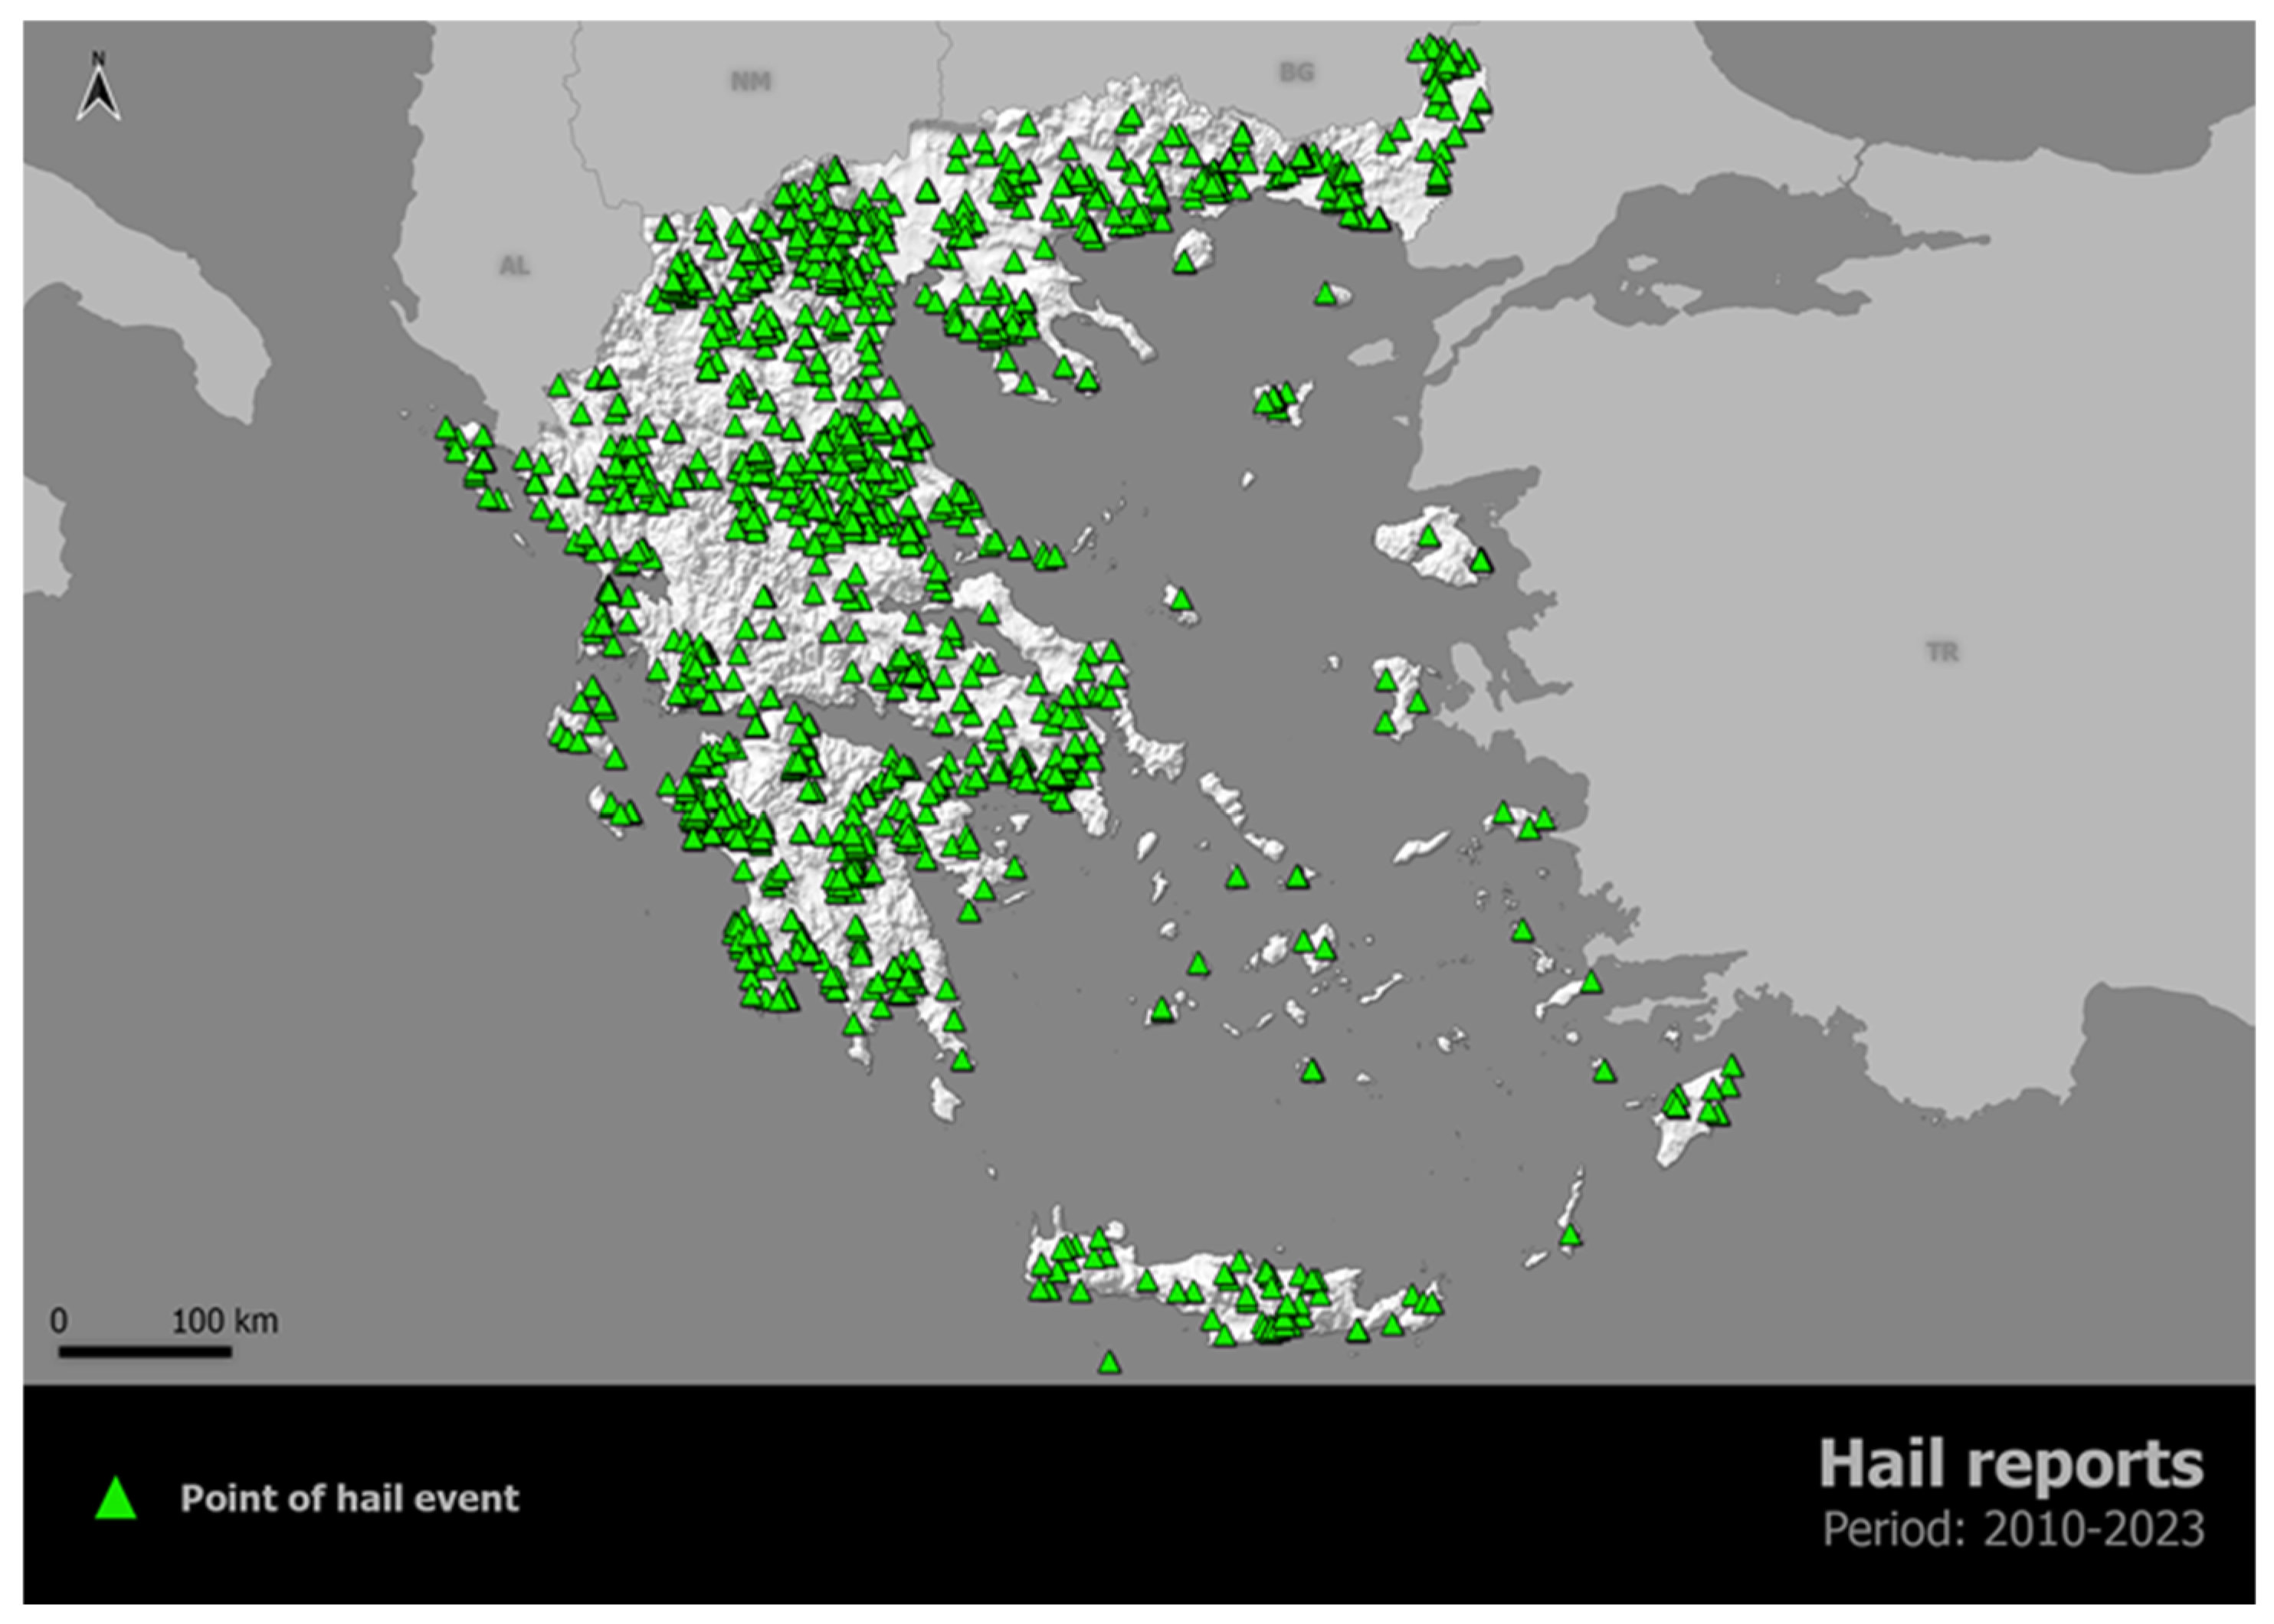
Hail occurrence is associated with thunderstorm activity and, more specifically, with deep convective clouds. While thunderstorms can be located and tracked by conventional instruments, it is hard to measure and collect reports of hail events. For that purpose, hail reports from the European Severe Weather Database (ESWD) [
23] during the period from 2010 to 2023 were used, as well as hail reports from hail pads in northern Greece operated by the Hellenic Agricultural Insurance Organization (ELGA) and where the Greek National Hail Suppression Program is implemented [
49]. However, it should be noted that the ESWD hail reports spatial distribution is limited to only where human activities take place and where the socioeconomic impact of hail events is reported (e.g., damage to fruit tree growers, vineyards, and fresh vegetables).
Most hail reports, shown in
Figure 8, are located across the main croplands of the country (e.g., Thessaly, Central Macedonia, Thrace) and the most densely populated areas (e.g., Attica). At the same time, the southern parts of the country, especially the islands (Cyclades, Dodecanese, Crete, N. and E. Aegean Sea islands), experience the lowest frequency of hail. This pattern can be partly explained by the high instability and strong lapse rates over the mainland during the warm season, while the islands in southern Greece experience thunderstorms mostly during the cold season when hail is less frequent.
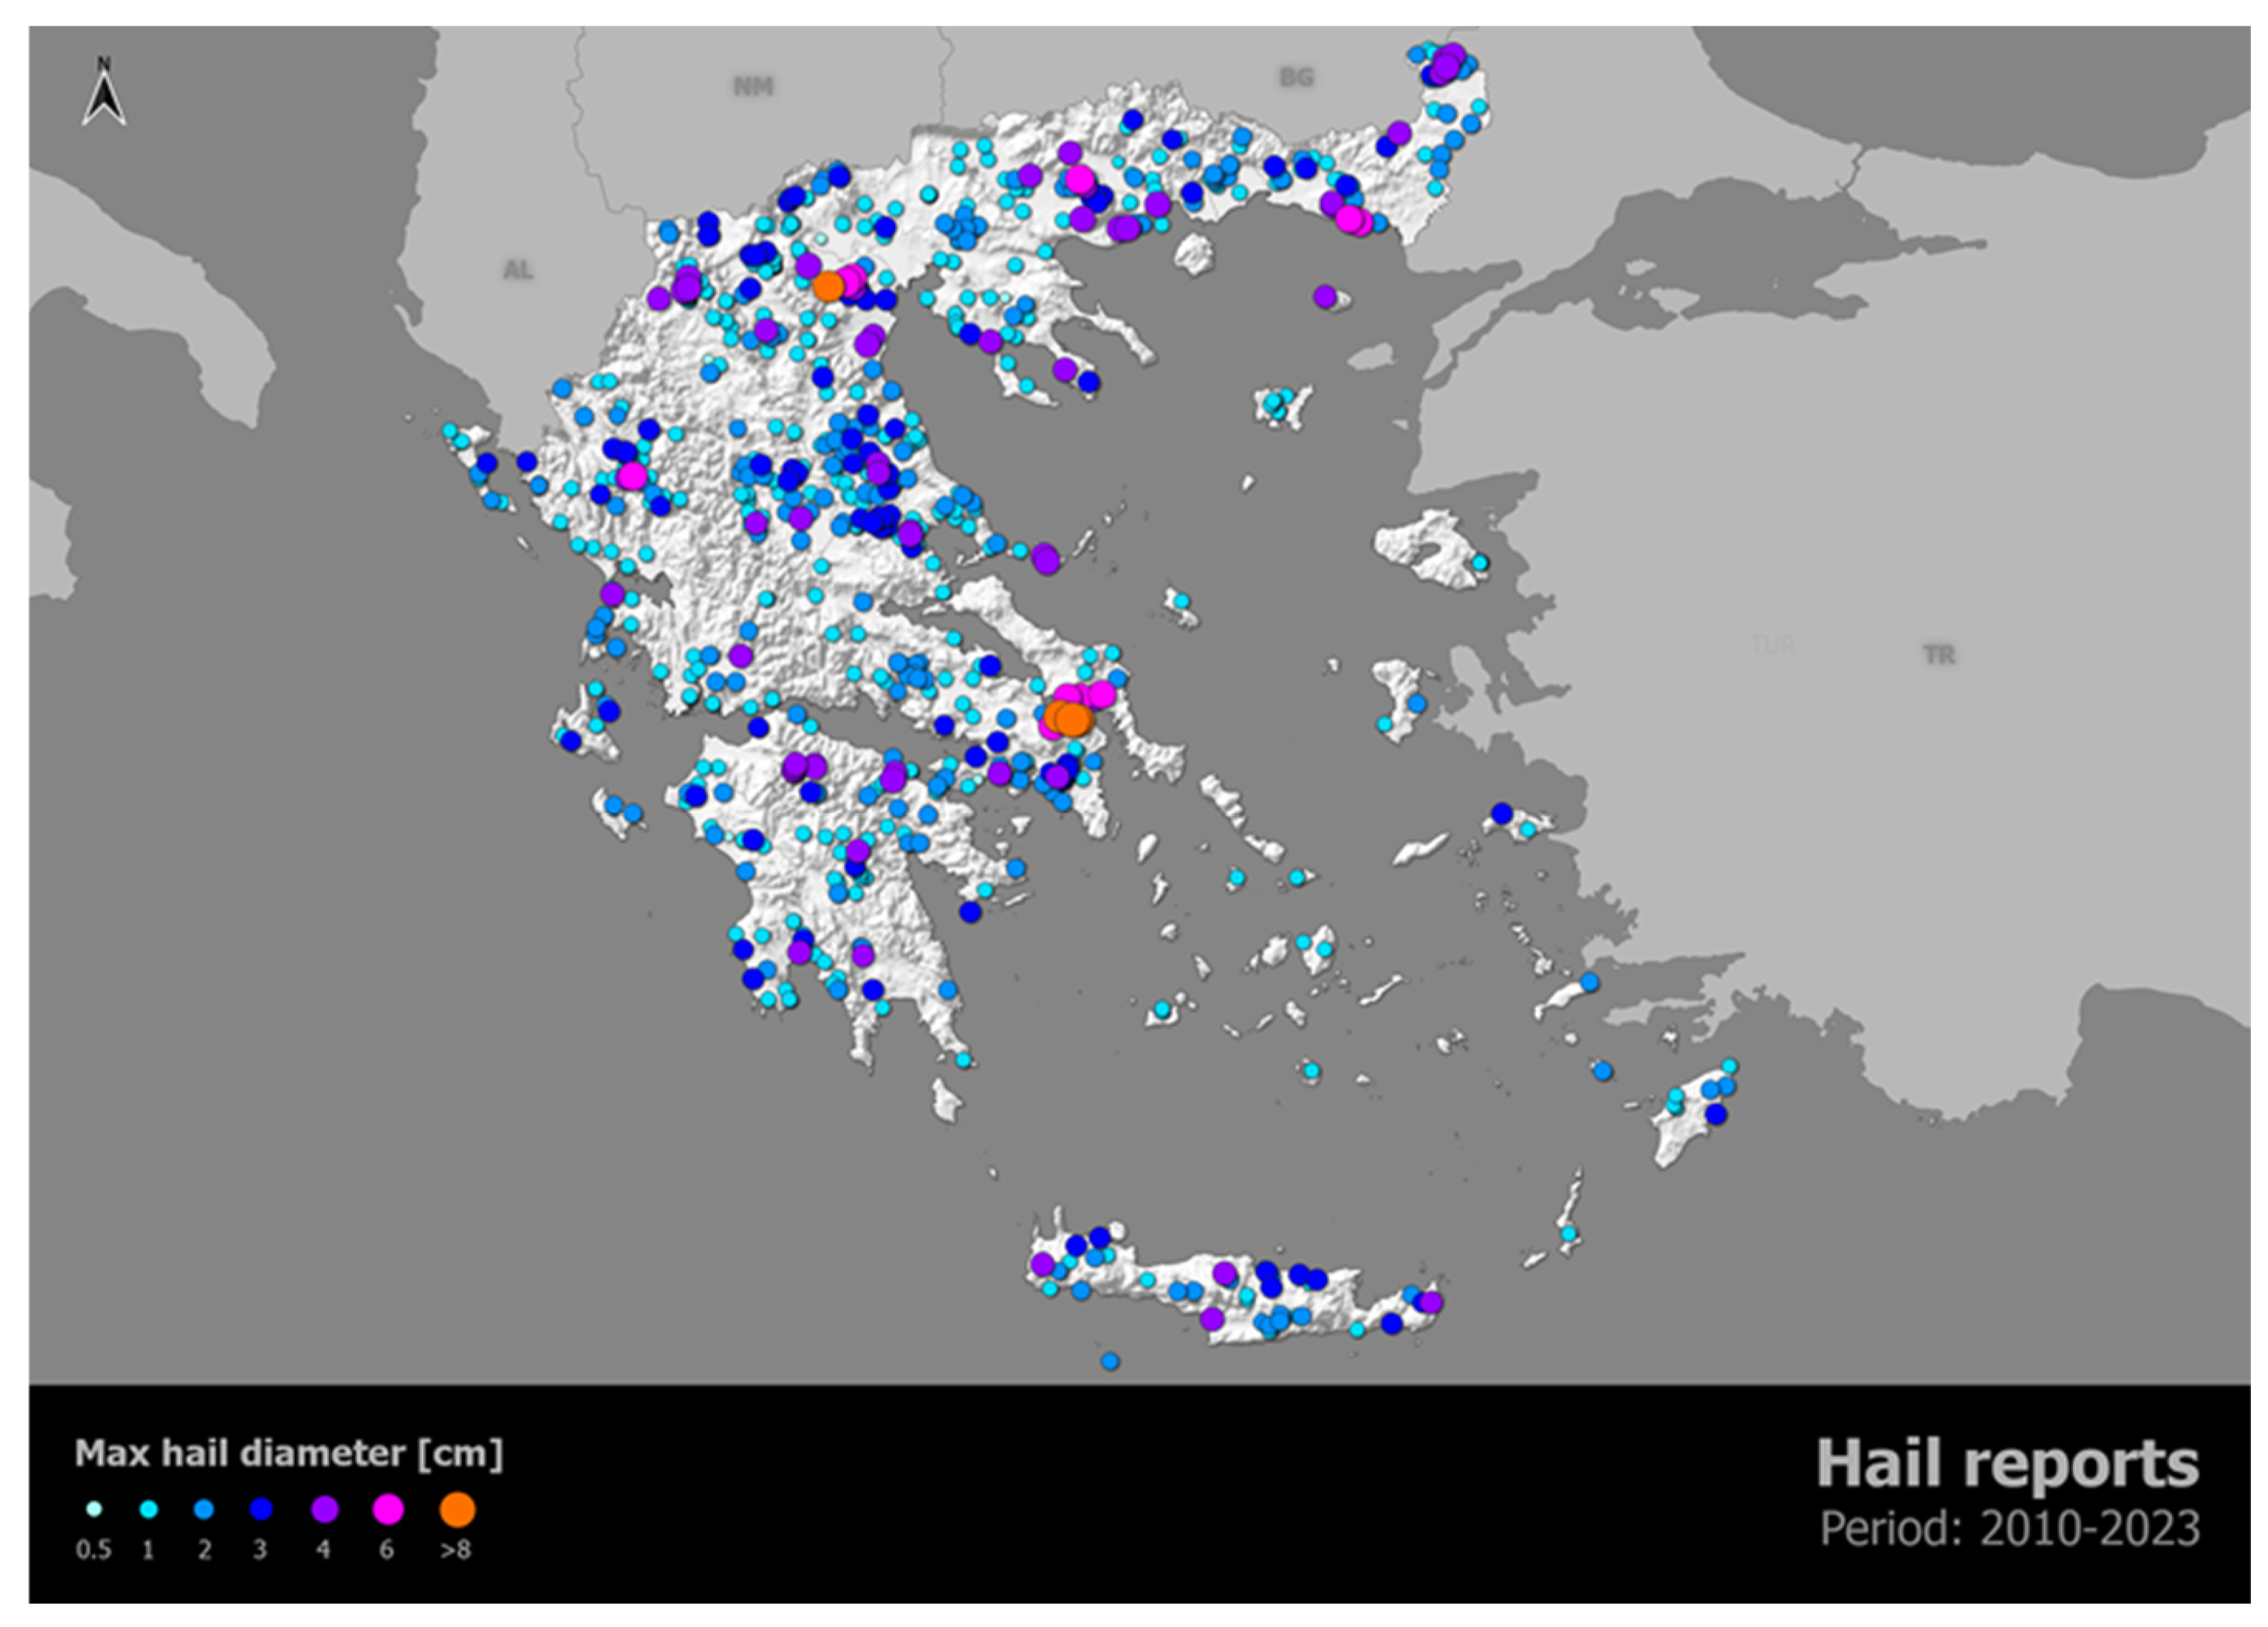
Damaging hail (i.e., hail >3 cm), however, occurs in many insular areas (
Figure 9). According to ESWD, the largest hail is mostly found in northern and central parts of continental Greece (
Figure 9) with significant economic impacts [
50]. The largest hailstone was observed on 4 October 2019, when giant hail of 11 cm was reported in the broader area of Oropos in the northern Attica region with significant damage [
51].
For the interpretation of the results, it should be noted that even though the ESWD should be used with caution due to the inherent limitations of reporting by citizens, they provide today the best possible overview of hail occurrence that has been used in the relevant literature.
Tornadoes are one of the most extreme, dangerous, and rare hazards that often result in significant property damage. The lack of a radar network in Greece limits the national observational capacity regarding tornadoes. Records of tornado occurrence are limited to crowdsourced data such as newspaper reports, TV broadcasts, social media networks, web cameras, and other historical archives [
52]. ESWD is the most complete database for tornadoes in Greece, having integrated all the available reports from multiple sources. During the period from 2010 to 2023 (
Figure 10), tornadoes in Greece were mostly observed near the coastal areas over the sea, also known as waterspouts [
52,
53,
54]. It should be noted that most of the waterspout reports are associated with non-tornadic events [
55]. In some extreme cases of severe thunderstorms, which exhibit rotation, tornadoes are also observed over land, and the Greek complex topography seems to play a significant role in their formation and duration [
56]. Given that the tornado rating is based on a damage survey, something that is not performed routinely in Greece, there is a rating for only 8.4% of 1120 tornado reports in Greece during the examined period (i.e., 94 cases). Based on the International Fujita scale [
57] that is used by the European Severe Storms Laboratory (ESSL), from these 94 tornado reports, 9.6% (i.e., 9 cases) is rated as IF-2 (strong tornadoes), 49% (i.e., 46 cases) is rated as IF-1 (weak tornadoes), while 41.4% (i.e., 39 cases) is rated as IF-0 (weak tornadoes).
Over the sea (
Figure 10), the majority of waterspouts are observed along the west coast of Greece, with peak occurrence in the northern parts of the Ionian Sea, in the northwestern Aegean Sea, with many near Sporades islands, around Crete, with the majority of them along the north coast of the island and around Rhodos island, especially along the east coast of the island. During autumn, the prevailing easterly trajectory of weather fronts coming from the warm and humid central Mediterranean promotes the development of numerous thunderstorms that can produce tornadoes. Due to the combination of strong low-level shear and high instability, supercells develop over the sea and then hit the Greek coasts with tornadic phenomena.
Over land, most tornadoes occur on the western coasts of central Greece, the western Peloponnese, and northern Greece. Most tornadoes form during autumn, while the lowest activity is observed during spring and summer [
52,
54]. Some of the most noteworthy events during this period include the tornadoes of 2015 in Skala, Laconia, in September 2021, when a strong tornado caused significant damage and injured at least 4 people, and the rare tornado outbreak in Attica region on October 22, where several tornadoes impacted the area [
58].
4.3. High Rainfall
Heavy precipitation events could be defined as days or periods of days associated with amounts of precipitation that exceed what a region usually experiences. -. The potential impacts of high rainfall events include, for example, soil erosion, crop damage, landslides, degrading water quality, floods, economic loss of livestock or, most importantly, human injuries/fatalities.
Previous studies report contradictory results in the tendency of the high rainfall events in Greece. These differences are strongly related to the studied period and to the selected climate indices and methodologies that are used. Indeed, Nastos and Zerefos (2008) [
59] examined a 45-year period (1957–2001) and found increasing trends (non-statistically significant) of daily high rainfall events were observed in the eastern and southern-eastern regions of Greece. Kelebek et al. (2021) [
60] found a statistically significant increasing tendency in the range of 3–5% per decade in the extreme precipitation indices they used for the Balkan countries and Mediterranean coasts for the period 1979–2016. In contrast, Kioutsioukis et al. (2010) [
43] reported that the frequency and intensity of high rainfall events significantly decreased in Greece during the period 1955–2002 and attributed this finding to an increase in the frequency of anticyclones over the Mediterranean region. Karagiannidis et al. (2012) [
61] used data from 20 pluviometric stations in Greece from the period 1958–2000 and adapted a 60 mm/day threshold for extreme precipitation, attempting to identify trends in extreme precipitation related to mid-latitude cyclonic systems. They found negative trends that are statistically significant during the last two decades (Spring) or one decade (Winter and September-to-May) of the analyzed period. Kostopoulou and Jones (2005) [
38] demonstrated negative trends in all indices of extreme precipitation in the eastern Mediterranean during the second half of the 20th century, probably attributed to the observed negative trends of the intense Mediterranean cyclones. Kambezidis et al. (2010) [
62] showed negative trends (statistically significant) in the western sub-regions of Greece and increasing trends in the wider area of Athens and the Cyclades Islands over the period 1962–2002. Finally, Lagouvardos et al. (2024) [
63] analyzed ERA5land reanalysis data for the period 1991–2020 and found that the number of days with heavy daily rainfall (>20 mm) shows an increasing trend in many areas in Greece (e.g., Western Greece, East Macedonia and Thrace) which locally reaches cumulatively ~9–10 days in the 30-year period and highlighted how important this is as heavy rainfall is related to more frequent flood-producing events.
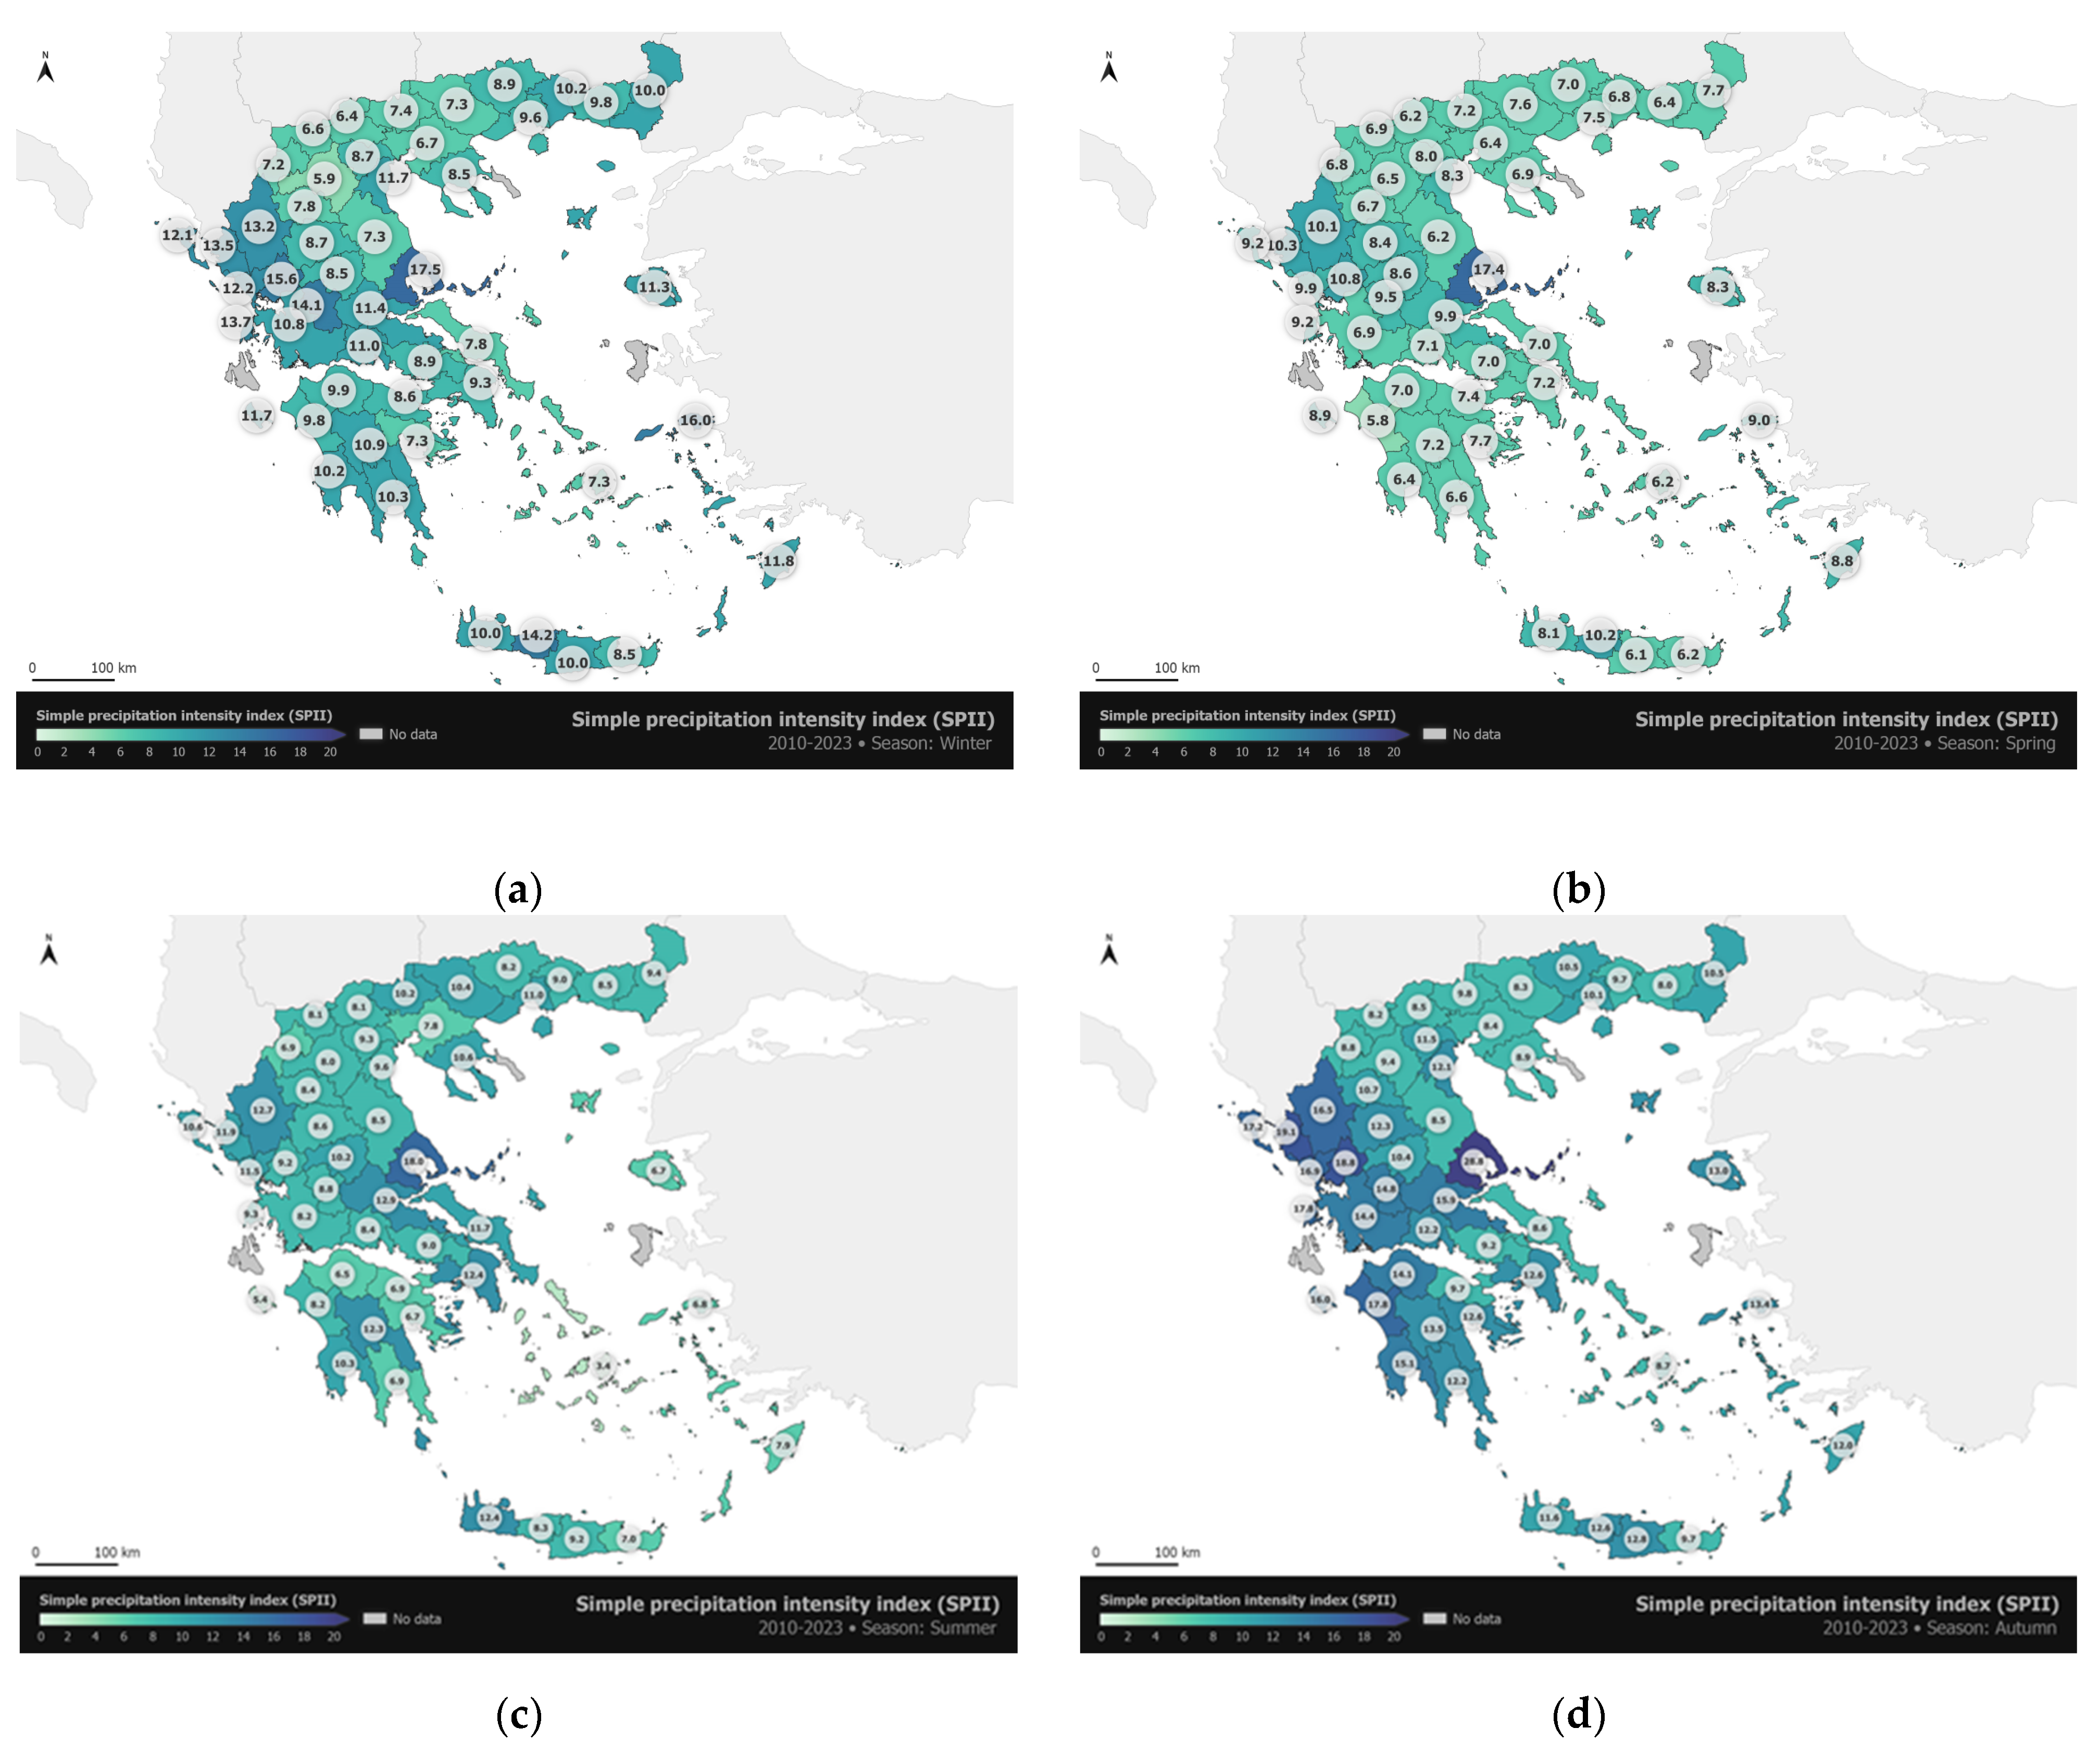
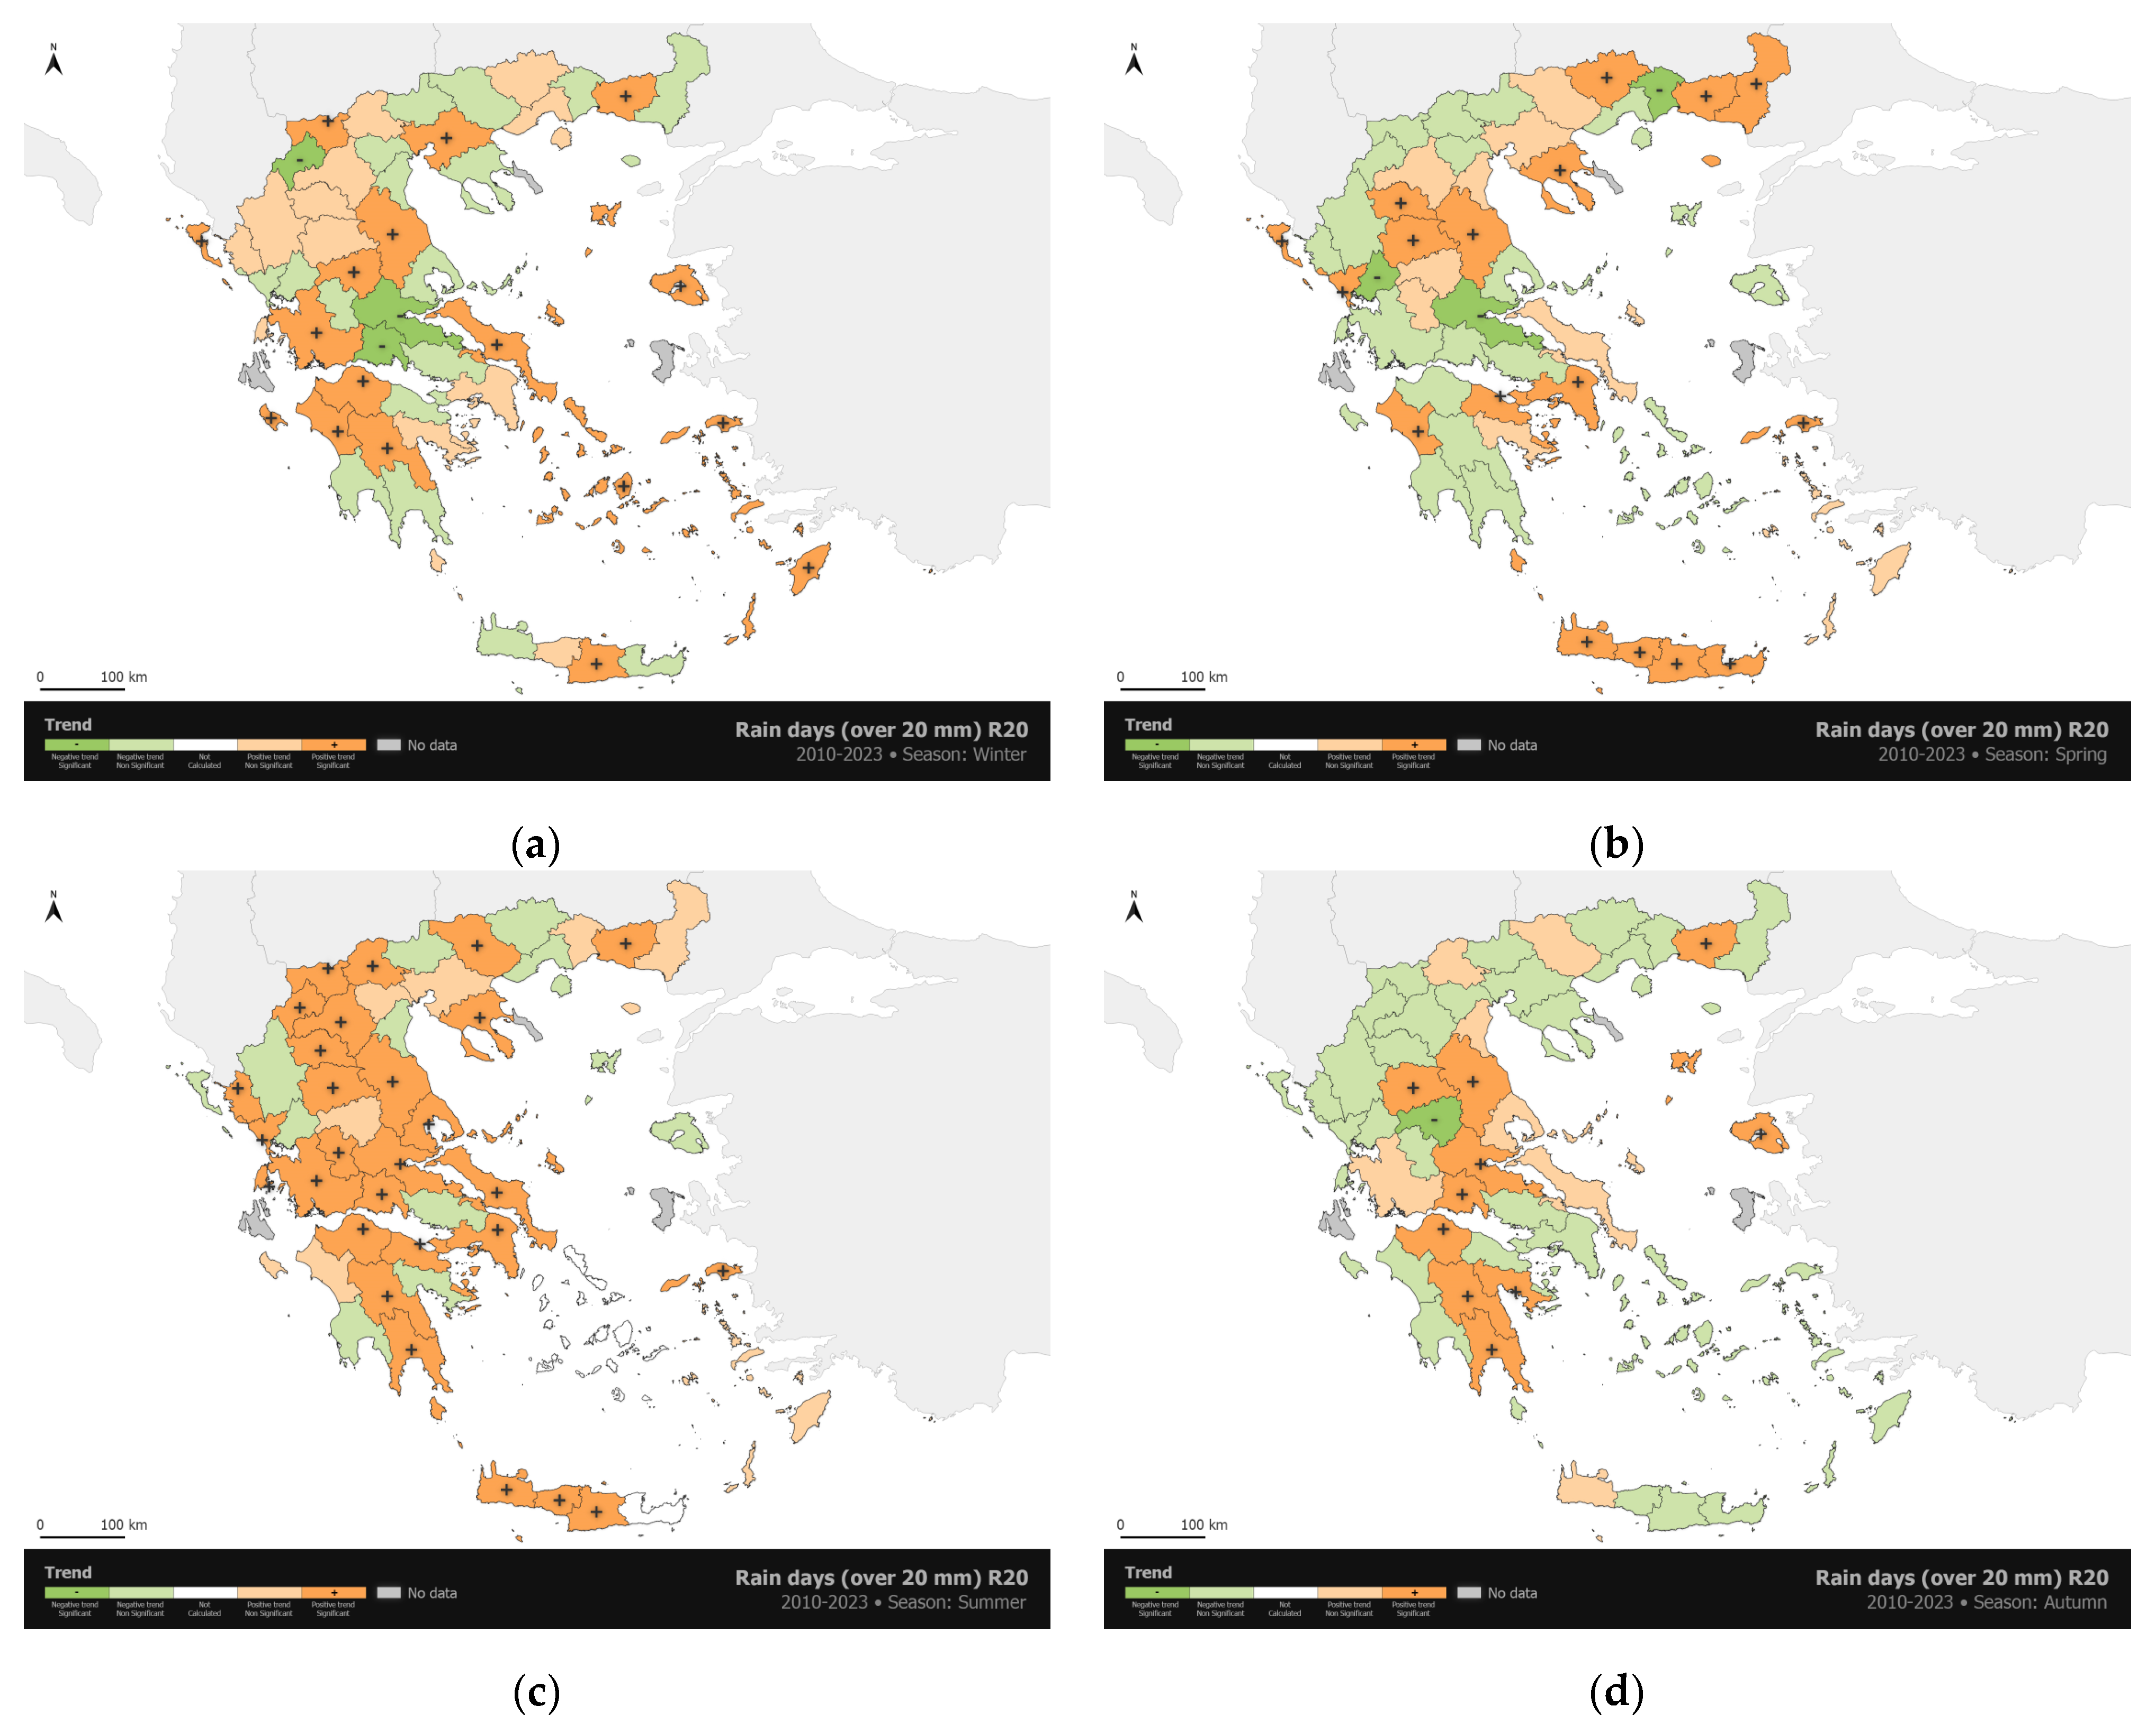
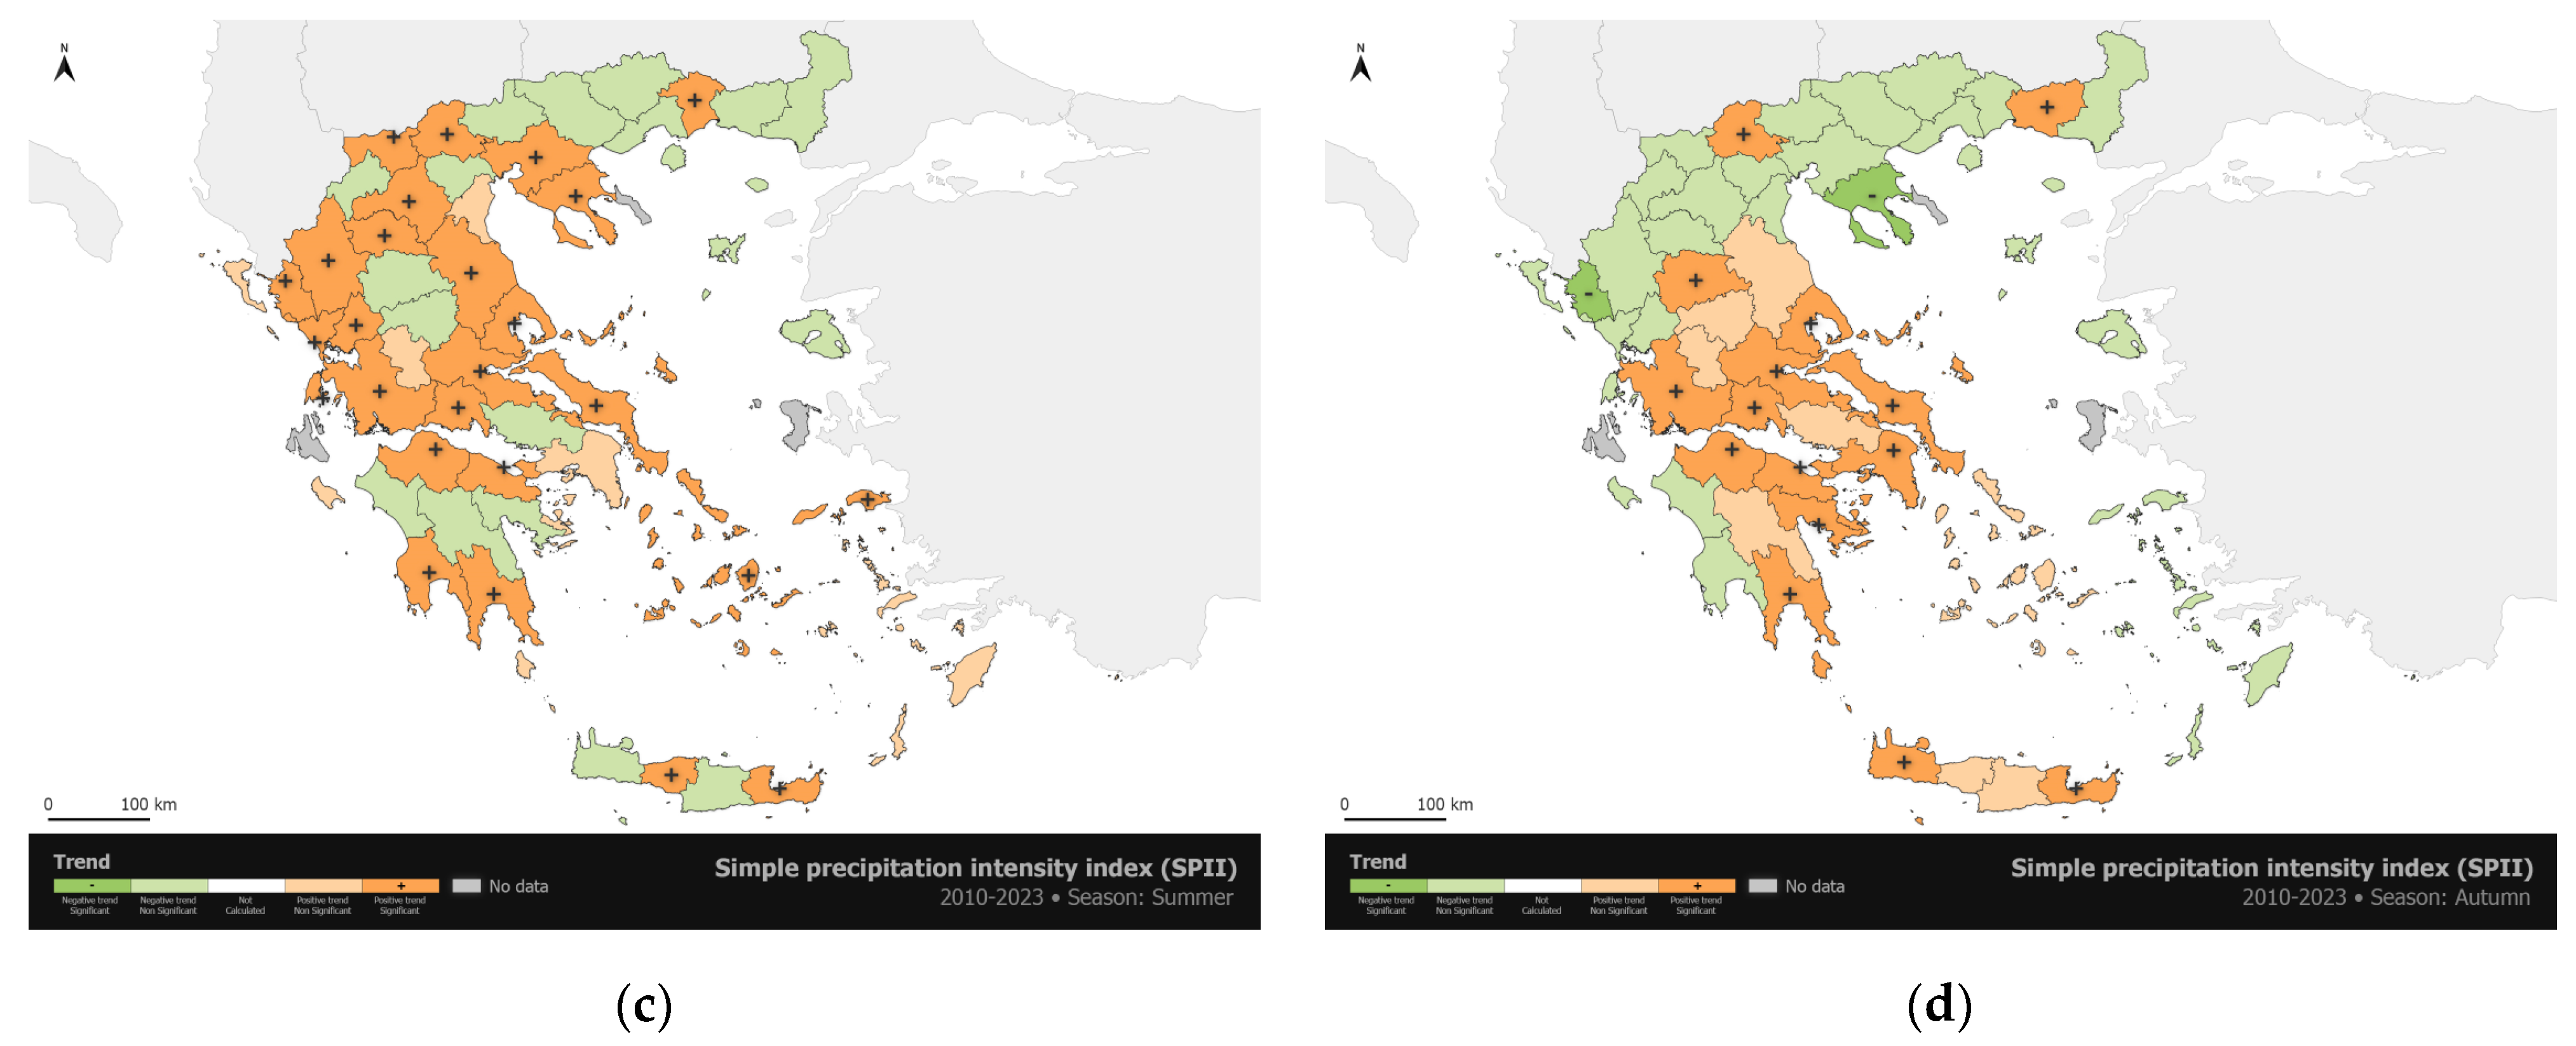
In this study, the analysis of rainfall and heavy precipitation events has been examined by utilizing two indices:
Number of rainy days per month when daily precipitation amount (24-h) exceeds 20 mm (R20)
Simple Precipitation Intensity Index (SPII) is defined as the total amount of monthly rainfall on wet days (days with >1 mm of precipitation) divided by the number of wet days during the same month.
Both indices were computed for each administrative prefecture of Greece separately. The first is indicative of the frequency of heavy precipitation events, while the second is primarily associated with the total rainfall.
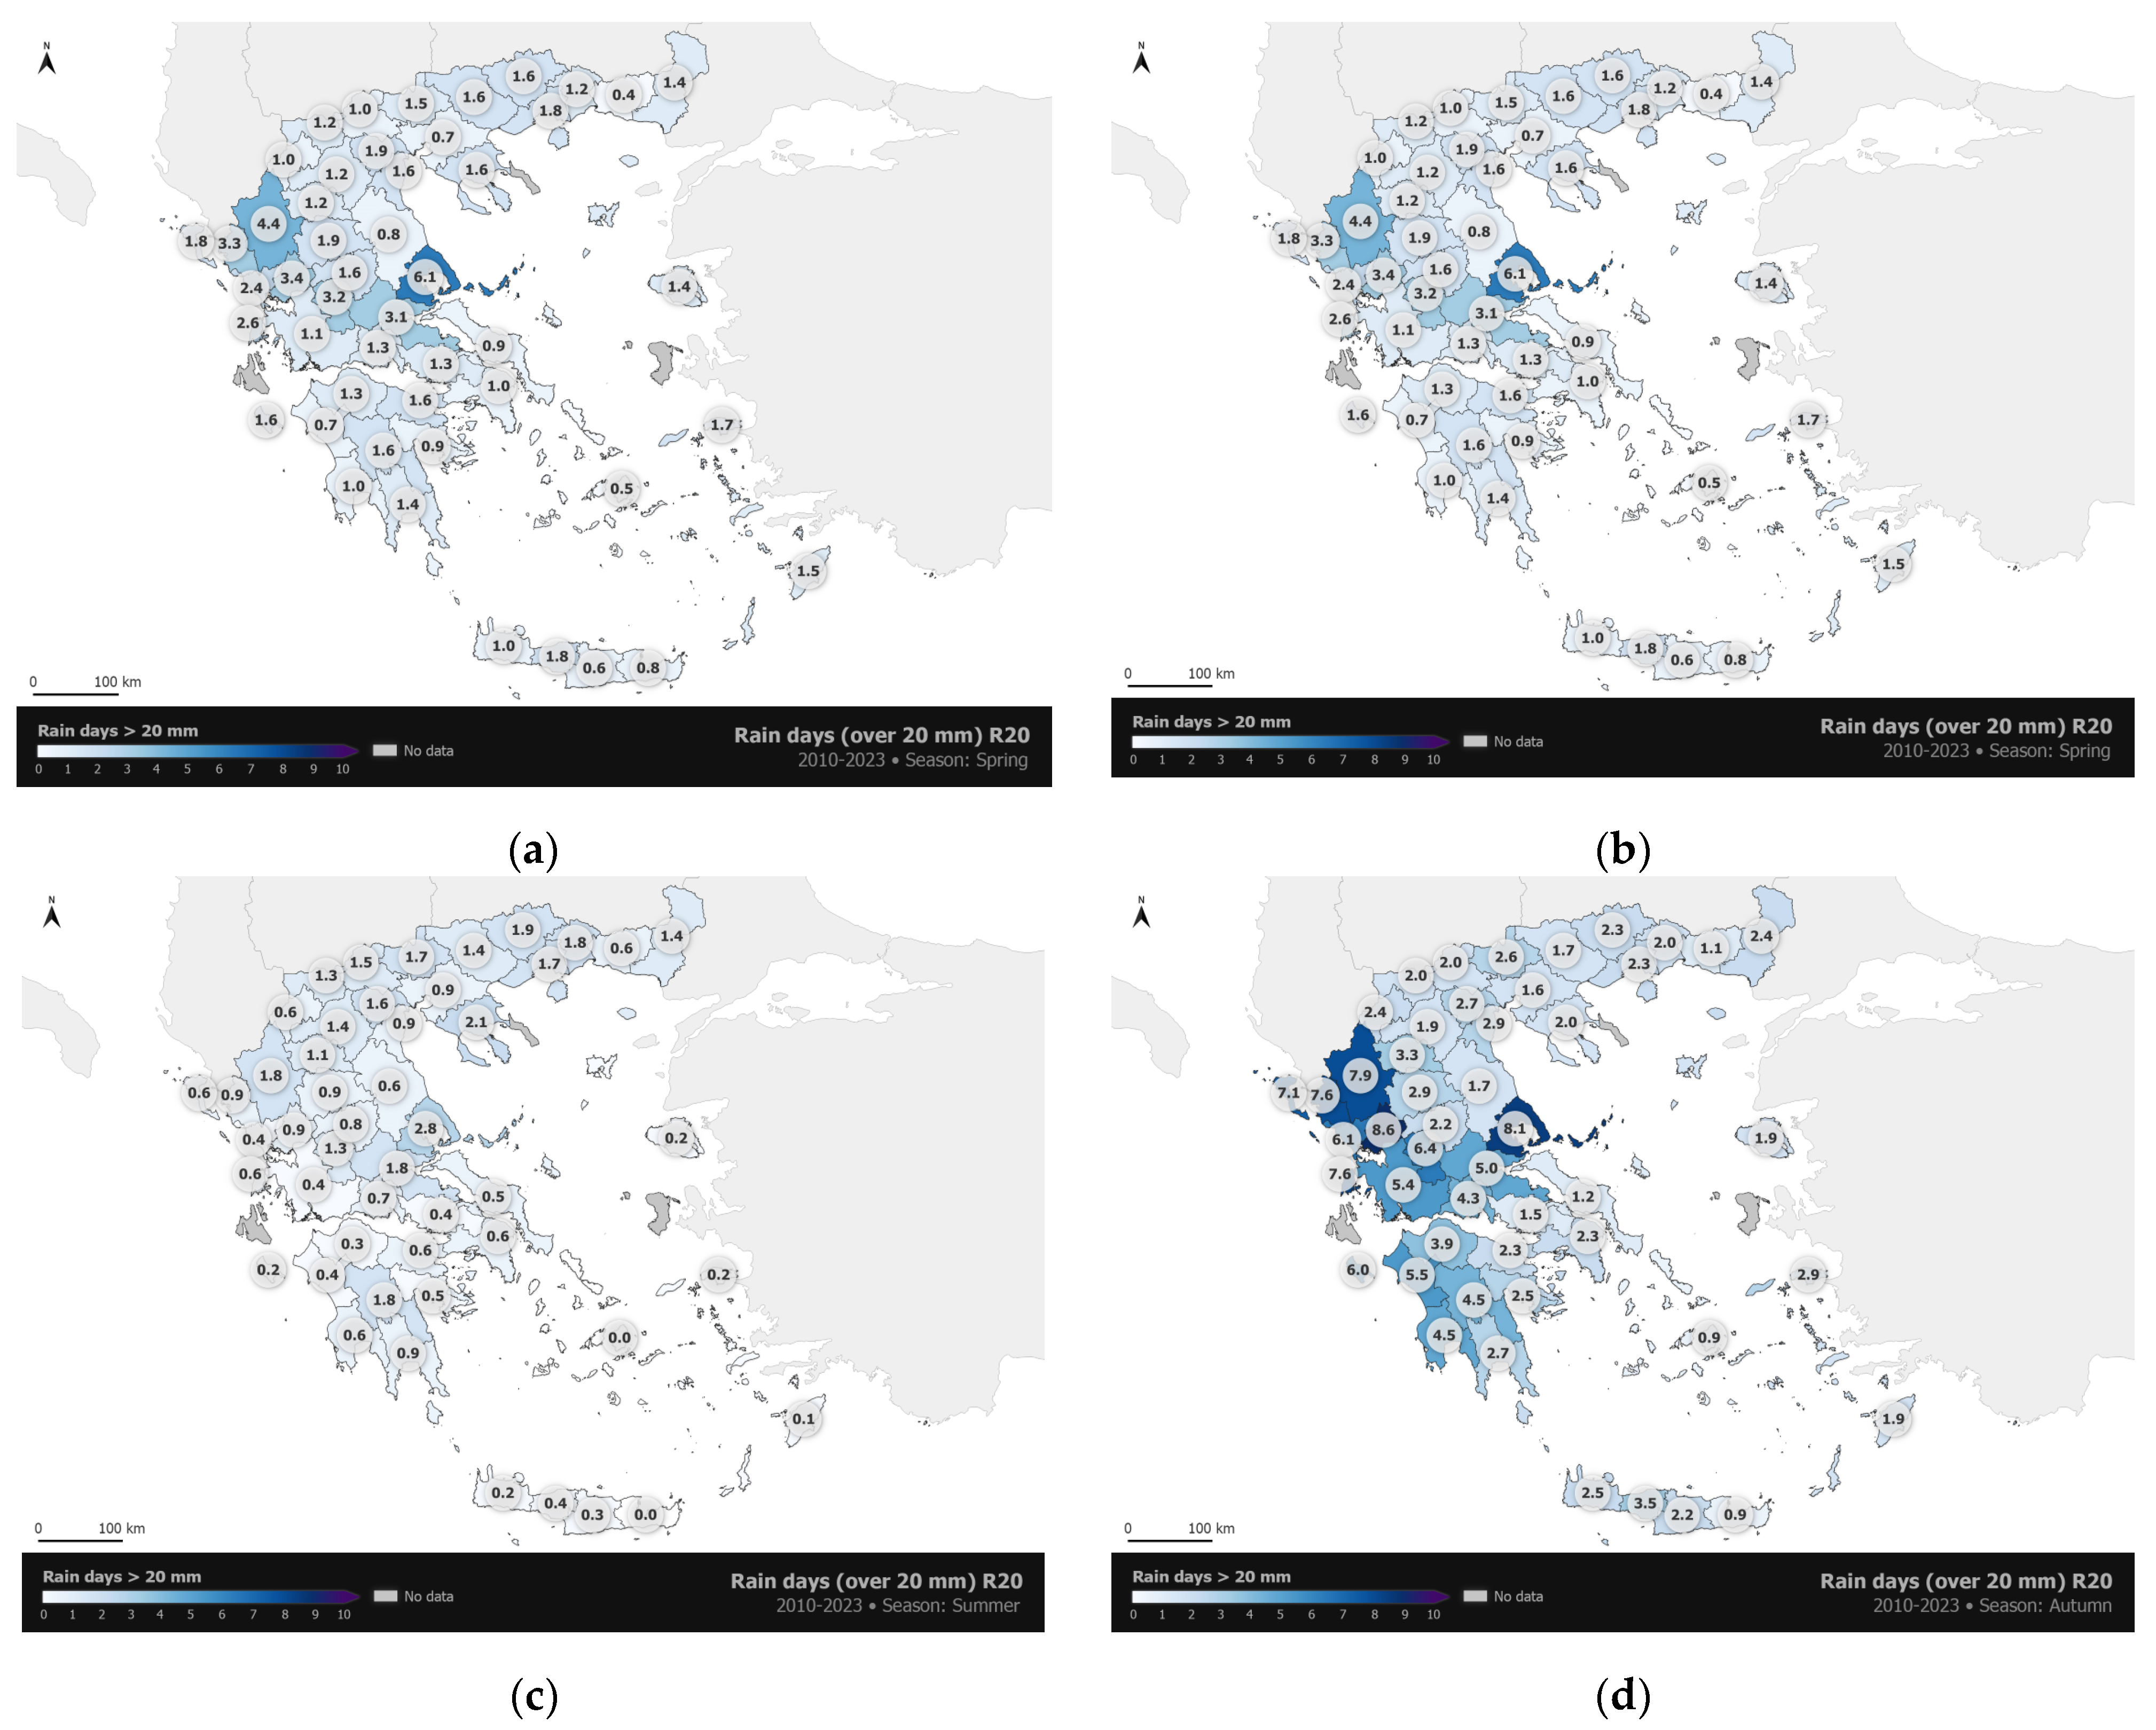
Figure 11 and
Figure 12 depict the seasonal average of R20 and SPII computed with data from 49 meteorological stations of NOA for the period 2010–2019. Maximum values of both indices are observed in winter and autumn, while minimum values are found in summer. As shown in
Figure 11, during the rainy season (winter and autumn) the higher values of R20 (greater than 5 days) are observed over the islands of the eastern Aegean islands and the western regions of continental Greece, while R20 does not exceed 2–3 days in the north and central Greece. A local maximum is also evident at southeast Thessaly (prefecture of Magnesia), where R20 is almost 8 days. In parallel, SPII values are maximum in the same areas of Greece during the same seasons. During the two drier seasons (spring and summer), R20 does not exceed 2–3 days on average, excluding local maxima in Magnesia and Northern Epirus. SPII presents values below 10 days, with local maxima that exceed 10 days in the same regions.
Figure 13 and
Figure 14 show the seasonal spatial distribution of the tendencies of R20 and SPII for the period 2010–2023.
R20 and SPII tendencies that vary in sign and strength are found in Greece. It should be noted, however, that the statistically significant trends are mainly positive, suggesting a general increase in heavy precipitation over Greece during the last one and a half decades.
Statistically significant increasing trends (at a 90% confidence level) of R20 and SPII are found mainly in the central and southern regions of Greece during autumn. During winter, many areas present positive statistically significant trends. During summer, statistically significant increasing trends are found for both indices over almost the entire Greece., During spring, negative tendencies dominate both indices over Greece, although not statistically significant at the 90% confidence level, implying a decline in the occurrence of rainfall and heavy precipitation events during this season. It is noteworthy, however, that most of the positive tendencies show statistically significant positive trends.
4.4. Droughts
Drought is an extreme weather event characterized by a continuous decline in precipitation and surface water balance. Drought is also characterized by a significant impact on the environment, agriculture, and economy, and affects more people than any other type of natural disaster universally [
64]. Drought is classified as a meteorological, agricultural, hydrological, or socioeconomic, based on the anticipated impacts. For the needs of this study, we will examine drought from the meteorological point of view.
The Mediterranean region, as it is more vulnerable to changes in global warming, shows a tendency to drier conditions [
65] and faces the possibility of experiencing an intensification of droughts (frequency and duration) in this century [
66]. Within this context, drought events have been described and analyzed in Greece. Nastos et al. (2013) [
67], using meteorological data from 22 stations all over Greece, showed that the eastern area of Greece shifted gradually from a “humid” climate zone in the period 1951–1960 to “sub-humid” in the period 1951–1960, and eventually to “semi-arid” climate zone in the studied period 1991–2000. Recently, Tsiros et al. (2020) [
68], extending the work of Nastos et al. (2013) [
67] for the period 1900–1997, pointed out that drier conditions were established in most areas of Greece. Myronidis and Theofanous (2021) [
69] indicated that the climate of the region of South Aegean is changing from dry and sub-humid to semi-arid conditions in the period 1991–2020. Precisely, they reported an intensifying drought phenomenon, as they found significant negative trends in the number of consecutive dry days (CDD) from 2001. Giannikopoulou et al. (2014) [
70] studied the drought episodes for three islands in the Cyclades complex for the 1970–2010 period, using observational data. They pointed out that mild drought conditions were most frequent and extreme during the period 1991–2010 compared to earlier drought events, particularly in Milos. Kostopoulou and Jones (2005) [
38], analyzing data from meteorological stations for the period 1958 to 2000 in Greece, found significant positive trends for the index of the maximum number of CDD. Moreover, the aforementioned trends were more pronounced on the islands of the Aegean Sea. Finally, Anagnostopoulou (2016) [
71] showed that Greece is characterized by frequent drought episodes that often exceed 10 consecutive days (dry spells).
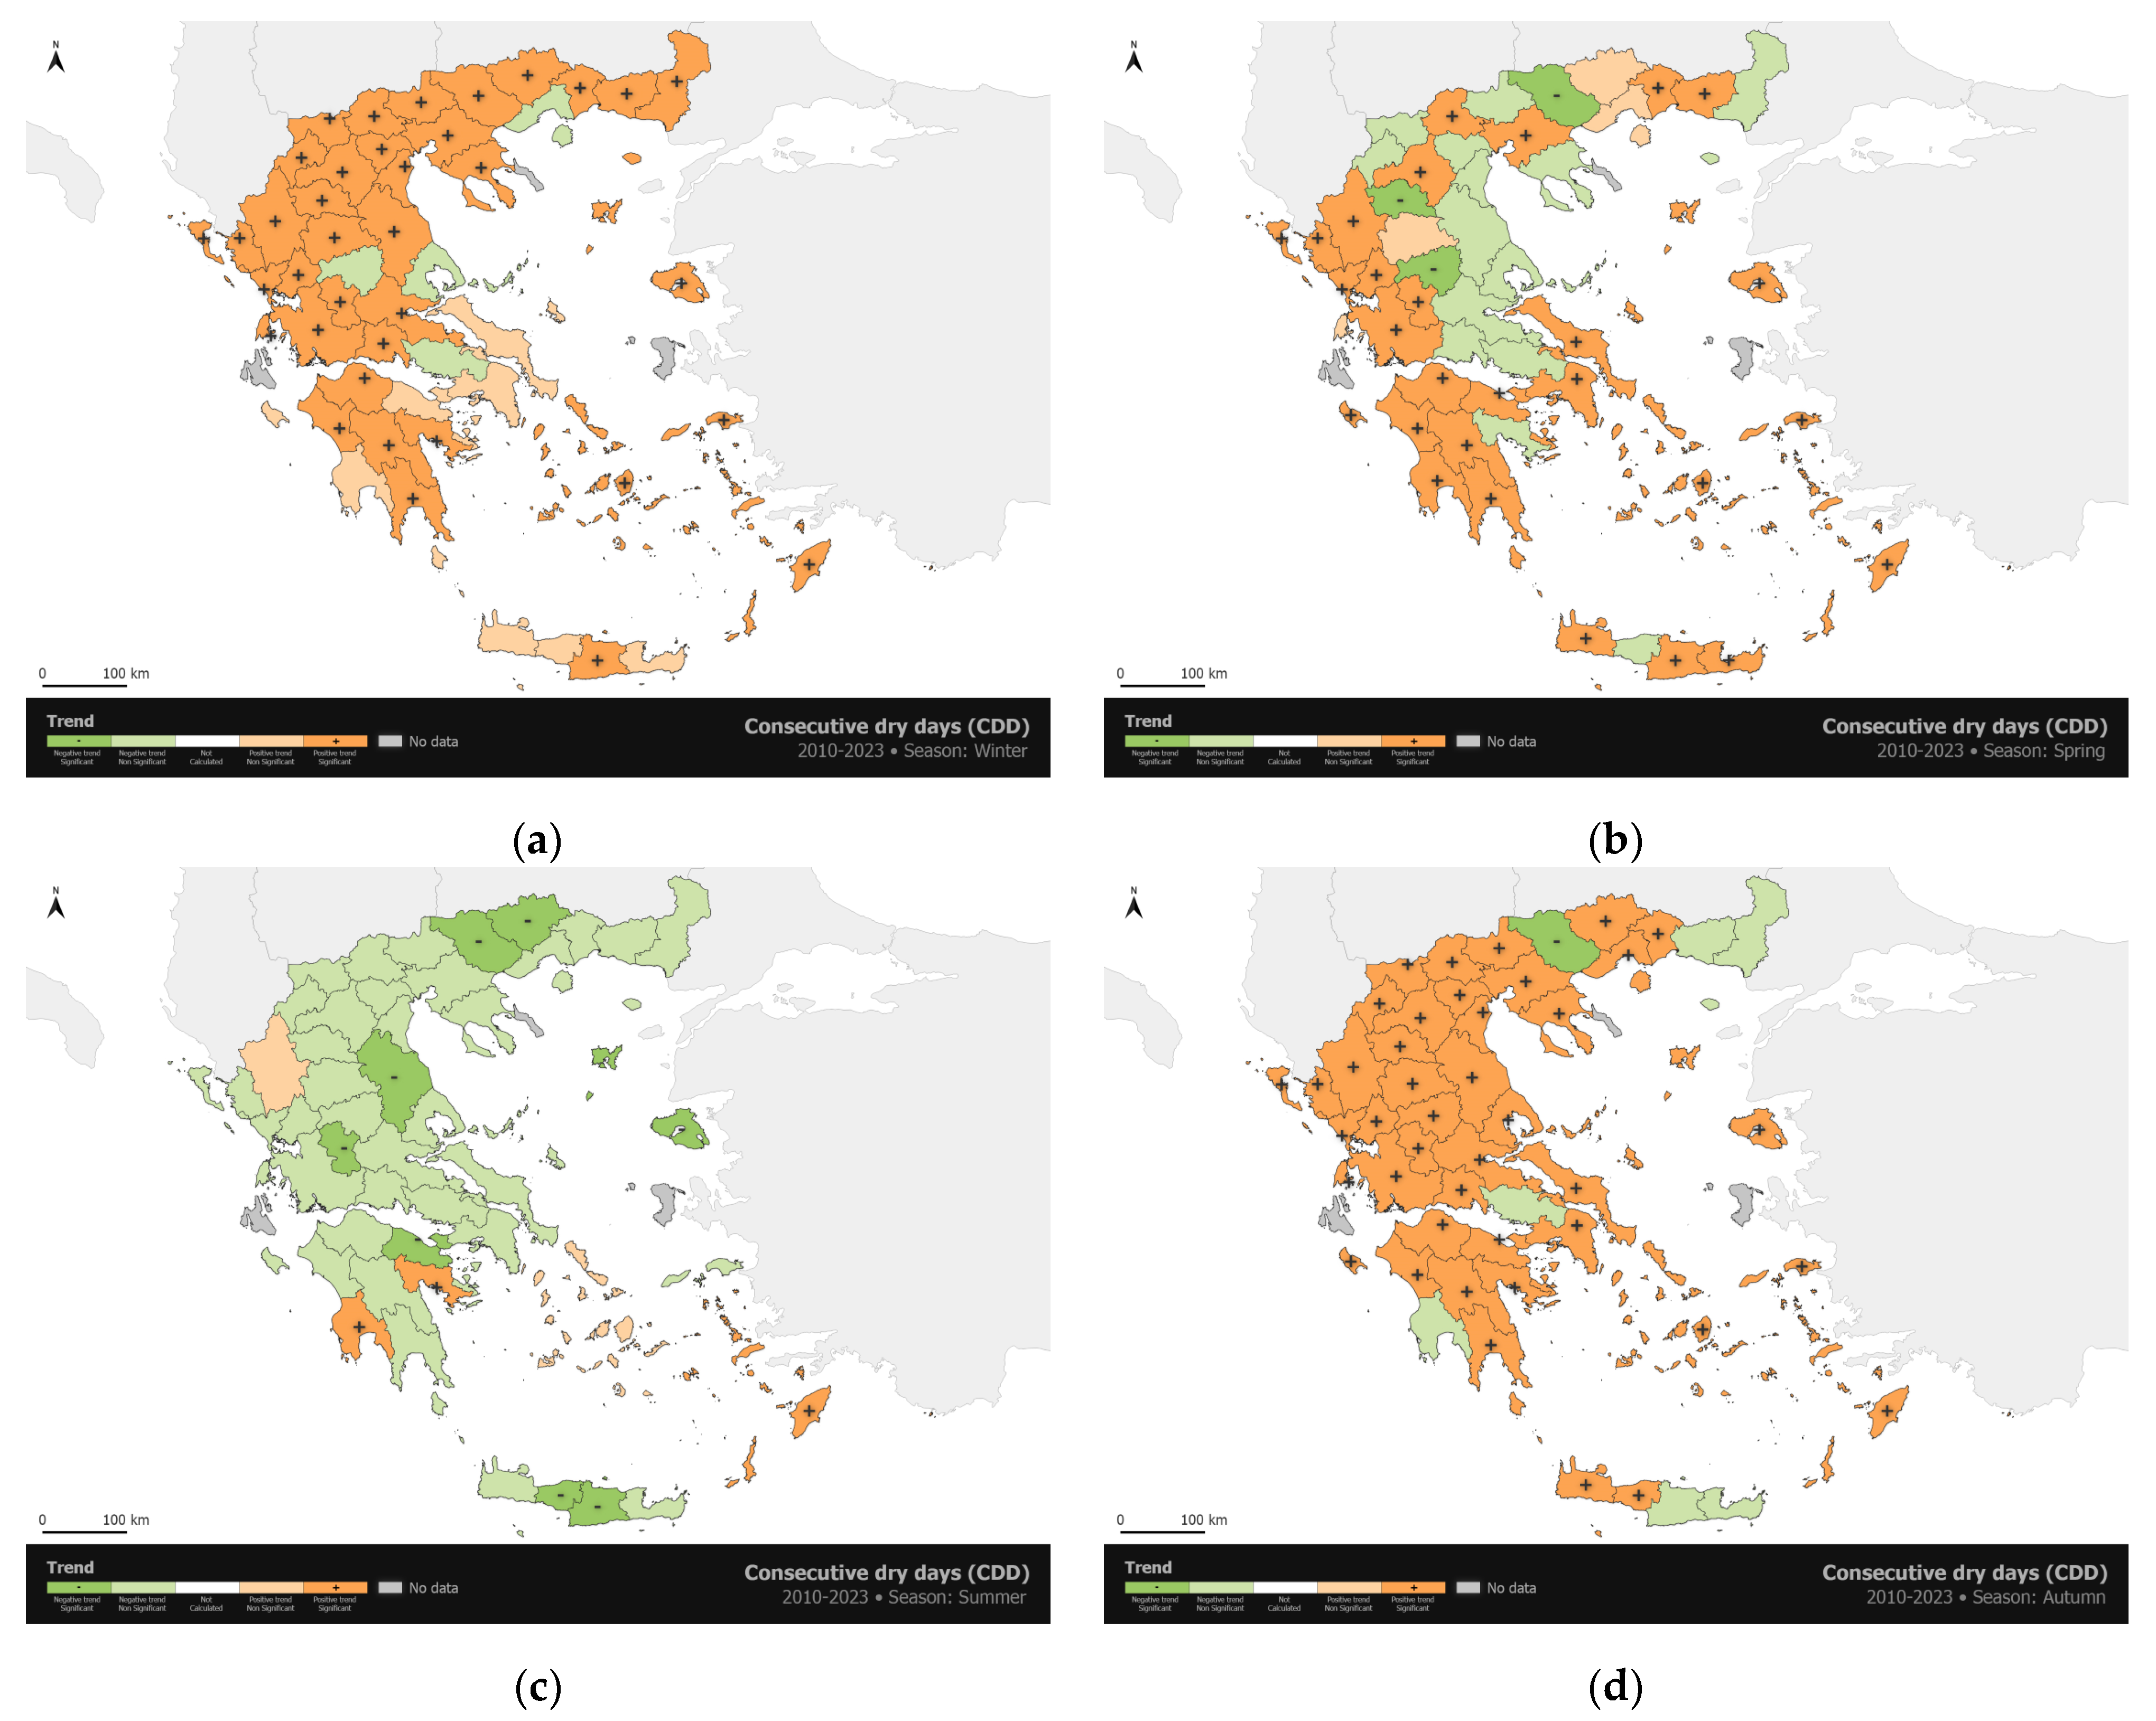
In this study, we used the climate index consecutive dry days (CDD), which is defined as the maximum number of consecutive days with precipitation less than 1 mm, in order to study the drought conditions in Greece during the period 2010–2023.
Figure 15 shows the spatial distribution of the mean observed CDD at a seasonal level. The worst conditions are found in summer, where a dry spell could last up to ~30 days, while milder conditions are found in winter. The spring and the autumn are transitional seasons, with average CDD lasting for almost 14 days. The drier conditions are found in the islands of the South Aegean Sea and the island of Crete, where dry spells could reach values up to almost 30 consecutive days in summer.
Figure 16 shows the spatial distribution of seasonal CDD trends for the period 2010–2023. It is noteworthy that a negative trend prevails during the warm period of the year (spring, summer), in general, while positive trends are found during the colder period (autumn, winter). Thus, there is a tendency for drier climatic conditions in autumn and winter, while the dry spells in summer are shorter. It must be noticed that most of the trends are not statistically significant (confidence level of 95%) in the warm period of the year.
4.5. Fire Weather Conditions
Weather is the most variable and largest driver of wildfire activity on a regional scale [
72,
73]. Temperature, relative humidity, wind speed, and precipitation are weather elements that independently affect fire behavior and spread. The alignment of multiple extremes of these meteorological variables, such as the co-occurrence of hot, dry, and windy conditions, provides the potential required for the occurrence of the most intense and fast-spreading wildfires.
In practice, the influence of weather on fire danger is typically accounted for using fire weather indices that are based on some approximation of fuel aridity derived from weather observations. One of the most commonly used indices is the Canadian Forest Fire Weather Index System (CFFWIS) [
74], which has been widely used for assessing fire weather and fire danger globally (e.g., [
75,
76,
77]). Furthermore, the CFFWIS is the index implemented by the European Forest Fire Information System (EFFIS;
https://effis.jrc.ec.europa.eu, accessed on 14 January 2025), while it has been extensively used in the past for assessing fire weather changes in the Mediterranean (e.g., [
12,
78]).
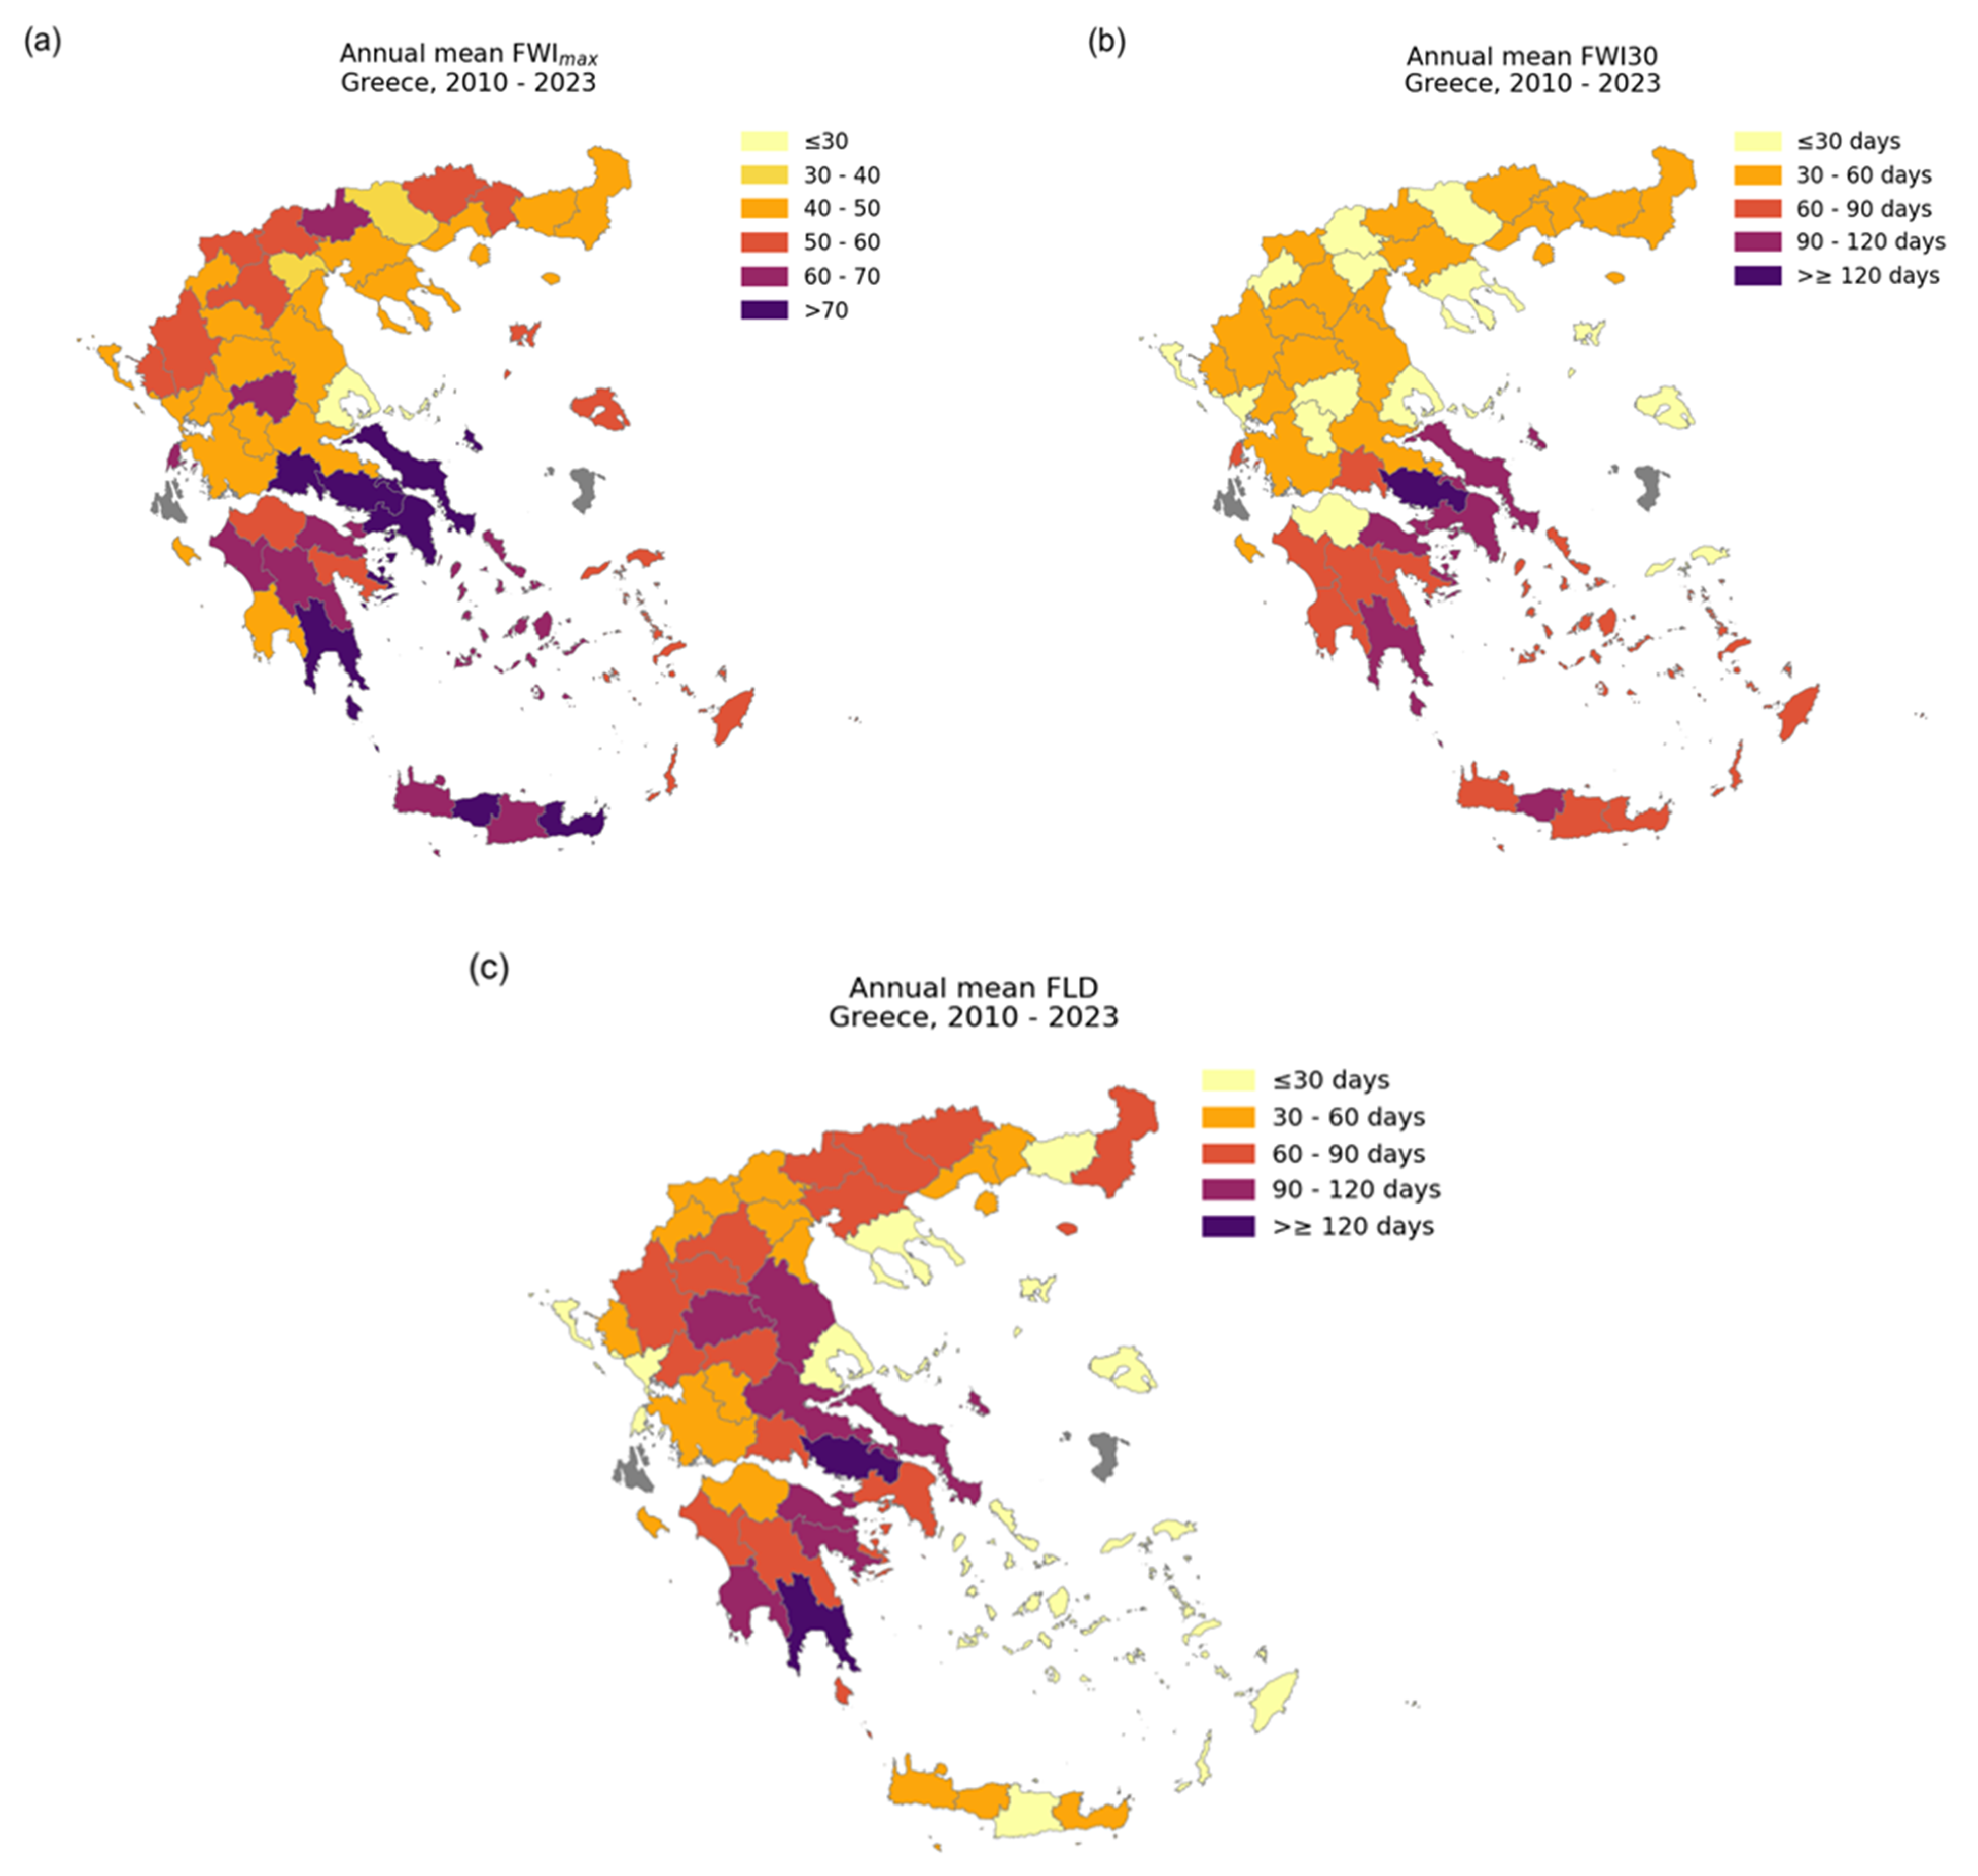
Here, we present the average values and trends of daily fire weather from 2010 to 2023 based on the measurements retrieved from the network of NOA automatic weather stations [
19]. In particular, we focus on the following extremes: (1) the annual maximum of the fire weather index (FWImax), which provides a measure of extreme fire danger, (2) the annual number of days conducive to fire spread (FWI30), defined as days when the FWI exceeds a threshold value of 30 (corresponding to at least moderate fire danger following Papagiannaki et al., 2020 [
79]), and (3) the annual number of flammable days (FLD), quantified as the days when the fine fuel moisture content (derived from the fine fuel moisture code [FFMC] following Ellis et al., 2021 [
76]) is below 10%, a value that indicates high flammability of the fine dead fuels.
Figure 17a–c present the average values of the computed CFFWIS-based extreme indices. The spatial distribution of all indices exhibits a general north-south gradient, whereby higher values (i.e., most adverse fire weather conditions) are found in the southern regions of Greece. In particular, the southeastern part of continental Greece (including most of Peloponnese) appears to be the most susceptible to adverse fire weather, showing, on average, annual mean FWImax values larger than 60 and annual mean FWI30 and FLD larger than 60 days. It is worth mentioning that Attica, where Athens city is located, exhibits, along with adjacent prefectures of Central Greece, the highest annual mean FWImax values exceeding 70, accompanied by an annual number of days conducive to fire spread (FWI30) larger than 90. Attica region has suffered from large wildfires during the reporting period. From 2017, 13 large fires have burned more than 700,000 str. in Attica, according to reports from the Copernicus Fast Mapping Service and the European Observatory on Forest Fires (EFFIS), with the fires of 2021 and 2023, with 253,700 and 215,600 str. being the worst fire seasons in terms of burnt areas [
80]. The analysis of the FWImax shows increasing trends during the reported period which are statistically insignificant over the largest part of the mainland country.
5. Societal Impacts of Weather-Related Hazards
Greece is a country with a typical Mediterranean climate, often affected by severe weather and climate-related events, mainly flash floods, windstorms, heatwaves, and forest fires [
81,
82,
83,
84]. Even though such phenomena do not usually appear with the destructive power of other natural hazards, such as earthquakes, their overall impact on society and the economy is severe.
Figure 18 depicts the annual distribution of weather-related phenomena that caused adverse societal effects in Greece during the last 24 years, 2000–2023, as derived from the HIWE-DB [
24] developed and curated by the METEO unit at the National Observatory of Athens (
https://meteo.gr/weather_cases.cfm, accessed on 14 January 2025). The total number of events varies considerably yearly, exhibiting a weak, positive trend (Poisson pseudo-R2 = 0.18,
p-value < 0.001) during the analyzed period. Flash flood ranks as the most frequent type in all years examined. Over the 24 years, flash floods have accounted for 56% of the total damaging phenomena. The second most frequent phenomenon is the windstorm (17%).
Regarding the impacts of weather-related events, the Greek dataset has been part of two databases for the Euro-Mediterranean region that record catastrophic events (FLOODHYMEX, [
85] and flood fatalities (FFEM-DB, [
2],
https://data.4tu.nl/articles/_/14754999/3, accessed on 14 January 2025).
Figure 19 depicts the annual distribution of the 65 fatal flood events that resulted in 159 flood fatalities, directly or indirectly (e.g., due to flood-induced landslide or fatal injury), in 2000–2023. All three variables exhibit high interannual variability. However, annual flood fatalities and average fatalities per event were both found to have a statistically significant and positive trend during the examined period, 2000–2023 (Linear regression: adjusted R2 = 0.20,
p-value < 0.01 for flood fatalities, and adjusted R2 = 0.15,
p-value < 0.05 for fatalities per event).
The annual number of fatal flood events did not exhibit any statistically significant trend. However, the observed increase in flood fatalities and fatalities per event highlights the complex interplay between the growing frequency of high-impact floods, societal vulnerability, and individual responses to risk. While catastrophic flood events often result in extensive material damage, the occurrence of fatalities is not solely a function of the event’s magnitude but is also influenced by factors such as preparedness, warning systems, and individuals’ attitudes and behaviors toward flood risks [
86].
Among the hydrogeological hazards, rainfall-induced landslides have also adversely affected the Mediterranean countries [
87,
88]. Due to their impact severity and direct relationship with the duration and intensity of precipitation, there is a growing research interest in modeling landslide risk for early warning systems [
89]; however, relevant studies have not yet been performed in Greece.
Overall, there is evidence of an upward trend in societal impacts caused by weather-related hazards in Greece, especially flash floods. This underscores the urgent need for a paradigm shift in disaster preparedness and response strategies. The current trend emphasizes reaching out to citizens with innovative practices that account for individual behavioral responses to emergencies. However, studies targeting Greek citizens consistently highlight low levels of preparedness, limited risk awareness, and inadequate access to specialized information [
90,
91,
92]. These studies also reveal a low degree of individual response to risk alerts, a lack of understanding of local risks, and systemic inefficiencies in risk communication—issues compounded by widespread low trust in authorities. These factors highlight a critical gap in risk communication frameworks and the shortcomings of standardized, top-down risk management approaches, which may significantly undermine community resilience.
The devastating impacts of recent events, such as the “Ianos” medicane that affected Greece on 18–19 September 2020 and Storm “Daniel” on 4–7 September 2023, demonstrate that vulnerabilities are amplified when extreme events strike areas with inadequate preparedness and protection measures. The “Ianos” medicane resulted in four fatalities and widespread economic losses from the heavy rainfall, the gusty winds, and the high waves [
18], and Storm “Daniel” caused 17 fatalities and devastated the local economy in the region of Thessaly, with recovery costs reaching billions of euros [
16,
17,
93]. These events highlight the urgent need for systemic changes in preparedness and resilience-building efforts.
Improving preparedness and resilience requires a shift from reactive to proactive measures. Developing impact-based early warning systems is essential, enabling authorities to provide localized risk assessments and clear, actionable messaging that resonates with diverse communities, including vulnerable populations. Public education and awareness campaigns tailored to local contexts can foster a culture of preparedness, promoting proactive behavior and increasing understanding of weather-related risks. Governments should also prioritize structural measures such as flood defenses, sustainable urban planning, and stricter enforcement of building codes in flood-prone areas. To complement these efforts, leveraging technology such as mobile apps, GIS, and machine learning can improve risk communication, resource allocation, and risk prediction. Finally, enhancing coordination among national, regional, and local authorities through regular drills and clearly defined roles can ensure a cohesive and efficient response to emergencies. Building resilient societies depends on robust infrastructure, informed communities, and effective collaboration between policymakers, scientists, and local actors.
6. Concluding Remarks
This paper presents an overview of severe climatological and hydrometeorological events in Greece. High-impact weather events like heatwaves and heavy rainfall are first analyzed for the Greek capital, Athens, and then the analysis expands to severe events across Greece, spanning from heat waves and severe convective events to droughts and fire weather conditions. The impacts of these severe weather events on the Greek society are also examined. In the following we summarize the main findings detailed in the previous sections.
The analysis of long-term, reliable climate data from the National Observatory of Athens (NOA) historical station in Athens center reveals significant warming in Athens since the 1980s, with temperatures rising almost twice as fast as the global average. Recent decades have seen a sharp increase in hot extremes in Athens, including both the frequency of hot days and heatwaves (HWs). Analysis of historical periods shows that the frequency of hot days in the recent climate period (1991–2020) is three times higher than in earlier periods. Heatwaves in Athens have also become more frequent and intense, with their number quadrupling in 1991–2020 compared to previous periods and occurring increasingly in June. Seasonal changes have extended the period of hot extremes, with heat events starting earlier and ending later each year since the mid-1970s. Regarding our findings on HWs, those are in line with other studies based on centennial observations over the Mediterranean, suggesting a significant increase in the frequency of HWs in the eastern Mediterranean since the late 1980s and triplication of hot days [
94]. As it concerns precipitation, the frequency of heavy rainfall days (e.g., days with over 20 mm, 40 mm, or 50 mm) has increased by approximately 70% during the recent decades. During the 1991–2020 period, nearly half of Athens’s total precipitation occurred on days with heavy or extreme rainfall. While the findings on air temperature and hot extremes trends across the region are more consistent in the literature, the precipitation regime varies strongly depending on the location and period under consideration [
95].
On a country scale, the analysis is based on the NOA network of automatic weather stations for the period 2010–2023. Although this period is not long enough to address the climatology of the studied areas, and this is a limitation of this study, it offers the opportunity through this dense but relatively new network to study not only the most recent trends but also to discuss them over regional units that were not monitored before by a surface weather station. Based on the analysis, it was evident that the Greek territory experiences almost one heatwave per summer, while the heatwave days range from 3.5 to 7.7 days per summer. The number of days meeting the HW criterion can reach up to 15% of the number of days in the summer. The lowest HWN and HWF values are found mostly in the Cyclades and North Aegean.
High rainfall events were studied based on the R20 and SPII indices, and maximum values of both were found during winter and autumn, while minimum was found for summer. The eastern Aegean islands, the western parts of continental Greece, receive the highest amounts of rainfall and present the highest number of heavy precipitation events during fall and winter. A statistically significant increasing trend of heavy precipitation events was found for the last 15 years in a large part of the country. While high-precipitation events are increasing, the drought index of consecutive dry days shows that the dry spells are becoming longer, mainly in the southern parts of the country. The driest conditions are found over the islands of the South Aegean Sea and Crete. In particular, in summer, up to 30 consecutive dry days can occur. Seasonal trends of the CDD during the last 15 years show a general tendency towards drier conditions in autumn and winter.
Analysis of convective events in Greece focused on thunderstorms, hail, and tornado events. Thunderstorms were studied using lightning data as a proxy. Thunderstorms are more frequent in spring and summer while they predominantly occur over Greece’s mainland, especially in the northern, central, and western regions. Northern Greece experiences the highest thunderstorm activity during the summer months, averaging 41 thunderstorm days. Monthly analysis showed that June is the peak month for thunderstorm activity in northern Greece, with an average of 14 thunderstorm days. Hail events in Greece mostly occur over the mainland during spring and summer, with the highest frequency in northern and central regions. It should be noted that southern Greece, including the islands, experiences fewer hail events. However, damaging hail over 3 cm in diameter does occasionally occur on the islands. Tornadoes are rare and often occur near the coast as waterspouts, especially along the western coast and in the northern Ionian and northwestern Aegean Seas. Land tornadoes are more likely in western Greece and northern areas, with notable events in Laconia and Attica. Most tornadoes in Greece are rated weak (IF-0 or IF-1), with only 9.6% classified as strong (IF-2). Tornadoes and waterspouts are most common in autumn, with minimal activity in spring and summer.
The analysis of fire weather conditions in Greece from 2010 to 2023 shows that southern regions, particularly the southeastern mainland and Peloponnese, experienced the highest fire danger. Although the maximum fire weather index (FWImax) generally shows increasing trends during the studied period, these are mostly statistically insignificant.
This paper has also discussed the weather-related societal impacts across Greece, which has shown an increasing trend over the past 24 years, with flash floods being the most frequent and damaging phenomenon, followed by windstorms. Although fatal flood events and fatalities have also increased since 1980, effective response is limited by low public preparedness and awareness, as well as inadequate risk communication from authorities. Major storms like the “Ianos” medicane in 2020 and Storm “Daniel” in 2023 highlighted these vulnerabilities, causing severe fatalities and economic damage. To improve resilience, Greece requires more effective risk communication, impact-based warning systems, and enhanced public education on emergency responses.
The overarching concluding remark is that Greece faces a variety of extreme meteorological and climatological events, with an alarming increasing trend. This trend is expected to increase further in the era of the “climate crisis”, and therefore, a meticulous collection of relevant data is of paramount importance for the next years. The National Observatory of Athens is committed to further developing and expanding its observational capacities in the immediate future, providing thus the necessary information for the authorities, stakeholders, and the general public.
Author Contributions
Conceptualization, V.K.; methodology, V.K., D.F. and K.L.; software, A.B., S.D., E.G., C.G., T.G., A.K., G.K. and G.P.; validation, V.K., D.F. and K.L.; formal analysis, all; investigation, all; resources, all; data curation, A.B., S.D., D.F., E.G., C.G., T.G., A.K., I.K., G.K., K.L., K.P. and G.P.; writing—original draft preparation, all; writing—review and editing, all; visualization, A.B. and G.K.; supervision, V.K.; project administration, V.K.; funding acquisition, V.K. All authors have read and agreed to the published version of the manuscript.
Funding
This research was funded by the General Secretariat of Research and Innovation (GSRI) under project “CLIMPACT: Support for upgrading the operation of the national network for climate change”, grant number OPS 5201588, financed by the national section of the PDE National Development Program 2021-2025, Ministry of Development – General Secretariat of Research and Innovation.
Institutional Review Board Statement
Not applicable.
Informed Consent Statement
Not applicable.
Data Availability Statement
The datasets generated during the current study are available from the corresponding author upon reasonable request.
Acknowledgments
We acknowledge the European Severe Weather Database (ESWD) for the availability of the hail and tornado incidence data used in this study. We also acknowledge funding of this research by project "Climpact: Support for upgrading the operation of the national network for climate change" financed by the national section of the PDE National Development Program 2021-2025, Ministry of Development – General Secretariat of Research and Innovation.
Conflicts of Interest
The authors declare no conflicts of interest.
References
- MunichRe 2021. Risks from Floods, Storm Surges and Flash Floods. Underestimated Natural Hazard. Available online: https://www.munichre.com/en/risks/natural-disasters-losses-are-trending-upwards/floods-and-flash-floods-underestimated-natural-hazards.html (accessed on 31 December 2021).
- Papagiannaki, K.; Petrucci, O.; Diakakis, M.; Kotroni, V.; Aceto, L.; Bianchi, C.; Brázdil, R.; Gelabert, M.G.; Inbar, M.; Kahraman, A.; et al. Developing a large-scale dataset of flood fatalities for territories in the Euro-Mediterranean region, FFEM-DB. Sci. Data 2022, 9, 166. [Google Scholar] [CrossRef]
- Petrucci, O.; Papagiannaki, K.; Aceto, L.; Boissier, L.; Kotroni, V.; Grimalt, M.; Llasat, M.C.; Llasat-Botija, M.; Rosselló, J.; Pasqua, A.A.; et al. MEFF: The database of MEditerranean Flood Fatalities (1980 to 2015). J. Flood Risk Manag. 2019, 12, e12461. [Google Scholar] [CrossRef]
- Petrucci, O.; Aceto, L.; Bianchi, C.; Bigot, V.; Brázdil, R.; Pereira, S.; Kahraman, A.; Kılıç, Ö.; Kotroni, V.; Llasat, M.C.; et al. Flood Fatalities in Europe, 1980–2018: Variability, Features, and Lessons to Learn. Water 2019, 11, 1682. [Google Scholar] [CrossRef]
- Diakakis, M.; Deligiannakis, G. Flood fatalities in Greece: 1970–2010. J. Flood Risk Manag. 2017, 10, 115–123. [Google Scholar] [CrossRef]
- Rappaport, E.N. Fatalities in the United States from Atlantic Tropical Cyclones: New Data and Interpretation. Bull. Am. Meteorol. Soc. 2014, 95, 341–346. [Google Scholar] [CrossRef]
- European Environmental Agency. Economic Losses from Climate-Related Extremes in Europe. 2022. Available online: https://www.eea.europa.eu/data-and-maps/indicators/direct-losses-from-weather-disasters-4/assessment (accessed on 3 February 2022).
- Lionello, P.; Bhend, J.; Buzzi, A.; Della-Marta, P.M.; Krichak, S.; Jansa, A.; Maheras, P.; Sanna, A.; Trigo, I.F.; Trigo, R. Cyclones in the Mediterranean region: Climatology and effects on the environment. In Mediterranean Climate Variability; Lionello, P., Malanotte-Rizzoli, P., Boscolo, R., Eds.; Elsevier: Amsterdam, The Netherlands, 2006; pp. 325–372. [Google Scholar]
- Michaelides, S.; Karacostas, T.; Sánchez, J.L.; Retalis, A.; Pytharoulis, I.; Homar, V.; Romero, R.; Zanis, P.; Giannakopoulos, C.; Bühl, J.; et al. Reviews and perspectives of high impact atmospheric processes in the Mediterranean. Atmos. Res. 2018, 208, 4–44. [Google Scholar] [CrossRef]
- Bedia, J.; Herrera, S.; Gutiérrez, J.M.; Zavala, G.; Urbieta, I.R.; Moreno, J.M.; García, S.H. Sensitivity of fire weather index to different reanalysis products in the Iberian Peninsula. Nat. Hazards Earth Syst. Sci. 2012, 12, 699–708. [Google Scholar] [CrossRef]
- Koutsias, N.; Xanthopoulos, G.; Founda, D.; Xystrakis, F.; Nioti, F.; Pleniou, M.; Mallinis, G.; Arianoutsou, M. On the relationships between forest fires and weather conditions in Greece from long-term national observations (1894–2010). Int. J. Wildland Fire 2013, 22, 493–507. [Google Scholar] [CrossRef]
- Giannaros, T.M.; Kotroni, V.; Lagouvardos, K. Climatology and trend analysis (1987–2016) of fire weather in the Euro-Mediterranean. Int. J. Clim. 2020, 41, E491–E508. [Google Scholar] [CrossRef]
- Kotroni, V.; Cartalis, C.; Michaelides, S.; Tymvios, F.; Bezes, A.; Christoudias, T.; Stoyanova, J.; Dafis, S.; Giannakopoulos, C.; Giannaros, T.M.; et al. DISARM Early Warning System for Wildfires in the Eastern Mediterranean. Sustainability 2020, 12, 6670. [Google Scholar] [CrossRef]
- Georgiev, C.G.; Tjemkes, S.A.; Karagiannidis, A.; Prieto, J.; Lagouvardos, K. Observational Analyses of Dry Intrusions and Increased Ozone Concentrations in the Environment of Wildfires. Atmosphere 2022, 13, 597. [Google Scholar] [CrossRef]
- Giannaros, T.M.; Papavasileiou, G. Changes in European fire weather extremes and related atmospheric drivers. Agric. For. Meteorol. 2023, 342, 109749. [Google Scholar] [CrossRef]
- NBG. Special Focus Report: Limited Impact on Q4: 2023 GDP from the Catastrophic Flood and Higher Growth in 2024–2025 Due to Reconstruction Projects. 2023. Available online: https://www.nbg.gr/en/group/studies-and-economic-analysis/reports/daniel-storm-gdp-q2-2023 (accessed on 22 August 2024).
- Zachariah, M.; Kotroni, V.; Lagouvardos, K.L.; Barnes, C.; Kimutai, J.; Kew, S.; Pinto, I.; Yang, W.; Vahlberg, M.; Singh, R.; et al. Interplay of Climate Change-Exacerbated Rainfall, Exposure and Vulnerability Led to Widespread Impacts in the Mediterranean Region; World Weather Attribution, Imperial College: London, UK, 2023. [Google Scholar] [CrossRef]
- Lagouvardos, K.; Karagiannidis, A.; Dafis, S.; Kalimeris, A.; Kotroni, V. Ianos: A hurricane in the Mediterranean. BAMS 2022, 103, E1621–E1636. [Google Scholar] [CrossRef]
- Lagouvardos, K.; Kotroni, V.; Bezes, A.; Koletsis, I.; Kopania, T.; Lykoudis, S.; Mazarakis, N.; Papagiannaki, K.; Vougioukas, S. The automatic weather stations NOANN network of the National Observatory of Athens: Operation and database. Geosci. Data J. 2017, 4, 4–16. [Google Scholar] [CrossRef]
- Kotroni, V.; Lagouvardos, K. Lightning occurrence in relation with elevation, terrain slope and vegetation cover over the Mediterranean. JGR-Atmospheres 2008, 113, D21118. [Google Scholar] [CrossRef]
- Lagouvardos, K.; Kotroni, V.; Betz, H.D.; Schmidt, K. A comparison of lightning data provided by ZEUS and LINET networks in western Europe. Nat. Hazards Earth Syst. Sci. 2009, 9, 1713–1717. [Google Scholar] [CrossRef]
- Dotzek, N.; Groenemeijer, P.; Feuerstein, B.; Holzer, A.M. Overview of ESSL’s severe convective storms research using the European Severe Weather Database ESWD. Atmos. Res. 2009, 93, 575–586. [Google Scholar] [CrossRef]
- Founda, D.; Papadopoulos, K.H.; Petrakis, M.; Giannakopoulos, C.; Good, P. Analysis of mean, maximum and minimum temperature in Athens from 1897–2001 with emphasis on the last decade: Trends, warm events, and cold events. Glob. Planet. Change 2004, 44, 27–38. [Google Scholar] [CrossRef]
- Papagiannaki, K.; Lagouvardos, K.; Kotroni, V. A database of high-impact weather events in Greece: A descriptive impact analysis for the period 2001–2011. Nat. Hazards Earth Syst. Sci. 2013, 13, 727–736. [Google Scholar] [CrossRef]
- Founda, D. Evolution of the air temperature in Athens and evidence of climatic change: A review. Adv. Build. Energy Res. 2011, 5, 7–41. [Google Scholar] [CrossRef]
- Founda, D.; Pierros, F.; Petrakis, M.; Zerefos, C. Interdecadal variations and trends of the Urban Heat Island in Athens (Greece) and its response to heat waves. Atmos. Res. 2015, 161–162, 1–13. [Google Scholar] [CrossRef]
- Guerreiro, S.B.; Dawson, R.J.; Kilsby, C.; Lewis, E.; Ford, A. Future heat waves, droughts and floods in 571 European cities. Environ. Res. Lett. 2018, 13, 034009. [Google Scholar] [CrossRef]
- Founda, D.; Giannakopoulos, C. The exceptionally hot summer of 2007 in Athens, Greece—A typical summer in the future climate? Glob. Planet. Change 2009, 67, 227–236. [Google Scholar] [CrossRef]
- Founda, D.; Varotsos, K.V.; Pierros, F.; Giannakopoulos, C. Observed and projected shifts in hot extremes’ season in the Eastern Mediterranean. Glob. Planet. Change 2019, 175, 190–200. [Google Scholar] [CrossRef]
- Giannaros, T.M.; Papavasileiou, G.; Lagouvardos, K.; Kotroni, V.; Dafis, S.; Karagiannidis, A.; Dragozi, E. Meteorological analysis of the 2021 extreme wildfires in Greece: Lessons learned and implications for early warning of the potential for pyroconvection. Atmosphere 2022, 13, 475. [Google Scholar] [CrossRef]
- Founda, D.; Katavoutas, G.; Pierros, F.; Mihalopoulos, N. The Extreme Heat Wave of Summer 2021 in Athens (Greece): Cumulative Heat and Exposure to Heat Stress. Sustainability 2022, 14, 7766. [Google Scholar] [CrossRef]
- Giannaros, C.; Agathangelidis, I.; Papavasileiou, G.; Galanaki, E.; Kotroni, V.; Lagouvardos, K.; Giannaros, T.; Cartalis, C.; Matzarakis, A. The extreme heat wave of July–August 2021 in the Athens urban area (Greece): Atmospheric and human-biometeorological analysis exploiting ultra-high resolution numerical modeling and the local climate zone framework. Sci. Total Environ. 2023, 857, 159300. [Google Scholar] [CrossRef]
- Giannaros, C.; Dafis, S.; Kotroni, V.; Lagouvardos, K. The extreme heat wave of late July/early August 2021 in Greece under the context of the direct effect of anthropogenic greenhouse gases. Atmos. Sci. Lett. 2024, 25, e1191. [Google Scholar] [CrossRef]
- Founda, D.; Giannakopoulos, C.; Pierros, F.; Kalimeris, A.; Petrakis, M. Observed and projected precipitation variability in Athens over a 2.5 century period. Atmos. Sci. Lett. 2013, 14, 72–78. [Google Scholar] [CrossRef]
- Baldi, M.; Dalu, G.; Maracchi, G.; Pasqui, M.; Cesarone, F. Heat waves in the Mediterranean: A local feature or a larger-scale effect? Int. J. Climatol. 2006, 26, 1477–1487. [Google Scholar] [CrossRef]
- Galanaki, E.; Giannaros, C.; Kotroni, V.; Lagouvardos, K.; Papavasileiou, G. Spatio-Temporal Analysis of Heatwaves Characteristics in Greece from 1950 to 2020. Climate 2023, 11, 5. [Google Scholar] [CrossRef]
- Founda, D.; Pierros, F.; Katavoutas, G.; Keramitsoglou, I. Observed trends in thermal stress at European cities with different background climates. Atmosphere 2019, 10, 436. [Google Scholar] [CrossRef]
- Kostopoulou, E.; Jones, P.D. Assessment of climate extremes in the Eastern Mediterranean. Meteorol. Atmos. Phys. 2005, 89, 69–85. [Google Scholar] [CrossRef]
- Kuglitsch, F.G.; Toreti, A.; Xoplaki, E.; Della-Marta, P.M.; Zerefos, C.S.; Trke, M.; Luterbacher, J. Heat wave changes in the eastern mediterranean since 1960. Geophys. Res. Lett. 2010, 37, 272. [Google Scholar] [CrossRef]
- Tolika, K. Assessing heatwaves over Greece using the Excess Heat Factor (EHF). Climate 2019, 7, 9. [Google Scholar] [CrossRef]
- Androulidakis, Y.S.; Krestenitis, Y.N. Sea Surface Temperature Variability and Marine Heat Waves over the Aegean, Ionian, and Cretan Seas from 2008–2021. J. Mar. Sci. Eng. 2022, 10, 42. [Google Scholar] [CrossRef]
- Benas, N.; Chrysoulakis, N.; Cartalis, C. Trends of urban surface temperature and heat island characteristics in the Mediterranean. Theor. Appl. Climatol. 2017, 130, 807–816. [Google Scholar] [CrossRef]
- Kioutsioukis, I.; Melas, D.; Zerefos, C. Statistical assessment of changes in climate extremes over Greece (1955–2002). Int. J. Climatol. 2010, 30, 1723–1737. [Google Scholar] [CrossRef]
- Giannaros, C.; Melas, D.; Giannaros, T.M. On the short-term simulation of heat waves in the Southeast Mediterranean: Sensitivity of the WRF model to various physics schemes. Atmos. Res. 2019, 218, 99–116. [Google Scholar] [CrossRef]
- Giannaros, T.M.; Kotroni, V.; Lagouvardos, K.; Matzarakis, A. Climatology and trends of the Euro-Mediterranean thermal bioclimate. Int. J. Climatol. 2018, 38, 3290–3308. [Google Scholar] [CrossRef]
- Katavoutas, G.; Founda, D. Intensification of thermal risk in Mediterranean climates: Evidence from the comparison of rational and simple indices. Int. J. Biometeorol. 2019, 63, 1251–1264. [Google Scholar] [CrossRef] [PubMed]
- Founda, D.; Katavoutas, G.; Pierros, F.; Mihalopoulos, N. Centennial changes in heat waves characteristics in Athens (Greece) from multiple definitions based on climatic and bioclimatic indices. Glob. Planet. Change 2022, 212, 103807. [Google Scholar] [CrossRef]
- Vlachogiannis, D.; Sfetsos, A.; Markantonis, I.; Politi, N.; Karozis, S.; Gounaris, N. Quantifying the Occurrence of Multi-Hazards Due to Climate Change. Appl. Sci. 2022, 12, 1218. [Google Scholar] [CrossRef]
- Christodoulou, M.; Sioutas, M. Radar Climatology of Supercell Thunderstorms in Northern and Central Greece. In Prespectives on Atmospheric Sciences; Publisher: Springer, Cham, 2017; pp. 247–253. [Google Scholar] [CrossRef]
- Sioutas, M.; Meaden, T.; Webb, J.D.C. Hail frequency, distribution and intensity in Northern Greece. Atmos. Res. 2009, 93, 526–533. [Google Scholar] [CrossRef]
- Papavasileiou, G.; Kotroni, V.; Lagouvardos, K.; Giannaros, T.M. Observational and numerical study of a giant hailstorm in Attica, Greece, on 4 October 2019. Atmos. Res. 2022, 278, 106341. [Google Scholar] [CrossRef]
- Matsangouras, I.T.; Nastos, P.T.; Bluestein, H.B.; Sioutas, M.V. A climatology of tornadic activity over Greece based on historical records. Int. J. Climatol. 2014, 34, 2538–2555. [Google Scholar] [CrossRef]
- Sioutas, M.; Dafis, S.; Papavasileiou, G.; Doe, R.K. Tornado Occurrence in Greece: Influencing Variables and Spatio-Temporal Variations. In Proceedings of the 8th European Conference on Severe Storms, Wiener Neustadt, Austria, 14–18 September 2015; Available online: https://meetingorganizer.copernicus.org/ECSS2015/ECSS2015-145-5.pdf (accessed on 14 January 2025).
- Sioutas, M.; Dafis, S.; Papavasileiou, G.; Doe, R. An updated tornado climatology and associated meteorological environments in Greece. In Proceedings of the 11th European Conference on Severe Storms, Bucharest, Romania, 8–12 May 2023. [Google Scholar] [CrossRef]
- Sioutas, M.V.; Keul, A.G. Waterspouts of the Adriatic, Ionian and Aegean Sea and their meteorological environment. Atmos. Res. 2007, 83, 542–557. [Google Scholar] [CrossRef]
- Matsangouras, I.T.; Pytharoulis, I.; Nastos, P.T. Numerical modeling and analysis of the effect of complex Greek topography on tornadogenesis. Nat. Hazards Earth Syst. Sci. 2014, 14, 1905–1919. [Google Scholar] [CrossRef]
- Groenemeijer, P.; Holzer, A.M.; Kühne, T.; Púčik, T. The International Fujita Scale and its implementation. In Proceedings of the 11th European Conference on Severe Storms, Bucharest, Romania, 8–12 May 2023. [Google Scholar] [CrossRef]
- Lampiris, A.; Dafis, S.; Papavasileiou, G. Observational and Numerical Study of a Tornado Outbreak in Attica and Euboea. In Perspectives on Atmospheric Sciences; Springer Atmospheric Sciences; Springer: Cham, Switzerland, 2017. [Google Scholar] [CrossRef]
- Nastos, P.T.; Zerefos, C.S. Decadal changes in extreme daily precipitation in Greece. Adv. Geosci. 2008, 16, 55–62. [Google Scholar] [CrossRef]
- Kelebek, M.B.; Batıbeniz, F.; Önol, B. Exposure Assessment of Climate Extremes over the Europe–Mediterranean Region. Atmosphere 2021, 12, 633. [Google Scholar] [CrossRef]
- Karagiannidis, A.F.; Karacostas, T.; Maheras, P.; Makrogiannis, T. Climatological aspects of extreme precipitation in Europe, related to mid-latitude cyclonic systems. Theor. Appl. Climatol. 2012, 107, 165–174. [Google Scholar] [CrossRef]
- Kambezidis, H.D.; Larissi, I.K.; Nastos, P.T.; Paliatsos, A.G. Spatial variability and trends of the rain intensity over Greece. Adv. Geosci. 2010, 26, 65–69. [Google Scholar] [CrossRef][Green Version]
- Lagouvardos, K.; Dafis, S.; Kotroni, V.; Kyros, G.; Giannaros, C. Exploring recent (1991–2020) trends of essential climate variables in Greece. Atmoshere 2024, 15, 1104. [Google Scholar] [CrossRef]
- Keyantash, J.; Dracup, J.A. The Quantification of Drought: An Evaluation of Drought Indices. Bull. Am. Meteorol. Soc. 2002, 83, 1167. [Google Scholar] [CrossRef]
- Kutiel, H.; Maheras, P.; Guika, S. Circulation and extreme rainfall conditions in the eastern Mediterranean during the last century. Int. J. Climatol. 1996, 16, 73–92. [Google Scholar] [CrossRef]
- IPCC; Pachauri, R.K.; Allen, M.R.; Barros, V.R.; Broome, J.; Cramer, W.; Christ, R.; Church, J.A.; Clarke, L.; Dahe, Q.; et al. Climate Change 2014: Synthesis Report. Contribution of Working Groups I, II and III to the Fifth Assessment Report of the Intergovernmental Panel on Climate Change; IPCC: Geneva, Switzerland, 2014. [Google Scholar]
- Nastos, P.T.; Politi, N.; Kapsomenakis, J. Spatial and temporal variability of the aridity index in Greece. Atmos. Res. 2013, 119, 140–152. [Google Scholar] [CrossRef]
- Tsiros, I.X.; Nastos, P.; Proutsos, N.D.; Tsaousidis, A. Variability of the aridity index and related drought parameters in Greece using climatological data over the last century (1900–1997). Atmos. Res. 2020, 240, 104914. [Google Scholar] [CrossRef]
- Myronidis, D.; Theofanous, N. Changes in climatic patterns and tourism and their concomitant effect on drinking water transfers into the Region of South Aegean, Greece. Stoch. Environ. Res. Risk. Assess. 2021, 35, 1725–1739. [Google Scholar] [CrossRef]
- Giannikopoulou, A.S.; Kampragkou, E.; Gad, F.K.; Kartalidis, A.; Assimacopoulos, D. Drought characterisation in Cyclades complex, Greece. Eur. Water 2014, 47, 31–43. [Google Scholar]
- Anagnostopoulou, C. Future drought projection for the Greek region. Bull. Geol. Soc. Greece 2016, 50, 1038–1045. [Google Scholar] [CrossRef][Green Version]
- Abatzoglou, J.T.; Kolden, C.A. Relationships between climate and macroscale area burned in the western United States. Int. J. Wildland Fire 2013, 22, 1003–1020. [Google Scholar] [CrossRef]
- Flannigan, M.D.; Logan, K.A.; Amiro, B.D.; Skinner, W.R.; Stocks, B.J. Future area burned in Canada. Clim. Change 2005, 72, 1–16. [Google Scholar] [CrossRef]
- Van Wagner, C.E. Development and Structure of the Canadian Forest Fire Weather Index System. Forestry 1987, 51, 3. [Google Scholar]
- Abatzoglou, J.T.; Williams, A.P.; Barbero, R. Global emergence of anthropogenic climate change in fire weather indices. Geophys. Res. Lett. 2019, 46, 326–336. [Google Scholar] [CrossRef]
- Ellis, T.M.; Bowman, D.M.J.S.; Jain, P.; Flannigan, M.D.; Williamson, G.J. Global increase in wildfire risk due to climate-driven declines in fuel moisture. Glob. Change Biol. 2021, 28, 1544–1559. [Google Scholar] [CrossRef] [PubMed]
- Jolly, W.M.; Cochrane, M.A.; Freeborn, P.H.; Holden, Z.A.; Brown, T.J.; Williamson, G.J.; Bowman, D.M.J.S. Climate-induced variations in global wildfire danger from 1979 to 2013. Nat. Commun. 2015, 6, 7537. [Google Scholar] [CrossRef] [PubMed]
- Karali, A.; Hatzaki, M.; Giannakopoulos, C.; Roussos, A.; Xanthopoulos, G.; Tenentes, V. Sensitivity and evaluation of current fire risk and future projections due to climate change: The case study of Greece. Nat. Hazards Earth Syst. Sci. 2014, 14, 143–153. [Google Scholar] [CrossRef]
- Papagiannaki, K.; Giannaros, T.M.; Lykoudis, S.; Kotroni, V.; Lagouvardos, K. Weather-related thresholds for wildfire danger in a Mediterranean region: The case of Greece. Agric. For. Meteorol. 2020, 291, 108076. [Google Scholar] [CrossRef]
- Lagouvardos, K.; Kotroni, V.; Giannaros, T.M.; Kyros, G. 37% of the Forests of Attica Burned in the Last 8 Years. 2024. Available online: https://www.meteo.gr/article_view.cfm?entryID=3355 (accessed on 1 October 2024).
- Lagouvardos, K.; Kotroni, V.; Giannaros, Τ.Μ.; Dafis, S. Meteorological conditions conducive to the rapid spread of the deadly wildfire in eastern Attica, Greece. Bull. Am. Meteorol. Soc. 2019, 100, 2137–2145. [Google Scholar] [CrossRef]
- Papagiannaki, K.; Lagouvardos, K.; Kotroni, V.; Bezes, A. Flash flood occurrence and relation to the rainfall hazard in a highly urbanized area. Nat. Hazards Earth Syst. Sci. 2015, 15, 1859–1871. [Google Scholar] [CrossRef]
- Kotroni, V.; Lagouvardos, K.; Kallos, G.; Ziakopoulos, D. Severe flooding over central and southern Greece associated with pre-cold frontal orographic lifting. Q. J. R. Meteorol. Soc. 1999, 125, 967–991. [Google Scholar]
- Lagouvardos, K.; Kotroni, V.; Dobricic, S.; Nickovic, S.; Kallos, G. On the storm of 21–22 October 1994 over Greece: Observations and model results. J. Geophys. Res. 1996, 101, 26217–26226. [Google Scholar] [CrossRef]
- Llasat, M.C.; Llasat-Botija, M.; Petrucci, O.; Pasqua, A.A.; Rosselló, J.; Vinet, F.; Boissier, L. Towards a database on societal impact of Mediterranean floods within the framework of the HYMEX project. Nat. Hazards Earth Syst. Sci. 2013, 13, 1337–1350. [Google Scholar] [CrossRef]
- Papagiannaki, K.; Diakakis, M.; Kotroni, V.; Lagouvardos, K.; Papagiannakis, G. The Role of Water Depth Perception in Shaping Car Drivers’ Intention to Enter Floodwaters: Experimental Evidence. Sustainability 2021, 13, 4451. [Google Scholar] [CrossRef]
- Gariano, S.; Petrucci, O.; Guzzetti, F. Changes in the occurrence of rainfall induced landslides in Calabria, southern Italy, in the 20th century. Nat. Hazards Earth Syst. Sci. 2015, 15, 2313–2330. [Google Scholar] [CrossRef]
- Polemio, M.; Petrucci, O. Occurrence of landslide events and the role of climate in the twentieth century in Calabria, southern Italy. Q. J. Eng. Geol. Hydrogeol. 2010, 43, 403–415. [Google Scholar] [CrossRef]
- Menon, V.; Kolathayar, S. Review on Landslide Early Warning System: A Brief History, Evolution, and Controlling Parameters. In Civil Engineering for Disaster Risk Reduction; Kolathayar, S., Pal, I., Chian, S.C., Mondal, A., Eds.; Springer: Singapore, 2022; pp. 129–145. [Google Scholar]
- Papagiannaki, K.; Kotroni, V.; Lagouvardos, K.; Ruin, I.; Bezes, A. Urban Area Response to Flash Flood–Triggering Rainfall, Featuring Human Behavioral Factors: The Case of 22 October 2015 in Attica, Greece. Weather Clim. Soc. 2017, 9, 621–638. [Google Scholar] [CrossRef]
- Papagiannaki, K.; Kotroni, V.; Lagouvardos, K.; Papagiannakis, G. How awareness and confidence affect flood-risk precautionary behavior of Greek citizens: The role of perceptual and emotional mechanisms. Nat. Hazards Earth Syst. Sci. 2019, 19, 1329–1346. [Google Scholar] [CrossRef]
- Papagiannaki, K.; Diakakis, M.; Kotroni, V.; Lagouvardos, K.; Andreadakis, E. Hydrogeological and Climatological Risks Perception in a Multi-Hazard Environment: The Case of Greece. Water 2019, 11, 1770. [Google Scholar] [CrossRef]
- Hewson, T.; Ashoor, A.; Boussetta, S.; Emanuel, K.; Lagouvardos, K.; Lavers, D.; Magnusson, L.; Pillosu, F.; Zsoter, E. Medicane Daniel: An extraordinary cyclone with devastating impacts. ECMWF Newsl. 2024, 179, 33–47. Available online: https://www.ecmwf.int/en/newsletter/179/earth-system-science/medicane-daniel-extraordinary-cyclone-devastating-impacts (accessed on 14 January 2025).
- Kuglitsch, F.G.; Toreti, A.; Xoplaki, E.; Della-Marta, P.M.; Luterbacher, J. Heat Wave Changes in the Mediterranean Region since 1900. Geophys. Res. Abstr. 2009, 11, 1850. [Google Scholar]
- Zittis, G.; Almazroui, M.; Alpert, P.; Ciais, P.; Cramer, W.; Dahdal, Y.; Fnais, M.; Francis, D.; Hadjinicolaou, P.; Howari, F.; et al. Climate change and weather extremes in the Eastern Mediterranean and Middle East. Rev. Geophys. 2022, 60, e2021RG000762. [Google Scholar] [CrossRef]
Figure 1.
Topographic map of Greece (elevation in m) and locations referred to in the text.
Figure 1.
Topographic map of Greece (elevation in m) and locations referred to in the text.
Figure 2.
Frequency (total number) of hot days, heat waves (HWs) and HW days at NOA for 4 consecutive climatic sub-periods (1901–1930, 1931–1960, 1961–1990, and 1991–2020).
Figure 2.
Frequency (total number) of hot days, heat waves (HWs) and HW days at NOA for 4 consecutive climatic sub-periods (1901–1930, 1931–1960, 1961–1990, and 1991–2020).
Figure 3.
Frequency (number of days) of different extreme precipitation categories in Athens (NOA) for 4 consecutive climatic sub-periods (1901–2020).
Figure 3.
Frequency (number of days) of different extreme precipitation categories in Athens (NOA) for 4 consecutive climatic sub-periods (1901–2020).
Figure 4.
The 2010–2023 average values of observed HWN for summer.
Figure 4.
The 2010–2023 average values of observed HWN for summer.
Figure 5.
The 2010–2023 average values of observed HWD for summer.
Figure 5.
The 2010–2023 average values of observed HWD for summer.
Figure 6.
The 2010–2023 average values of observed HWF for summer.
Figure 6.
The 2010–2023 average values of observed HWF for summer.
Figure 7.
Thunder days in Greece over the 52 prefectures based on ZEUS lightning data.
Figure 7.
Thunder days in Greece over the 52 prefectures based on ZEUS lightning data.
Figure 8.
Hail reports in Greece during the period 2010–2023.
Figure 8.
Hail reports in Greece during the period 2010–2023.
Figure 9.
Maximum hail diameter reports in Greece during the period 2010–2023.
Figure 9.
Maximum hail diameter reports in Greece during the period 2010–2023.
Figure 10.
Tornado reports in Greece during the period 2010–2023. Blue triangles denote waterspouts, while the red triangles denote tornadoes over land.
Figure 10.
Tornado reports in Greece during the period 2010–2023. Blue triangles denote waterspouts, while the red triangles denote tornadoes over land.
Figure 11.
The 2010–2023 average values of observed R20 for (a) Winter, (b) Spring, (c) Summer, and (d) Autumn.
Figure 11.
The 2010–2023 average values of observed R20 for (a) Winter, (b) Spring, (c) Summer, and (d) Autumn.
Figure 12.
The 2010–2023 average values of observed SPII for (a) Winter, (b) Spring, (c) Summer, and (d) Autumn.
Figure 12.
The 2010–2023 average values of observed SPII for (a) Winter, (b) Spring, (c) Summer, and (d) Autumn.
Figure 13.
Seasonal R20 trends for (a) Winter, (b) Spring, (c) Summer, and (d) Autumn.
Figure 13.
Seasonal R20 trends for (a) Winter, (b) Spring, (c) Summer, and (d) Autumn.
Figure 14.
Seasonal SPII trends for (a) Winter, (b) Spring, (c) Summer, and (d) Autumn.
Figure 14.
Seasonal SPII trends for (a) Winter, (b) Spring, (c) Summer, and (d) Autumn.
Figure 15.
The 2010–2023 average values of observed CDD for: (a) Winter, (b) Spring, (c) Summer, and (d) Autumn.
Figure 15.
The 2010–2023 average values of observed CDD for: (a) Winter, (b) Spring, (c) Summer, and (d) Autumn.
Figure 16.
Seasonal CDD trends for (a) Winter, (b) Spring, (c) Summer, and (d) Autumn.
Figure 16.
Seasonal CDD trends for (a) Winter, (b) Spring, (c) Summer, and (d) Autumn.
Figure 17.
Annual mean values of the period 2010–2023 for: (a) FWImax, (b) FWI30, and (c) FLD.
Figure 17.
Annual mean values of the period 2010–2023 for: (a) FWImax, (b) FWI30, and (c) FLD.
Figure 18.
Annual distribution of weather-related phenomena in Greece in 2000–2023 by phenomenon.
Figure 18.
Annual distribution of weather-related phenomena in Greece in 2000–2023 by phenomenon.
Figure 19.
Annual distribution of fatal flood events, associated flood fatalities in Greece and average fatalities per event in 2000–2023.
Figure 19.
Annual distribution of fatal flood events, associated flood fatalities in Greece and average fatalities per event in 2000–2023.
| Disclaimer/Publisher’s Note: The statements, opinions and data contained in all publications are solely those of the individual author(s) and contributor(s) and not of MDPI and/or the editor(s). MDPI and/or the editor(s) disclaim responsibility for any injury to people or property resulting from any ideas, methods, instructions or products referred to in the content. |
© 2025 by the authors. Licensee MDPI, Basel, Switzerland. This article is an open access article distributed under the terms and conditions of the Creative Commons Attribution (CC BY) license (https://creativecommons.org/licenses/by/4.0/).
