Article

Effects of Wildfire and Logging on Soil CO2 Efflux in Scots Pine Forests of Siberia

by
Elena A. Kukavskaya
1,*,
Anna V. Bogorodskaya
1,
Ludmila V. Buryak
1,2,3,
Olga P. Kalenskaya
3 and
Susan G. Conard
4,5,†
1
V.N. Sukachev Institute of Forest of the Siberian Branch of the Russian Academy of Sciences—Separate Subdivision of the Federal Research Center “Krasnoyarsk Science Center SB RAS”, Akademgorodok 50/28, 660036 Krasnoyarsk, Russia
2
The Branch of FBU VNIILM “Centre of Forest Pyrology”, Krupskaya 42, 660062 Krasnoyarsk, Russia
3
Institute of Forest Technologies, Reshetnev Siberian State University of Science and Technology, Krasnoyarsky Rabochiy Prospect 31, 660037 Krasnoyarsk, Russia
4
College of Science, Affiliate Faculty, George Mason University, Fairfax, VA 22030, USA
5
US Department of Agriculture, Forest Service, (retired), Washington, DC 20250, USA
*
Author to whom correspondence should be addressed.
Retired Fire Ecology Research National Program Leader, USDA Forest Service, Washington, DC 20250, USA.
Atmosphere 2024, 15(9), 1117; https://doi.org/10.3390/atmos15091117
Submission received: 24 July 2024 / Revised: 9 September 2024 / Accepted: 11 September 2024 / Published: 14 September 2024
(This article belongs to the Special Issue Carbon Fluxes in the Pan-Arctic Region)

Abstract

:
Wildfires and logging play an important role in regulating soil carbon fluxes in forest ecosystems. In Siberia, large areas are disturbed by fires and logging annually. Climate change and increasing anthropogenic pressure have resulted in the expansion of disturbed areas in recent decades. However, few studies have focused on the effects of these disturbances on soil CO2 efflux in the vast Siberian areas. The objective of our research was to evaluate differences in CO2 efflux from soils to the atmosphere between undisturbed sites and sites affected by wildfire and logging in Scots pine forests of southern Siberia. We examined 35 plots (undisturbed forest, burned forest, logged plots, and logged and burned plots) on six study sites in the Angara region and four sites in the Zabaikal region. Soil CO2 efflux was measured using an LI-800 infrared gas analyzer. We found that both fire and logging significantly reduced soil efflux in the first years after a disturbance due to a reduction in vegetation biomass and consumption of the forest floor. We found a substantially lower CO2 efflux in forests burned by high-severity fires (74% less compared to undisturbed forests) than in forests burned by moderate-severity (60% less) and low-severity (37% less) fires. Clearcut logging resulted in 6–60% lower soil CO2 efflux at most study sites, while multiple disturbances (logging and fire) had 48–94% lower efflux. The soil efflux rate increased exponentially with increasing soil temperature in undisturbed Scots pine forests (p < 0.001) and on logged plots (p < 0.03), while an inverse relationship to soil temperature was observed in burned forests (p < 0.03). We also found a positive relationship (R = 0.60–0.83, p < 0.001) between ground cover depth and soil CO2 efflux across all the plots studied. Our results demonstrate the importance of disturbance factors in the assessment of regional and global carbon fluxes. The drastic changes in CO2 flux rates following fire and logging should be incorporated into carbon balance models to improve their reliability in a changing environment.

1. Introduction

The global pool of soil organic carbon is estimated at 1700 GtC, with an additional 1400 GtC accumulated in permafrost [1]. Forest soils store more than 40% of the total organic C in terrestrial ecosystems [2]. Carbon dioxide (CO2) efflux from the soil surface represents the second largest flux of carbon cycling between the atmosphere and terrestrial ecosystems after photosynthesis [3]. Detailed information on soil CO2 fluxes is required to evaluate the ecosystem carbon budget and to determine whether terrestrial ecosystems are carbon sinks or sources [4].
Soil CO2 efflux depends greatly on soil temperature [5], water availability [6], and nutrients [7], with soil temperature considered as a key driver in many ecosystems [8,9] primarily due to its positive relationship with the decomposition rate of soil organic matter [10]. Among climatic factors, air temperature and precipitation are positively correlated with soil CO2 efflux [11].
Climate change is rapidly altering the boreal forest environment, with the most significant changes observed in Siberia [12,13,14]. Burned areas and the frequency of extreme fire events in Siberian boreal forests have been increasing in the 21st century, and these increases are projected to continue [15]. While boreal ecosystems contribute only 13% to the total annual global flux of microbially and plant-respired carbon dioxide (with 20 and 67% contributed by temperate and tropical ecosystems, respectively), they show the largest increase in soil respiration (~7% between 1989 and 2008) [16]. Numerous experiments have confirmed that soil CO2 efflux increases with increased temperature [9,17]. Rising global temperatures in Siberia are expected to accelerate mineralization processes in soils, thereby increasing the release of CO2 to the atmosphere [18].
Wildfires and logging are important disturbances in Siberia [19] that drastically change soil physical and chemical properties [20,21] and substantially affect carbon budgets and fluxes [22]. These disturbance factors have increased in Siberia over the recent decades [23,24]. Researchers have found that the amount of CO2 released to the atmosphere in boreal forests decreases after wildfires [25,26,27]. The magnitude of the reduction depends on the fire severity and time since the fire, with the lowest effluxes observed on newly burned sites [26,28]. The effect of logging on soil CO2 efflux is rather inconsistent and is determined by ecosystem type, harvesting method, and climate conditions [3]. Thus, in the European part of Russia, Molchanov et al. [29] found that soil CO2 efflux increased by 10–50% at a logged site compared to an undisturbed over-mature fir forest in the Moscow region, while Pridacha et al. [30] estimated that soil CO2 efflux in a mature Scots pine forest was 30% higher than at a logged site in the Republic of Karelia.
While extensive global databases of annual and seasonal soil respiration data have been developed that cover a range of climate, ecosystem, and disturbance conditions [31,32], comprehensive data for the vast territory of Russia, and particularly Siberia, are still lacking. Most of the data on soil efflux are only available for the northern regions [8,25,27], while the southern Siberian taiga is still underrepresented in the literature. Meanwhile, this region is characterized by high above-ground biomass and plays an important role in the carbon cycle [1], while at the same time it is under severe anthropogenic and natural pressure [19,23]. The dual effect of fires and logging on soil CO2 efflux has not thus far been assessed across the vast disturbed areas of Siberia. The aim of our study was to evaluate the potential change in CO2 efflux from soils to the atmosphere in Scots pine stands of Siberia after wildfire and logging using information from field observations. To achieve our goal, we measured soil CO2 efflux in (i) undisturbed Scots pine stands and similar forests disturbed by (ii) fire, (iii) logging, and (iv) both logging and fire.

2. Materials and Methods

2.1. Study Sites

The study was conducted in the Angara and Zabaikal regions of the southern Eurasian boreal forest (Figure 1). The Angara region is located in Krasnoyarsk krai, Central Siberia, while the Zabaikal region is southeast of Lake Baikal, East Siberia. These regions were chosen due to their high levels of logging disturbance and fire frequency [19,23,33,34].
The Angara region, on the northern and southern sides of the Angara River, represents the southern taiga ecozone. The climate of the region is continental, with mean annual temperatures over the 2006 to 2023 period ranging from –0.6 to –1.1 °C and daily minimum and maximum values of –51.8 and 36.5 °C, respectively, as reported by the local weather stations (https://rp5.ru; accessed on 1 March 2024). The annual precipitation was 370–380 mm. Snow depth ranged from 25 to 45 cm. The relief of the study area is hilly upland with a mean altitude above sea level varying between 250 and 350 m [35]. Scots pine (Pinus sylvestris L.) forests dominate in the region (34% of the study area), with larch (Larix sibirica Ledeb) stands accounting for 22%, while spruce (Picea obovata Ledeb) and birch (Betula spp.) forests each occupy 14% of the region [36].
The Zabaikal region has complex terrain and geology, with over 50 mountain ridges. The climate is continental, with mean annual temperatures over the 2006 to 2023 period ranging from –2.0 to 0.8 °C and daily minimum and maximum values up to –45.4 and 53.1 °C, respectively (https://rp5.ru; accessed on 1 March 2024). The annual precipitation varies from 200 in the south to 700 mm in the mountains in the north. Winter is characterized by deep soil frost penetration, the absence of wind, and low snow cover (3–11 cm according to the local weather stations). Larch (Larix gmelinii, L. sibirica) and Scots pine forests of low-to-moderate productivity dominate the region [37].
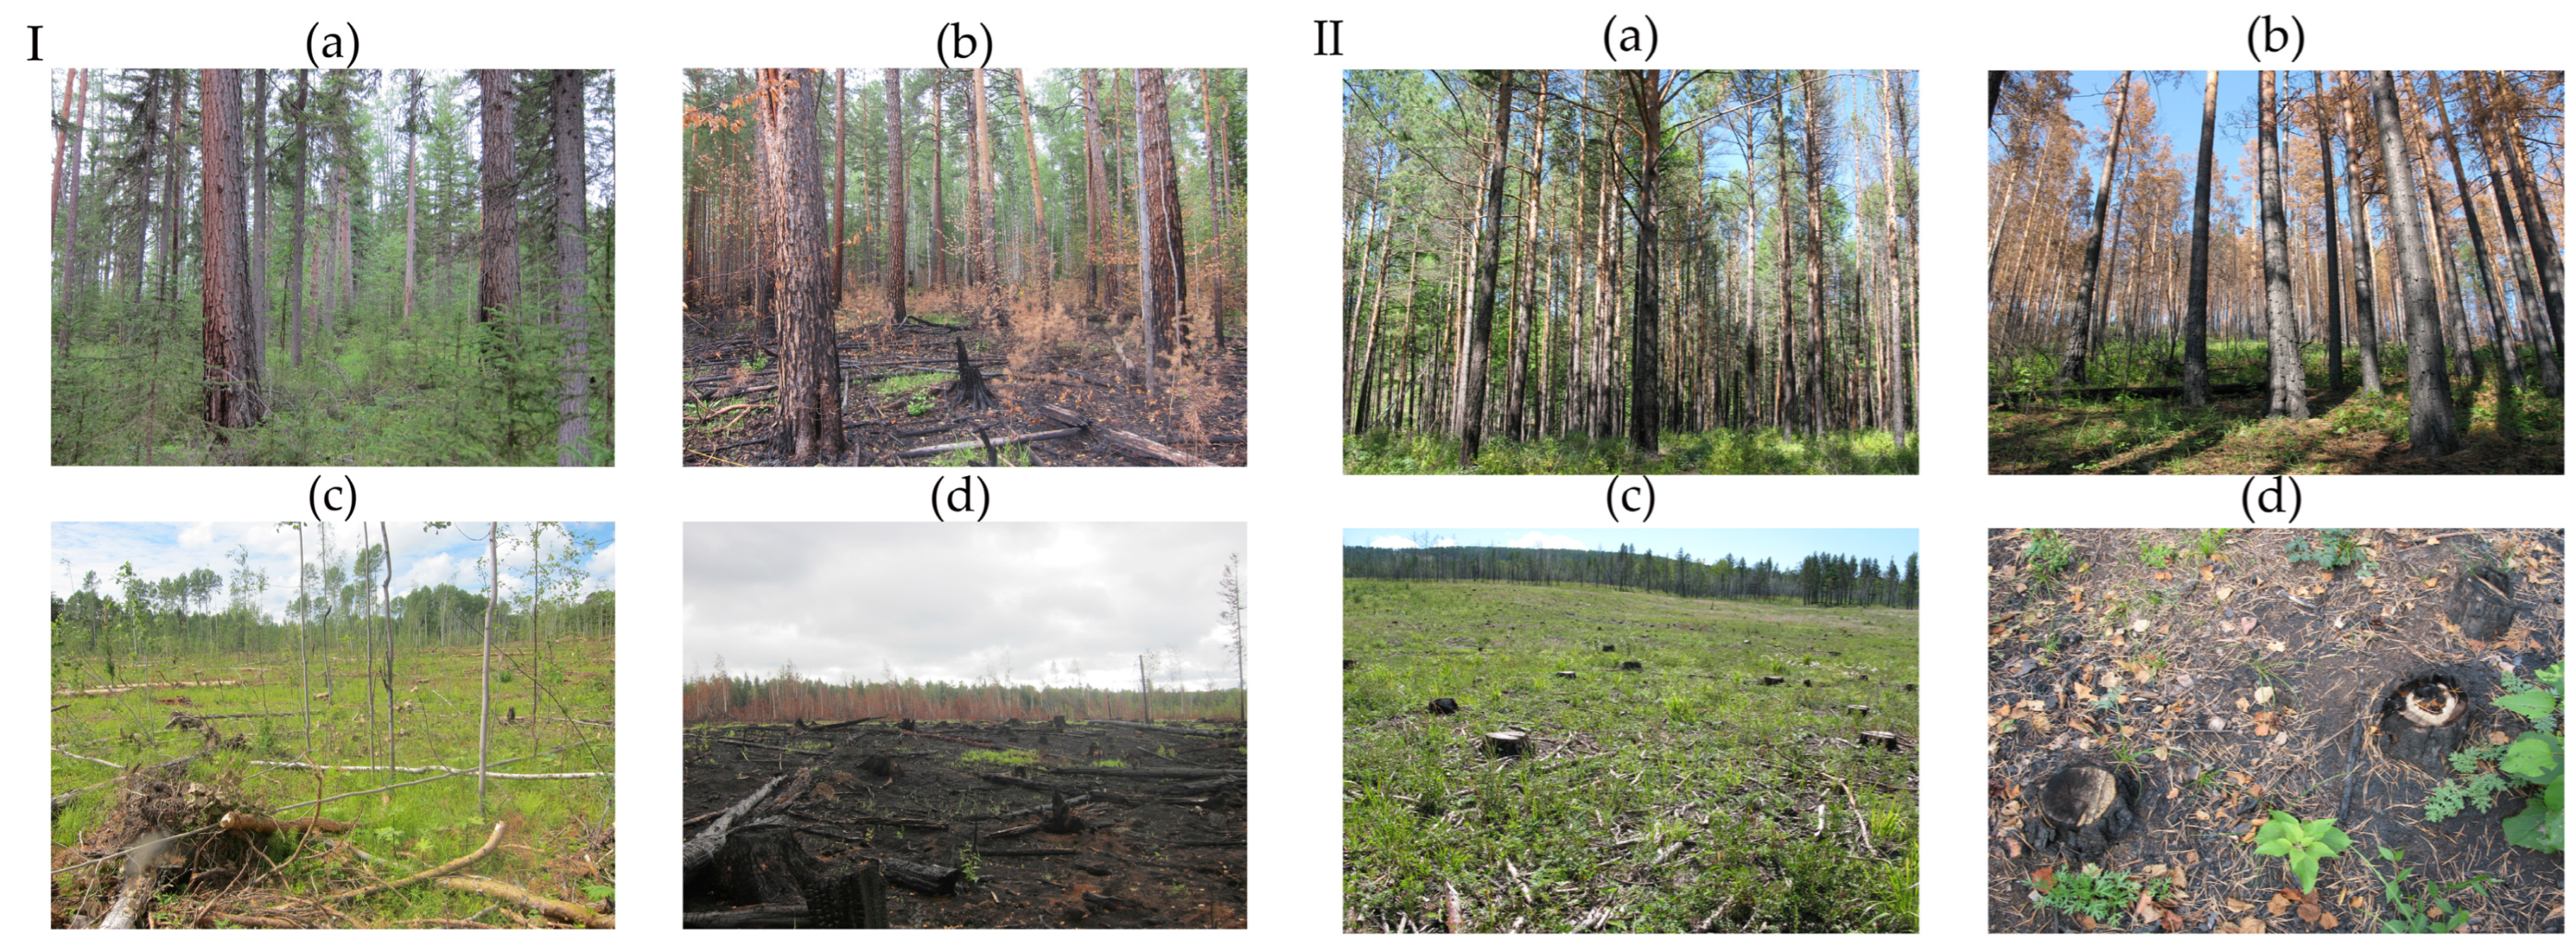
We assessed the short-term effects of fire and logging on soil CO2 efflux at 6 sites in the Angara region (1A–6A) and 4 sites in the Zabaikal region (1Z–4Z) (Figure 1). At each site, three to four plots representing different histories of logging and fire were surveyed at a time: (i) undisturbed forest; (ii) burned forest; (iii) logged plot; and (iv) logged and burned plot (Figure 2).
All sites were in Scots pine forests, which are characterized by high fire frequency and have undergone extensive harvesting [33], especially in recent decades [23,34,38]. The average diameter at breast height (DBH) of the undisturbed forests varied from 20.1 to 32.6 cm, and tree height varied from 18.5 to 27.2 m (Table 1). The majority of the study sites were over-mature forests with tree ages greater than 200 years, while three sites in the Zabaikal region represented mature (3Z) and middle-aged (1Z and 4Z) stands. The sites in the Angara region had higher productivity, with the basal area (BA) reaching 45 m2 ha−1, compared to the Zabaikal region, where the BA ranged from 25.2 to 38.3 m2 ha−1 (Table 1). Feather moss (Pleurozium schreberi (Brid.) Mitt.) dominated the living ground cover of most undisturbed forests in the Angara region. An exception was Study Site 2A, where grasses (Carex macroura, Calamagrostis arundinacea, Rubus saxatolis, etc.) and small shrubs (Vaccinium vitis-idaea) dominated the understory. This site was burned by low-severity fires with low (up to 5%) tree mortality 13 years prior to the study. In the Zabaikal region, the understory was dominated by grasses and forbs (Carex spp., Calamagrostis epigejos, Vicia pseudorobus, V. venosa, Astragalus membranaceus, etc.) on all undisturbed sites. The 4Z undisturbed site had a dense shrub layer represented by Rhododendron dauricum. Soil types were Albic Retisols in the Angara region and Entic Podzols in the Zabaikal region [39].
All burned plots had burned in the spring or summer in the year of the survey. All fires spread as surface fires, which are typical for light conifer forests in the study regions [40]. We classified fire severity as low, moderate, or high (Table 1) based on average fire char heights on the trees [41] and the completeness of combustion of ground fuels [42]. Postfire tree mortality varied from 3 to 90% depending on the fire severity.
All logged plots had been clearcut, with the stand volume logged ranging from 92 to 100%. Time since harvest varied from 0.5 years (logging during preceding winter) to 5 years (Table 1). Fire severity in the logged plots was typically higher than in the undisturbed forests [33].
All field plots within a study site were located in immediate proximity or within 1 km of each other in the same growing conditions, and the sampled stands in each plot had comparable characteristics before fire and logging disturbances. In total, there were 22 individual field plots studied in the Angara region and 13 plots in the Zabaikal region.

2.2. CO2 Efflux Measurements

We conducted one-off measurements of soil CO2 efflux between July and early August of one year at all the sites studied. July–early August corresponds to the maximum air and soil temperatures as well as soil flux rates in Siberia [43]. We measured all plots (undisturbed, logged, burned, and logged and burned) at each study site on the same day between 11:00 and 16:00. We did not measure during rain events or for several days after the rain to keep conditions between measurements at different study areas as similar as possible. Manual chamber measurements were performed on 8–10 collars in each sample plot to determine the CO2 efflux from soil to atmosphere using an LI-800 infrared gas analyzer (Li-COR Inc., Lincoln, NE, USA). The polyvinylchloride collars (inner diameter 10 cm) were placed on the mineral layer to reduce air leakage from below the collar. The vegetation inside the chamber was not removed during the measurements.
Soil temperatures at 5 cm depth were measured adjacent to each collar at the time of CO2 efflux measurements by a portable thermometer (Hanna Instruments Inc., Padova, Italy). In addition, the depth of ground cover (litter, moss, lichen, and duff) was measured near at least 5 collars per studied plot.

2.3. Data Analysis

Statistical analyses of the data were performed with R [44]. The graphs were created using R package ‘ggplot2’ (version 3.4.1) [45]. Mean values and standard deviations were calculated for the parameters studied. Student’s t-test was used to estimate whether soil CO2 fluxes for different sites were significantly different. The differences were considered significant at p < 0.05.

3. Results

3.1. The Impact of Fire and Logging on Soil CO2 Efflux

Soil CO2 efflux in the undisturbed Scots pine forests of the Angara region varied from 6.2 ± 2.3 to 13.5 ± 0.9 µmol m−2 s−1 (mean ± standard deviation) across the studied sites (Figure 3, Table S1). The highest efflux was recorded on Site 2A, which was burned by a low-severity fire 13 years prior to the study. This site was characterized by a predominance of grasses in the vegetation cover compared to the dominance of feather moss in other undisturbed sites.
Wildfires and clearcut logging sites had significantly lower soil CO2 fluxes than undisturbed sites. In the burned forests of the Angara region, soil CO2 efflux was 37–81% lower than in the undisturbed Scots pine stands (Figure 3). The highest reduction, from 10.5 ± 3.9 to 2.0 ± 1.1 µmol m−2 s−1, was observed on Site 4A, which was burned by a high-severity fire. The smallest difference in the soil efflux rate was observed at Site 5A, where a low-severity fire occurred.
On the clearcut logging sites, soil CO2 efflux was 24–60% lower than in the undisturbed Scots pine forests (Figure 3). At the majority of sites, except for Site 5A, soil efflux was higher (by 70–240%) in the logged sites than in the burned forests. In the repeatedly disturbed (logged and burned) sites in the Angara region, soil CO2 efflux was 54–94% lower than in the undisturbed forests, with the lowest efflux being 0.4 ± 0.3 µmol m−2 s−1 (Figure 3).
In the Zabaikal region, soil CO2 efflux in undisturbed forests of Sites 1Z–3Z varied from 7.0 ± 1.0 µmol m−2 s−1 to 9.7 ± 1.9 µmol m−2 s−1 (Figure 4, Table S1). The highest efflux (11.0 ± 2.4 µmol m−2 s−1) was recorded at undisturbed Site 4Z. This site was characterized by a dense shrub layer, represented by Rhododendron dauricum, which could contribute significantly to root respiration rates.
In the burned forests of the Zabaikal region, soil efflux was 47–67% lower than in the undisturbed Scots pine forests (Figure 4). Most of the clearcut logging sites had 6–40% lower CO2 efflux than undisturbed forests, while Site 3Z was characterized by a slight (statistically insignificant) increase in soil efflux.
In the logged and burned sites of the Zabaikal region, soil efflux ranged from 2.5 ± 0.8 to 5.0 ± 1.5 µmol m−2 s−1 (Figure 4). This is 36–52% lower than in undisturbed Scots pine forests.

3.2. The Dependences of Soil CO2 Efflux on Temperature and Ground Cover Depth

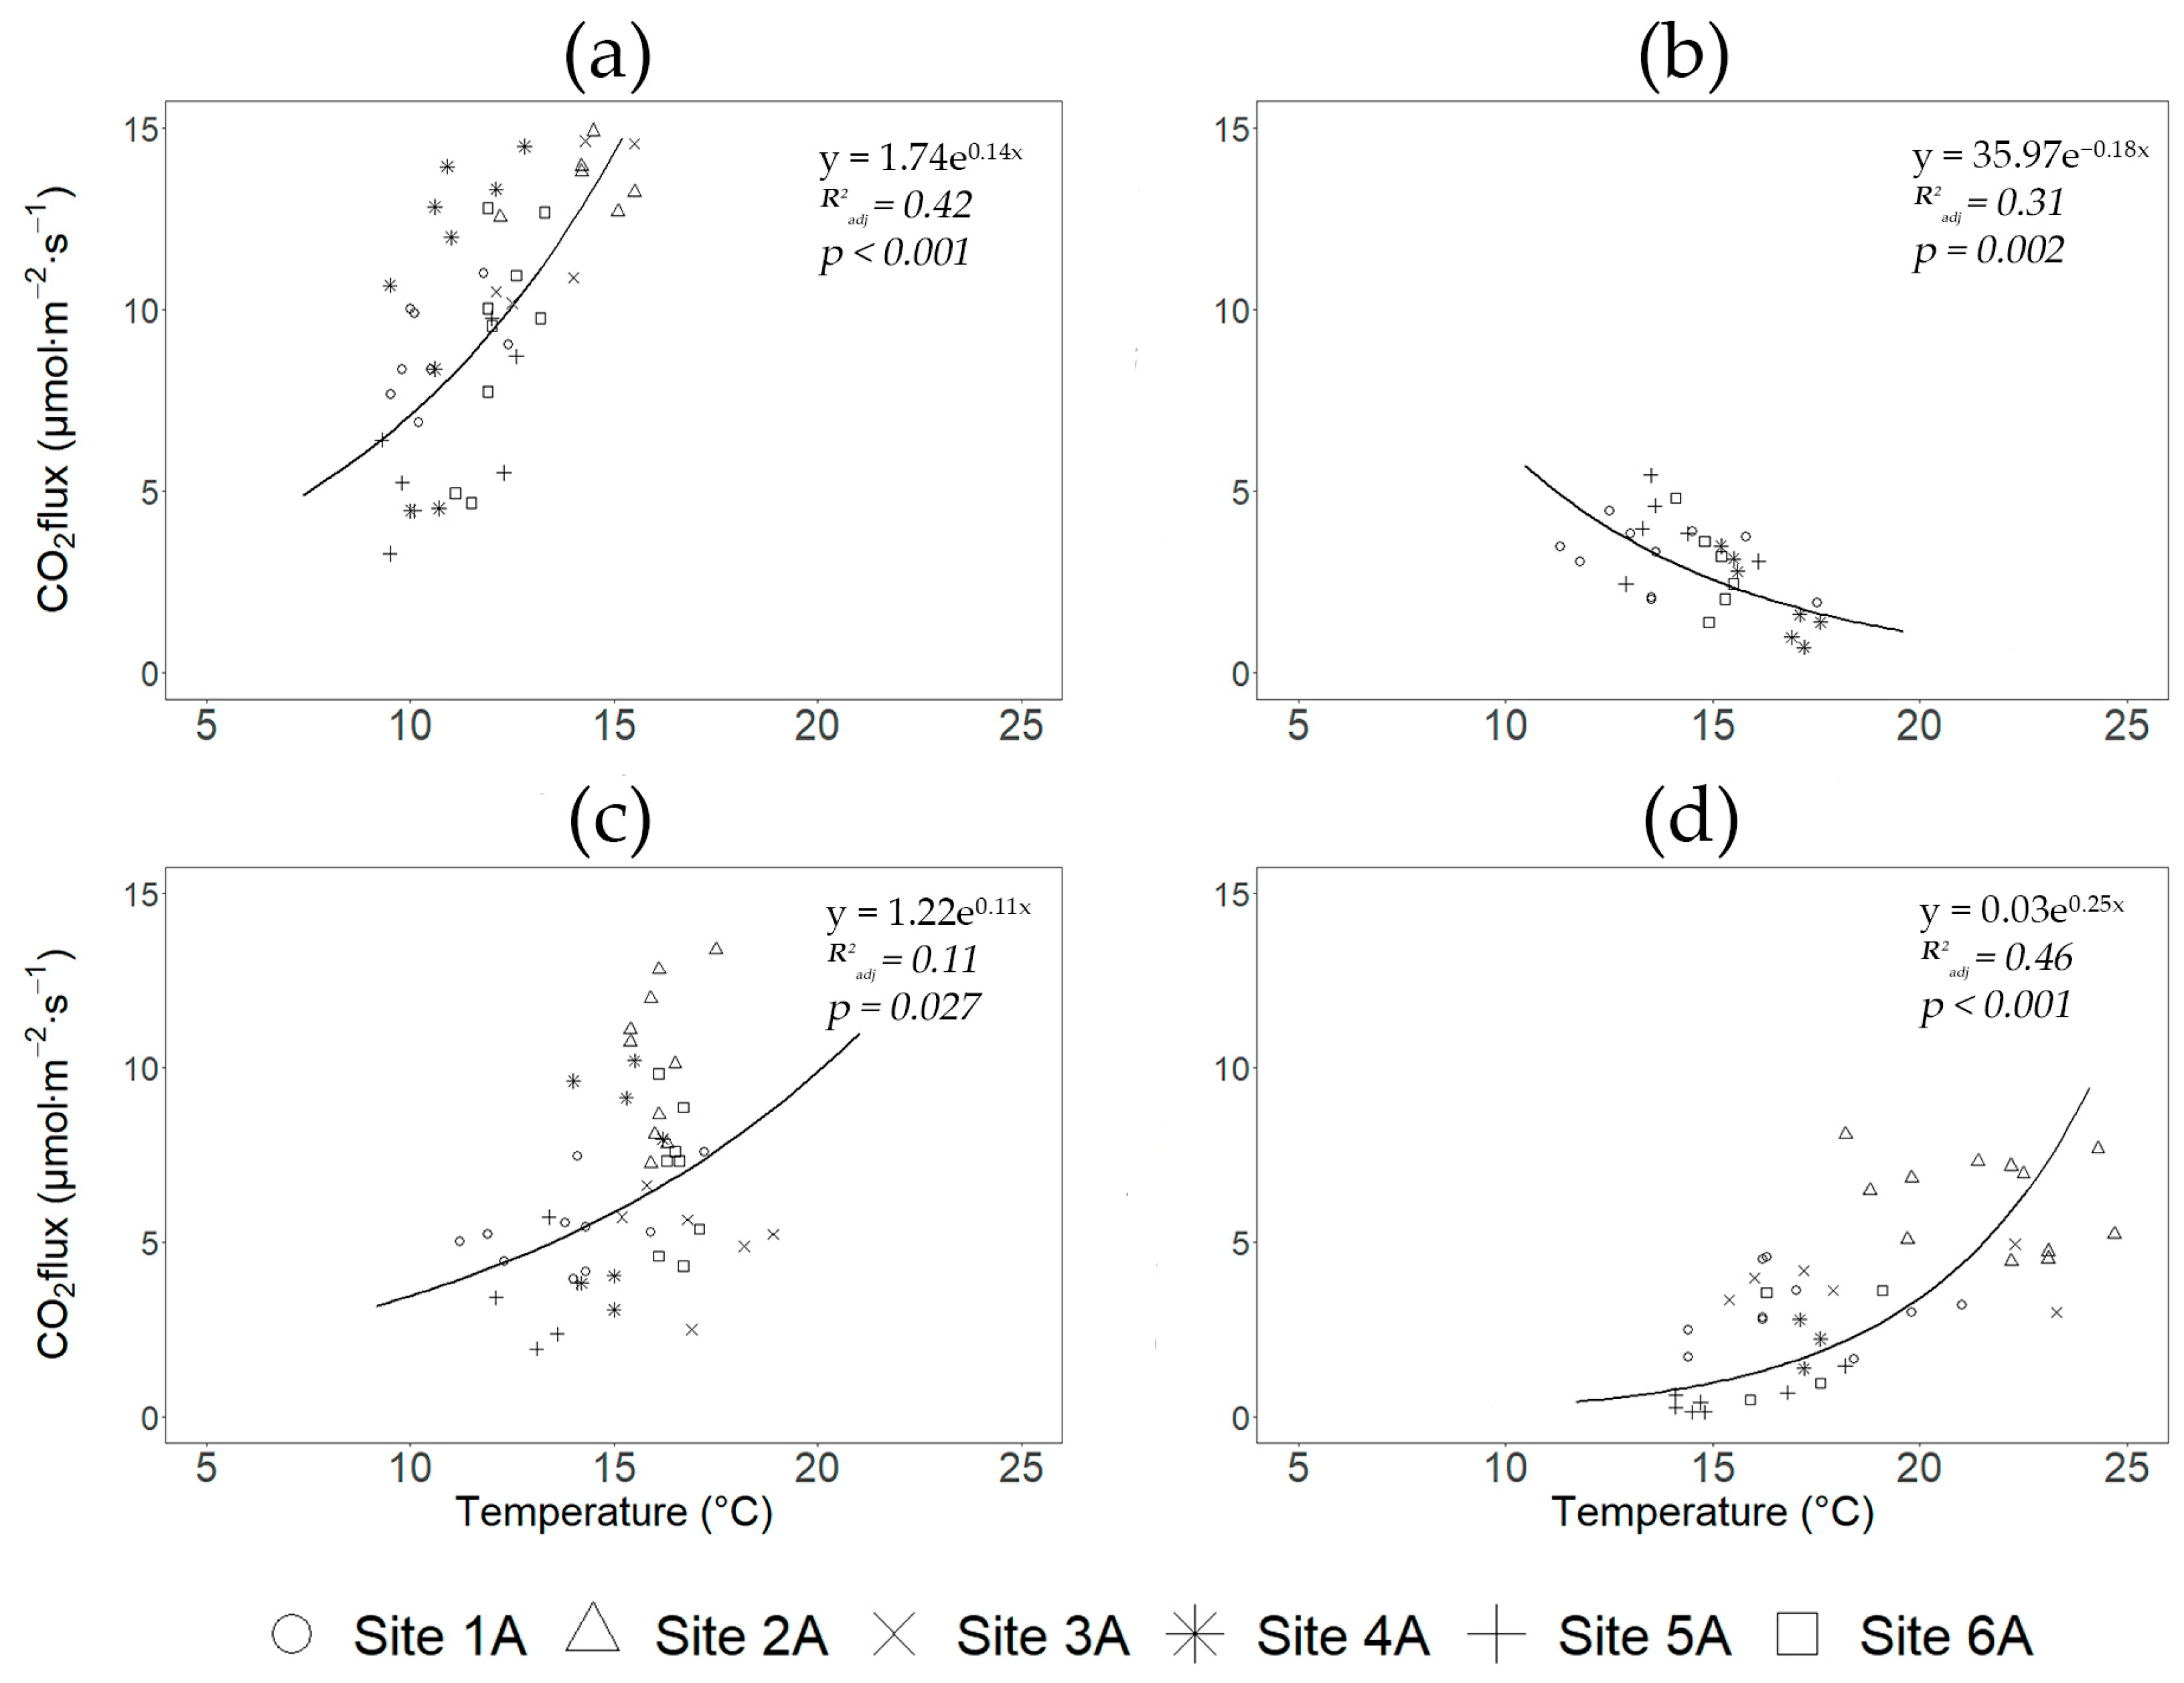
The soil efflux rate increased exponentially with increasing soil temperature in the majority of plots (undisturbed, logged, and logged and burned), with the exception of burned forests (Figure 5 and Figure 6). In the burned forests, the higher the soil temperature was, the lower the measured CO2 flux (Figure 5b and Figure 6b). A shift in the soil temperature range from 10–15 °C in undisturbed forests of the Angara region to 11–18 °C in burned or logged sites and to 14–25 °C in repeatedly disturbed (burned and logged) sites was observed. A similar trend of soil temperature change with increasing forest disturbance was recorded in the Zabaikal region. However, the initial temperatures there were higher than in the Angara region: 13–18 °C in undisturbed forests, 14–22 °C on burned or logged sites, and 17–25 °C on repeatedly disturbed sites.
The highest effect of soil temperature on CO2 efflux was found in undisturbed Scots pine forests (R2adj = 0.42–0.44). Disturbances increased the variability in site characteristics and the importance of other factors, resulting in a reduced significance of soil temperature effects on CO2 efflux. We found no significant dependence of soil efflux on temperature on the repeatedly disturbed (burned and logged) plots in the Zabaikal region (Figure 6d), while this relationship was unexpectedly high in the Angara region (Figure 5d). In general, the relationships between CO2 efflux and soil temperature were statistically more significant in the Angara region compared to the Zabaikal region.
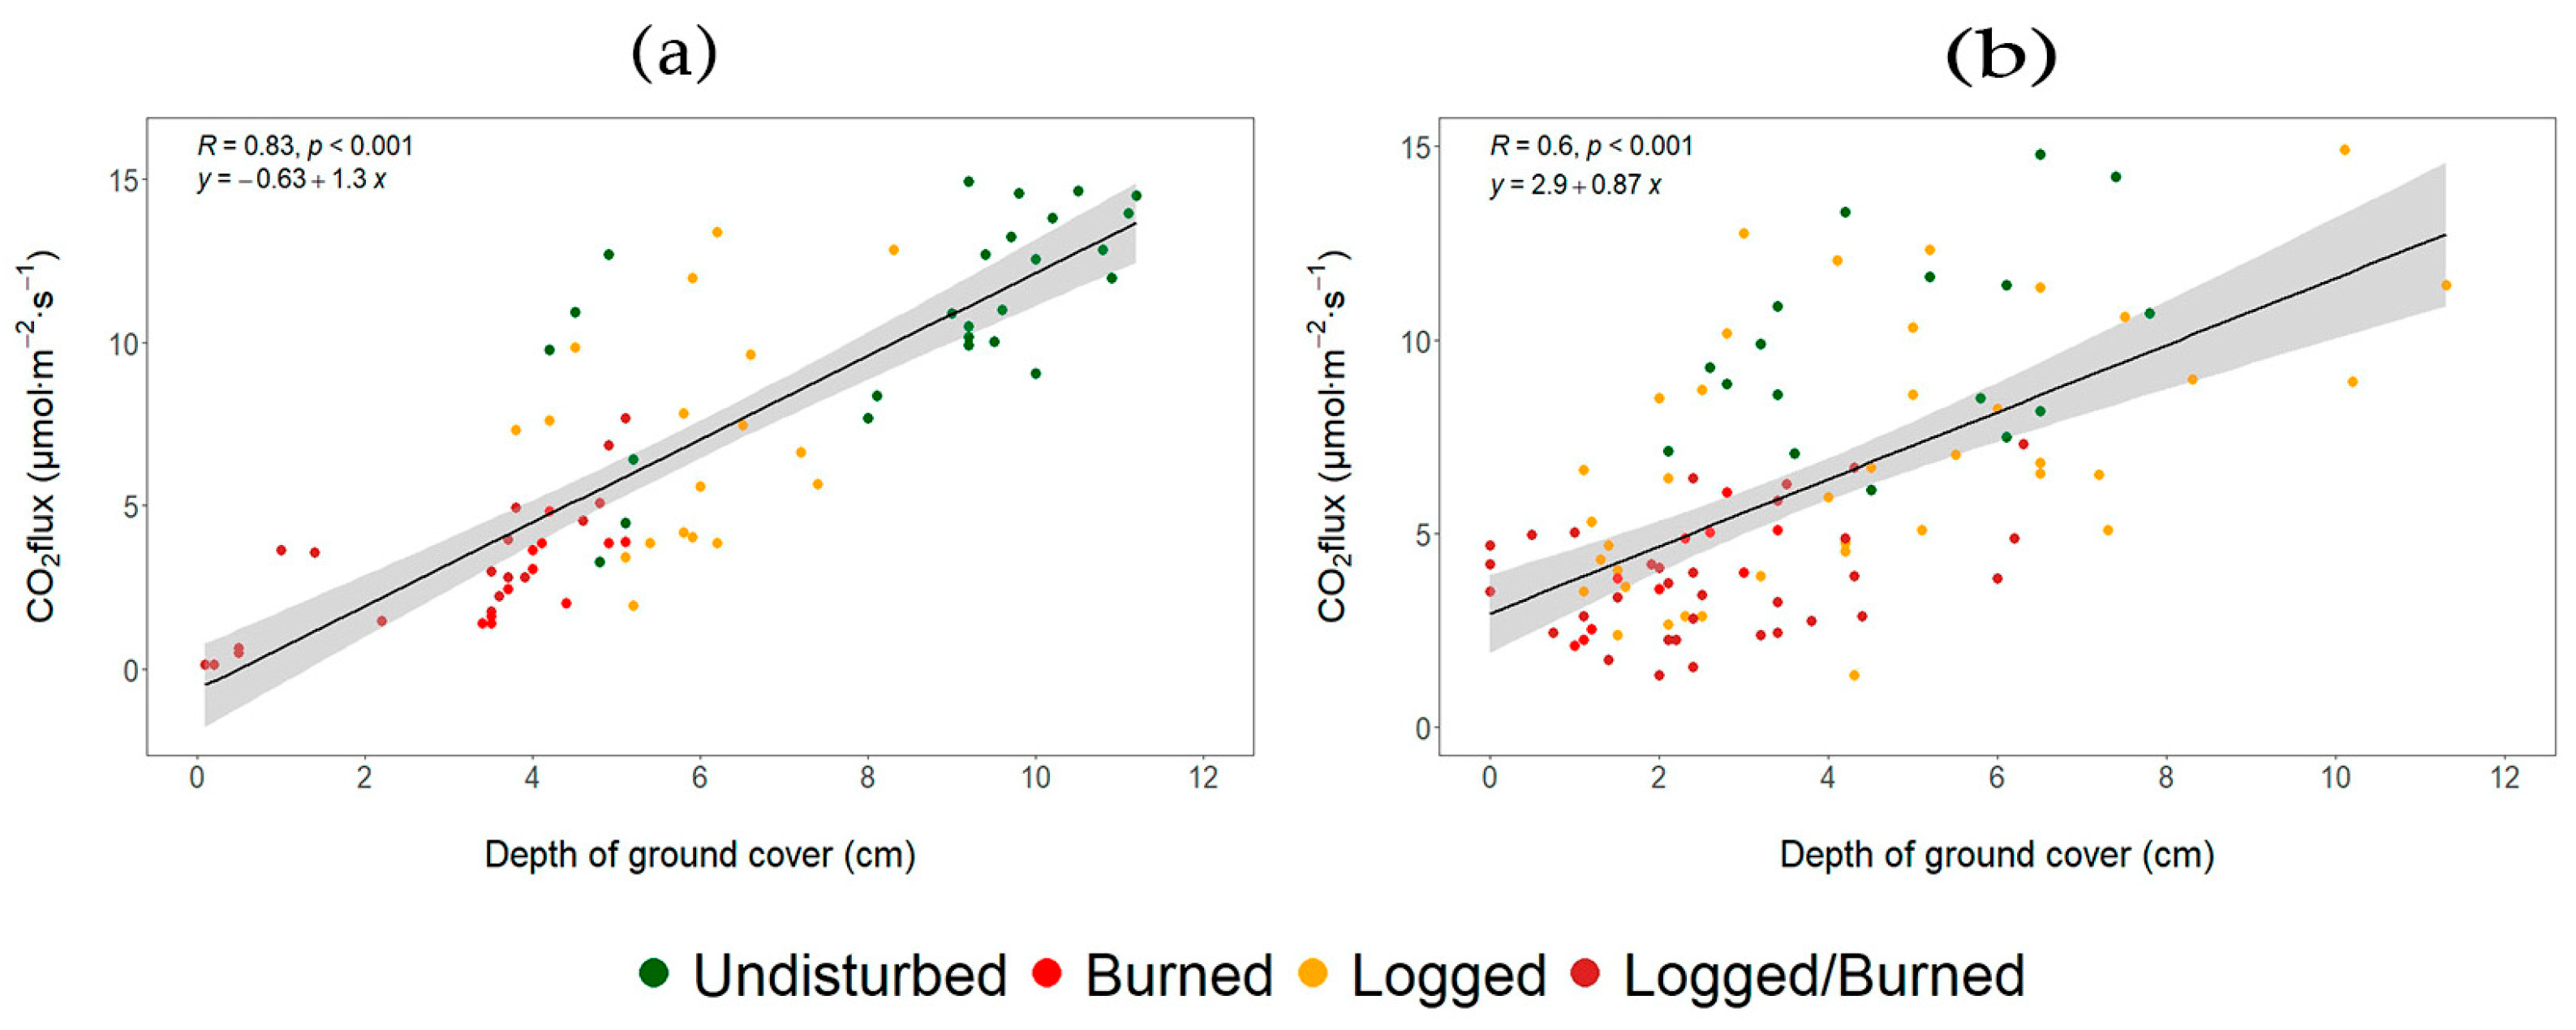
We also found a strong positive relationship (R = 0.83, p < 0.001) between ground fuel depth and soil CO2 efflux in the Angara region and a moderate correlation (R = 0.60, p < 0.001) in the Zabaikal region (Figure 7). However, the distribution of the sites characterized by different levels of disturbance (undisturbed, burned, logged, and logged and burned) differed between the studied regions (Figure 7 and Figure S1). The majority of undisturbed Scots pine forests in the Angara region were characterized by the greatest depth of ground cover and soil efflux (Figure 7a and Figure S1a). In contrast, undisturbed Scots pine forests in the mountainous areas of the Zabaikal region had a lower fuel depth than in the Angara region (Figure 7b and Figure S1b). Logged areas were characterized by greater variability in site conditions and less dependence of soil efflux on fuel depth (Figure S1).

4. Discussion

Soil CO2 efflux is highly variable between different ecosystems and forest types due to variations in site characteristics and particular above- and below-ground biomass [46,47,48]. It also varies significantly during the year and between years as a function of weather conditions [6,8,49]. For our study, we chose the most typical forest types in the Angara and Zabaikal regions, which are under high natural and anthropogenic pressure [33]. The differences in mean values of soil efflux in undisturbed forests among many sites (e.g., 2A, 3A, and 4A in the Angara region or 2Z, 3Z, and 4Z in the Zabaikal region) were not statistically significant (p > 0.05). On the one hand, this reflects the high variability in CO2 efflux within a site. On the other hand, it also might be evidence that similar growing conditions resulted in similar heterotrophic microbial respiration and autotrophic root respiration at different sites in our study regions. In general, we found that the soil CO2 efflux for the southern Scots pine forests of Siberia ranged from 6.2 to 13.5 µmol m−2 s−1, with a mean value of 9.9 ± 2.2 µmol m−2 s−1 for all the plots studied. Our measurement season corresponded to the highest soil efflux rates of the year [43,50].
We expected lower soil fluxes in the undisturbed forests in the Zabaikal region due to drier weather and soil conditions in the Zabaikal region [37], resulting in lower forest productivity [33], nutrients, and microbial biomass [51] compared to the Angara region. However, the means for two study regions were not significantly different (p > 0.05). This might be due to the complex effects of weather conditions during the measurements [10], stand structure [52], and ground cover [53] characteristics. For instance, CO2 rates are higher in forests dominated by grasses in the ground cover compared to forests where mosses prevail [47]. The living ground cover in the Angara region is dominated by feather moss, while the Zabaikal region is characterized by an abundance of grasses. Thus, the dominance of grass cover in the Zabaikal region should indicate a higher soil efflux; however, poorer growing conditions indicate a lower flux. So, the complex effect of site characteristics resulted in similar fluxes across our two study regions. Meanwhile, our estimates of soil CO2 efflux for the southern Scots pine forests of Siberia differ significantly from much of the published data, most of which are from more northern areas of Eurasia. Our data are 65–300% higher compared to previously reported estimates of soil CO2 fluxes in the Scots pine forests of the central Siberian taiga [43], the European part of Russia [53], and Finland [54,55]. We assume that this is a result of higher soil temperature and soil moisture in more southern regions [56] as well as larger amounts and quality of organic carbon, which affect the rate of microbial, root, and rhizosphere respiration [57]. Soil efflux in our sites was 40–150% higher than in deciduous and coniferous forests in the Russian Far East [49] and in the Northwest Caucasus Mountains [58] and about 60% higher than in mixed forests in the European part of Russia, the Moscow region [50]. Compared to the northernmost ecosystems of central Siberia [59], our estimates of CO2 efflux were 2.5–5 times higher than in sedge and moss tundra, respectively. However, our estimates were similar to those reported for mixed coniferous–deciduous forests in the southeastern USA [60] and for aspen and black spruce stands in the southern boreal forests of Canada [61].
Wildfires reduced soil CO2 efflux by 37–81% in our study sites. Although the soils become significantly warmer after a fire (Figure 5 and Figure 6), the loss of ground vegetation, tree mortality (i.e., decrease of autotrophic respiration), and the consumption of the forest floor during a fire result in a significant reduction in soil fluxes [62]. This is consistent with the majority of published data [26]. For instance, Masyagina et al. [52] found that in Siberian northern taiga larch forests, soil efflux decreased to 1.77 ± 1.18 µmol m−2 s−1 in the first decade after fire, compared to 5.18 ± 2.70 µmol m−2 s−1 in mature stands 150 years and older. Makhnykina et al. [27] found that in central taiga Scots pine stands of Siberia, soil CO2 fluxes were significantly lower for at least 20 years after fire. Koster et al. [28] noted that soil respiration followed a logistic function, with the recovery process occurring within 10–20 years after fire in Scots pine stands in Estonia. Interestingly, recent findings [55] revealed that two hours after fire, soil CO2 efflux in burned Scots pine forests in Finland was higher than before the fire, with high-severity fires having significantly higher emissions compared to low-severity fires. The authors suggest that this increase may be due to the continued combustion of organic matter in burned plots. Later (days, months), they found that soil fluxes in burned sites were lower than in unburned forests, with no significant difference between sites burned by low- and high-severity fires [55]. In contrast, at our study sites, which we examined several months after fires, we found a greater reduction in soil efflux in forests burned by high-severity fires (by 74% compared to undisturbed forests) than in forests burned by moderate- (60%) and low-severity (37%) fires. Along with the decline in the contribution of tree roots in CO2 efflux, this may be related to higher soil heating and greater fuel consumption resulting in lower soil microbial populations following more intense fires [51,63]. Other researchers also found a significant decline in soil respiration after a high-severity fire but not after a low-severity fire [64].
While the effect of fire on CO2 fluxes is more or less consistent in the literature, the estimates of soil efflux after logging vary widely [3]. This may be a result of increased variability across disturbed areas due to different forest types, harvest methods, and climatic conditions. Logging increases diurnal fluctuations in soil temperature [3] and may leave large amounts of litter and down woody debris [33]. Pumpanen et al. [54] found that while soil CO2 effluxes decreased by 40% in clearcut areas with logging residue removed, effluxes were twice as high in mounds formed by down woody debris as in the control Scots pine–spruce stand in southern Finland. Other studies have also found reduced soil CO2 fluxes in areas where woody material has been removed [65]. We did not place the measuring collars on the large piles of slash, but rather installed them in the most typical areas of the logged sites. We found that at most of our sites, clearcut logging resulted in a 6–60% decrease in soil respiration, except at Site 3Z in the Zabaikal region. This may be due to the lower level of disturbance at this site compared to the other logged areas. Here, the harvested area was less than 2 ha, with living trees surrounding the site contributing to respiration, whereas other logged sites were 10–30 ha in size. Kulmala et al. [66] found that logging reduced soil efflux only in the first growing season, with CO2 efflux being significantly higher during the following two years compared to undisturbed mature spruce forests in Finland.
Repeatedly disturbed (logged and burned) plots had the lowest CO2 efflux at most of our study sites. However, the burned forests in which the fires were of high severity (Sites 4A and 4Z) showed a similar reduction in soil fluxes compared to the repeatedly disturbed sites (the means were not significantly different, p > 0.05). These fires resulted in high to total tree mortality and almost complete combustion of ground fuels. The highest reduction in soil fluxes due to repeated disturbances has also been noticed by other researchers [65].
The lower rates of soil CO2 efflux on logged and burned sites compared to the undisturbed Scots pine stands may be related to both a greater contribution of forest floor and autotrophic respiration in the undisturbed forests due to the larger biomass of tree roots [30] as well as more favorable hydrothermal conditions, in particular, higher soil moisture compared to disturbed sites. An increase in temperatures in disturbed areas and a change in nutrient cycles lead to a decrease in CO2 efflux from the soil as enzyme and microbial activities are significantly suppressed [63]. Luo and Zhou [3] noticed that the greater contribution of heterotrophic respiration to soil CO2 efflux at the logged sites may reflect higher rhizomicrobial respiration.
The important influence of soil temperature on soil CO2 efflux has been emphasized in many studies [6,8,47]. As temperature rises, the loss of soil organic C increases and thus CO2 efflux increases [5]. While a number of studies have reported soil moisture content effects on soil CO2 efflux [10,43], other publications report no significant impact of soil moisture [5,28]. In our study, we also found that in the undisturbed forests and logged plots, CO2 efflux increased as soil temperature rose. The opposite trend in the burned forests (Figure 5b and Figure 6b) was probably related to the fact that the areas of higher temperature were associated with areas of more intense burning (which resulted in the removal of the shading canopy and greater formation of black pyrogenic material/charcoal on the soil surface). In these areas, we observed the greatest reduction in vegetation and microbial biomass [51], leading to a decrease in soil CO2 efflux. Overall, the highest soil temperatures (Figure 5 and Figure 6) were recorded on logged sites and logged and burned areas, which were characterized by lower average CO2 efflux (Figure 3 and Figure 4) compared to undisturbed forests. The difference in the relationship between soil efflux and temperature in the sites that were logged and burned in our two study regions could be related to site characteristics and in particular to different slash removal practices. Thus, in the Angara region, the logged sites have high down wood fuel loads [33] (Figure 2), so a similar soil temperature trend was observed at the logged and burned sites as at the logged sites. In the Zabaikal region, the logged sites were characterized by good slash removal, so the trend in the logged and burned sites looks similar to the burned forest. However, the apparent negative correlation in Figure 6d was not statistically significant, perhaps due to the greater variability in ground fuel depth (Figure 7) and fuel consumption in the mountain forests. The lower dependence on soil temperature in the disturbed forests of the Zabaikal region, which grow in more arid conditions compared to the Angara region, is also probably related to the differences in net primary production and C inputs to the soil among the study areas [67]. Thus, in the Zabaikal region, the pool of organic carbon in litter and in the 1 m thick soil layer was estimated to be less than 10 kg C m−2, while in the Angara region it varied between 11 and 20 kg C m−2 [68]. The dependence of soil CO2 efflux on ground fuel depth is mainly associated with disturbance of the sites, with the lowest efflux rates observed on the most disturbed (logged and burned) sites, where the lowest fuel depth is recorded (Figure 7 and Figure S1). The lower fuel depth in the undisturbed Scots pine forests in the Zabaikal region compared to the Angara region is related to lower forest productivity, which results in lower fuel loads [33].
As the number of years since a disturbance increases, the difference in CO2 fluxes between the disturbed sites and undisturbed forests is expected to decrease due to forest regrowth and the proliferation of grasses and their significant contribution (30 to 80%) to the soil CO2 efflux [69].

5. Conclusions

Our data demonstrate a significant change in soil CO2 efflux into the atmosphere in disturbed Scots pine forests of southern Siberia. We found that both fires and logging reduced efflux (by 6–94% compared to the undisturbed forests) in the first years after a disturbance. The amount of the decrease depended on the site and disturbance characteristics. The lowest CO2 effluxes were revealed in repeatedly disturbed (burned and logged) sites and in forests burned by high-severity fires. Soil CO2 efflux was found to correlate with soil temperature and ground fuel depth.
The data obtained are required to better understand the net effects of various disturbance factors on CO2 efflux in forest ecosystems in Siberia. While our study only covers a short time span after disturbances, it does suggest that reductions in CO2 efflux after disturbances may help to balance out the large pulses of emissions that can occur during fires and perhaps other disturbances. To explore the long-term change patterns in disturbed areas, further studies with more detailed site and weather characteristics are needed. Moreover, other forest types (e.g., Larix spp.) subject to extensive anthropogenic pressure and increasing fire frequency in the southern Siberian forests should be examined to identify specific changes in soil CO2 efflux.
Regional data on soil CO2 efflux are required for carbon budget assessments and future climate projections to define land-based mitigation efforts. Both fires and logging disturbances are increasing in large areas of the boreal forest. The data obtained are necessary to assess the contribution of fire and logging to the regional and global carbon budgets of disturbed areas.

Supplementary Materials

The following supporting information can be downloaded at https://www.mdpi.com/article/10.3390/atmos15091117/s1. Table S1: Soil CO2 efflux at study sites in the Angara and Zabaikal regions with various disturbance types (mean ± standard deviation); Figure S1: Relationship between soil CO2 efflux and ground fuel depth in the Angara (a) and Zabaikal (b) regions with respect to disturbance types.

Author Contributions

Conceptualization, E.A.K. and S.G.C.; methodology, E.A.K. and S.G.C.; software, E.A.K.; formal analysis, E.A.K.; investigation, E.A.K., A.V.B., L.V.B., O.P.K. and S.G.C.; data curation, E.A.K. and A.V.B.; writing—original draft preparation, E.A.K. and S.G.C.; writing—review and editing, E.A.K. and S.G.C.; visualization, E.A.K.; supervision, E.A.K.; funding acquisition, S.G.C. All authors have read and agreed to the published version of the manuscript.

Funding

This research was funded by the Russian Science Foundation, Krasnoyarsk Territory, and the Krasnoyarsk Regional Fund of Science, project #24-27-20064. Field measurements were supported by the NASA Land Cover and Land Use Change Program.

Institutional Review Board Statement

Not applicable.

Informed Consent Statement

Not applicable.

Data Availability Statement

The original fieldwork data presented in this study are available on request from the corresponding author. The data are not publicly available due to privacy.

Conflicts of Interest

The authors declare no conflicts of interest.

References

  1. Friedlingstein, P.; O’Sullivan, M.; Jones, M.W.; Andrew, R.M.; Bakker, D.C.E.; Hauck, J.; Landschützer, P.; Le Quéré, C.; Luijkx, I.T.; Peters, G.P.; et al. Global carbon budget 2023. Earth Syst. Sci. Data 2023, 15, 5301–5369. [Google Scholar] [CrossRef]
  2. Mayer, M.; Prescott, C.E.; Abaker, W.E.A.; Augusto, L.; Cécillon, L.; Ferreira, G.W.D.; James, J.; Jandl, R.; Katzensteiner, K.; Laclau, J.-P.; et al. Tamm Review: Influence of forest management activities on soil organic carbon stocks: A knowledge synthesis. For. Ecol. Manag. 2020, 466, 118127. [Google Scholar] [CrossRef]
  3. Luo, Y.; Zhou, X. Soil Respiration and the Environment; Elsevier Academic Press: San Diego, CA, USA, 2006. [Google Scholar]
  4. Kudeyarov, V.N. Soil respiration and carbon sequestration: A review. Eurasian Soil Sci. 2023, 56, 1191–1200. [Google Scholar] [CrossRef]
  5. Fang, C.; Moncrieff, J.B. The dependence of soil CO2 efflux on temperature. Soil Biol. Biochem. 2001, 33, 155–165. [Google Scholar] [CrossRef]
  6. Kucinskas, O.; Marozas, V. Diurnal and seasonal soil CO2 efflux variation in Scots pine (Pinus sylvestris L.) forests in the European hemi-boreal zone. Lith. J. Elem. 2021, 26, 731–754. [Google Scholar] [CrossRef]
  7. Zhong, Y.; Yan, W.; Shangguan, Z. The effects of nitrogen enrichment on soil CO2 fluxes depending on temperature and soil properties. Glob. Ecol. Biogeogr. 2016, 25, 475–488. [Google Scholar] [CrossRef]
  8. Shibistova, O.; Lloyd, J.; Evgrafova, S.; Savushkina, N.; Zrazhevskaya, G.; Arneth, A.; Knohl, A.; Kolle, O.; Schulze, E.D. Seasonal and spatial variability in soil CO2 efflux rates for a central Siberian Pinus sylvestris forest. Tellus B Chem. Phys. Meteorol. 2002, 54, 552–567. [Google Scholar] [CrossRef]
  9. Niinisto, S.N.; Silvola, J.; Kellomaki, S. Soil CO2 efflux in a boreal pine forest under atmospheric CO2 enrichment and air warming. Glob. Chang. Biol. 2004, 10, 1363–1376. [Google Scholar] [CrossRef]
  10. Fenn, K.M.; Malhi, Y.; Morecroft, M.D. Soil CO2 efflux in a temperate deciduous forest: Environmental drivers and component contributions. Soil Biol. Biochem. 2010, 42, 1685–1693. [Google Scholar] [CrossRef]
  11. Tang, X.; Pei, X.; Lei, N.; Luo, X.; Liu, L.; Shi, L.; Chen, G.; Liang, J. Global patterns of soil autotrophic respiration and its relation to climate, soil and vegetation characteristics. Geoderma 2020, 369, 114339. [Google Scholar] [CrossRef]
  12. Groisman, P.Y.; Blyakharchuk, T.A.; Chernokulsky, A.V.; Arzhanov, M.M.; Belelli Marchesini, L.; Bogdanova, E.G.; Borzenkova, I.I.; Bulygina, O.N.; Karpenko, A.A.; Karpenko, L.V.; et al. Climate changes in Siberia. In Regional Environmental Changes in Siberia and Their Global Consequences; Groisman, P., Gutman, G., Eds.; Springer: Dordrecht, The Netherlands, 2013; pp. 57–109. [Google Scholar] [CrossRef]
  13. Gauthier, S.; Bernier, P.; Kuuluvainen, T.; Shvidenko, A.Z.; Schepashenko, D.G. Boreal forest health and global change. Science 2015, 349, 819–822. [Google Scholar] [CrossRef] [PubMed]
  14. Li, Y.; Janssen, T.A.J.; Chen, R.; He, B.; Veraverbeke, S. Trends and drivers of Arctic-boreal fire intensity between 2003 and 2022. Sci. Total Environ. 2024, 926, 172020. [Google Scholar] [CrossRef] [PubMed]
  15. Corning, S.; Krasovskiy, A.; Kiparisov, P.; San Pedro, J.; Viana, C.M.; Kraxner, F. Anticipating future risks of climate-driven wildfires in boreal forests. Fire 2024, 7, 144. [Google Scholar] [CrossRef]
  16. Bond-Lamberty, B.; Thomson, A. Temperature-associated increases in the global soil respiration record. Nature 2010, 464, 579–582. [Google Scholar] [CrossRef]
  17. Bronson, D.R.; Gower, S.T.; Tanner, M.; Linder, S.; Van Herk, I. Response of soil surface CO2 flux in a boreal forest to ecosystem warming. Glob. Chang. Biol. 2008, 14, 856–867. [Google Scholar] [CrossRef]
  18. Mukhortova, L.; Schepaschenko, D.; Moltchanova, E.; Shvidenko, A.; Khabarov, N.; See, L. Respiration of Russian soils: Climatic drivers and response to climate change. Sci. Total Environ. 2021, 785, 147314. [Google Scholar] [CrossRef]
  19. Achard, F.; Mollicone, D.; Stibig, H.-J.; Aksenov, D.; Laestadius, L.; Li, Z.; Popatov, P.; Yaroshenko, A. Areas of rapid forest-cover change in boreal Eurasia. For. Ecol. Manag. 2006, 237, 322–334. [Google Scholar] [CrossRef]
  20. Certini, G. Effects of fire on properties of forest soils: A review. Oecologia 2005, 143, 1–10. [Google Scholar] [CrossRef]
  21. Eroğlu, H.; Sariyildiz, T.; Küçük, M.; Sancal, E. The effects of different logging techniques on the physical and chemical characteristics of forest soil. Balt. For. 2016, 22, 139–147. [Google Scholar]
  22. Zamolodchikov, D.G.; Grabovsky, V.I.; Shulyak, P.P.; Chestnykh, O.V. The impacts of fires and clear-cuts on the carbon balance of Russian forests. Contemp. Probl. Ecol. 2013, 6, 714–726. [Google Scholar] [CrossRef]
  23. Shvetsov, E.G.; Kukavskaya, E.A.; Shestakova, T.A.; Laflammy, J.; Rogers, B.M. Increasing fire and logging disturbances in Siberian boreal forests: A case study of the Angara region. Environ. Res. Lett. 2021, 16, 115007. [Google Scholar] [CrossRef]
  24. Jones, M.W.; Abatzoglou, J.T.; Veraverbeke, S.; Andela, N.; Lasslop, G.; Forkel, M.; Smith, A.J.P.; Burton, C.; Betts, R.A.; van der Werf, G.R.; et al. Global and regional trends and drivers of fire under climate change. Rev. Geophys. 2022, 60, e2020RG000726. [Google Scholar] [CrossRef]
  25. Masyagina, O.V. Carbon dioxide emissions and vegetation recovery in fire-affected forest ecosystems of Siberia: Recent local estimations. Curr. Opin. Environ. Sci. Health 2021, 23, 100283. [Google Scholar] [CrossRef]
  26. Zhou, L.; Liu, S.; Gu, Y.; Wu, L.; Hu, H.-W.; He, J.-Z. Fire decreases soil respiration and its components in terrestrial ecosystems. Funct. Ecol. 2023, 37, 3124–3135. [Google Scholar] [CrossRef]
  27. Makhnykina, A.; Panov, A.; Prokushkin, A. The impact of wildfires on soil CO2 emission in middle taiga forests in Central Siberia. Land 2023, 12, 1544. [Google Scholar] [CrossRef]
  28. Köster, K.; Köster, E.; Orumaa, A.; Parro, K.; Jõgiste, K.; Berninger, F.; Pumpanen, J.; Metslaid, M. How time since forest fire affects stand structure, soil physical-chemical properties and soil CO2 efflux in hemiboreal Scots pine forest fire chronosequence? Forests 2016, 7, 201. [Google Scholar] [CrossRef]
  29. Molchanov, A.G.; Kurbatova, Y.A.; Olchev, A.V. Effect of clear-cutting on soil CO2 emission. Biol. Bull. Russ. Acad. Sci. 2017, 44, 218–223. [Google Scholar] [CrossRef]
  30. Pridacha, V.B.; Semin, D.E.; Ekimov, D.A. Dynamics of soils properties in disturbed forest ecosystems of southern Karelia. In XV Siberian Meeting and School of Young Scientists on Climate-Ecological Monitoring: Proceedings of the All-Russian Conference with International Participation; Golovatskaya, E.A., Ed.; Institute of Monitoring of Climatic and Ecological Systems SB RAS: Tomsk, Russia, 2023; pp. 171–173. Available online: https://www.imces.ru/media/uploads/XV_CCKEM_2023_sb.pdf (accessed on 1 March 2024). (In Russian)
  31. Bond-Lamberty, B.; Thomson, A. A global database of soil respiration data. Biogeosciences 2010, 7, 1915–1926. [Google Scholar] [CrossRef]
  32. Zhou, L.; Liu, S.; Gu, Y.; Wu, L.; Hu, H.-W.; He, J.-Z. Fire decreases soil respiration and its components in terrestrial ecosystems (Dataset). Dryad 2023. [Google Scholar] [CrossRef]
  33. Kukavskaya, E.A.; Buryak, L.V.; Ivanova, G.A.; Conard, S.G.; Kalenskaya, O.P.; Zhila, S.V.; McRae, D.J. Influence of logging on the effects of wildfire in Siberia. Environ. Res. Lett. 2013, 8, 045034. [Google Scholar] [CrossRef]
  34. Kukavskaya, E.A.; Buryak, L.V.; Shvetsov, E.G.; Conard, S.G.; Kalenskaya, O.P. The impact of increasing fire frequency on forest transformations in southern Siberia. For. Ecol. Manag. 2016, 382, 225–235. [Google Scholar] [CrossRef]
  35. Abrams, M.; Crippen, R.; Fujisada, H. ASTER Global Digital Elevation Model (GDEM) and ASTER Global Water Body Dataset (ASTWBD). Remote Sens. 2020, 12, 1156. [Google Scholar] [CrossRef]
  36. Bartalev, S.; Egorov, V.; Zharko, V.; Loupian, E.; Plotnikov, D.; Khvostikov, S.; Shabanov, N. Land Cover Mapping over Russia Using Earth Observation Data; Russian Academy of Sciences’ Space Research Institute: Moscow, Russia, 2016; Available online: http://www.iki.rssi.ru/books/2016bartalev.pdf (accessed on 1 March 2024). (In Russian)
  37. Geniatulin, R.F. (Ed.) Encyclopaedia of Zabaykalye; Nauka: Novosibirsk, Russia, 2000. (In Russian) [Google Scholar]
  38. Kukavskaya, E.A.; Shvetsov, E.G.; Buryak, L.V.; Tretyakov, P.D.; Groisman, P.Y. Increasing fuel loads, fire hazard, and carbon emissions from fires in Central Siberia. Fire 2023, 6, 63. [Google Scholar] [CrossRef]
  39. IUSS Working Group WRB. World Reference Base for Soil Resources. In International Soil Classification System for Naming Soils and Creating Legends for Soil Maps, 4th ed.; International Union of Soil Sciences (IUSS): Vienna, Austria, 2022; Available online: https://www.isric.org/sites/default/files/WRB_fourth_edition_2022-12-18.pdf (accessed on 1 March 2024).
  40. Rogers, B.M.; Soja, A.J.; Goulden, M.L.; Randerson, J.T. Influence of tree species on continental differences in boreal fires and climate feedbacks. Nat. Geosci. 2015, 8, 228–234. [Google Scholar] [CrossRef]
  41. Kurbatsky, N.P. Forest Fire Suppression Procedures and Tactics; Goslesbumizdat: Moscow, Russia, 1962. (In Russian) [Google Scholar]
  42. Rosleskhoz Directive. About Approval of Instructions on Estimating Damage Caused by Forest Fires; No. 53 from 03.04.1998. Available online: https://docs.cntd.ru/document/901863083 (accessed on 1 March 2024).
  43. Makhnykina, A.V.; Tychkov, I.I.; Prokushkin, A.S.; Pyzhev, A.I.; Vaganov, E.A. Factors of soil CO2 emission in boreal forests: Evidence from Central Siberia. iForest 2023, 16, 86–94. [Google Scholar] [CrossRef]
  44. R Core Team. R: A Language and Environment for Statistical Computing; R Foundation for Statistical Computing: Vienna, Austria, 2022; Available online: https://www.R-project.org/ (accessed on 1 March 2024).
  45. Wickham, H. ggplot2. Elegant Graphics for Data Analysis; Springer: Cham, Switzerland, 2016; 260p. [Google Scholar] [CrossRef]
  46. Díaz-Pinés, E.; Schindlbacher, A.; Godino, M.; Kitzler, B.; Jandl, R.; Zechmeister-Boltenstern, S.; Rubio, A. Effects of tree species composition on the CO2 and N2O efflux of a Mediterranean mountain forest soil. Plant Soil 2014, 384, 243–257. [Google Scholar] [CrossRef]
  47. Koptsik, G.N.; Kupriianova, Y.V.; Kadulin, M.S. Spatial variability of carbon dioxide emission by soils in the main types of forest ecosystems at the Zvenigorod biological station of Moscow State University. Mosc. Univ. Soil Sci. Bull. 2018, 73, 81–88. [Google Scholar] [CrossRef]
  48. Cai, Y.; Sawada, K.; Hirota, M. Spatial variation in forest soil respiration: A systematic review of field observations at the global scale. Sci. Total Environ. 2023, 874, 162348. [Google Scholar] [CrossRef]
  49. Ivanov, A.V.; Zamolodchikov, D.G.; Salo, M.A.; Kondratove, A.V.; Piletskaya, O.A.; Bryanin, S.V. Soil respiration in forest ecosystems in the south of the Far East. Eurasian Soil Sci. 2023, 9, 1201–1209. [Google Scholar] [CrossRef]
  50. Kurganova, I.; Gerenyu, V.L.D.; Rozanova, L.; Sapronov, D.; Myakshina, T.; Kudeyarov, V. Annual and seasonal CO2 fluxes from Russian southern taiga soils. Tellus B Chem. Phys. Meteorol. 2003, 55, 338–344. [Google Scholar] [CrossRef]
  51. Bogorodskaya, A.V.; Kukavskaya, E.A.; Kalenskaya, O.P.; Buryak, L.V. Changes in the microbiological and physicochemical properties of soils after fires in pine and birch forests in the central part of the Zabaikalsky krai. Eurasian Soil Sci. 2023, 56, 1707–1723. [Google Scholar] [CrossRef]
  52. Masyagina, O.V.; Evgrafova, S.Y.; Menyailo, O.V.; Mori, S.; Koike, T.; Prokushkin, S.G. Age-dependent changes in soil respiration and associated parameters in Siberian permafrost larch stands affected by wildfire. Forests 2021, 12, 107. [Google Scholar] [CrossRef]
  53. Osipov, A.F. Influence of forest growth conditions on the CO2 emissions from the soil surface in the middle taiga pine forests of the Komi Republic, Russia. Russ. J. Ecol. 2023, 54, 632–639. [Google Scholar] [CrossRef]
  54. Pumpanen, J.; Westman, C.J.; Ilvesniemi, H. Soil CO2 efflux from a podzolic forest soil before and after forest clear-cutting and site preparation. Boreal Environ. Res. 2004, 9, 199–212. Available online: https://www.borenv.net/BER/archive/pdfs/ber9/ber9-199.pdf (accessed on 1 March 2024).
  55. Köster, K.; Kohli, J.; Lindberg, H.; Pumpanen, J. Post-fire soil greenhouse gas fluxes in boreal Scots pine forests–Are they affected by surface fires with different severities? Agric. For. Meteorol. 2024, 349, 109954. [Google Scholar] [CrossRef]
  56. Tang, X.L.; Zhou, G.Y.; Liu, S.G.; Zhang, D.Q.; Liu, S.Z.; Li, J.; Zhou, C.Y. Dependence of soil respiration on soil temperature and soil moisture in successional forests in Southern China. J. Integr. Plant Biol. 2006, 48, 654–663. [Google Scholar] [CrossRef]
  57. Capek, P.; Starke, R.; Hofmockel, K.S.; Bond-Lamberty, B.; Hess, N. Apparent temperature sensitivity of soil respiration can result from temperature driven changes in microbial biomass. Soil Biol. Biochem. 2019, 135, 286–293. [Google Scholar] [CrossRef]
  58. Sushko, S.; Ovsepyan, L.; Gavrichkova, O.; Yevdokimov, I.; Komarova, A.; Zhuravleva, A.; Blagodatsky, S.; Kadulin, M.; Ivashchenko, K. Contribution of microbial activity and vegetation cover to the spatial distribution of soil respiration in mountains. Front. Microbiol. 2023, 14, 1165045. [Google Scholar] [CrossRef]
  59. Panov, A.; Prokushkin, A.; Korets, M.; Putilin, I.; Zrazhevskaya, G.; Kolosov, R.; Bondar, M. Variation in soil CO2 fluxes across land cover mosaic in typical tundra of the Taimyr Peninsula, Siberia. Atmosphere 2024, 15, 698. [Google Scholar] [CrossRef]
  60. Godwin, D.R.; Kobziar, L.N.; Robertson, K.M. Effects of fire frequency and soil temperature on soil CO2 efflux rates in old-field pine-grassland forests. Forests 2017, 8, 274. [Google Scholar] [CrossRef]
  61. Gaumont-Guay, D.; Black, T.A.; McCaughey, H.; Barr, A.G.; Krishnan, P.; Jassal, R.S.; Nesic, Z. Soil CO2 efflux in contrasting boreal deciduous and coniferous stands and its contribution to the ecosystem carbon balance. Glob. Chang. Biol. 2009, 15, 1302–1319. [Google Scholar] [CrossRef]
  62. O’Neill, K.P.; Kasischke, E.S.; Richter, D.D. Environmental controls on soil CO2 flux following fire in black spruce, white spruce, and aspen stands of interior Alaska. Can. J. For. Res. 2002, 32, 1525–1541. [Google Scholar] [CrossRef]
  63. Zhou, Y.; Biro, A.; Wong, M.Y.; Batterman, S.A.; Carla Staver, A. Fire decreases soil enzyme activities and reorganizes microbially mediated nutrient cycles: A meta-analysis. Ecology 2022, 103, e3807. [Google Scholar] [CrossRef] [PubMed]
  64. Kelly, J.; Ibáñez, T.S.; Santín, C.; Doerr, S.H.; Nilsson, M.-C.; Holst, T.; Lindroth, A.; Kljun, N. Boreal forest soil carbon fluxes one year after a wildfire: Effects of burn severity and management. Glob. Chang. Biol. 2021, 27, 4181–4195. [Google Scholar] [CrossRef] [PubMed]
  65. Köster, K.; Püttsepp, U.; Pumpanen, J. Comparison of soil CO2 flux between uncleared and cleared windthrow areas in Estonia and Latvia. For. Ecol. Manag. 2011, 262, 65–70. [Google Scholar] [CrossRef]
  66. Kulmala, L.; Aaltonen, H.; Berninger, F.; Kieloaho, A.-J.; Levula, J.; Bäck, J.; Hari, P.; Kolari, P.; Korhonen, J.F.J.; Kulmala, M.; et al. Changes in biogeochemistry and carbon fluxes in a boreal forest after the clear-cutting and partial burning of slash. Agric. For. Meteorol. 2014, 188, 33–44. [Google Scholar] [CrossRef]
  67. Davidson, E.; Belk, E.; Boone, R.D. Soil water content and temperature as independent or confounded factors controlling soil respiration in a temperate mixed hardwood forest. Glob. Chang. Biol. 1998, 4, 217–227. [Google Scholar] [CrossRef]
  68. Schepaschenko, D.G.; Mukhortova, L.V.; Shvidenko, A.Z.; Vedrova, E.F. The pool of organic carbon in the soils of Russia. Eurasian Soil Sci. 2013, 46, 107–116. [Google Scholar] [CrossRef]
  69. Kudeyarov, V.N.; Zavarzin, G.A.; Blagodatskiy, S.A.; Borisov, A.V.; Voronin, P.Y.; Demkin, V.A.; Demkina, T.S.; Evdokimov, I.V.; Zamolodchikov, D.G.; Karelin, D.V.; et al. Pool and Fluxes of Carbon in Terrestrial Ecosystems of Russia; Zavarzin, G.A., Ed.; Nauka: Moscow, Russia, 2007. (In Russian) [Google Scholar]
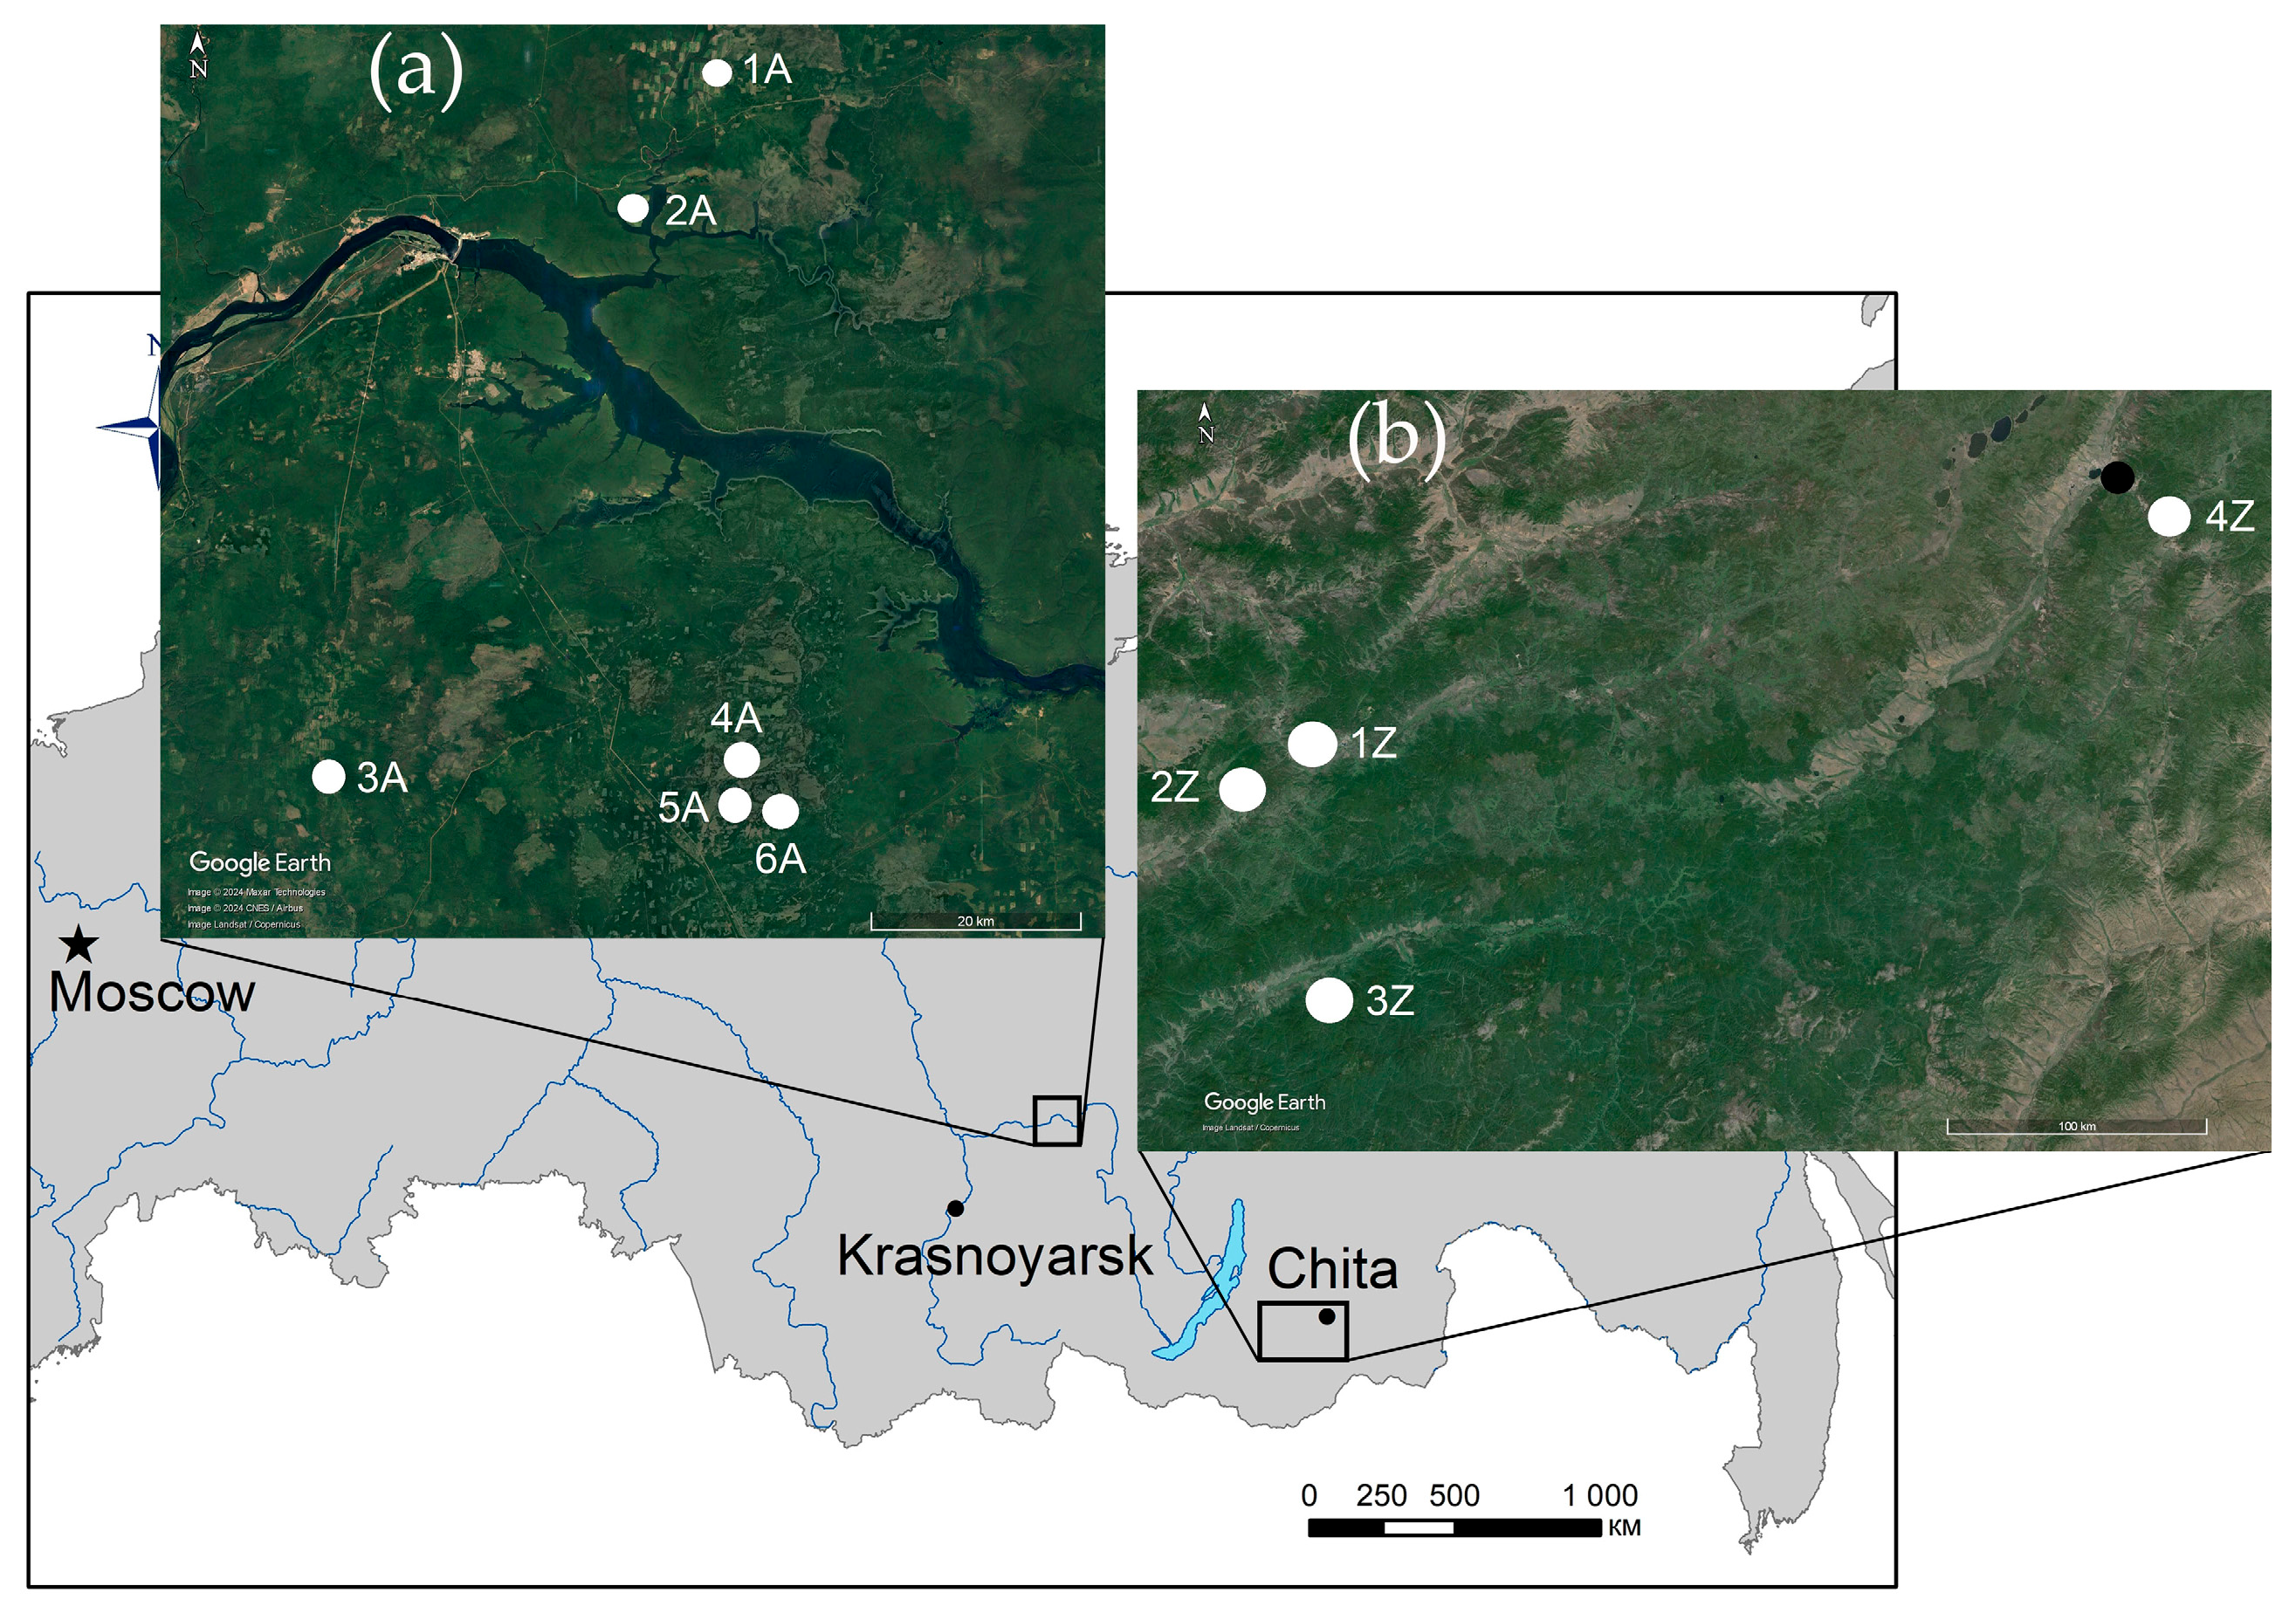
Figure 1. The location of the study sites. The inserts show the Angara (a) and the Zabaikal (b) regions and the locations of our study areas.
Atmosphere 15 01117 g001
Figure 2. Typical study sites in the Angara region (I) and the Zabaikal region (II): undisturbed forest (a), burned forest (b), logged plot (c), logged and burned plot (d).
Atmosphere 15 01117 g002
Figure 3. Soil CO2 efflux at 6 study sites with various disturbance types in the Angara region. The box denotes 25th–75th percentiles, the center line indicates the median, the dot inside the box stands for the mean, the whiskers indicate minimum/maximum values, and dots outside the whiskers show outliers.
Atmosphere 15 01117 g003
Figure 4. Soil CO2 efflux at 4 study sites with various disturbance types in the Zabaikal region. The box denotes 25th–75th percentiles, the center line indicates the median, the dot inside the box stands for the mean, the whiskers indicate minimum/maximum values, and dots outside the whiskers show outliers.
Atmosphere 15 01117 g004
Figure 5. Soil CO2 efflux as a function of soil temperature in the undisturbed forests (a), burned forests (b), logged sites (c), and burned and logged sites (d) in the Angara region.
Atmosphere 15 01117 g005
Figure 6. Soil CO2 efflux as a function of soil temperature in the undisturbed forests (a), burned forests (b), logged sites (c), and burned and logged sites (d) in the Zabaikal region.
Atmosphere 15 01117 g006
Figure 7. Relationship between soil CO2 efflux and ground fuel depth in the Angara (a) and Zabaikal (b) regions with respect to disturbance types.
Atmosphere 15 01117 g007
Table 1. Stand structure characteristics of the studied forests and characteristics of the disturbances.
Site *Pre-Disturbance Stand CharacteristicsFire Severity in the Burnt ForestTime Since Clearcut Logging (Years)Fire Severity in the Logged Site
Tree Species Composition **DBH
(cm)
Height
(m)
Age
(years)
Basal Area
(m2 ha−1)
1A7SP1L1S1B+F, A, single SibP24.820.520031.01moderate1high
2A7SP3L+A, single S28.722.022035.87NA #5moderate
3A10SP+L, single B, A20.119.920030.45NA1high
4A8SP1F1A+L, single S, SibP, B26.626.5250, 8040.10high2high
5A8SP1L1A+S, B28.725.5270, 8042.78low1moderate
6A6SP3L1A+B, S, single SibP, F32.927.2280, 8045.05moderate2high
1Z8SP1L1B+A24.018.58034.5NA2high
2Z6SP3L1B+A28.522.4250, 7030.8NA1high
3Z9SP1L+B, A32.623.715025.2moderate0.5NA
4Z8SP2L+B22.318.57038.3high0.5high
* A—Angara region; Z—Zabaikal region. ** Forest woody vegetation composition is determined using a 10-unit scale on the basis of tree species wood volume (m3 ha−1). SP is Scots pine, L is larch, SibP is Siberian pine, F is fir, B is birch, S is spruce, A is aspen. A “+” sign indicates a tree species volume of 2 to 5% and “single” indicates a tree species volume of up to 2%. # NA—not applicable (no sites of this type were examined).
Disclaimer/Publisher’s Note: The statements, opinions and data contained in all publications are solely those of the individual author(s) and contributor(s) and not of MDPI and/or the editor(s). MDPI and/or the editor(s) disclaim responsibility for any injury to people or property resulting from any ideas, methods, instructions or products referred to in the content.