Article

Development of Dust Emission Prediction Model for Open-Pit Mines Based on SHPB Experiment and Image Recognition Method

1
China Energy Zhungeer Energy Co., Ltd., Ordos 017000, China
2
School of Mines, China University of Mining and Technology, Xuzhou 221116, China
3
High-Tech Research Center for Open Pit Mines, China University of Mining and Technology, Xuzhou 221116, China
*
Author to whom correspondence should be addressed.
Atmosphere 2024, 15(9), 1118; https://doi.org/10.3390/atmos15091118
Submission received: 9 July 2024 / Revised: 26 August 2024 / Accepted: 3 September 2024 / Published: 14 September 2024
(This article belongs to the Section Air Pollution Control)

Abstract

:
Open-pit coal mining offers high resource recovery, excellent safety conditions, and large-scale production. However, the process generates significant dust, leading to occupational diseases such as pneumoconiosis among miners and adversely affecting nearby vegetation through dust deposition, which hinders photosynthesis and causes ecological damage. This limits the transition of open-pit mining to a green, low-carbon model. Among these processes, blasting generates the most dust and has the widest impact range, but the specific amount of dust generated has not yet been thoroughly studied. This study integrates indoor experiments, theoretical analyses, and field tests, employing the Split Hopkinson Pressure Bar (SHPB) system to conduct impact loading tests on coal–rock samples under pressures ranging from 0.13 MPa to 2.0 MPa. The results indicate that as the impact load increases, the proportion of large-sized blocks decreases while smaller fragments and powdered samples increase, signifying intensified sample fragmentation. Using stress wave attenuation theory, this study translates indoor impact loadings to field blast shock waves, revealing the relationship between blasting dust mass fraction and impact pressure. Field tests at the Haerwusu open-pit coal mine validated the formula. Using image recognition technology to analyze post-blast muck-pile fragmentation, the estimated dust production closely matched the calculated values, with an error margin of less than 10%. This formula provides valuable insights for estimating dust production and improving dust control measures during open-pit mine blasting operations.

1. Introduction

Open-pit mining is one of the significant methods for coal extraction, where dust generated during blasting processes poses substantial environmental and occupational health risks. Some studies have shown that dust pollution is one of the most significant environmental problems in open-pit mining, which leads to serious deterioration of air quality and adverse effects on human health in the vicinity of the mine site [1,2,3]. Kayet et al. found that dust emissions due to exploration, drilling, blasting, mining, transporting, crushing, etc., lead to the deposition of dust in different locations such as roadsides, vegetation, etc. It significantly leads to the degradation of vegetation and the diversity of plants and animals [4]. According to research, more than 30% of coal miners in China suffer from pneumoconiosis (black lung disease) due to dust, indicating the need to further strengthen dust reduction measures [5]. Particularly in bench blasting operations, the frequent nature of blasting activities and the complexity of blasting parameters contribute to significant uncertainties in dust emissions. Previous studies have primarily focused on the impact of blasting parameters on dust emissions and the application of dust control technologies. However, quantitative research on dust emissions specifically from bench blasting in open-pit mines remains limited. This study aims to explore the intensity of blasting dust emissions and estimate dust emissions under specific blasting parameter conditions.
Existing research on dust emissions is scarce due to limitations in current technological conditions. Studies typically collect dust concentration data using dust detection and collection devices for analysis. However, predictions often fall short of actual values due to safety distance requirements during blasting and the focus on respirable dust, resulting in less than ideal predictive accuracy. Moreover, the wide dispersion of dust and uneven distribution further complicates predicting dust emissions during blasting operations. Scholars have made significant efforts to address dust emissions issues. For instance, Zhang Xingkai et al. [6] utilized dust concentration and deposition measurements from DaYe iron ore mine blasting experiments to calculate blasting dust emissions and analyze variations in dust dispersion. Guo Yao et al. [7] proposed a quantifiable visualization method for blasting dust based on the Gaussian diffusion model. This method simulates the dispersion patterns of blasting dust using Matlab and Ansys Fluent software, establishing relationships between blasting dust emissions and dispersion ranges. Liu Jian et al. [8], based on blasting operations at a Myanmar open-pit mine, conducted field experiments to study factors influencing blasting dust concentration and emissions. The results indicated a 25% increase in dust emissions with a 10% increase in explosive usage.
It can be seen that scholars have conducted part of the research work on the prediction of dust emissions from blasting. However, at present, for the dust production in the blasting process of surface coal mines, there has not been a model for the calculation of dust emissions combined with field experiments.
Currently, numerous scholars have utilized Split Hopkinson Pressure Bar (SHPB) experimental devices for various studies. Li Chengwu et al. [9] used Split Hopkinson Pressure Bars to analyze the dynamic mechanical properties of coal, studying parameters such as stress, strain, impact energy, and dissipative energy. Jie Beijing et al. [10] conducted research on the dynamic mechanical properties of coal rock under different loading rates using an SHPB experimental setup, correlating peak dynamic data with changes in magnetic field information, and constructing a combined coal–rock dynamic constitutive model. Zhao Yixin et al. [11] researched the dynamic tensile strength of coal based on SHPB experiments, discussing layering phenomena and non-static mechanical properties in coal rock. He et al. [12] studied coal sample dynamic properties under different impact velocities and axial static loads, analyzing macroscopic fracture forms and pore evolution, and dissecting coal–rock instability mechanisms from an energy dissipation perspective. Gao Wenjiao et al. [13,14,15] studied coal destruction under high-frequency strain using the SHPB device, establishing a non-static strength theoretical model for single-load high-speed loading of anthracite. Li Chengwu et al. [16] utilized the LS-DYNA finite element software and the Holmquist–Johnson–Cook (HJC) constitutive model for numerical simulation of coal–rock SHPB experiments, reproducing stress waveforms, oscillations, and specimen damage during impact experiments. Liu Shaohong et al. [17,18], based on improved SHPB setups, researched stress wave propagation mechanisms and energy dissipation in combined coal–rock systems under dynamic and static loads, establishing a one-dimensional nonlinear dynamic model of coal–rock systems. Jiao Zhenhua et al. [19] utilized SHPB and custom side-constraining devices for impact compression tests on coal samples under different velocity grades and constraint states, studying coal–rock energy dissipation and damage modes. Wang Lei et al. [20], using a split-type SHPB, determined the relationship between fracture energy consumption, energy consumption ratio, and energy density with length-to-diameter ratios, summarizing dynamic compression fracture energy and energy consumption ratio effects and explaining energy dissipation from specimen scale and dynamic stress balance and damage processes.
Some scholars have also applied SHPB experimental devices to the blasting field. Wang Li et al. [21] conducted multiple attempts in the blasting field using SHPB, promoting the development of nonlinear stress wave propagation theories. Dai Renping et al. [22,23] quantitatively studied the protective effects of tunnel surrounding rock blasting damage protection materials using SHPB experimental devices. Zhang Zhicheng et al. [24] utilized the SHPB device to study the damage effects of directional unloading isolation blasting on rocks.
It is evident that SHPB experimental technology is relatively mature in studying the dynamic mechanical characteristics of coal–rock bodies and is widely used in the blasting field. Existing research focuses on the dynamic characteristics, damage properties, and energy propagation laws of coal–rock bodies at different velocities. However, there is limited research on the size distribution of coal–rock fragmentation under different impact loads. Fragmentation size directly affects the economic benefits of mining enterprises and can be used to estimate dust emissions under specific parameters during blasting.
Using image recognition technology, scholars have made significant progress in dust research. Jiang Jiang Yin et al. [25] combined deep learning and image processing techniques, analyzing and classifying dust in mining areas using convolutional neural networks (CNN) to achieve high-precision recognition results. Additionally, Boyu Luan et al. [26] applied machine learning models such as random forests and Markov chains, combined with environmental parameters (such as wind speed, temperature, humidity) for dust concentration prediction, significantly improving prediction accuracy. Ruixin Zhang et al. [27], using high-resolution cameras and drones, constructed real-time monitoring and warning systems for analyzing and identifying dust dispersion situations. Chunsheng Wang et al. [28] utilized multi-source data fusion technology, combining image recognition with laser radar and infrared sensor data, to enhance dust monitoring accuracy. Remote sensing image analysis is also commonly used for monitoring dust distribution and dispersion paths, effectively guiding dust control measures’ formulation and evaluation. However, existing research primarily focuses on dust concentration and dispersion paths, without effectively predicting dust emissions from open-pit mines.
In summary, the existing research has not yet established an accurate prediction model of blasting dust emissions. Clarifying the amount of dust generated in the blasting process has an important engineering significance and can be based on this research on blasting dust reduction and blasting quality analysis. To reduce the large amount of dust generated and to protect the health of the operators and optimize the mining environment, the study of blasting methods, development of blasting materials, in-depth understanding of the mechanism of dust and dust reduction methods, and other measures are of great significance.
Therefore, this study focuses on blasting dust emissions at the Ha’erwusu open-pit coal mine, specifically addressing the calculation of dust emissions from bench blasting in open-pit coal mines. It integrates indoor experiments, theoretical analyses, and field tests, utilizing the SHPB experimental device to study the size distribution of coal–rock samples under different impact loads. Based on this, it establishes relationships between the loading pressure and the percentage of blasting dust mass. By utilizing the blasting shock wave calculation formula for bench blasting in open-pit coal mines, it transforms indoor impact loadings into blasting shock waves in engineering, establishing a calculation formula for dust emissions from coal seam bench blasting. Finally, it uses image recognition technology to select fragmentation sizes from field blasting results, calculate dust emissions, and compare these with the calculated results from the proposed formula, validating its accuracy. The research process and methodology of this study is shown in Figure 1.

2. Indoor Tests

2.1. Laboratory Impact Simulation Test of Blasting in Coal–Rock Layers

Using a Split Hopkinson Pressure Bar (SHPB) test system, dynamic impact tests were conducted on prepared coal–rock samples under different loading pressures. These tests simulate the fragmentation of coal–rock layers under instantaneous blast impact loads. The relationship between impact load and fragmentation size was investigated to provide a foundation for calculating dust generation during open-pit mining blasts.

2.1.1. Overview of Indoor Impact Load Tests on Coal Rock

(1)
Sample Preparation
This experiment is primarily divided into two types: coal and rock tests under impact load. The coal and rock samples used in the tests were collected from the Haerwusu open-pit coal mine in Inner Mongolia. The rock sample is sandstone, and composition testing revealed that the main components of this sandstone are quartz (11.25%), kaolinite, microcline (46.11%), and anorthite (43.11%). The samples were prepared at the Mechanics Testing Center of China University of Mining and Technology through a process involving core extraction, cutting, and polishing. According to the experimental plan, the coal samples were cylindrical with dimensions of 50 mm in height and 50 mm in diameter, while the rock samples were cylindrical with dimensions of 25 mm in height and 50 mm in diameter. The prepared samples are shown in Figure 2.
(2)
Experimental Equipment
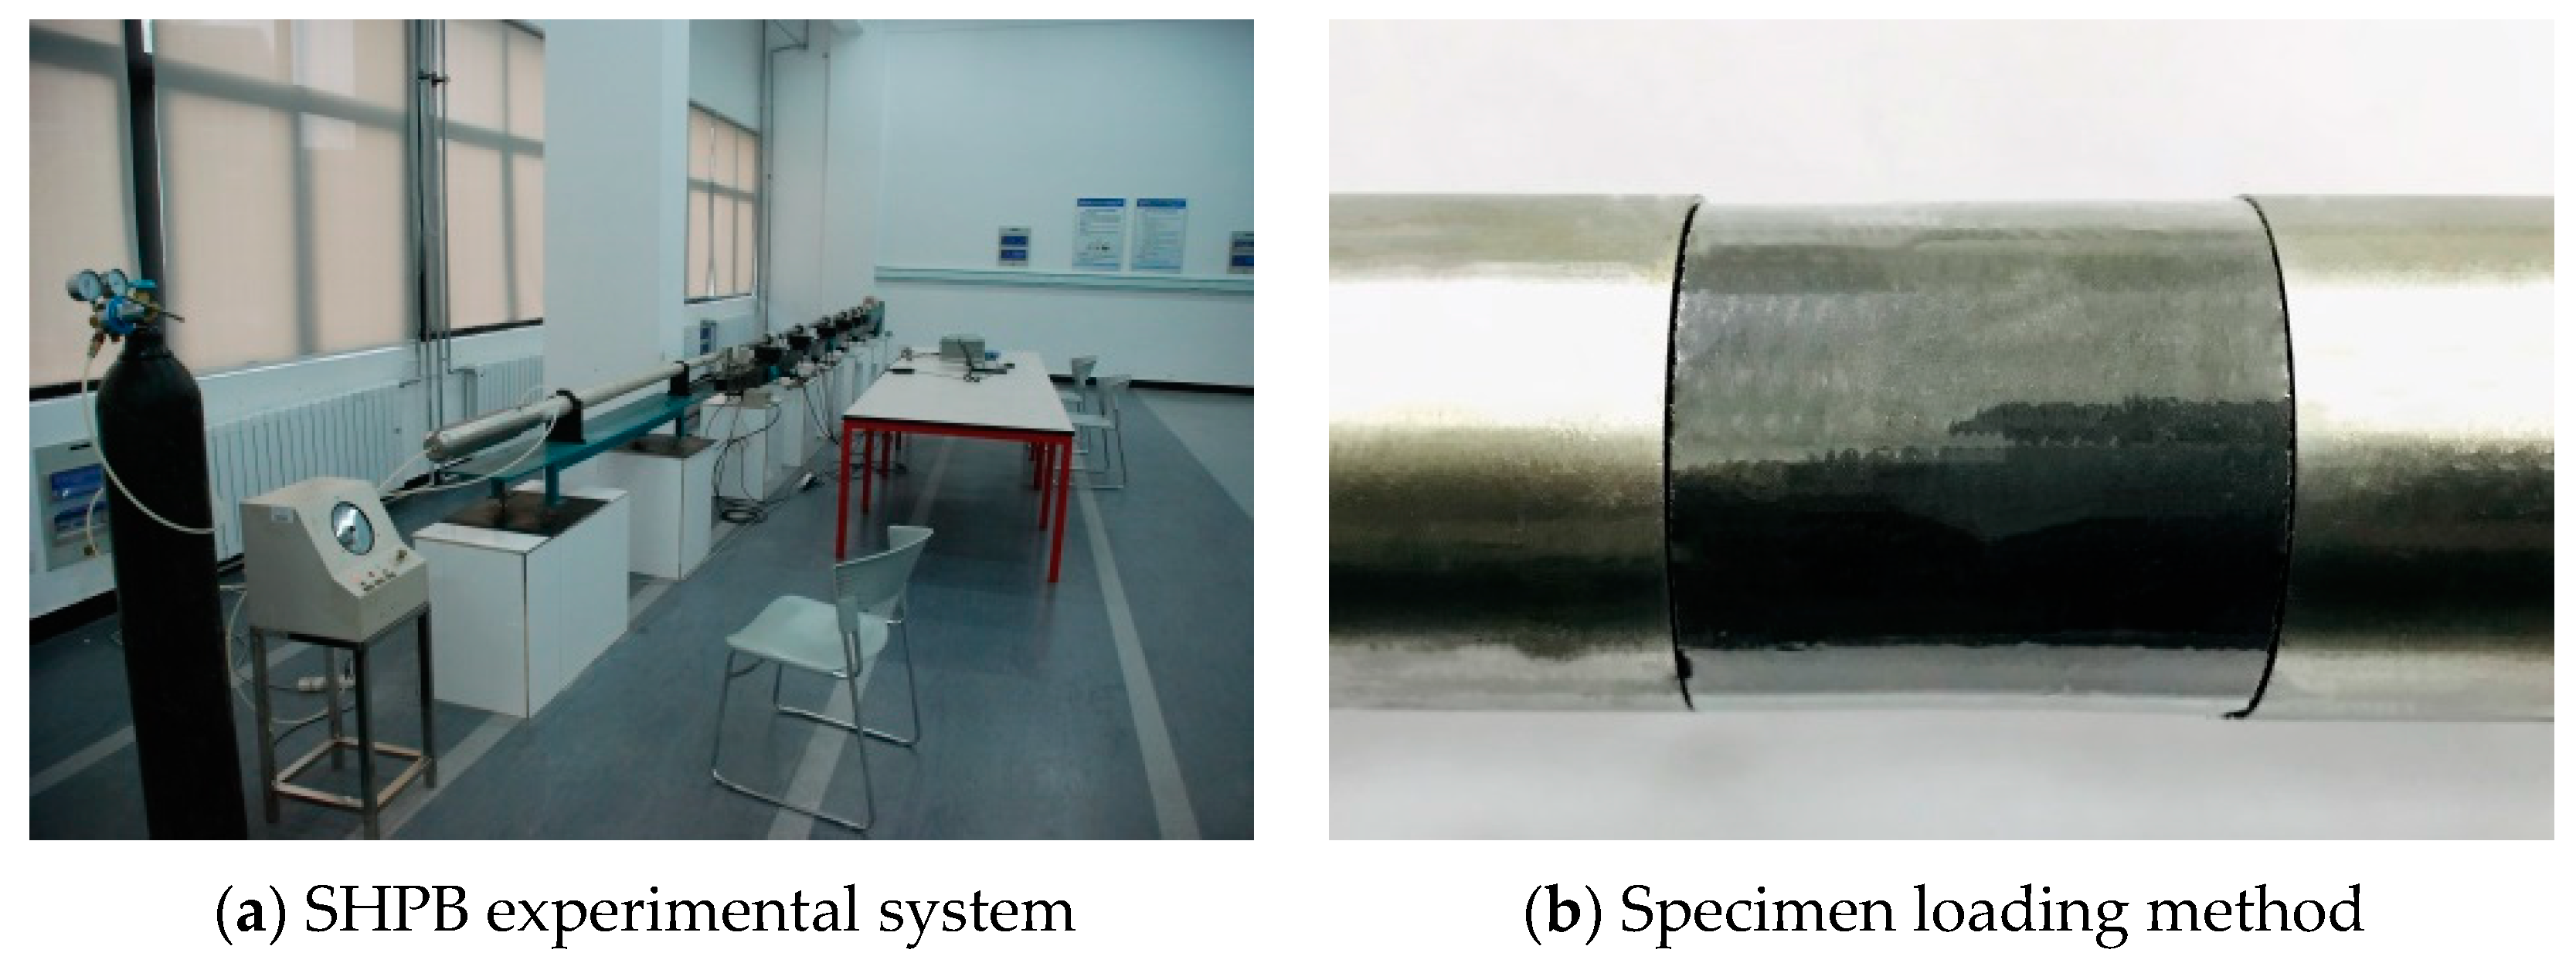
This experiment utilized the φ50 mm SHPB test system from the State Key Laboratory for Deep Geomechanics and Underground Engineering at China University of Mining and Technology. This system has been proven through practical use to be complete and reliable in data acquisition. The SHPB test system is shown in Figure 3a.
The sample loading method is shown in Figure 3b. During the experiment, under the action of high-pressure gas, the striker collides with the incident bar, generating an incident pulse in the incident bar. When the incident pulse propagates through the incident bar and reaches both sides of the sample, the stress pulse reflects and transmits multiple times at the sample-bar interface, causing the sample to undergo high-speed deformation. Meanwhile, the reflected pulse forms a reflection pulse signal, and the remaining pulses transmit through the sample to the transmission bar, forming a transmission pulse signal. The pulse signals are detected by strain gauges on the elastic bars, and the results are recorded in the signal acquisition system.
(3)
Experimental Plan
Through multiple preliminary tests, it was determined that the minimum loading pressure causing failure of coal–rock samples is 0.13 MPa. This indicates that the pressure at the boundary between the fracture zone and the undisturbed zone is 0.13 MPa. The SHPB test system used in this experiment has a maximum loading pressure of 2.0 MPa. Therefore, using 0.13 MPa and 2.0 MPa as the upper and lower load benchmarks, an impact load gradient experiment was designed. Ten experimental schemes were finalized with impact loads of 0.13 MPa, 0.17 MPa, 0.25 MPa, 0.30 MPa, 0.50 MPa, 0.70 MPa, 0.90 MPa, 1.20 MPa, 1.50 MPa, and 2.0 MPa. These ten pressure levels were used to perform dynamic compression tests on the coal and sandstone samples.

2.1.2. Study on Fragmentation Size Distribution of Coal Rock under Impact

To reveal the fragmentation size distribution patterns of coal–rock samples under different impact loads, equipment such as grading sieves and electronic scales were used to screen and weigh the damaged coal and rock samples. Using image recognition particle size analysis technology, the changes in particle sizes of coal and rock samples under different impact loads were analyzed.
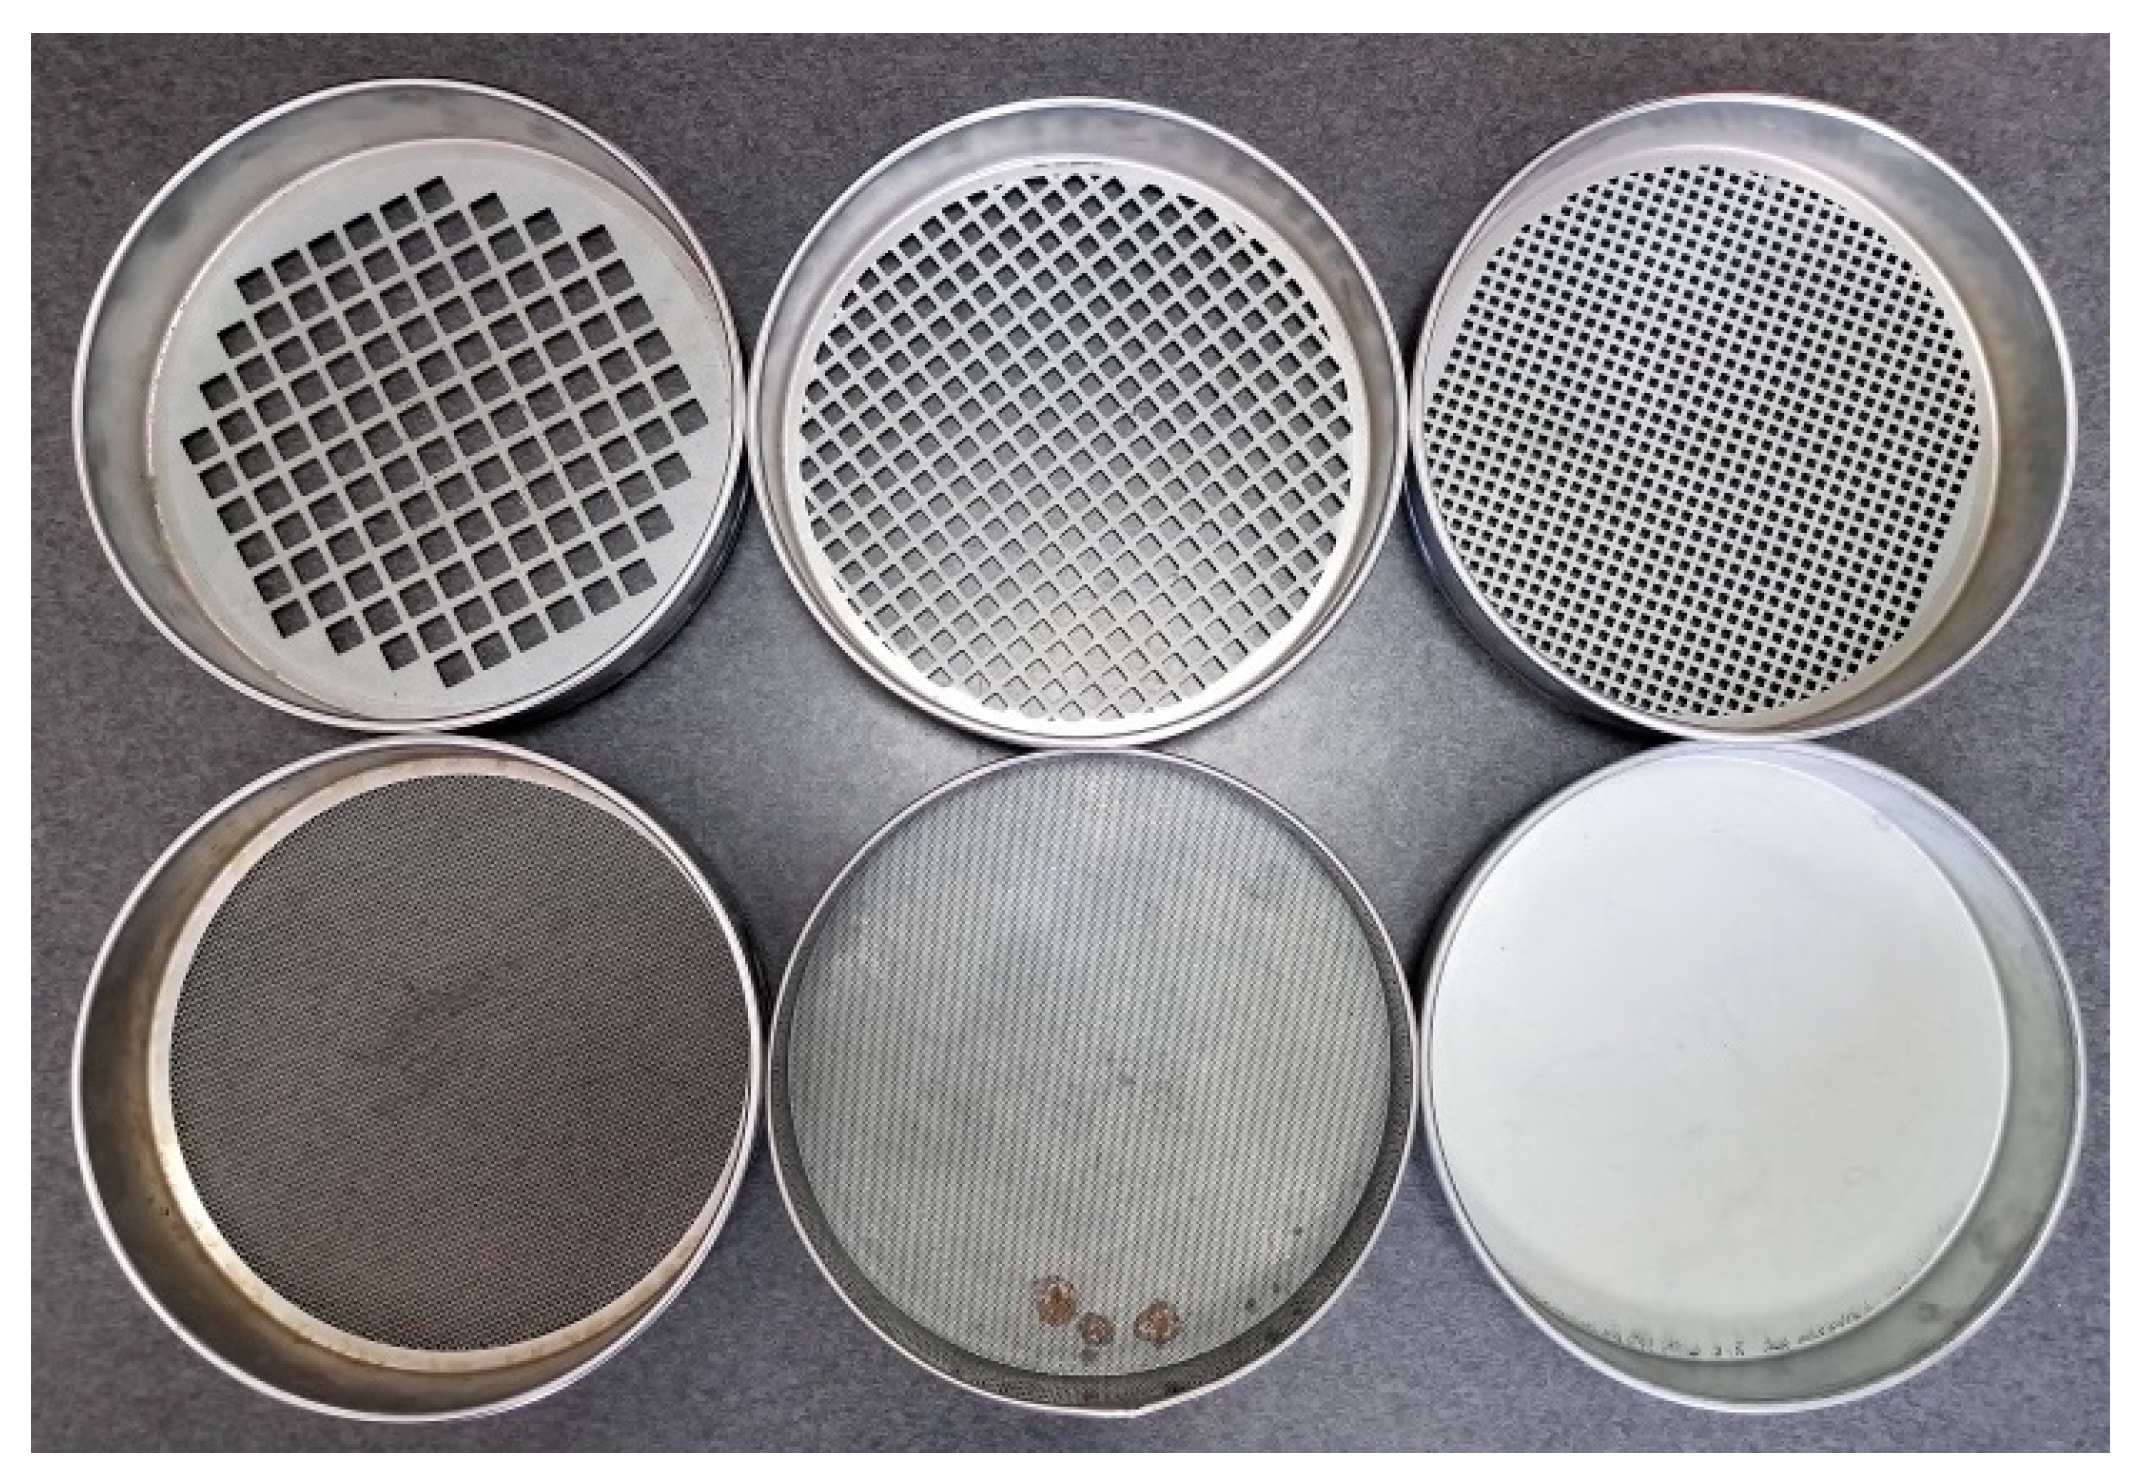
During the experiment, the direct measurement method of sieving was used to classify the fragmentation of coal–rock samples after impact damage. The grading sieves selected for the experiment had apertures ranging from large to small, specifically 15.0 mm, 10.0 mm, 5.0 mm, 2.0 mm, and 1.0 mm. The samples were sieved to obtain six groups of coal–rock samples with particle size ranges of 15.0–50.0 mm, 10.0–15.0 mm, 5.0–10.0 mm, 2.0–5.0 mm, 1.0–2.0 mm, and 0.0–1.0 mm, where 50 mm is the diameter of the sample. These sizes were numbered from large to small as i = 1, 2, 3...6. The fragmentation of coal–rock samples under different pressures was sieved using the grading sieves, resulting in different particle sizes for each pressure condition, as shown in Figure 4.
After sieving, the mass percentage is used as the fragmentation distribution parameter, representing the percentage of fragment mass at each particle size relative to the total sample mass. To assess the degree of sandstone fragmentation under different impact loads, this experiment used the average fragment size δ as the evaluation index. The specific method to obtain δ is as follows:
First, the fragments were sieved using the grading sieve, and the mass of fragments at each particle size mdi was obtained using a high-precision electronic scale. Then, the mass percentage miv of fragments at each particle size was calculated by dividing the fragment mdi mass by the total sample mass m. Next, the mass percentage miv was multiplied by the average particle size div of that group to obtain the proportion δiv of that particle size in all fragment sizes. Finally, the percentages of all fragment sizes were summed to obtain the average particle size. The specific expression is
δ = 1 i δ i v = 1 i m i v d i v
In the formula, i represents the sieving level of the grading sieve; div is the average particle size of each group, calculated as the mean of the maximum and minimum particle sizes for that group. When i = 1, the average particle size is 32.5 mm.

3. Indoor Test Analysis

3.1. Fragmentation Size Distribution Characteristics of Coal–Rock Samples

(1)
Fragmentation Size Distribution Characteristics of Rock Samples
Using the aforementioned analysis method for fragmentation size distribution characteristics, the fractured rock samples from the Hopkinson Bar tests were graded and sieved, yielding the sieving results of the fractured rock samples under different impact pressures, as shown in Figure 5. As the impact pressure increased from 0.13 MPa to 2.00 MPa, the degree of fragmentation in the rock samples significantly increased. The proportion of larger fragments gradually decreased, while the proportion of silt-sized debris increased.
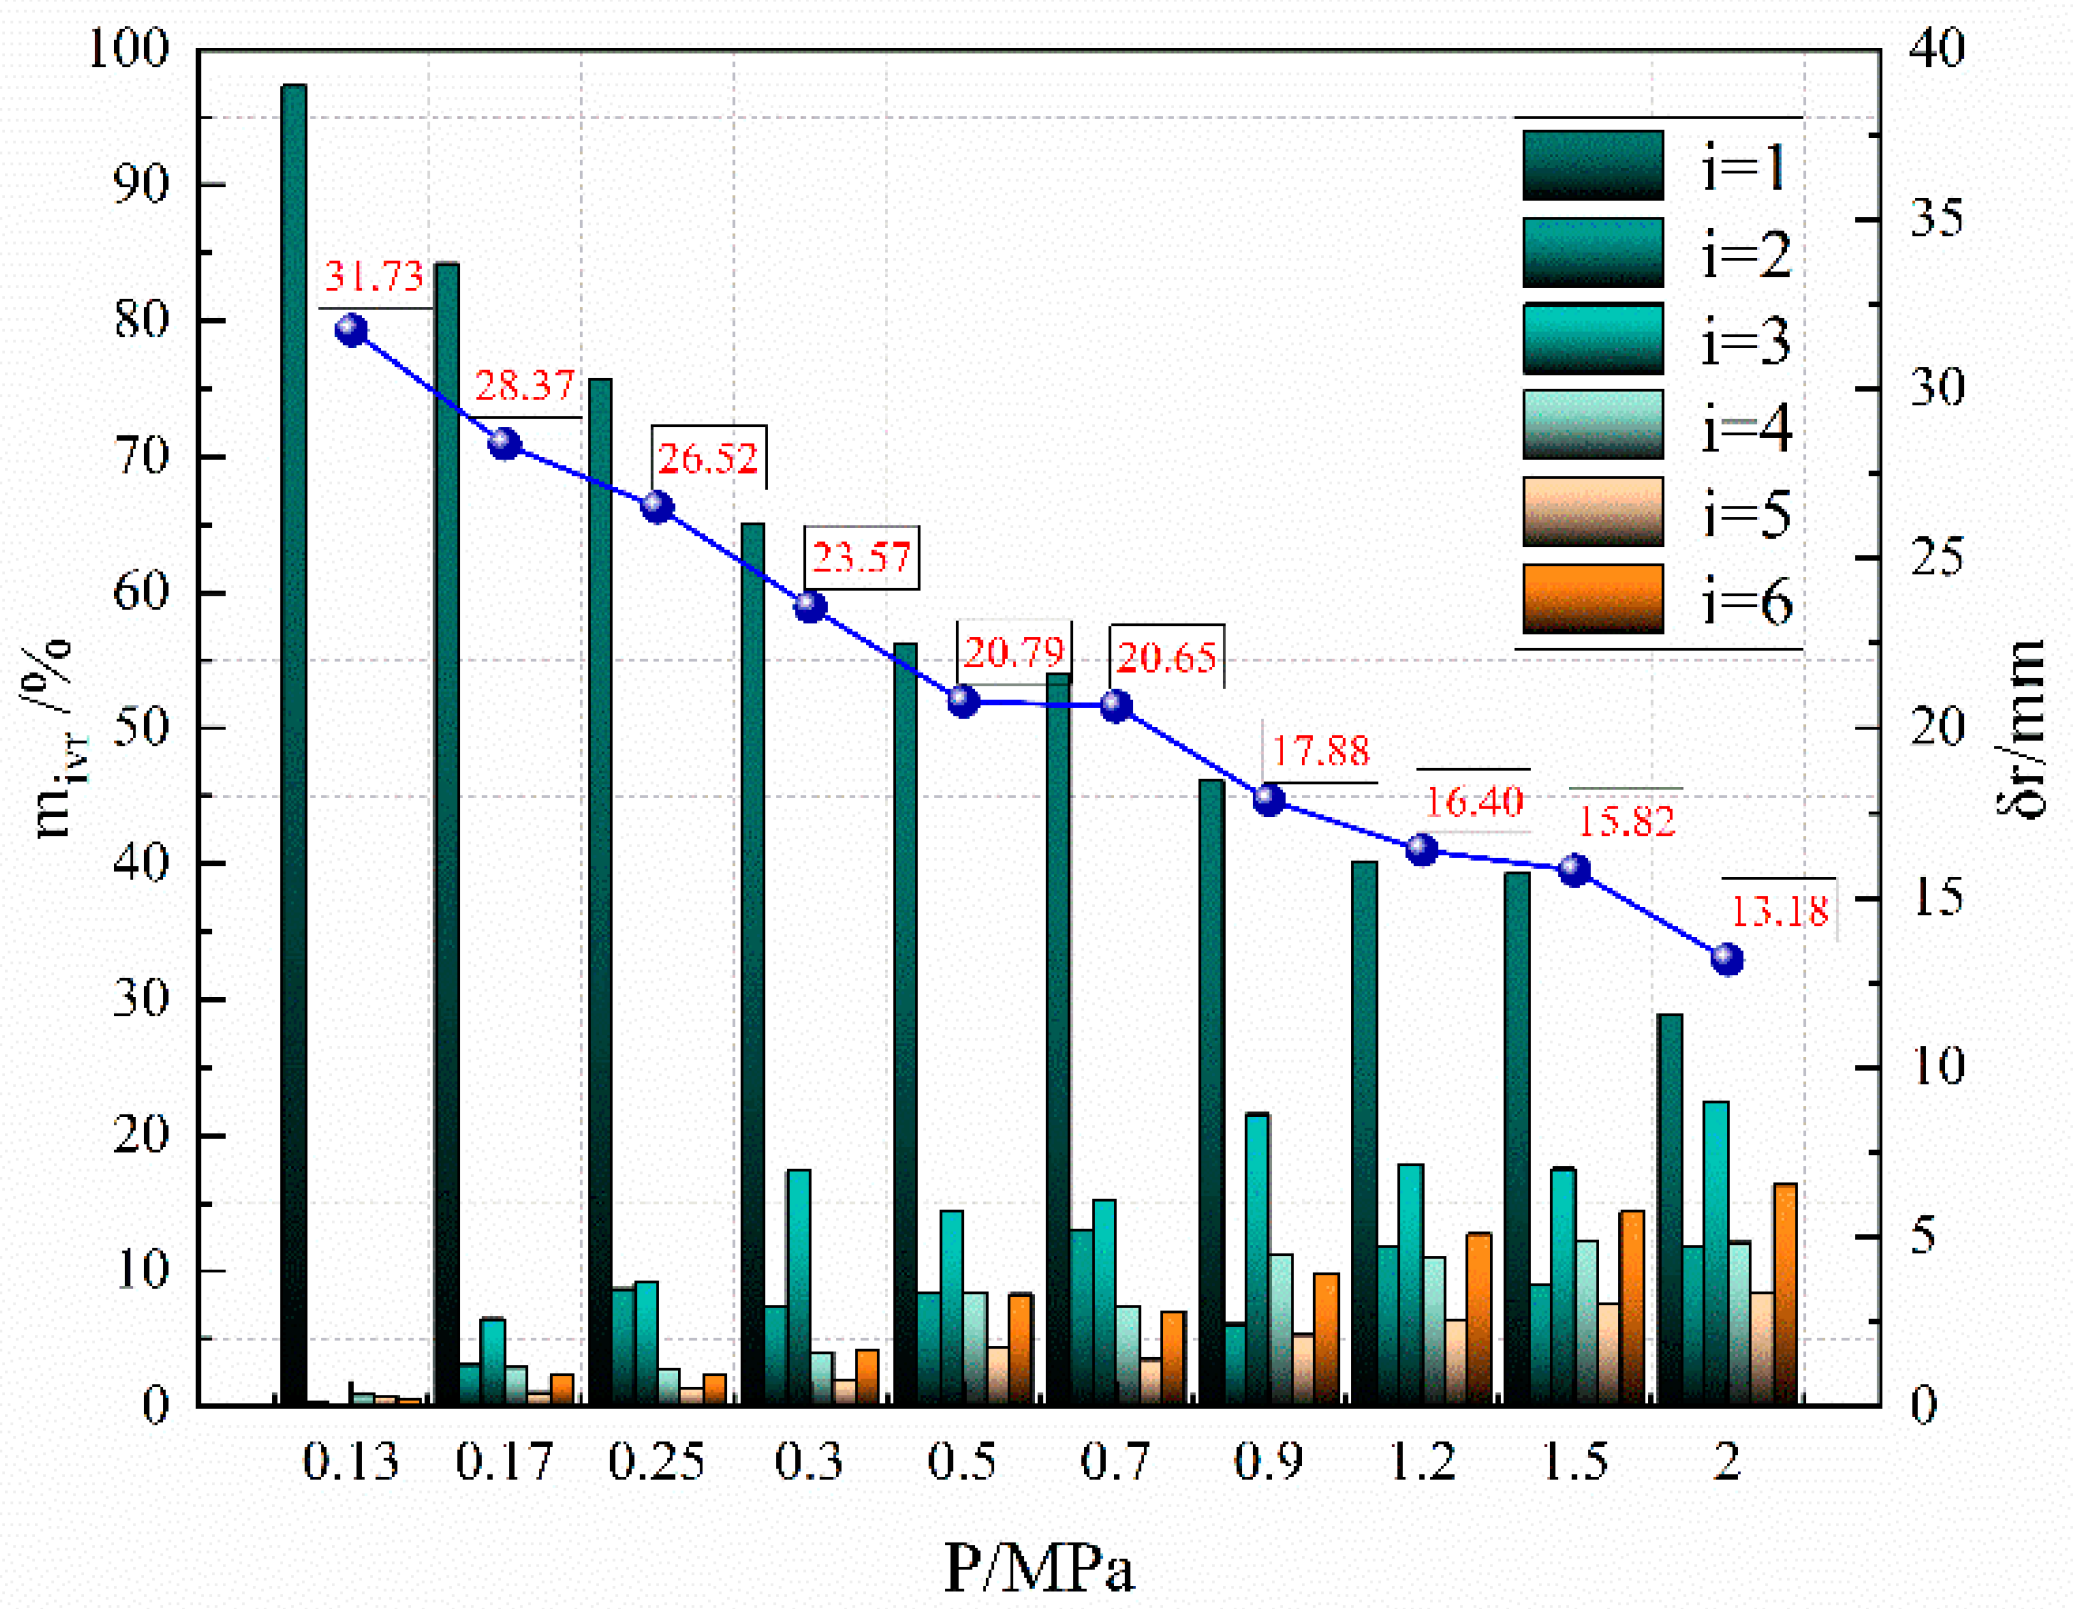
Through sieving calculations, the mass percentage and average particle size of rock sample fragments under different impact loads can be obtained, as shown in Table 1. In the table, Mr represents the total mass of three rock samples, and mvir represents the percentage of the mass of the i-th particle size group relative to the total mass after the fragmentation of the three rock samples. Figure 6 shows the variation patterns of the mass percentage miv and the average fragment size δr of rock samples with respect to the impact load.
As shown in Table 1 and Figure 6, the particle size distribution and average particle size of the rock fragments exhibit a certain regularity with the change in impact pressure. When the impact pressure increases from 0.13 MPa to 2.00 MPa, the mass percentage of the largest fragments (≥15.0 mm) gradually decreases from 97.32% to 28.91%, a reduction of 70.29%. The mass percentages of the next two particle size groups (10.0–15.0 mm and 5.0–10.0 mm) exhibit random distribution around a certain ratio, with the 10.0–15.0 mm group at around 8% and the 5.0–10.0 mm group at around 14%. The mass percentages of the last three particle size ranges (2.0–5.0 mm, 1.0–2.0 mm, and 0.0–1.0 mm) increase with the impact pressure. When the pressure increases from 0.13 MPa to 2.00 MPa, the mass percentage of fragments in the 2.0–5.0 mm range increases from 0.87% to 12.09%, in the 1.0–2.0 mm range from 0.83% to 8.42%, and in the 0.0–1.0 mm range from 0.52% to 16.34%.
As the pressure increases, the average particle size of the fragmented rock samples gradually decreases, indicating an increasing degree of rock sample damage. The trend in average particle size change can be roughly divided into two processes: As the pressure increases from 0.13 MPa to 0.30 MPa, the average particle size rapidly decreases from 31.73 mm to 23.57 mm, a reduction of 25.72%. When the pressure further increases, the decrease in average particle size slows down, reducing from 23.57 mm to 13.18 mm, a reduction of 44.08%.
(2)
Fragmentation Size Distribution Characteristics of Coal Samples
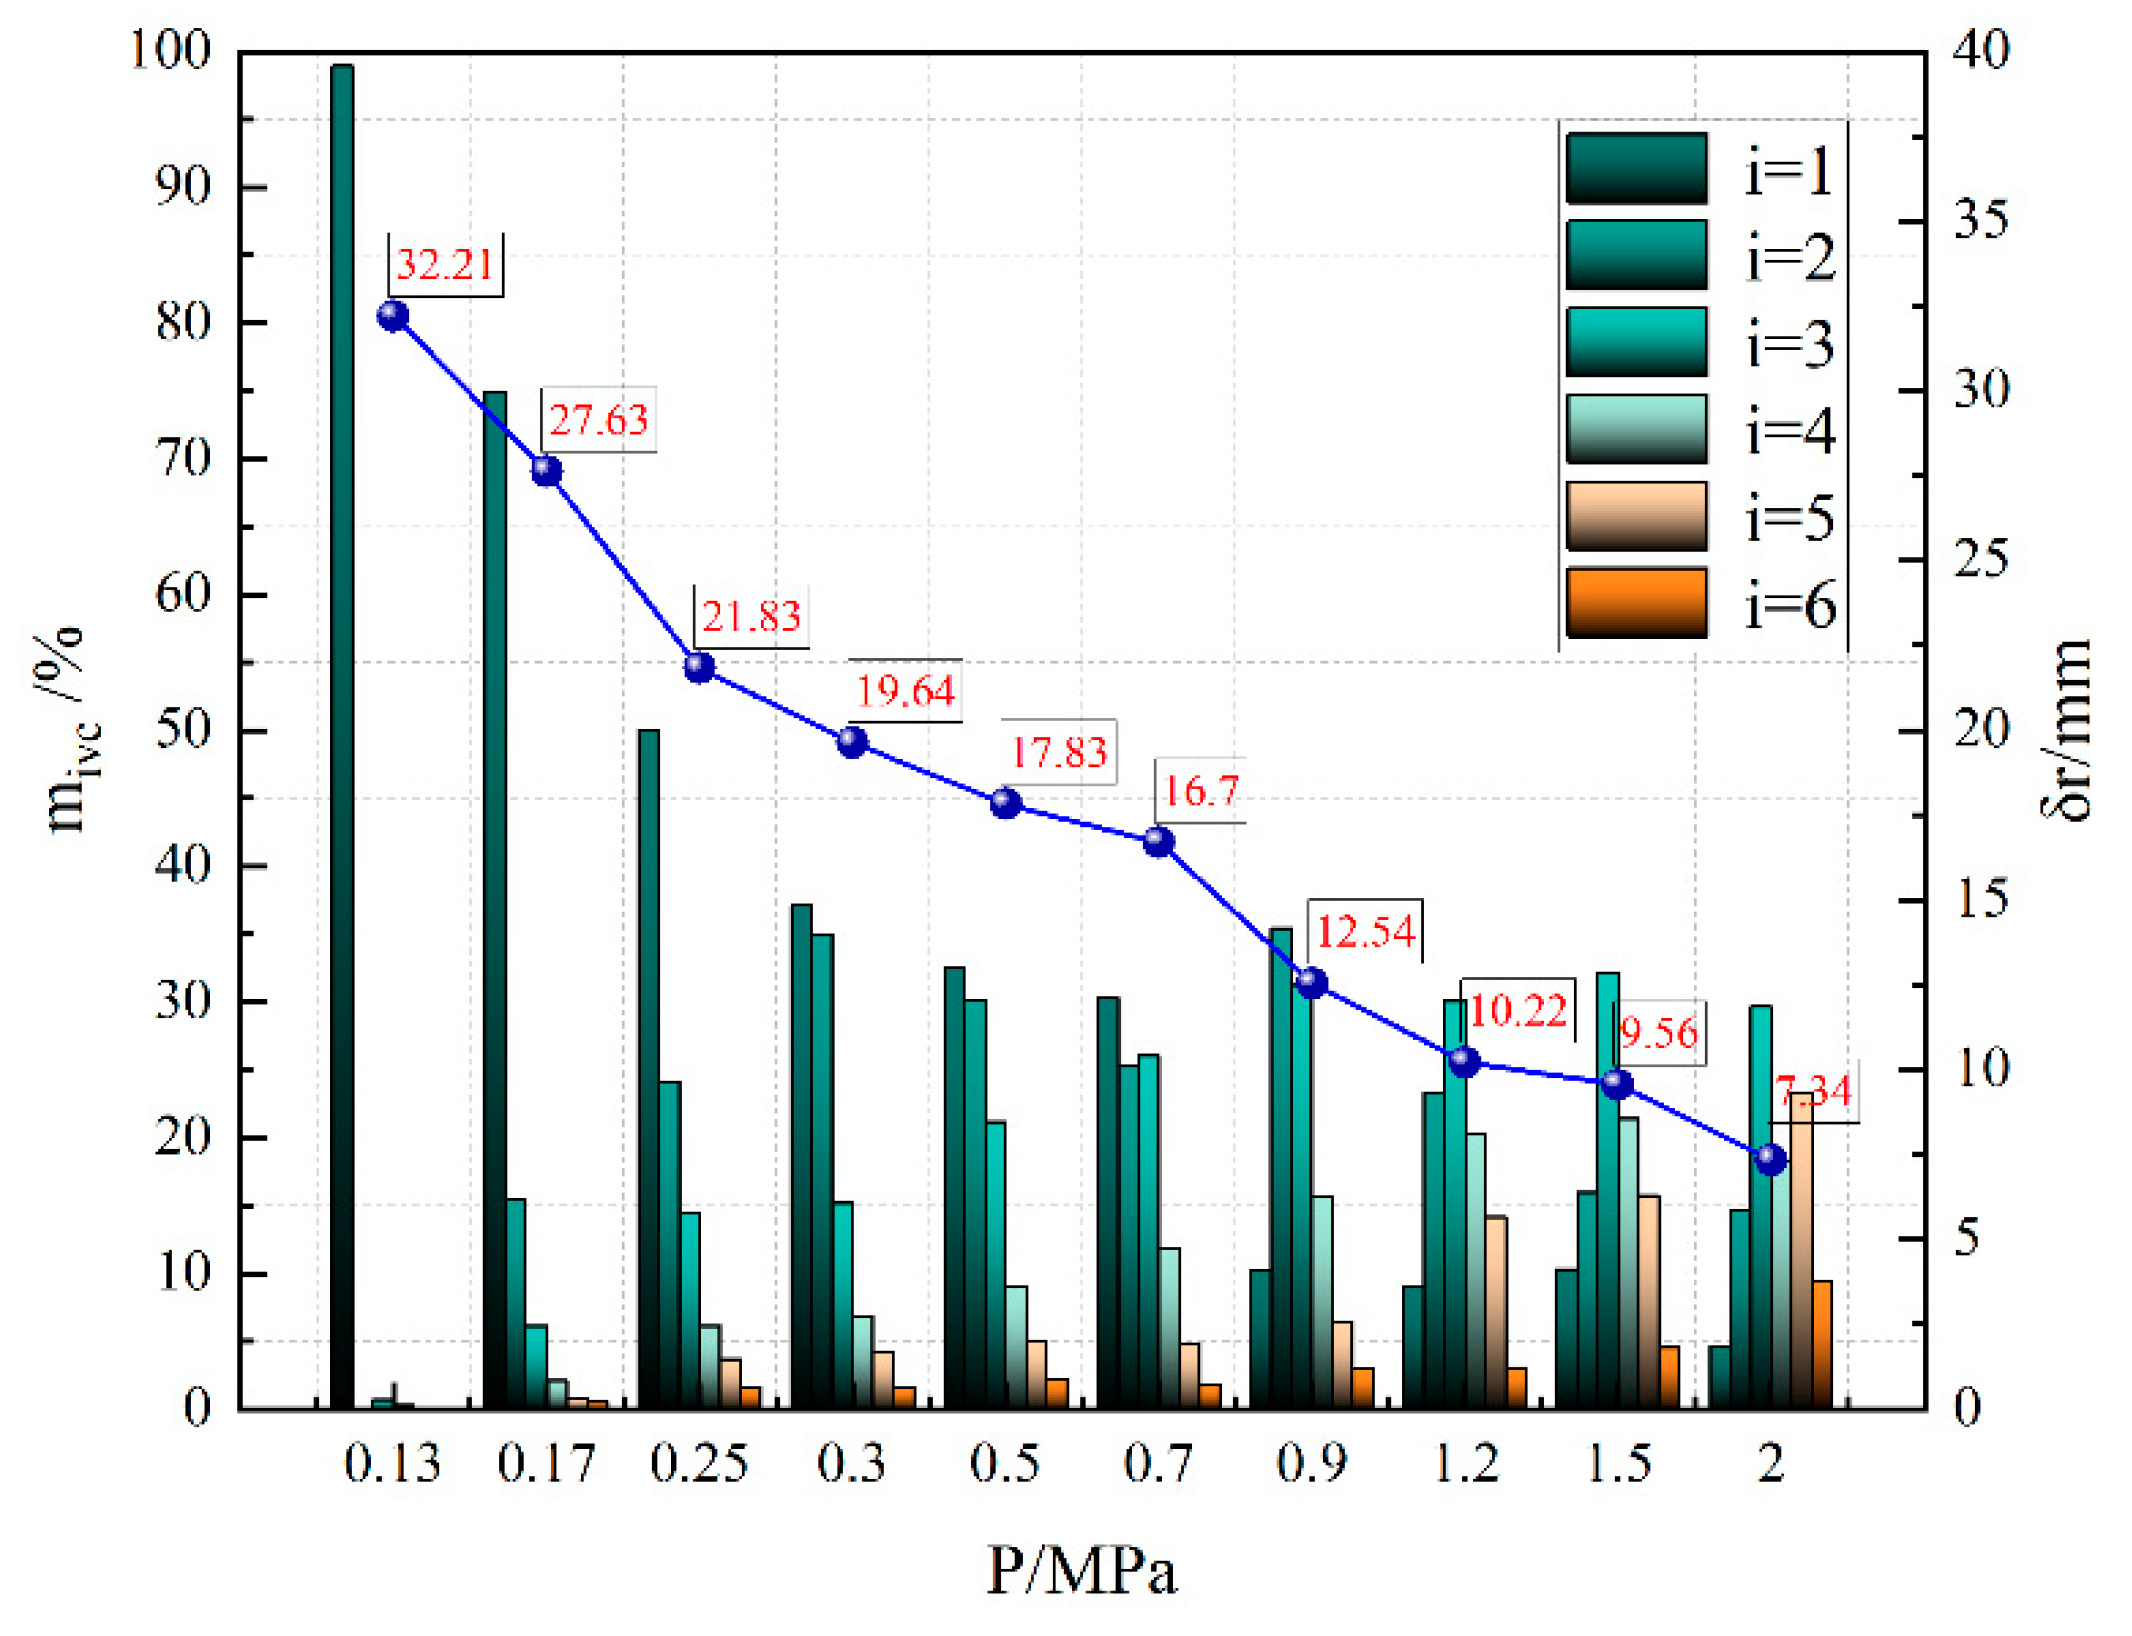
Similarly, using the aforementioned methods for studying the fragmentation size distribution characteristics, the coal samples subjected to impact damage were analyzed. This analysis provided the mass percentage of fragments and the average particle size under different impact pressures. Here, Mc represents the total mass of three coal samples, and mivc represents the percentage of the mass of the i-th particle size group relative to the total mass after the fragmentation of the three coal samples. This analysis revealed the fragmentation size distribution characteristics and the trend in average particle size with impact pressure, as shown in Figure 7.
When the impact pressure increases from 0.13 MPa to 2.00 MPa, the degree of fragmentation in coal samples intensifies. The proportion of large coal fragments decreases, while the proportion of smaller fragments and powdered coal increases, indicating a significant correlation between the size of coal fragments after breaking and the impact pressure.
As shown in Figure 7, the fragmentation size distribution characteristics and average particle size of coal samples exhibit significant differences under different impact pressures.
Specifically, as the pressure increases from 0.13 MPa to 2.00 MPa, the mass percentage of the largest fragments (≥15.0 mm) gradually decreases from 98.93% to 4.65%, a reduction of 95.30%. The mass percentages of the next three particle size groups (10.0–15.0 mm, 5.0–10.0 mm, and 2.0–5.0 mm) show an initial increase followed by a decrease. The pressure corresponding to the maximum value increases as the particle size range decreases, with the maximum percentages being 35.43%, 32.11%, and 21.37%, respectively. The mass percentages of the smallest two particle size ranges (1.0–2.0 mm and 0.0–1.0 mm) increase rapidly with increasing pressure. Specifically, as the pressure increases from 0.13 MPa to 2.00 MPa, the mass percentage of fragments in the 1.0–2.0 mm range increases from 0.07% to 23.33%, and in the 0.0–1.0 mm range from 0.05% to 9.45%.
The average particle size of the fragmented coal samples decreases gradually with the increase in pressure, indicating that the degree of coal sample damage increases. The trend in average particle size change can be roughly divided into three processes: as the pressure increases from 0.13 MPa to 0.30 MPa, the average particle size rapidly decreases from 32.21 mm to 19.64 mm, a reduction of 39.03%; as the pressure increases from 0.30 MPa to 0.90 MPa, the decrease in average particle size slows down from 19.64 mm to 12.54 mm, a reduction of 36.15%; and when the pressure further increases, the decrease in average particle size slows further from 12.54 mm to 7.34 mm, a reduction of 41.47%.

3.2. Regression Analysis of Loading Pressure and Blasting Dust Mass Percentage

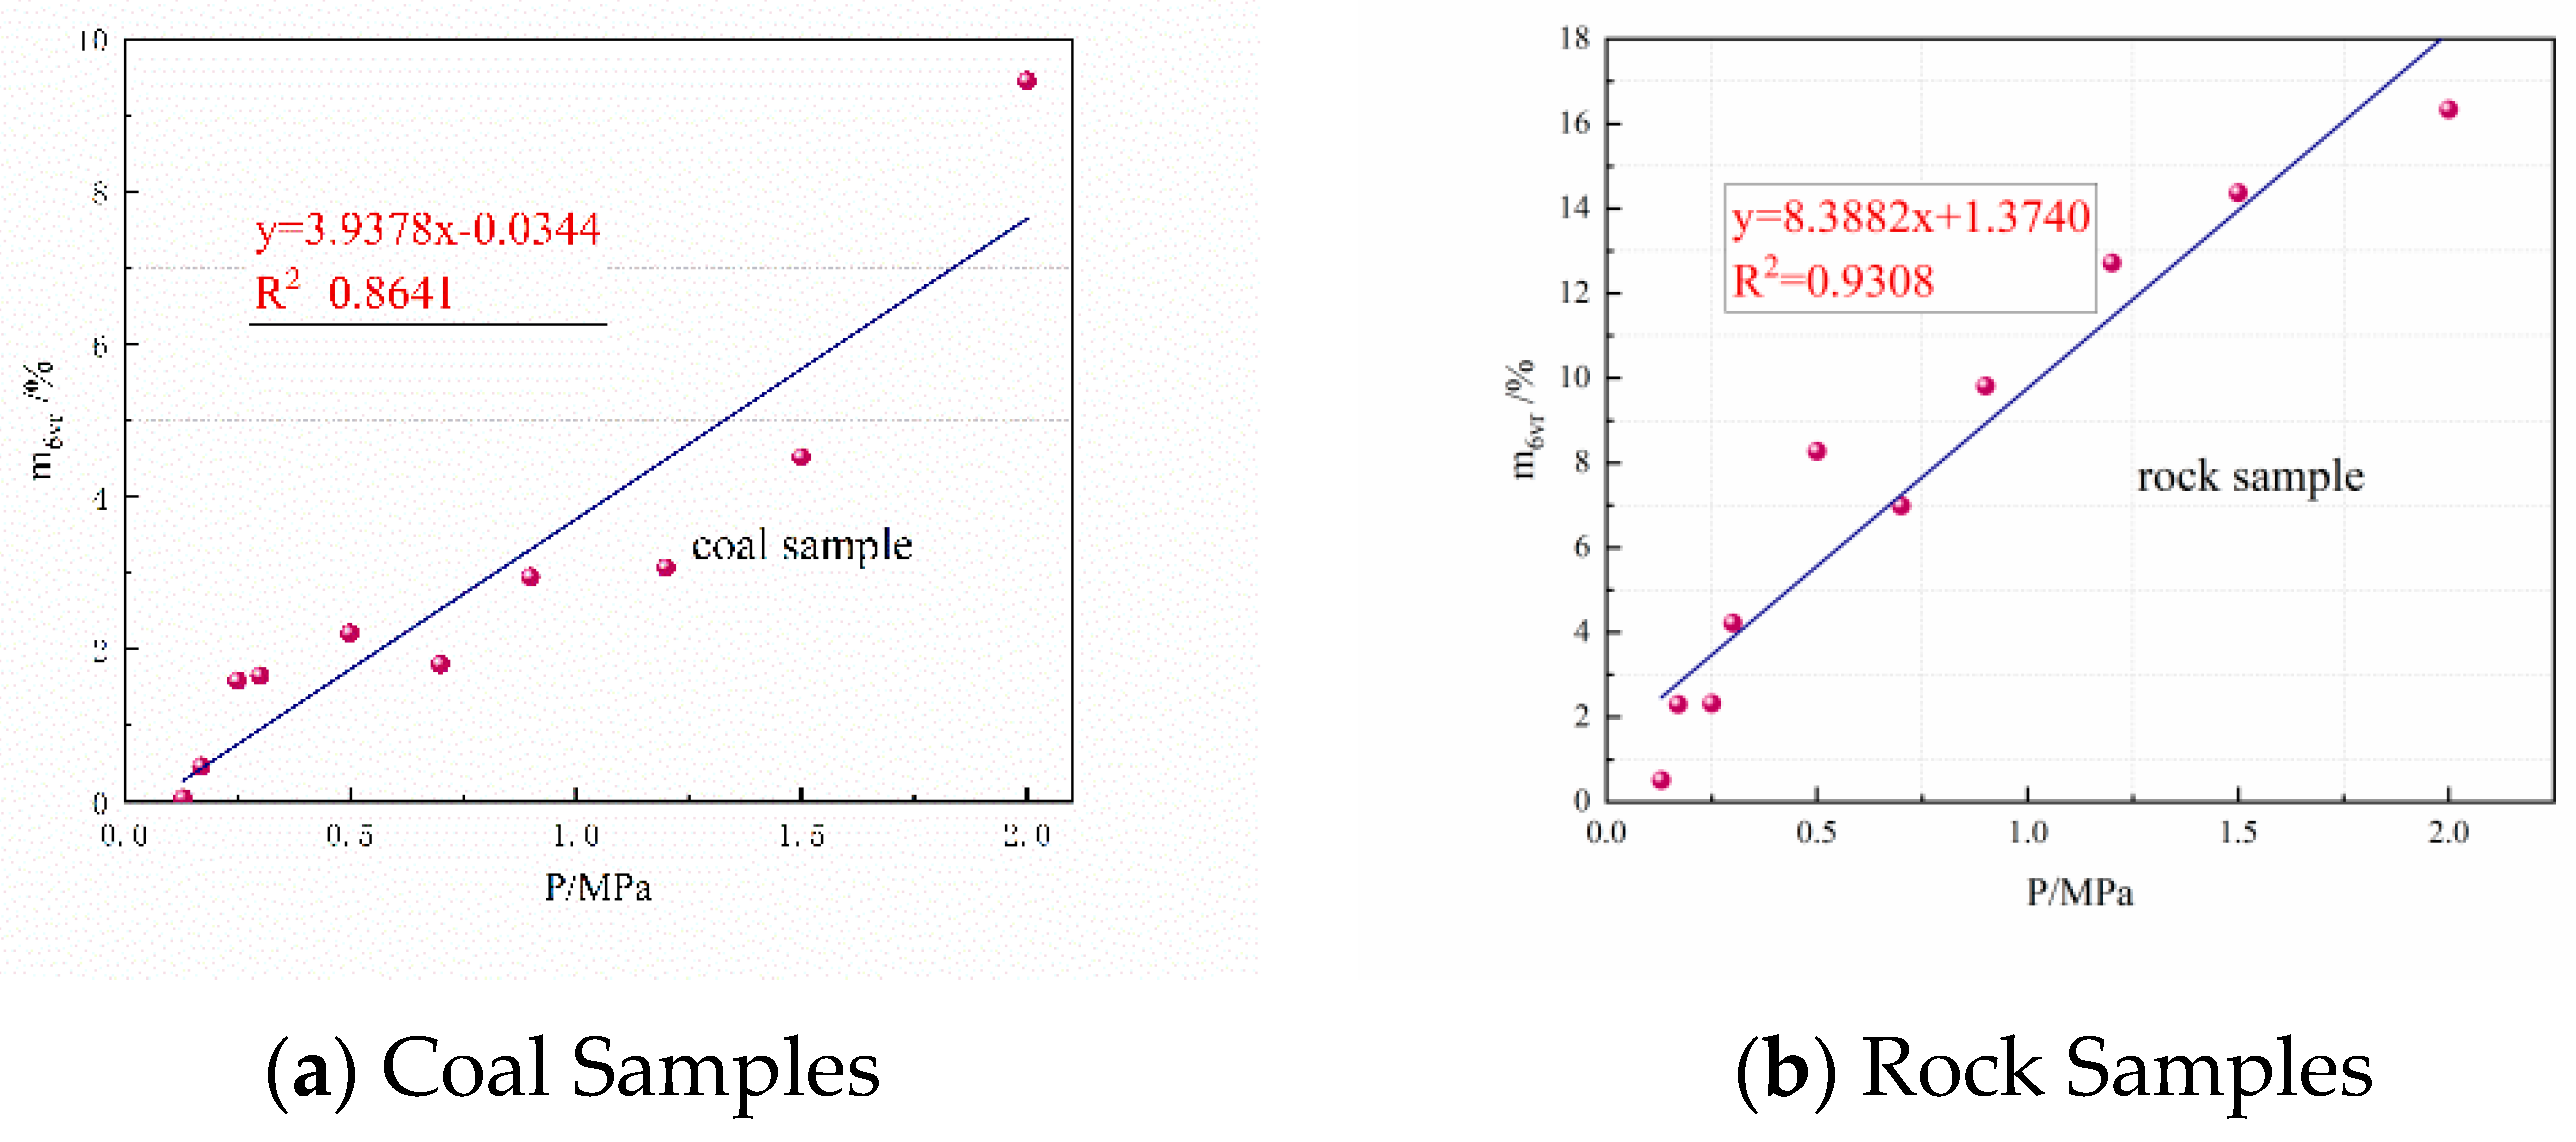
Based on the analysis of the indoor experimental results, the particle size distribution and mass percentage of different fragment sizes after sample fragmentation are significantly influenced by the loading pressure, with a trend in decreasing average particle size as the pressure increases. To analyze the effect of loading pressure on the mass percentage of blasting dust, a scatter plot was created with the mass percentage of blasting dust obtained from sieving measurements as the y-axis and the loading pressure as the x-axis, followed by a correlation analysis.
Since coal dust and rock dust are two different types of particles, to ensure the accuracy of the correlation analysis, the coal dust and rock dust were analyzed separately. The results are shown in Figure 8.
According to Figure 8, the correlation coefficient R2 for the coal layer is 0.8641, indicating a good positive correlation between the mass percentage of blasting dust and the impact pressure. For the rock layer, R2 is 0.9308, showing an even better positive correlation compared to the coal layer. Since the R2 values for both the coal and rock layers are close to 1, the fit is considered good. Based on linear regression analysis, the regression formulas for the impact pressure and mass percentage for coal and rock layers are as follows:
m 6 v c = 3.9378 P 0.23443
m 6 v r = 8.3882 P + 1.374
In the formula, m6vc is the mass percentage of blasting dust in the coal layer (%), m6vr is the mass percentage of blasting dust in the rock layer (%), and P is the impact pressure (MPa).

3.3. Calculation Formula for Blasting Dust Emission

According to the “Blasting Safety Regulations” [29] and the “Practical Handbook of Engineering Blasting” [30], the calculation formula for the shock wave during open-pit bench blasting is
P = η K ( Q 1 3 / R ) α
In the formula, α and K are empirical coefficients, 1.31 and 0.67, respectively; η is the attenuation index, determined to be 0.49 through actual tests; Q is the charge amount, kg; and R is the distance from a point in the coal seam to the center of the explosive, m.
After the explosion of the explosive, the stress wave acting on all points on the same spherical surface is the same. Therefore, the stress can be directly determined according to Formula (4). In Formula (4), R is a variable; different distances from the explosive center result in different actual impact loads. In indoor experiments, the explosive effect is simulated by a given impact pressure, so the variable in Formula (4) needs to be simplified. In indoor experiments, the R value can correspond to the radius of the experimental sample, equivalent to the distance from the explosive center to the edge of the fracture zone in single-hole blasting. However, the actual blasting process is not a simple single-hole blasting, but multi-hole blasting occurring simultaneously, with extremely complex interactions between the holes, which cannot be calculated. Therefore, the actual blasting process needs to be simplified, temporarily ignoring the interactions between the blast holes. The charge amount Q is the amount for a single hole; then, the distance R in single-hole blasting corresponds to the midpoint of the hole spacing and row spacing in actual drilling, and the load from a single hole is used to obtain the mass percentage of blasting dust, which is used to calculate the dust emission in the blast area.
Substituting the above formula into the regression formulas for the impact pressure and mass percentage of the coal–rock layers, the relationship between the mass percentage of blasting dust and the blasting parameters can be obtained. The dust emission is the total mass of the blast area multiplied by the mass percentage, which is substituted into the formula to receive
m m = ρ m V m 6 v c %
The formula for calculating the dust emission from coal seam blasting is derived as follows:
m m = ρ m V % ( 3.9378 η K ( Q 3 R ) α 0.2344 )
Similarly, the formula for calculating the dust emission from rock (sandstone) blasting is derived as follows:
m y = ρ y V % ( 8.3882 η K ( Q 3 R ) α + 1.374 )
In the formula, mm is the dust emission from coal seam blasting, kg; my is the dust emission from rock blasting, kg; ρm is the density of coal, kg/m3; ρy is the density of rock, kg/m3; V is the blast volume, m3; Q is the charge amount per hole, kg; R is the average hole spacing and row spacing, m; α and K are empirical coefficients, 1.31 and 0.67, respectively; and η is the attenuation index, determined to be 0.49 through actual tests.

4. Field Verification

4.1. Grading Image Recognition Analysis Method

Due to the large block size and distribution range of coal and rock fragments after blasting in field operations, the traditional sieving method used in indoor experiments is no longer applicable. In recent years, new grading methods based on image recognition have emerged, expanding the concept of traditional material size grading. These methods have improved the fields, precision, efficiency, intelligence, and environmental friendliness of grading. This paper uses an intelligent automatic grading system based on image recognition to grade the coal and rock fragments after blasting. This method can improve work efficiency and has many advantages over traditional manual sieving, such as uniform grading standards, reduced mechanical noise and energy consumption, and the provision of various classification index statistics.

4.1.1. Image Analysis Method

The intelligent automatic grading system for the distribution of coal and rock fragments after blasting is programmed using MATLAB software. MATLAB’s image processing toolbox contains various image processing functions that can be conveniently used for digital image processing. The post-blast image processing method is as follows:
(1)
Image import: Use the imread function to import the live image into matlab.
(2)
Image enhancement: imadjust is used to enhance the gray level of the image. The histeq function equalizes the image histogram and uses medfilt2 to median the image to remove noise and black spots in the image.
(3)
Determining the rock mass interface: Using the gradient magnitude as the segmentation function, the Sobel edge concealment, the Imfilter function, and some simple algorithms are used to calculate the gradient magnitude.
(4)
Image binarization: Separate the rock blocks in the image by using the rock boundary line obtained above, then transform the gray image into a binarized image by using the im2bw function, and the bwareaopen function is used to remove the small rocks and flaws in the graph.
(5)
Setting of the reference object: A helmet with a diameter of 0.2 m is placed in the image for calibrating the size of the rock in the image.
(6)
Rock block identification: The connected area in the image is identified by the bwconncomp function, and the identified image is as shown below. The block marked by the red hexagonal star is a helmet.
(7)
Block grading: Firstly, the regionprops function is used to calculate the properties of the connected regions, and then the bar function is used to classify the coal briquettes.

4.1.2. Analysis Area and Plan

The coal seam at the Haerwusu open-pit coal mine is mined using a loosening blasting method. The blasting design of the mine area remains basically unchanged, with the blasting hole depth, number of holes, and amount of explosives adjusted according to production tasks.
(1)
Determination and Division of the Analysis Area
The observation area for the coal seam fragmentation distribution in this blasting test is 6 South Coal. The overall blasting area is 345 m long and 45 m wide, with a bench height of 8 m and a blasting volume of 115,200 m3. The amount of explosives used is 24.3 tons. The overall condition of the blasting area is shown in Table 2. According to the blasting design plan, the drilling and blasting method and the parameters of the blasting materials are shown in Table 3 and Table 4. The key parameters include the following: hole depth of 9 m, hole spacing of 8 m, row spacing of 6 m, and 300 holes. The blast area charging structure and wiring diagram is shown in Figure 9. Figure 10 shows the site condition after the coal seam blasting, indicating a relatively flat bench surface and uneven coal block sizes after blasting.
(2)
Analysis Method and Steps
In the length direction of the blasting area, blast holes are arranged at equal intervals. If the coal quality is uniform throughout the blasting area, the coal and rock fragmentation characteristics and block size distribution between adjacent holes should be similar. Therefore, this paper selects the area between any two groups of adjacent blast holes in the middle for fragmentation analysis. The specific steps of the experimental plan are as follows:
(1)
Uniform Division within the 8 m Hole Spacing: The area is evenly divided into 12 equally spaced image acquisition zones.
(2)
Image Acquisition: Each zone is photographed using a digital camera, ensuring that the camera lens is aligned consistently with the area being imaged.
(3)
Feature Recognition Using MATLAB: The captured images are processed using MATLAB software for feature recognition. The size of a reference object is used as a standard to obtain the fragmentation distribution characteristics within the photographed range.
(4)
Comparison and Secondary Feature Recognition: The processed images are compared with the original images. Any unclear sections undergo secondary feature recognition to obtain the fragmentation distribution characteristics of those parts.
(5)
Comprehensive Analysis: The results of the initial and secondary recognitions are combined to obtain the fragmentation distribution characteristics of the entire image acquisition area.

4.2. Field Verification Analysis Results

(1)
Image Recognition of the Blasted Pile Fragmentation
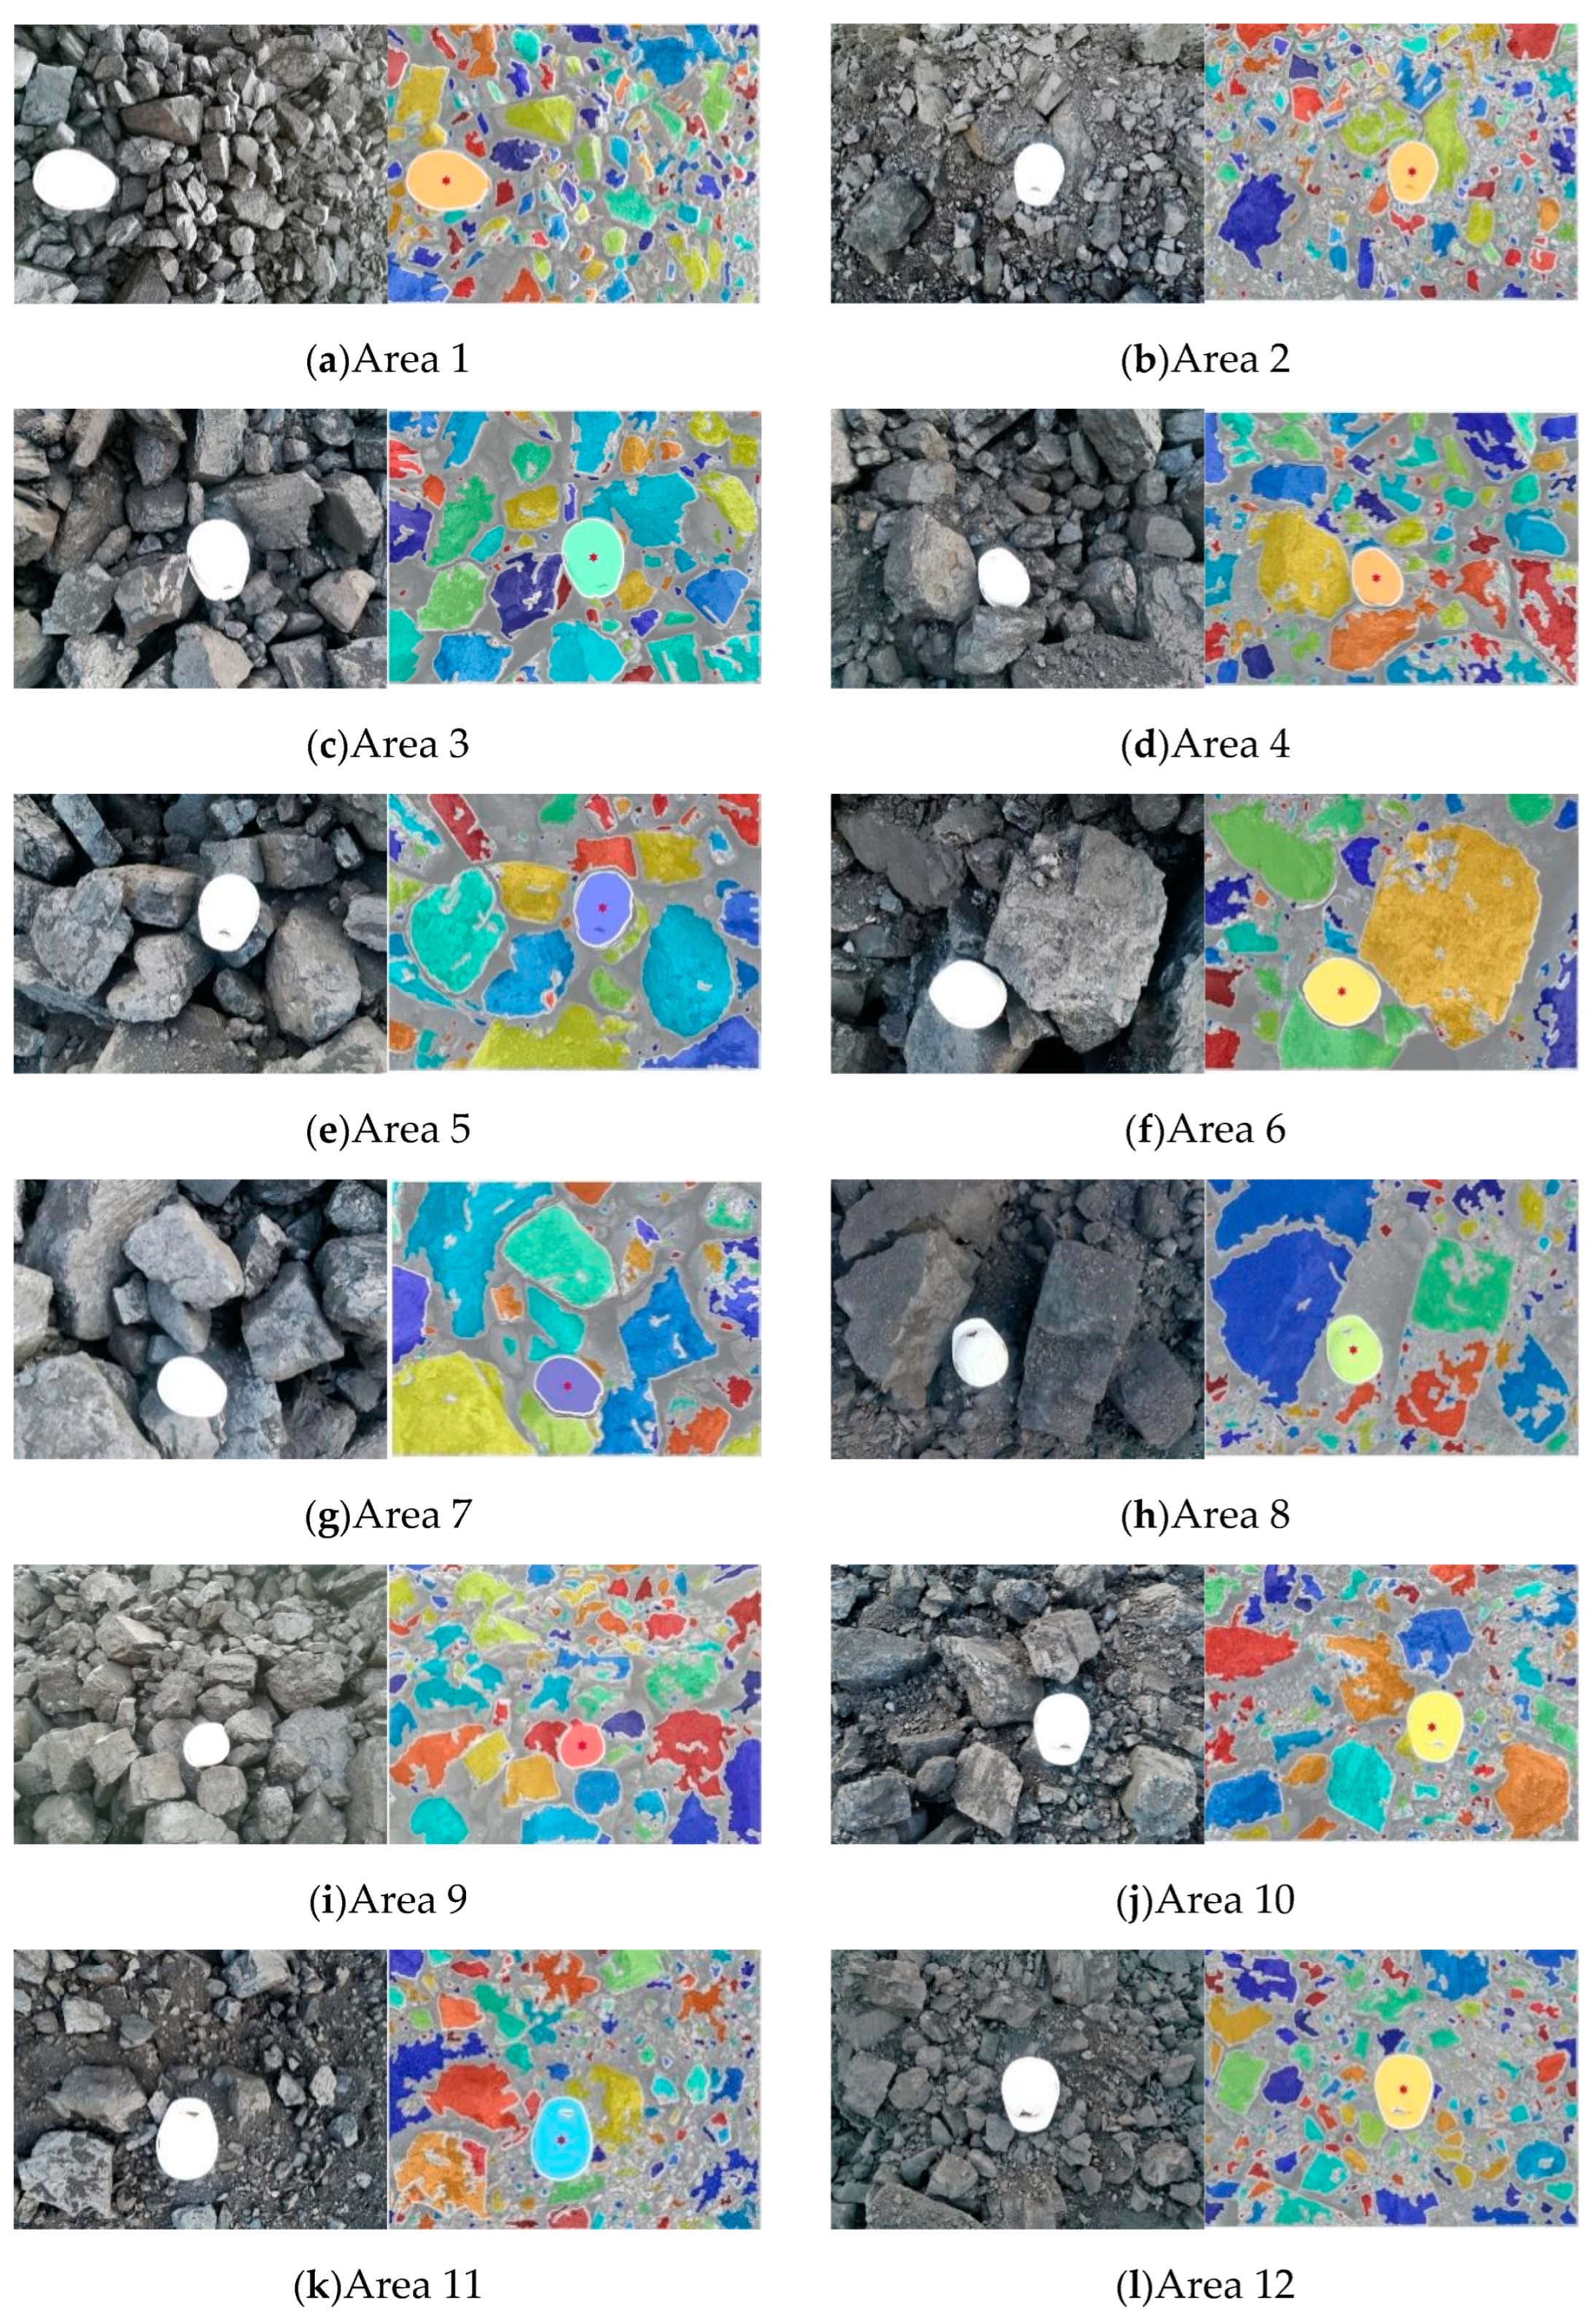
Based on digital image recognition methods, the fragmentation distribution characteristics of coal and rock in the blasting areas between holes were identified, as shown in Figure 11. The technique allows for accurate identification of the surface sizes of coal fragments in the captured images, using a hard hat as a reference object, and marks different sizes with various colors.
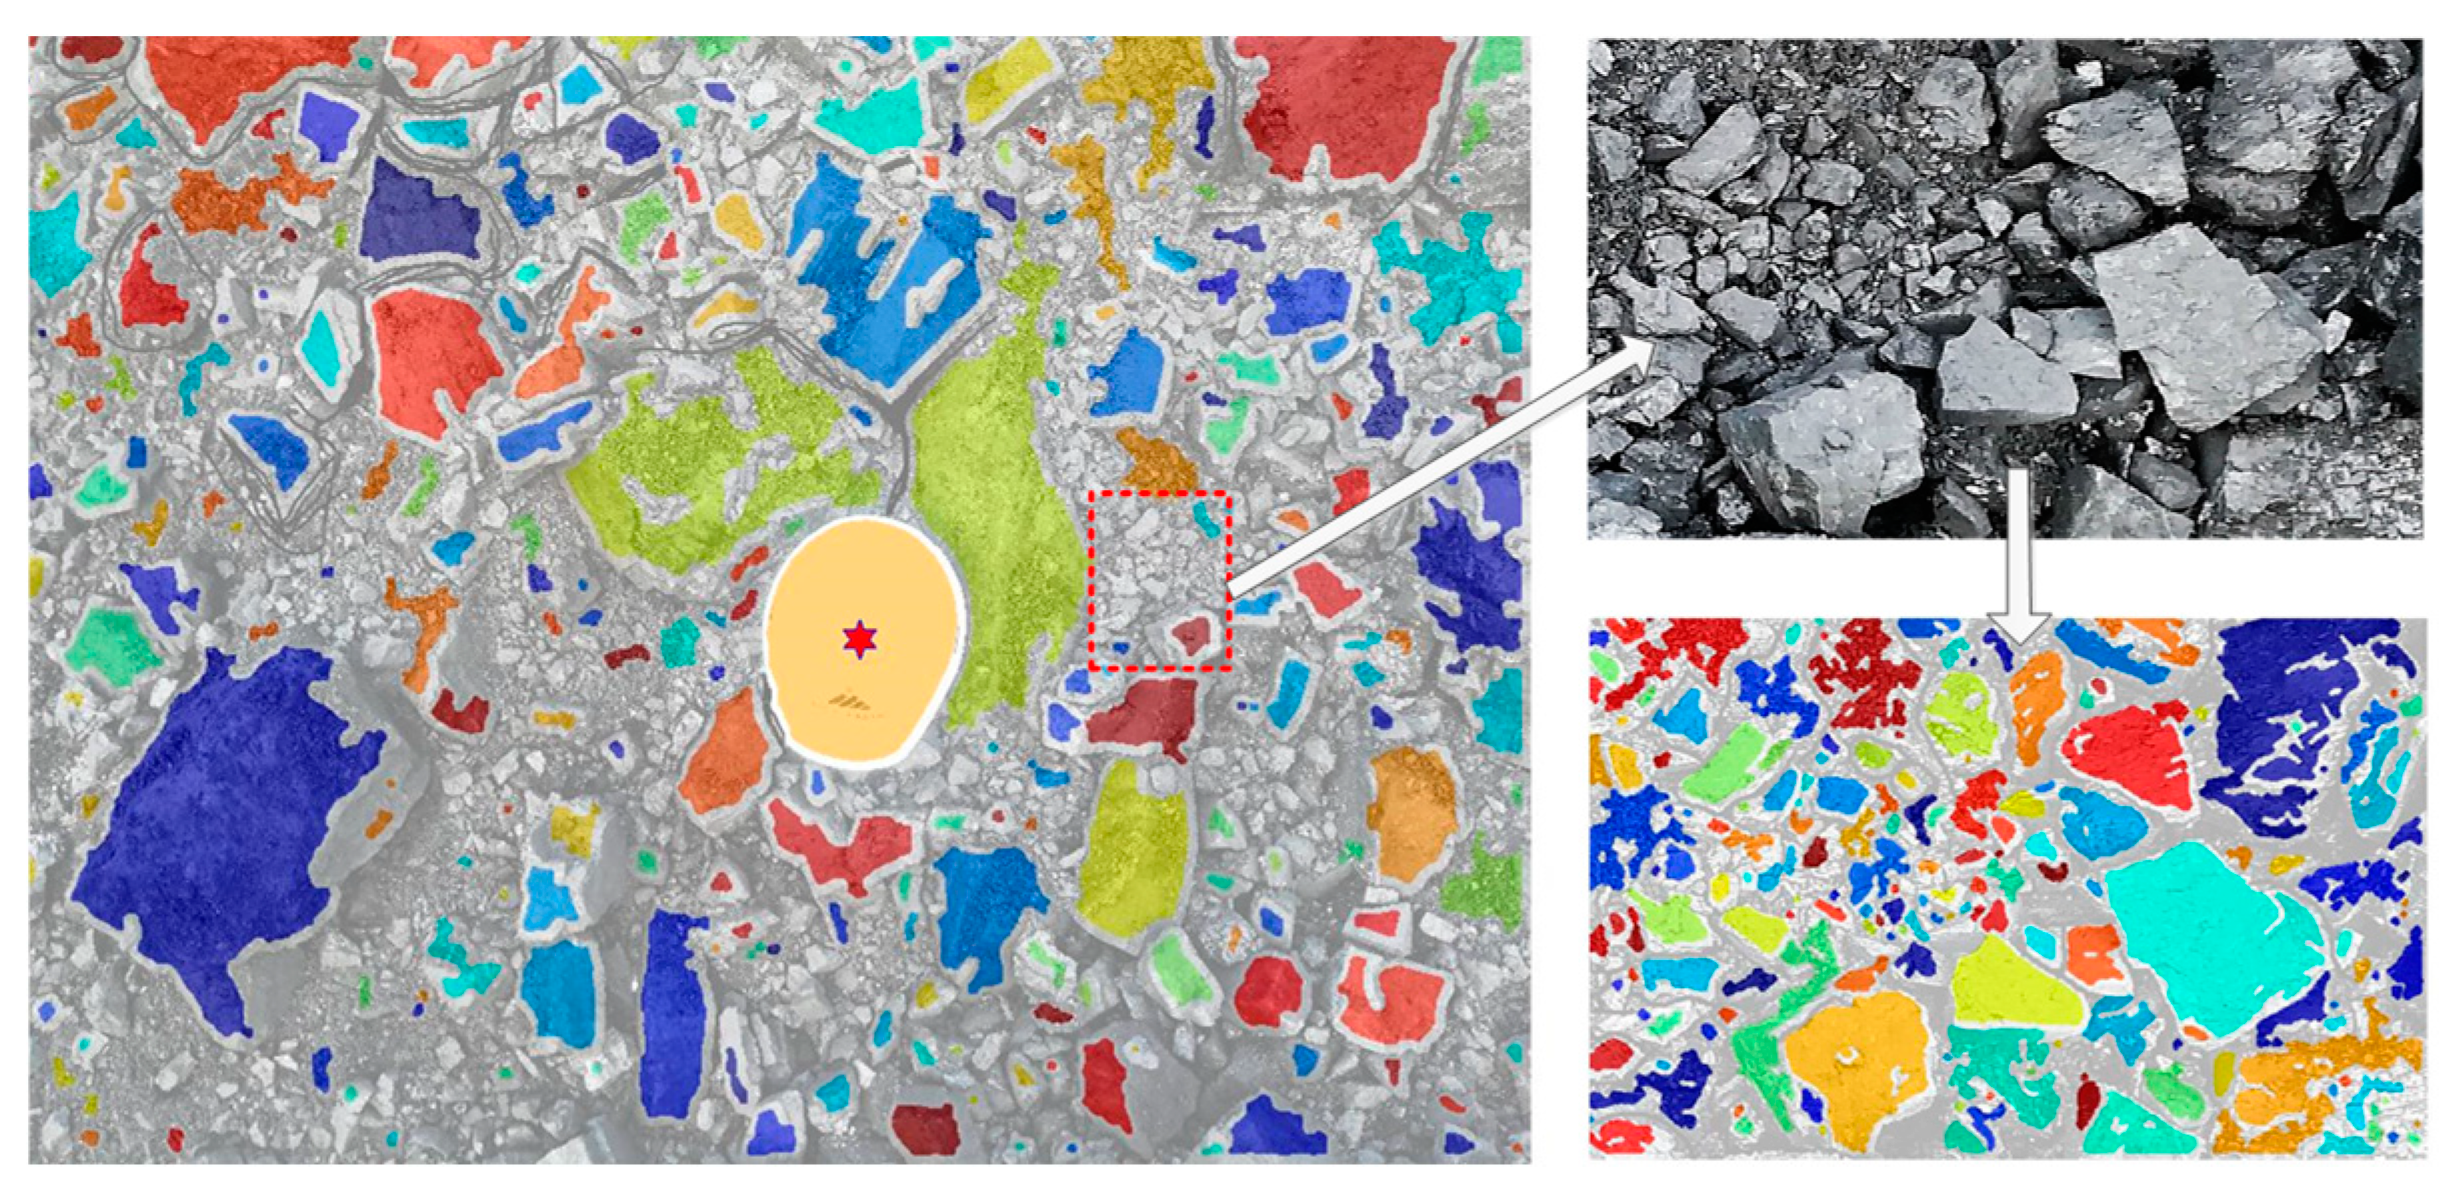
The fragmentation image recognition set five grading levels: 0.0–1 mm, 1–50 mm, 50–200 mm, 200–300 mm, and greater than 300 mm. From the identified images in Figure 11, many local gray areas can be seen, representing the smallest coal fragments within the 0–1 mm size range. However, after comparing with the original image, it was found that many gray areas do not exclusively represent coal fragments within the 0–1 mm range. This discrepancy is mainly due to image resolution and errors in detail recognition during the identification process. Therefore, secondary recognition was performed on areas with identification bias, as shown in Figure 12.
By enlarging the local areas of the images, a rich fragmentation distribution can be observed. Through secondary recognition, the global image processing deviations can be effectively corrected. Figure 12 shows the secondary recognition of some details. In the actual analysis process, the details of each set of images were subjected to secondary recognition corrections.
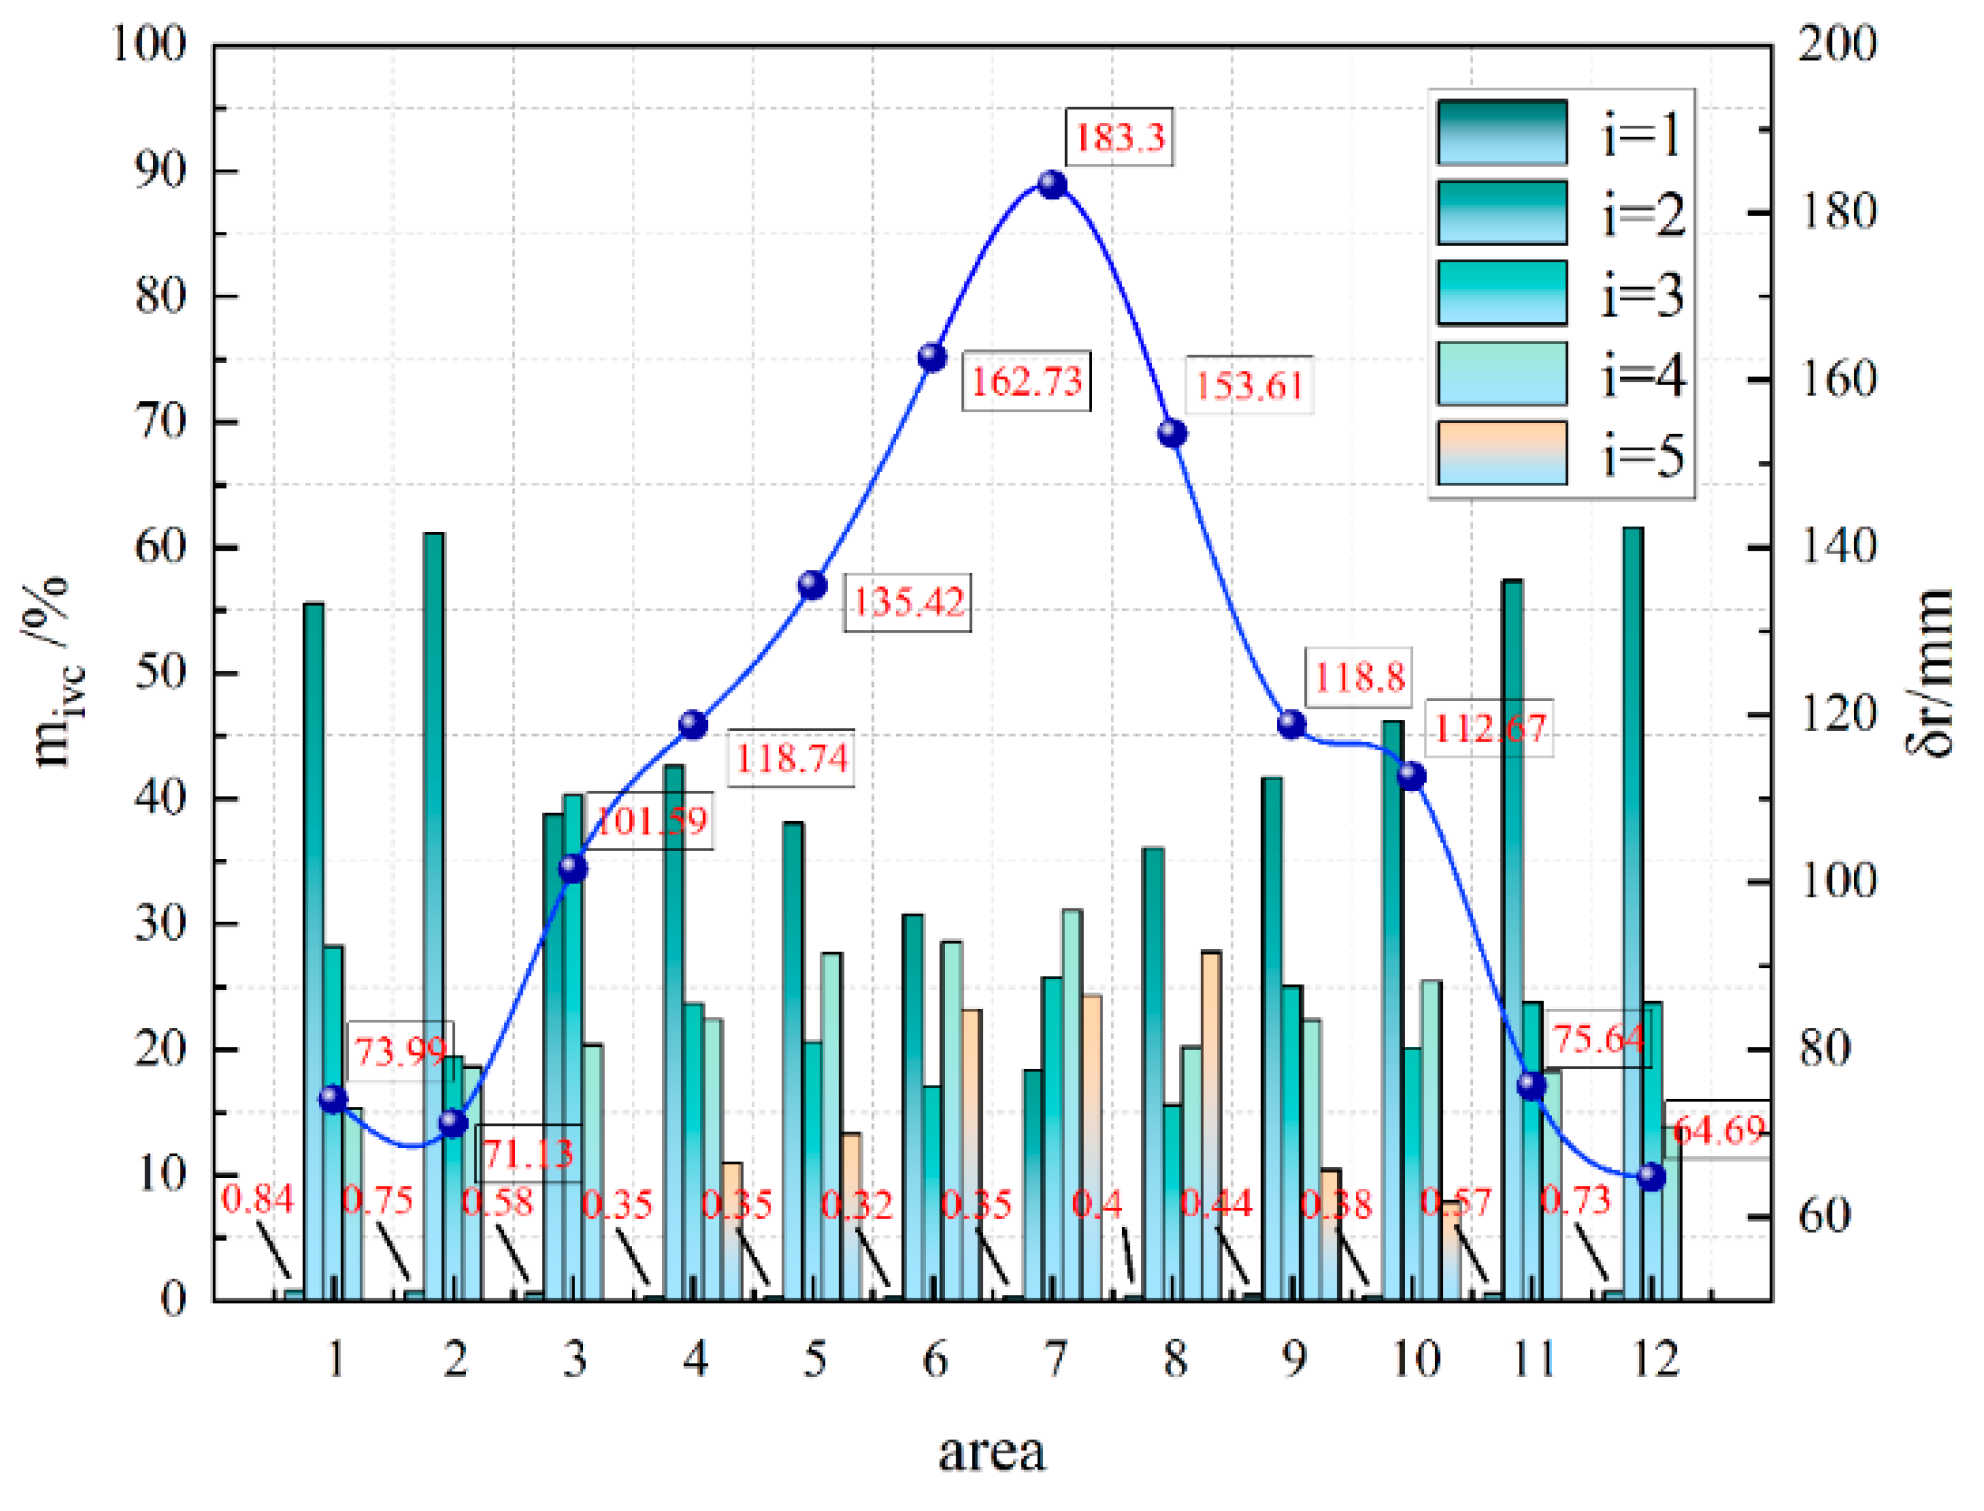
According to the division method of each area described in the previous sections, it can be determined that the smaller the area number, the closer the area is to blast hole 1. As the area number increases, the observation area gradually approaches blast hole 2. Observation areas 6 and 7 are the midpoints between the two groups of blast holes, i.e., the furthest observation areas from the blast holes. From Figure 13, it can be observed that as the distance from the blast hole increases, the proportion of large fragments first increases and then decreases, while the proportion of small fragments first decreases and then increases. The average fragment size δ also shows a trend of first increasing and then decreasing. Therefore, it can be concluded that the areas closer to the blast holes have more severe coal–rock damage and smaller fragment sizes, while the areas further from the blast holes have larger coal–rock fragments. According to the statistical results in Table 5, when i = 1, the average mass percentage of the twelve areas is 0.505. Based on experimental calculations, the coal density is 1498 kg/m3. Thus, the dust emission from the entire blast area can be calculated as follows:
m m = ρ m V m 6 v c % = 1498 × 115200 × 0.505 × % = 871476 kg
Using the dust emission calculation formula proposed in this paper, the calculated dust emission from blasting is
m m = 1498 × 115200 × % × ( 3.9378 × 0.49 × 0.67 × ( 24.3 × 1000 300 3 7 ) 1.31 0.2344 = 783403   kg  
The comparison of the calculation results shows that the calculated dust emission is 783,403 kg, equivalent to a dust production per unit volume of 6.80 kg/m3. The statistical results show a dust emission of about 871,476 kg, equivalent to a dust production per unit volume of 7.56 kg/m3, with an error rate of approximately 10%. Using the same method for rock layer experiments, the dust emission per unit volume is 7.24 kg/m3, with an error rate of about 7%, indicating that the calculation results align well with the actual results. The analysis suggests that the larger dust emission observed in the statistical results is due to the limited accuracy of image recognition, which may misclassify some coal fragments larger than 1 mm as blasting dust, leading to some errors. However, the comparison shows that the calculation formula results are close to the statistical results, providing a certain reference value. Currently, there are no fully accurate instruments available to measure dust emissions during blasting in open-pit bench blasting projects. Therefore, using this formula for estimation can provide some reference for dust suppression work in actual blasting operations.

5. Conclusions

This study focuses on blasting dust at the Haerwusu open-pit coal mine, addressing the calculation of dust emissions during open-pit bench blasting. By integrating indoor experiments, theoretical analysis, and field experiments, the indoor impact load was converted to the shock wave in field blasting operations. Based on this, a formula for calculating dust emissions from open-pit bench blasting was established. The actual dust emissions were obtained through image recognition of the blasted piles in field experiments and compared with the calculated results. The specific findings are as follows:
(1)
Indoor Hopkinson Bar Experiments: Multiple indoor Hopkinson Bar experiments were conducted to simulate the blasting process, studying the fragmentation distribution patterns. As the impact pressure increased from 0.13 MPa to 2.00 MPa, the fragmentation of coal–rock samples intensified. The proportion of large fragments decreased, while the proportion of smaller fragments and powdered coal–rock samples increased, indicating a strong correlation between fragmentation size and impact pressure.
(2)
Correlation Analysis of Dust Mass Percentage and Loading Pressure: The mass percentage of blasting dust obtained from sieving measurements was correlated with the loading pressure. The results showed a good positive correlation for coal layers with R2 = 0.8641 and an even better correlation for rock layers with R2 = 0.9308. This positive correlation suggests that a formula for calculating dust emissions can be established.
(3)
Calculation Formula for Dust Emissions: Based on the Hopkinson Bar experiments and the shock wave calculation formula for open-pit bench blasting, a calculation formula for dust emissions was established. Image analysis of the blasting site was performed, and the actual fragmentation distribution was obtained through secondary recognition. The mass percentage of dust was used as the actual dust emission and compared with the formula’s calculated results, showing an error of less than 10%. The establishment of this formula can effectively guide the dust reduction operation by adjusting the blasting parameters and combining water seal blasting and other dust reduction processes to reduce the generation of dust, safeguard the health of the operators, and optimize the environment of the mining area, which has the value of popularization and the prospect of engineering applications.
Additionally, the formula established in this study is based on the coal–rock characteristics and blasting design parameters of the Haerwusu open-pit coal mine. For different mines with varying coal–rock characteristics and blasting design parameters, the formula needs to be adjusted according to the actual conditions.

Author Contributions

Conceptualization, S.D.; methodology, X.D.; validation, X.L.; formal analysis, Z.L.; investigation, Z.L.; resources, H.C.; data curation, H.C.; writing—original draft preparation, X.D. and Z.L.; writing—review and editing, S.D. and X.L.; visualization, Z.L. All authors have read and agreed to the published version of the manuscript.

Funding

This work was funded by the National Natural Science Foundation of China (no. 52174131) and the Fundamental Research Funds for the Nation Key R&D Program of China (2023YFC2907305).

Data Availability Statement

The data presented in this study are available on request from the corresponding author due to the confidentiality of production data related to the test site, the Haerwusu open-pit coal mine.

Acknowledgments

The authors thank the Haerwusu open-pit coal mine for providing a research base for this paper.

Conflicts of Interest

Authors Shanzhou Du and Hao Chen were employed by the China Energy Zhungeer Energy Co., Ltd. The remaining authors declare that the research was conducted in the absence of any commercial or financial relationships that could be construed as a potential conflict of interest.

References

  1. Chang, P.; Chen, Y.; Xu, G.; Huang, J.; Ghosh, A.; Liu, W.V. Numerical study of coal dust behaviours and experimental investigation on coal dust suppression efficiency of surfactant solution by using wind tunnel tests. Energy Sources Part A Recovery Util. Environ. Eff. 2021, 43, 2173–2188. [Google Scholar]
  2. Entwistle, J.A.; Hursthouse, A.S.; Reis, P.A.M.; Stewart, A.G. Metalliferous Mine Dust: Human Health Impacts and the Potential Determinants of Disease in Mining Communities. Curr. Pollut. Rep. 2019, 5, 67–83. [Google Scholar] [CrossRef]
  3. Mandal, K.; Council of Scientific and Industrial Research; Kumar, A.; Tripathi, N.; Singh, R.S.; Chaulya, S.K.; Mishra, P.K.; Bandyopadhyay, L.K. Characterization of different road dusts in opencast coal mining areas of India. Environ. Monit. Assess. 2012, 184, 3427–3441. [Google Scholar] [CrossRef]
  4. Kayet, N.; Pathak, K.; Chakrabarty, A.; Kumar, S.; Chowdary, V.; Singh, C.; Sahoo, S.; Basumatary, S. Assessment of foliar dust using Hyperion and Landsat satellite imagery for mine environmental monitoring in an open cast iron ore mining areas. J. Clean. Prod. 2019, 218, 993–1006. [Google Scholar] [CrossRef]
  5. Cui, K.; Shen, F.; Han, B.; Yuan, J.; Suo, X.; Qin, T.; Liu, H.; Chen, J. Comparison of the Cumulative Incidence Rates of Coal Workers’ Pneumoconiosis between 1970 and 2013 among Four State-Owned Colliery Groups in China. Int. J. Environ. Res. Public Health 2015, 12, 7444–7456. [Google Scholar] [CrossRef] [PubMed]
  6. Zhang, X.; Li, H. The Calculation and Analysis of the Dust Discharge Amount of Open-pit Blasting. Met. Mine 1996, 3, 41–44. [Google Scholar]
  7. Yao, G. Study on Quantifiable Visualization of Blasting Dust Based on Gaussian Diffusion Model. J. China Railw. Soc. 2022, 44, 153–159. [Google Scholar]
  8. Liu, J.; Li, Z.; Bai, H.; Zhang, Z.; Cao, T.; Chen, Z. Research on Influence Factors of Blasting Dust Emission of Open-pit Mine. Blasting 2017, 34, 169–174. [Google Scholar]
  9. Li, C.W.; Wang, Q.F.; Lyu, P.Y. Study on electromagnetic radiation and mechanical characteristics of coal during an SHPB test. J. Geophys. Eng. 2016, 13, 391–398. [Google Scholar]
  10. Beijing, X.; Zheng, Y. Dynamic mechanical constitutive model of combined coal-rock mass based on overlay model. J. China Coal Soc. 2019, 44, 463–472. [Google Scholar]
  11. Zhao, Y.; Zhao, G.-F.; Jiang, Y.; Elsworth, D.; Huang, Y. Effects of bedding on the dynamic indirect tensile strength of coal: Laboratory experiments and numerical simulation. Int. J. Coal Geol. 2014, 132, 81–93. [Google Scholar] [CrossRef]
  12. Di, H.; Xiangguo, K.; Shugang, L.; Haifei, L.; Pengfei, J.; Daiyu, D.; Quanle, Z. Study on dynamics characteristics and energy dissipation law of coal fracture instability under impact load disturbance. Coal Sci. Technol. 2024, 1–13. [Google Scholar]
  13. Gao, W.-J.; Shan, R.; Zhu, Y. Determining quasi-static fracture toughness of anthracite using short rod specimen. Chin. J. Rock Mech. Eng. 2006, 25, 3919–3926. [Google Scholar]
  14. Gao, W.J.; Chan, R.L. Failure pattern and strength properties of anthracite under impact loading. J. China Coal Soc. 2012, 37, 13–18. [Google Scholar]
  15. Gao, W.; Shan, R.; Su, Y. Theoretical research on dynamic strength of anthracite under uniaxial impact. Explos. Shock. Waves 2013, 33, 297–302. [Google Scholar]
  16. Li, C.-W.; Wang, J.-G.; Jie, B.-J.; Sun, Y.-F. Numerical simulation of SHPB tests for coal by using HJC model. J. Min. Saf. Eng. 2016, 33, 158–164. [Google Scholar]
  17. Liu, S.H. Nonlinear catastrophy model and chaotic dynamic mechanism of compound coal-rock unstable failure under coupled static-dynamic loading. J. China Coal Soc. 2014, 39, 292–300. [Google Scholar]
  18. Liu, S.H.; Mao, D.B.; Ji, Q.X.; Li, F.M. Under static loading stress wave propagation mechanism and energy dissipation in compound coal-rock. J. China Coal Soc. 2014, 39, 15–22. [Google Scholar]
  19. Zhenhua, J.; Yaodong, J.; Yixin, Z.; Bin, L.; Qiupeng, Y.; Zujun, Z. Energy dissipation and damage characteristies of latera-restraint coalunder impact load. J. China Univ. Min. Technol. 2023, 52, 492–501. [Google Scholar]
  20. Wang, L.; Yuan, Q.; Xie, G.; Gu, S.; Jiao, Z.; Liu, H.; Chen, L. Length-diameter ratio effect of energy dissipation and fractals of coal samples under impact loaxling. J. China Coal Soc. 2022, 47, 1534–1546. [Google Scholar]
  21. Wang, L.L.; Ren, H.Q.; Yu, J.L.; Zhou, F.H.; Wu, X.Y.; Tang, Z.P.; Hu, S.; Yang, L.; Dong, X.L. Development and application of the theory of nonlinear stress wave propagation. Chin. J. Solid Mech. 2013, 34, 217–240. [Google Scholar]
  22. Dai, R.; Gong, Q.; Zhou, S.; Zhou, G. Processing model and application of sand and gravel of earth pressure balance shield. China Civ. Eng. J. 2010, 43, 292–298. [Google Scholar]
  23. Dai, R.P.; Guo, X.B.; Gong, Q.M.; Pu, C.J.; Zhang, Z.C. SHPB test on blasting damage protection of tunnel surrounding rock. Rock Soil Mech. 2011, 32, 77–83. [Google Scholar]
  24. Zhang, Z.C.; Wang, C.D. Study on notching angle in notching blast. Explos. Shock. Waves 1990, 233–238. [Google Scholar]
  25. Yin, J.; Lei, J.; Fan, K.; Wang, S. Integrating image processing and deep learning for effective analysis and classification of dust pollution in mining processes. Int. J. Coal Sci. Technol. 2023, 10, 17–33. [Google Scholar] [CrossRef]
  26. Luan, B.; Zhou, W.; Jiskani, I.M.; Wang, Z. An Improved Machine Learning Approach for Optimizing Dust Concentration Estimation in Open-Pit Mines. Int. J. Environ. Res. Public Health 2023, 20, 1353. [Google Scholar] [CrossRef] [PubMed]
  27. Li, L.; Zhang, R.; Sun, J.; He, Q.; Kong, L.; Liu, X. Monitoring and prediction of dust concentration in an open-pit mine using a deep-learning algorithm. J. Environ. Health Sci. Eng. 2021, 19, 401–414. [Google Scholar] [CrossRef]
  28. Wang, C.; Chang, L.; Zhao, L.; Niu, R. Automatic Identification and Dynamic Monitoring of Open-Pit Mines Based on Improved Mask R-CNN and Transfer Learning. Remote Sens. 2020, 12, 3474. [Google Scholar] [CrossRef]
  29. GB 6722-2014; Safety Regulations for Blasting. National Standards of the People’s Republic of China. General Administration of Quality Supervision, Inspection and Quarantine of the People’s Republic of China: Beijing, China, 2014.
  30. Liu, D.Z.; Yang, S.C. Practical Manual for Engineering Blasting; Metallurgical Industry Press: Beijing, China, 2003. [Google Scholar]
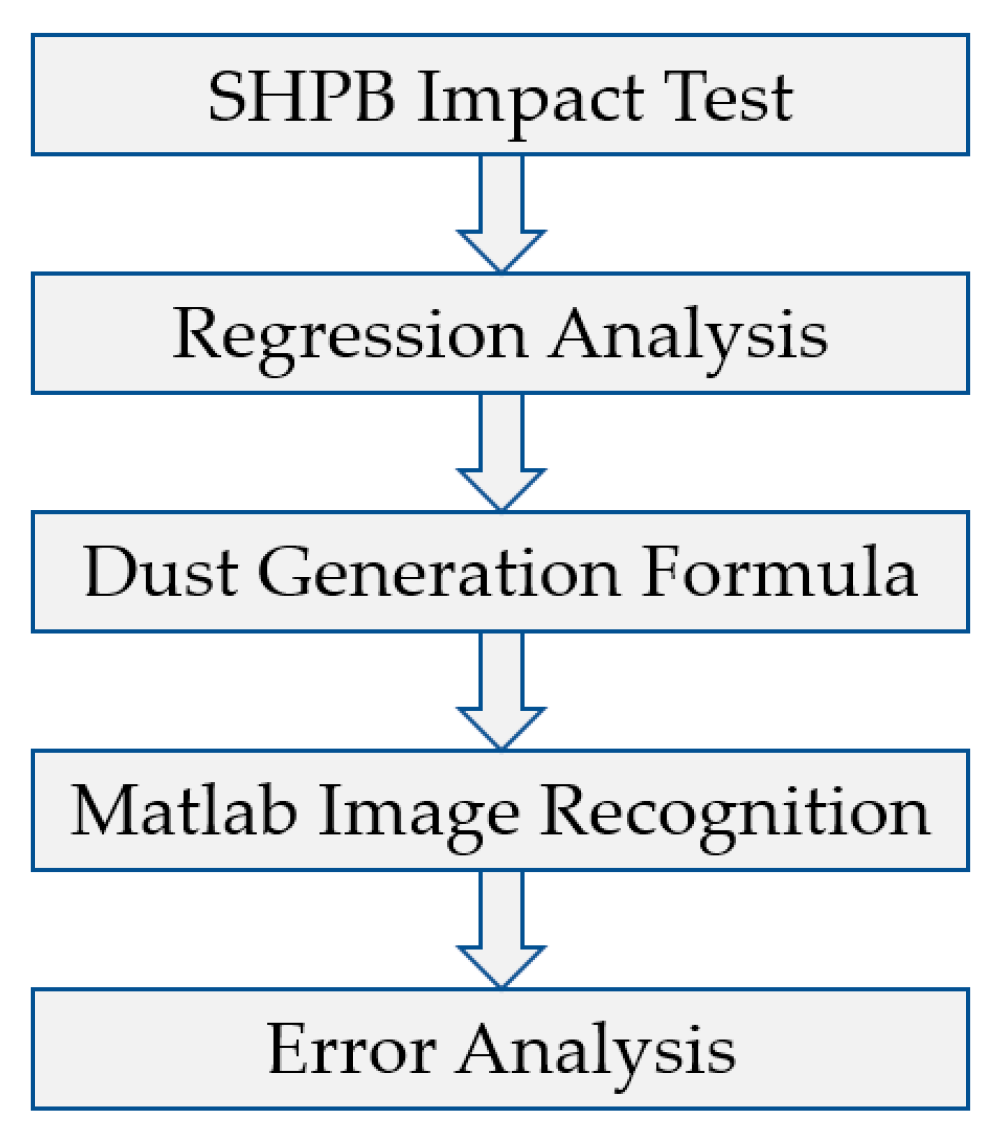
Figure 1. Research flowchart.
Atmosphere 15 01118 g001
Figure 2. Partially processed coal and rock samples. Subfigure (a) shows the prepared coal sample. Subfigure (b) shows a prepared rock sample.
Atmosphere 15 01118 g002
Figure 3. Test equipment and specimen loading method. Subfigure (a) shows the SHPB experimental system and subfigure (b) shows the specimen loading method.
Atmosphere 15 01118 g003
Figure 4. Particle size grading sieve for fragments after impact damage.
Atmosphere 15 01118 g004
Figure 5. Characteristics of sieved rock fragments under different pressures.
Atmosphere 15 01118 g005
Figure 6. Variation of rock sample particle size distribution and average particle size with impact pressure.
Atmosphere 15 01118 g006
Figure 7. Variation of coal sample particle size distribution and average particle size with impact pressure.
Atmosphere 15 01118 g007
Figure 8. Relationship between blasting dust mass percentage and impact pressure. Subfigure (a) shows the coal dust mass fraction versus impact air pressure, and subfigure (b) shows the rock dust mass fraction versus impact air pressure.
Atmosphere 15 01118 g008
Figure 9. Blast area charging structure and wiring diagram. Subfigure (a) shows the blast area charging structure, and subfigure (b) shows the wiring diagram.
Atmosphere 15 01118 g009
Figure 10. Coal seam blasting site.
Atmosphere 15 01118 g010
Figure 11. Image recognition characteristics of fragmentation distribution in different areas between holes.
Atmosphere 15 01118 g011
Figure 12. Secondary recognition of fragmentation distribution in detailed areas.
Atmosphere 15 01118 g012
Figure 13. The Pattern of Change of Block Size Distribution and the Average Size of Coal Block in Coal Rock Blasting.
Atmosphere 15 01118 g013
Table 1. Fragmentation size distribution characteristics of rock samples under different pressures.
P/MPaMr/gmivr/%δr/mm
i = 1i = 2i = 3i = 4i = 5i = 6
0.13337.5397.320.380.090.870.830.5231.73
0.17339.9384.213.086.472.881.052.3128.37
0.25339.3375.748.699.162.741.352.3326.52
0.30352.9865.097.3717.404.001.904.2323.57
0.50344.0456.188.3714.418.424.348.2820.79
0.70343.4753.9812.9815.197.403.476.9920.65
0.90316.0246.116.0721.5611.175.289.8217.88
1.20314.6140.1111.8017.8511.076.4512.7216.40
1.50337.0239.288.9917.5312.247.5914.3715.82
2.00334.7128.9111.7822.4612.098.4216.3413.18
Table 2. Blast area overview.
Blast Area LocationBackup Electric ShovelRock TypeBlast Area Length (m)Blast Area Width (m)Bench Height (m)Blast Volume (m3)Explosive Quantity (t)
6 South of coal seamHydraulic BackhoeCoal345458115,20024.3
Table 3. Blasting hole layout and perforation parameters.
Drilling RigAperture (mm)Hole LayoutHole Spacing (m)Row Spacing (m)Hole Edge Margin (m)Explosive Consumption (kg/m3)Hole Depth (m)Number of Holes
302#200triangles864~4.50.2119300
(1) Hole Layout: Holes are laid out from south to north with a spacing of 8 m and a row spacing of 6 m.
(2) Drilling: Drilling is carried out from south to north, penetrating the rock by 1 m, with a drilling angle of 90°.
(3) Bottom Protection Measures: Avoiding slag pressure blasting, appropriately increasing the penetration depth.
(4) Note: Blast hole numbering starts from the first hole at the north end of the blast area, for example, the first hole at the northern end of the first row is labeled as A1, and the first hole at the northern end of the second row is labeled as B1.
Table 4. Blast area explosive parameters with 3 m ammonium oil explosives.
42 ms Surface PipeDetonating Cord (m)Delay Detonator (Artillery)Emulsion Explosive Type 2 (kg)Instantaneous Detonator (Artillery)
5700201805
Table 5. Mass percentage of each area with i = 1.
Area123456789101112Average
mvi/%0.840.750.580.350.350.320.350.40.440.380.570.730.505
Disclaimer/Publisher’s Note: The statements, opinions and data contained in all publications are solely those of the individual author(s) and contributor(s) and not of MDPI and/or the editor(s). MDPI and/or the editor(s) disclaim responsibility for any injury to people or property resulting from any ideas, methods, instructions or products referred to in the content.