1. Introduction
Because Japan is affected by the activities of four underlying geologic plates, many earthquakes with serious damage have occurred so far. In recorded history from AD 599 to 2012, a total of 872 damaging earthquakes have been compiled, along with related documents [
1]. A huge number of documents on historical earthquakes have also been compiled by the Earthquake Research Institute of the University of Tokyo, totaling 33 volumes and 27,000 pages, including quite a few testimonies of EQL [
2]. Furthermore, Musya’s book “Investigations into the Luminous Phenomena Accompanying Earthquakes” is a collection of EQL testimonies since recorded history, which is a pioneering work in EQL research in Japan [
3]. Among these sources [
2,
3], there were 78 earthquakes involving a variety of EQL testimonies: glowing mountains, flames/sparks from underground, landslide lights, colored clouds, fire pillars/balls on the sea, glowing tsunamis, red skies, etc., all of which might be related to various physicochemical mechanisms.
However, historical records on EQL often lacked scientific support and statistical reliability and were also influenced by the psychological factors of the observers. Therefore, EQL has often been regarded as a type of so-called “earthquake weather”, and the investigation of their causal mechanisms has tended to be overlooked in seismology.
Since EQL have recently been photographed and scientifically confirmed to occur, it is scientifically significant to elucidate their true nature, even if they are a rare phenomenon that occurs only once every hundreds or thousands of years. This makes it challenging to verify proposed models or hypotheses, but it is still an important endeavor.
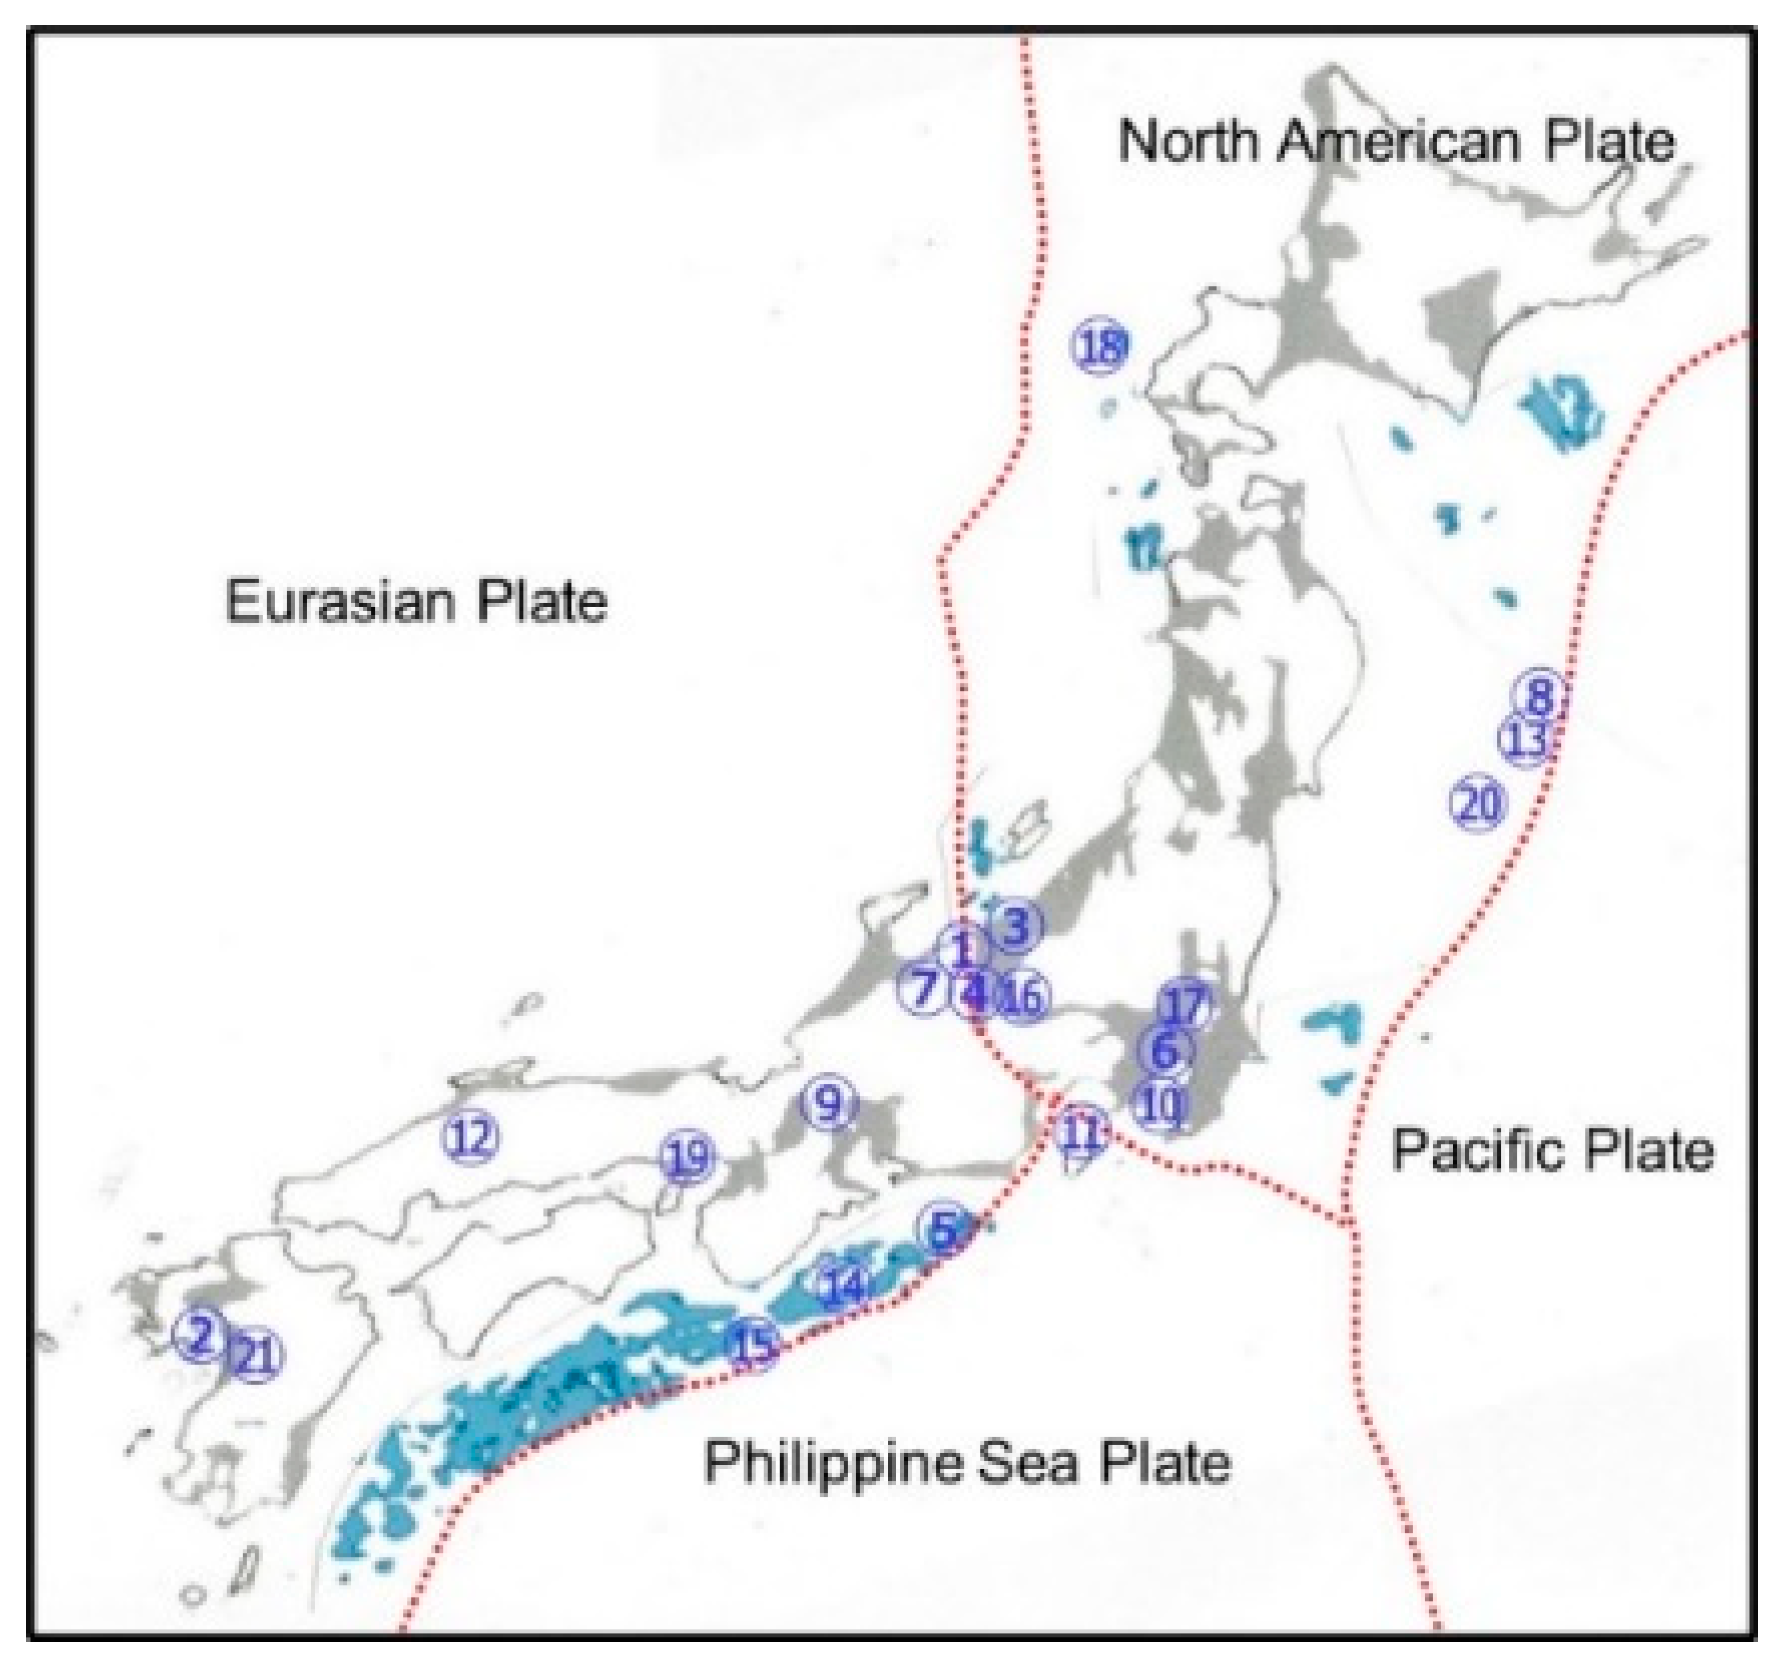
From this standpoint, we have conducted a study to date on the possible mechanisms of EQL observed in Japan, paying attention to the characteristic anomalies that appear in the lithosphere, atmosphere, hydrosphere, and ionosphere during seismic activities. In this review, we focus on 11 cases of EQL out of 21 earthquakes accompanied by EQL, where reliable information is available and the occurrence mechanisms are considered to be different, and discuss their characteristic features as well as possible underlying mechanisms. Additionally, we mention several instances of EQL observed in other countries, comparing these international cases to those in Japan. We also focus on the lead time of EQL phenomena such as flames, fire pillars, and fireballs associated with large earthquakes that occur in methane-bearing areas.
2. Rumbling the Ground, Glowing the Mountains—The 1965–1967 Matsushiro Earthquake Swarm
From 1965 to 1967, frequent felt earthquakes occurred around Mt. Minakami (659 m above sea level), located in the center of Matsushiro Town, Nagano in central Japan. The total number of felt earthquakes during this period was 62,826, with a maximum magnitude of 5.4. The total energy released during the earthquake swarm period was equivalent to a magnitude 6.4 earthquake [
4]. Mt. Minakami is a small volcano that was active 300,000 to 350,000 years ago (see
Figure 1a). When the volcano ceased to be active, the magma cooled down, leaving numerous microcracks in the surrounding shrunken crust around the conduit. In such a geological environment, high-temperature/high-pressure carbon dioxide-bearing water was released from the cooled magma reservoir deep underground [
5]. This water was stored beneath a hard rock layer approximately 10 km deep. When the hard layer suddenly ruptured, the water moved upward, and at depths of 1 to 6 km, the carbon dioxide degassed from the water and expanded, opening the cracks, reducing the fracture strength of the rock, and causing felt earthquakes. Therefore, this process was a so-called water/carbon dioxide eruption [
6].
As the felt earthquakes continued, mysterious EQL often appeared silently on Mt. Minakami or the surrounding mountains, illuminating the dark night sky. The EQL were then photographed for the first time in the world by a local dentist, Dr. T. Kuribayashi (cf.
Figure 1b). It was 23:48 on 4 December 1965. The age of the Moon was 11.5 but was hidden by clouds that covered almost the entire sky. After all, photographs of a total of 12 EQL events were taken. Among them,
Figure 1c was photographed with a camera equipped with a fisheye lens showing that the luminous area spanned over several surrounding mountains ranged about 8 km in diameter. Note that, according to the photographer’s eyes, the image seemed to be blue-white with a slight reddish tinge.
To summarize the research conducted so far [
7,
8,
9]:
Although EQL could be related to seismic swarm activity, they were not coseismic phenomena and had no relation to earthquake magnitude. Additionally, fewer EQL appeared in the fault fissure zone that developed in the valley between Mt. Minakami and the surrounding mountains;
The EQL did not produce audible noise; they were inaudible;
Most of the EQL appeared before or after passing a meteorological discontinuity front;
Most of the EQL events occurred either before or after the passage of the meteorological discontinuity front.
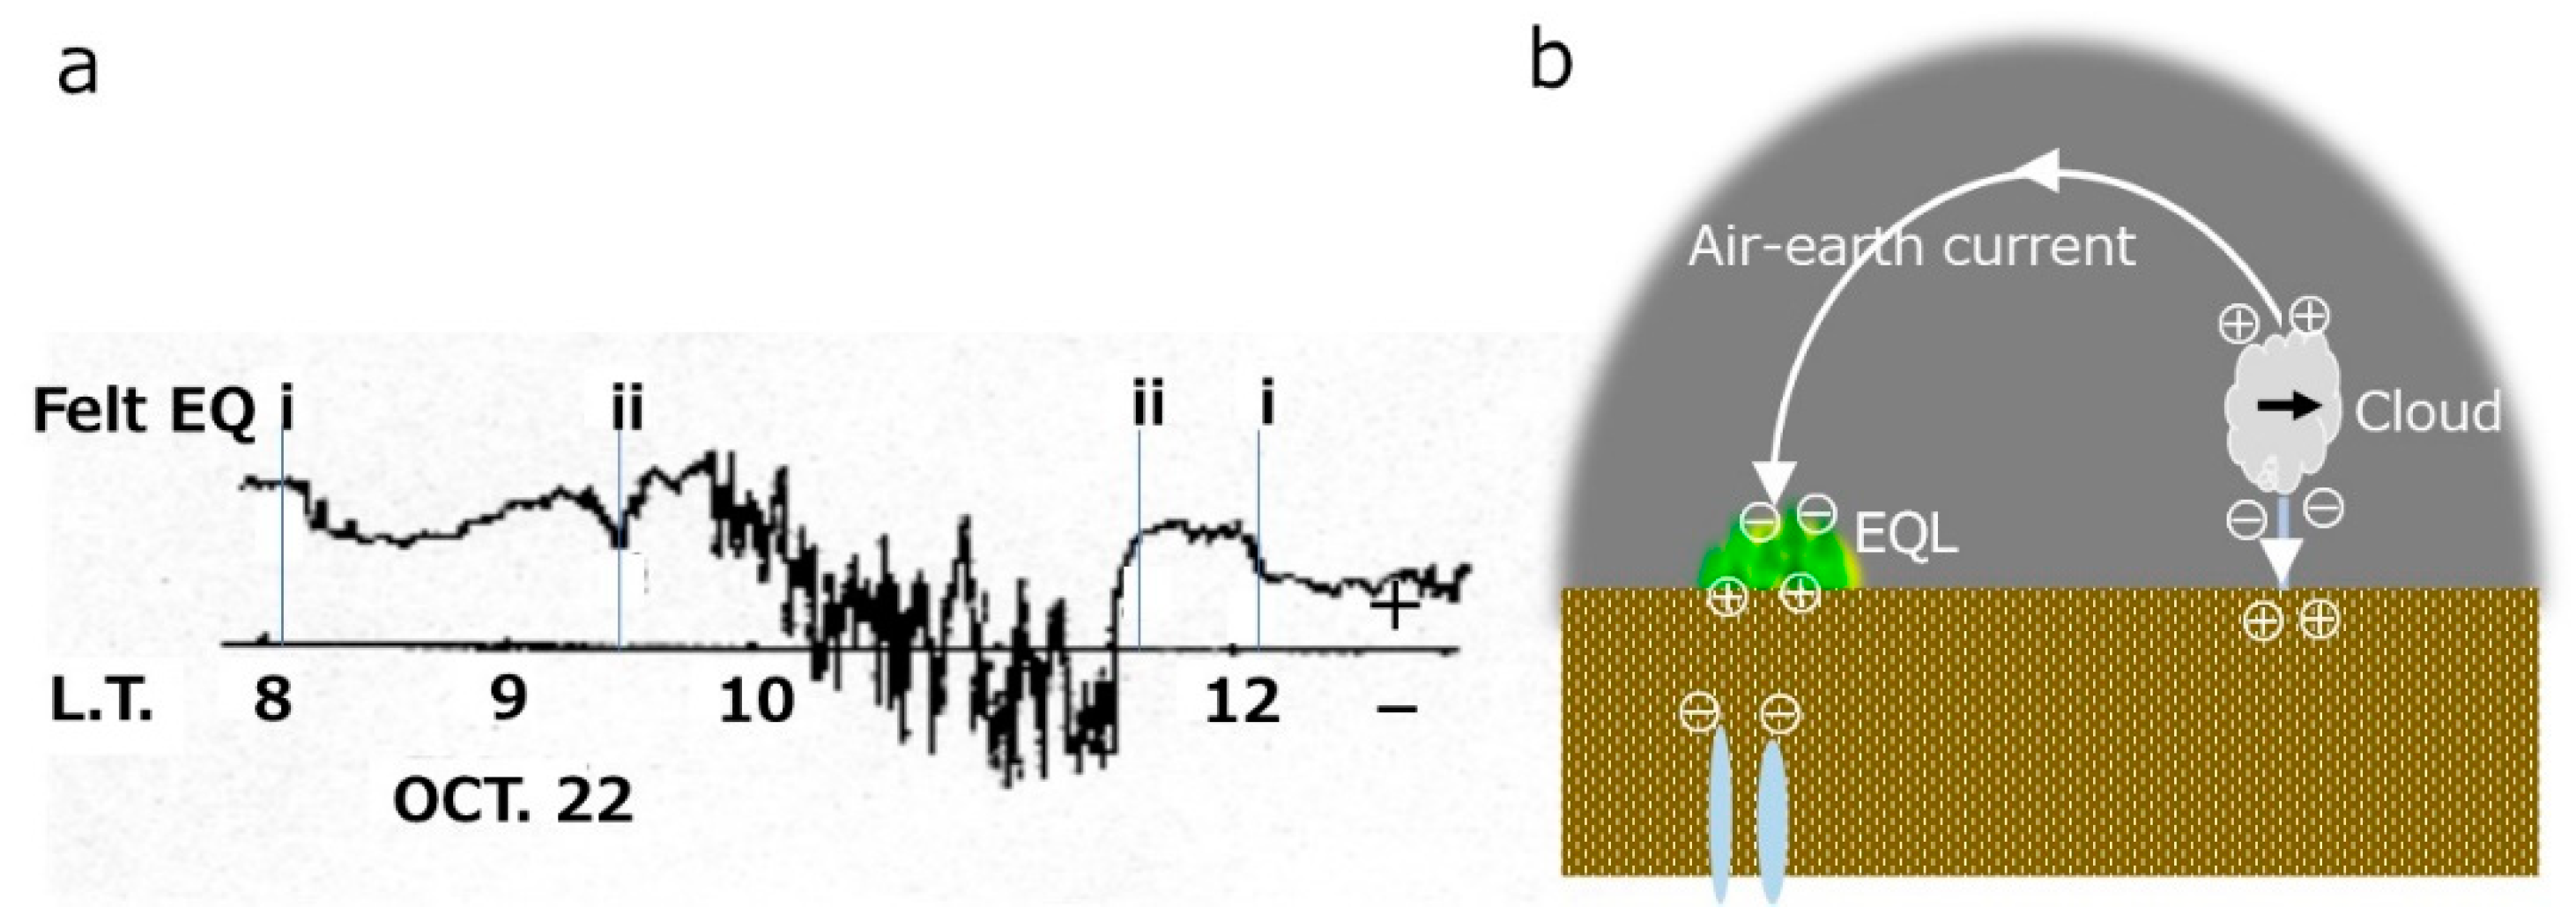
Additionally, following the passage of the discontinuity front, the atmospheric electric field exhibited violent fluctuations in both positive and negative directions, as depicted in a typical record shown in
Figure 2a [
10]. However, no EQL was observed during this period as it was daytime. These observational data provide valuable insight for further consideration of the mechanism behind EQL, as described below.
The aforementioned phenomena, denoted as (1) and (2), have not been adequately explained by the previously proposed model of tectonic stress-activated corona discharge with audible noise [
11,
12]. An alternative model suggests an inaudible dielectric barrier discharge [
13]. It proposes that crack fronts at the epicenter become negatively charged due to the interaction of fracturing rock with deep Earth gas, inducing a positive charge on the ground surface through electrostatic induction (
Appendix B) [
13,
14]. Conversely, a thundercloud passing over a meteorological front tends to charge the ground surface negatively. This results in rapid fluctuations in the Earth’s potential, competing with the electrical fluctuations from the underground interactions. These rapid fluctuations might trigger dielectric barrier discharges through trees, which have dielectric properties (
Figure 2b).
In order to confirm this hypothesis, we conducted a laboratory experiment to determine whether trees on the mountain function as dielectrics, as shown in
Figure 3a–d [
13]. In this high-frequency, high-voltage experiment simulating a mountain terrain with and without evergreen twigs (see
Figure 3a,b), it was observed that the twigs acted as a dielectric, generating a silent dielectric barrier discharge (cf.
Figure 3a). This phenomenon could potentially explain the occurrence of EQL observed on mountains during the Matsushiro earthquake swarm. Conversely, when a high DC voltage was applied, spark discharges accompanied by audible noises occurred irrespective of the presence of twigs (see
Figure 3c,d). Blue light is emitted due to excitation of nitrogen molecules.
It is noted that Mt. Brown, located approximately 80 km northwest of Charlotte, North Carolina, USA, has been renowned for the occurrence of mysterious glowing phenomena [
15]. Among the various prevailing theories attempting to explain this phenomenon, two particularly intriguing viewpoints have emerged: one suggesting that it is a result of electrical discharge from clouds to mountains and the other proposing that dissociated water causes intermittent geyser-like activity underground. When these two phenomena are interrelated, it is conceivable that a dielectric barrier discharge via the trees may occur, akin to the EQL observed during the Matsushiro earthquake swarm. Observing fluctuations in the atmospheric electric field on Mt. Brown could potentially provide the decisive insight necessary to resolve this enigma.
3. Tornado-like Clouds Standing Upward the Fault—1985 M7.2 Kobe Earthquake (I)-
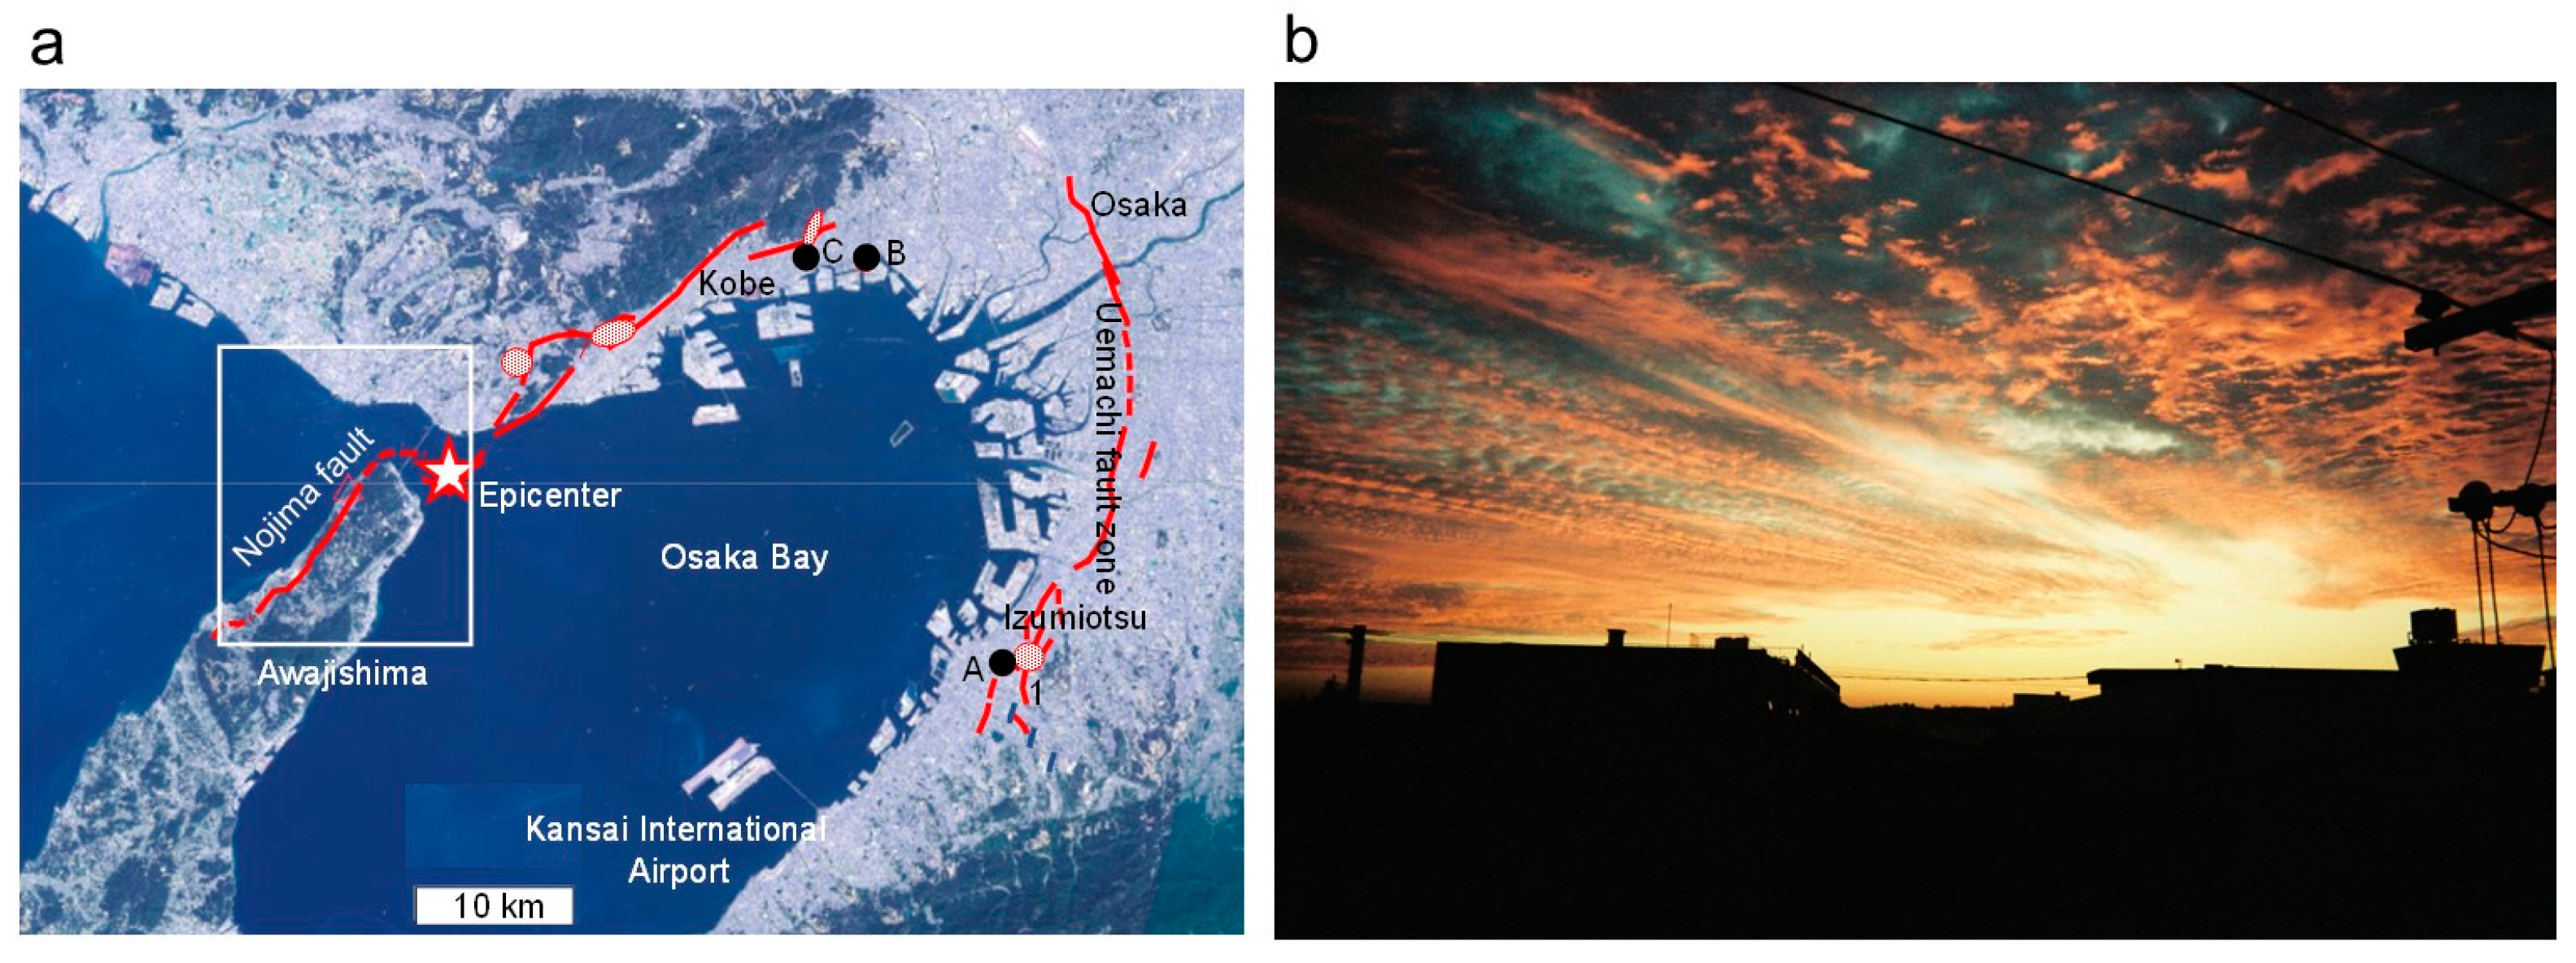
Eight days before the M7.2 Kobe earthquake on 15 January 1995, a tornado-like cloud suddenly appeared above the Nojima fault on Awaji Island [
16]. It was captured by the camera of an amateur photographer, Mrs. T. Sugie, who happened to be photographing the setting sun with the Akashi-Ohashi Bridge under construction in the background (cf.
Figure 4a–c). Despite the strong wind blowing from the west to the east (from right to left in
Figure 4b,c) at the time of its appearance, the tornado-like cloud tilted almost straight to the west by a little less than 10 degrees, matching the angle of inclination of the fault, from a height of about 680 m, and stood completely unaffected by the wind (see
Figure 4b). Approximately 2 min later, the cloud was dispersed by the strong west wind (
Figure 4c).
Note that this phenomenon is very similar to the tracks created by electrons ejected from atoms by highly penetrating gamma rays in a cloud chamber (see
Figure 5a). Immediately after the gamma rays pass through the cloud chamber, they follow a straight path. However, soon a kink-like instability occurs in the plasma along the trajectory, creating a vortex, which is eventually swept away by convection within the cloud chamber (see
Figure 5b).
Gamma rays are produced in nature when the radioactive element radon decays. In fact, near the faults that were active during the Kobe earthquake, radon concentrations gradually increased before the earthquake, reaching levels 5 to 10 times higher than normal by the time of the earthquake [
17,
18]. Judging from this fact, radon had already upwelled along the fault and accumulated near the subsurface before the earthquake. This established the conditions for highly penetrating gamma rays to be emitted in all directions. These rays could penetrate along the upward direction of the effectively transparent fault, and then pass through the atmosphere (cf.
Figure 5c). The reason why this cloud appeared at an altitude of 680 m was that the water vapor in the atmosphere above that altitude was in a supersaturated state. The water vapor aggregated around the electrons ejected by gamma rays (
Figure 4b;
Figure 5c).
When the tornado-like cloud is formed, it is essentially excited in a plasma state. Thus, if it appeared at night, it would look like a luminous tornado-like cloud. In fact, when historical earthquake records were reviewed, the following eyewitness testimony was found in the Hiroshima-North Earthquake that occurred at 23:02 L.T. on 20 December 1930: “At the same time when I felt the earthquake, something of a phosphorescent fire color that looked like an upside-down broomstick stood up in the sky from the edge of a mountain in the northeast direction, and the light reflected on the surrounding clouds was fire-colored. Then it disappeared” [
3].
Lastly, it cannot be definitively said that such tornado-like clouds are always precursors to earthquakes. This is because there have been instances where tornado-like clouds were photographed, but no earthquake occurred.
4. Fossilized EQL—1995 Kobe Earthquake (II)
About a month after the 1995 Kobe earthquake, during the author’s visit to the Nojima Fault on Awaji Island, they encountered Mr. E. Kawano, a fisherman at Awaji Island’s Tonouchi fishing port (cf.
Figure 4a). He shared the following testimony: On the day of the earthquake, he had begun preparing for fishing around 05:00 L.T. as usual. “Suddenly, several streaks of electric sparks in the direction of the Hirabayashi district scattered from underground (see
Figure 6a). Then, a few seconds later, a violent tremor struck. The sky above Kobe city illuminated with a reddish hue, resembling the moments just before dawn”.
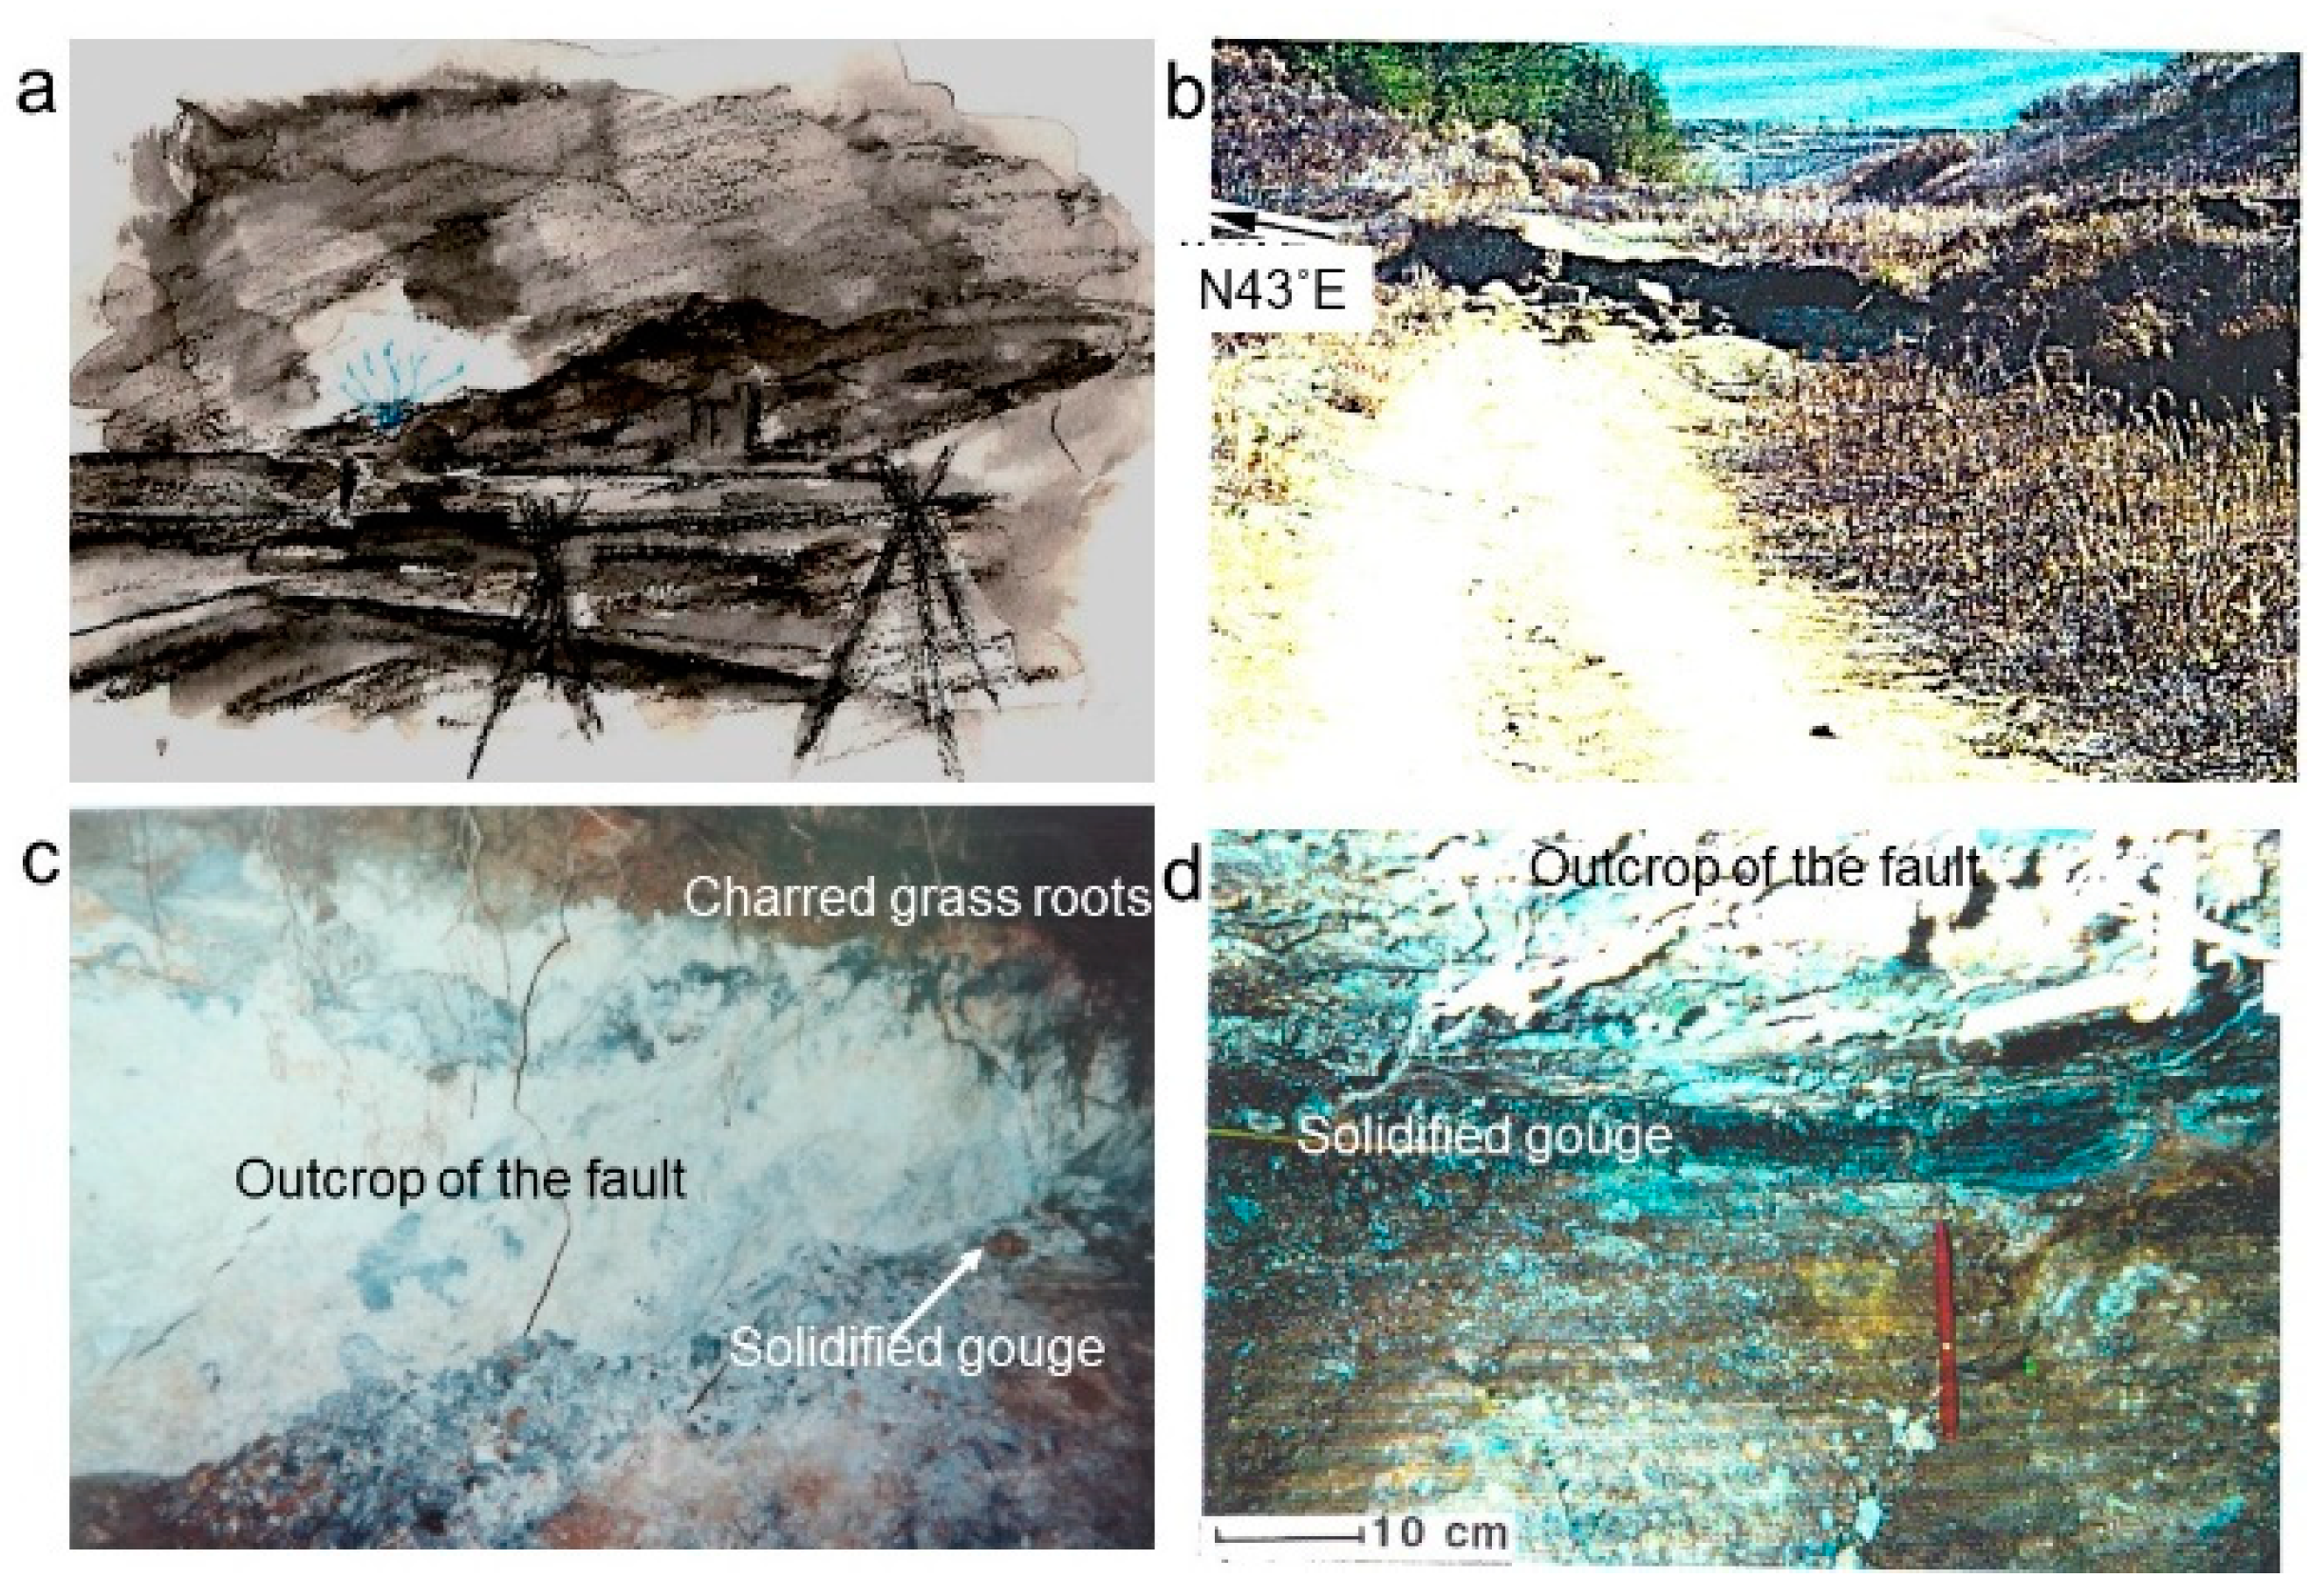
During the survey around the Nojima fault, the author discovered approximately a 5 cm thick layer of blackened fault gouge in the Hirabayashi district, situated in the direction indicated by this evidence (see
Figure 6b–d) [
19,
20]. Adjacent to the blackened gouge, only the grass roots on the outcrop of the fault were charred (as observed on the right side of the upper part of the fault plane:
Figure 6c), whereas this charring was not evident a little further away (from the center to the left upper part of the fault plane:
Figure 6c).
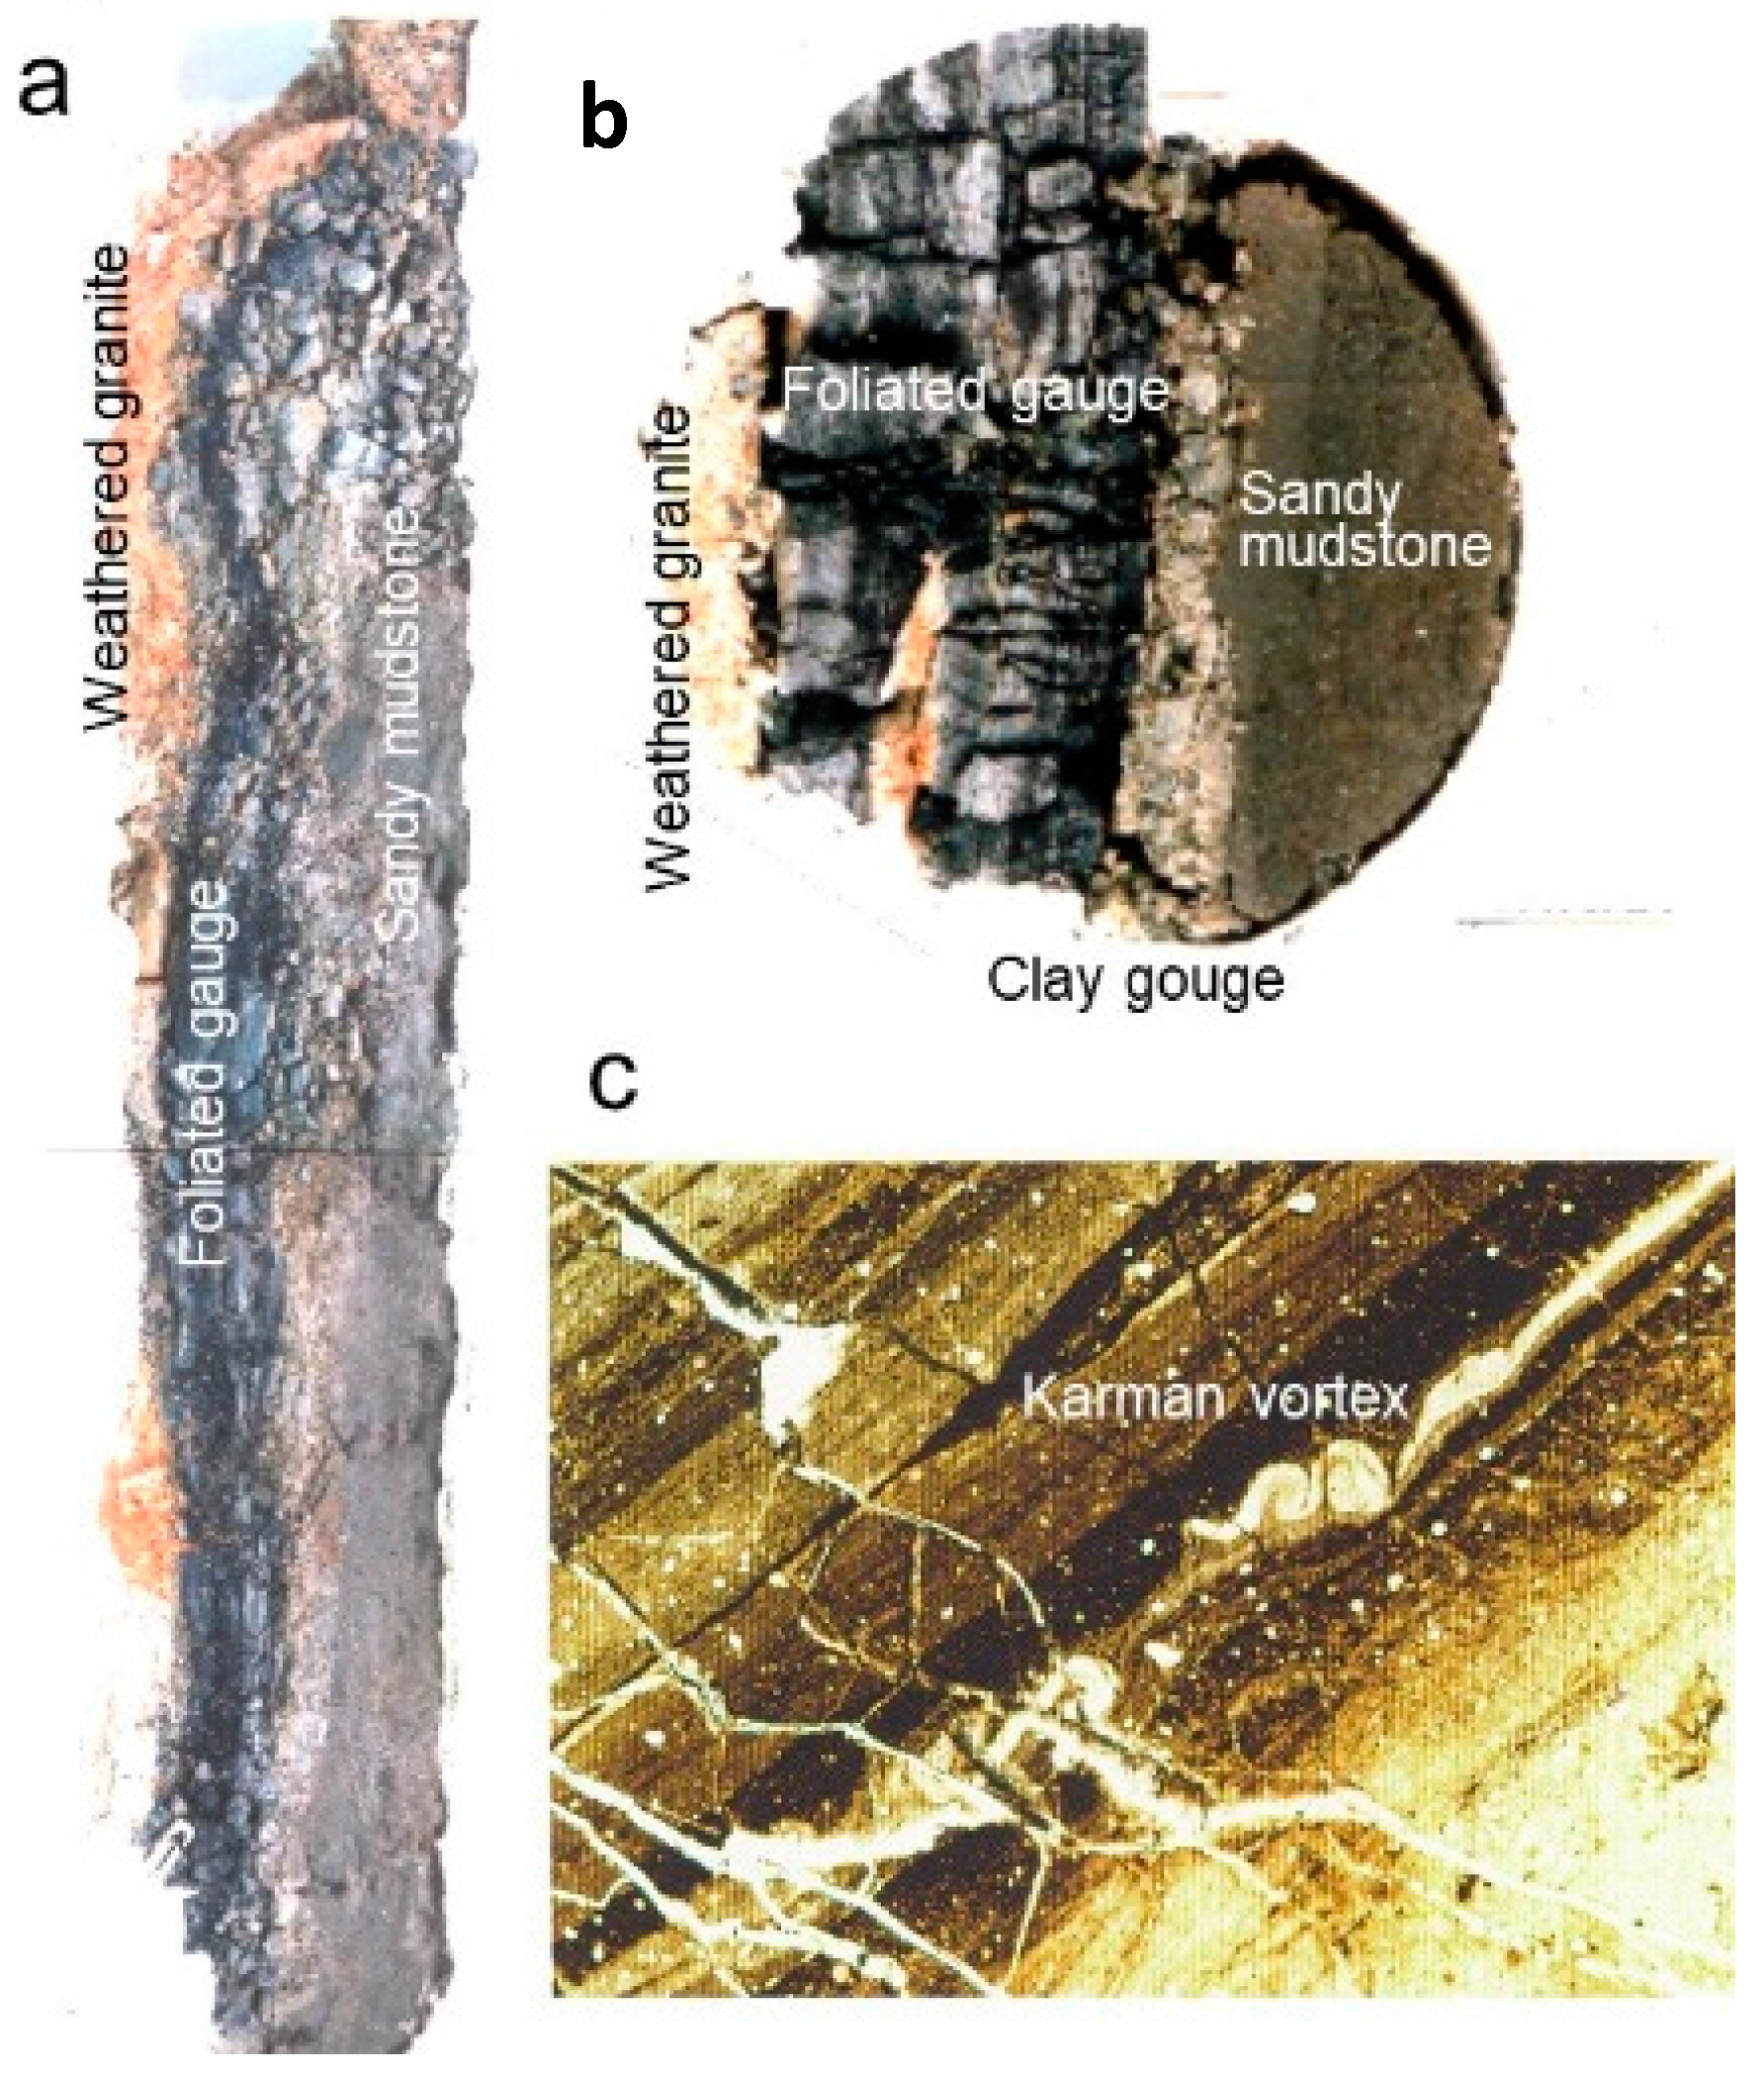
A core sample was extracted from shallow boreholes at the site depicted in
Figure 6d (see
Figure 7a,b). This fault gouge was found sandwiched between weathered granite and mudstone layers, comprising a solidified, blackened gouge and a softer, gray clay gouge (see
Figure 7b). In a sense, it serves as a “fossilized EQL”: the assumption being that an intense Earth current passed through the soft clay gouge, leading to sintering and its transformation into a hard, blackened substance. If this hypothesis holds true, the strong electric current would be expected to affect the residual magnetization of adjacent magnetic minerals. Indeed, the natural remanent magnetization of ferromagnetic minerals in mudstones tended to increase as they neared the Earth’s surface [
19,
20]. Essentially, a significant current discharge likely occurred close to the Earth’s surface, resulting in secondary magnetization. It was further inferred that the direction of magnetization differed from that of the Earth’s magnetic field, with the current flow direction being nearly perpendicular to the ground [
20].
Furthermore, when a thin section of the blackened gouge was observed using a polarizing microscope, Karman vortices of the fluid were observed in the quartz veins (see
Figure 7c). This observation suggests that the quartz melted and entered a turbulent state due to the Joule heating from the electric sparking.
To estimate the amount of current flowing in the field, a spark discharge sintering experiment was conducted using a soft gray clay gouge. A pulsed current of 1000 A at 10 V and 30 Hz was applied, resulting in the successful creation of a sintered sample with comparable hardness to a blackened gouge in just 10 s [
20].
The intense current generated in the field is likely caused by the electrical interaction between deep Earth gases and fractured rock, as noted in
Appendix B [
14,
21]. Specifically, the presence of a granite layer deep within the epicenter area of the Kobe earthquake suggests that larger currents could be generated during the fracturing of granite compared to other rocks such as gabbro and basalt, a phenomenon confirmed by laboratory experiments [
14]. In our laboratory experiments, the peak current observed for granite was 1.76 × 10
−6 A on average for an interaction area (
S) of gas flow with fracturing rock, where
S = 1.20 × 10
−4 m
2, resulting in a current density of 1.47 × 10
−2 A/m
2 [
14]. A simple estimation suggests that an area of fractured rock of approximately 260 m square on the fault plane would be required to generate 1000 A, a value that is likely in the field.
5. Bizarre Luminous Clouds in the Night—1995 Kobe Earthquake (III)
Just before and after the 1995 Kobe earthquake, which struck at 05:46 L.T., various types of EQL were witnessed [
22,
23,
24,
25]. The EQL described in
Section 3 and
Section 4 represent typical cases, but perhaps the most peculiar occurrence is the one presented in this chapter: Approximately an hour prior to the earthquake, the usually dark night sky inexplicably brightened to the extent that one could read a newspaper. The sky’s color shifted from blue to white, and then to red/orange, before eventually returning to its original darkness. It is noteworthy that sunrise on that day was at 07:05 L.T. and civil twilight would typically begin around 06:30 L.T.
The spectacular scene of the bizarre EQL was photographed by Mr. N. Yokota immediately after the earthquake. The photographs depict unusually brightened clouds facing east, opposite the epicenter (cf.
Figure 8a). As Mrs. Yokota described, “It looked like a fire-breathing dragon”, the scene was truly a marvel of wild nature itself (see
Figure 8b). Dazzlingly bright masses (luminous clouds) of light floated low in the sky, with many mottled streaks of cloud extending towards the left in
Figure 8b (i.e., westward to Osaka Bay). A total of five photographs were taken within about 7 min immediately after the earthquake, but the EQL persisted for a long time, with essentially little change in cloud movement and brightness during the 7-min shooting time. Eventually, the brightness lasted for about 20 min, but afterward, it returned to its original darkness.
Our survey revealed that during the offering of an eyewitness testimony in Osaka, the occurrence of EQL might have lasted for about an hour before the earthquake, although the photographs were taken just after the mainshock [
26]. The luminous clouds were estimated to be located approximately 130–200 m above sea level, above the Uemachi fault fissure zone, which is situated approximately 1 km east of the shooting site. It is worth noting that this zone was very close to the area experiencing seismic intensity of VII.
The streak clouds emitted from the luminous clouds resemble a tornado-like formation described in
Section 3. Hence, the likely cause of this phenomenon was suggested to be radon emanation from the fault fissure zone. This hypothesis is supported by the anomalous increase in radon concentrations observed in groundwater and air for several months or more leading up to the Kobe earthquake [
17,
18]. It is noteworthy that a granite belt containing radioactive elements extends approximately 1 km underground around the epicenter area. Consequently, numerous radon hot spring sites are widely distributed in the Kobe and Osaka areas.
However, it is unlikely that radon, with a density of 9.73 kg/m
3, which is denser than air, can ascend to altitudes of 130–200 m without assuming a very high blow-out velocity exceeding 10 m/s from the ground. Nevertheless, recent studies suggest that water vapor has the capability to trap radon [
27]. Water clusters can exist in the gas phase, and their sizes increase with relative humidity [
28]. In such circumstances, water molecules reorganize around guest molecules like radon or methane, forming a hydrate structure [
29,
30], where the surrounding water molecules are linked by hydrogen bonds [
29]. Water vapor and methane, being lighter than humid air, should be considered as potential carriers of radon into the atmosphere [
27].
Numerical calculation results [
26] for a mixed gas with an effective density of 0.6 kg/m
3 (radon concentration of 0.135 × 10
−3 vol%) showed that it can reach an altitude of 150 m and then spread horizontally due to turbulent diffusion (see
Figure 9a). From the aforementioned considerations, the possible cause for the luminous clouds floating approximately 150 m above was likely due to radioluminescence that might occur during the transition and recombination of excited and ionized molecules. The validity of this hypothesis could be supported by the following evidence:
Finally, it is noted that the colorful clouds in
Figure 8b exhibit variations in blue, white, and red/orange hues. When gamma rays traverse the atmosphere, electrons and ions are generated along their path through the interaction of radon with atoms in the air. Water vapor then condenses around these condensation nuclei, forming molecular clusters whose size depends on the degree of water vapor saturation. In regions of the upper atmosphere with lower degrees of vapor saturation, cluster growth is limited to smaller sizes, approximately less than ~10 nm. Consequently, only the bluish light from the luminous clouds is likely to be reflected due to Rayleigh scattering. Conversely, at medium altitudes where supersaturation is higher, the water cluster size immediately after the passage of gamma rays is small, resulting in a blue appearance primarily due to Rayleigh scattering. However, as the clusters gradually grow, Mie scattering becomes predominant, causing the reflected light to appear white. Further growth in size, reaching the micron scale, leads to the manifestation of red/orange hues (see
Figure 9b).
In this study, it was not possible to quantitatively estimate the amount of radon present in the floating luminous clouds, which is necessary to produce visible radioluminescence. This presents a future challenge.
6. A Bolt from the Blue—1993 Ibaraki Ken-Naiseibu Earthquake
Looking back through historical earthquake records, there are a considerable number of testimonies of extraordinary EQL phenomena, such as flashes of light on a sunny day accompanying an earthquake. For example, during the 1854 Ansei Tokai earthquake, “There was no cloud in the sky, then the sound was like thunder… it was a mysterious sound”. Similarly, during the 1923 Great Kanto earthquake, “the night before the Great Earthquake in 1923, a fierce, soundless lightning was seen for quite a long time in a part of the sky over Tokyo city”.
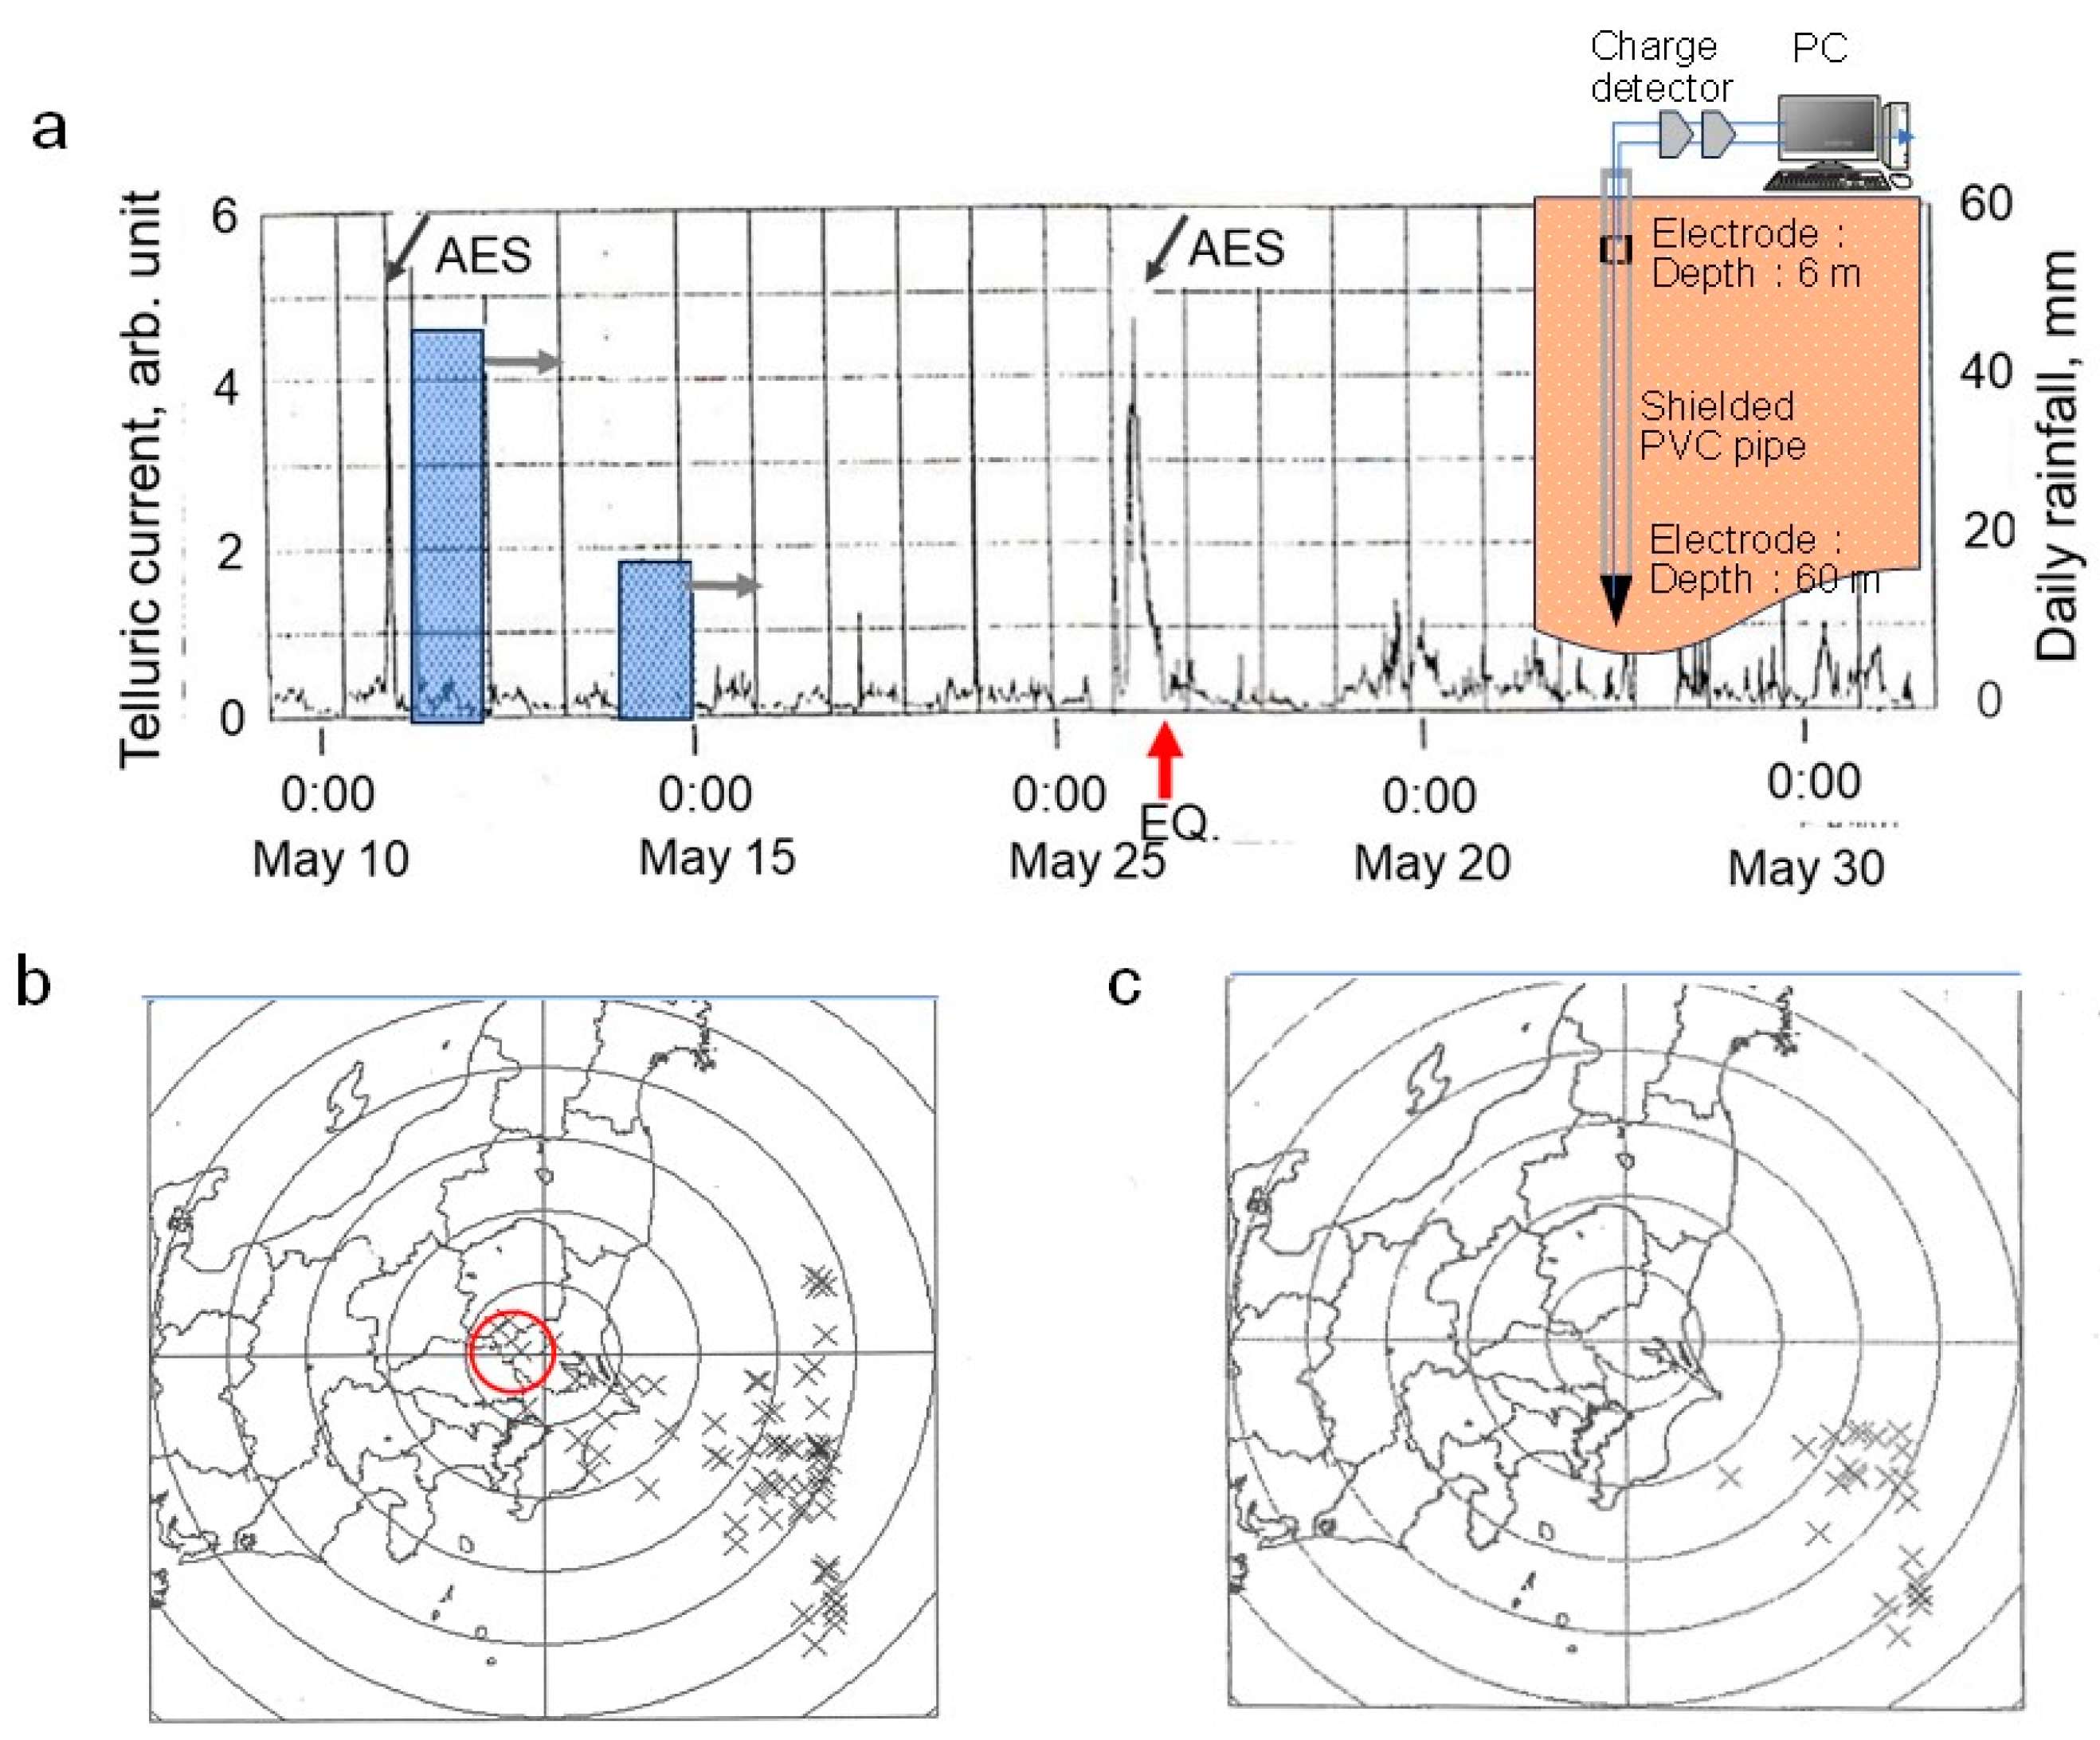
In this context, the author also had an experience that seemed like a bolt from the blue. For about 10 years since 1992, we conducted continuous observation of telluric current using a vertical dipole: one electrode was set about 60 m deep, and the other 6 m underground at the Tsukuba observation site (see the insert in
Figure 10a) [
33].
At 11:36 on 21 May 1993, an M5.4 earthquake occurred at a depth of 60.8 km, approximately 30 km from the observation site. On this occasion, when viewed from Tsukuba, the sky in the direction of the epicenter was covered with low-hanging clouds, and it appeared as if lightning was occurring. However, according to records from the Japan Meteorological Agency, the weather in Tsukuba on that day was sunny, with no rainfall, a maximum temperature of 21.1 °C, and a maximum wind speed of 6.3 m/s.
The observation records of telluric currents for 10 days before and after the earthquake are shown in
Figure 10a. An abnormal electric signal (AES) was recorded for about 7 h just before the earthquake occurred. We obtained lightning information by the Lightning Location System, which had begun commercial supply at that time. Initially, it was found that the abnormalities in the telluric currents spatiotemporally coincided with lightning strikes that occurred immediately before the earthquake (cf.
Figure 10b). However, after the data provider corrected for noise in the electromagnetic wave observation site, the lightning strikes on the ground disappeared (see
Figure 10c). The noises that were eliminated were probably attributed to seismically activated signals, which might be different in characteristic wave shape compared to cloud-to-ground lightning.
This fact suggests that the electrical anomaly on the ground caused by the earthquake induced atmospheric discharges that were different from normal lightning strikes. Additionally, there have been many reports of more intense lightning strikes than usual when earthquakes occur during bad weather conditions that are favorable for lightning.
7. Landslide Lights
When examining historical earthquake documents in Japan, there are a number of testimonies of large-scale landslides accompanied by intense light emission. While landslide lights may not seem particularly unusual, given that some laboratory experiments have demonstrated light emission associated with rock failure, it is important to note that all previous experiments were conducted using quartz-bearing granite, which tends to emit light due to the piezoelectric effect [
34,
35,
36]. However, the mountains in Japan where landslide lights have been observed are not composed of granite but other types of rock. For example, [
37]:
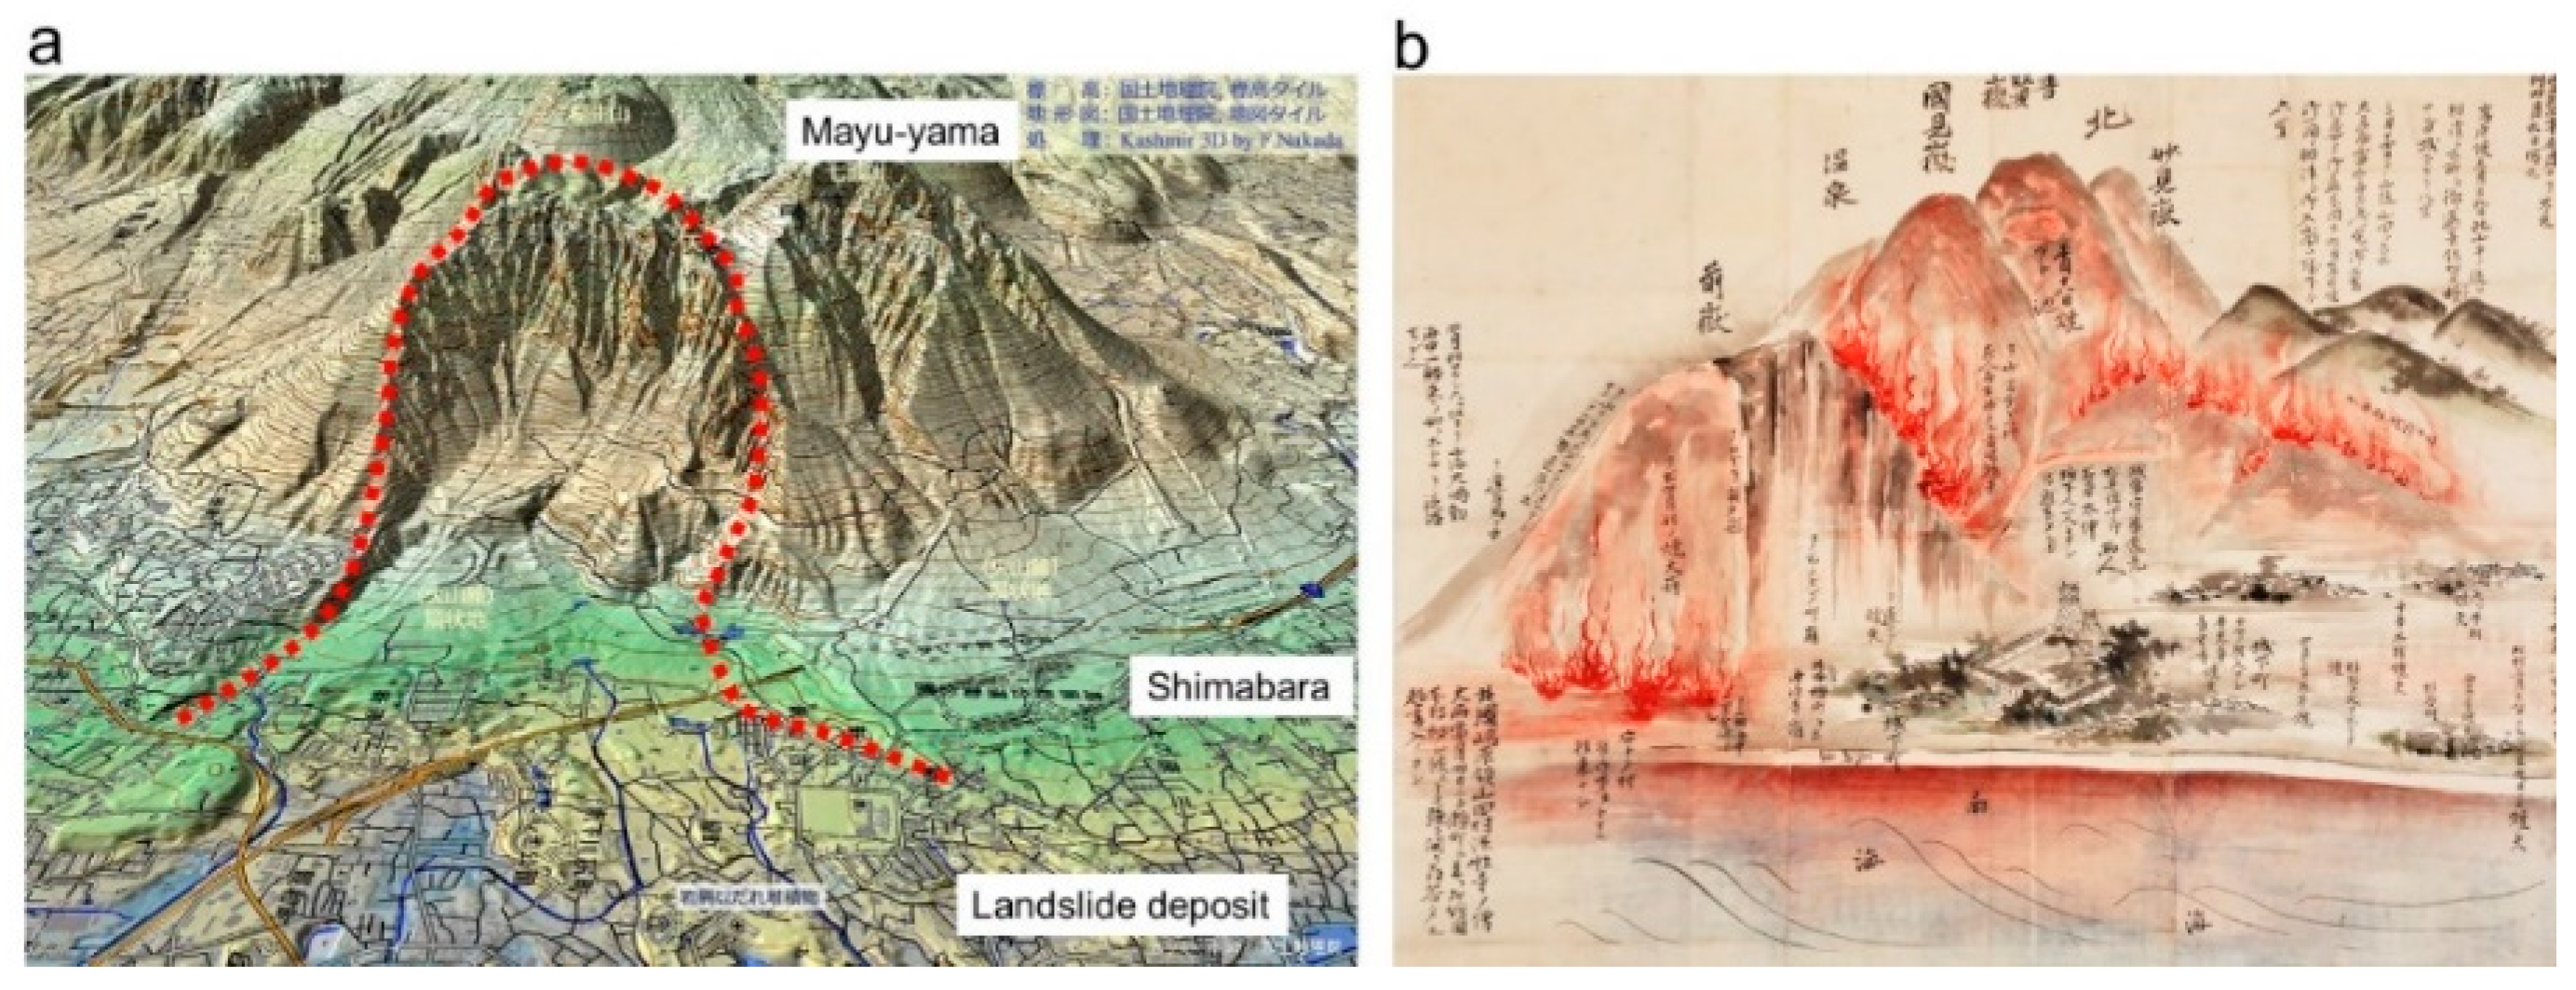
(1) In 1792, volcanic earthquakes near Unzen-Fugen-dake in Kyushu triggered the collapse of Mayu-yama, which consists of pyroclastic rock, in Shimabara. This collapse was accompanied by lightning-like phenomena known as “fires similar to but even more severe than lightning”, and the resulting pyroclastic flow reached the sea off Shimabara, creating what appeared to be “seawater whole fires” (see
Figure 11a,b). It is important to note that despite the resemblance, this event was not caused by a volcanic eruption, as there was no eruption occurring at the time, although Mayu-yama is a volcanic dome.
(2) In the M7.4 Zenkoji Earthquake that occurred at around 22:00 L.T. on 8 May 1847 in central Japan, “When Mt. Iwakura (composed of biotite-bearing rhyolite/hydrocarbon-bearing tuff breccia) collapsed, the village of Aniwa at the foot of Mt. Iwakura was illuminated, with every corner of the houses visible as if it were daylight.
(3) In the 1909 Kōnō (or Anegawa) earthquake, which struck east of Shiga province, a limestone cliff collapsed on the west side of Mt. Ibuki. During this event, residents mistakenly attributed the earthquake to an eruption of Mt. Ibuki, as they observed lights emitted from the landslide. These lights appeared reddish in color, leading residents to believe they were witnessing volcanic activity.
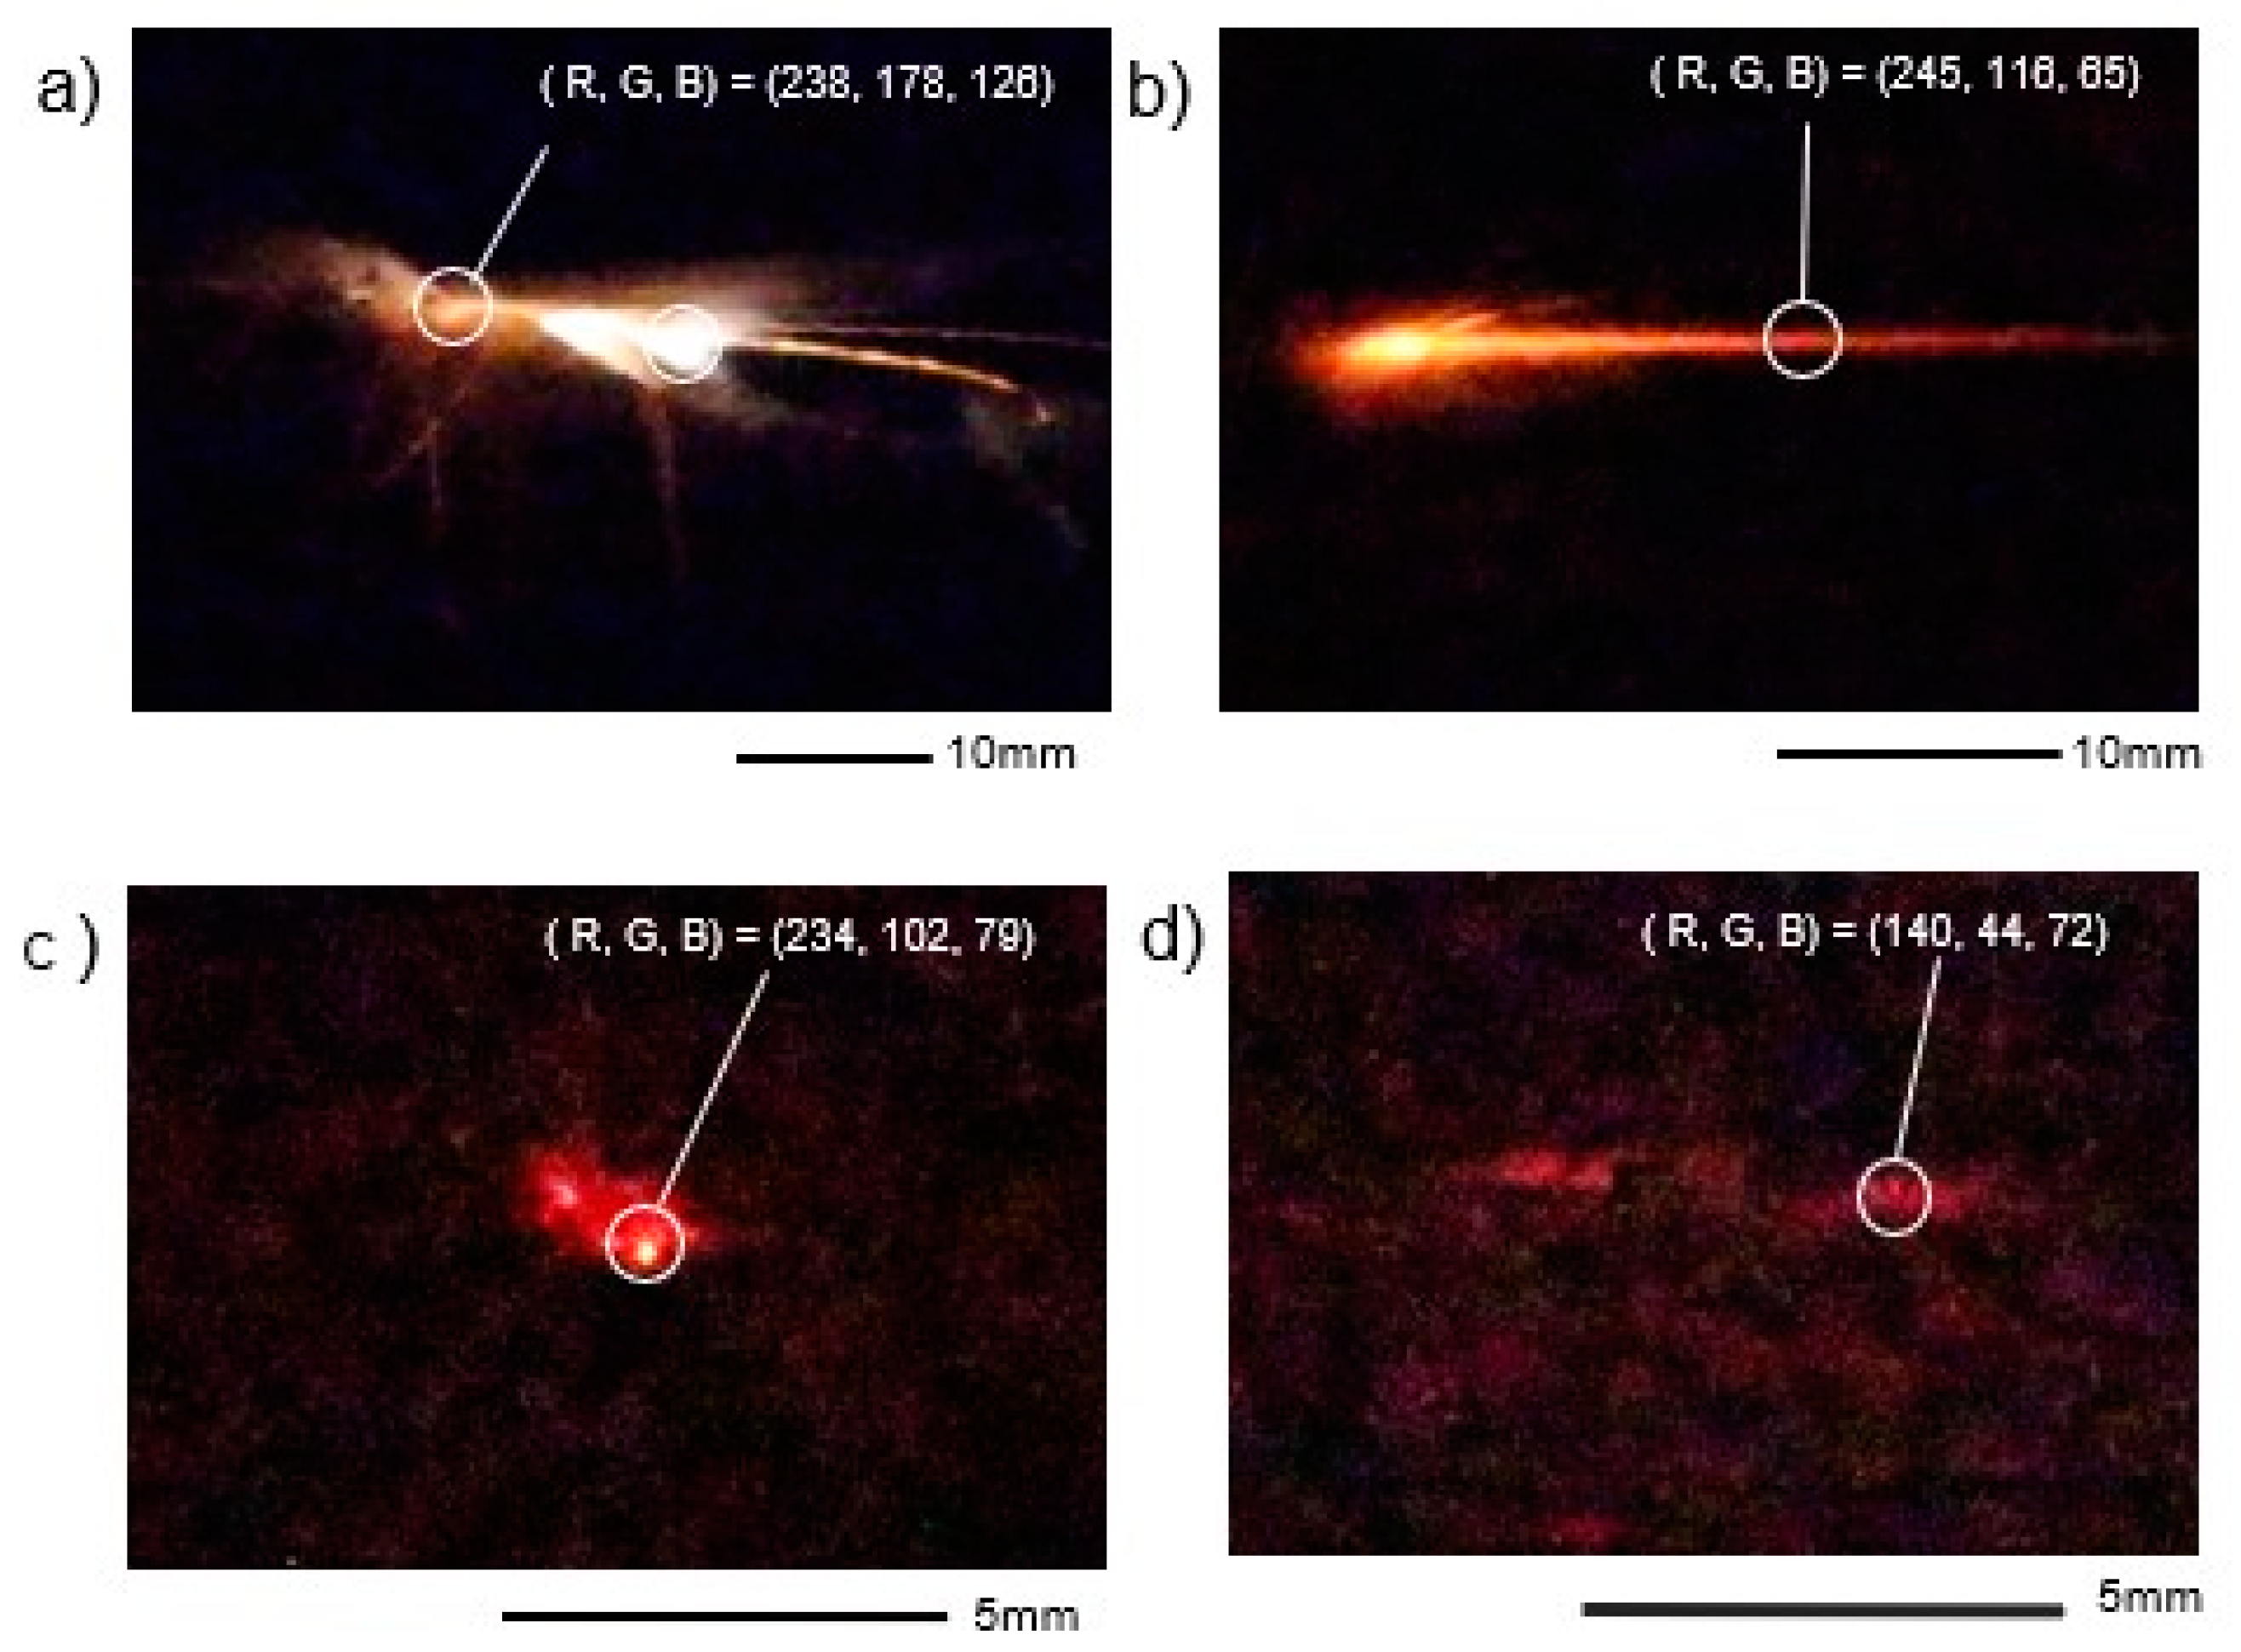
To investigate the mechanism of landslide-induced light emission, Charpy impact tests were conducted. In these tests, a rock sample fixed at the bottom holder undergoes shear failure as a pendulum, attached to the same rock sample, swings down from a certain height. The aim was to observe the light emission generated upon impact between the constituent rocks of collapsed mountains. The results revealed that the cause of light emission from impact-fractured rocks varies depending on the type of rock (see
Figure 12a–d). Specifically, for the Mayuyama’s pyroclastic rocks, TDS-MA analyses showed the presence of H
2O and lower hydrocarbons with complex cracking patterns such as C, CH, CH
4, C
2H
2, C
2H
4, as well as peaks indicating H
2S and CO
2, typical components of volcanic gases. Consequently, the findings suggest that the flammable gases CH
4 and H
2S stored in the pyroclastic rock were degassed and combusted due to the frictional heat generated upon impact (cf.
Figure 12c).
When hydrocarbon-bearing tuff breccia rocks collided, they emitted as much light as granite (
Figure 12b). Degassing and combustion of stored gas, as well as fracto-electron-related light emission, possibly from biotite in rhyolite, seemed to have contributed to the landslide lights on Mt. Iwakura.
Limestone emits orange-colored frictional thermoluminescence at temperatures around 200–250 °C (cf.
Figure 12d), which corresponds to the cause of the landslide lights on Mt. Ibuki.
In summary, the temperature rise due to friction between rolling rocks is an important factor in landslide lights, involving degassing and burning of the flammable gases in the rock, inducing thermally stimulated emission of electrons and photons (referred to as fracto-emission) or thermoluminescence. In landslide fields, these lights can be so intense that observers throughout history have often mistaken them for volcanic eruptions.
8. Flames, Fire Pillars, and Fireballs Appeared on the Ground
Water-soluble natural gas fields, primarily consisting of flammable methane, are widely distributed in the Japanese archipelago (cf.
Appendix A) [
38]. During significant earthquakes, methane can gush out from underground within the Earth through steeply sloped strata boundaries, caused by folding actions and/or faults. This results in flames erupting from underground as seismic energy activates methane, leading to spontaneous electrostatic ignition [
39].
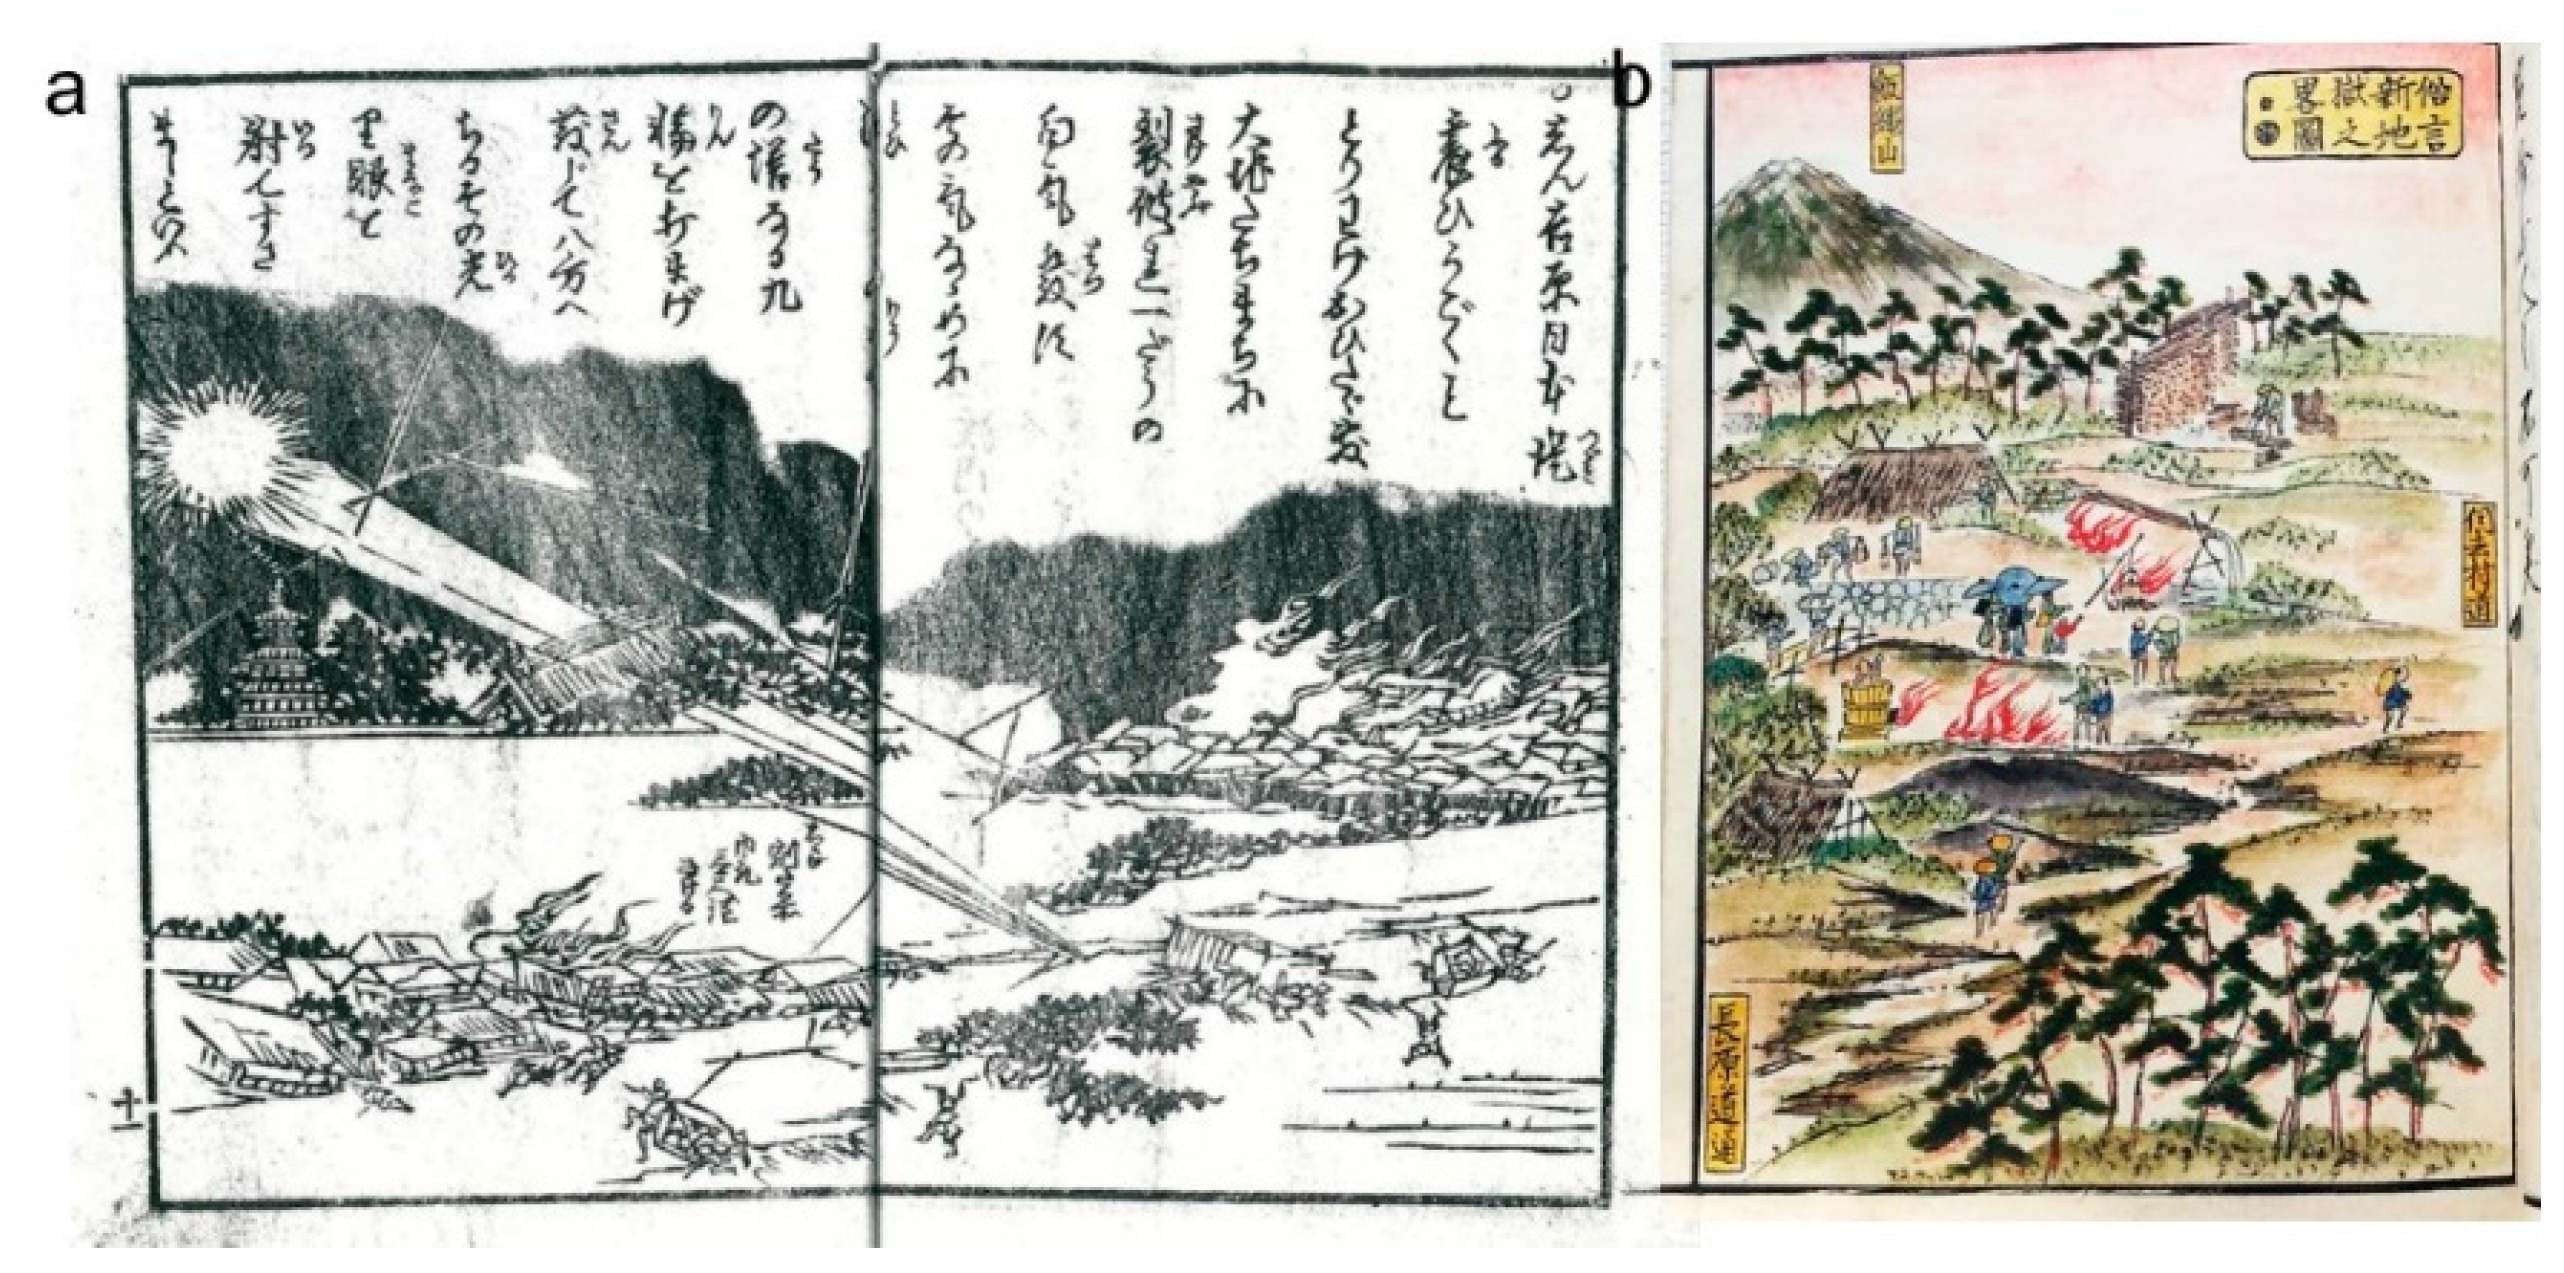
The historical earthquake literature documents numerous eyewitness testimonies of methane flames, fireballs, and fire pillars associated with eight earthquakes (③, ④, ⑥, etc.), all of which occurred in areas where water-soluble gas fields are distributed (cf.
Appendix A). Various shapes of methane flames have been witnessed, including a fireball flying through the air (see
Figure 13a) and fire pillars and swirling flames rising from the ground (see
Figure 13b).
The mechanism of spontaneous ignition may be attributed to frictional heat generation on the fault surface, and/or the electrification and electrostatic ignition of methane resulting from the coupled electric interaction of fracturing rock with methane [
39]. It is noteworthy that there were three instances where houses caught fire, leading to major conflagrations: the 1828 Echigo-Sanjo earthquake, the 1847 Zenkoji earthquake, and the 1855 Ansei Edo earthquake [
39]. Methane flame-related phenomena may occur when the Earth’s crust, compressed beforehand, suddenly loosens just before the earthquake occurs, causing trapped methane in the subsurface to gush out and ignite spontaneously. Hence, it may be feasible to predict an earthquake just before its occurrence using observation tools such as IR imaging. We will delve further into this discussion in
Section 13.
It is noted that the Tatarinov couple successfully captured images of fireballs (they called plasmoids) believed to be caused by degassing from the ground, using infrared cameras installed in the Baikal Rift Zone from 2007 to 2012 [
40]. While further research into the causes of the fireballs was anticipated, the first author passed away in late 2022.
9. Glowing Tsunamis
Surveying the history of earthquakes off the Pacific coast of Tohoku reveals that significant earthquakes have often occurred at plate boundaries, resulting in large tsunamis striking the Sanriku coast. Among these events, the 1896 Meiji Sanriku earthquake tsunami and the 1933 Showa Sanriku earthquake tsunami, both occurring during the night, are notable for the occurrence of glowing tsunamis in white or bluish-white hues hitting the coast. The following are representative eyewitness testimonies [
41].
- A.
M8.2–8.5 Meiji Sanriku tsunami earthquake at 19:32 L.T. on 15 June 1896:
“Approximately 30 min later, a gigantic black wall of waves struck the entire Sanriku region with a roaring sound and blue light”.
“The waves emitted white foam and a sound like thunder. White light illuminated all directions”.
“The dark offshore glowed blue, and the foaming tsunami hit us high like mountains”.
- B.
M8.1 Showa Sanriku tsunami earthquake at 02:30 L.T. on 3 March 1933:
“The crest of a tsunami wave was white and shining in a straight line”.
“The tsunami wave formed a band about 4 m wide and shone in pure white”.
“The seawater near the shore looked like it was boiling and glowed blue”.
“When I looked at the sea from the coast, I noticed that the surface of the sea was shining all at once. It seemed different from the light of Noctiluca scintillans”.
“The bay entrance was filled with a hazy blue-red glow”.
Judging from these testimonies, the crests of the tsunami were foaming and glowing white or pale blue. The videos taken during the 1993 Hokkaido Nansei-Oki earthquake and the 2011 Tohoku-Oki Earthquake provide important hints in investigating the cause of the above-mentioned glowing tsunami [
42].
Our laboratory experiments on bursting methane bubbles by impact have demonstrated that positively charged mists soaring high into the air create a large electrical potential difference with the sea surface. This electrostatic energy is sufficient on a field scale to electrostatically ignite methane [
42]. Note that the phenomenon where mists become positively charged when bubbles collapse is known as the Blanchard effect [
43].
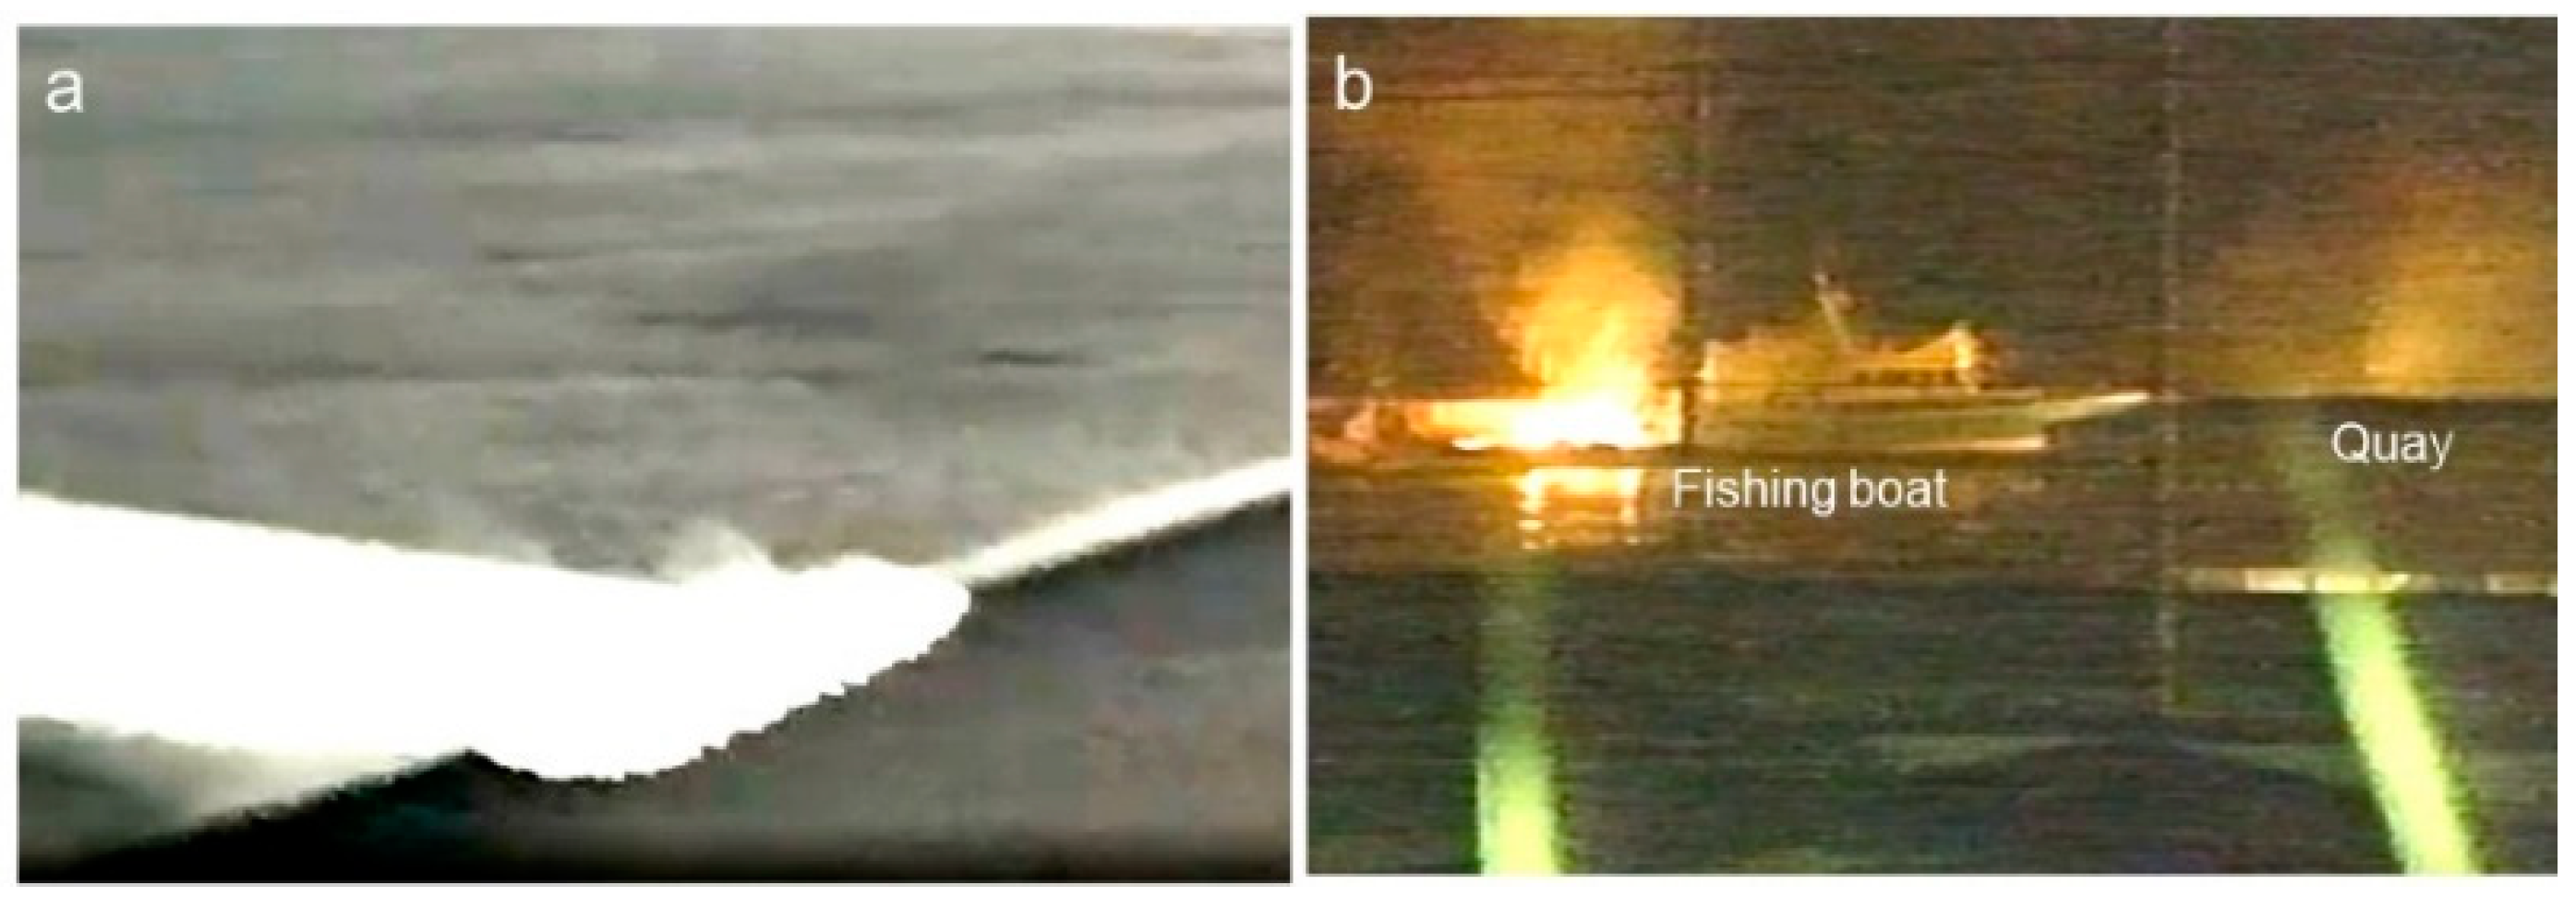
The Tohoku-Oki Earthquake, which struck at 14:46 L.T. on 11 March 2011, surpassed the magnitudes of the 1896 Meiji Sanriku and the 1933 Showa Sanriku tsunamis. Despite occurring during daytime, no eyewitnesses reported seeing a glowing tsunami. However, video footage captured the tsunami’s approach, generating white bubbles and mist (see
Figure 13a) [
41,
42]. The tsunami stirred up sludge from the shallow ocean floor, darkening it with mud. Additionally, methane released from decomposing organic matter in the sludge formed a white, bubble-filled tsunami.
Such evidence was observed during the Hokkaido Nansei-Oki earthquake, which occurred at 22:17 L.T. on 12 July 1993, when a tsunami struck Aonae Port on Okushiri Island in Hokkaido [
42].
Figure 14b shows a still image from a video taken by an NHK team on site at the time, capturing the tsunami colliding with the quay, causing mist to rise and appear white (see right side of
Figure 14b).
After a while, a second tsunami wave forced the burning boats ashore, pushing them into the streetscape area. There, petroleum oil and gasoline leaking from the oil tanks and cars ignited, resulting in a large-scale fire. Similar tsunami-induced fires also occurred in various bay areas during the 2011 Tohoku-Oki earthquake [
41]. These events highlight the need for new disaster prevention and mitigation measures for tsunami-induced fires.
10. Fire Pillar/Fireball Offshore
On the eve of the 2011 M9.0 Tohoku-Oki earthquake, a brief eyewitness account was cited in the newspaper stating that “a pillar of light stretched into the sky ahead of the tip of the cape”, although no photograph was taken. Similarly, on the eve of the Meiji Sanriku tsunami earthquake at 19:32 L.T. on 15 June 1896, “someone who went offshore to fish witnessed a burning-like fire in the northeast direction and soon after heard a sound like continuous gunfire coming towards the land” [
44]. Based on these testimonies, an undersea volcanic eruption was proposed at that time as the source mechanism for the generation of the gigantic tsunami [
42]. Referring to this model, a woodblock print as shown in
Figure 15 was circulated. However, it is reasonable to assume that the source of these events was a methane explosion from methane hydrate (MH) or methane on the ocean floor, as will be explained later.
On 1 December 1946, at approximately 04:19 L.T., the M8.0 Showa-Nankai earthquake occurred, causing severe seismic and tsunamigenic damage along the Pacific coast of southwestern Japan. At that time, there were numerous eyewitness testimonies of luminescent phenomena on the sea [
45]. The following testimony is particularly compelling in elucidating the cause of the fire pillar: On the night just before the earthquake occurred, an elderly man in Tsubaki predicted that something strange would happen. He woke up around 03:00 L.T. just before the earthquake and observed two fire pillars on the sea: “One fire pillar was off the coast of Shirahama, and the other off the coast of Susami. It appeared as if the seawater beneath the fire pillars was excavated, resembling a dish, and then an earthquake occurred” (cf.
Figure 16).
This testimony was analyzed as follows: Tsubaki is situated on a gently sloping coastal area ranging from 20 m to 50 m above sea level. The observation of “the sea surface appearing concave like a dish”, suggests a curvature in the sea horizon. The distance from the observer to the sea horizon, L (in meters), can be expressed as L = 3570(h + 1.5)1/2, where h is the observer’s sea level height. For instance, L is 16.6 km for h = 20 m and 25.6 km for h = 50 m.
There were two adjacent landslide marks on the ocean floor below the horizon, visible from the sea cliffs. Assuming these landslides, possibly caused by an earthquake, as the origin points of the fire pillar, the estimated distance between the landslide location and the witness is L = 18 km. Consequently, the altitude of the witness site is estimated to be 25 m above sea level.
The resolution of the human visual field is considered to be 1 min (1/60°). Thus, the sea level would have appeared to sink by at least 18,000 m × tan (1/60°) ≈ 5 m. Furthermore, the observation of a dish-like shape implies that it must have spread horizontally by about 30 m to achieve a depth of 5 m for the dish shape.
It is known that methane hydrate, which is stabilized at temperatures less than 4 °C and pressures higher than approximately 5 MPa (deeper than ~500 m), abundantly exists around the area near the foot of the 1100 m deep cliff. As illustrated in
Figure 17, during the pre-seismic stage, heat transfer from a deep heat source and/or electric current due to coupling of fracturing fault rocks with deep Earth gases might flow through a fault into the foot of the cliff, resulting in explosive methane hydrate (MH) dissociation and gasification with volume expansion. The methane bubble thus rises toward sea level. On the other hand, gravitational balance is disrupted due to the generation of a concave sea floor beneath the sea cliff where explosive MH dissociation occurs, and a landslide on the sea cliff begins, drawing seawater and causing the sea surface to become concave. Then a landslide-induced tsunami occurs. Methane bubbles move upward, bursting above the sea, and charged mists fly up, igniting the methane with static electricity and forming a column of fire (see
Figure 17).
It is worth noting that a similar phenomenon was reported overseas regarding landslides on Robinson Crusoe Island, triggered by the impact of a tsunami during the 1835 Concepción earthquake. This event might have been caused by methane stored on the ocean floor erupting, resulting in the creation of a fire pillar [
46].
11. Red Sky—Enhancement of 630 nm Airglow
When strong winds carry significant amounts of water vapor and dust, such as yellow sand, the red light from the Sun is scattered, particularly around sunrise or sunset. This scattering can turn the sky a deep red hue resembling bloodstains. If the midnight sky appears red, it is unlikely due to sunlight scattering but rather to the lower-latitude aurora phenomenon caused by intense magnetic storms in the Arctic during periods of heightened solar activity. These geomagnetic storms extend aurora ovals, bringing the aurora to lower latitudes. The lower-latitude aurora emits a reddish hue due to the 630 nm airglow in the ionosphere, resulting from the dissociative recombination of O
2+ [
47]. Such lower-latitude auroras have frequently been witnessed throughout Japan’s history, typically appearing in the northern direction from the observer’s location [
48,
49].
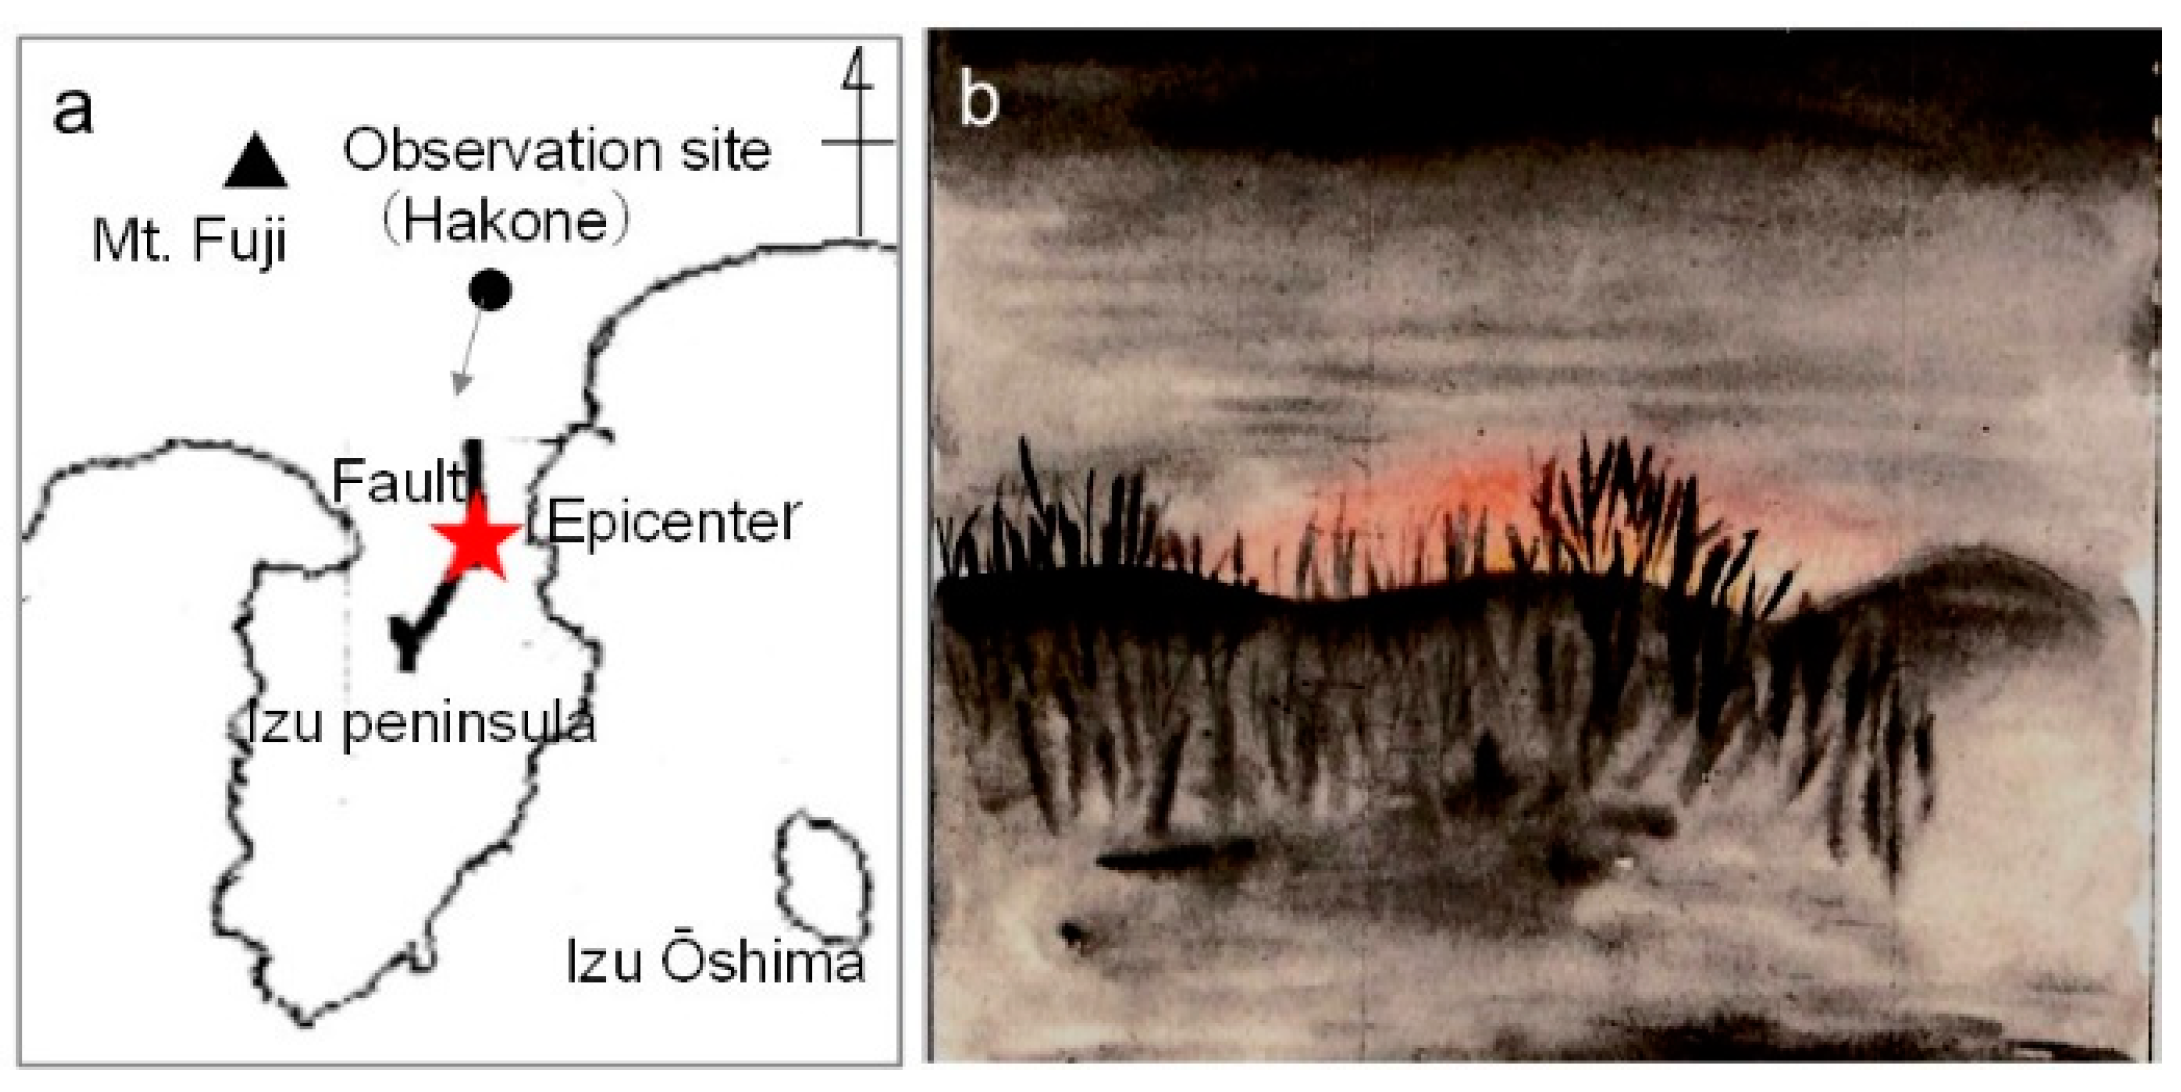
However, according to the historical earthquake literature, there are several documents stating that the sky turning reddish was not observed in the north, but rather in the direction of the epicenter. For example, when the M7.3 North Izu Earthquake occurred at around 04:02 L.T. on 26 November 1930, an eyewitness reported, “The sky above Izu in the southwest direction from Hakone, which is normally dark, had such a reddish color as to feel eerie” [
3] (cf.
Figure 18a,b).
Once, information related to a seismic phenomenon known as ‘red sky’ was reported from the USA: At 10:50 L.T. on 20 April 2002, the Au Sable earthquake measuring M = 5.1 occurred near Plattsburgh, New York, USA. An airline pilot, Mr. S. Nagai, who had flown over the area the night before the earthquake, reported to the United States Geological Survey (USGS) as follows: ‘We observed northern lights in the direction of our flight, starting when we were crossing over New York City at 35,000 feet. Usually, the northern lights we observe are so far north that they appear to remain at a constant distance, but this time they seemed to get closer and closer. As we approached Plattsburgh, New York, we were actually flying through it, which we had never experienced before. We could actually look up and see the waves passing by us. It was not until the next morning when I heard about the earthquake near Plattsburgh that I put the two together’. It is likely that the 630 nm airglow due to a medium-scale traveling ionospheric disturbance (MSTID) appeared in the ionospheric epicenter. At that time, ionospheric observation data from the Incoherent Scatter Radar (ISR) at Millstone Hill at MIT Lincoln Laboratory was not publicly available, probably due to maintenance [
50], so his report could not be substantiated by any scientific observation method at present.
Meanwhile, a stagnant MSTID was confirmed through the dense network of Global Navigation Satellite System (GNSS) receivers in Japan, approximately 20 min prior to 01:25 L.T. on April 16 during the M7.3 Kumamoto Earthquake [
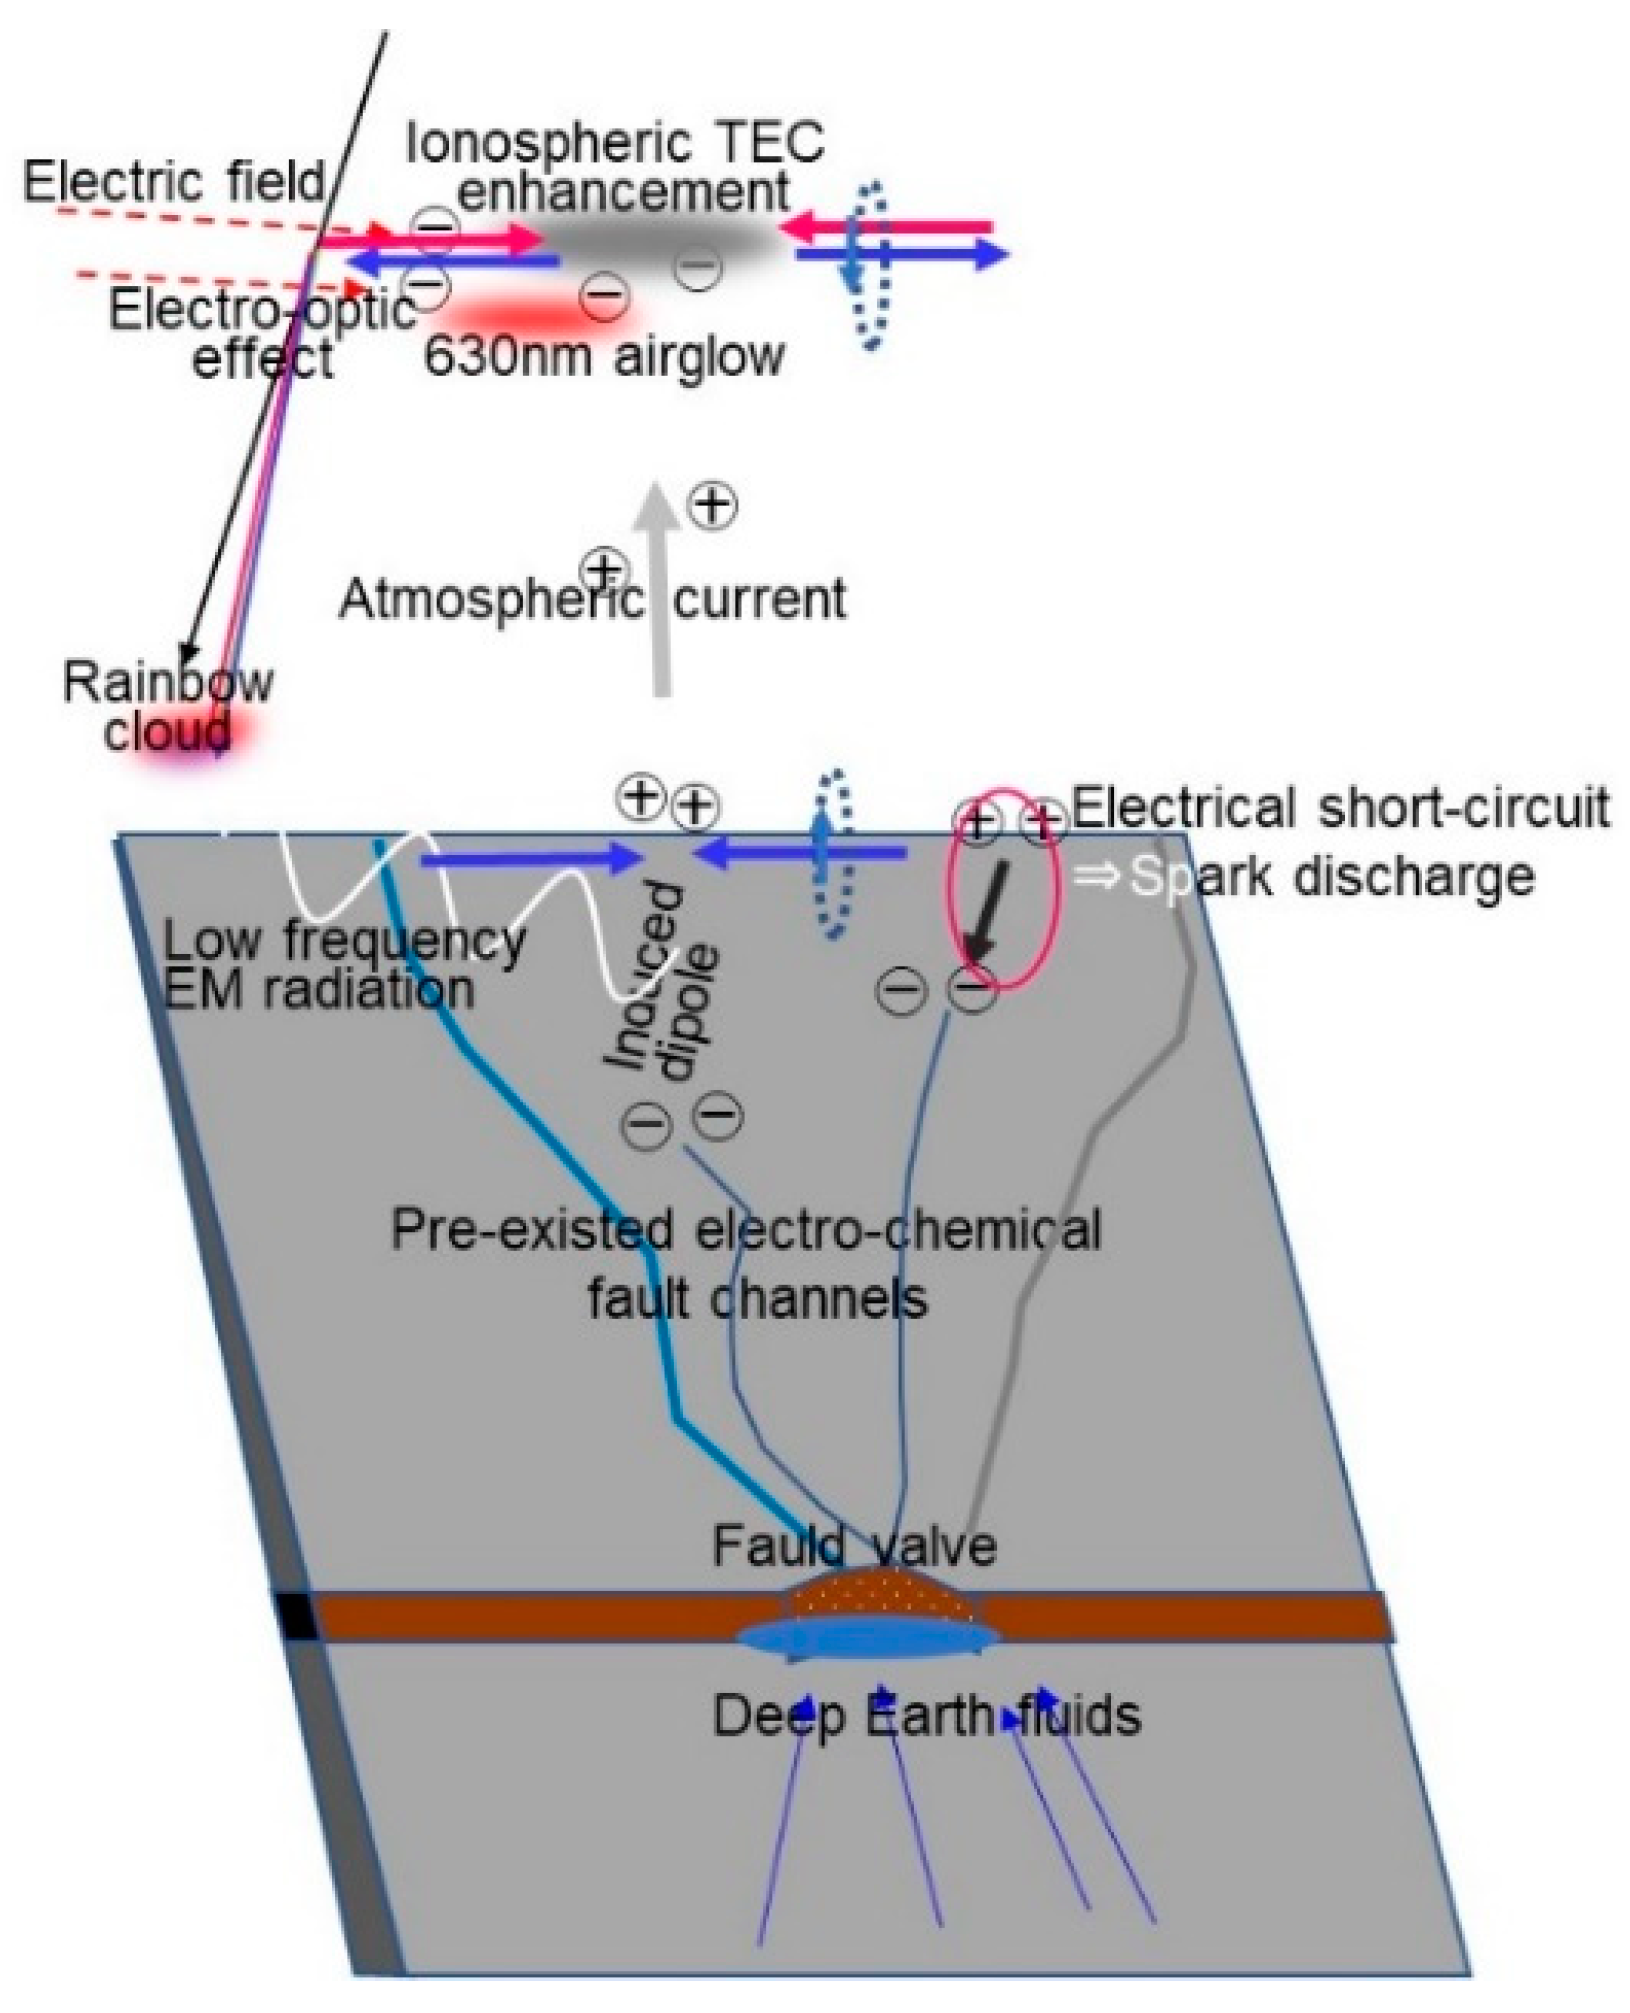
51]. Typically, MSTIDs propagate southwestward during nighttime, but on this occasion, it remained above the epicenter for approximately 30 min. This phenomenon may be attributed to the positive charge generated on the ground surface of the epicenter attracting ionospheric electrons (see
Appendix B). However, despite favorable weather conditions at the time, there were no eyewitness reports of a red sky visible from the ground, likely because the intensity was not sufficient to be discernible to the naked eye.
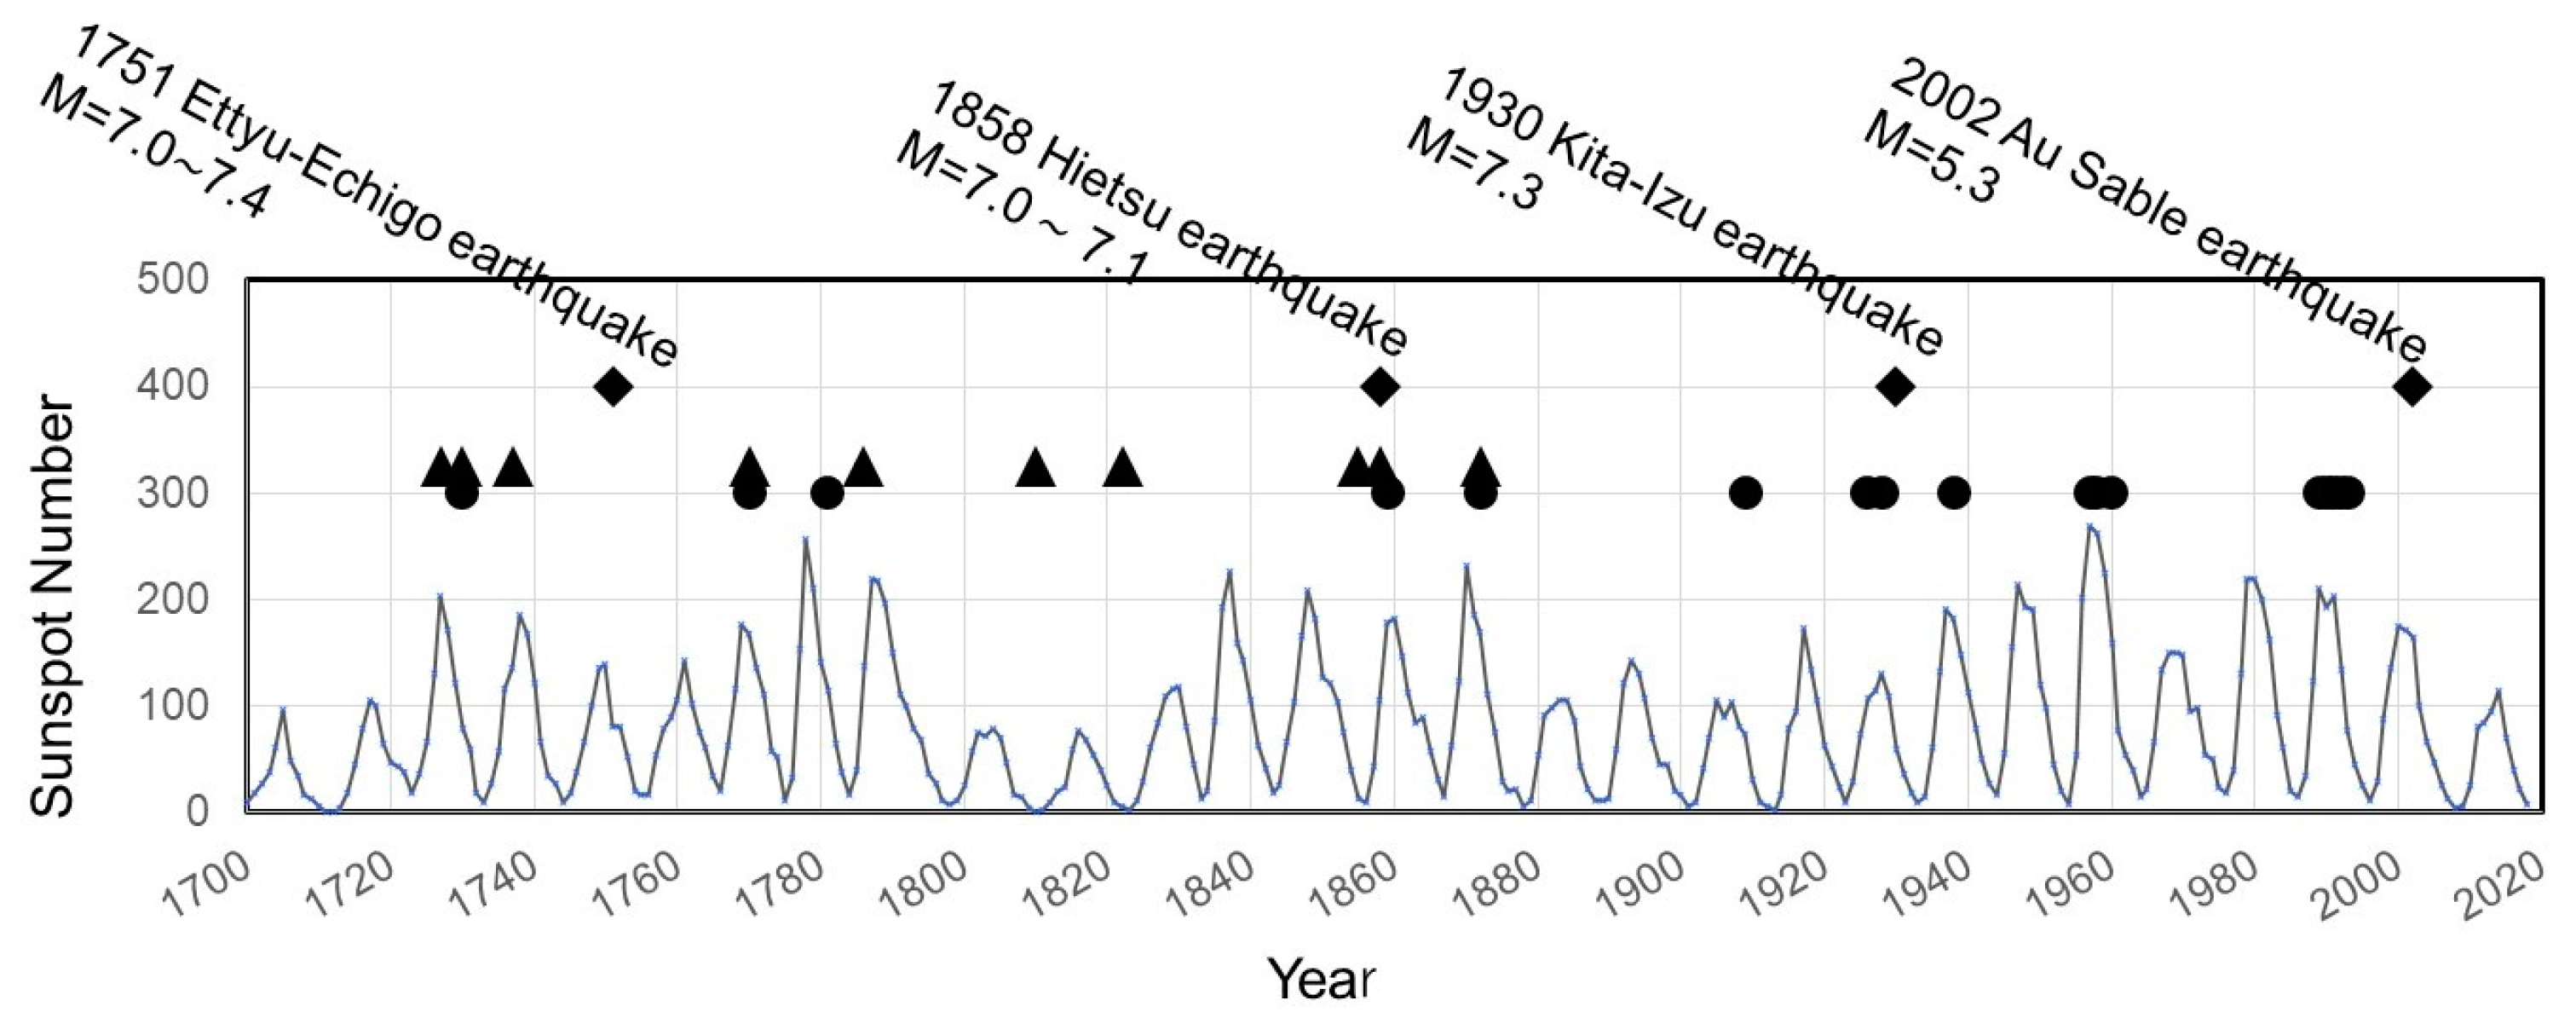
Figure 19 illustrates the relationship between the occurrence dates of aseismic and seismic reddish skies and sunspot activity. Both aseismic and seismic red skies have been observed during sunspot maxima.
In summary, the occurrence of seismic red sky might be attributed to the presence of a stagnant MSTID during the solar active period above the epicenter, thereby enhancing the 630 nm airglow. It is hoped that future investigations will further elucidate the causal relationships between seismic activity and the lithosphere-atmosphere-ionosphere coupling mechanism, leading to a clearer understanding of the phenomenon of red sky appearance.
12. Rainbow Cloud
This is a story from over a century ago: Mr. Kōkichi Mukuhira, an amateur researcher, attempted to predict earthquakes based on his personal observation of the relationship between earthquake occurrences and the appearance of rainbow phenomena beforehand. One day before the Kita-Izu earthquake that struck at 04:03 L.T. on 26 November 1930, he sent a telegram to the Dean of the Science department at Kyoto University stating, “Tomorrow morning at 4 o’clock, an earthquake will occur in Izu”, successfully predicting both the location and time of the event. The location where he observed the rainbow was 313 km northwest of the epicenter. This event not only garnered attention within academia but also among the general public, with some seismologists viewing it favorably [
52,
53]. However, the causal relationship between earthquakes and rainbows remains entirely unclear, and there are currently many skeptical opinions among scientific experts.
In the Showa Tonankai earthquake that occurred at 13:54 L.T. on 7 December 1944, an eyewitness in Shimizu, Shizuoka city, 273 km northeast from the epicenter, reported, “Around noon of that day (1–2 h before the earthquake), the spectrum of sunlight could be observed in thin clouds”, [
54]. However, there is insufficient information available for a scientific study.
When we examined overseas news, in the M8.0 earthquake that occurred at 14:28 C.S.T. on 12 May 2008 in China’s Sichuan Province, rainbow clouds appeared in three locations approximately 450–550 km away from the epicenter and were captured on video from 10–60 min before the earthquake [
55].
A circumhorizontal arc and a circumzenithal arc are known as rainbow phenomena that appear in the direction of the Sun, caused by the refraction of sunlight due to small ice crystals floating in the sky. The rainbow clouds observed during the Sichuan earthquake could resemble the circumhorizontal arc, but it may appear to be a different phenomenon (see
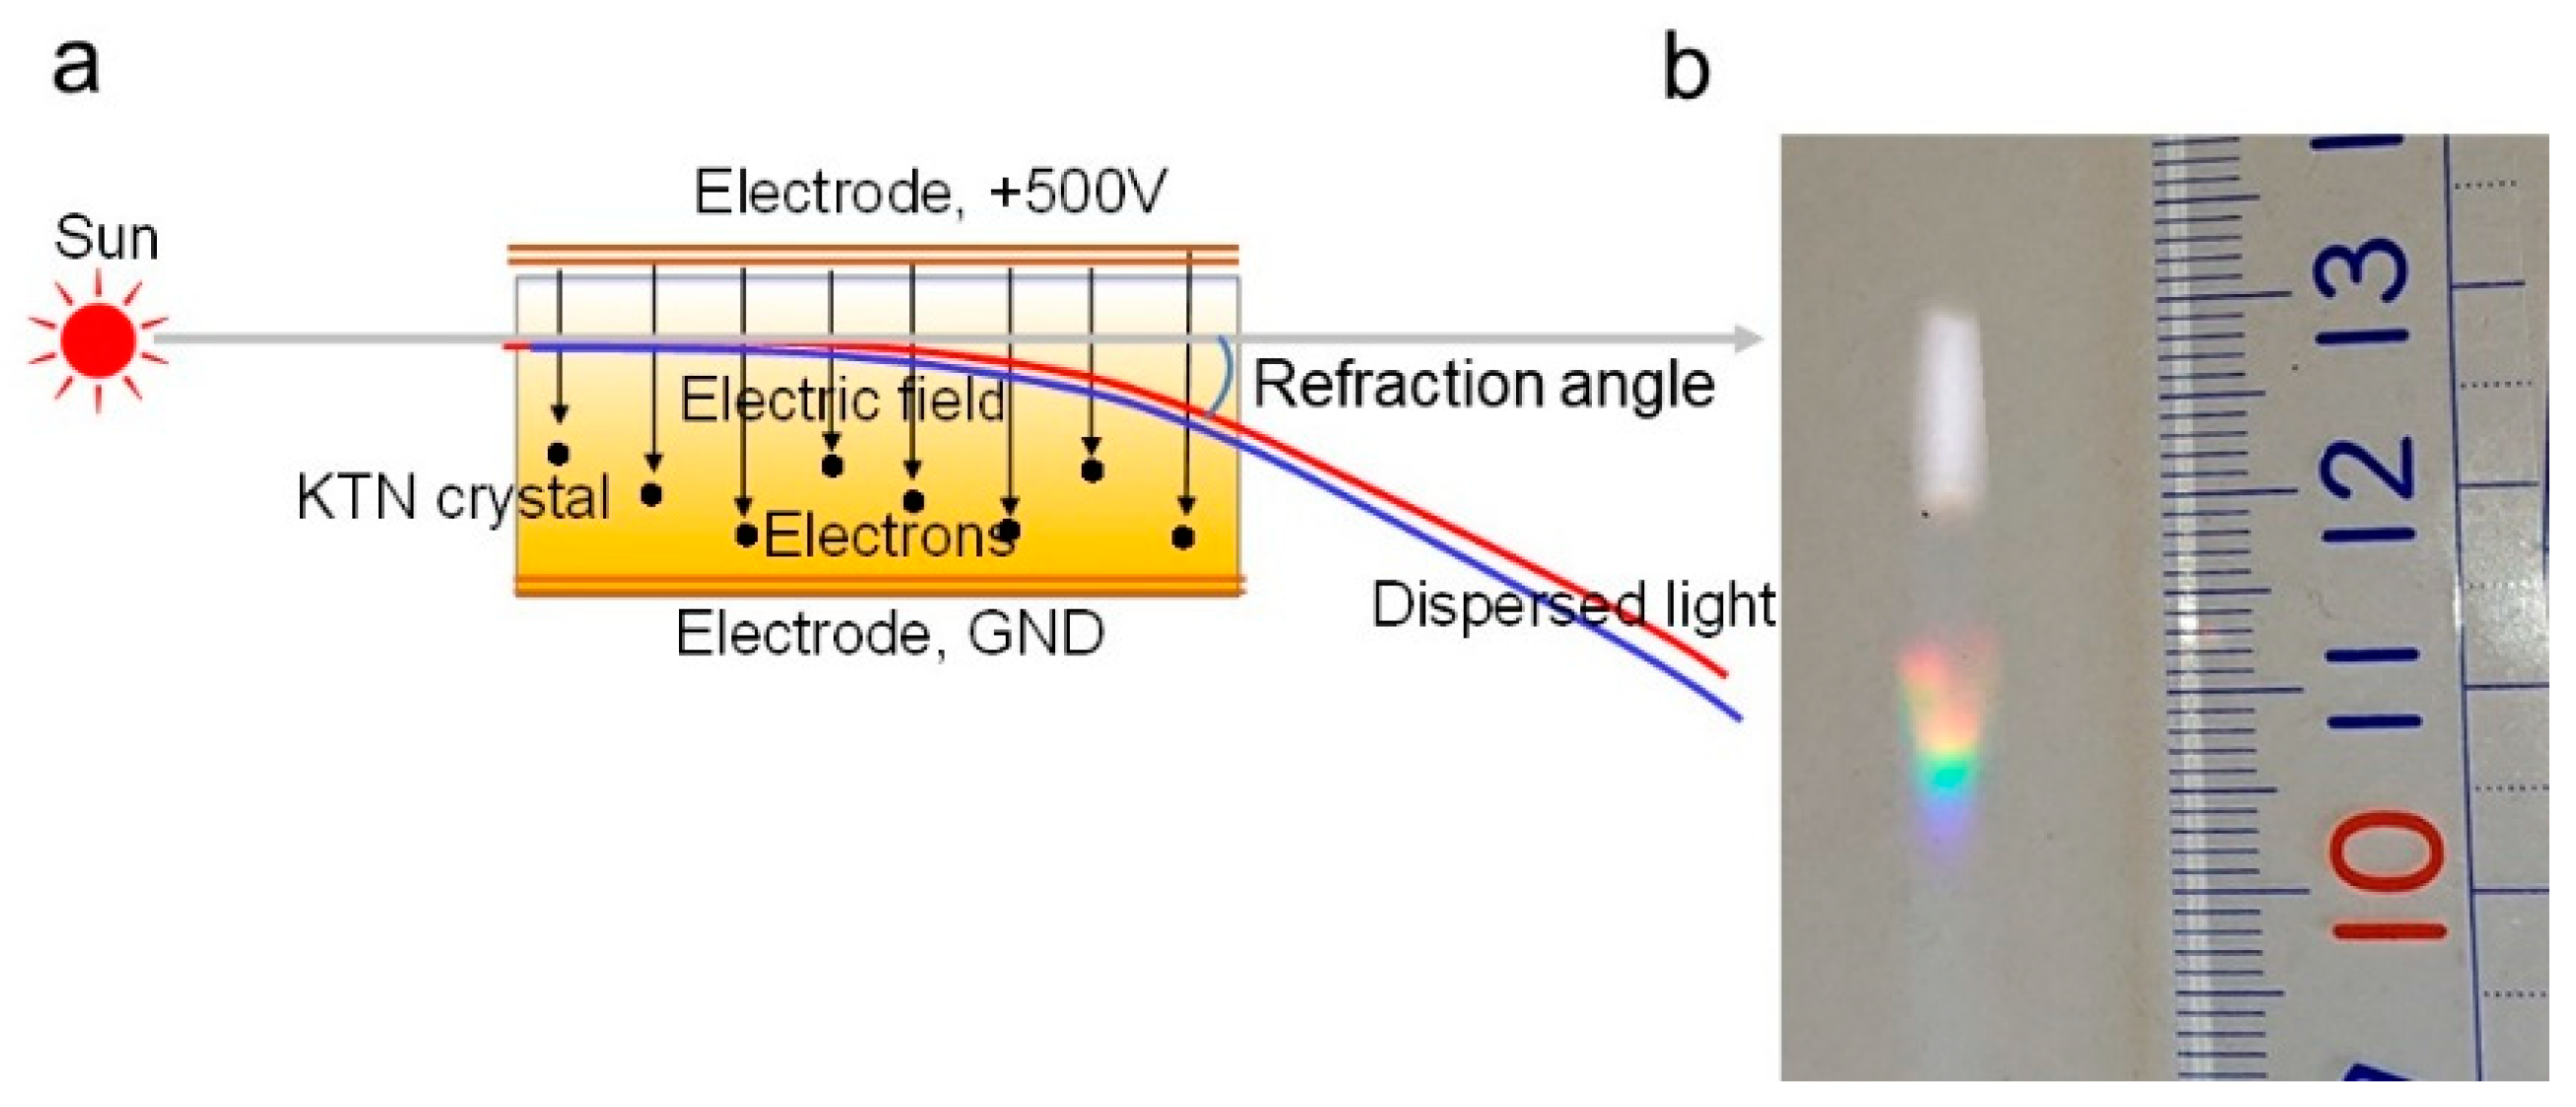
Appendix C). A probable alternative explanation might be attributed to the phenomenon caused by the electro-optical interaction of the enhancement in the ionospheric total electron contents above the epicenter with sunlight. The English-translated abstract regarding this topic in
Appendix C will be presented at the upcoming meeting of the Earthquake Prediction Society of Japan.
13. EQL as a Precursor Phenomenon
Rikitake’s book “Earthquake Precursor Phenomena” (1986) [
53] covers a plethora of precursor data for earthquakes that have occurred in Japan since 1964, when “Japan’s earthquake prediction program” started. It also includes data for major earthquakes that occurred before 1964, such as the 1923 M7.9 Great Kanto earthquake and the 1944 M7.9 Showa-Tonankai earthquake. The collected items encompass crustal anomalies observed in geodesy, tide gauges, tilt, strain, b-value, seismic wave velocity changes, etc.; electromagnetic anomalies such as earth currents, electromagnetic radiation, etc.; and geochemical anomalies such as radon, groundwater, etc. [
54,
56].
He observed that among the crustal anomalies, the relationship between the precursor period T (in days) and the earthquake magnitude M can be expressed as follows:
which he referred to as precursors of the first kind. Conversely, the relationship concerning both geochemical and geo-electromagnetic anomalies is expressed as:
which he referred to as a quasi-first type antecedent phenomenon.
Eyewitness testimonies of EQL were also collected in the precursor text data by Rikitake [
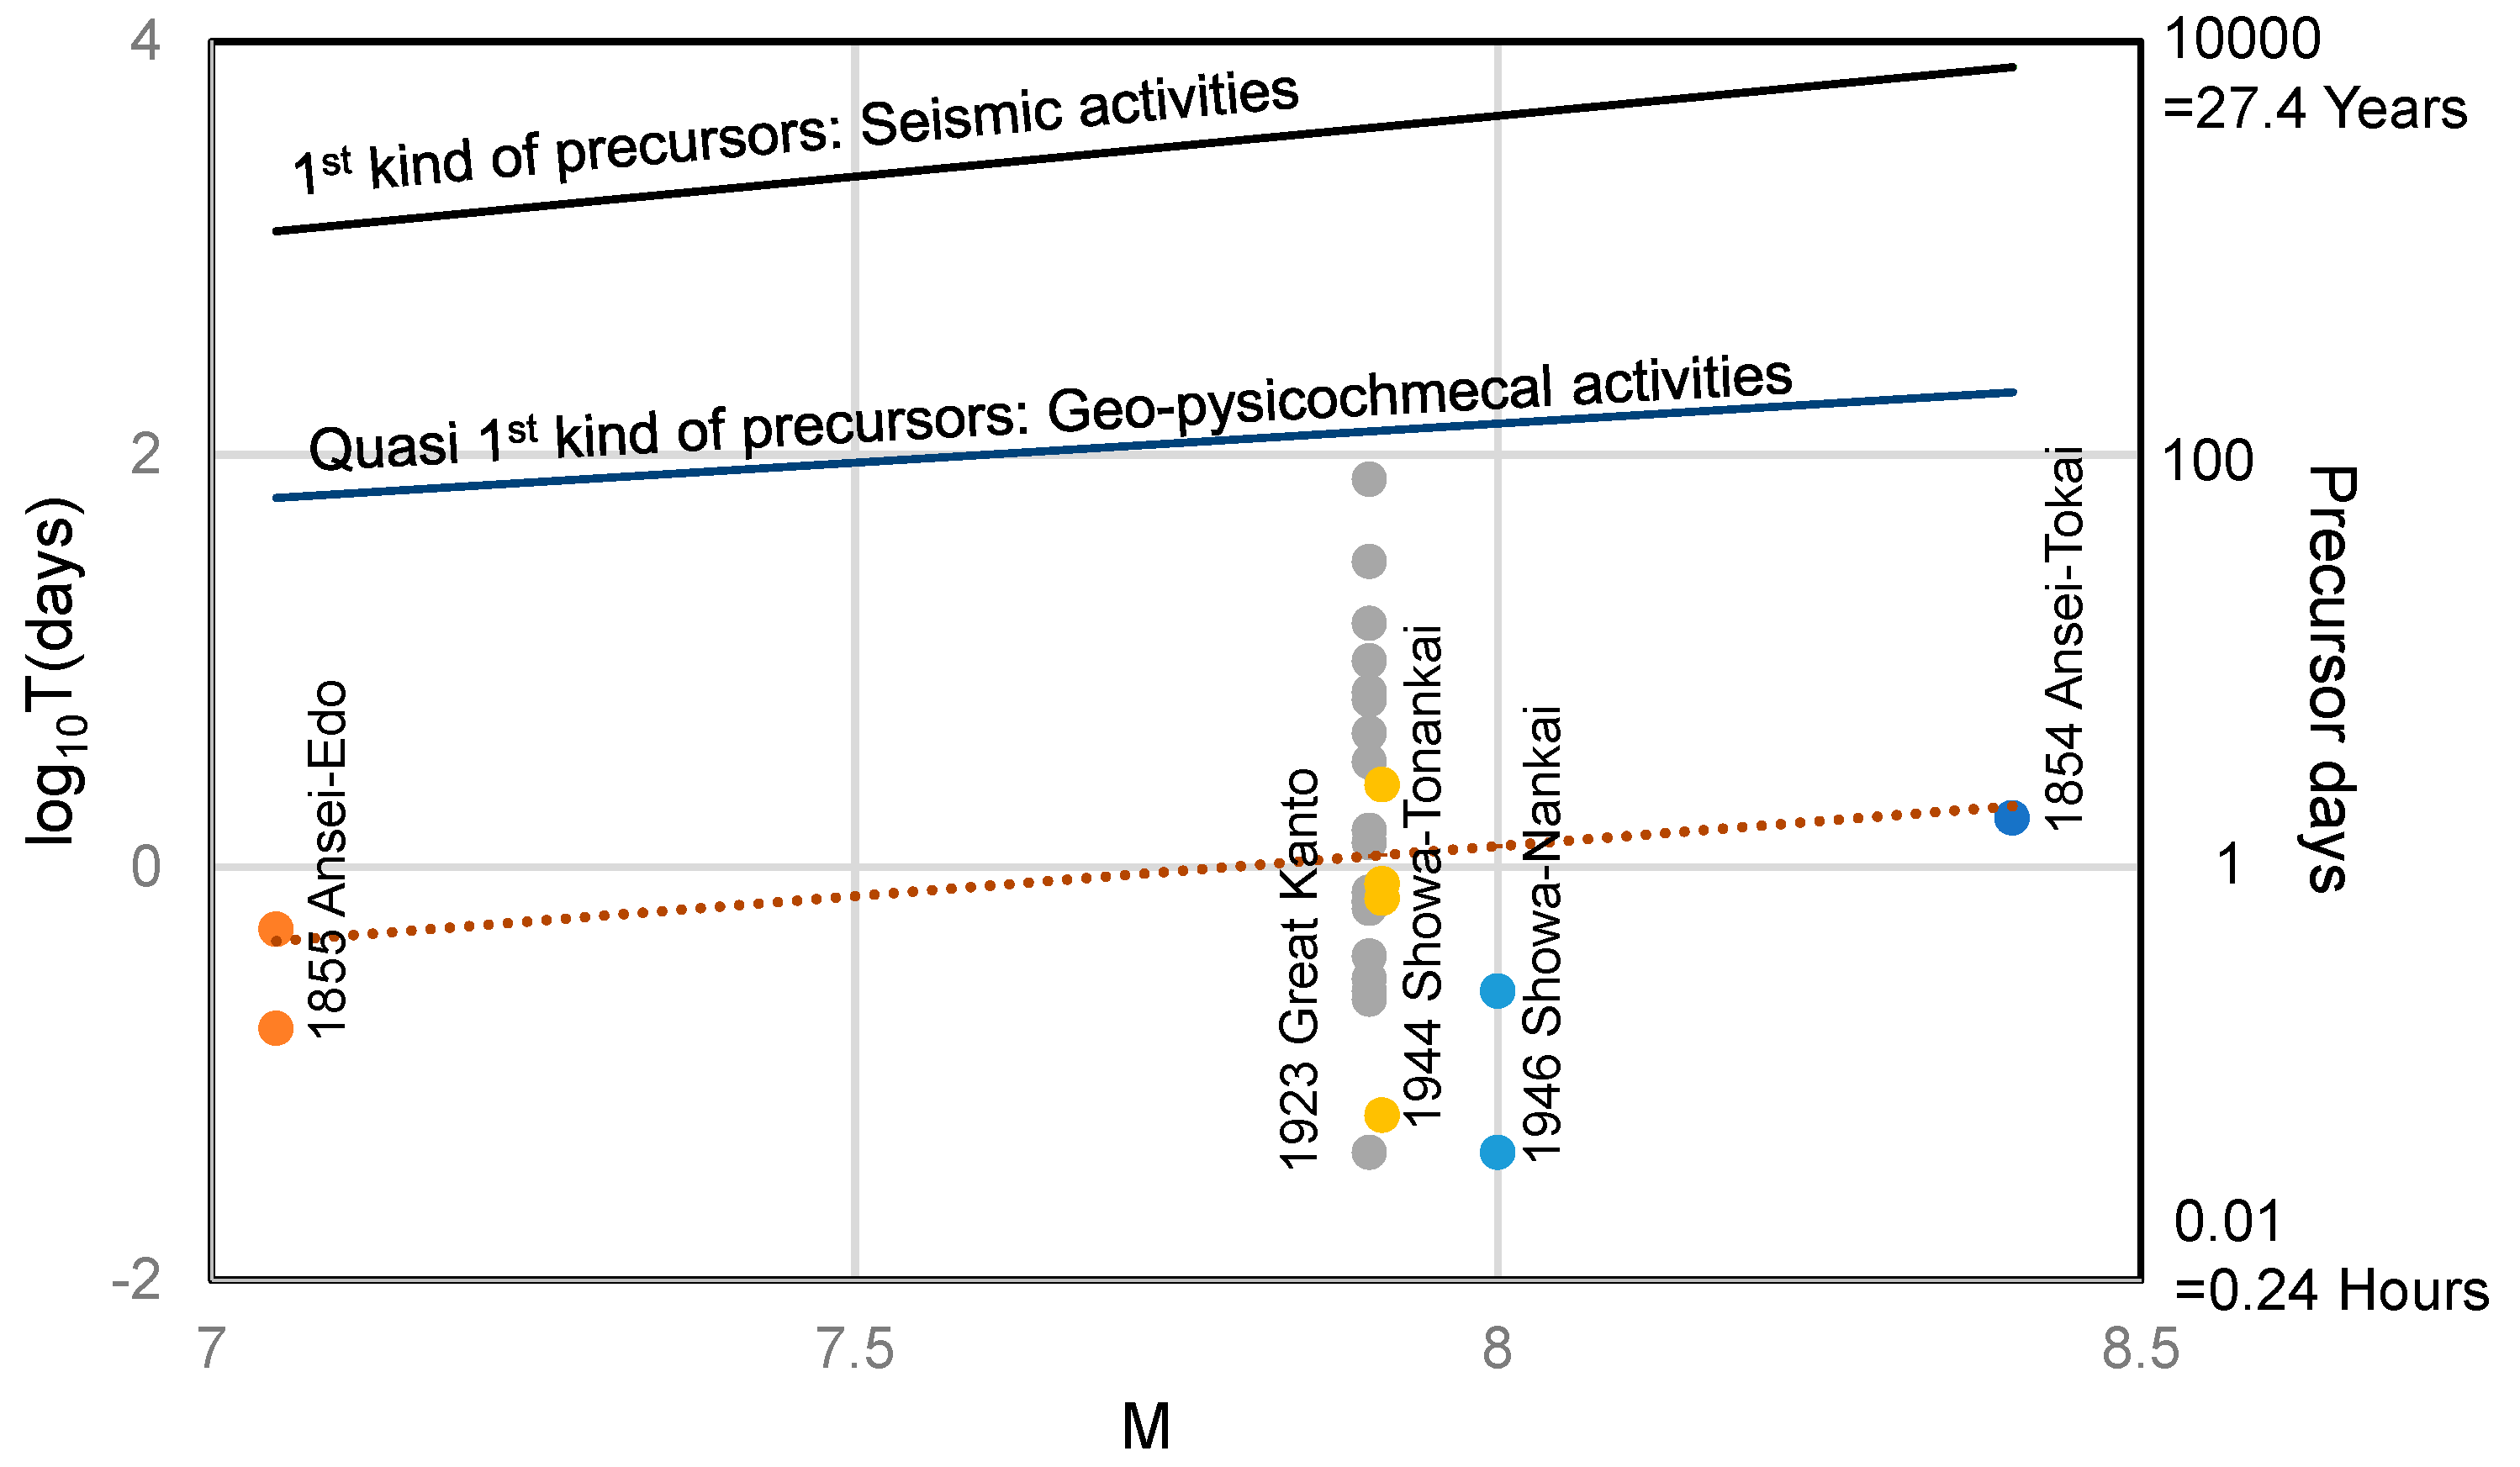
53]. However, because he held a skeptical opinion on the EQL, he was excluded from the aforementioned analyses. Nevertheless, as mentioned earlier, we have demonstrated that EQL were genuine phenomena associated with earthquakes. Therefore, based on the EQL data comprising a total of 34 testimonies for four major earthquakes [
54], we investigated the relationship between log
10T(days) and M, expressed as follows (see
Figure 20):
Both Equations (1) and (2) are also depicted in
Figure 20 for comparison purposes. It is evident that the precursor period of EQL is shorter than those of crustal anomalies and geochemical/electromagnetic anomalies.
Although the number of EQL phenomenon cases is still limited and nothing can be said for certain, if it were possible to observe EQL at multiple points day and night using infrared surveillance cameras in regions where large earthquakes are a concern, it might not be impossible to predict these earthquakes just before they occur.
14. Discussion and Summary
In the preceding sections, we have delineated the typical characteristics of EQL and explored the potential underlying mechanisms. We posit that EQL are primarily influenced by seismic physicochemical variations within the geological structure of fault zones in the lithosphere, where deep fluids are present. Additionally, various seismic variations in the hydrosphere, atmosphere, and ionosphere interact with each other, contributing to the manifestation of distinct anomalous phenomena.
Such earthquakes are believed to occur when strain energy accumulated at plate boundaries and/or adjacent fault planes reaches critical levels, leading to dynamic rupture. Furthermore, we observe that significant earthquakes follow a recurring process consisting of: (i) tectonic loading due to relative plate motion, (ii) quasi-static rupture nucleation, (iii) dynamic rupture propagation and cessation, and (iv) fault strength recovery [
57].
We now delve into the positioning of EQL processes within the seismic cycle. Although the role of fluid in the mechanical processes (i)–(iv) is not explicitly delineated, deep Earth fluids exert a substantial influence on seismic activities. A plausible model to elucidate this influence is the concept of a fault valve and the fluid reservoir beneath it [
58,
59]. Tectonic stresses and trapped fluid pressures collectively exert strain on the fault valve, eventually reaching a critical point and initiating quasi-static rupture, culminating in seismic events. During the onset of quasi-static fracture, highly mobile deep gases continue to ascend, causing microcracks to widen. This process may give rise to various types of electromagnetic phenomena, including EQL as elucidated in the electromagnetic fault model outlined in
Appendix B.
In summary, various types of EQL can be incorporated into the earthquake cycle (iii)–(iv), as depicted in
Figure 21. Although this review aims to cover almost all types of EQL observed during historical earthquakes, the immense energy released by major earthquakes may generate even more enigmatic EQL in the future than those recorded so far. Even if such EQL occur only once every thousand years, and verifying hypotheses about them is inherently difficult, it is still meaningful to continue unraveling these mysteries using the scientific knowledge we have accumulated. This scientific pursuit, with a sound scientific base, should continue within the framework of seismology.
