Abstract
The achievement of dual carbon goals varies significantly across Chinese provinces due to the differences in resource endowments and socioeconomic development levels. These variations impose distinct pressures for transitioning along different socioeconomic development paths. Exploration of orderly carbon reduction paths for each province is, thus, crucial, but current predictions have not adequately integrated provincial development plans and carbon emission convergence trends. This study combines the Intergovernmental Panel on Climate Change (IPCC’s) shared socioeconomic pathways (SSPs) with a dual-layer target-setting approach based on trends in carbon emissions and each province’s five-year plans. The scalable stochastic impacts by regression on population, affluence, and technology (STIRPAT) model and ridge regression method were employed to identify the factors influencing carbon emissions. Carbon peak values and timing were then predicted for provinces under different scenarios. The results indicate that total carbon emissions are primarily influenced by provincial economic level and population, with spatial and temporal variations in the driving factors. Carbon emissions are ranked from low to high in the following order: SSP1, SSP2, and SSP5. Provinces were categorized into four tiers based on their peak times: early, on-time, delayed, and significantly delayed peaking. Under SSP1, 24 provinces would achieve carbon peaking as scheduled. Under SSP2, only 17 provinces would achieve carbon peaking on time. Among the first-tier provinces, Beijing and Shanghai would achieve peak carbon five to eight years ahead of schedule; the second-tier provinces of Henan, Fujian, Guangdong, and Inner Mongolia would achieve peak carbon by 2030; the third tier would achieve carbon peak before 2035; and the fourth tier would gradually reach peak carbon before 2050. Policy implications for differentiated carbon peak paths are proposed for different regions based on these findings.
1. Introduction
China is a vast country with significant differences in resource endowment, economic development level, and carbon emissions characteristics [1,2,3]. As such, it is impractical to require all provinces in China to reduce their carbon emissions in a uniform direction and pace [4]. Achieving the dual carbon goal is a broad and profound economic and social systemic change, and the objective reality that the distributions of resources and industrial division of labor in various regions differ widely and do not march in unison, as in one size-fits-all approaches, must be recognized [5]. Dual carbon policy–oriented green transformation is a long-term goal that needs to be established before breaking. It must be based on national conditions, not be detached from reality, engage in campaigns for carbon reduction, and step on the emergency brake for climate change [6]. In view of its importance and the regional differences in the dual carbon strategic position of Chinese provinces, prediction of regional differentiated carbon emission reduction paths is critical for realizing national dual carbon goals [7]. Carbon emission characteristics under different scenarios [8], as well as both the emissions targets and the required socioeconomic development levels, should be considered. This would lead to the selection of the more reasonable of the different development pathways [9].
Forecasting carbon emissions begins with the identification of influencing factors and determining the mechanisms of carbon emissions. Most studies use models to identify the impact of drivers on historical carbon emissions [10,11]. To further analyze the impacts of these drivers on future carbon emissions, the literature often adopts scenario analysis combined with sensitivity analysis to identify the driving characteristics of carbon emissions [12,13]. For example, carbon emission factors have been identified and analyzed through the single-factor identification method and the combination identification method [14,15]; these include the LMDI index decomposition model [16] and the stochastic impacts by regression on population, affluence, and technology (STIRPAT) model [17], among others. The results indicate that the drivers of carbon emissions cover roughly four dimensions: economic development, industrial structure, population size, and technology level [18]. If further subdivided, as in the current study, GDP per capita [19], population size and urbanization level [20,21], industrial structure [22,23], level of foreign investment and open trade [24,25], level of human capital [26], and intensity of environmental regulation [27,28] are all factors that have an important impact on carbon emissions. Determining the quantitative relationship between the influencing factors and carbon emissions is a relatively mature and mainstream method for predicting carbon emissions according to changes in the influencing factors [29,30,31].
Considering the complex and diverse attributes of the economy and society, scenario modeling has often been used for comprehensive projections of climate assessment [32,33,34,35,36]. The scenario setting commonly used to predict China’s future carbon emissions evolution aligns with optimistic, baseline, and pessimistic scenarios [37,38,39,40], which predict the carbon peak path maps and timetables for different Chinese provinces [41,42,43,44]. However, the use of internationally comparable scenario frameworks is still rare. Shared socioeconomic pathways (SSPs) [45,46,47] are predictions of multidimensional data indicators for a society based on historical data. This modeling approach integrates climate policies adopted by countries and provides multiple baseline scenarios for integrated simulation [48]. It provides a unified and scientific framework standard [49] and benchmarks the IPCC. In addition, SSPs provide a comparable framework for carbon emission projections for the comprehensive study of climate change.
The government has led activities for the realization of China’s carbon peak goal, which has been promoted by various departments [50]. Local planning is forward-looking and oriented; it is an important basis for governments at all levels to fulfill their responsibilities [51,52,53]. It is also a policy tool for the government to govern public affairs that is conducive to lower-level governments so they can position and promote policies according to local strengths and weaknesses [54,55,56,57]. However, the government’s strong attributes and important role in local development plans in China have been less widely mentioned in carbon emission forecasting studies. Dealing with the combined objectives of local planning and the international common scenario framework setting remains difficult. Thus, it is important to integrate local planning into the SSP framework while considering regional socioeconomic characteristics and policy measures. This integration allows for the estimation and simulation of key factors such as population, economy, urbanization, and technological utilization efficiency, which are crucial for predicting the carbon peak pathways of various provinces in China.
To this end, we address these research gaps by analyzing the provincial carbon peak timetable and pathway maps under local development plans. An integrated assessment method is adopted based on the SSPs proposed by the IPCC that combines the STIRPAT model and the different scenarios, while considering the implementation of climate policy and the resulting uncertainty of future socioeconomic development. Following the CEADs database [58], the total carbon emissions of 30 provinces (except Hong Kong, Macao, Taiwan, and Tibet) in China between 2000 and 2021 were statistically analyzed to provide the historical spatial–temporal distribution of emissions. Next, the driving factors and directions of carbon emissions were identified based on the STIRPAT model. This was then combined with China’s “14th Five-Year Plan and Long-Range Objectives Through the Year 2035” and the convergence trend of European countries that have already reached the peak, using the conditional convergence model to predict the key parameters of industrial structure and energy intensity. Three different development paths were then constructed—SSP1, SSP2, and SSP5—to predict the total change in carbon emissions in each region. Finally, the regions were classified into four categories according to when they reach peak carbon and the timeframe, and further analysis was conducted to examine the mechanisms and optimal carbon reduction pathways for each province. Our findings provide essential insights into the priority of carbon peak implementation challenges at different spatial levels in China to accelerate the achievement of both the dual carbon and sustainable development goals.
The marginal contributions of this paper are reflected in the following three aspects: (1) integrating the STIRPAT model with SSP analysis, combining climate policy and long-term economic development plans, and forecasting carbon peaking based on the current carbon emissions and differentiated development levels in each province, which expands the application of SSPs at the regional scale in China; (2) the two-tier setting of short-term and long-term targets was constructed that considers international development trends and the targets of different development stages in China, which makes the prediction results more scientific; and (3) carbon reduction efficiency is included in the discussion of carbon reduction paths, and differentiated paths are proposed based on local conditions.
2. Methodology and Data
2.1. Modeling Framework
Predicting carbon emissions involves identifying emissions factors and selecting scenario simulation methods. First, the driving factors and their directions are identified for each province using the STIRPAT model. Second, the scenario simulation methods are selected by summarizing the carbon peak programs in the 30 Chinese provinces and local “14th Five-Year Plan Outline and 2035 Vision Plan” using the conditional convergence model to deal with target setting. This is combined with the data indicators from European countries that have already reached peak carbon to predict changes in key parameters such as industrial structure, energy intensity, and the overall changes in carbon emissions. The overall rate of change is then predicted with reference to three paths: SSP1, SSP2, and SSP5 (the changes in carbon emissions under the paths SSP3 and SSP4 are not considered; as the relevant target setting and development law under these paths do not match the country’s core development purpose, simulation and prediction are not carried out). The overall technical route of the study is illustrated in Figure 1 to connect each part and assist in reading. The picture is divided into five parts, which closely align to the structure of the paper: identification of carbon emission factors, setting the carbon emissions scenario, dynamic classification of the 30 provinces, realization of carbon peaks in each province, and the conclusion. Each module contains a complete presentation of the methods and data used.
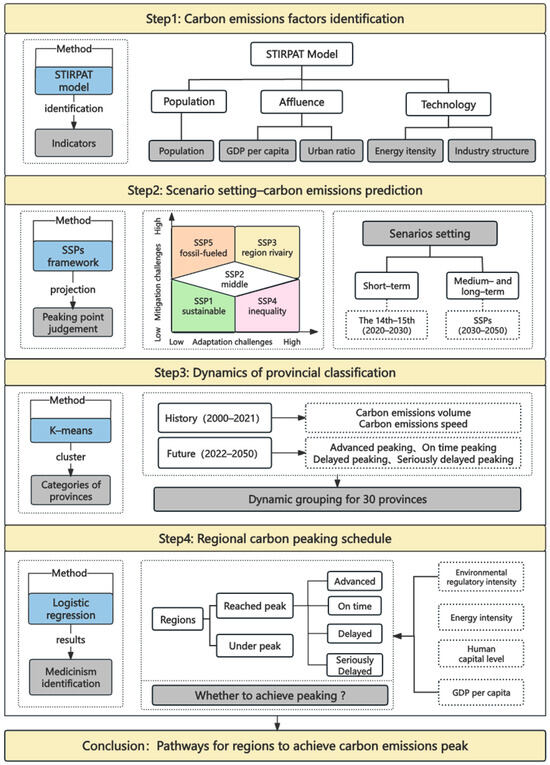
Figure 1.
Technical route.
2.1.1. Driver Analysis
The STIRPAT model is the most widely used and highly recognized model for the study of peak carbon emissions; it is a nonlinear model obtained by expanding on the basis of the traditional IPAT model, which can quantitatively examine the relationship between carbon emissions and various influencing factors. It has good flexibility and a certain degree of space for expansion; it can be expressed as follows:
where denotes environmental pressure; , , and denote population size, affluence, and technology level, respectively; a is the model coefficient; b, c, and d denote the elasticity coefficient of the corresponding variables, respectively; and e is the model error term. Drawing on existing studies [17] and combining the elements of the SSP scenarios, population size was used to represent population, wealth level is indicated by GDP per capita and urbanization rate, and the share of use of the tertiary sector and energy intensity are proxies for technological level; the five variables were introduced into the model and further expanded as Formula (2):
where indicates carbon dioxide emissions; is the population size; is per capita GDP; is urbanization rate; is energy intensity; is the proportion of tertiary industry; a is the model coefficient; b, c and d denote the elasticity coefficients of the corresponding variables; e is the model error term.
2.1.2. Scenario Setting
A two-tier scenario analysis was conducted: the external scenario was based on the SSP framework to determine the development path and rate under the projected scenarios. The internal scenario was based on the “14th Five-Year Plan Outline” formulated by the Chinese government and the data indicators of the European countries that have already reached peak carbon to set the convergence target. In the external framework, China’s development rate and change trend coincide with the world’s development trajectory, while in the inner framework, it is consistent with the national development plans target setting based on not conflicting with the target values of the peak carbon countries.
- Shared socioeconomic pathways
SSPs are scenarios describing future global socioeconomic development that provide a reference framework for climate change research and improve the consistency and comparability of research results. SSPs cover different social, economic, and environmental conditions that may occur, as well as the different policy and technology options under those conditions. The framework also divides future global socioeconomic development into five paths—SSP1, SSP2, SSP3, SSP4, and SSP5—with each path representing a development direction and policy option (shown in Table 1).

Table 1.
Goal differences for shared socioeconomic pathways.
- 2.
- Parameter setting and model simulation methods for medium-term and long-term development plans
According to the “14th Five-Year Plan Outline and Visionary Goals for the Year 2035” of the National Economic and Social Development of the People’s Republic of China (shown in Table 2), the following energy scenarios were set: “reduce energy consumption per unit of GDP by 13.5% compared with 2020” and “with the continuous promotion of technical energy conservation, structural energy conservation and management energy conservation, China’s energy consumption per unit of GDP is expected to decrease by about 30% in 2030 compared with 2020”.

Table 2.
Carbon peak programs and target setting in the 30 provinces.
Based on the SSP energy development scenarios and speeds, this study establishes target values for energy-related indicators in each province, autonomous region, and municipality in China, while ensuring consistency with the overall and provincial-level energy development plans. More specifically, this study (1) reviews and analyzes the energy development plans and policies of each province, autonomous region, and municipality, as well as the energy-related indicators and target values set forth in these plans; (2) consults publicly available information, such as the “Energy Development ‘14th Five-Year Plan’ Implementation Opinions” and “Carbon Peak Implementation Plans” of each province, as well as the “Implementation Opinions on Fully Promoting the New Development Concept and Doing a Good Job in Carbon Peak and Carbon Neutrality Work” issued by relevant departments; (3) coordinates and adjusts the specific parameters and variables of each province, autonomous region, and municipality according to local development realities and national parameters; and (4) analyzes and evaluates the impact of different energy development scenarios and speeds on the energy-related indicators and target values for each province to provide recommendations for adjusting the energy development plans and policies.
2.1.3. Model Parameterization
- Population projection modeling and parameterization
Population is an important factor leading to carbon emissions [20]. The population–development–environment (PDE) model was used here to make population projections [46]. The core idea of the PDE model is that population is viewed as an ecosystem, and the future population state depends on the existing population size and structure, which affect the regeneration capacity of the future population of a region through the fertility rate, mortality rate, and migration in and out of the region. The specific mathematical expressions of the PDE model are shown in Formulas (3)–(6):
where t stands for the t(th) year, n stands for a given year (n years), P stands for the population size, D stands for the mortality rate, M stands for the net in-migration (net in-migration is positive and net out-migration is negative), F stands for the number of females, FR stands for the age-specific fertility rate, f_r stands for the proportion of females in the new-born population, and P_Z stands for the total number of people.
The PDE model was combined with the description of the SSPs population scenarios to construct a complete scenario for the future development of the SSP population in terms of fertility, mortality, and migration rates (Table 3). Population projections were based on data from the sixth and seventh national censuses, including the number of men and women in each age group, the total fertility rate, and average life expectancy.

Table 3.
SSPs population scenario setting.
- 2.
- Industrial structure forecasting model and parameterization
Industrial structure is another important factor affecting the level of carbon emissions [22]. The conditional convergence method was used to set the short-, medium-, and long-term targets for the level of industrial structure in the period of 2022–2050 based on the convergence rates of different scenario paths, data from indicators in countries that have already reached peak carbon, and the “14th Five-Year Plan Outline” of each province. In the short term, the baseline scenarios were set based on the binding targets for 2025 and 2030, as shown in Table 4.

Table 4.
Scenarios for the convergence in the level of industrial structure (short-, medium-, and long-term).
- 3.
- Energy intensity prediction model and parameterization
Promoting the transformation in the mode of economic growth and improving the efficiency of energy use is crucial for enhancing the quality of economic development [24]. Energy intensity was therefore selected as a technical indicator to measure the efficiency of energy use and to assess and forecast future development. Future scenarios were based on the development path under the SSP framework, with reference to the historical trends and information from the “Outline of the 14th Five-Year Plan and Visionary Goals for the Year 2035” of the National Economic and Social Development, the National Bureau of Statistics, and the development plans of each province. The conditional convergence method was adopted to set the target value with additional reference to the energy intensity convergence trends of three countries that have already reached their carbon peaks: Italy, Germany, and the Netherlands. The established energy scenarios are shown in Table 5.

Table 5.
Scenarios setting for the convergence in the level of energy intensity (medium-term and long-term).
2.2. Data Sources
The data studied in this paper fall into two categories: historical data (including socioeconomic data and carbon emissions data) and model prediction parameters. The historical data are all from the National Bureau of Statistics, the Provincial Statistical Yearbook, and the Energy Statistical Yearbook (2000–2021). The population data are from the sixth and seventh census data of the difficult areas, and the data on carbon emissions in the past years are from the CEADs database. The model prediction parameters include the parameter prediction of five indicators of economic development, population size, urbanization degree, industrial structure, and energy intensity from 2022–2050. The data for predicted GDP and urbanization degree under the SSP scenarios are from the team’s existing research [47]. By constructing a long-term GDP forecasting framework with technological progress and human and physical capital formation as the main drivers of economic growth under the five SSP scenarios, China’s GDP growth dynamics were predicted using the Cobb–Douglas production function. A logistic model with saturation constraints was also used to capture the urbanization model correlation coefficients to predict the rate urbanization under the subpaths. Table 6 shows the relevant indicators.

Table 6.
Construction of data indicators.
3. Results
3.1. Historical Carbon Emissions Trends in Chinese Provinces
According to statistical data, the cumulative total carbon emissions of China’s provinces (excluding Hong Kong, Macao, Taiwan, and Tibet) from 2000 to 2021 rose year after year, but the rate of growth has also started to slow down, which indicates that the “The 12th Five-Year Plan” and “The 13th Five-Year Plan” periods achieved remarkable progresses in “dual control of energy consumption” and related environmental policies. Currently, there are similarities and differences in cumulative carbon emissions and trends among provinces. To facilitate the analysis of these commonalities and differences, provinces were categorized into four regions according to the dimensions of total carbon emissions and the indicators of the rate of carbon emissions. Region I: Carbon Emissions Reduction Leader Region (Figure 2), which includes Beijing, Shanghai, Chongqing, Tianjin, Jilin, and Yunnan, where the average total carbon emissions are small and the average rate of carbon emissions follows a downward trend. Yunnan experienced a short-lived downward trend in 2004, and data from the upper and lower years suggest that the difference mainly stems from raw coal—used to produce and supply electricity, steam, and hot water—and coke, used for the smelting and pressing of ferrous and nonferrous metals. Region II: Carbon Emissions Reduction Potential Region (Figure 3) has low average total carbon emissions, but the average rate of carbon emissions is rising; this region includes Fujian, Jiangxi, Guizhou, Shaanxi, Gansu, Guangxi, Ningxia, Qinghai, and Hainan. However, Hainan showed a downward trend in 2001, and further analysis of the sources of carbon emissions in 2000 and 2002 revealed significant differences in the use of raw coal, diesel fuel, and natural gas; its energy consumption was primarily for agriculture, forestry, animal husbandry, fisheries, and water conservancy. Region III: Carbon Emissions Reduction Stable Region (Figure 4), which has large average total carbon emissions but a decreasing average rate of carbon emissions; it includes Henan, Liaoning, Heilongjiang, Hunan, Hubei, and Sichuan. Region IV: Catching-up Region (Figure 5), which has large average total carbon emissions and an increasing average rate of carbon emissions; it includes Hebei, Inner Mongolia, Shandong, Shanxi, Xinjiang, Anhui, Jiangsu, and Guangdong.
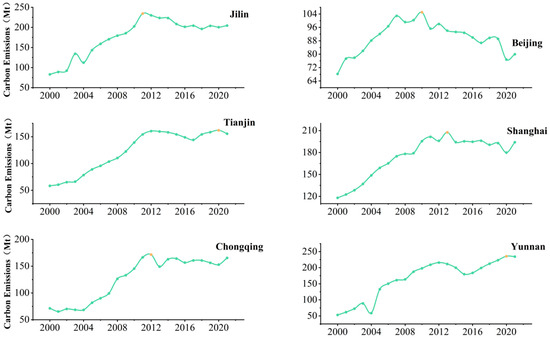
Figure 2.
Historical trends in carbon emissions, 2000–2021 (Region I—Leader Region).
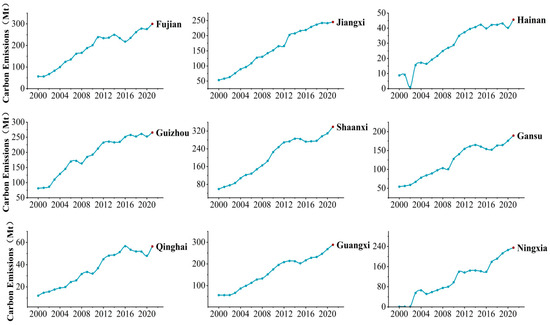
Figure 3.
Historical trends in carbon emissions, 2000–2021 (Region II—Potential Region).
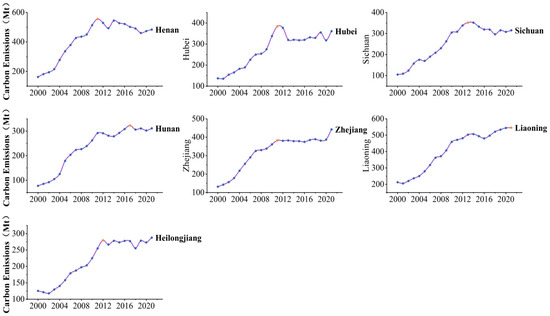
Figure 4.
Historical trends in carbon emissions, 2000–2021 (Region III—Stable Region).
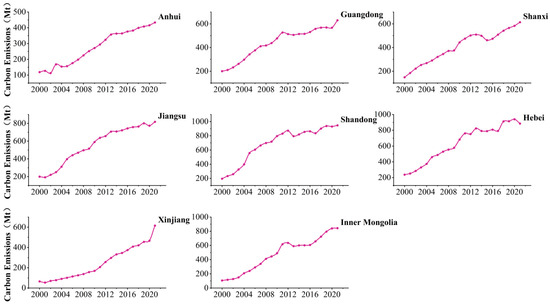
Figure 5.
Historical trends in carbon emissions, 2000–2021 (Region IV—Catching-up Region).
At present, the carbon emissions in Region II and Region IV are still rising, which means that the provinces in this region may face greater pressure to reduce carbon emissions and will take longer to transform their industrial structure. The annual carbon emissions of the provinces in Region IV reach about 800–1000 Mt, primarily because low-carbon transformation has not yet occurred in the industrial structure, and the distribution of heavy industries and pollution is more intensive. Region I, due to advantages such as policy precedence, is very likely to be the first to achieve peak carbon and face less pressure to reduce carbon emissions.
3.2. Drivers of Carbon Emissions in Chinese Provinces
Based on historical data from 2000 to 2021, national and regional carbon emissions and related influencing factors were fitted using the STIRPAT model. To address the issue of multicollinearity among variables, regression analysis was conducted using ridge estimation, a modified least squares method, to avoid overfitting between variables. The model was ultimately stabilized at k = 0.04, achieving a fit of 0.981. This resulted in a more significant regression equation, following Formula (7):
The ridge regression results show that population size and urbanization level are the drivers of carbon emissions, while per capita GDP and energy intensity are positively correlated, and the proportion of tertiary industry output is negatively correlated. China has not yet reached the inflection point of the Kuznets curve, and the increase in per capita GDP will not inhibit the growth of carbon emissions; however, the country has, in general, already decoupled energy consumption growth from carbon emissions, and the decrease in energy intensity will incur carbon emissions reduction.
Specifically, every 1% increase in population size leads to a 3.81% increase in total carbon emissions, and as the birth rate declines, life expectancy increases and the degree of aging deepens. The impact of changes in population size on carbon emissions is, thus, becoming increasingly important. At the same time, for every 1% increase in urbanization rate, total carbon emissions rise by 1.77%. With the concentration of production factors in central cities, the increasing proportion of urban population has become an important driver for the growth of carbon emissions. For every 1% rise in energy intensity, the total carbon emission rises by 0.008%. Coal produces more carbon dioxide than other fossil energy sources under the same conditions, so the application of renewable and clean energy sources could be effective to reduce energy intensity. For every 1% increase in the proportion of tertiary industry, carbon emissions decrease by 1.838%. The cultural and tourism boom promotes the development of tertiary industry, improves advances in the regional industrial structure, and, ultimately, reduces carbon emissions.
Ridge regression analyses were conducted for the 30 provinces, as shown in Figure 6, where red bubbles represent positive correlations, blue bubbles represent negative correlations, and the size of the bubbles represents the size of the correlation coefficients. The results indicate that, at the regional level, population size and urbanization rate are the key drivers of carbon emissions, and are positively correlated for most provinces. Per capita GDP promotes, and the share of tertiary industry inhibits, carbon emissions. Beijing’s per capita GDP is negatively correlated, which indicates that it has realized the inflection point of the Kuznets curve, and growth of per capita GDP will reduce regional carbon emissions. In Guizhou, Jilin, Inner Mongolia, Ningxia, and Xinjiang, increases in the share of the tertiary industry do not reduce carbon emissions, which is attributable to the low efficiency of regional energy use; this means that the increase in tertiary industry is not accompanied by reduced energy consumption by secondary industry. Anhui, Sichuan, Guizhou, and Chongqing show an increase in carbon emissions as population size decreases along the following pathway: in an aging society, the reduction in carbon emissions due to fertility decline is not enough to offset the positive effect of increased life expectancy. Previous studies have shown that there is an inverted U-curve relationship between urbanization rate and carbon emissions in China, and the inflection point has already been reached in Tianjin and Hainan; as the level of urbanization increases, carbon emissions will decrease accordingly.
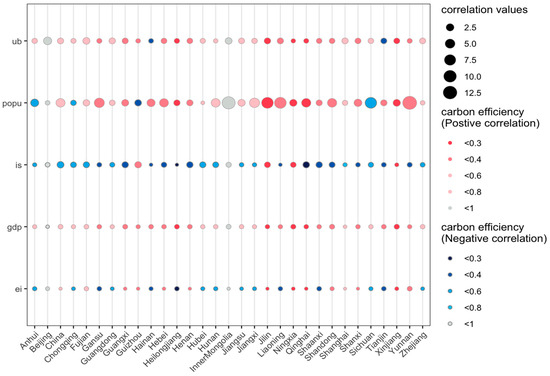
Figure 6.
Regression correlation coefficients of the STIRPAT model for Chinese provinces.
To avoid regression bias, the mean absolute percentage error was calculated to test model accuracy, with reference to the standard set by Pao and Tsai [53]. The fitting curve is shown in Figure 7, which shows that the model error is 2.4; this indicates that the constructed carbon emission prediction framework is highly accurate and credible.
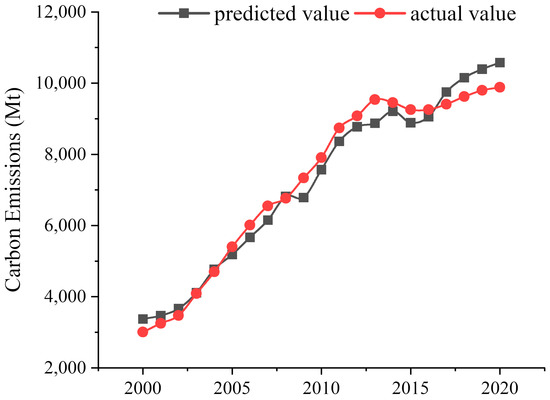
Figure 7.
Fitted curve for total regional carbon emissions in China, 2000–2021.
3.3. Forecasts of Total Carbon Emissions in the Country’s Provinces
3.3.1. Population Projections
The order of population size projected under the three SSPs indicates that SSP1 leads to a larger population than SSP5, which is larger than SSP2; the total population of the provinces first increases and then decreases (Figure 8). From a regional perspective, the population size of the southwest region is higher than the northwest—about two to seven times higher. The inflection points and trends for population under the differentiated paths for the different regions also vary. Compared with the previous population projection studies of this subject team, after updating the data of the seventh census, population appears to have followed a low rate of growth, and this trend has become more pronounced over time.
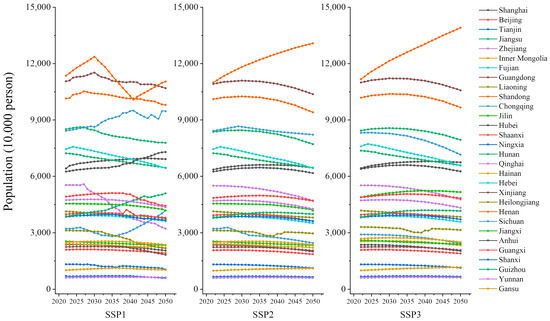
Figure 8.
Projected national regional subpathway for population, 2020–2050.
3.3.2. Industrial Structure Projections
Figure 9 shows the share of tertiary industry weighted by GDP. The overall industrial structure of the nation under SSP1 and SSP2 follows an upward trend, while the share of tertiary industry under SSP5 declines slightly from current levels. The proportion of tertiary industries is highest under SSP1 and lowest under SSP5. The floating intervals of the northern and southern regions do not show significant differences, and maintain the same growth trend. By 2050, all regions in China under the SSP1 are expected to be able to reach the level of developed countries accounting for as high as about 70%; under SSP2, maintaining the current growth rate, they could complete the “14th Five-Year Plan” development goals; and under SSP5, the slowest transformation, the projected value for 2050 would only be 62–65%.
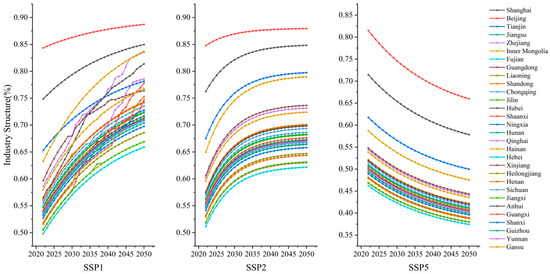
Figure 9.
Projected national regional subpathway industry structure, 2020–2050.
3.3.3. Energy Intensity Projections
As shown in Figure 10, from the perspective of the pathways, SSP1 is the fastest decreasing speed of energy intensity, and then the SSP2 and SSP5, in order.
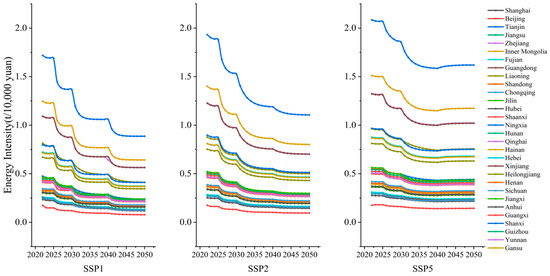
Figure 10.
Energy intensity projections by pathway for national regions, 2020–2050.
From the perspective of spatial distribution, the energy intensity of the southern provinces is generally lower than that of the north, with the range fluctuating around 0.1–0.5 tons of standard coal/CNY 1 million; the northern provinces are all higher than 1 ton of standard coal/CNY 1 million at the beginning of the period, with the range fluctuating around 1.5–2.0 tons of standard coal/CNY 1 million. This difference may lie in the fact that most of the industrial layout and economic development in the north relies on the pollution-intensive, high-emissions power generation industry; the north also uses collective heating, which consumes a large amount of energy.
In Gansu, Hebei, Shanxi, Heilongjiang, Liaoning, Inner Mongolia, Ningxia, Qinghai, and Xinjiang, energy intensity is higher than 1 ton of standard coal/CNY 1 million, of which the less developed ethnic minority areas account for more than half. In the southern region, the energy intensity of Guangxi, Yunnan, and Guizhou was about 0.4–0.6 tons of standard coal/CNY 1 million; compared with the other provinces, the energy efficiency is still poor. Tianjin had the highest energy intensity among the four municipalities directly under the central government; it should focus on the direction of policy tilt and could improve the intensity of energy regulation while coordinating the development of its industrial structure. From the degree of flattening and steepening of the curves, it appears that Fujian, Guangdong, Shanghai, Zhejiang, and Tianjin converge more rapidly under each scenario path, so the potential for carbon emissions reduction will be larger at later stages.
3.3.4. Total Carbon Emissions Projections
Based on the three different development pathways under the SSP framework, the forecast parameters for each pathway were selected and combined with the existing regression equations to forecast the total carbon emissions of China’s provinces during the period of 2022–2050. The prediction data reveal that, under SSP1 and SSP2, the 30 provinces reach peak carbon by 2040, and more than two-thirds of the provinces accomplish their time target. Under SSP5, more than half of the provinces do not fulfill their carbon peak target and no carbon peak occurs before 2050, so the SSP5 pathway is not considered here. Supported by our projections, Chinese provinces were grouped into four categories—1, 2, 3, and 4—following the order at which peak carbon occurs: “1” represents early peaking (before 2029), “2” represents on-time peaking (2030), “3” represents delayed peaking (2031–2035), and “4” represents significantly delayed peaking (2036–2050). In Figure 11, green represents SSP1, blue represents SSP2, and the labeled numbers in the upper right corner represent the province’s category for the different pathways.
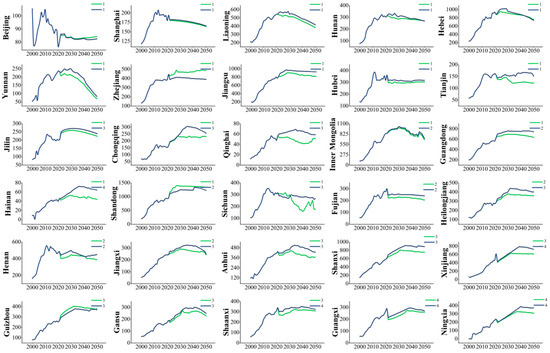
Figure 11.
Carbon emissions trend projections by province, 2000–2050.
Despite the different starting points, the ranking of the total carbon emissions for each pathway is almost the same in most provinces: Carbon emissions under SSP1 are smaller than those under SSP2. The provinces of Zhejiang, Shandong, Sichuan, and Guizhou, however, appear to have the lowest carbon emissions under the SSP2 path, which is consistent with the factors identified in the previous section, as the total carbon emissions in these areas is greatly affected by population size, and the downward trend in population under SSP1 is larger than under SSP2; the reduction in the population size will lead to an increase in the carbon emissions in these provinces, and the structural age of the city also accelerates carbon emissions to a certain extent.
Half of the 30 provinces will reach carbon peak by 2030 following both SSP1 and SSP2: Beijing, Shanghai, Liaoning, Hunan, Hebei, Yunnan, Zhejiang, Jiangsu, Hubei, Tianjin, Inner Mongolia, Guangdong, Shandong, Fujian, and Henan. These provinces are all on track to achieve their peak carbon goal, both in terms of their current development rates and the sustainable development paths. Seven provinces—Jilin, Chongqing, Qinghai, Sichuan, Hainan, Heilongjiang, and Jiangxi—could reach peak carbon early under SSP1, but would be delayed under SSP2. These provinces, especially Hainan, should, therefore, focus on developing low-carbon emissions reduction technologies and control population size to complete the energy consumption targets set in the “14th Five-Year Plan.” Eight provinces—Anhui, Shanxi, Xinjiang, Guizhou, Gansu, Shaanxi, Guangxi, and Ningxia—would not be able to achieve peak carbon on schedule following either SSP1 or SSP2, with peak carbon being either delayed or significantly delayed. Half of these provinces are in less developed regions with large populations of ethnic minorities. These provinces have a high proportion of secondary industries, which makes it difficult for them to realize industrial upgrading and transformation quickly. Reducing carbon emissions may also lead to larger economic losses in these provinces due to their underdeveloped economies and low energy use efficiency, which are generally linked. Thus, these provinces should use their own resource-rich advantages and take advantage of policy benefits to promote the synergistic convergence of economic development and carbon emissions reduction.
3.3.5. Carbon Peak Projections
By studying the socioeconomic development indicators of OECD peak carbon countries, we found that although each country reached peak carbon in different years, their socioeconomic development status has tended to converge at the peak carbon moment. This section combines the socioeconomic development indicators of each province and uses the first-order derivative of zero and the MK test to judge the peak carbon emissions point of each province. As shown in Table 7, China can be divided into four echelons based when carbon peak would be achieved in the 30 provinces in a graded order based on the SSP1, SSP2, and SSP5 pathways.

Table 7.
Peak carbon years and peak values in China’s provinces.
Under SSP1 and SSP2, all 30 provinces would have achieved peak carbon by 2050, while under SSP, 7 provinces would still not have achieved this. Under SSP1, the first tier—Beijing, Shanghai, Liaoning, Hunan, Hebei, Yunnan, Zhejiang, Jilin, Hubei, Tianjin, Jiangsu, Chongqing, Qinghai, Inner Mongolia, Guangdong, and Hainan—would achieve peak carbon 1–8 years ahead of the other provinces. The second tier—Fujian, Shandong, Heilongjiang, Henan, and Jiangxi—would achieve peak carbon on time in 2030. The third tier—Sichuan, Anhui, Shanxi, Xinjiang, Guizhou, Gansu, and Shaanxi—would not achieve peak carbon by 2030 but would do so by 2035 based on current levels of environmental policy intensity and socioeconomic development. The fourth tier—Guangxi and Ningxia—would realize carbon peak in 2036 and 2037, respectively. The results for SSP2 are shown in Table 7.
Specifically, the provinces that would be able achieve peak carbon by 2050 under the two pathways (containing four states: early, on-time, delayed, and significantly delayed) are shown in Figure 12. The bubble size indicates the size of the carbon peak values, the horizontal axis indicates the year of peak carbon is achieved, the vertical axis represents the 30 provinces, and the eight curves at the top of the figure are the kernel density distributions, which represent the distributions of the discrete peaking times in a continuous region for the four types of provinces—namely, early, on-time, delayed, and significantly delayed for SSP1 (same as above for SSP2). Based on Figure 12, it can be seen that all provinces under both pathways achieve peak carbon by 2050, with most provinces achieving peak carbon on time under SSP1, followed by SSP2. Most provinces in Tier 2 and Tier 3 have the potential to reach peak carbon, but the lack of appropriate pathway choices and inter-regional collaboration has delayed peak attainment.
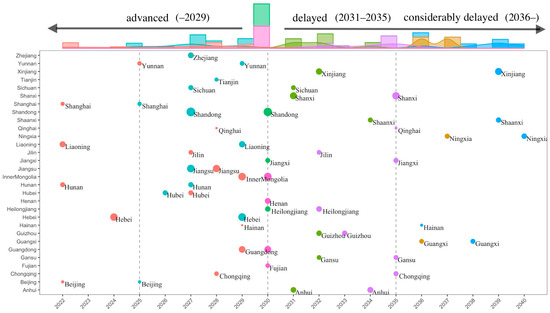
Figure 12.
Carbon peak time and value in Chinese provinces under SSPs.
The first tier takes the lead in achieving the 2060 carbon neutrality target by maintaining steady economic development and production of low-carbon technologies at the current level of development. The second tier needs to control population size while rationalizing and advancing the level of industries to promote the early achievement of peak carbon. The third and fourth tiers face greater pressure to reduce carbon emissions; depending on the current level of technology and economic development, they may not be able to realize the 2030 peak carbon target. It is, thus, necessary to strengthen regional environmental regulation by forcing local governments and enterprises to make industrial adjustments; it is also necessary to improve energy efficiency and low-carbon technology to reduce energy consumption. To address the issue of missed peak targets in regions such as Ningxia, Shanxi, and Xinjiang, improving energy efficiency and decreasing energy intensity are recommended, and the development and export of clean energy should be encouraged and accelerated. Guangxi, Shaanxi, Qinghai, and other regions should first decouple carbon emissions and economic development, while reducing energy intensity to curb carbon emissions. Local governments should strengthen the environmental regulations and forcibly push pollution-intensive, energy-consuming industries to become cleaner.
We collected data on the changes in carbon emission rates before and after peak carbon for medium-sized countries (e.g., Germany and Italy) and compared them with China. The first two line graphs in Figure 13 correspond to Germany and Italy, which achieved peak carbon in 1990 and 2007, respectively (marked with a black origin in the graphs). It can be observed that the rate of change in carbon emissions in Italy was positive before the peak and fluctuated around zero after 2007. The last two rows illustrate the change in the rate of carbon emissions under SSP1 and SSP2. It is notable that after the black origin (2030), the rate of change in China gradually tends to be negative, with zero as the baseline. This comparison reveals that China conforms to the rate of change of countries that have already reached their peak, which strengthens the rigor and generalizability of the present results.
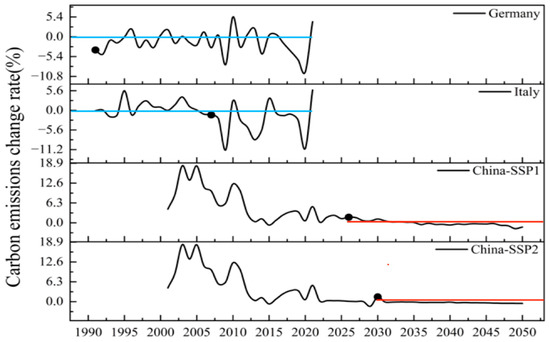
Figure 13.
Change in the rate of carbon emissions between China and peak-achieving medium-sized countries.
3.4. Mechanism Testing
Reducing carbon emissions should be cost-effective, recognize the differences among regions, and consider equity and efficiency while striving to achieve the dual carbon target. In this chapter, based on identifying the peak time and peak status of each province, we further clarify the impact of reduction efficiency on carbon emissions to propose differentiated cost-effective pathways.
Following our statistical calculations and forecasts to obtain the economic and social technical indicators for the 30 provinces, group regressions were performed based on the provinces that did and did not achieve peak carbon; these were transformed into binary variables: provinces that peaked early and those that peaked as expected were assigned a value of “1”; those that reached a delayed or significantly delayed peak were assigned “0”. Because energy intensity and carbon intensity are important constraints for controlling carbon emissions in China, they were used as key explanatory variables. Policy, economic growth, industrial structure, population size, urbanization rate, and environmental regulation intensity were included in the logistic regression equation as independent explanatory variables.
First, a test of the variance inflation factor was carried out. In the regression group that had not yet peaked, multicollinearity of energy intensity and carbon intensity was apparent (VIF > 15), so the energy intensity independent variable was excluded. The regression results showed that the total carbon emissions of the provinces that have not peaked are positively correlated with population size, industrial structure, and intensity of environmental regulation, and negatively correlated with urbanization rate and carbon intensity. Carbon intensity has the largest effect; the absolute value of the regression coefficient was 13.79. Environmental regulation intensity has the smallest effect, with a value of 0.003. In the regression group for provinces that have peaked, there was no covariance between variables, so no variables were excluded. The results showed that the total carbon emissions of the peaked provinces are positively correlated with industrial structure and environmental regulation intensity, and negatively correlated with population size, urbanization rate, energy intensity, and carbon intensity. Importantly, carbon intensity has the largest effect, with an absolute value of 11.5, but for peaked provinces, urbanization rate has the smallest effect, with an absolute value of 0.018.
Based on the group regression, we concluded that provinces that have not yet peaked should focus on reducing carbon intensity, while also developing human capital and ensuring high-quality development of the population. For the provinces that can peak on time, the most important thing is to pay attention to controlling the population size and urban development. The inflection point has not yet been reached, and excessive population growth or unreasonable urbanization could reverse carbon decoupling, which would increase carbon emissions. Effort should also be made to achieve the binding targets of dual control of energy consumption and carbon emissions.
4. Discussion and Policy Implications
Taking the dual carbon goal as the background, this paper evaluates and predicts the carbon peak values and timing for each province under the subpaths of the social sharing economy. We summarize the resource endowments, low-carbon technology levels, and policy tilting intensities of different regions, then discuss the optimal paths for reducing carbon emissions in each province.
First, achieving the dual carbon goal requires the combined efforts of the entire country, as determining the appropriate peak path is an important task of the center of social development, along with the degree of carbon emissions reduction. A review of the literature revealed that current carbon emissions reduction and forecasting studies have tended to focus on the overall progress of national carbon emissions or regional local forecasts, with less consideration of the heterogeneity of individual provinces. Moreover, studies have not considered the long-term perspective of the dynamic evolution of carbon decoupling. We considered the endowment differences and development level of each province and used the STIRPAT model to derive the differentiated driving factors, as well as predicting the values and time point for peak carbon based on the SSPs framework. The optimal pathway for carbon emissions reduction was then selected for each province. The proportion of provinces that would be able to peak was then analyzed for the period 2000–2021, and the mechanisms behind provincial carbon peaks were identified based on peak status. This solves the solidification problem of only considering the national sample and enriches the application of decoupling theory for carbon emissions reduction. However, due to the differences in prediction methods and parameter evaluation, the data in this paper may be slightly biased. The discussion is also only based on the perspective of economic efficiency and uses economic and environmental indicators to measure the effect of carbon emissions reduction. Indicators related to the welfare loss of the regional population were not involved. There is still room for improving the scientific rationality and comprehensive of the selection and application of indicators.
The results of the projections for the 30 provinces of China are trend projections based on local development plans and overall national goals, which do not exhaustively consider the impact of major events on China’s demographics and economy. If the impact of major events on the population and average annual structure were considered, the projections would change, although the general trend would remain unchanged. Although major events have led to a reduction in the population, according to current studies, the mortality rate under COVID-19 differed from the normal rate reported in the census, with the mortality rate among the elderly being generally higher. It, thus, also changed the age structure of China’s population to a certain extent, and these changes need further exploration.
Second, according to the statistical results, China’s carbon emissions show spatial–temporal regional heterogeneity. The total carbon emissions generally follow a rising trend over time, while the growth rate descends year by year. Carbon emissions in economically developed regions follow a downward trend, while in economically undeveloped and underdeveloped regions, emissions are still following an upward trend, which is consistent with prior studies. It is, therefore, not reasonable for the whole country to achieve peak carbon at a uniform pace, and it is essential to explore the carbon peak paths of each province in a sequential manner. The selection of the carbon peak path cannot be separated from the overall development path and the setting of constraint indicators. Identifying the strong driving factors and formulating a reasonable development rate for each province should also be prioritized. The results reveal that population size is strongly correlated with emissions in the west, especially in ethnic minority regions. Energy intensity and carbon intensity are more affected in developed regions in the east, and industrial structure is more affected in the central region. Controlling the scale of the strong driving factors is, hence, the imperative condition for choosing a carbon emissions reduction path.
Third, studies have shown that economic growth and carbon emissions are closely linked, and changes in the decoupling state affect when peak carbon is achieved. Using Markov chains to identify the decoupling state from the perspective of long-term dynamics can more accurately predict the path map and timetable for peak carbon in each province. This paper combined the peak status to further identify the provincial mechanism, which provides new insight for planning carbon reduction pathways. Incorporating government behavior indicators into the existing indicator system also reveals that the environmental regulation intensity affects peaked and nonpeaked provinces differently; regulation is strongly correlated with peak carbon status. Exploring carbon peak pathways must be based on the status of carbon emissions, comprehensively consider peak state, and combine timely environmental policy development and financial support.
Fourth, the efficiency of carbon emissions reduction is an economic indicator that measures the long-term benefits and contributions of carbon emissions reduction in Chinese provinces. Over time, the advantage of carbon emissions efficiency in the northwest and northeast heavy industrial areas gradually fades, forming a highland of efficient carbon emissions reduction with Inner Mongolia and Beijing first, the southeast coast last, and the Central Plains as connecting the two; that is, it follows the distribution characteristics of high in the east, low in the west, high in the south, and low in the north. Xinjiang, Gansu, and Ningxia saw a decline after the “13th Five-Year Plan” and stagnated during the “14th Five-Year Plan” period; Yunnan, Guizhou, and Guangxi did not form a synergistic development with Sichuan, and maintained their lagged condition. After the “Chengdu-Chongqing Twin Cities Economic Circle” was proposed in 2020, all regions sought to seize the opportunity to usher in new breakthroughs in economic development. Henan, Hebei, Liaoning, Jilin, and Heilongjiang have experienced lower levels of carbon emissions efficiency since 2010 due to adjustments in the national industrial layout and location strategy, which led to the three northeastern provinces becoming the core of heavy industry, while Henan and Hebei became food bases.
Fifth, the differentiation of resource endowment, geographic location, and socioeconomic development level determines, to a certain extent, the sequential characteristics of peak carbon achievement. Aside from the discussion above, it is worth paying especial attention to how the optimal carbon emissions reduction path, suitable for each province, is chosen. At present, the 28th United Nations Framework Convention on Climate Change, following the GTS stocktaking, called for countries to “transition away” from fossil fuels. The goal is to triple renewable energy, double energy efficiency, and reduce agricultural emissions while maintaining food security by 2030. A “loss and damage” fund was to be established to help vulnerable groups unable to adapt to climate change. Based on the reporting requirements of COP28, following the imposition of environmental policies and the government’s proposal of binding targets, low-carbon technologies have rapidly developed, and the trend in carbon emissions has gradually slowed down, along with the adjustment to the industrial structure. At the same time, due to the variability in the driving factors, large differences remain in the effects of different factors on carbon emissions reduction in China. Accurately identifying the factors driving carbon emissions in each province, reasonably predicting the timing of peak carbon, and exploring orderly paths to peak carbon are the mainstream trends for realizing the dual carbon goal [59]. Targeted strategies are necessary to adjust the optimal carbon emissions reduction paths for each province, realize the sequential carbon peaks of all provinces, and achieve carbon neutrality, as follows.
- Carbon peaks for developed provinces and cities: In Beijing, Shanghai, Tianjin, and Hunan, energy intensity and industrial structure should continue to be maintained to meet national targets, while considering the impact on carbon emissions of changes in the demographic structure of the population and the increase in life expectancy. For older industrial zones—Shanxi, Shandong, Liaoning, Henan, and Hebei provinces—the intensity of environmental regulations should be strengthened to consider the development of the secondary sector while reducing the carbon emissions it causes, from the perspectives of both the government and companies. For areas that are not likely to attain peak carbon, the energy-rich but less developed provinces such as Yunnan, Inner Mongolia, Ningxia, Guangxi, Qinghai, and Gansu are still in the mid- to late-industrialization stage of development, and their per capita GDP, energy intensity, and levels of low-carbon technology are lower than the national average. Without the socioeconomic foundation, determining how to transform resource advantages into economic advantages is particularly important. This is the case in northwest China, where it is necessary to focus on the high-quality development of the population and urbanization, enhance human capital, and develop energy technology and low-carbon technology while actively and steadily promoting the construction of wind and light clean energy. Southwest China should rely on existing water conservancy power generation projects to enhance energy efficiency, use ecosystem carbon sinks to achieve peak carbon, and leverage the CCER trading platform to transform the economy and promote carbon neutrality. Provinces that can attain peak carbon should, on the one hand, steadily reduce unit energy consumption and carbon intensity, while fulfilling the binding targets set by the state; furthermore, urbanization should be reasonably guided when necessary, and regional openness should be strengthened to maximize the intensive effect of population size. The expansion of urban infrastructure should be carried out in an orderly manner to avoid the congestion effect triggered by excessive population growth.
- Carbon neutrality of the energy supply: It is necessary to achieve the cleaner transformation of the energy structure. For the northwest region, Ningxia could focus on building million-kilowatt photovoltaic bases relying on deserts, the Gobi, and coal-mining subsidence zones, and build various types of photovoltaic and comprehensive utilization projects based on local conditions. Inner Mongolia could accelerate the construction of the national demonstration zone for a modern energy economy and promote the construction of large-scale wind-power photovoltaic bases. Qinghai could tap the wind, light, and water potential of the Tibetan Plateau, strengthening the province’s wind- and solar-power-based multitype clean energy development on a large scale. For the southwest region, Yunnan, which is reliant on hydropower, should continue to promote the development of the Jinsha River, Lancang River, and other hydropower resources. Guangxi could take advantage of the coast to promote offshore wind power and clean energy generation. For the energy demand side, provinces need to improve the efficiency of energy use in the terminal sector. The blind development of high-energy-consuming, high-emission, and low-level projects should be firmly curbed, and the list-type and responsibility system of management for such projects should be implemented. The low-carbon development of agriculture and animal husbandry should be accelerated: around the yak, Tibetan sheep, barley, vegetables, leisure agriculture, and the five characteristic industries of animal husbandry, the use of organic fertilizer to replace chemical fertilizer should be accelerated. Environmental regulations have also been strengthened in highly polluted areas, and external forces have promoted enterprises to realize low-carbon transformation. While improving energy efficiency and reducing energy intensity, attention should be paid to energy justice and equity, to avoiding the blind increase in the penetration rate of clean energy in a region if it brings about widespread energy poverty.
- Regional cooperation: Realizing the goals of peak carbon and carbon neutrality is a systematic project that requires the active cooperation of all aspects of the economy and society. The regional aggregation of provincial carbon emissions efficiency means that emission reductions and efficiency improvements in individual provinces may be futile due to regional interactions. Regional cooperation needs to be emphasized. Each individual province must reach a consensus on the environmental interests and responsibilities of the whole nation; this would then allow it to develop environmental regulations, ecological standards, and compensation mechanisms for regional cooperation. Given national environmental constraints, joint planning and implementation of energy-saving and emissions reduction projects will promote regional cooperation and new breakthroughs in technological innovation to reduce the costs of reducing carbon emissions for individuals in each region.
5. Conclusions
This paper identified the primary factors influencing carbon emissions under the SSPs proposed by the IPCC based on the STIRPAT model. K-means clustering was performed with the total carbon emissions and rates of Chinese provinces from 2000 to 2021 to divide the 30 provinces into four categories. Combined with local planning and the emissions convergence trend, the total carbon emissions of these Chinese provinces over the last 30 years were simulated by setting short-, medium-, and long-term targets from 2022 to 2050. Differentiated carbon emissions reduction paths were then proposed based on the results.
The main results of the study indicate that, from 2000 to 2021, the national provincial carbon emissions fall into four categories based on the trends of their change: low-carbon emission and slow-growing, low-carbon emission but fast-growing, high-carbon emissions but slow-growing, and high-carbon emissions and fast-growing. Urbanization rate and population size are the key drivers of carbon emissions, and increases in per capita GDP and the proportion tertiary industry have a positive and negative effect on carbon emissions, respectively. The direction of energy intensity on carbon emissions is based on the decoupling status of each province, which is characterized by stages.
Under the SSP1 and the SSP2, all 30 provinces can reach carbon peak by 2040 based on national carbon emission projections, and more than two-thirds of the provinces fulfill their target peak years. Under SSP5, over half of the provinces do not meet the carbon peak target and no carbon peak occurs before 2050. Beijing, Shanghai, Liaoning, Hunan, Hebei, Yunnan, Zhejiang, Jiangsu, Hubei, Tianjin, Inner Mongolia, Guangdong, Shandong, Fujian, and Henan are all on track to achieve peak carbon under either the current development rate or the sustainable development pathway. Jilin, Chongqing, Qinghai, Sichuan, Hainan, Heilongjiang, and Jiangxi could also reach peak carbon early under SSP1, but this would be delayed under SSP2. Thus, these provinces—especially Hainan—should develop low-carbon emissions reduction technologies and control the size of their population to complete the energy consumption targets set in the “14th Five-Year Plan”. However, Anhui, Shanxi, Xinjiang, Guizhou, Gansu, Shaanxi, Guangxi, and Ningxia do not achieve carbon peak as expected in either pathway; these regions show delayed or significantly delayed peaking, and half of them encompass less developed ethnic regions. These provinces have a high proportion of secondary industries, which makes it difficult to upgrade and transform their industrial structure rapidly, particularly when coupled with an underdeveloped economy and low energy use efficiency. They generally show a nondecoupled state, and carbon emissions reduction may lead to larger economic losses.
In summary, the level of economic development and carbon decoupling are the prerequisites for achieving the dual carbon target; the intensity of environmental policies and low-carbon energy technologies are adjusted based on these aspects for each region. In general, realizing China’s dual carbon goals means not only taking the path of sustainable development, developing low-carbon technology to improve national energy efficiency, and increasing the proportion of renewable energy use, but also implementing the regional priority strategy based on the socioeconomic, ecological, and cultural background.
There are some shortcomings in the research of this paper: firstly, the data of carbon emissions are only selected from direct emissions and do not include indirect emissions. Secondly, due to data availability, this paper only considers the influence of economic–social–energy–technology factors, losing sight of policies related to carbon market trading and the drivers of people’s perceptual awareness in the SSPs framework. After considering the current ecological compensation policy, the dual-control policy of “carbon emission” and people’s willingness, the trend and path of carbon emission in each province and city will change accordingly. At the same time, this paper will face new challenges and opportunities, and we need to explore new paths of emission reduction.
Author Contributions
Conceptualization, Y.Y. and F.Z.; methodology, D.J.; software, Y.Y.; validation, F.Z., Y.Y. and J.T.; formal analysis, F.Z.; investigation, Y.Y.; resources, Y.Y. and D.J.; data curation, J.T. and Y.M.; writing—original draft preparation, F.Z. and Y.Y.; writing—review and editing, F.Z. and Y.Y.; visualization, Y.M.; supervision, Y.Y. and J.T.; project administration, F.Z.; funding acquisition, F.Z. All authors have read and agreed to the published version of the manuscript.
Funding
This research was supported by the Open Research Program of the International Research Center of Big Data for Sustainable Development Goals (Grant No. CBAS2023ORP04); the National Key R&D Program of China (Project No. 2022YFC3800700); the Key Laboratory of Ecology and Environment in Minority Areas (Minzu University of China), National Ethnic Affairs Commission (No. KLEEMA202306); and the Science and Technology Project of Information and Communication Company of Gansu Power Company, State Grid of China (Project No. 52272323000C).
Institutional Review Board Statement
Not applicable.
Informed Consent Statement
Not applicable.
Data Availability Statement
Due to privacy relevant data can be obtained by contacting the corresponding author with reasonable reasons.
Conflicts of Interest
The authors declare no conflicts of interest.
References
- Su, X.; Li, B.; Zhang, Z. Regional disparities and determinants of carbon emissions intensity in China: A spatial econometric analysis. J. Clean. Prod. 2021, 307, 127269. [Google Scholar]
- Lin, J.; Zhang, G.; Li, X.; Chen, G.Q. Regional disparity of carbon emissions in China from 2007 to 2012: A comprehensive perspective. J. Clean. Prod. 2018, 202, 286–300. [Google Scholar]
- Su, B.; Ang, B.W.; Li, Y. Estimation of provincial-level CO2 emissions in China using economic, energy, and emission data. Energy Policy 2017, 100, 184–194. [Google Scholar]
- Zheng, Y.; Tang, J.; Huang, F. The impact of industrial structure adjustment on the spatial industrial linkage of carbon emission: From the perspective of climate change mitigation. J. Environ. Manag. 2023, 345, 118620. [Google Scholar] [CrossRef] [PubMed]
- Xi, J. Xi Jinping Presides over the 36th Collective Study Session of the Political Bureau of the CPC Central Committee and Delivers an Important Speech. CPC Central Committee Website. 2022. Available online: https://www.gov.cn/xinwen/2022-03/08/content_5677839.htm (accessed on 5 March 2022).
- Xi, J. Xi Jinping Attends the Inner Mongolia Delegation Plenary Meeting of the Fifth Session of the 13th National People’s Congress and Delivers a Speech. Chinese Government Website. 2022. Available online: https://www.12371.cn/2022/09/23/ARTI1663913479551101.shtml (accessed on 24 January 2022).
- Yang, L.H.; Lei, Y.Q.; Ye, F.F.; Hu, H.; Lu, H.; Wang, Y.M. Forecasting carbon peaking in China using data-driven rule-base model: An in-depth analysis across regional and economic scenarios. J. Clean. Prod. 2024, 451, 142053. [Google Scholar] [CrossRef]
- Rogelj, J.; Popp, A.; Calvin, K.V.; Luderer, G.; Emmerling, J.; Gernaat, D.; Fujimori, S.; Strefler, J.; Hasegawa, T.; Marangoni, G.; et al. Scenarios towards limiting global mean temperature increase below 1.5 °C. Nat. Clim. Chang. 2018, 8, 325–332. [Google Scholar] [CrossRef]
- Wang, Y.; Liu, Z.; Zhang, X. The trade-off between carbon emissions reduction and economic growth in China: An analysis based on provincial panel data. J. Clean. Prod. 2020, 275, 122956. [Google Scholar]
- Li, C.; Zhang, Z.; Wang, L. Carbon peak forecast and low carbon policy choice of transportation industry in China: Scenario prediction based on STIRPAT model. Environ. Sci. Pollut. Res. 2023, 30, 63250–63271. [Google Scholar] [CrossRef] [PubMed]
- Quan, C.; Cheng, X.; Yu, S.; Ye, X. Analysis on the influencing factors of carbon emission in China’s logistics industry based on LMDI method. Sci. Total Environ. 2020, 734, 138473. [Google Scholar] [CrossRef] [PubMed]
- Edmonds, J.; Reilly, J. Global energy and CO2 to the year 2050. Energy J. 1985, 4, 21–48. [Google Scholar]
- Riahi, K.; Rao, S.; Krey, V.; Cho, C.; Chirkov, V.; Fischer, G.; Kindermann, G.; Nakicenovic, N.; Rafaj, P. RCP 8.5—A scenario of comparatively high greenhouse gas emissions. Clim. Chang. 2011, 109, 33–57. [Google Scholar] [CrossRef]
- Ren, H.; Du, R.; Xie, G.; Jin, W.; Li, X.; Deng, Y.; Ma, W.; Wang, B. Research Status of Factors Influencing China’s Carbon Emissions and Identification Methods. Environ. Eng. 2023, 41, 195–203+244. [Google Scholar]
- Wu, J.; Jin, X.; Wang, H.; Feng, Z.; Zhang, D.; Li, X. Analysis of Carbon Emissions and Influencing Factors at the Urban Scale in China. Environ. Sci. 2023, 44, 2974–2982. [Google Scholar]
- Jiang, C.; Xu, Q.; Su, T. Factors Influencing Carbon Emissions in China’s Coal-Producing Regions and Scenario Prediction of Carbon Peak—Based on LMDI and Threshold-STIRPAT Model. J. Nanning Norm. Univ. (Nat. Sci. Ed.) 2023, 40, 32–42. [Google Scholar]
- Wang, N.; Han, C.; Zhang, Y.; Gu, Z. Study on Regional Carbon Emission Peak Based on Threshold-STIRPAT Extended Model: A Case Study of East China Region. Environ. Eng. 2023, 42, 211–219. [Google Scholar] [CrossRef]
- Liu, Y.; Chang, X.; Huang, C. Analysis of the Impact of Economic Growth, Industrial Structure, and Population Structure on China’s Carbon Emissions. Mod. Manag. 2022, 42, 15–20. [Google Scholar]
- Guo, J.; Bai, Y.; Guan, H. Economic Growth, Urbanization, and Carbon Emissions: Theoretical Analysis and Empirical Test. Mod. Manag. 2023, 43, 167–175. [Google Scholar]
- Zhang, T.; Yang, J.; Sheng, P. The Impact and Pathways of Urbanization on China’s Carbon Emissions. China Popul. Resour. Environ. 2016, 26, 47–57. [Google Scholar]
- He, X.; Zhuang, Y.; Qiu, S.; Li, H.; Zhao, Y.; Lu, S.Y.; Lin, J.Y. Scale Effects of Urban Three-Dimensional Spatial Structure on Carbon Emission. Acta Ecol. Sin. 2024, 44, 612–624. [Google Scholar] [CrossRef]
- Zheng, H.; Gao, X.; Sun, Q.; Han, X.; Wang, Z. The impact of regional industrial structure differences on carbon emission differences in China: An evolutionary perspective. J. Clean. Prod. 2020, 257, 120506. [Google Scholar] [CrossRef]
- Liu, C.; Wang, Z.; Yuan, C. The Influence of Autonomous Technological Innovation on Industrial Carbon Emissions and Trend Prediction from a Structural Perspective. China Popul. Resour. Environ. 2022, 32, 12–21. [Google Scholar]
- Mahadevan, R.; Sun, Y. Effects of foreign direct investment on carbon emissions: Evidence from China and its Belt and Road countries. J. Environ. Manag. 2020, 276, 111321. [Google Scholar] [CrossRef] [PubMed]
- Hu, B.; Shao, J. The Impact of FDI on China’s Carbon Dioxide Emissions: An Empirical Study Based on Spatial Durbin and Multiple Threshold Models. J. Tianjin Univ. Commer. 2022, 42, 49–58. [Google Scholar]
- Wang, Q.; Zhang, F.; Li, R. Revisiting the environmental kuznets curve hypothesis in 208 counties: The roles of trade openness, human capital, renewable energy and natural resource rent. Environ. Res. 2023, 216, 114637. [Google Scholar] [CrossRef] [PubMed]
- Zhang, A. Regional Differences in the Impact of Environmental Regulation on Economic Growth. Ph.D. Thesis, Lanzhou University, Lanzhou, China, 2018. [Google Scholar]
- Huang, X.; Tian, P. How does heterogeneous environmental regulation affect net carbon emissions: Spatial and threshold analysis for China. J. Environ. Manag. 2023, 330, 117161. [Google Scholar] [CrossRef] [PubMed]
- Gao, G.; Wen, Y.; Wang, L.; Xu, R. Research on Carbon Peak of Urban Agglomerations Based on Carbon Emission Influencing Factors. Econ. Manag. 2023, 45, 39–58. [Google Scholar]
- Jiao, L.; Yang, R.; Chen, B.; Zhang, Y. Variation, Determinants and prediction of carbon emissions in Guizhou, a new economic growth pole in southwest China. J. Clean. Prod. 2023, 417, 138049. [Google Scholar] [CrossRef]
- Jiang, L. Internal consistency of demographic assumptions in the shared socioeconomic pathways. Popul. Environ. 2014, 35, 261–285. [Google Scholar] [CrossRef] [PubMed]
- Hong, Q.; Cui, L.; Hong, P. The impact of carbon emissions trading on energy efficiency: Evidence from quasi-experiment in China’s carbon emissions trading pilot. Energy Econ. 2022, 110, 106025. [Google Scholar] [CrossRef]
- Wang, A.; Hu, S.; Li, J. Using machine learning to model technological heterogeneity in carbon emission efficiency evaluation: The case of China’s cities. Energy Econ. 2022, 114, 106238. [Google Scholar] [CrossRef]
- Pechanec, V.; Purkyt, J.; Benc, A.; Nwaogu, C.; Štěrbová, L.; Cudlín, P. Modelling of the carbon sequestration and its prediction under climate change. Ecol. Inform. 2018, 47, 50–54. [Google Scholar] [CrossRef]
- Li, Y. Forecasting Chinese carbon emissions based on a novel time series prediction method. Energy Sci. Eng. 2020, 8, 2274–2285. [Google Scholar] [CrossRef]
- Huo, T.; Du, Q.; Xu, L.; Shi, Q.; Cong, X.; Cai, W. Timetable and roadmap for achieving carbon peak and carbon neutrality of China’s building sector. Energy 2023, 274, 127330. [Google Scholar] [CrossRef]
- Sun, Q.; Chen, H.; Long, R.; Zhang, J.; Yang, M.; Huang, H.; Ma, W.; Wang, Y. Can Chinese cities reach their carbon peaks on time? Scenario analysis based on machine learning and LMDI decomposition. Appl. Energy 2023, 347, 121427. [Google Scholar] [CrossRef]
- He, L.; Li, X.; Cui, Q.; Guan, B.; Li, M.; Chen, H. Decarbonization pathways to subregional carbon neutrality in China based on the top-down multi-regional CGE model: A study of Guangxi. Energy 2024, 294, 130846. [Google Scholar] [CrossRef]
- Zhang, Y.; Zhang, J.; Jiang, S.; Guo, H.; Wang, S.; Fu, Z. Prediction and Path Analysis of Carbon Peak in Shannan Region of Tibet Based on Multi-Scenario Analysis. Acta Sci. Nat. Univ. Pekin. 2024, 60, 350–356. [Google Scholar]
- You, K.; Ren, H.; Cai, W.; Huang, R.; Li, Y. Modeling carbon emission trend in China’s building sector to year 2060. Resour. Conserv. Recycl. 2023, 188, 106679. [Google Scholar] [CrossRef]
- Zhan, J.; Wang, C.; Wang, H.; Zhang, F.; Li, Z. Pathways to achieve carbon emission peak and carbon neutrality by 2060: A case study in the Beijing-Tianjin-Hebei region, China. Renew. Sustain. Energy Rev. 2024, 189, 113955. [Google Scholar] [CrossRef]
- Wei, Y.; Yu, B.; Tang, B.; Liu, L.; Liao, H.; Chen, J.; Chen, F.; An, R.; Wu, Y.; Tan, J.; et al. Research on China’s Carbon Peak and Carbon Neutrality Timetable and Roadmap. J. Beijing Inst. Technol. (Soc. Sci. Ed.) 2022, 24, 13–26. [Google Scholar]
- Yu, B.; Zhao, G.; An, R.; Chen, J.; Tan, J.; Li, X. Research on China’s Carbon Emission Path under Carbon Neutrality Target. J. Beijing Inst. Technol. (Soc. Sci. Ed.) 2021, 23, 17–24. [Google Scholar]
- Yu, B.; Zhao, Z.; Wei, Y.M.; Liu, L.C.; Zhao, Q.; Xu, S.; Kang, J.; Liao, H. Approaching national climate targets in China considering the challenge of regional inequality. Nat. Commun. 2023, 14, 8342. [Google Scholar] [CrossRef] [PubMed]
- Wilbanks, T.J.; Ebi, K.L. SSPs from an impact and adaptation perspective. Clim. Chang. 2014, 122, 473–479. [Google Scholar] [CrossRef]
- Gurney, K.R.; Kılkış, Ş.; Seto, K.C.; Lwasa, S.; Moran, D.; Riahi, K.; Keller, M.; Rayner, P.; Luqman, M. Greenhouse gas emissions from global cities under SSP/RCP scenarios, 1990 to 2100. Glob. Environ. Chang. 2022, 73, 102478. [Google Scholar] [CrossRef]
- Zhang, F.; Xu, N.; Wu, F. Prediction of China’s Carbon Emissions from 2020 to 2100 under the Path of Shared Socioeconomic Economy. Acta Ecol. Sin. 2021, 41, 9691–9704. [Google Scholar]
- Liu, Z.; Huang, X.; Lu, X.; Li, S.; Qi, X. Prediction of China’s Carbon Neutrality Path under the Path of Shared Socioeconomic Economy. Acta Geogr. Sin. 2022, 77, 2189–2201. [Google Scholar]
- Jiang, D.; Chang, Y.; Zhong, F.; Yao, W.; Zhang, Y.; Ding, X.; Huang, C. Future growth pattern projections under shared socioeconomic pathways: A municipal city bottom-up aggregated study based on a localised scenario and population projections for China. Econ. Res.-Ekon. Istraživanja 2022, 35, 2574–2595. [Google Scholar] [CrossRef]
- Andrew, B. Market failure, government failure and externalities in climate change mitigation: The case for a carbon tax. Public Adm. Dev. Int. J. Manag. Res. Pract. 2008, 28, 393–401. [Google Scholar] [CrossRef]
- Huang, R.; Riddle, M.; Graziano, D.; Warren, J.; Das, S.; Nimbalkar, S.; Cresko, J.; Masanet, E. Energy and emissions saving potential of additive manufacturing: The case of lightweight aircraft components. J. Clean. Prod. 2016, 135, 1559–1570. [Google Scholar] [CrossRef]
- Wang, X. Analysis of Factors Influencing the Role Positioning of “Strong Government” in the Chinese Model. Inquiries 2007, 2, 45–48. [Google Scholar]
- Yu, F.; Guo, Y.; Le-Nguyen, K.; Barnes, S.J.; Zhang, W. The impact of government subsidies and enterprises’ R&D investment: A panel data study from renewable energy in China. Energy Policy 2016, 89, 106–113. [Google Scholar]
- Weng, Q. Research on Beautiful Countryside Construction from the Perspective of Strong Government. Rural Sci. Technol. 2019, 36, 28–29+32. [Google Scholar]
- Wang, J.; Qiu, Y.; Shi, D. The Challenges and Cross-Regional Energy Cooperation for Carbon Peak. J. Hainan Univ. 2024, 1–8. [Google Scholar] [CrossRef]
- Yang, D.; Liu, Z.; Yin, C. Local Planning Actions in Response to Global Climate Change: Balancing Mitigation and Adaptation. Urban Plan. 2018, 42, 35–42+59. [Google Scholar]
- Jiang, J.; Hu, A.; Yan, Y. Research on the Implementation Mechanism of National Five-Year Plans: Implementation Paths, Dilemmas, and Solutions. J. Northwest Norm. Univ. (Soc. Sci.) 2017, 54, 24–30. [Google Scholar]
- Liu, Z.; Guan, D.; Wei, W. Accounting for China’s Carbon Dioxide Emissions. Sci. China Earth Sci. 2018, 48, 878–887. [Google Scholar]
- Li, L.; Zhang, Y.; Zhou, T.; Wang, K.; Wang, C.; Wang, T.; Yuan, L.; An, K.; Zhou, C.; Lü, G. Mitigation of China’s carbon neutrality to global warming. Nat. Commun. 2022, 13, 5315. [Google Scholar] [CrossRef] [PubMed]
Disclaimer/Publisher’s Note: The statements, opinions and data contained in all publications are solely those of the individual author(s) and contributor(s) and not of MDPI and/or the editor(s). MDPI and/or the editor(s) disclaim responsibility for any injury to people or property resulting from any ideas, methods, instructions or products referred to in the content. |
© 2024 by the authors. Licensee MDPI, Basel, Switzerland. This article is an open access article distributed under the terms and conditions of the Creative Commons Attribution (CC BY) license (https://creativecommons.org/licenses/by/4.0/).