Abstract
The article presents a special stand featuring ion generators designed and manufactured for experimental research. This study investigates the use of ion energy for air purification, specifically focusing on its effect on PM (0.3–10 μm) agglomeration. By introducing charged ions into the air, particulate matter can be charged, resulting in increased particle sizes through agglomeration, and subsequently improving the filtration efficiency. Experiments were conducted in a controlled chamber to evaluate the performance of an ion-based air purification system. The effects of various parameters, such as ion concentration, airflow rate, and particle size distribution, on PM agglomeration were studied. The results demonstrated that the ion-based air purification system could effectively enhance PM agglomeration, particularly for ultrafine particles. The study also revealed that the efficiency of PM agglomeration was influenced by the ion concentration and airflow rate, with an optimal range identified to maximize the system’s performance. Furthermore, the potential real-world application of this technology was discussed, considering factors such as energy consumption, maintenance requirements, and compatibility with existing air purification systems. This study contributes to the development of innovative air purification solutions and offers valuable insights into the potential of ion energy for improving indoor air quality and safeguarding human health.
1. Introduction
As the scale of industrialization and traffic flows grow around the world, atmospheric pollution also increases. Nowadays, air pollution is a global problem. Air pollutants produced in one state can move through the atmosphere and degrade air quality elsewhere. The sources of air pollution are diverse—both anthropogenic and natural. These sources include the burning of fossil fuels to produce electricity; transport; industry; households; industrial processes and solvent use, e.g., in the chemical and mineral industries; agriculture; waste recycling; volcanic eruptions; sandstorms; sea salt aerosols and the volatilization of volatile organic compounds from plants, etc.
In the operation of diesel engines, the dispersion of particles is from 50 nm to 1 µm [1,2]. Large amounts of fine solid particles enter the atmosphere during cement production [3]. Half of all solid particles released during cement production are smaller than 2.5 µm [4].
Atmospheric pollution with solid particles is a very relevant global problem. Due to their small size, particulate matter can travel long distances in the atmosphere. Air pollution poses a threat to human health and the environment. According to the World Health Organization, increased air pollution with solid particles influences the incidence of respiratory and cardiovascular diseases. Currently, the latest directives of the European Union require reducing the spread of small particles into the atmosphere as efficiently as possible. A large proportion of Europe’s population lives in areas, especially cities, where air quality standards are not met. According to statistics from the World Health Organization, air pollution causes 3.7 million deaths annually [5]. Among all substances that pollute the atmosphere, solid particles are singled out as the most harmful to human health [6,7]. A total of 2.4 million deaths occurs annually due to diseases caused by particulate matter [8]. Particulate air pollution is a major environmental air quality problem in cities.
Solid particles are a mixture of airborne particles and liquid droplets (aerosols), which may contain various components—acids, sulfates, nitrates, organic compounds, metals, soil particles, dust, soot, etc. The solid particles emitted into the air differ in their physical and chemical composition, and the particle sizes and the sources of their emission are different.
The most painful effects are caused by small solid particles from 10 to 2.5 μm in size. Particles with a size of 2.5 μm enter the human body through the respiratory tract and cause serious health problems [9]. These microparticles are so small that they can be compared with human hair [10].
In the USA, the Environmental Protection Agency was established in 1997, which set standards for this type of pollution. The following standards have been set: the amount of pollutants produced per day must not exceed 35 µg/m3, and the annual average must not exceed 12 µg/m3. Small particles in the atmosphere can travel long distances [11]. The regulation is valid for PM2.5 only.
In order to more effectively reduce the entry of solid particles into the atmosphere, various modern air cleaning devices and new methods are being developed. Multi-stage air purification systems, which use a lot of electricity, are used to clean small particles from the air. Such systems also require large rooms. Such systems are not only complex, but also expensive. For these reasons, scientists constantly conduct experimental and numerical studies, based on the results of which modern technologies for the efficient deposition of fine solid particles would be developed. One such method is particle agglomeration. Agglomeration is the adhesion of particles induced by various factors. Various factors can be applied to agglomerate particles: acoustics, chemistry, turbulence, etc. Indoor air quality has become a significant concern due to the adverse health effects associated with particulate matter (PM). Agglomeration is a promising method for joining particles together. Small particles stick (agglomerate) to larger particles and, due to the increased mass, are cached in filters faster and more efficiently. Agglomeration is the adhesion of small particles to larger particles (from the Latin agglomero—adhesion). One such method is the agglomeration of particles under the influence of an acoustic field [12]. From the results of experimental and numerical studies, it can be seen that acoustic agglomeration significantly changes the distribution of particles according to their sizes, after exposure to an acoustic field, the concentration of larger particles increases compared to fine ones [13,14,15,16,17,18].
It is difficult to collect solid particles with a diameter of less than 10 µm using conventional cleaning devices (cyclones, scrubbers, etc.), so even after the air cleaning process, they continue to enter the atmosphere [13,19,20,21]. The cyclone cleaning efficiency when cleaning 1 µm particles is only 50% [22]. With regard to the efficiency of electrostatic filters when applied in industries where the pollutants are particles with a diameter of 0.1–1 µm, the cleaning efficiency decreases from 99.5% to 92–95% [23].
Air purification from particles smaller than 10 µm requires complex, multi-level air purification systems. And these days, new methods are constantly being sought to help effectively reduce environmental pollution with small solid particles. Small particles of pollutants are dangerous not only because they penetrate deep into the lungs and other vital organs, but also because they have the ability to absorb other chemical pollutants [24].
Small particles can agglomerate due to various processes taking place between them. Due to the particles’ small diameters, extremely strong Van Der Waals, electrostatic and capillary forces act between them, which together form the attractive force. This force can cause the particles to form larger compounds [25].
Particles are affected by various factors (Figure 1). It is also necessary to evaluate the various factors influencing the efficiency of particle agglomeration. Particles are often agglomerated by acoustic particle impact. Chemical–turbulent agglomeration and other methods are also applied.
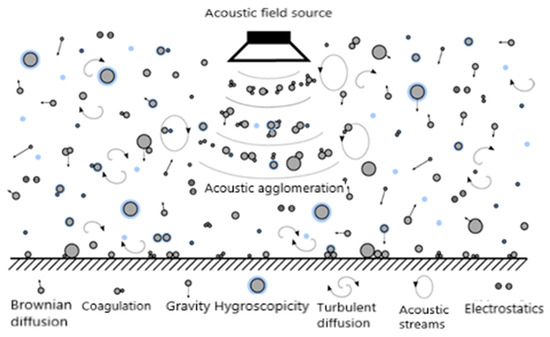
Figure 1.
Factors affecting particles [26].
When the particles are exposed to an acoustic field, the interaction between the particles intensifies and agglomeration takes place.
The work [27] investigated the agglomeration of monodisperse particles of different sizes (0.5 μm, 2 μm, and 4 μm) under different parameters. The results showed that in the range of 800 to 2400 Hz, the acoustic effect of agglomeration was better for 4 μm particles than for 0.5 μm and 2 μm particles.
In work [28], the direct simulation Monte Carlo (DSMC) method was used to simulate the acoustic agglomeration of solid particles. The effectiveness of the method is based on experimental results. The results show that the acoustic effect is effective because the amount of small particles is greatly reduced, which means that they agglomerate.
In order to investigate the impact efficiency of sound waves, experiments on the acoustic agglomeration of cloud droplets under the influence of sound waves at a frequency of 35–100 Hz and a sound pressure of 112–122 dB are presented in [29]. It was established that the effect of agglomeration of cloud droplets is greater for the sound pressure than for the sound frequency.
In order to improve the effect of particle agglomeration by means of turbulent agglomeration, the authors of [30] proposed merging vortices of different sizes in the turbulent flow field. A turbulent agglomerator was constructed and adapted for that purpose. Experimental studies revealed that the connection of vortices of different sizes in the field of a turbulent flow improves the agglomeration of particles.
Sun and other authors [31] constructed three types of turbulent agglomerators and conducted research on them. The results showed that the turbulent agglomerator with low eddies in the flow field had the best effect with regard to improving agglomeration.
The authors of [32] investigated the effect of sound pressures and sound frequencies on particle movement speed and concentration distribution, as well as on the sizes of bubbles and agglomerates.
In order to develop a high-efficiency and cost-effective particle removal technology, a new particle removal device was developed and presented in [33] based on theoretical analysis. The performance of the designed combined particle removal device was evaluated by laboratory experiments. Compared to a single external sound or condensation field, the combination of two external fields increased the particle removal efficiency. The maximum particle removal efficiency is about 70% at a sound frequency of 1500 Hz, a sound pressure level of 141 dB and a cooling water flow of 560 L/h.
The article [34] presents the results of ultrasonic removal of particles with a size of 2.5 µm. A two-stage gas purification system consisting of an agglomerator and a cyclone was proposed and manufactured. As a result of the research, the optimal conditions for the formation of a vortex flow, ensuring effective agglomeration of particles, have been determined. Ultrasonic exposure has been found to increase the cleaning efficiency of 2.5 µm particles from 46 to 85%.
In [35], a new agglomerator was proposed which has three agglomeration modes: turbulent agglomeration, atomized turbulent agglomeration and charged turbulent agglomeration. The agglomerator was also connected to a material filter. The results showed that the agglomeration efficiency of 1 μm particles in three agglomeration modes was 21.8%, 53.2%, and 68.9%. After connecting the material filter, the removal efficiency of 1 μm particles together with the three agglomeration modes was 66.5%, 83.9%, 86.8%, and 89.7%.
The article [36] describes studies carried out to determine the effect of ultrasound on the agglomeration of fine particles. The findings demonstrated that at a sound pressure of 160 dB, the agglomeration efficiency of 2.5 µm particles is 83%. In the presence of eddy currents, the agglomeration efficiency increases to 13%. A method of increasing coagulation efficiency by applying eddy currents between radiating and reflecting surfaces was proposed, and it ensured 96% coagulation efficiency.
Both chemical and turbulent agglomeration are promising technologies. However, both chemical and turbulent agglomeration have certain disadvantages. To identify the most effective variant of particle agglomeration, a combination of chemical and turbulent agglomeration was proposed and studied [37]. The results showed that chemical–turbulent agglomeration has more advantages compared to turbulent–chemical agglomeration. Turbulent agglomeration is a promising technology for economically and safely improving the removal of fine particles from industrial exhaust gases.
The authors of [38] investigated the acoustic agglomeration of fine coal ash particles. The work of the acoustic field agglomeration device is based on the particle coupling balance model. The interaction of particles in an acoustic field is still not well understood, which greatly hinders the development of technology for fine particle emission control using acoustic agglomeration [39].
The agglomeration of particles depends on various factors that occur between the particles and between the particles and the gaseous medium (e.g., air). Experimental and numerical studies of particle agglomeration [13,14,15,16,17,18] have confirmed that the amount of larger particles increases after the particles are exposed to an acoustic field, turbulent flow, or another method. However, the exact principle of particle agglomeration has yet to be determined.
Until now, methods and ways to improve the efficiency of particle agglomeration have been sought in order to increase the efficiency of air cleaning. Various experimental, theoretical, and numerical studies have been carried out.
The ion generator creates an electric field that facilitates the ionization process. During the process, positively and negatively charged particles are formed in the environment. The ion generator has two flat-plate electrodes connected to an electrical energy source. Ion generators use flat-plate electrodes due to their properties such as high electrical conductivity and a large surface area, which facilitate the ionization process. One electrode is called the cathode (negative) and the other is the anode (positive). Consequently, the environment consists of positively and negatively charged ions.
When air passes through the electric field, the electric field forces atoms or molecules to ionize, i.e., lose or gain electrons. Due to this process, particles in the air flow begin to attract each other. When ions adhere to these particles, they form larger particles that are deposited in the filter in the air flow outlet. These can be electrically charged dust particles, bacteria, or other allergens. In electrostatic precipitators, particles are ionized and deposited on the electrodes themselves.
The aim of the work is to perform particle agglomeration studies using ion generators.
Numerical tools can be used to simulate gas and dust flows and can be mentioned here. CFD-DEM simulation and optimization of gas-cyclone performance with realistic macroscopic particulate matter is given by El-Emam et al. [40]. Application of COMSOL Multiphysics numerical simulation method on dust control is given by Li and Jin [41].
2. Research Equipment
A special research bench was designed and manufactured for the experimental studies of particle agglomeration, which includes: a fan, a dispenser, a cyclone, particle counters, a box with ion generators, an air flow velocity meter, and a deposition chamber. A photo of the research bench is presented in Figure 2.
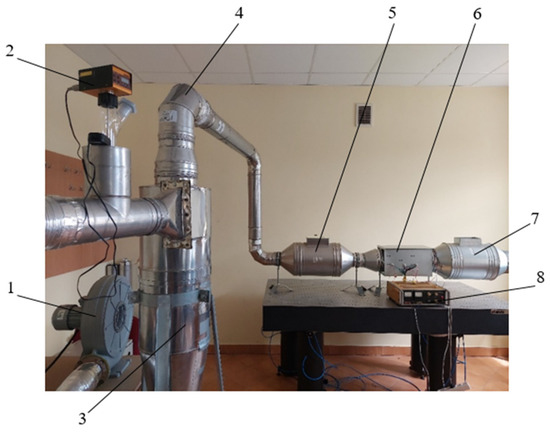
Figure 2.
Photo of the research bench: 1—fan, 2—dispenser, 3—cyclone, 4—duct, 5—primary particle quantity measurement zone, 6—box with ion generators, 7—secondary particle quantity measurement zone, 8—ion generator controller. The sensors were placed in the positions of the research stand design elements marked with numbers 5 and 7.
The operational principle of the setup is as follows: fan 1 supplies air flow from the environment to cyclone 3, where particles larger than 10 µm in diameter are removed from the air stream. Next, fine particles move through duct 4 to the primary measurement zone 5, where their quantity is measured by the particle counter in measurement zone 5, then to the box containing ion generator 6, where the ion generators are installed, and then to the secondary particle measurement zone 7. Each measurement is repeated three times and the mean value is computed.
Four TFB-YD1266 ion generators (Tianchang TRUMPXP Electronic Technology Co., Ltd., Shanghai, China) were used for particle agglomeration studies (Figure 3). The technical characteristics of the ion generators are presented in Table 1.
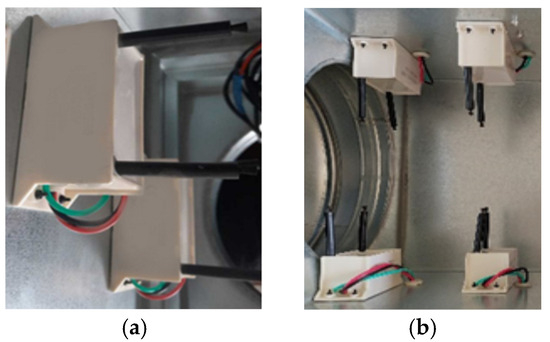
Figure 3.
Ion generator layout diagram: (a) side view; (b) top view.

Table 1.
Technical characteristics of ion generators.
The measuring equipment ALMEMO 2590A (Ahlborn Mess- und Regelungstechnik GmbH, Holzkirchen, Germany) was used to measure the air flow speed; measuring device consists of a meter 1 and a speed measuring sensor (vane anemometer) 2 (Figure 4).
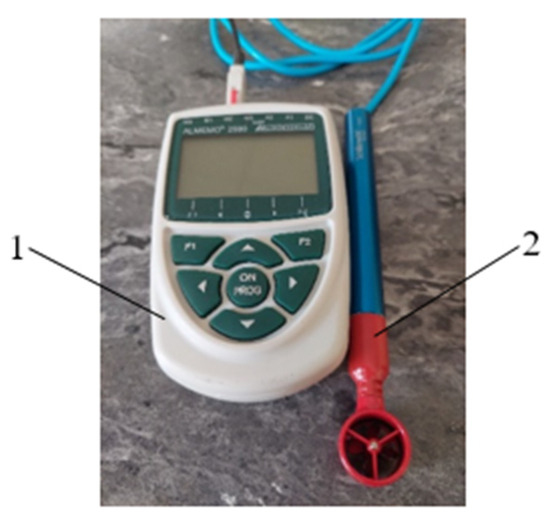
Figure 4.
Air flow speed meter: 1—meter, 2—speed measuring sensor (vane anemometer).
The air velocity sensor for use at higher temperatures up to 250 °C is supplied with a steel head and turbine which is bolted to the probe handle and is not replaceable. In anemometry, the accuracy of the vane probe is recognized as unsurpassed. Blade rotation is nearly linear to flow velocity and is unaffected by pressure, temperature, density, and humidity. In MiniAir probes(Schiltknecht Messtechnik AG, Gossau, Switzerland), as each metal blade passes through the probe handle, a pulse is generated by a simple magnetic receiver in the handle. The MiniAir64 vane anemometer (Schiltknecht Messtechnik AG, Gossau, Switzerland) measures the speed of gaseous media and water, with a direct 4–20 mA output. The Swiss Precision MiniAir64 Vane (Schiltknecht Messtechnik AG, Gossau, Switzerland) probe is unique. The lamella rotation has a very low resistance and is not affected by pressure, temperature, density, or humidity. A compact and easy-to-use particle counter “APC ErgoTouch Pro” (Merck KGaA, Darmstadt, Germany) was used for particle quantity measurements (Figure 5).
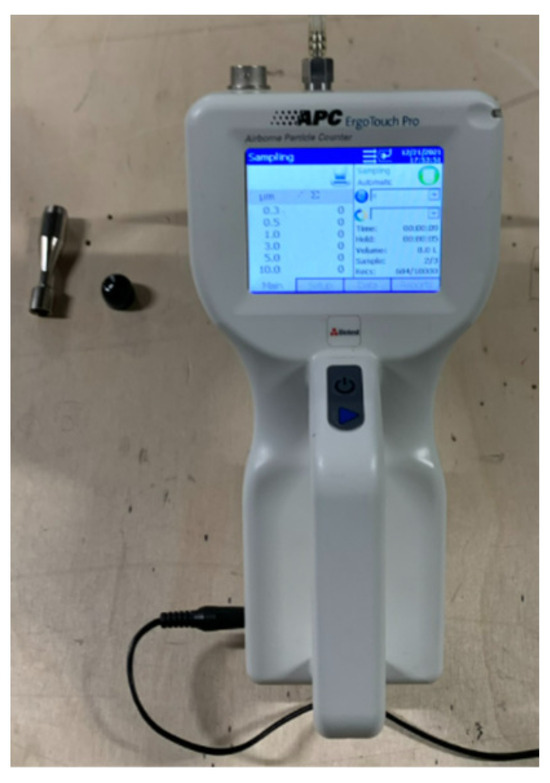
Figure 5.
Particle counter.
Using this particle counter, accurate results are quickly obtained, stored in the internal memory of the counter, and then transferred to a computer for analysis. This device has a 0.1 CFM (2.83 L/min) flow rate and counts bin sizes from 0.3 to 10 μm. Typical applications for this particle counter include clean room monitoring, research, exposure assessment, indoor air quality, filter testing, clearance testing, quality assurance, and contaminant migration studies.
As mentioned, the measurement range varies from 0.3 to 10 μm. This equipment cannot measure or count larger particles, such as those over 10 microns.
3. Methodology of Research
A research methodology was presented, according to which the experimental studies were carried out. Measurements of air flow pollution with solid particles (the tests) were carried out in a room of a building located in the city center with a volume of about 280 m3. The building stands roughly 50 m away from a construction site where a multi-story building was under construction. During the measurements, the ambient temperature was recorded at 27.5 °C and the humidity was recorded at 55.7%.
First of all, the number of solid particles in the environment and their size distribution from 0.3 μm to 10 μm were measured at different air flow speeds (from 2 m/s to 5 m/s), since this air speed is in ventilation systems. A duct with a diameter of 200 mm was used on the test bench.
In the physical experiment, cement particles (dust) were used, and the mechanical parameters are presented in Table 2.

Table 2.
Mechanical parameters of cement particle (dust).
After that, analogous measurements were made for air flow moving in an ionized environment and with different amounts of ion generators. The scheme of the arrangement of ion generators is presented in Figure 6, and the working parameters are presented in Table 3.
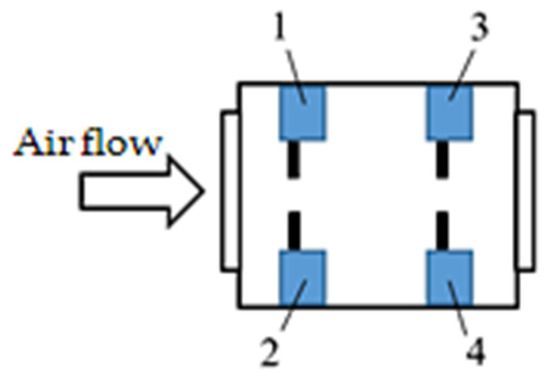
Figure 6.
A schematic diagram of the arrangement of ion generators in a box, 1; 2; 3; 4—ion generators. Air flow.

Table 3.
Ion generators’ working parameters.
In order to conduct experimental research, a special methodology was drawn up, according to which the experimental research was carried out.
The whole ion generator box contains 4 ion generators (4–4 W). During the experiment, they were connected in pairs of 2 ion generators each (1 ion generator is 1 W), 1–2 ion generators (2 ion generators—2 W) and 3—4 ion generators (4 ion generators—4 W).
Experimental studies were carried out in the following order:
- The fan was switched on;
- The air flow speed from 2 m/s was increased by 0.5 m/s to 5 m/s;
- The air flow was supplied from the environment (particle size: 10–2.5 μm);
- Large particles over 10 μm were deposited in the cyclone;
- The measurement of the number of particles was performed in the first measurement zone;
- Next, 1–2 ion generators were enabled (3.84 W);
- After that, 1–2 and 3–4 ion generators were enabled (7.68 W);
- The measurement of the number of particles was performed in the second measurement zone;
- The obtained measurement results from the particle counters in the first and second measurement zones were transferred to the computer;
- An analysis of the measurement results was performed.
In the next section, the analyzed results are graphically generalized and the discussion is presented.
4. Research Results
In this work, measurements of PM concentrations and particle size distributions were taken before and after the introduction of ions to assess the system’s effectiveness. Experimental measurements were performed according to the presented research methodology. Depending on the speed of the air flow and the effect of the ion generators, the agglomeration of particles of different sizes took place very differently.
The results of the experimental measurements performed at different speeds of air flow movement are presented graphically (Figure 7, Figure 8, Figure 9, Figure 10, Figure 11, Figure 12, Figure 13, Figure 14 and Figure 15). The graphs (Figure 7, Figure 8, Figure 9, Figure 10, Figure 11, Figure 12 and Figure 13) show the results of particle agglomeration depending on the speed of air flow. The data presented in the graphs are compared with each other for a single pair of generators and two pairs of generators, and the third graph illustrates the measurement results obtained without ion generators.
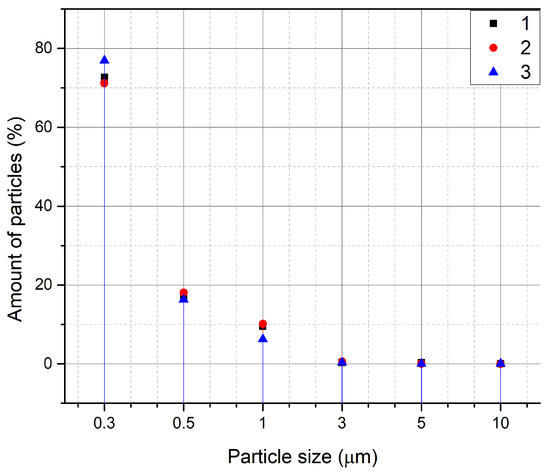
Figure 7.
Air movement speed 2 m/s: 1—one pair of ion generators, 2—two pairs of ion generators, 3—results without ion generators.
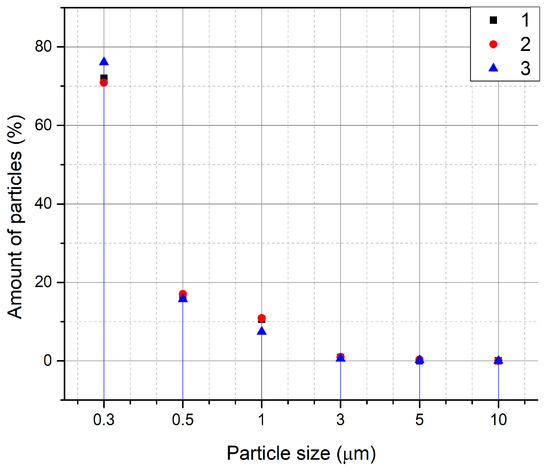
Figure 8.
Air movement speed 2.5 m/s: 1—one pair of ion generators, 2—two pairs of ion generators, 3—results without ion generators.
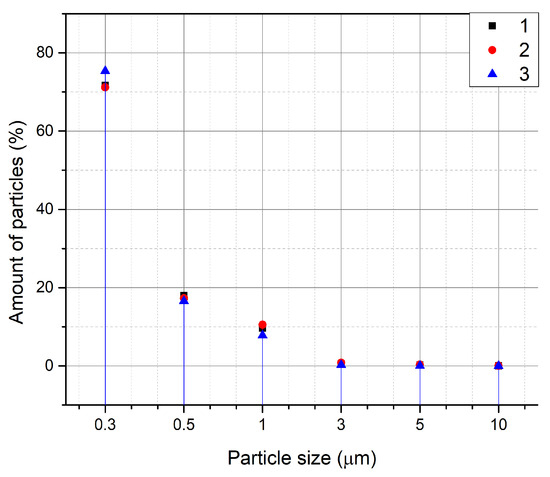
Figure 9.
Air movement speed 3 m/s: 1—one pair of ion generators, 2—two pairs of ion generators, 3—results without ion generators.
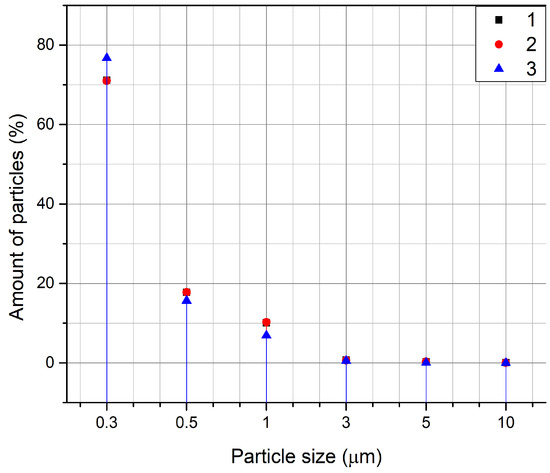
Figure 10.
Air movement speed 3.5 m/s: 1—one pair of ion generators, 2—two pairs of ion generators, 3—results without ion generators.
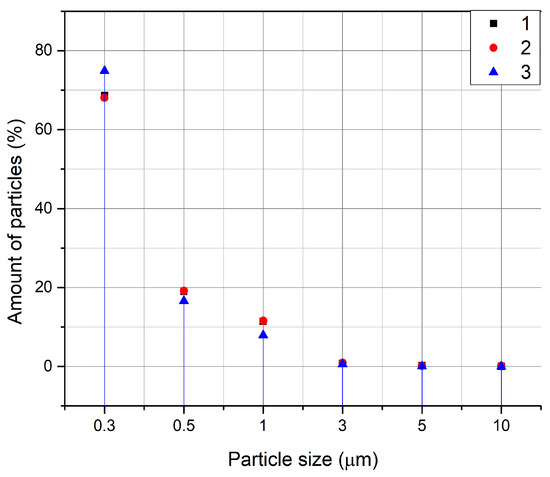
Figure 11.
Air movement speed 4 m/s: 1—one pair of ion generators, 2—two pairs of ion generators, 3—results without ion generators.
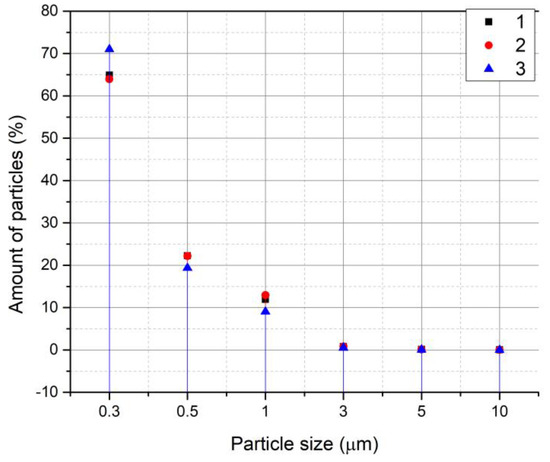
Figure 12.
Air movement speed 4.5 m/s: 1—one pair of ion generators, 2—two pairs of ion generators, 3—results without ion generators.
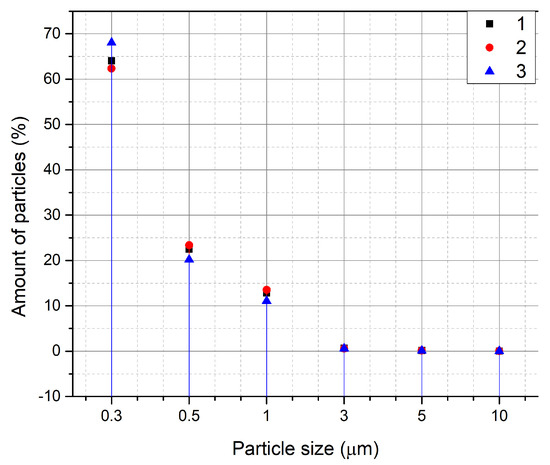
Figure 13.
Air movement speed 5 m/s: 1—one pair of ion generators, 2—two pairs of ion generators, 3—results without ion generators.
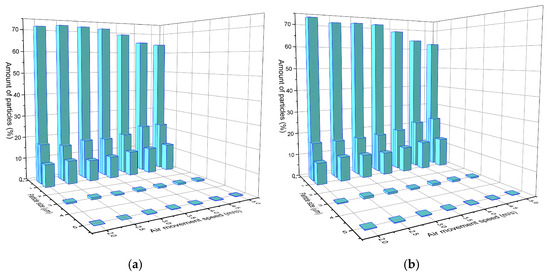
Figure 14.
Dependence of particle concentration distribution on air movement speed, marked in light blue: (a) during operation of two ion generators, (b) during operation of four ion generators.
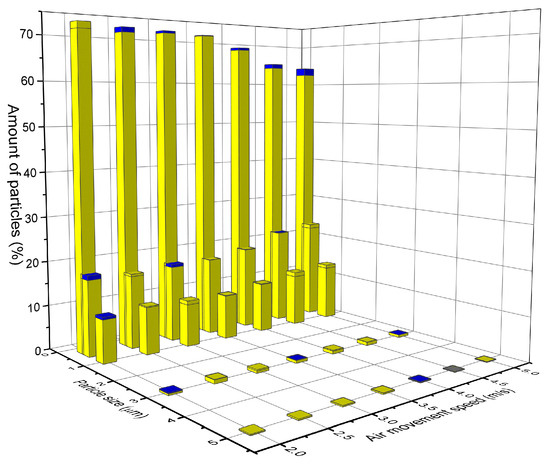
Particles larger than 10 μm in the air stream were separated in the cyclone and deposited in it. Experimental studies were carried out with particles of 0–10 μm size. Very few, up to 0.1%, particles of 10 μm size were recorded in the air stream. This means that the remaining particles (99.9%) were smaller than 10 μm. Most of the particles were 0.3 μm in size, and these particles are the most dangerous for human health. The smaller the particles, the more easily they spread in the environment and the more easily they enter the human body. As a result of the measurements, it was found that particle agglomeration took place in the operating environment of the ion generator as the air flow moved. Depending on the speed of the air flow, the amount of particles up to 0.3 μm in size decreased by 5–6%. This means that these particles agglomerated into particles of 0.4–1 μm in size (Figure 14a,b).
The difference in particle concentration distribution between the results of two and four generators is presented in Figure 15. In this figure, the difference in the results (Figure 14 and Figure 15) is marked in dark blue.
From the graphs depicting the research results, it can be seen that fine particles up to 1 μm in size agglomerate better. The efficiency decreases as particle size increases. The efficiency of agglomeration of larger particles decreases and the efficiency of agglomeration of particles over 1 μm is only 10–14%.
The use of ion generators improved the particle agglomeration results by up to 5%. The efficiency of particle agglomeration is also influenced by the number of ion generators (two or four generators were used). The efficiency of agglomeration differs between two and four ion generators. By connecting two generators to two ion generators, the efficiency of particle agglomeration increased by almost 8%.
The speed of air flow affects particle agglomeration unevenly. The agglomeration of 0.3 μm particles decreases with increasing air flow speed. However, the agglomeration of 1 μm particles increases with increasing air flow speed. The agglomeration of 3 and 5 μm particles is unevenly distributed as the air flow speed increases, and the results sometimes improve or worsen.
5. Discussion
The experimental results demonstrate the influence of air flow speed, ion generators, and particle size on the agglomeration efficiency of particles in the 0–10 μm range. The following key observations can be derived from the data.
Particle size distribution: The majority of particles in the air stream were found to be smaller than 10 μm, with 0.3 μm particles being the most prevalent. This highlights the significance of studying the agglomeration of fine particles, as they pose a greater risk to human health due to their ability to spread more easily in the environment and penetrate the human body.
Effect of air flow speed on agglomeration: The study found that air flow speed affects particle agglomeration differently depending on particle size. The agglomeration of 0.3 μm particles decreased with increasing air flow speed, while agglomeration of 1 μm particles increased. The results for 3 and 5 μm particles were less consistent, with agglomeration efficiency fluctuating as the air flow speed increased. This suggests that optimizing air flow speed is crucial for achieving effective particle agglomeration, and that the ideal speed may vary depending on the target particle size.
Impact of ion generators on agglomeration: Utilizing ion generators resulted in up to a 5% improvement in particle agglomeration outcomes. The quantity of ion generators was also found to affect agglomeration efficiency, as employing four generators led to an 8% enhancement in efficiency compared to using two generators. These findings suggest that the ion energy effect substantially contributes to improving particle agglomeration, and optimizing the number and positioning of ion generators could further bolster air purification systems.
Agglomeration efficiency: The results show that smaller particles (up to 1 μm) agglomerate more effectively, with efficiency decreasing as particle size increases. For particles larger than 1 μm, the agglomeration efficiency was found to be in the 10–14% range. This suggests that while smaller particles are more easily agglomerated, further optimization may be needed to improve the efficiency of agglomeration for larger particles.
Collectively, these results underscore the potential of ion energy in augmenting particle agglomeration within air purification systems. Additional research and optimization of factors, including airflow velocity, ion generator arrangement, and focusing on particular particle sizes, could pave the way for more effective air purification technologies. This, in turn, would contribute to improving indoor air quality and ultimately benefit human health. The incorporation of ion energy effect in air purification systems has demonstrated significant improvements in the removal of particulate matter (PM), particularly PM2.5 and PM10. These improvements can be attributed to the interaction between charged ions and airborne particles, leading to agglomeration and enhanced filtration.
The aforementioned scientific analysis of air purification systems utilizing the ion energy effect for particulate matter agglomeration demonstrates considerable improvements in PM removal efficiency. Among the studied configurations, the combination of ion generators and mechanical filters exhibits the most promising results. It can be mentioned that one of the measures of dust control effectiveness is the “efficiency of the dedusting installation” [44].
6. Conclusions
- It can be concluded that the application of ion generators affects the agglomeration of particles.
- The highest efficiency of agglomeration was observed between particles up to 1 μm in size. The efficiency of particle agglomeration decreased with increasing particle size.
- After using ion generators, the results of particle agglomeration improved even up to 5%.
- The number of ion generators also affected the efficiency of particle agglomeration, because the agglomeration efficiency was different when two and four ion generators are used. Adding two more ion generators to the applied two ion generators increased the e-efficiency of particle agglomeration up to 8%.
- Summarizing the research results, it can be said that it makes sense to use ion generators for particle agglomeration. It also makes sense to continue to conduct research using ion generators.
Author Contributions
A.Č., I.T. and R.B. conceptualization, methodology, software, validation, formal analysis; A.Č., I.T., R.B. and R.J. writing—original draft preparation, writing—review and editing, supervision. All authors have read and agreed to the published version of the manuscript.
Funding
This research received no external funding.
Institutional Review Board Statement
Not applicable.
Informed Consent Statement
Not applicable.
Data Availability Statement
The data presented in this study are available on request from the corresponding author. The data are not publicly available due to privacy concerns.
Conflicts of Interest
The authors declare no conflicts of interest.
References
- Kihong, P.; Kittelson, D.B.; McMurry, P.H. Structural Properties of Diesel Exhaust Particles Measured by Transmission Electron Microscopy (TEM). Relationships to Particle Mass and Mobility. Aerosol Sci. Technol. 2004, 38, 881–889. [Google Scholar] [CrossRef]
- Burtscher, H. Physical characterization of particulate emissions from diesel engines. J. Aerosol Sci. 2005, 36, 896–932. [Google Scholar] [CrossRef]
- Sanchez-Soberon, F.; Rovira, J.; Mari, M.; Sierra, J.; Nadal, M.; Domingo, J.; Schuhmacher, M. Main components and human health risks assessment of PM10, PM2.5, and PM1 in two areas influenced by cement plants. Atmos. Environ. 2015, 120, 109–116. [Google Scholar] [CrossRef]
- Gupta, R.K.; Majumdar, D.; Trivedi, J.V.; Bhanarkar, A.D. Particulate matter and elemental emissions from a cement kiln. Fuel Process. Technol. 2012, 104, 343–351. [Google Scholar] [CrossRef]
- WHO. Frequently Asked Questions: Ambient and Household Air Pollution and Health. Available online: https://www.who.int/vietnam/news/feature-stories/detail/frequently-asked-questions-about-ambient-and-household-air-pollution-and-health (accessed on 18 May 2023).
- Cohen, A.J.; Ross Anderson, H.; Ostro, B.; Pandey, K.D.; Krzyzanowski, M.; Künzli, N.; Gutschmidt, K.; Pope, A.; Romieu, I.; Samet, J.M.; et al. The global burden of disease due to outdoor air pollution. J. Toxicol. Environ. Health 2005, 68, 1301–1307. [Google Scholar] [CrossRef] [PubMed]
- EEA. Air Quality in Europe 2013 Report, EEA Report; EEA: Copenhagen, Denmark, 2013. [Google Scholar] [CrossRef]
- Sierra-Vargas, M.P.; Teran, L.M. Air Pollution: Impact and Prevention. Respirology 2012, 17, 1031–1038. [Google Scholar] [CrossRef] [PubMed]
- World Health Organization. WHO Air Quality Guidelines Global Update 2005; World Health Organization: Bonn, Germany, 2005. [Google Scholar]
- Particulate Matter (PM) Pollution. Available online: https://www.epa.gov/pm-pollution/particulate-matter-pm-basics (accessed on 1 May 2024).
- Pui, D.; Chen, S.; Zuo, Z. PM2.5 in China: Measurments, sources, visibility and health effects, and mitigation. Particuology 2014, 13, 1–26. [Google Scholar] [CrossRef]
- Čereška, A.; Zavadskas, E.K.; Cavallaro, F.; Podvezko, V.; Tetsman, I.; Grinbergienė, I. Sustainable assessment of aerosol pollution decrease applying multiple attribute decision-making methods. Sustainability 2016, 8, 586. [Google Scholar] [CrossRef]
- Dong, S.; Lipkens, B.; Cameron, T.M. The effects of orthokinetic collision, acoustic wake, and gravity on acoustic agglomeration of polydisperse aerosols. J. Aerosol Sci. 2006, 37, 540–553. [Google Scholar] [CrossRef]
- Hoffmann, T.L. An extended kernel for acoustic agglomeration simulation based on the acoustic wake effect. J. Aerosol Sci. 1999, 28, 919–936. [Google Scholar] [CrossRef]
- Hoffmann, T.L. Environmental implications of acoustic aerosol agglomeration. Ultrasonics 2000, 238, 353–357. [Google Scholar] [CrossRef] [PubMed]
- Sheng, C.; Shen, X. Modelling of acoustic agglomeration processes using the direct simulation Mote Carlo method. J. Aerosol Sci. 2006, 37, 16–36. [Google Scholar] [CrossRef]
- Riera, E.; Gonzalez-Gomez, I.; Rodrigue, G.; Gallego-Juarez, J.A. Ultrasonic agglomeration and preconditioning of aerosol particles and other applications. Powder Ultrason. 2023, 38, 861–886. [Google Scholar] [CrossRef]
- Markauskas, D.; Kačianauskas, R.; Maknickas, A. Numerical particle-based analysis of the effects responsible for acoustic particle agglomeration. Adv. Powder Technol. 2015, 26, 698–704. [Google Scholar] [CrossRef]
- Gallego, J.A.; Sarabia, E.R.; Rodriguez, G. Application of acoustic agglomeration to reduce fine particle emissions from coal combustion plants. Environ. Sci. Technol. 1999, 33, 3843–3849. [Google Scholar] [CrossRef]
- Heidenreich, S.; Vogt, U.; Büttner, H. A novel process to separate submicron particles from gases-a cascade of packed columns. Chem. Eng. Sci. 2000, 55, 2895–2905. [Google Scholar] [CrossRef]
- Sarabia, E.R.; Elvira-Segura, L.; Gonzalez-Gomez, I. Investigation of the influence of humidity on the ultrasonic agglomeration of submicron particles in diesel exhausts. Ultrasonics 2003, 41, 277–281. [Google Scholar] [CrossRef] [PubMed]
- Yuen, W.T.; Fu, S.C.; Chao, Y.H. The Effect of Aerosol Size Distribution and Concentration on the Removal Efficiency of an Acoustic Aerosol Removal System. J. Aerosol Sci. 2017, 104, 79–89. [Google Scholar] [CrossRef]
- Bin, H.; Yang, Y.; Zhou, L.; Shen, A.; Cai, L.; Yang, L.; Roszak, S. Experimental and DTF studies of PM2.5 removal by chemical agglomeration. Fuel 2018, 212, 27–33. [Google Scholar] [CrossRef]
- Shen, G.; Huang, X.; He, C.; Zhang, S.; An, L. Experimental study of acoustic agglomeration and fragmentation on coal-fired ash with different particle size distribution. Powder Technol. 2018, 325, 145–150. [Google Scholar] [CrossRef]
- Guo, Q.; Yang, Z.; Zhang, J. Influence of a combined external field on the agglomeration of inhalable particles from a coal combustion plant. Powder Technol. 2012, 227, 67–73. [Google Scholar] [CrossRef]
- Ng, B.F.; Xiong, J.W.; Wan, M.P. Application of acoustic agglomeration to enhance air filtration efficiency in air-conditioning and mechanical ventilation (ACMV) systems. PLoS ONE 2017, 12, e0178851. [Google Scholar] [CrossRef]
- He, M.; Luo, Z.; Wan, H.; Fang, M. The Influences of Acoustic and Pulsed Corona Discharge Coupling Field on Agglomeration of Monodisperse Fine Particles. Appl. Sci. 2020, 10, 1045. [Google Scholar] [CrossRef]
- Wu, Z.; Fan, F.; Yan, J.; Chen, H.; Hu, X.; Su, M. An adaptable direct simulation Monte Carlo method for simulating acoustic agglomeration of solid particles. Chem. Eng. Sci. 2021, 249, 117298. [Google Scholar] [CrossRef]
- Qiu, J.; Tang, L.J.; Cheng, L.; Wang, G.Q.; Li, F.F. Interaction between strong sound waves and cloud droplets: Cloud chamber experiment. Appl. Acoust. 2021, 176, 107891. [Google Scholar] [CrossRef]
- Sun, Z.; Yang, L.J.; Wu, X. Promoting the removal of fine particles by turbulent agglomeration with the coupling of different-scale vortexes. Powder Technol. 2020, 367, 399–410. [Google Scholar] [CrossRef]
- Sun, Z.; Yang, L.; Wu, H.; Wu, X. Agglomeration and removal characteristics of fine particles from coal combustion under different turbulent flow fields. J. Environ. Sci. 2020, 89, 113–124. [Google Scholar] [CrossRef]
- Zhu, L.; Tang, Y. Effects of acoustic fields on the dynamics of micron-sized particles in a fluidized bed. Powder Technol. 2020, 372, 625–637. [Google Scholar] [CrossRef]
- Li, K.; Wang, E.; Wang, Q.; Husnain, N.; Deli, L.; Fareed, S. Improving the removal of inhalable particles by combining flue gas condensation and acoustic agglomeration. J. Clean. Prod. 2020, 261, 121270. [Google Scholar] [CrossRef]
- Khmelev, V.N.; Shalunov, A.V.; Nesterov, V.A. Improving the performance of air purification efficiency from fine-dispersed particles by ultrasonic exposure in swirling flow. Int. J. Environ. Sci. Technol. 2020, 17, 3927–3934. [Google Scholar] [CrossRef]
- Liu, H.; Li, Z.; Tan, H.; Yang, F.; Feng, P.; Du, Y.; Ren, M.; Dong, M. Experimental investigation on a novel agglomeration device based on charged ultrasonic spray and vortex generators for improving the removal of fine particles. Fuel 2021, 287, 119549. [Google Scholar] [CrossRef]
- Khmelev, V.N.; Nesterov, V.A.; Bochenkov, A.S.; Shalunov, A.V. The Limits of Fine Particle Ultrasonic Coagulation. Symmetry 2021, 13, 1607. [Google Scholar] [CrossRef]
- Sun, Z.; Yang, L.; Shen, A.; Zhou, L.; Wu, H. Combined effect of chemical and turbulent agglomeration on improving the removal of fine particles by different coupling mode. Powder Technol. 2019, 344, 242–250. [Google Scholar] [CrossRef]
- Zheng, J.; Li, Y.; Wan, Z.; Hong, W.; Wang, L. Modification of the agglomeration kernel and simulation of the flow pattern in acoustic field with fine particles. Powder Technol. 2019, 356, 930–940. [Google Scholar] [CrossRef]
- Qu, G.N.; Fan, F.X.; Zhang, S.H.; Su, M.X. Interaction between monodisperse fine particles in a standing wave acoustic field. Acta Phys. Sin. 2020, 69, 064704. [Google Scholar] [CrossRef]
- El-Emam, M.A.; Shi, W.; Zhou, L. CFD-DEM simulation and optimization of gas-cyclone performance with realistic macroscopic particulate matter. Adv. Powder Technol. 2019, 30, 2686–2702. [Google Scholar] [CrossRef]
- Li, F.; Jin, L. Application of COMSOL Multiphysics numerical simulation method on dust control. In Proceedings of the 2010 International Conference on Computer Application and System Modeling (ICCASM 2010), Taiyuan, China, 22–24 October 2010; Volume 14, pp. 425–428. [Google Scholar] [CrossRef]
- Rudžionis, Ž.; Ivanauskas, E.; Navickas, A.A. Influence of Cement Kiln Dust and Shale Ash on the Cement Stone Properties. In Proceedings of the 10th International Conference on Modern Building Materials, Structures and Techniques, Vilnius Gediminas Technical University, Department of Construction Economics & Property, Vilnius, Lithuania, 19–21 May 2010; p. 270. [Google Scholar]
- Constantinides, G.; Ulm, F.J. The effect of two types of C-S-H on the elasticity of cement-based materials: Results from nanoindentation and micromechanical modeling. Cem. Concr. Res. 2004, 34, 67–80. [Google Scholar] [CrossRef]
- Kapusta, M.; Skrzypkowski, K. Determination of the Salt-Dust Emission and the Efficiency of the Dedusting Installation in the Wieliczka Salt Mine. Energies 2022, 15, 8122. [Google Scholar] [CrossRef]
Disclaimer/Publisher’s Note: The statements, opinions and data contained in all publications are solely those of the individual author(s) and contributor(s) and not of MDPI and/or the editor(s). MDPI and/or the editor(s) disclaim responsibility for any injury to people or property resulting from any ideas, methods, instructions or products referred to in the content. |
© 2024 by the authors. Licensee MDPI, Basel, Switzerland. This article is an open access article distributed under the terms and conditions of the Creative Commons Attribution (CC BY) license (https://creativecommons.org/licenses/by/4.0/).