Article

Indoor Radon Surveying and Mitigation in the Case-Study of Celleno Town (Central Italy) Located in a Medium Geogenic Radon Potential Area

1
Dipartimento di Scienze, Università degli Studi “Roma Tre”, 00146 Roma, Italy
2
Istituto Nazionale Geofisica e Vulcanologia, Sezione Roma 1, 00143 Roma, Italy
3
Consiglio Nazionale delle Ricerche, Istituto di Geologia Ambientale e Geoingegneria, Monterotondo, 00015 Rome, Italy
4
Mapei S.p.A., Waterproofing Line, 20158 Milano, Italy
*
Author to whom correspondence should be addressed.
Atmosphere 2024, 15(4), 425; https://doi.org/10.3390/atmos15040425
Submission received: 23 February 2024 / Revised: 21 March 2024 / Accepted: 23 March 2024 / Published: 29 March 2024
(This article belongs to the Special Issue Indoor Air Pollution Exposure and Health Risk Assessment)

Abstract

:
Indoor radon surveying and remediation were implemented in a single-family home affected by high levels of indoor radon in the Celleno municipality (central Italy) with the aim of identifying the contribution of radon sources, evaluating the factors affecting radon entry into the building, and reducing radon risk. Average radon levels were relatively low at the ground floor (286 ± 202 Bq m−3) and first floor (167 ± 84 Bq m−3) in autumn when the temperature was still warm and the windows were open, but increased up to 2776 ± 1768 Bq m−3 and 970 ± 202 Bq m−3 in the first half of December, when the heating system was on and the windows were closed. The inner walls of the pilot room at the ground floor, semi buried on one side, were then treated with a waterproof product (a silane terminated polymer) and the average radon was halved (1475 ± 1092 Bq m−3) in the following month, which was still characterised by winter conditions. Radon entry in the room was identified and sealed with the same product, and a radon accumulation space behind a NE-SW oriented wall was naturally ventilated, reducing radon below the reference level in April with northerly winds conditions.

1. Introduction

Indoor radon is considered the second biggest cause of lung cancer after smoking [1] and a major contributor to natural radiation exposure for the general population [2,3,4]. The main sources of indoor radon are the geological bedrock, building materials, and the water used for domestic purposes [5,6]. The geological bedrock is generally the main supplier, especially in areas characterised by high geogenic radon potential (GRP; [3,7]). GRP represents the rate at which radon migrates to the surface along faults or directly emanated from shallow soil [7]. It can be defined based on soil radon activity concentrations at a fixed depth (0.8–1 m) and the associated soil gas permeability [8].
Large areas of Lazio region (central Italy), where volcanic products or faulted and fractured carbonate rocks outcrop, belong to high GRP districts [3,7]. The Celleno area, where this study was carried out, is classified as a medium–high GRP territory [3]. Average indoor radon levels at Celleno, based on 44 samples, are 378 Bq m−3 (247–509), with values up to 2291 Bq m−3 [3]. The dwelling under consideration in particular was characterised by radon levels higher than 2000 Bq m−3 in winter, when environmental conditions severely affect radon entry into buildings [3]. The geological bedrock is the main radon source, but ignimbrites emitted by the Vulsini volcanic apparatus were used to build the house and partially contribute to indoor levels.
Recent Italian legislation (D.Lgs. n. 101/2020) [9] established the safety standards for the protection of people from the dangers deriving from ionising radiation and from radon gas in the workplace and in homes, indicating a reference level of 300 Bq/m3. The mitigation of high radon-affected buildings is generally based on the reduction of radon entry by sealing of surfaces, on the use of anti-radon barriers, on soil depressurisation, or houses pressurisation techniques to reverse the air pressure differences between the indoor space and the soil underneath the building and on the ventilation (natural or forced) of the rooms [10,11,12].
The aim of this research was: (i) to identify and assess the contribution of radon sources; (ii) to study and evaluate the factors affecting radon entry into the building, either geogenic or anthropogenic; and (iii) to reduce radon risk.

2. Geological Setting of the Study Area

Celleno town is located on the Tyrrhenian margin of central Italy, within the volcanic complexes of Vulsini Mts. Extensional tectonics controlled the evolution of the area since the Middle–Late Pliocene, generating dominant NW–SE and NE–SW faulting patterns [13,14] and NW–SE trending marine and continental sedimentary basins [15]. Associated volcanic activity during the Quaternary produced large volumes of potassic and ultrapotassic lavas and pyroclastics [16] that were deposited on horst and graben structures. An overlying sedimentary sequence comprises, from top to bottom, Miocene-Quaternary clayey-sandy marine, and continental formations, covering Mesozoic carbonate formations.

3. Materials and Methods

3.1. Study House

The study house (Figure 1) is located on “Gruppo di Civita di Bagnoreggio” volcanic succession ascribed to Middle Pleistocene [15,17]. It was already investigated in the frame of an EU-funded LIFE-RESPIRE (Radon rEal time monitoring System and Proactive Indoor REmediation) project, one of the aims of which was to implement a friendly solution for radon real-time measurement and remediation to keep indoor levels below reference values [3]. This arrangement consisted of radon, temperature, and relative humidity sensors, and an external electric fan-system operating by negative pressure method. Since this device was unable to satisfactorily reduce radon concentration, a dual-way fan was applied later to increase forced ventilation in the living room (room C in Figure 1). This action improved radon activity concentrations in room C, but not in the bedroom located on the ground floor (room A in Figure 1).
The house was built with a local tuff very rich in radon precursors around 1960 and was only acquired by the present owner in 1991, who carried out some works to protect the house from soil radon entry: (i) a naturally ventilated trench around rooms A and D, and (ii) a bitumen membrane and a network of pipes (connected to an external fan, referred to as “forced ventilation” in the following sections) below the ground of the same room (Figure 1). A divider of bricks was then placed at a certain distance from the main wall of room A (Figure 1), unintentionally creating a radon accumulation chamber, indicated as “cavity” in Figure 1. Rooms A and D are delimited by an embankment, which makes the house semi-buried on two sides. The naturally ventilated trench was dug right along these margins.

3.2. Monitoring System

In the context of this work, indoor radon was measured in two rooms, the bedroom located on the ground floor (room A) and a second bedroom on the first floor (room B) using two AER PLUS (Algade Instrumentation, Bessines-sur-Gartempe, France) radon monitors (Figure 1). The AER PLUS is a small solid-state radon detector with local storage for temperature and relative humidity data. It is battery supplied with an autonomy of at least six months. Both instruments were calibrated for the effect of absolute humidity on the efficiency of the radon sensor (a silicon detector in which radon is collected by simple diffusion) at INGV radon chamber. The procedure [6,18] is reported in Appendix A.
The surveying period was from October 2022 to April 2023 (Table 1). After a first phase of data collection reflecting the normal habits of the occupants (October and November 2022), from 8 December to 10 December 2022, the walls of room A were treated with a radon barrier material available on the market, Aquaflex S1K, a silane terminated polymer tested in [6] using the scale model room approach. According to this method, the product gave an indoor radon reduction of 81% [6] and was chosen because of its performance and versatility also in the presence of humidity. Approximately 2.4 kg of product per m2 of surface were applied in two coats considering the running operative procedures in the construction industry to cut the radon contribution of building materials. The monitoring was continued in the following months when some further small actions were carried out from mid-December 2022 to mid-January 2023 to better isolate the room from soil radon entry, identified by thoron (220Rn) sniffing (Table 1). Finally, on 15 January 2023, two holes were made on the NW external wall of room A to ventilate the cavity behind the bricks partition, and another hole was drilled through the NE wall of the same cavity on 2 March 2023 (Figure 1 and Table 1). It is notable that in the period 30 November 2022–2 December 2022, the old window frames were replaced with new ones to improve the thermal insulation of the room.
Thoron sniffing was performed with the RAD7 (Durridge Company, Inc., Billerica, MA, USA) radon monitor to find radon entry points from the electrical outlets, end points of the radiator pipes on the wall and cracks between the parquet strips to improve the insulation of the room from the ground. The RAD7 is a continuous radon monitor equipped with built-in pump to exchange air with the environment. It collects radon and thoron daughters (polonium isotopes) on the surface of its planar silicon detector, enabling high-resolution alpha spectroscopy of their decay energies. Temperature and relative humidity data are collected throughout the run. The RAD7 can make a direct and specific measurement of thoron via its first daughter 216Po with a half-life of just 150 ms (sniff mode). This makes the response to thoron virtually instantaneous and allow entry points to be located when the source is very close.
Thoron sniffing was also applied on the treated wall in room A and on the opposite side of the same wall not covered with Aquaflex S1K in the kitchen, room C (Figure 1), to evaluate the efficiency of the barrier material.
Transects of total gamma radiation were carried out in room A, room B and outdoors (Figure 1) using a digital ratemeter connected to a scintillator, 5.1 cm × 5.1 cm (diameter × length). The ratemeter (model 2241-3, Ludlum Measurements, Inc., Sweetwater, TX, USA) is equipped with a built-in scaler that provides timed counts over a user specified period. The gamma detector (model 44-11, Ludlum Measurements, Inc.) collecting gamma radiation from 60 keV to 2 MeV is optically coupled to a photomultiplier tube, 5.1 cm in diameter. The sensitivity is typically 900 cpm per 0.01 μSv h−1 (137Cs). The purpose of these measurements was to evaluate relative contributions of building materials and bedrock and estimate dose rates.
The Acquaforte meteorological station of the SIARL network [19], located two kilometers away from the study site, provided daily temperature (minimum, medium, and maximum); wind velocity (minimum, medium, and maximum); and direction and precipitation rates data to evaluate the effect of these parameters on indoor radon.

4. Results

4.1. Indoor Radon Monitoring

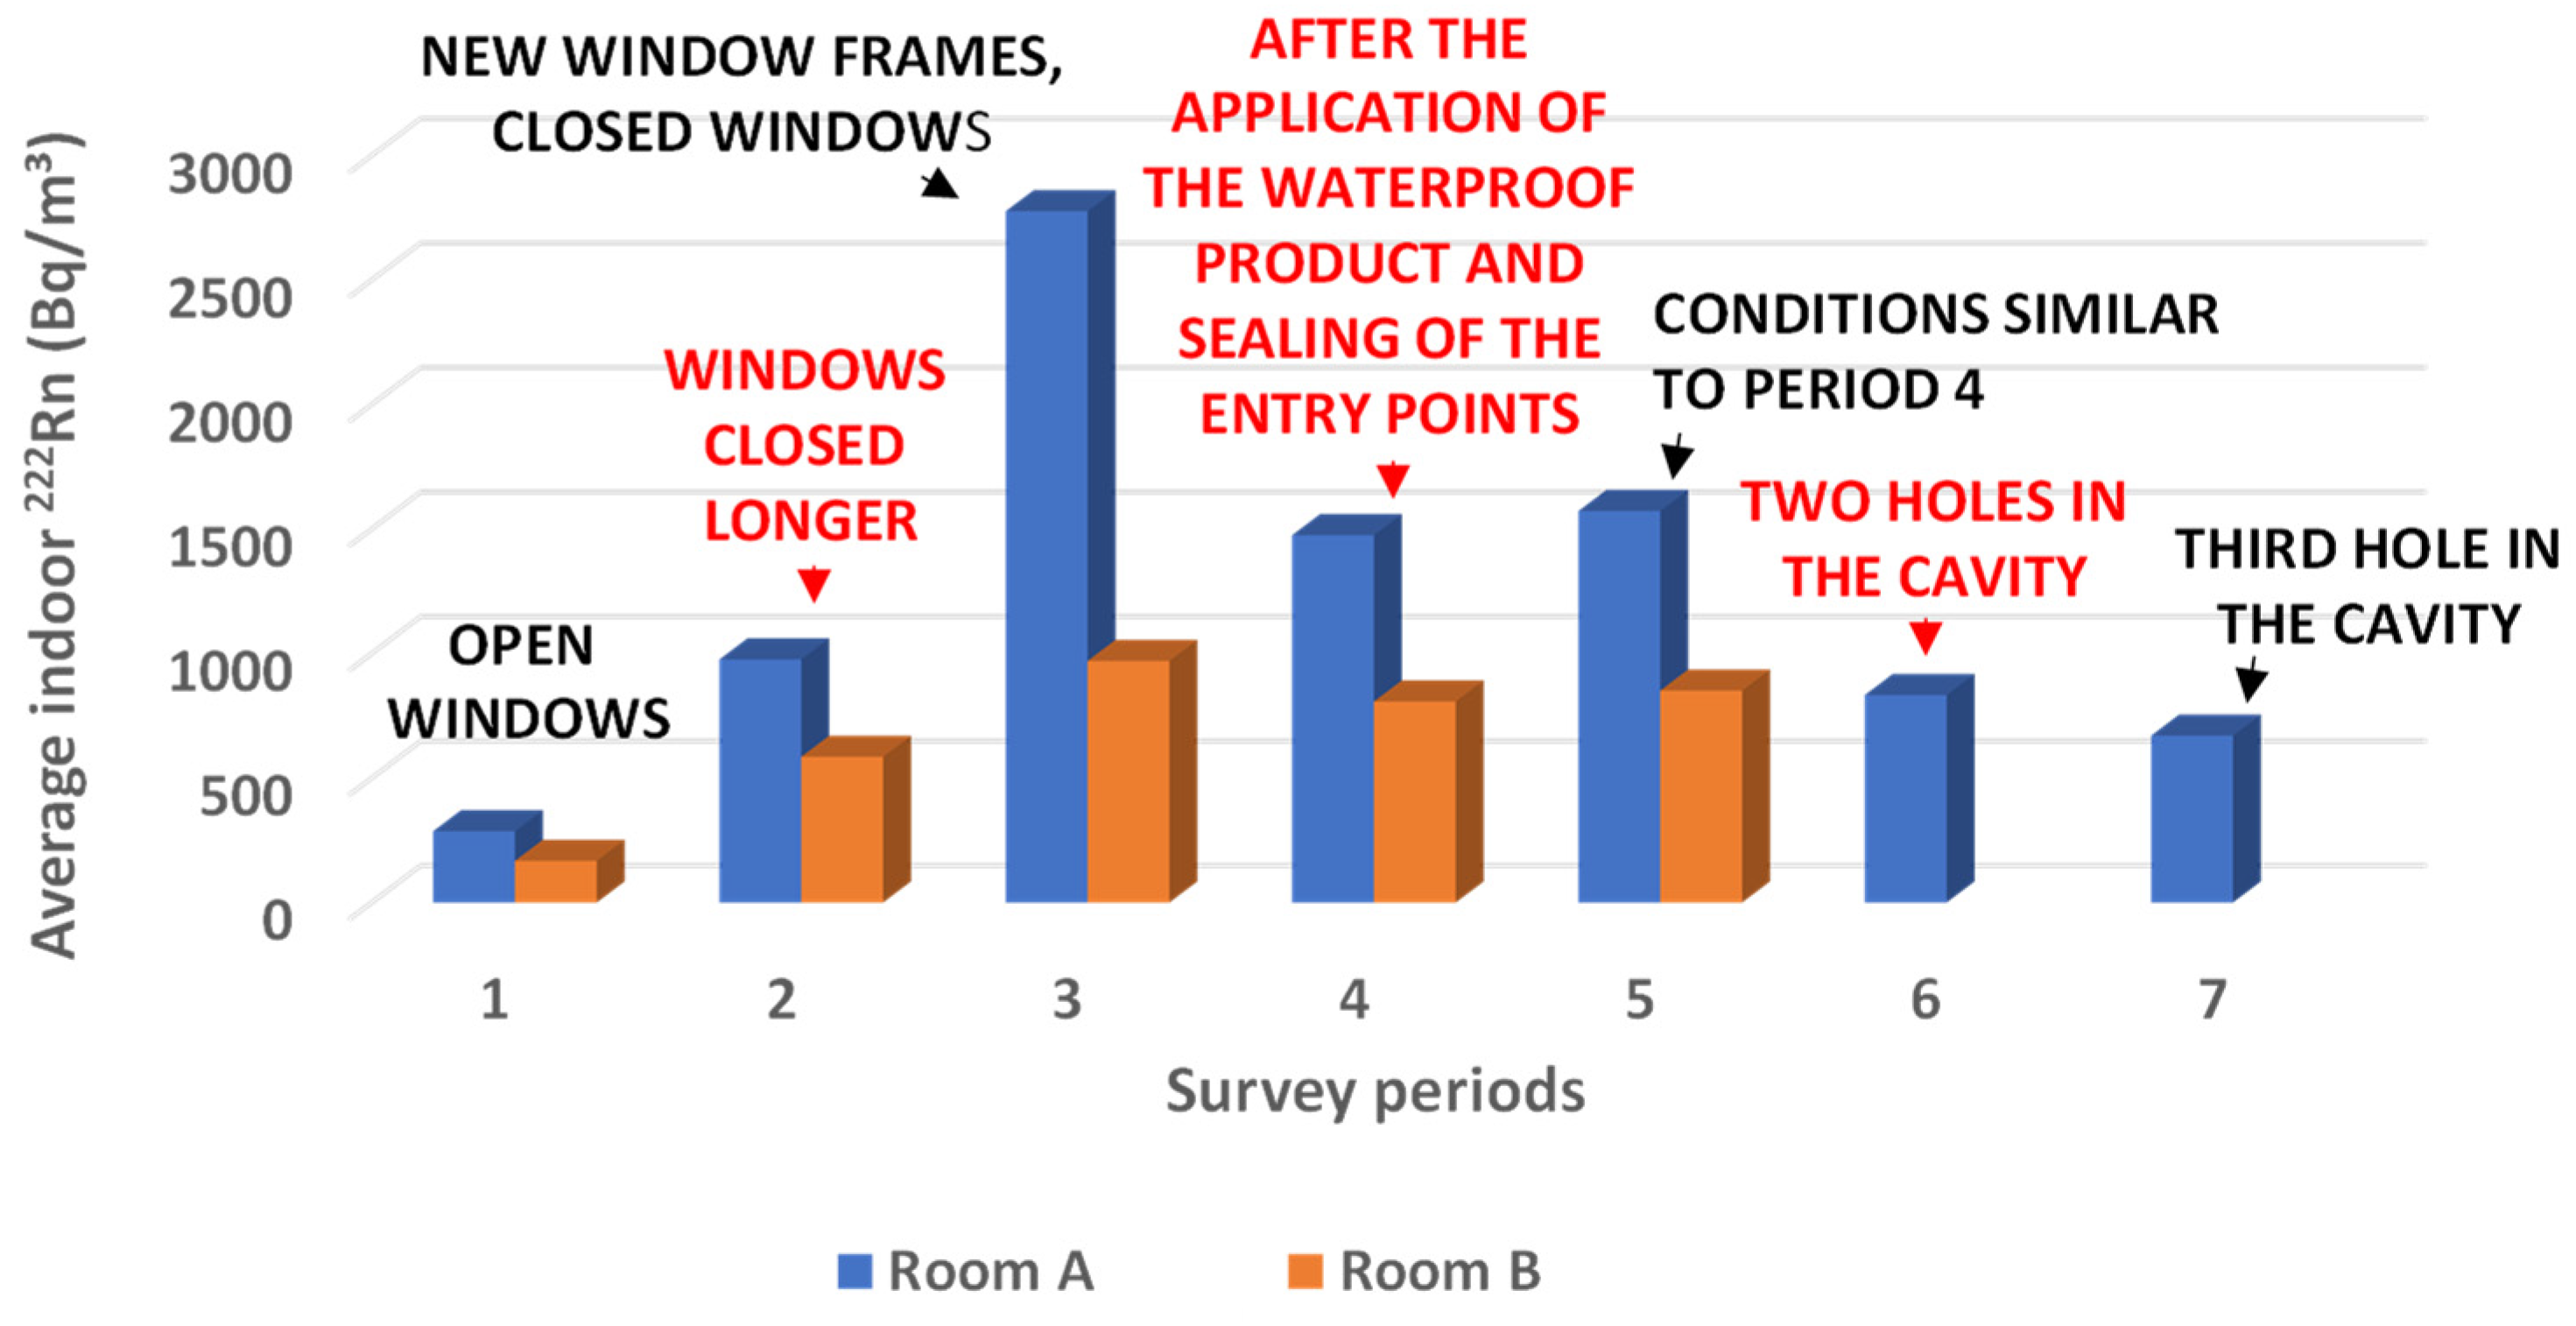
Indoor 222Rn time was recorded in rooms A and B from 12 October 2022 to 13 April 2023. The survey interval was divided into seven segments based on the implementation of mitigation activities reported in Table 1. Average data in the seven periods are reported in Table 2 and Figure 2.
During the first period of monitoring (from 12 October–11 November 2022), the radon values were relatively low in both rooms because the weather in fall 2022 was warm and temperate, and windows were left open all day. This allowed the air exchange between the house and the external environment. Average radon levels (286 Bq m−3) at the ground floor were higher than those of the first floor (167 Bq m−3), showing that the soil significantly contributed to indoor radon. Later (from 12 November 2022 to 30 November 2022), radon began to increase due to both the increased pressure and temperature gradients between the house and the outdoors and the longer time without natural ventilation. In this period, room A recorded average radon values of 976 Bq m−3 and room B of 585 Bq m−3.
At the end of the second segment, the old window frames of room A were replaced with new ones with a strong seal; therefore, from 1 December 2022 to 16 December 2022, the colder climatic conditions and the new windows produced a significant increase of average radon: 2776 Bq m−3 in room A and 970 Bq m−3 in room B.
During the fourth monitoring period from 17 December 2022 to 15 January 2023, it was possible to evaluate the effect of the waterproof product applied on the walls of room A and in the radon entry points, detected by 220Rn sniffing (Figure 3).
Average radon levels dropped to 1475 Bq m−3 (by 47%) in room A and to 807 Bq m−3 (by 17%) in room B, emphasising the effectiveness of the radon barrier product applied in room A. In the fifth segment of the survey, radon values were almost like those of the previous period in both rooms (1572 and 851 Bq m−3, respectively, in rooms A and B.
The sixth phase, from 17 February 2023 to 3 March 2023, was still characterised by cold climatic conditions with closed windows and the thermo-fireplace on in the afternoon, but indoor radon was furtherly reduced to 833 Bq m−3 (by a further 47% with reference to the fourth period) in room A, due to the opening of two holes on the external NE-SW trending wall behind the cavity created by the bricks partition (Figure 1).
The drilling of a third hole in the external wall behind the cavity of room A, perpendicular to the previously mentioned wall (Figure 1), brought radon levels in the seventh period (from 4 March 2023 to 13 April 2023) to 670 Bq m−3. should be emphasised that, with constant winds from NE and N (from 3 to 6 April 2023), a strong wind effect was observed, and radon levels dropped down to 495 Bq m−3. This effect was very strong even if the fan connected to the underground pipes of room A was off, the windows were closed and the thermo-fireplace in room C was on.

4.2. Thoron Sniffing and Soil Gas Entry Points

Soil gas entry points in rooms A, C, and D were located with the thoron sniffing method [20]. Thoron was locally detectable, showing a direct connection with the soil source. Radon passed through the electrical outlets, the end points of the radiator pipes on the wall and the cracks between the parquet strips.
The location of measuring points and relative significant thoron determination are shown in Figure 3.

4.3. Total Gamma Radiation and Dose

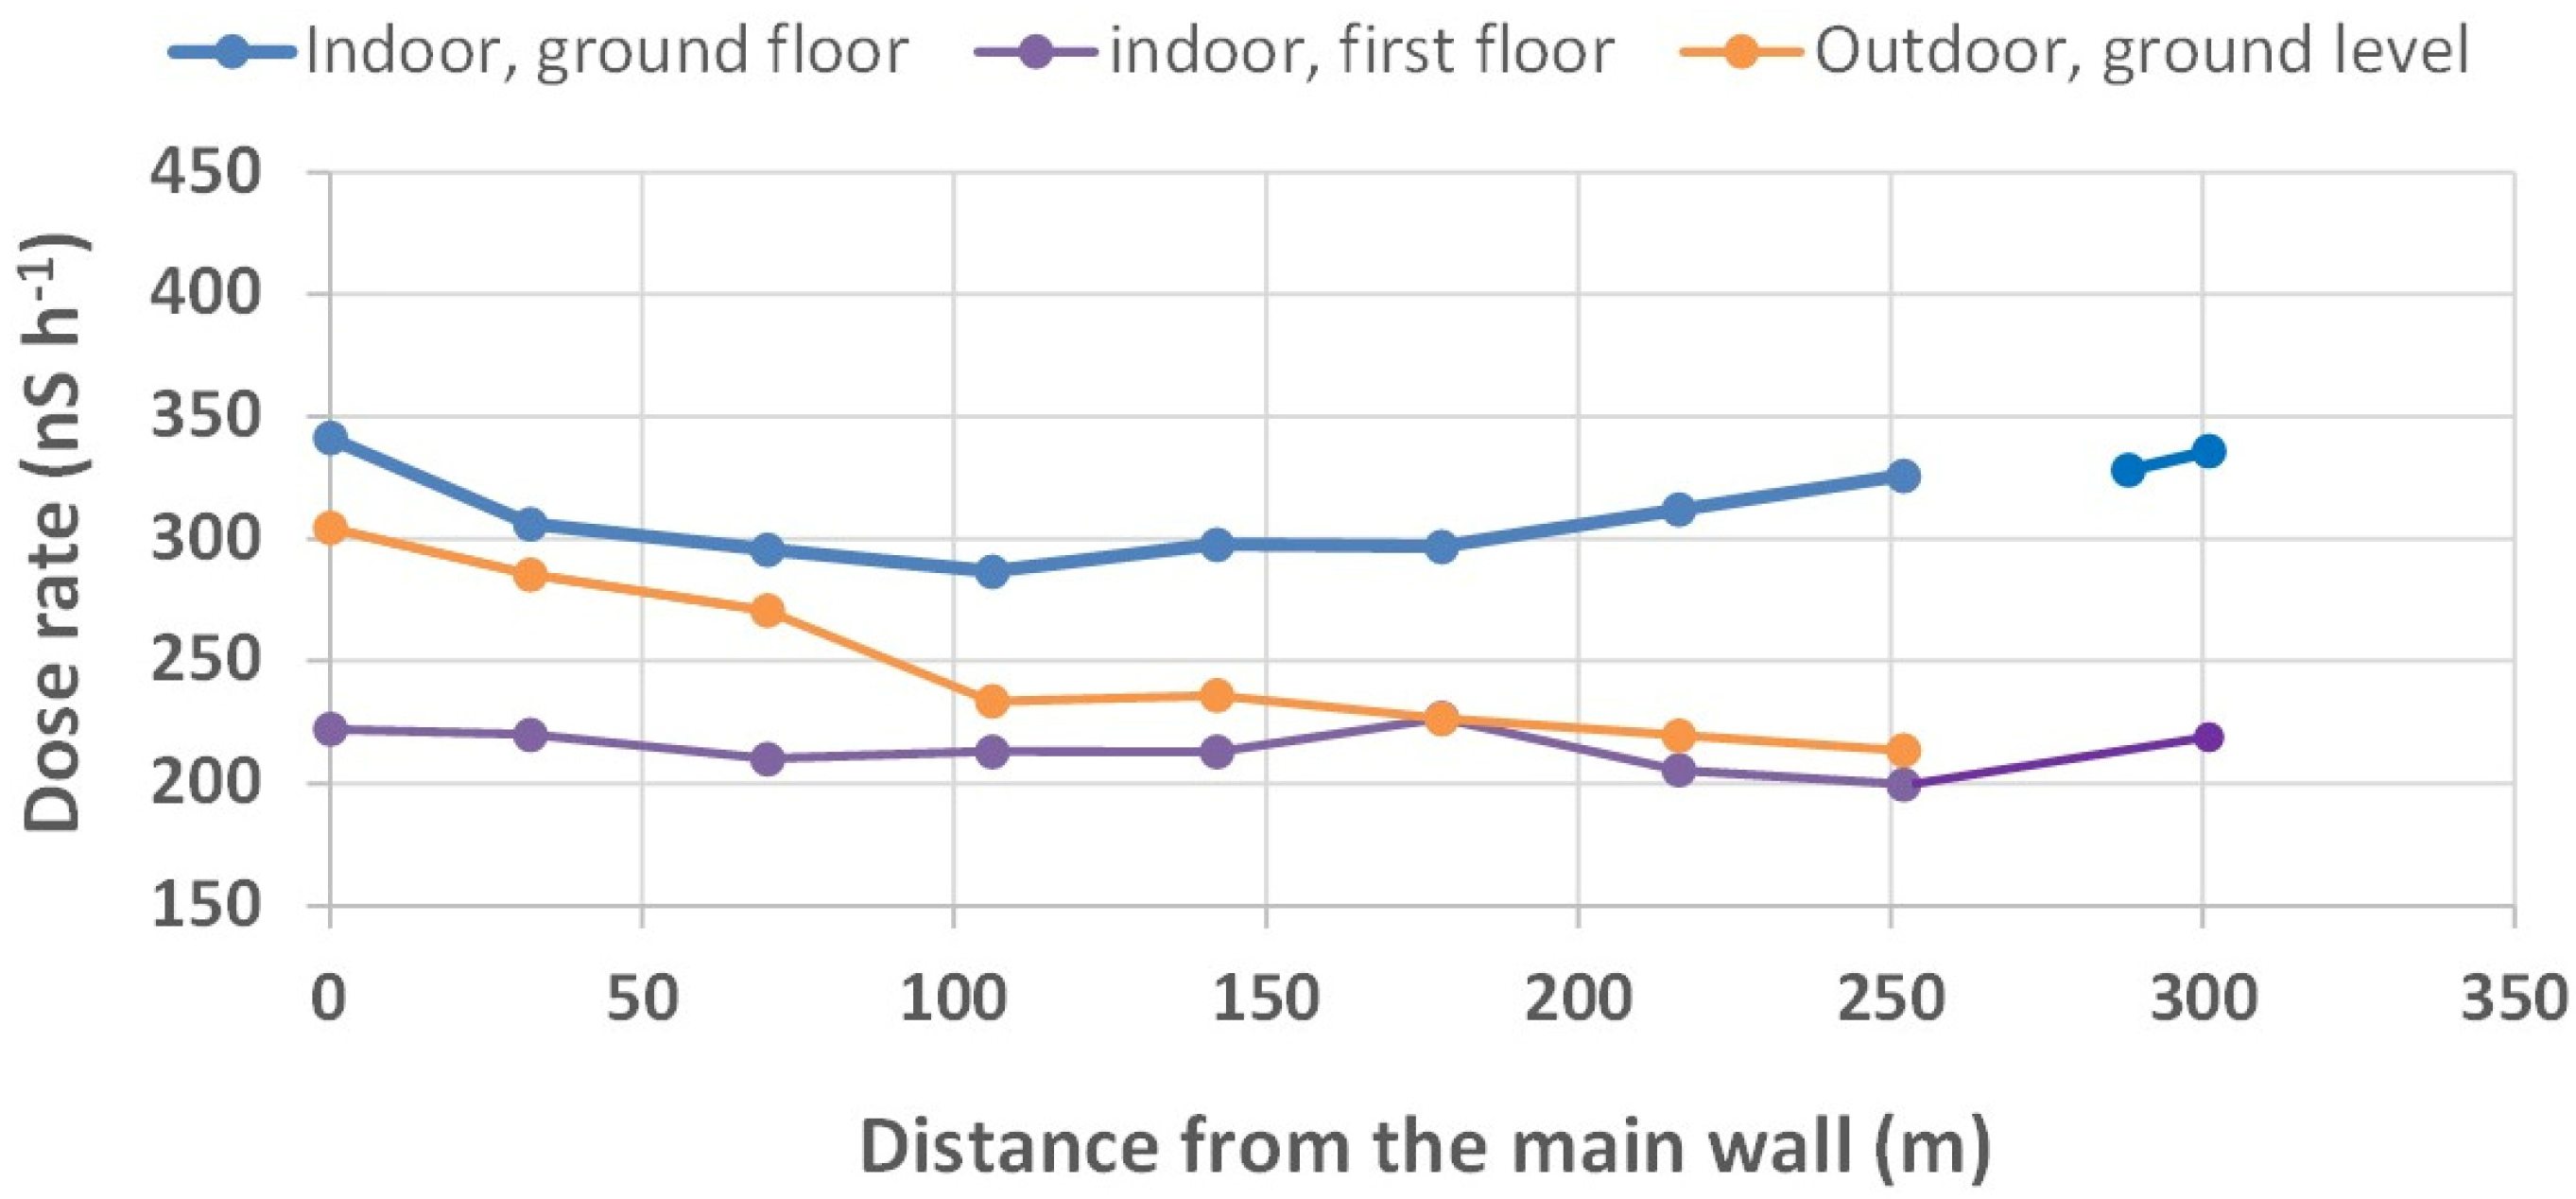
Dose rate profiles in rooms A and B and outdoors, just in front of room A, are reported in Figure 4. All profiles showed higher values in proximity of the building walls made of volcanic materials and a decreasing trend at higher distance from them. It should be emphasised that rooms A and B are 3 m wide and that the increasing trend of dose rates from 1.40 m onwards is due to presence of a second wall in front of the first. Since the building materials are enriched in radon precursors, 238U (173 ± 4 Bq kg−1) and 226Ra (165 ± 2 Bq kg−1), as well as in 232Th (293 ± 2 Bq kg−1) and 40K (1313 ± 20 Bq kg−1) [3], it is possible to correlate the dose rate with the contribution of building materials to indoor radon concentration.
Dose rate values are higher in room A located at the ground floor and lower in room B at the first floor confirming the prevailing influence of the bedrock for exposure to natural radiation and indirectly as a primary source of radon. The outer profile, just less intense than that of room A profile, confirms this finding.

5. Discussion

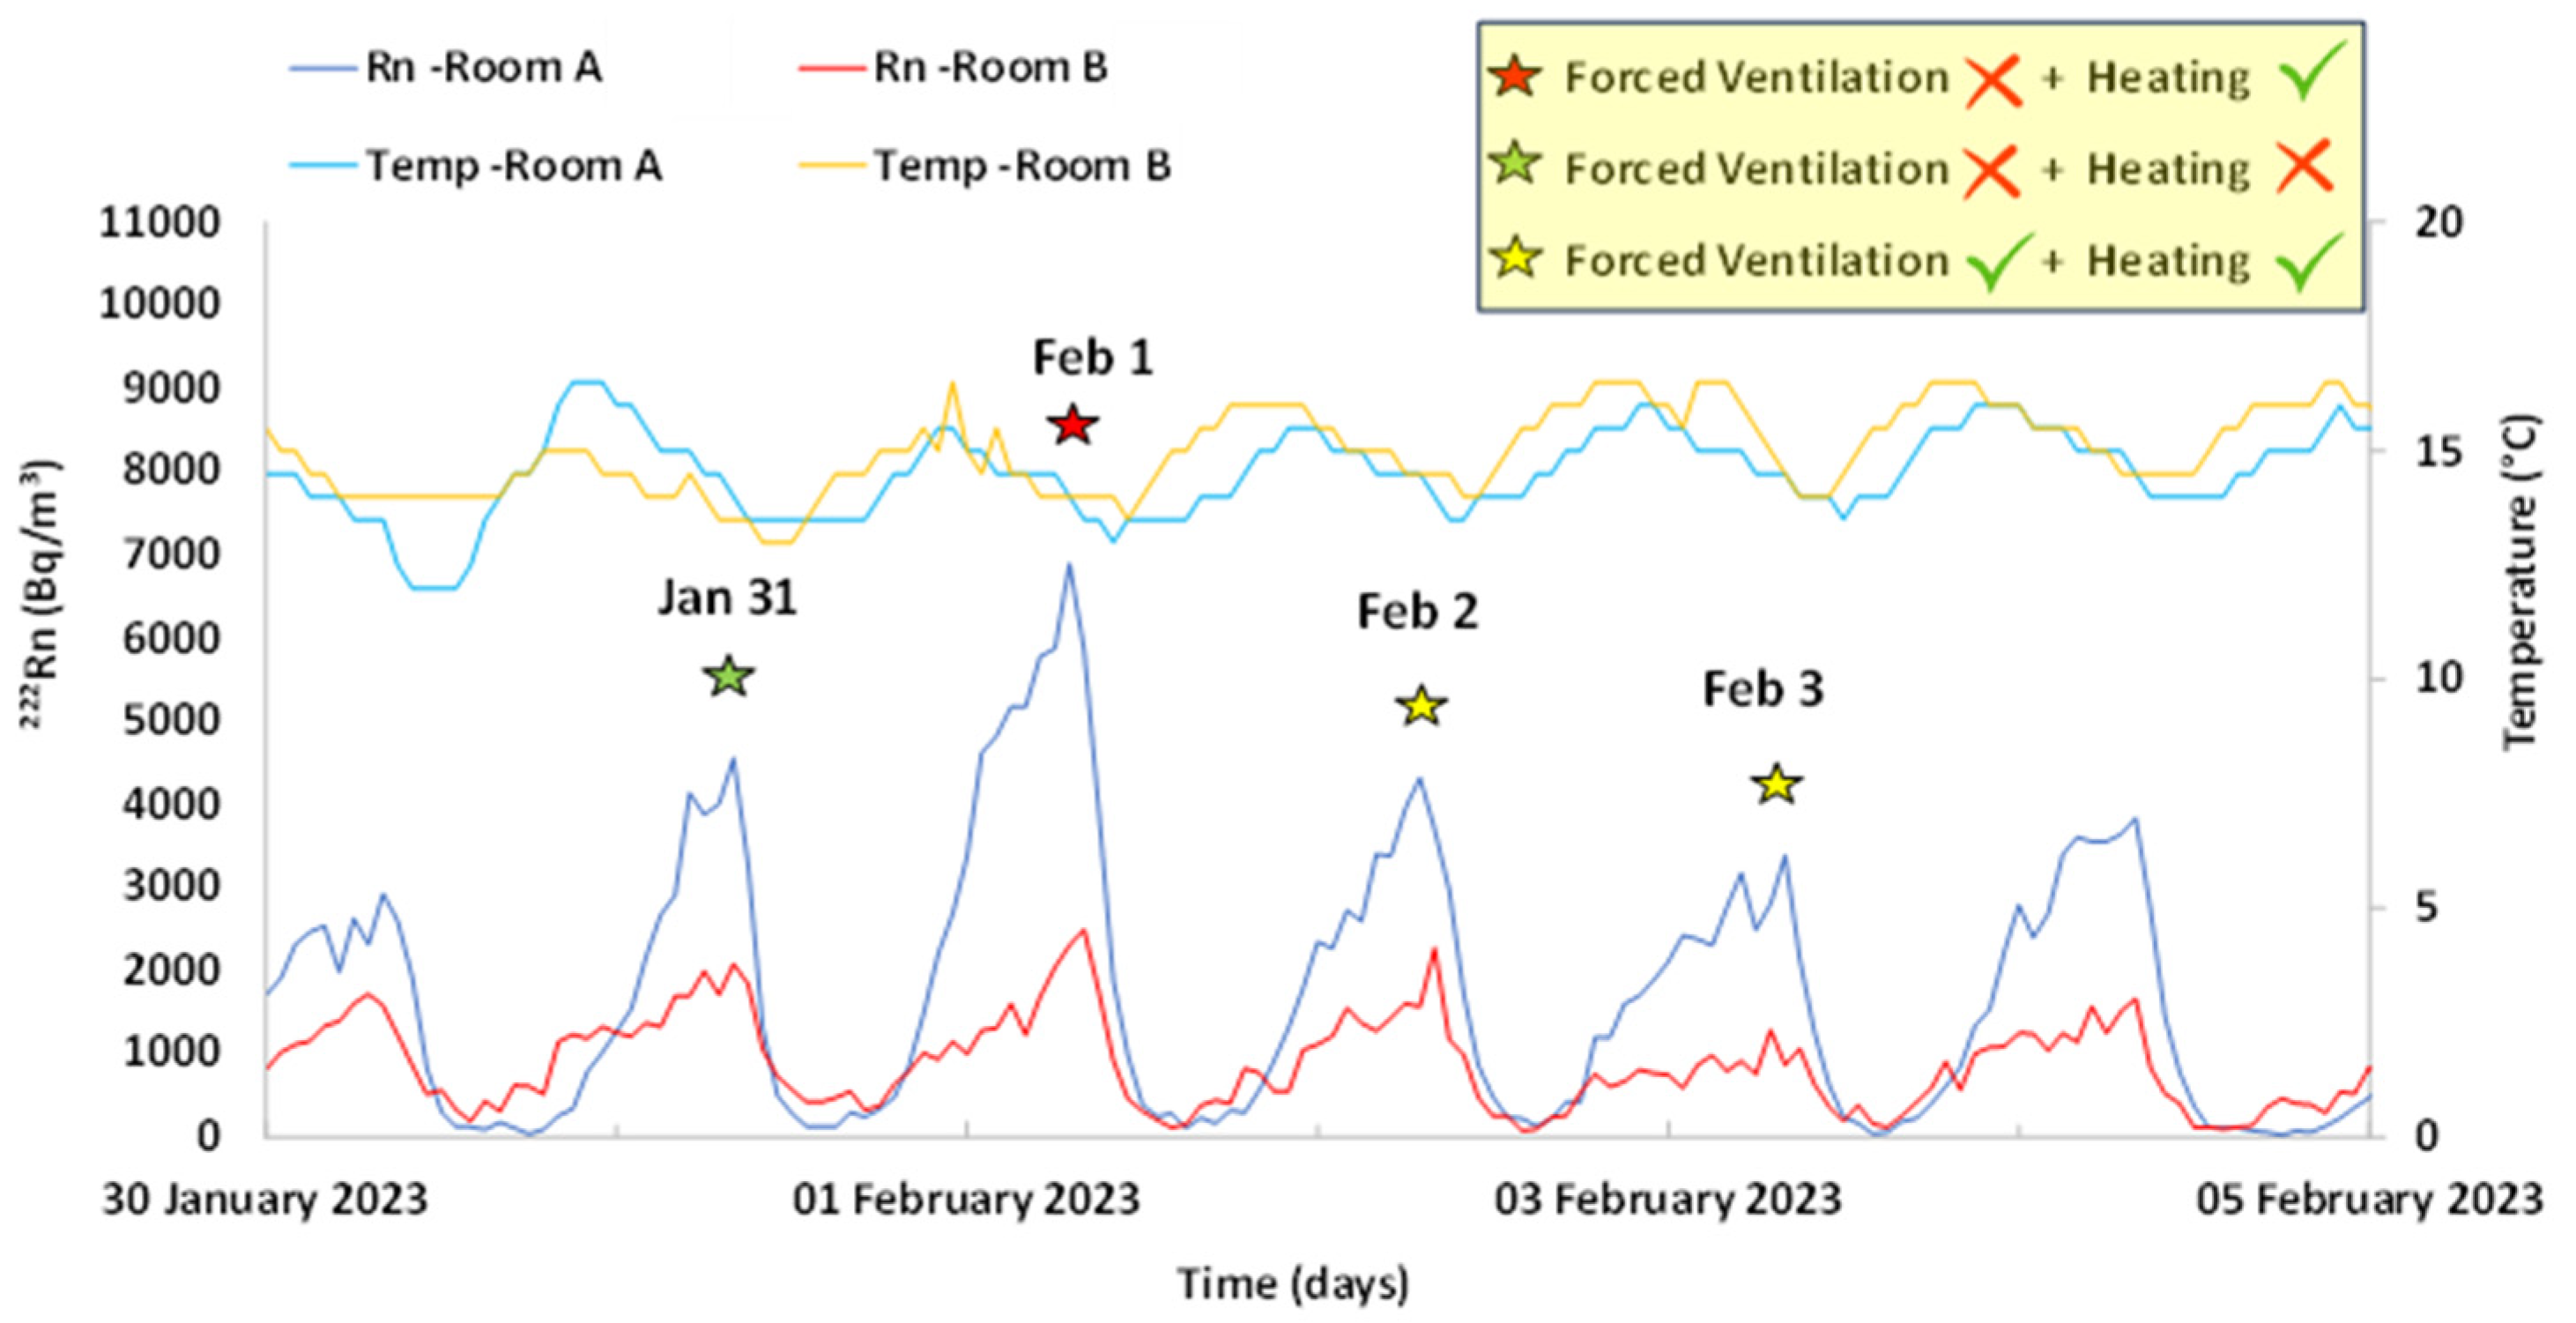
Strong daily fluctuations were recorded throughout the entire study period and were clearly linked to the opening and closing of the windows, respectively in the morning and in the afternoons [21,22,23,24,25], demonstrating that natural ventilation effectively and rapidly reduced radon levels. The heating system in the cold season, generally turned on in the afternoon and evening hours, further enhanced winter temperature and pressure gradients between the building and the outside, driving soil gas into the building and increasing radon highest daily values. When the forced ventilation below room A was turned on, radon highest levels were somewhat reduced [26,27].
The effect of heating and forced ventilation on radon peaks detected in room A in the early morning (before the opening of the windows) is demonstrated by data recorded from 31 January to 3 February 2023 (Figure 5).
On 1 February, radon reached its highest levels (6894 Bq m−3), with ventilation off and heating on, while the day before radon level was lower (4557 Bq m−3), due to a reduced indoor/outdoor thermal gradient produced by turning off the heating, ventilation being off. Finally, on 2 and 3 February, radon peaks reached lowest values, progressively decreasing down to 4318 and 3834 Bq m−3, with ventilation and heating on. From an overall view of the data, reductions in radon appear to be linked more to the effect of forced ventilation below room A than to a reduction of temperature gradients. A similar change in radon peaks was detected in room B on the same days, but with a smaller relative difference (Figure 5). This agrees with the primary effect of forced ventilation with respect to a thermal gradient of 5 degrees, since the latter is the same for both floors, but the effect of forced ventilation is weaker on the first floor.
No significant external temperature change and constant wind intensity characterise this period, making the above conclusions stronger.
Indoor radon activity concentration is particularly higher on the ground floor, partially semi-buried on one side. However, radon levels are also significant on the first floor, as evidenced for example by the average concentration of 976 ± 562 Bq m−3 in room A, compared to 585 ± 269 Bq m−3 in room B during the second survey period, before the application of the new window frames (Table 2 and Figure 2). This indicates that geological bedrock is the primary source of radon, but building materials also contribute [28]. These observations are confirmed by profiles of dose rate that increase toward the building walls either at the ground floor or the first floor, being 36% lower at the first floor. The average dose rates in room A (0.321 μSv h−1), room B (0.218 μSv h−1), and outdoors (0.249 μSv h−1) are compatible with values detected for other volcanic areas in the world [24,29,30,31].
Radon levels also depend on meteo-climatic factors, even if their role is frequently difficult to isolate from other drivers, such as the living habits of the residents, because of their simultaneous occurrence. If the average data over the seven survey periods are discussed rather than the daily records, it is possible to evaluate the general effect of indoor/outdoor thermal gradients on indoor radon, combined with the implementation of radon remediation. From the first to the second period, radon increased by 3.5 and 2.8 times in rooms A and B, respectively, due to reduced natural ventilation and indoor-outdoor thermal gradients increased by approximately 3 degrees. A progressive further growth in temperature gradients of 5 degrees and an additional room insulation linked to new window frames in room A, produced a supplementary 2.8 times radon rise from the second to the third survey phase. During the fourth and fifth periods, even if the thermal gradients increased again by one degree, radon was halved in room A thanks to the application of the waterproof product on the inner walls and in the radon entry points detected by thoron sniffing. Over the same time periods, radon levels decreased by only 10% in room B at the first floor, reinforcing the idea that waterproof products are very effective to reduce radon when applied on the walls made of high radon-emitting building materials. A similar result was documented in [32], where the application of a waterproof product with a radon permeability in the range of 10−12 m2 s−1 over the walls of a pilot room, built with a high radon-emitting material, reduced indoor radon of 70% and up to 80% with the combined action of a ventilation system.
The efficacy of the waterproof product to cut indoor radon was also evidenced by comparing thoron sniffing results on the wall separating rooms A and D (Figure 3); no thoron was detected in room A, away from any electrical sockets or the radiator pipe end points, while significant thoron levels (478 Bq m−3) were found exactly in the adjacent room D not treated with the product.
The ventilation of the bricks partition in the sixth and seventh survey periods, combined with a reduction of thermal gradients by 2 degrees, further halved average radon levels. This improvement is much more significant with northerly winds that pushed soil gas out of the cavity.
Consequently, it is advisable for the inhabitants of the house to apply a forced ventilation to the “accumulation chamber” to simulate N winds and cut radon levels down to the reference level established by recent legislation. This action will be presumably effective also for indoor radon at the first floor, even if no direct data are available to support this because the survey in room B was over at the end of the fifth period, before the ventilation of the space behind the wall of room A.
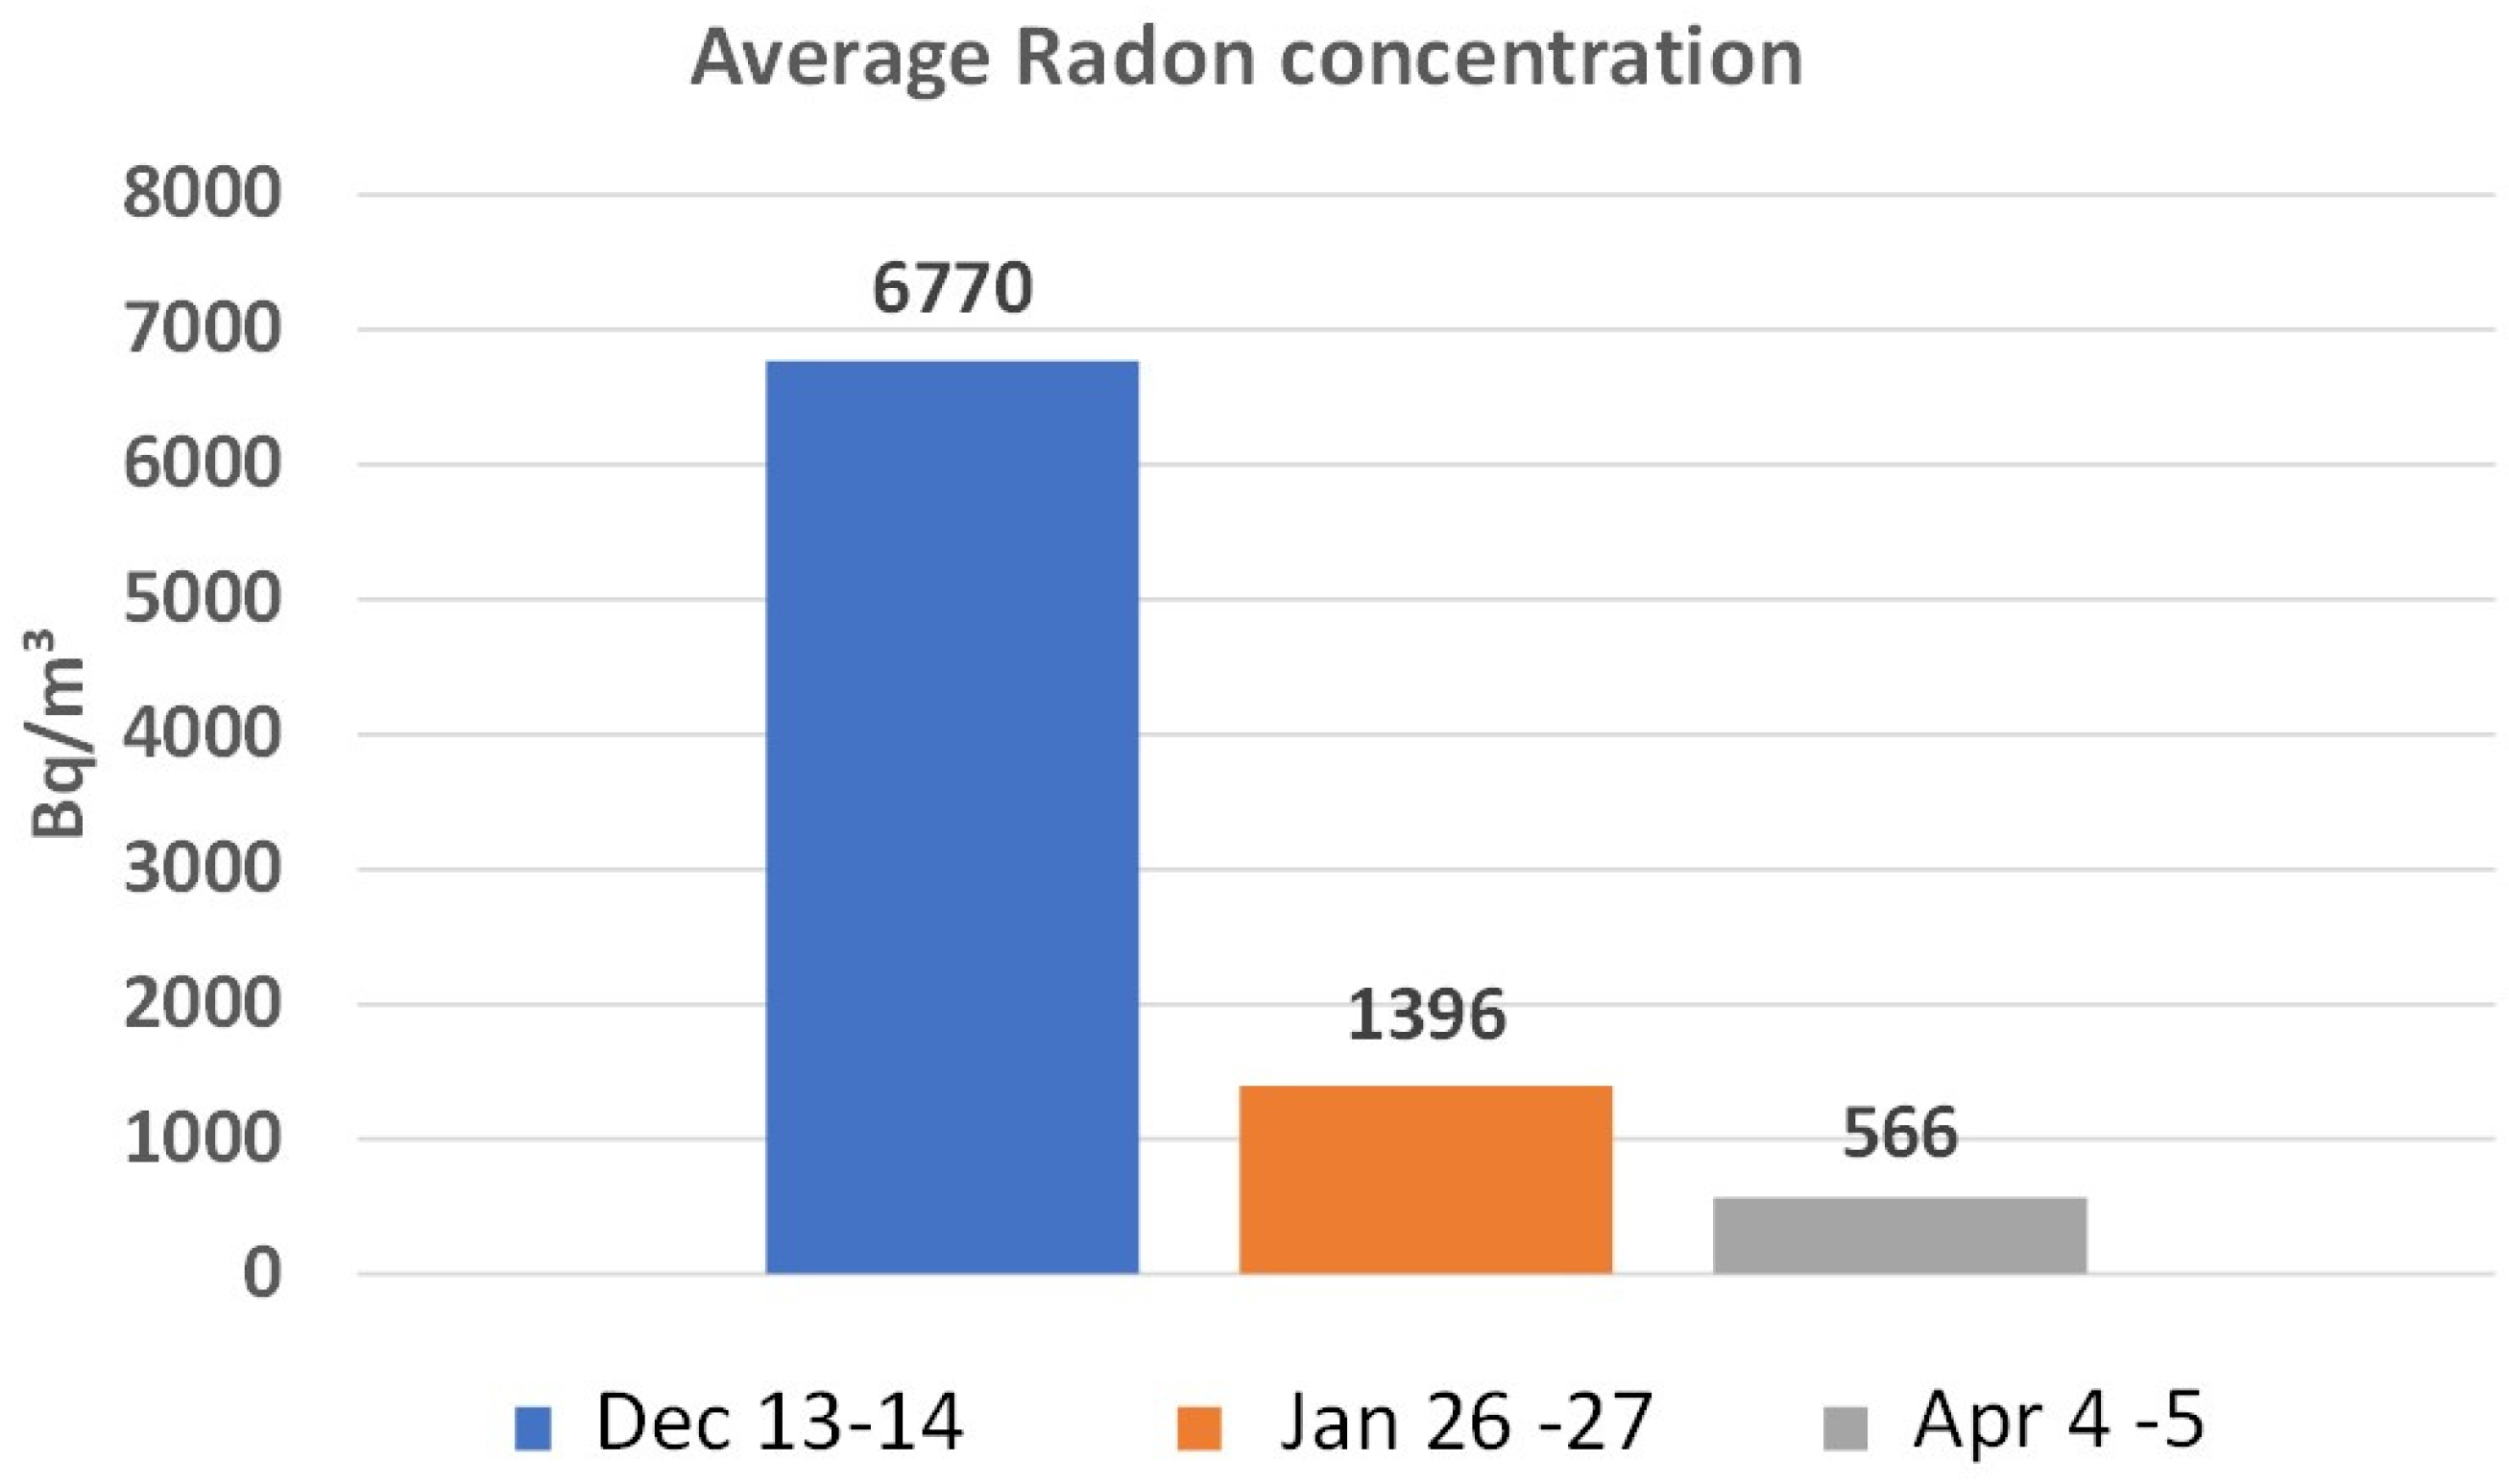
The combined effect of remediation actions (ventilation of the cavity and application of waterproof products) was furtherly strengthened by a comparison of radon data detected in room A from 4 to 5 April 2023 (566 Bq m−3) with two other periods (13–14 December 2022 and 26–27 January 2023) characterised by the same wind directions (from N and NE) and environmental condition (closed windows and ventilation off) (Figure 6), but no forced ventilation of the radon accumulation cavity. The first period was characterised by just a coat of the radon barrier on the walls, no detection and sealing of radon entry points, no holes on the outer walls (average radon was 6770 Bq m−3), while the second was distinguished by two coats of the product, the sealing of radon entry points and just two holes on the same side of room A external wall (average radon was 1396 Bq m−3) [27].
Finally, dose rate profiles can be used to assess the risk due to exposure of people to ionising radiation in radon priority areas. If the average (ambient) dose rate of 0.249 μSv h−1 is converted to outdoor annual ambient dose equivalent, using an outdoor occupancy factor of 0.2, we obtain a value of 0.44 mSv y−1 which is lower than the average value of 0.85 mSv y−1, calculated for Lazio [33], but about four times higher than the population-weighted world’s average of 0.106 mSv y−1 [34]. This scenario is compatible with a medium geogenic radon potential area) [3].

6. Conclusions

The conclusions can be summarised as follows:
  • Real cases are complex due to the simultaneous interplay of many factors affecting indoor radon. This makes it necessary to study single situation individually.
  • Radon sources need to be evaluated and appropriately treated. The geological bedrock has a prevailing effect over the building materials in this study case.
  • A silane terminated polymer applied on the walls of a pilot room made of a material with high emission of radon halved indoor concentration, even if soil radon is the primary source.
  • Suitable waterproof materials can be successfully tested as radon barriers using the model room approach, proposed in [6].
  • The natural ventilation by northerly winds or the forced ventilation of the partition space in room A is advisable to reduce indoor radon below reference levels.
  • Dose rate profiles help in defining the risk due to exposure of people to ionising radiation in a medium-geogenic radon potential area, as indicated in the recent European legislation.

Author Contributions

Conceptualisation, M.P., I.R., P.T., G.G. and M.S.; methodology, M.P., I.R., P.T. and G.G.; validation, M.P., I.R., P.T. and G.G.; investigation, M.P., I.R., P.T., G.G., M.S., C.L., D.V. and F.S.; resources, P.T., M.S., C.L. and D.V.; writing—original draft preparation, M.P., I.R., P.T. and G.G.; writing—review and editing, M.P., I.R., P.T., G.G., M.S., C.L., D.V. and G.C.; supervision, P.T., G.G. and M.S. All authors have read and agreed to the published version of the manuscript.

Funding

This research received no external funding.

Institutional Review Board Statement

Not applicable.

Informed Consent Statement

Not applicable.

Data Availability Statement

The original contributions presented in the study are included in the article, further inquiries can be directed to the corresponding author.

Acknowledgments

Authors wish to acknowledge Piero Bignotti, the owner of the study house, for allowing us to study and work there. MAPEI S.p.A. provided the waterproof product applied in the pilot room. We are also grateful to Roberto Pasquali, specialist in the Mapei S.p.A. Waterproofing Line, for precious assistance and advises.

Conflicts of Interest

Authors Cristina Longoni (C.L.) and Dino Vasquez (D.V.) are employees of the Mapei S.p.A. The remaining authors declare that the research was conducted in the absence of any commercial or financial relationships that could be construed as a potential conflict of interest.

Appendix A

The effect of water molecules on the electrostatic collection of 218Po ions onto the surface of the two AER PLUS detectors (neutralisation) was evaluated through simultaneous comparison with the INGV radon chamber equipped with a scintillation cell (ZnS), which is not affected by air humidity. The INGV radon chamber is a 56 L stainless steel box equipped with a scintillation cell (ZnS) coupled with a photomultiplier. A range of 1.5 to 14.5 g of H2O in a kg of dry air (Absolute Humidity, AH) was investigated to reproduce the environmental climatic conditions according to experimental configurations described in [18].
The radon activity concentration detected by the AER 1011674-B in room A with reference to that provided by the scintillation cell (R) was equal to:
R = −43.44442 × AH + 1.25963 for AH < 0.0088
R = −0.06003 × ln AH + 0.59066 for AH ≥ 0.0088
Radon activity concentration detected by the AER 1011715-B in room B with reference to the radon value provided by the scintillation cell (R) was equal to:
R = −40.52836 × AH + 1.15846 for AH < 0.0084
R = −0.11905 × ln AH + 0.24984 for AH ≥ 0.0084

References

  1. IARC (International Agency Research Cancer) Monographs. Radon and Its Decay Products; IARC: Lyon, France, 1988; p. 43. [Google Scholar]
  2. NCRP (National Council on Radiation Protection and Measurements). Ionizing Radiation Exposure of the Population of the United States; Report n. 160; NCRP: Bethesda, MA, USA, 2009. [Google Scholar]
  3. Giustini, F.; Ruggiero, L.; Sciarra, A.; Beaubien, S.E.; Graziani, S.; Galli, G.; Pizzino, L.; Tartarello, M.C.; Lucchetti, C.; Sirianni, P.; et al. Radon Hazard in Central Italy: Comparison among Areas with Different Geogenic Radon Potential. Int. J. Environ. Res. Public Health 2022, 19, 666. [Google Scholar] [CrossRef]
  4. Radulescu, I.; Calin, M.R.; Luca, A.; Röttger, A.; Grossi, C.; Done, V.L.; Ioan, M.R. Inter-comparison of commercial continuous radon monitors responses. Nucl. Inst. Meth Phys. Res. A 2022, 1021, 165927. [Google Scholar] [CrossRef]
  5. Lucchetti, C.; Galli, G.; Tuccimei, P. Indoor/outdoor air exchange affects indoor radon. The use of a scale model room to develop a mitigation strategy. Adv. Geosci. 2022, 57, 81–88. [Google Scholar] [CrossRef]
  6. Portaro, M.; Tuccimei, P.; Galli, G.; Soligo, M.; Longoni, C.; Vasquez, D. Testing the properties of radon barrier materials and home ventilation to reduce indoor radon accumulation. Atmosphere 2023, 14, 15. [Google Scholar] [CrossRef]
  7. Ciotoli, G.; Voltaggio, M.; Tuccimei, P.; Soligo, M.; Pasculli, A.; Beaubien, S.; Bigi, S. Geographically weighted regression and geostatistical techniques to construct the geogenic radon potential map of the Lazio region: A methodological proposal for the European Atlas of Natural Radiation. J. Environ. Radioact. 2017, 166, 355–375. [Google Scholar] [CrossRef] [PubMed]
  8. Neznal, M.; Neznal, M.; Matolin, M.; Barnet, I.; Miksova, J. The New Method for Assessing the Radon Risk of Building Sites, Czech Geol; Survey Special Papers; Czech Geological Survey: Prague, Czech Republic, 2004.
  9. DECRETO LEGISLATIVO (D.Lgs) n. 101/2020 31 Luglio 2020. Supplemento Ordinario alla “Gazzetta Ufficiale n. 201 del 12 Agosto 2020—Serie Generale. Available online: https://www.gazzettaufficiale.it (accessed on 10 July 2023).
  10. Long, S.; Fenton, D.; Cremin, M.; Morgan, A. The effectiveness of radon preventive and remedial measures in Irish homes. J. Radiol. Prot. 2013, 33, 141–149. [Google Scholar] [CrossRef]
  11. Jiranek, M. Sub-slab depressurisation systems used in the Czech Republic and verification of their efficiency. Radiat. Prot. Dosim. 2014, 162, 64–67. [Google Scholar] [CrossRef]
  12. Fuente, M.; Rábago, D.; Goggins, J.; Fuente, I.; Sainz, C.; Foley, M. Radon mitigation by soil depressurisation case study: Radon concentration and pressure field extension monitoring in a pilot house in Spain. Sci. Total Environ. 2019, 695, 133746. [Google Scholar] [CrossRef] [PubMed]
  13. Funiciello, R.; Parotto, M. Il substrato sedimentario nell’area dei Colli Albani: Considerazioni geodinamiche e paleogeografiche sul margine tirrenico dell’Appennino centrale. Geol. Rom. 1978, 17, 233–287. [Google Scholar]
  14. Faccenna, C.; Funiciello, R.; Mattei, M. Late Pleistocene N–S shear zone along Latium Thyrrenian margin: Structural characters and volcanological implications. Boll. Geofis. Teor. Appl. 1994, 36, 141–144. [Google Scholar]
  15. Barberi, F.; Buonasorte, G.; Cioni, R.; Fiordelisi, A.; Foresi, L.; Iaccarino, S.; Laurenzi, M.A.; Sbrana, A.; Vernia, A.; Villa, I.M. Plio–Pleistocene geological evolution of the geothermal area of Tuscany and Latium. Mem. Descr. Carta Geol. D’italia 1994, 49, 77–135. [Google Scholar]
  16. Peccerillo, A. Plio-Quaternary magmatism in Italy. Episodes 2003, 26, 222–226. [Google Scholar] [CrossRef] [PubMed]
  17. Nappi, G.; Renzulli, A.; Santi, P.; Gillot, P.Y. Geological evolution and geochronology of the Vulsini Volcanic District (Central Italy). Bull. Soc. Geol. Ital. 1995, 114, 599–613. [Google Scholar]
  18. Galli, G.; Cannelli, V.; Nardi, A.; Piersanti, A. Implementing soil radon detectors for long term continuous monitoring. Appl. Radiat. Isot. 2019, 153, 108813. [Google Scholar] [CrossRef] [PubMed]
  19. Integrated Agrometeorological Service of the Lazio Region. Available online: https://www.siarl-lazio.it/ (accessed on 1 October 2022).
  20. Jílek, K.; Hýža, M.; Kotík, L.; Thomas, J.; Tomášek, L. International intercomparison of measuring instruments for radon/thoron gas and radon short-lived daughter products in the NRPI Prague. Radiat. Prot. Dosim. 2014, 160, 154–159. [Google Scholar] [CrossRef] [PubMed]
  21. Schubert, M.; Musolff, A.; Weiss, H. Influences of meteorological parameters on indoor radon concentrations (222Rn) excluding the effects of forced ventilation and radon exhalation from soil and building materials. J. Environ. Radioact. 2018, 192, 81–85. [Google Scholar] [CrossRef] [PubMed]
  22. Sá, J.P.; Branco, P.T.B.S.; Alvim-Ferraz, M.C.M.; Martins, F.G.; Sousa, S.I. V Radon in Indoor Air: Towards Continuous Monitoring. Sustainability 2022, 14, 1529. [Google Scholar] [CrossRef]
  23. Taşköprü, C.; İçhedef, M.; Saç, M.M. Diurnal, monthly, and seasonal variations of indoor radon concentrations concerning meteorological parameters. Environ. Monit. Assess. 2022, 195, 25. [Google Scholar] [CrossRef]
  24. Bekelesi, W.C.; Darko, E.O.; Andam, A.B. Activity concentrations and dose assessment of 226Ra, 228Ra, 232Th, 40K, 222Rn and 220Rn in soil samples from Newmont-Akyem gold mine using gamma-ray spectrometry. Environ. Sci. Technol. 2017, 11, 237–247. [Google Scholar]
  25. Spasić, D.; Gulan, L. High Indoor Radon Case Study: Influence of Meteorological Parameters and Indication of Radon Prone Area. Atmosphere 2022, 13, 2120. [Google Scholar] [CrossRef]
  26. Xie, D.; Wu, Y.; Wang, C.; Yu, C.W.; Tian, L.; Wang, H. A study on the three-dimensional unsteady state of indoor radon diffusion under different ventilation conditions. Sustain. Cities Soc. 2021, 66, 102599. [Google Scholar] [CrossRef]
  27. Felicioni, L.; Jiránek, M.; Vlasatá, B.; Lupíšek, A. An Environmental Evaluation of Ventilation Systems Aimed at Reducing Indoor Radon Concentration. Buildings 2023, 13, 2706. [Google Scholar] [CrossRef]
  28. Sabbarese, C.; Ambrosino, F.; D’Onofrio, A. Development of radon transport model in different types of dwellings to assess indoor activity concentration. J. Environ. Radioact. 2021, 227, 106501. [Google Scholar] [CrossRef]
  29. Sahin, L.; Hafızoğlu, N.; Çetinkaya, H.; Manisa, K.; Bozkurt, E.; Biçer, A. Assessment of radiological hazard parameters due to natural radioactivity in soils from granite-rich regions in Kütahya Province, Turkey. Isot. Environ. Health Stud. 2017, 53, 212–221. [Google Scholar] [CrossRef] [PubMed]
  30. Sharma, S.; Kumar, A.; Mehra, R. Variation of ambient gamma dose rate and indoor radon/thoron concentration in different villages of Udhampur district, Jammu and Kashmir State, India. Radiat. Protect. Environ. 2017, 40, 133–141. [Google Scholar]
  31. Lucchetti, C.; Briganti, A.; Castelluccio, M.; Galli, G.; Santilli, S.; Soligo, M.; Tuccimei, P. Integrating radon and thoron flux data with gamma radiation mapping in radon-prone areas. The case of volcanic outcrops in a highly-urbanized city (Roma, Italy). J. Environ. Radioact. 2019, 202, 41–50. [Google Scholar] [CrossRef]
  32. Cosma, C.; Papp, B.; Cucos, A.; Sainz, C. Testing radon mitigation techniques in a pilot house from Baita-Stei radon prone area (Romania). J. Environ. Radioact. 2015, 140, 141–147. [Google Scholar] [CrossRef]
  33. Ruggiero, L.; Bigi, S.; Ciotoli, G.; Galli, G.; Giustini, F.; Lombardi, S.; Lucchetti, C.; Pizzino, L.; Sciarra, A.; Sirianni, P.; et al. Relationships between geogenic radon potential and gamma ray maps with indoor radon levels at Caprarola municipality (central Italy). In Extended Abstract at 14th GARMM; European Radon Association: Prague, Czech Republic, 2018. [Google Scholar]
  34. UNSCEAR (United Nations Scientific Committee on the Effects of Atomic Radiation). Report to the General Assembly, Annex B: Exposures from Natural Radiation Sources; UNSCEAR: New York, NY, USA, 2000. [Google Scholar]
Figure 1. Map of the study house in Celleno (central Italy). T-F in room C stands for a thermo-fireplace.
Atmosphere 15 00425 g001
Figure 2. Average radon data in rooms A and B during seven segments of the survey period from 12 October 2022 to 13 April 2023. See Table 2.
Atmosphere 15 00425 g002
Figure 3. Locations of radon entry points detected by thoron (220Rn) sniffing. It is noting that the four walls of room A, the electrical outlets, and the end points of the radiator pipes on the wall were treated with Aquaflex S1K.
Atmosphere 15 00425 g003
Figure 4. Dose profiles in rooms A and B and outdoors.
Atmosphere 15 00425 g004
Figure 5. Effect of heating and ventilation on early morning radon peaks from 31 January to 3 February 2023.
Atmosphere 15 00425 g005
Figure 6. Combined effect of remediation actions on indoor radon in room A in three selected time periods.
Atmosphere 15 00425 g006
Table 1. Monitoring and mitigation activities in the study house at Celleno (central Italy).
ActivityDate
Beginning of radon monitoring
in rooms A and B
12 October 2022
Replacement of new window frames in room A
to improve thermal insulation
From 30 November
to 2 December 2022
Application of Aquaflex S1K
on the inner walls of room A
From 8 December to 10 December 2022
Identification and sealing
of radon entry points in room A
From mid-December 2022
to mid-January 2023
Drilling two holes in the NW external wall behind the cavity created by the bricks partition of room A15 January 2023
End of radon monitoring in room B20 February 2023
Drilling a third hole on the NE external wall
behind the cavity of room A
2 March 2023
End of radon monitoring in room A13 April 2023
Table 2. Average radon data and relative standard deviations measured in rooms A and B (see Figure 1) from 12 October 2022 to 13 April 2023.
SegmentPeriodRoom A Room B
Average 222RnStand. Dev.Average 222RnStand. Dev.
Bq m−3Bq m−3Bq m−3Bq m−3
112 October–11 November 28620216784
212 November–30 November976562585269
31 December–16 December 27761768970202
417 December–15 January 14751092807120
516 January–19 February 15721013851239
620 February–3 March 833422--
74 March–13 April 670442--
Stand. Dev. stands for standard deviation.
Disclaimer/Publisher’s Note: The statements, opinions and data contained in all publications are solely those of the individual author(s) and contributor(s) and not of MDPI and/or the editor(s). MDPI and/or the editor(s) disclaim responsibility for any injury to people or property resulting from any ideas, methods, instructions or products referred to in the content.