Article

Particulate Matter Emissions at Different Microenvironments Using Low-Cost Sensors in Megacity Dhaka, Bangladesh

1
Department of Chemistry, Faculty of Science, University of Dhaka, Dhaka 1000, Bangladesh
2
Department of Chemistry, Faculty of Science, Bangladesh University of Engineering and Technology, Dhaka 1000, Bangladesh
*
Authors to whom correspondence should be addressed.
Atmosphere 2024, 15(8), 897; https://doi.org/10.3390/atmos15080897
Submission received: 30 April 2024 / Revised: 16 July 2024 / Accepted: 25 July 2024 / Published: 26 July 2024

Abstract

:
The global challenge of air pollution’s adverse health effects, particularly highlighted in Dhaka, Bangladesh, underscores the significant impact of particulate matter (PM) exposure. This study aims to assess the current sources of PM2.5 emissions in different microenvironments around Dhaka and explore potential risk factors to assess individual 24 h exposure to PM2.5. A commercially available low-cost sensor was utilized for collecting data for 15 days under various environmental conditions. The average concentrations for PM1.0, PM2.5, and PM10 were 37.05 ± 24.36 µg/m3, 57.22 ± 40.75 µg/m3, and 69.22 ± 48.46 µg/m3, respectively. The highest PM2.5 concentrations were found (78.87 ± 53.69 μg/m3) in restaurants and residences (62.35 ± 41.70 μg/m3), while air-conditioned shopping malls exhibited the lowest concentrations (20.08 ± 15.57 μg/m3). Driving with windows closed and utilizing air conditioning resulted in a 33–52% reduction in PM2.5 concentrations inside the car. The Hazard Quotient (HQ) for PM2.5 varied by location, with a low level observed in the air-conditioned locations and a moderate level observed in restaurants and non-air-conditioned shopping malls. The significance of this study lies in its potential to inform public health strategies and urban planning initiatives aimed at reducing air pollution exposure in highly populated cities like Dhaka.

1. Introduction

The biggest concern about air pollution nowadays is its effect on human health. Among all air pollutants, PM2.5 (particles with an aerodynamic diameter < 2.5 µm) is currently considered one of the most severe air contaminants. It has been extensively documented in numerous studies that PM2.5 penetrates deeply into the lung alveoli and, in certain cases, can even enter the blood [1,2,3]. It is a complex blend of chemical components from a variety of sources that have different toxicities [4]. Though PM2.5 emissions are caused by natural sources (e.g., volcanic dust or desert dust particles and marine spray aerosols), they can also arise from human activities. Apart from ambient particulate matter, data indicate that indoor sources (e.g., cooking, cleaning, exposure to cigarettes, etc.) and sources associated with personal activities have a significant impact on total personal exposure to PM2.5 [5]. According to the World Health Organization (WHO), 87% of the world’s population lived in communities where the average concentration of PM2.5 in ambient air exceeded the WHO air quality recommendation of no more than 5 µg/m3 (annual exposure) in 2013 [6]. Additionally, outdoor air pollution has recently been designated as a key global carcinogen by the WHO’s International Agency for Research on Cancer (IARC) [7]. Exposure to air pollution from traffic has been linked to a variety of health problems. Personal exposure to traffic-related contaminants varied from person to person [8]. In late pregnancy, the exposure of mothers to high levels of traffic-related air pollution was linked to high systolic blood pressure, according to prospective cohort research conducted in Cincinnati [9]. Zwack et al. [10] examined the contribution of local traffic to PM concentrations in Manhattan street canyons by using GPS receivers to track the volunteers’ movements continuously following the designated walking routes at specific times. According to a survey carried out by USA Today [11], local sources of pollution, such as point and mobile source emissions, have an impact on the exposure of numerous school children in the United States. At the same time, several studies have shown the risk of air pollution by particles through the reduction in the cognitive and neurological functions of students and, hence, their academic performance [12,13]. The findings demonstrated that the source-specific PM2.5 mixture contributes to high personal exposure [14,15]. Furthermore, these studies highlighted that the source identification and distribution of personal exposure to PM2.5 is worthy of further consideration.
Air contaminants are pervasive; whether an individual is indoors or outdoors, some degree of exposure is unavoidable [16]. The precise quantification of daily human exposure to pollutants is needed to assess the risk and effects of air pollution. Due to the intricate links that exist between humans and their environments, contextual elements such as environmental, socio-economic, and behavioral factors must be considered in exposure assessments [17]. People move continuously through time and places, whereas the atmospheric pollution of the landscape changes both geographically and temporally. Traditional methods, which rely on fixed-site monitoring (FSM) networks and residential locations to estimate population-level exposure, are vastly different [16]. New approaches are now being developed to improve the geographical and temporal resolution of PM data [18]. Currently, a variety of commercial sensors can be used to monitor pollution at a reasonable cost, and their use is increasingly prevalent around the world [19,20]. Low-cost sensor technologies for air pollutant monitoring, such as PM2.5, have advanced rapidly over the past few years [21,22], resulting in the collection of high-temporal resolution data. They are also simple to use and, in many cases, are ready to connect to microcomputers. However, low-cost sensors, on the other hand, can suffer from significant biases and may be incompatible with reference systems in some situations [23,24]. A literature review by Morawska et al. [25] found that low-cost sensors work well in the lab with a high degree of linearity but experience considerable degradation when used in natural environments. Despite the widespread use of low-cost sensors by citizen scientists around the world to assess air quality for a variety of purposes [25,26,27], there are two key issues. One is that low-cost sensors’ reactions to target pollutants are often less sensitive, specific, and steady than compliance controllers that use the Federal Reference or Equivalents Methods (FRMs/FEMs) [28]. Another is that the users of these sensors are frequently enthusiastic but lack technical expertise in quality assurance and control (QA/QC), exposing them to the risk of the incorrect use of the sensors and/or misinterpretation of the daily data they collect. To achieve similar results across the sensors and compliance monitors, site-specific and time-specific calibration factors must be used. The pretesting/calibration of low-cost sensors under the conditions of planned use is often advised [29].
Numerous early studies relied on data from location-specific air pollution monitoring systems, which often did not consider individual exposure to contaminants. Accurately examining the effects of PM2.5 on individuals may necessitate the measurement of PM2.5 exposure within microenvironments (MEs) [30]. To date, there is a lack of research on the sources of PM in various ME within Dhaka city and their potential impact on human health. This paper is organized as follows: Section 2 outlines the sampling area, instrumentation, and health risk assessment methodology. In Section 3, Section 3.1, Section 3.2 and Section 3.3 discuss the variations in particulate matter (PM1.0, PM2.5, and PM10), while Section 3.4 and Section 3.5 focus on the variation of PM2.5 across various microenvironments and the associated health risk assessment. The primary focus is on PM2.5 due to its prevalence in the area and its greater harm to human health compared to PM10. Currently, there are no guideline values for PM1.0, preventing a health risk assessment for this particulate size. This study aims to achieve two specific goals: (1) develop methods and concepts to track the movement of individuals and their daily exposure to PM2.5 in different MEs, and (2) identify risk factors for PM2.5 exposure among residents of Dhaka city. The findings of this study will provide valuable information to epidemiologists, helping them to devise strategies to reduce particulate pollution in the capital of Bangladesh.

2. Materials and Methods

2.1. Study Area and Description of the Sampling Sites

This study was conducted in the capital city of Bangladesh, Dhaka. The current population of Bangladesh is 174.29 million people, which equates to 2.15% of the total global population in 2024 [31]. Among them, the current metro area population in Dhaka, Bangladesh, is 23.94 million, a 3.13% increase from 2023 [32]. Moreover, the public transport system in Dhaka consists of private cars, motorcycles, bicycles, buses, trains, and other small vehicles. Given the primary aim of this study is to underscore exposure monitoring across various MEs, the designated sampling routes were specifically tailored to areas where individuals are most likely to move throughout the observation period (Figure S1 in the Supplemental Materials). The sampling sites chosen to monitor exposure in several MEs are summarized in Table 1. Investigations were conducted to determine various factors related to the building’s location, such as the type of establishment (residence, restaurants, etc.), the activities taking place there, the number of residents, the proximity to traffic, and the level of ventilation. Furthermore, we investigated the variation in PM2.5 concentrations in marketplaces equipped with air conditioning (AC) against those without AC availability, aiming to evaluate the potential influence of AC accessibility on individuals’ PM2.5 exposure.

2.2. Instrumentation

AS-LUNG (Academia Sinica, Taipei, Taiwan) sampler was used to simultaneously monitor the PM (PM1.0, PM2.5, and PM10) concentrations at each site on each sampling day. The portable version of AS-LUNG (AS-LUNG-P), a well-known PM2.5 personal sampler has been employed in numerous prior studies [33,34]. AS-LUNG-P comprises a PMS3003 sensor (Plantower Co., Ltd., Beijing, China) for measuring PM2.5 concentrations via the light-scattering principle. The device includes a GPS sensor, CO2 sensor, PM sensor, a time module, and a temperature/RH sensor. The cost-effectiveness of AS-LUNG sensors allows for widespread use without compromising the budget, especially in resource-limited settings. This type of sensor is widely used in various parts of the world due to its affordability.
The monitoring took place over 15 days (September–October 2021), with continuous sampling for 24 h each day. A time activity diary (TAD) was maintained to record personal data and spatial and temporal descriptions. The TAD included details such as accommodation information, living conditions, and notable roadside activities like garbage incineration or emissions from mills and industries. The GPS application STRAVA was used to mark the sampling locations. Sampling was conducted in various locations within the house, including the kitchen, living room, and rooftop, to better understand how individuals are exposed to PM in their own living spaces. Additionally, sampling was performed in a busy restaurant to explore exposure during dining out, as well as in vehicles such as cars, public buses, and rickshaws, and in different shopping malls and grocery supermarkets to investigate exposure during transportation.

2.3. Health Risk Assessment

The following three equations were used to characterize the risks posed by exposure to PM [35,36]:
Field   Average   Daily   Dose   ( FADD ) = C × I R × E D × E F B W × A T
where FADD (µg/kg/day) is the dose that the population of each location may be exposed to when inhaling PM concentrations measured, C (µg/m3) is the average value of PM concentration in the atmosphere, IR (m3/day) is the amount of contaminated air inhaled per unit time or event, EF is the exposure frequency, ED is the exposure duration expressed in years, BW is the average body weight in kg, and AT is the period over which the exposure is averaged.
Safe   Average   Daily   Dose   ( SADD ) = C × I R × E D × E F B W × A T
SADD (µg/kg/day) is the dose that the population of each location may be exposed to without suffering negative health risks.
Hazard   Quotient   ( HQ ) = F A D D S A D D
[HQ < 0.1, no hazard; HQ = 0.1–1.0, low hazard; HQ = 1.1–10, moderate hazard; HQ > 10, high hazard].

3. Results

3.1. Temporal Variation of Particulate Matter Concentrations

Figure 1 illustrates the continuous fluctuations of PM1.0, PM2.5, and PM10 concentrations observed on both day 1 and day 2 of the study. On the first day, a significant spike in total particulate matter was recorded at 08:53., coinciding with cooking activities in the kitchen. The release of gases from the stove and oven, along with dishwashing, contributed to a substantial increase in PM concentration, peaking at 145 µg/m3. Subsequently, when the subject was inside a car with the air conditioning on and windows closed, the PM levels sharply declined around 12:53 This decrease persisted until the subject exited the car, resulting in a gradual rise in PM concentration from 67 to 183 µg/m3, especially near Notun Bazar, Badda, where elevated road dust levels were observed. At approximately 18:25, significant peaks were recorded, correlating with the subject’s proximity to a large construction yard in Beraid, Badda. After re-entering the car with the air conditioning on at 21:20, PM concentrations decreased once again. Finally, a peak at 22:25 was attributed to faint cooking smoke from the kitchen and the use of an air freshener in the bedroom.
On the second day, a distinct peak occurred at 9:51, with PM10 levels reaching 268 µg/m3. This spike coincided with the subject’s proximity to an open market crowded with people purchasing morning commodities, leading to elevated particulate matter levels. Another significant peak in PM10 was recorded at 11:20, attributed to heavy traffic exhaust and roadway dust.
During the afternoon, there was a substantial decrease in the PM levels as the subject moved to the rooftop of a multi-storied apartment. However, the PM concentrations sharply increased again around 21:30, correlating with cooking activities and aerosol spraying in the living room.

3.2. Daily Variation of PM Concentrations

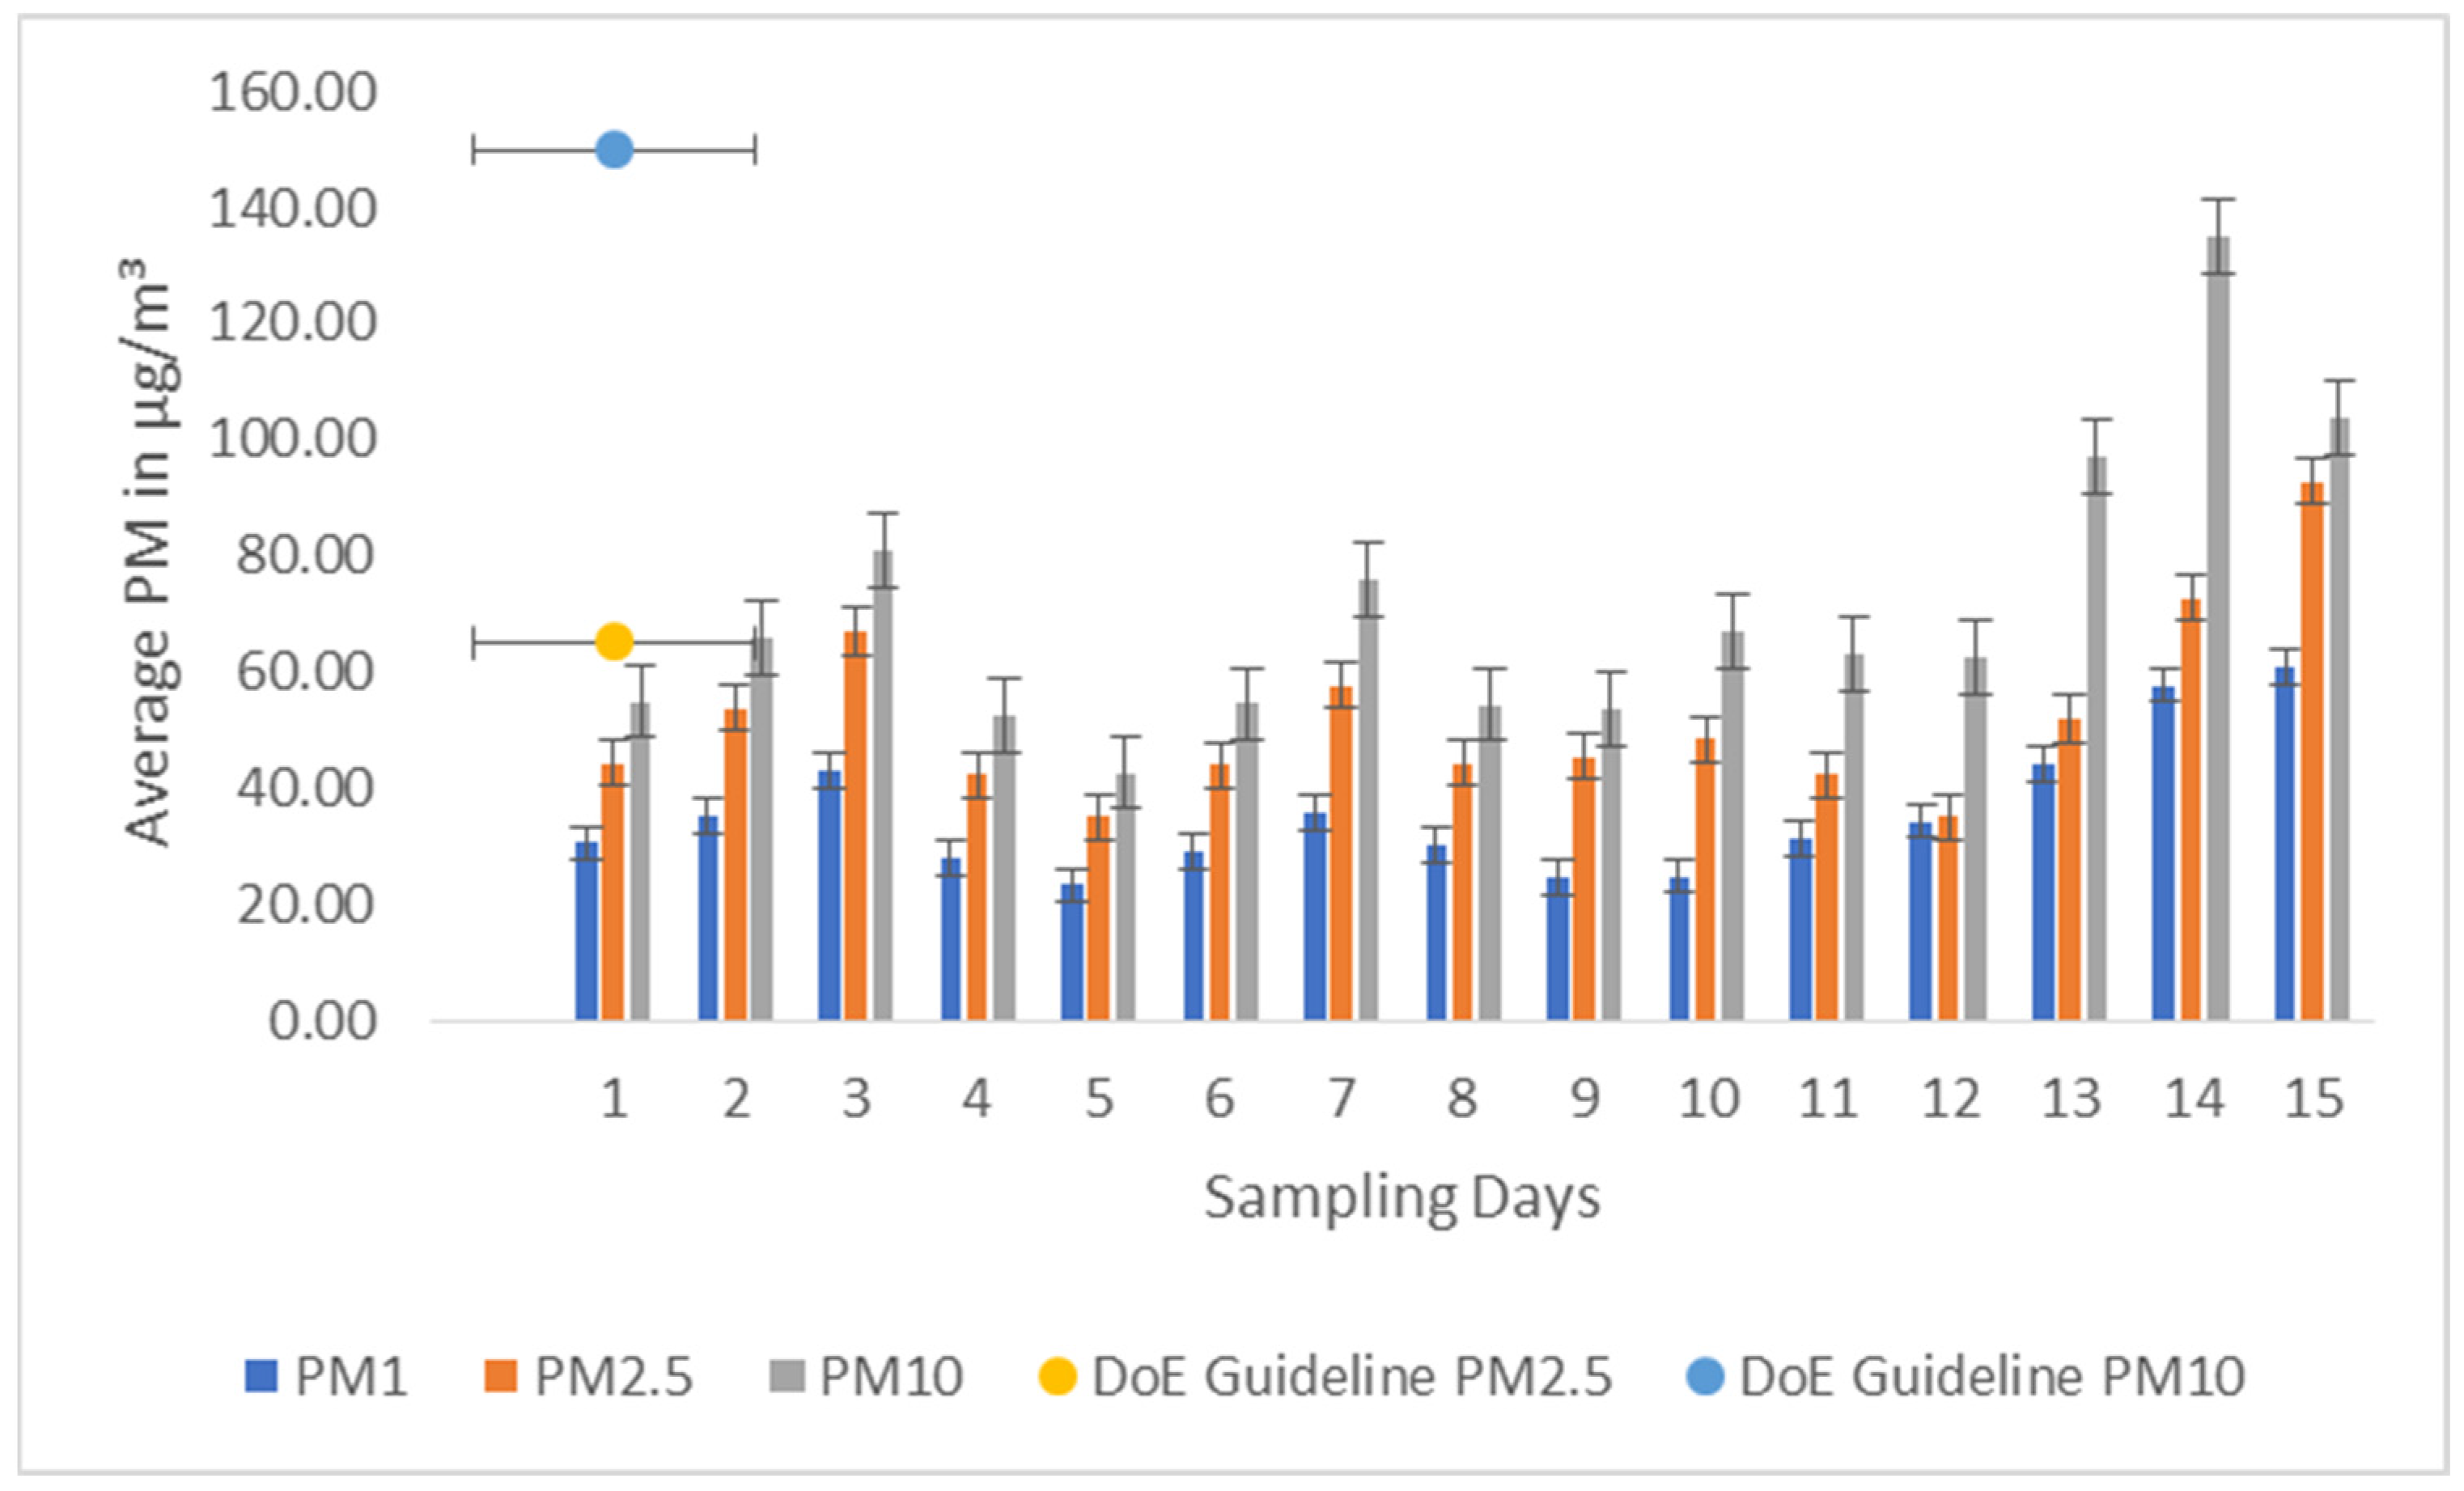
Figure S2 shows the time series and daily average PM concentrations over 15 sampling days with varying ambient concentrations. The average and standard deviation for PM concentrations were calculated from the total daily sample sizes. The mean 24 h average concentration of PM10 varied from 42.68 to 134.81 µg/m3, while for PM2.5, concentration varied from 35.04 to 92.76 µg/m3. The PM1.0 concentration fluctuated from 23.23 to 72.64 µg/m3. The guideline values of PM10 and PM2.5 for 24 h average concentrations of DoE, in Bangladesh, are 150 µg/m3 and 65 µg/m3, respectively, so the daily exposed PM2.5 concentrations exceeded the guideline limit, but the PM10 concentration was within the guideline value (Figure 2). Throughout the sampling period, approximately 75% of the 24 h average concentrations of both PM2.5 and PM10 adhered to the guidelines established by DoE, Bangladesh. The closure of all educational institutions amid the COVID-19 outbreak led to a decrease in road traffic compared to typical conditions. Additionally, frequent rains during the post-monsoon season likely contributed to lower particle exposure.
PM10 was highest on day 14 with a value of 134.81 µg/m3 and lowest on day 5 with a value of 42.68 µg/m3. A similar pattern was seen for both PM2.5 and PM1.0, i.e., the highest values on day 15 (92.76 µg/m3 and 60.90 µg/m3) and the lowest on day 5 (23.23 µg/m3 and 35.04 µg/m3). The higher value of PM2.5 on day 15 was possibly due to roadway dust, traffic exhaust emissions, and cooking smoke in the kitchen. The higher values for PM1.0 were probably for intense mosquito and cooking smoke and also for air freshener. The lowest on day 5 was because of the rainfall during the daytime. Another reason could be because of the subject’s commuting in the car while the AC was turned on and also the subject was in an air-conditioned restaurant and shopping mall. The average PM concentration calculated for the period showed that the PM10 level (42%) was higher than PM1.0 (23%) and PM2.5 (35%). This observation may be attributed to ongoing infrastructure projects, such as metro rail construction, and the development of high-rise buildings, which are recognized as common sources of PM10. The average concentrations for PM1.0, PM2.5, and PM10 were 37.05 ± 24.36 µg/m3, 57.22 ± 40.75 µg/m3, and 69.22 ± 48.46 µg/m3, respectively.

3.3. Day–Night Comparison of Particulate Matter Concentrations

Figure 3 shows the comparison between the PM concentration in day and nighttime. The mean PM1.0 concentration during daytime varies from 21.50 ± 11.07 to 57.17 ± 11.07 µg/m3. On the other hand, the nighttime PM1.0 varies from 23.37 ± 20.53 to 81.44 ± 20.53 µg/m3. For most of the days, it is clearly seen that the PM1.0 concentration at night is higher than in the day. Especially on days 13–15, it was almost double. In the case of PM2.5, there is no drastic change between day and night as the daytime PM2.5 mean concentration varies from 31.63 ± 17.44 to 87.67 ± 17.44 µg/m3, and the nighttime varies from 33.16 ± 33.38 to 132.07 ± 33.38 µg/m3. On days 4–5 and 9–10, the PM2.5 concentration was remarkably similar. Similarly, PM10 in daytime varies from 39.34 ± 19.85 to 98.43 ± 19.85 µg/m3 and 39.62 ± 37.08 to 153 ± 37.08 µg/m3 in nighttime. Being the coarse particle, the mean concentration of PM10 is always larger than PM1.0 and PM2.5. Overall, the nighttime exposure exceeded the daytime exposure by approximately 65 percent. A significant factor contributing to this heightened PM2.5 exposure during nighttime hours is the operation of heavy transport vehicles, which emit exhaust gases.

3.4. Variation of PM2.5 Concentration in Different Microenvironments

Figure 4 illustrates the variations in the PM2.5 concentrations across different microenvironments. The highest recorded PM2.5 concentration, at 78.87 ± 53.69 µg/m3, was observed in specific restaurants at the center of Dhaka. Following closely, residences exhibited the second highest concentration, measuring 62.35 ± 41.70 µg/m3. In contrast, several multi-storied malls that are fully air-conditioned and enclosed, demonstrated the lowest PM2.5 concentration at 20.08 ± 15.57 µg/m3. Similarly, within cars where the air conditioning was turned on and the windows were closed, a relatively lower concentration of 22.63 ± 11.77 µg/m3 was observed. Conversely, non-air-conditioned shopping malls exhibited PM2.5 concentrations approximately three times higher than fully enclosed shopping malls. Additionally, despite the enclosed nature of the laboratory with minimal occupancy, moderate PM concentrations were recorded due to the presence of chemicals, e.g., nitric acid (HNO3), sulfuric acid (H2SO4), formaldehyde (HCHO), hydrogen peroxide (H2O2), propanol, and copper sulfate (CuSO4) in the vicinity.
The highest concentration of PM2.5 was detected in the enclosed restaurants with high occupancy, exacerbated by intense cooking activities in the kitchen, leading to elevated PM levels. Various factors contribute to PM levels in residences, including cigarette smoke, body spray, air fresheners, and cooking smoke [37]. Among these, occupant movements play a significant role in increasing indoor particle concentrations due to re-suspension, as airborne particles settle on nearby surfaces [36]. Moreover, compared to other ambient sources such as dust and traffic, cigarette smoke has been consistently demonstrated in numerous studies to pose a greater hazard [37,38]. The third-highest concentration of PM was observed in public vehicles, such as buses. Research conducted in Shanghai has identified buses with diesel engines as one of the primary sources of PM2.5 [39]. The lowest concentration of PM was detected in shopping malls, which are characterized by being fully air-conditioned. In contrast, the concentration of PM in non-AC shopping markets was approximately three times higher than that in fully enclosed shopping malls. This elevation in PM concentration can be attributed to various factors, including aerosol emissions from clothing and cosmetics stores, incense burning in jewelry stores, and cooking smoke emanating from nearby food courts. Incense burning, especially in Asian countries, was identified as a significant indoor source of PM2.5, often leading to indoor PM2.5 levels that exceed ambient PM2.5 concentrations by several-fold [24,40]. In China, Chen et al. [41] found that cosmetics and personal care products are major sources of PM2.5 bounded (phthalates esters, PAEs).

3.5. Level of Hazard Quotient in Different Microenvironments

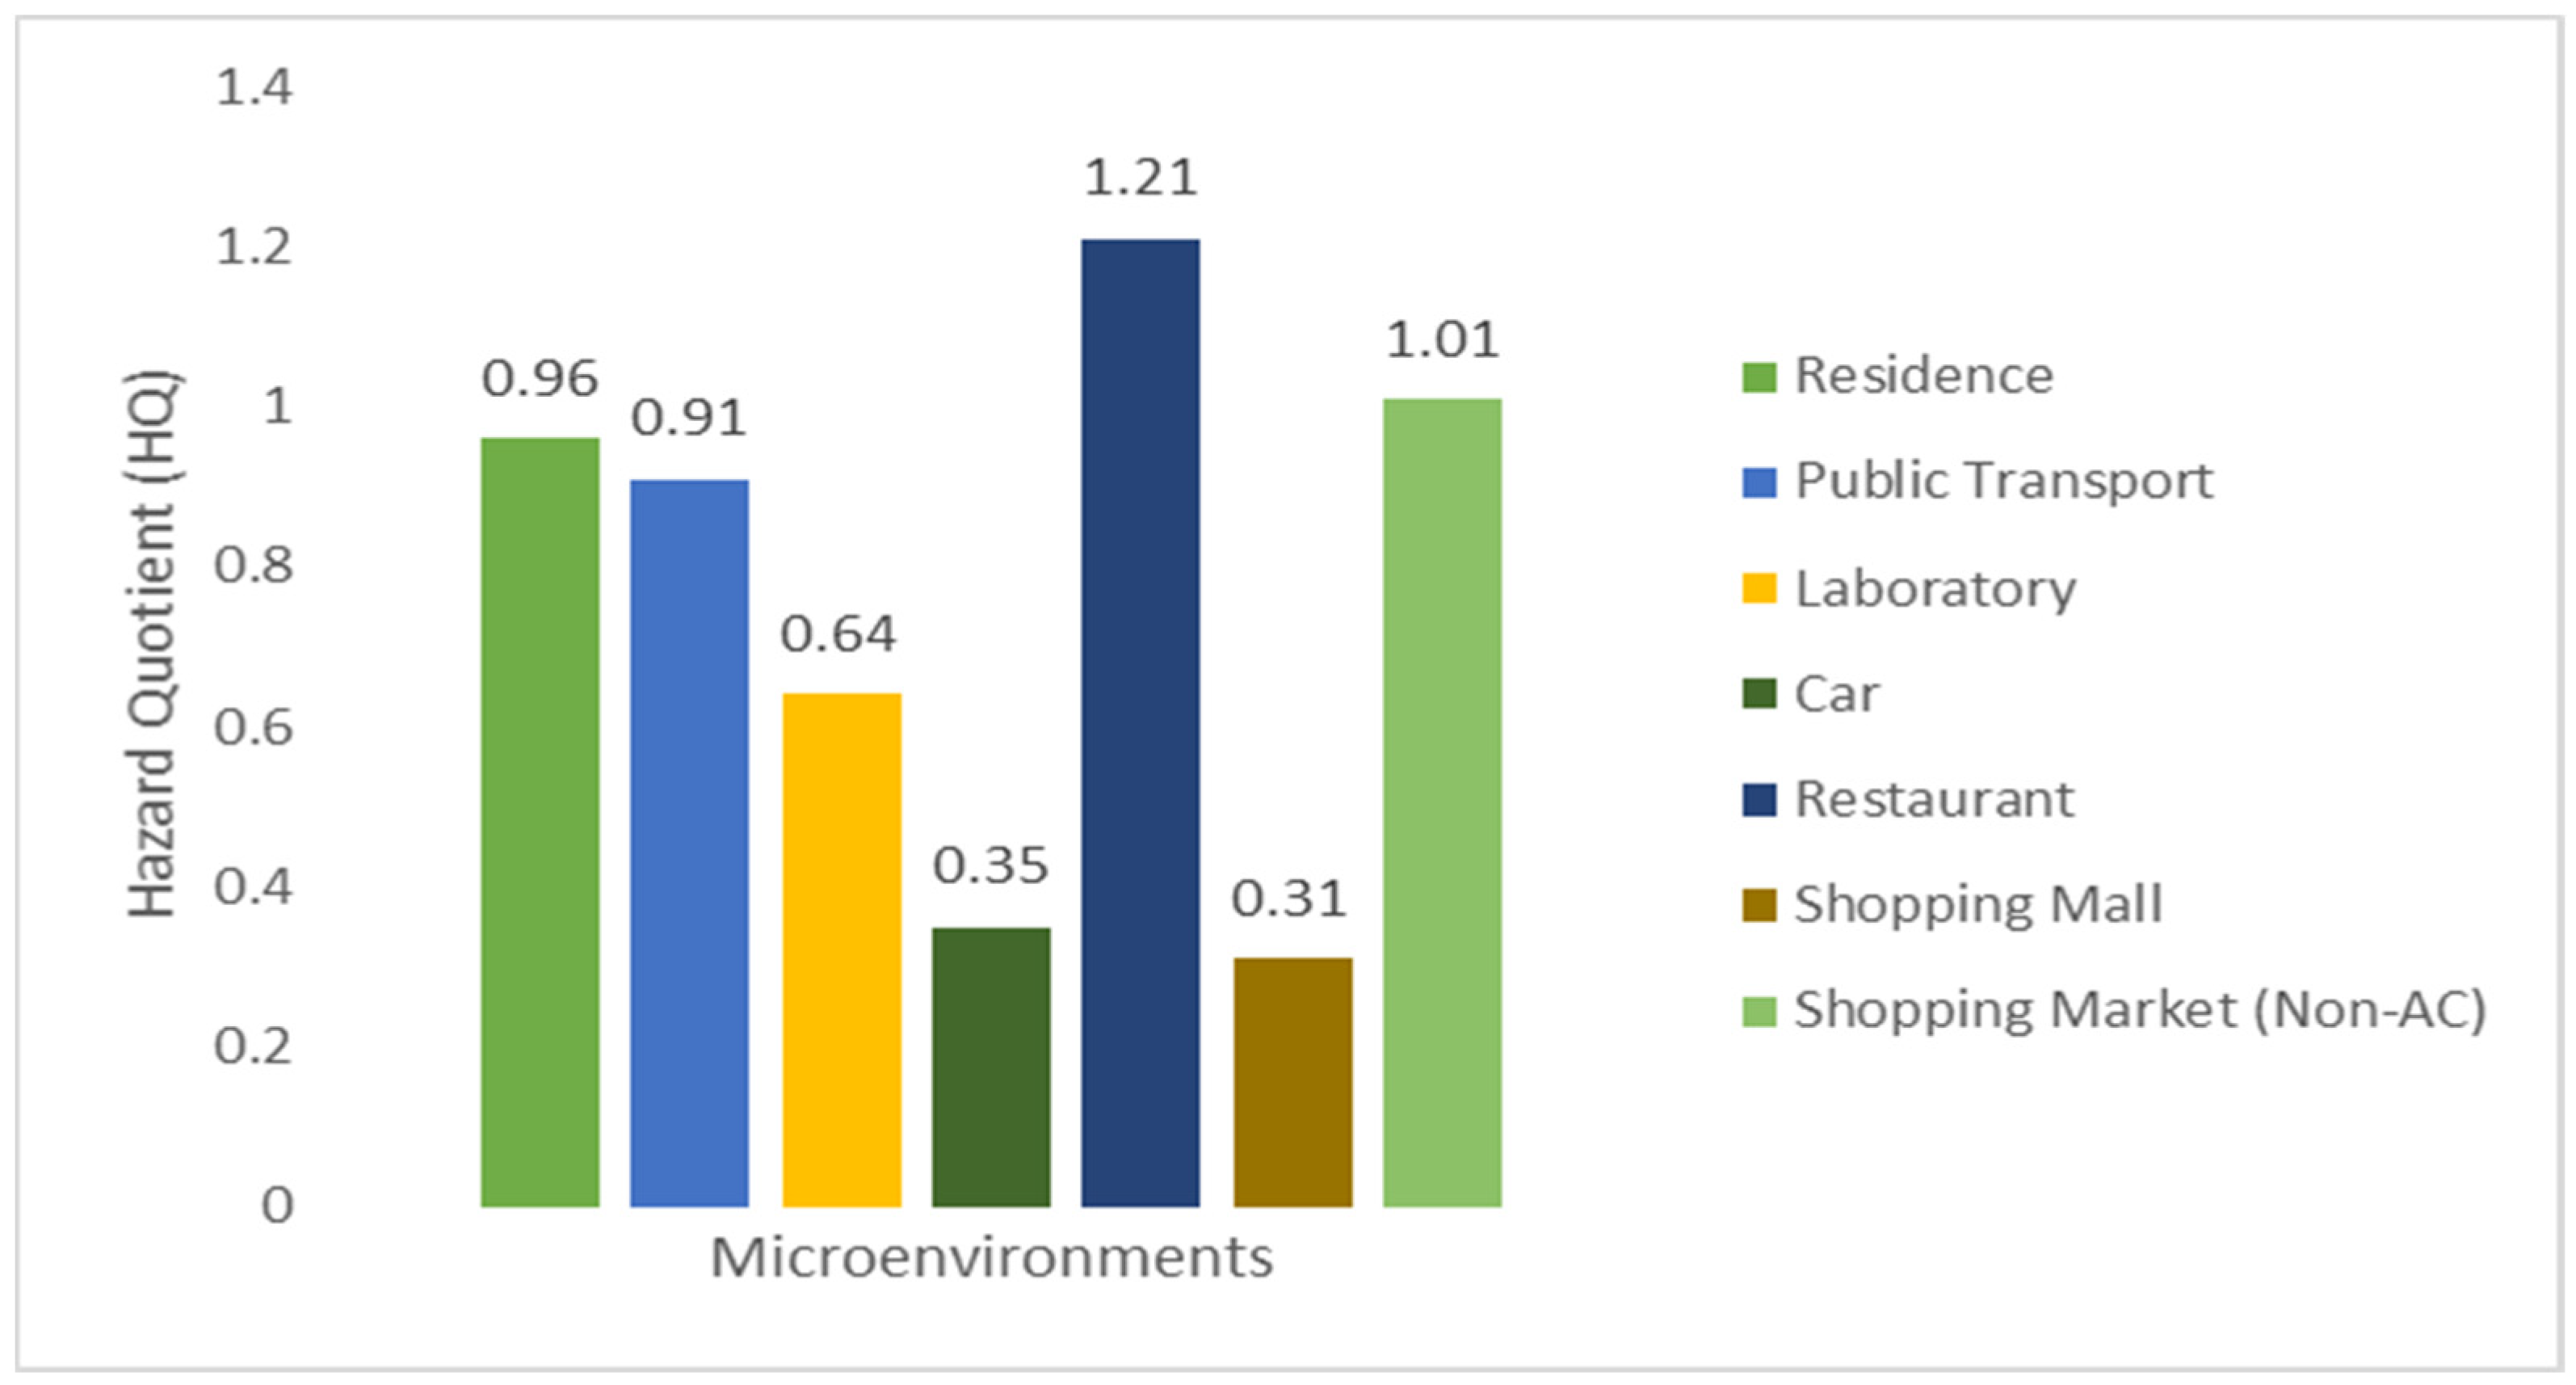
The PM2.5 concentration was used to assess and characterize the potential health risk posed by the community in the area, and the hazard quotient was calculated for seven microenvironments among the sampling sites in Dhaka (Figure 5).
As per the United States Environmental Protection Agency (US E.P.A) Exposure Factors Handbook [42], the inhalation rate in male and female are 23.69 m3/day and 18.41 m3/day, so the average inhalation rate (IR) of 21.03 m3/day was considered in the calculation. The average body weight of males and females are 57.3 kg and 49.7 kg, so an average body weight (BW) of 53.5 kg was considered [43]. The FADD and SADD due to exposure to particulate matter were calculated using Equations 1 and 2, respectively. Table 2 shows the result obtained for exposure to PM2.5.
Moderate health hazards were observed in public transport and non-AC shopping malls, whereas other microenvironments exhibited lower levels of health risk. The lowest hazard levels were observed in cars and air-conditioned shopping malls. Nevertheless, prolonged exposure to high concentrations may pose severe health hazards for occupants.
Several limitations are acknowledged in this study, including the small sample size and the absence of measurement for the test candidates’ acute respiratory rates. Consequently, there may be uncertainty regarding potential differences in participant respiratory rates influenced by their physical attributes, travel speed, and encountered weather conditions. Moreover, the study was confined to a single location, implying that extending its findings to other cities may not yield accurate results. These limitations underscore the necessity for further research endeavors with larger sample sizes, comprehensive respiratory rate assessments, and broader geographical coverage to enhance the robustness and generalizability of findings in understanding individuals’ exposure to environmental stresses.

4. Conclusions

The outcomes of this study highlight the importance of monitoring particulate matter at different microenvironments to better understand individuals’ interactions with environmental stressors. Nighttime emerged as the period with the highest exposure levels on approximately 65 percent of the sampling days, with the operation of heavy transport during nighttime significantly contributing to elevated PM2.5 levels. The mean 24 h average concentration of PM10 varied from 42.68 to 134.81 µg/m3, while for PM2.5, concentration varied from 35.04 to 92.76 µg/m3. The PM1.0 concentration fluctuated from 23.23 to 72.64 µg/m3. Notably, approximately 75% of the 24 h average concentrations of both PM2.5 and overall PM10 remained within the acceptable limits according to the guidelines set by the DoE throughout the sampling period. The closure of educational institutions due to the COVID-19 pandemic resulted in reduced traffic on the roads of Dhaka, potentially explaining why particle exposure levels remained within the DoE guidelines. However, there is still cause for concern, as the risk level posed by individual exposure (HQ value) was determined to be low to moderate in most locations across the Dhaka division. Moderate health hazards were observed in public transport and non-AC shopping malls, whereas other microenvironments exhibited lower levels of health risk. The lowest hazard levels were observed in cars and air-conditioned shopping malls. This study significantly contributes to the field by providing a comprehensive framework for evaluating air pollution exposure, which can be utilized to develop targeted interventions and policies to mitigate health risks associated with air pollution in urban environments.
Moving forward, future studies should strive for a more integrated approach, incorporating devices capable of logging location, time, and environmental variables simultaneously. Such an approach holds the potential to enhance data accuracy and facilitate a deeper understanding of individual exposure dynamics to environmental stressors.

Supplementary Materials

The following supporting information can be downloaded at: https://www.mdpi.com/article/10.3390/atmos15080897/s1, Figure S1: Strava maps for some sampling locations for the assessment of particulate matter at different microenvironments in Dhaka city; Figure S2: Time series plot of particulate matter (PM1.0, PM2.5, and PM10) concentration for 15 sampling days.

Author Contributions

M.A.I.N.: Conceptualization, Methodology, Formal Analysis, Data Curation, Investigation, and Writing—Original Draft; S.R.: Formal Analysis, Writing—Original Draft, and Review and Editing; S.U.Z.: Formal Analysis, Writing—Original Draft, and Review and Editing; A.S.: Conceptualization, Methodology, Writing—Review and Editing, and Supervision. All authors have read and agreed to the published version of the manuscript.

Funding

This research received no external funding.

Institutional Review Board Statement

Not applicable.

Informed Consent Statement

Informed consent was obtained from all subjects involved in the study.

Data Availability Statement

The data presented in this study are available on request from the corresponding author. The data are not publicly available due to privacy.

Acknowledgments

The authors acknowledge the Academia Sinica, Taiwan, for providing the AS-LUNG sensor.

Conflicts of Interest

The authors declare no conflicts of interest.

References

  1. Franck, U.; Odeh, S.; Wiedensohler, A.; Wehner, B.; Herbarth, O. The Effect of Particle Size on Cardiovascular Disorders—The Smaller the Worse. Sci. Total Environ. 2011, 409, 4217–4221. [Google Scholar] [CrossRef] [PubMed]
  2. Chen, R.; Hu, B.; Liu, Y.; Xu, J.; Yang, G.; Xu, D.; Chen, C. Beyond PM2.5: The Role of Ultrafine Particles on Adverse Health Effects of Air Pollution. Biochim. Biophys. Acta (BBA)-Gen. Subj. 2016, 1860, 2844–2855. [Google Scholar] [CrossRef] [PubMed]
  3. Li, T.; Hu, R.; Chen, Z.; Li, Q.; Huang, S.; Zhu, Z.; Zhou, L. Fine Particulate Matter (PM2.5): The Culprit for Chronic Lung Diseases in China. Chronic Dis. Transl. Med. 2018, 4, 176–186. [Google Scholar] [CrossRef] [PubMed]
  4. Krall, J.R.; Mulholland, J.A.; Russell, A.G.; Balachandran, S.; Winquist, A.; Tolbert, P.E.; Waller, L.A.; Sarnat, S.E. Associations between Source-Specific Fine Particulate Matter and Emergency Department Visits for Respiratory Disease in Four US Cities. Environ. Health Perspect. 2017, 125, 97–103. [Google Scholar] [CrossRef] [PubMed]
  5. Meng, Q.Y.; Spector, D.; Colome, S.; Turpin, B. Determinants of Indoor and Personal Exposure to PM2.5 of Indoor and Outdoor Origin during the RIOPA Study. Atmos. Environ. 2009, 43, 5750–5758. [Google Scholar] [CrossRef]
  6. Brauer, M.; Freedman, G.; Frostad, J.; Van Donkelaar, A.; Martin, R.V.; Dentener, F.; van Dingenen, R.; Estep, K.; Amini, H.; Apte, J.S. Ambient Air Pollution Exposure Estimation for the Global Burden of Disease 2013. Environ. Sci. Technol. 2016, 50, 79–88. [Google Scholar] [CrossRef] [PubMed]
  7. IARC Working Group on the Evaluation of Carcinogenic Risks to Humans (Ed.) Outdoor Air Pollution; IARC monographs on the evaluation of carcinogenic risks to humans; International Agency for Research on Cancer; World Health Organization: Lyon, France, 2016; ISBN 978-92-832-0147-2. [Google Scholar]
  8. Baccarelli, A.A.; Zheng, Y.; Zhang, X.; Chang, D.; Liu, L.; Wolf, K.R.; Zhang, Z.; McCracken, J.P.; Díaz, A.; Bertazzi, P.A. Air Pollution Exposure and Lung Function in Highly Exposed Subjects in Beijing, China: A Repeated-Measure Study. Part. Fibre Toxicol. 2014, 11, 51. [Google Scholar] [CrossRef]
  9. Sears, C.G.; Braun, J.M.; Ryan, P.H.; Xu, Y.; Werner, E.F.; Lanphear, B.P.; Wellenius, G.A. The Association of Traffic-Related Air and Noise Pollution with Maternal Blood Pressure and Hypertensive Disorders of Pregnancy in the HOME Study Cohort. Environ. Int. 2018, 121, 574–581. [Google Scholar] [CrossRef]
  10. Zwack, L.M.; Paciorek, C.J.; Spengler, J.D.; Levy, J.I. Characterizing Local Traffic Contributions to Particulate Air Pollution in Street Canyons Using Mobile Monitoring Techniques. Atmos. Environ. 2011, 45, 2507–2514. [Google Scholar] [CrossRef]
  11. Morrison, B.; Heath, B. The Smokestack Effect: Toxic Air and America’s Schools. USA Today 2008, 2008, 2009. [Google Scholar]
  12. Suglia, S.F.; Gryparis, A.; Schwartz, J.; Wright, R.J. Association between Traffic-Related Black Carbon Exposure and Lung Function among Urban Women. Environ. Health Perspect. 2008, 116, 1333–1337. [Google Scholar] [CrossRef] [PubMed]
  13. Mohai, P.; Kweon, B.-S.; Lee, S.; Ard, K. Air Pollution around Schools Is Linked to Poorer Student Health and Academic Performance. Health Aff. 2011, 30, 852–862. [Google Scholar] [CrossRef] [PubMed]
  14. Kim, D.; Sass-Kortsak, A.; Purdham, J.T.; Dales, R.E.; Brook, J.R. Sources of Personal Exposure to Fine Particles in Toronto, Ontario, Canada. J. Air Waste Manag. Assoc. 2005, 55, 1134–1146. [Google Scholar] [CrossRef] [PubMed]
  15. Roy, S.; Zaman, S.U.; Joy, K.S.; Jeba, F.; Kumar, P.; Salam, A. Impact of Fine Particulate Matter and Toxic Gases on the Health of School Children in Dhaka, Bangladesh. Environ. Res. Commun. 2023, 5, 025004. [Google Scholar] [CrossRef]
  16. Steinle, S.; Reis, S.; Sabel, C.E. Quantifying Human Exposure to Air Pollution—Moving from Static Monitoring to Spatio-Temporally Resolved Personal Exposure Assessment. Sci. Total Environ. 2013, 443, 184–193. [Google Scholar] [CrossRef]
  17. Steinle, S.; Reis, S.; Sabel, C.E.; Semple, S.; Twigg, M.M.; Braban, C.F.; Leeson, S.R.; Heal, M.R.; Harrison, D.; Lin, C. Personal Exposure Monitoring of PM2.5 in Indoor and Outdoor Microenvironments. Sci. Total Environ. 2015, 508, 383–394. [Google Scholar] [CrossRef]
  18. Badura, M.; Batog, P.; Drzeniecka-Osiadacz, A.; Modzel, P. Evaluation of Low-Cost Sensors for Ambient PM2.5 Monitoring. J. Sens. 2018, 1, 5096540. [Google Scholar] [CrossRef]
  19. Kumar, P.; Morawska, L.; Martani, C.; Biskos, G.; Neophytou, M.; Di Sabatino, S.; Bell, M.; Norford, L.; Britter, R. The Rise of Low-Cost Sensing for Managing Air Pollution in Cities. Environ. Int. 2015, 75, 199–205. [Google Scholar] [CrossRef]
  20. Castell, N.; Dauge, F.R.; Schneider, P.; Vogt, M.; Lerner, U.; Fishbain, B.; Broday, D.; Bartonova, A. Can Commercial Low-Cost Sensor Platforms Contribute to Air Quality Monitoring and Exposure Estimates? Environ. Int. 2017, 99, 293–302. [Google Scholar] [CrossRef]
  21. Levy Zamora, M.; Xiong, F.; Gentner, D.; Kerkez, B.; Kohrman-Glaser, J.; Koehler, K. Field and Laboratory Evaluations of the Low-Cost Plantower Particulate Matter Sensor. Environ. Sci. Technol. 2018, 53, 838–849. [Google Scholar] [CrossRef]
  22. Lung, S.-C.C.; Thi Hien, T.; Cambaliza, M.O.L.; Hlaing, O.M.T.; Oanh, N.T.K.; Latif, M.T.; Lestari, P.; Salam, A.; Lee, S.-Y.; Wang, W.-C.V. Research Priorities of Applying Low-Cost PM2.5 Sensors in Southeast Asian Countries. Int. J. Environ. Res. Public Health 2022, 19, 1522. [Google Scholar] [CrossRef] [PubMed]
  23. Borghi, F.; Spinazzè, A.; Rovelli, S.; Campagnolo, D.; Del Buono, L.; Cattaneo, A.; Cavallo, D.M. Miniaturized Monitors for Assessment of Exposure to Air Pollutants: A Review. Int. J. Environ. Res. Public Health 2017, 14, 909. [Google Scholar] [CrossRef]
  24. Wang, Z.; Delp, W.W.; Singer, B.C. Performance of Low-Cost Indoor Air Quality Monitors for PM2.5 and PM10 from Residential Sources. Build. Environ. 2020, 171, 106654. [Google Scholar] [CrossRef]
  25. Morawska, L.; Thai, P.K.; Liu, X.; Asumadu-Sakyi, A.; Ayoko, G.; Bartonova, A.; Bedini, A.; Chai, F.; Christensen, B.; Dunbabin, M. Applications of Low-Cost Sensing Technologies for Air Quality Monitoring and Exposure Assessment: How Far Have They Gone? Environ. Int. 2018, 116, 286–299. [Google Scholar] [CrossRef]
  26. Snyder, E.G.; Watkins, T.H.; Solomon, P.A.; Thoma, E.D.; Williams, R.W.; Hagler, G.S.; Shelow, D.; Hindin, D.A.; Kilaru, V.J.; Preuss, P.W. The Changing Paradigm of Air Pollution Monitoring. Environ. Sci. Technol. 2013, 47, 11369–11377. [Google Scholar] [CrossRef] [PubMed]
  27. Muller, C.L.; Chapman, L.; Johnston, S.; Kidd, C.; Illingworth, S.; Foody, G.; Overeem, A.; Leigh, R.R. Crowdsourcing for Climate and Atmospheric Sciences: Current Status and Future Potential. Int. J. Climatol. 2015, 35, 3185–3203. [Google Scholar] [CrossRef]
  28. Jiao, W.; Hagler, G.; Williams, R.; Sharpe, R.; Brown, R.; Garver, D.; Judge, R.; Caudill, M.; Rickard, J.; Davis, M. Community Air Sensor Network (CAIRSENSE) Project: Evaluation of Low-Cost Sensor Performance in a Suburban Environment in the Southeastern United States. Atmos. Meas. Tech. 2016, 9, 5281–5292. [Google Scholar] [CrossRef]
  29. Austin, E.; Novosselov, I.; Seto, E.; Yost, M.G. Laboratory Evaluation of the Shinyei PPD42NS Low-Cost Particulate Matter Sensor. PLoS ONE 2015, 10, e0137789. [Google Scholar]
  30. Wu, J.; Xiao, X.; Li, Y.; Yang, F.; Yang, S.; Sun, L.; Ma, R.; Wang, M.C. Personal Exposure to Fine Particulate Matter (PM2.5) of Pregnant Women during Three Trimesters in Rural Yunnan of China. Environ. Pollut. 2020, 256, 113055. [Google Scholar] [CrossRef]
  31. Available online: www.worldmeters.info (accessed on 9 April 2024).
  32. Available online: www.macrotrends.net/global-metrics/ (accessed on 9 April 2024).
  33. Sinaga, D.; Setyawati, W.; Cheng, F.Y.; Lung, S.-C.C. Investigation on Daily Exposure to PM2.5 in Bandung City, Indonesia Using Low-Cost Sensor. J. Expo. Sci. Environ. Epidemiol. 2020, 30, 1001–1012. [Google Scholar] [CrossRef]
  34. Lung, S.-C.C.; Wang, W.-C.V.; Wen, T.-Y.J.; Liu, C.-H.; Hu, S.-C. A Versatile Low-Cost Sensing Device for Assessing PM2.5 Spatiotemporal Variation and Quantifying Source Contribution. Sci. Total Environ. 2020, 716, 137145. [Google Scholar] [CrossRef]
  35. Pavel, M.R.S.; Zaman, S.U.; Jeba, F.; Islam, M.S.; Salam, A. Long-Term (2003–2019) Air Quality, Climate Variables, and Human Health Consequences in Dhaka, Bangladesh. Front. Sustain. Cities 2021, 3, 681759. [Google Scholar] [CrossRef]
  36. Lemly, A.D. Evaluation of the Hazard Quotient Method for Risk Assessment of Selenium. Ecotoxicol. Environ. Saf. 1996, 35, 156–162. [Google Scholar] [CrossRef]
  37. Dacunto, P.J.; Cheng, K.C.; Acevedo-Bolton, V.; Jiang, R.T.; Klepeis, N.E.; Repace, J.L.; Ott, W.R.; Hildemann, L.M. Real-time particle monitor calibration factors and PM2.5 emission factors for multiple indoor sources. Environ. Sci. Process. Impacts 2013, 15, 1511–1519. [Google Scholar] [CrossRef] [PubMed]
  38. Zhang, T.; Chillrud, S.N.; Yang, Q.; Pitiranggon, M.; Ross, J.; Perera, F.; Ji, J.; Spira, A.; Breysse, P.N.; Rodes, C.E. Characterizing Peak Exposure of Secondhand Smoke Using a Real-time PM2.5 Monitor. Indoor Air 2020, 30, 98–107. [Google Scholar] [CrossRef] [PubMed]
  39. Yue, W.; Li, X.; Liu, J.; Li, Y.; Yu, X.; Deng, B.; Wan, T.; Zhang, G.; Huang, Y.; He, W.; et al. Characterization of PM2.5 in the ambient air of Shanghai city by analyzing individual particles. Sci. Total Environ. 2006, 368, 916–925. [Google Scholar] [CrossRef]
  40. Zaman, S.U.; Yesmin, M.; Pavel, M.R.S.; Jeba, F.; Salam, A. Indoor air quality indicators and toxicity potential at the hospitals’ environment in Dhaka, Bangladesh. Environ. Sci. Pollut. Res. 2021, 28, 37727–37740. [Google Scholar] [CrossRef]
  41. Chen, Y.; Lv, D.; Li, X.; Zhu, T. PM2.5-bound phthalates in indoor and outdoor air in Beijing: Seasonal distributions and human exposure via inhalation. Environ. Pollut. 2018, 241, 369–377. [Google Scholar] [CrossRef]
  42. US Environmental Protection Agency. USPEA Exposure Factors Handbook; US Environmental Protection Agency: Washington, DC, USA, 2011.
  43. Available online: www.worlddata.info (accessed on 9 April 2024).
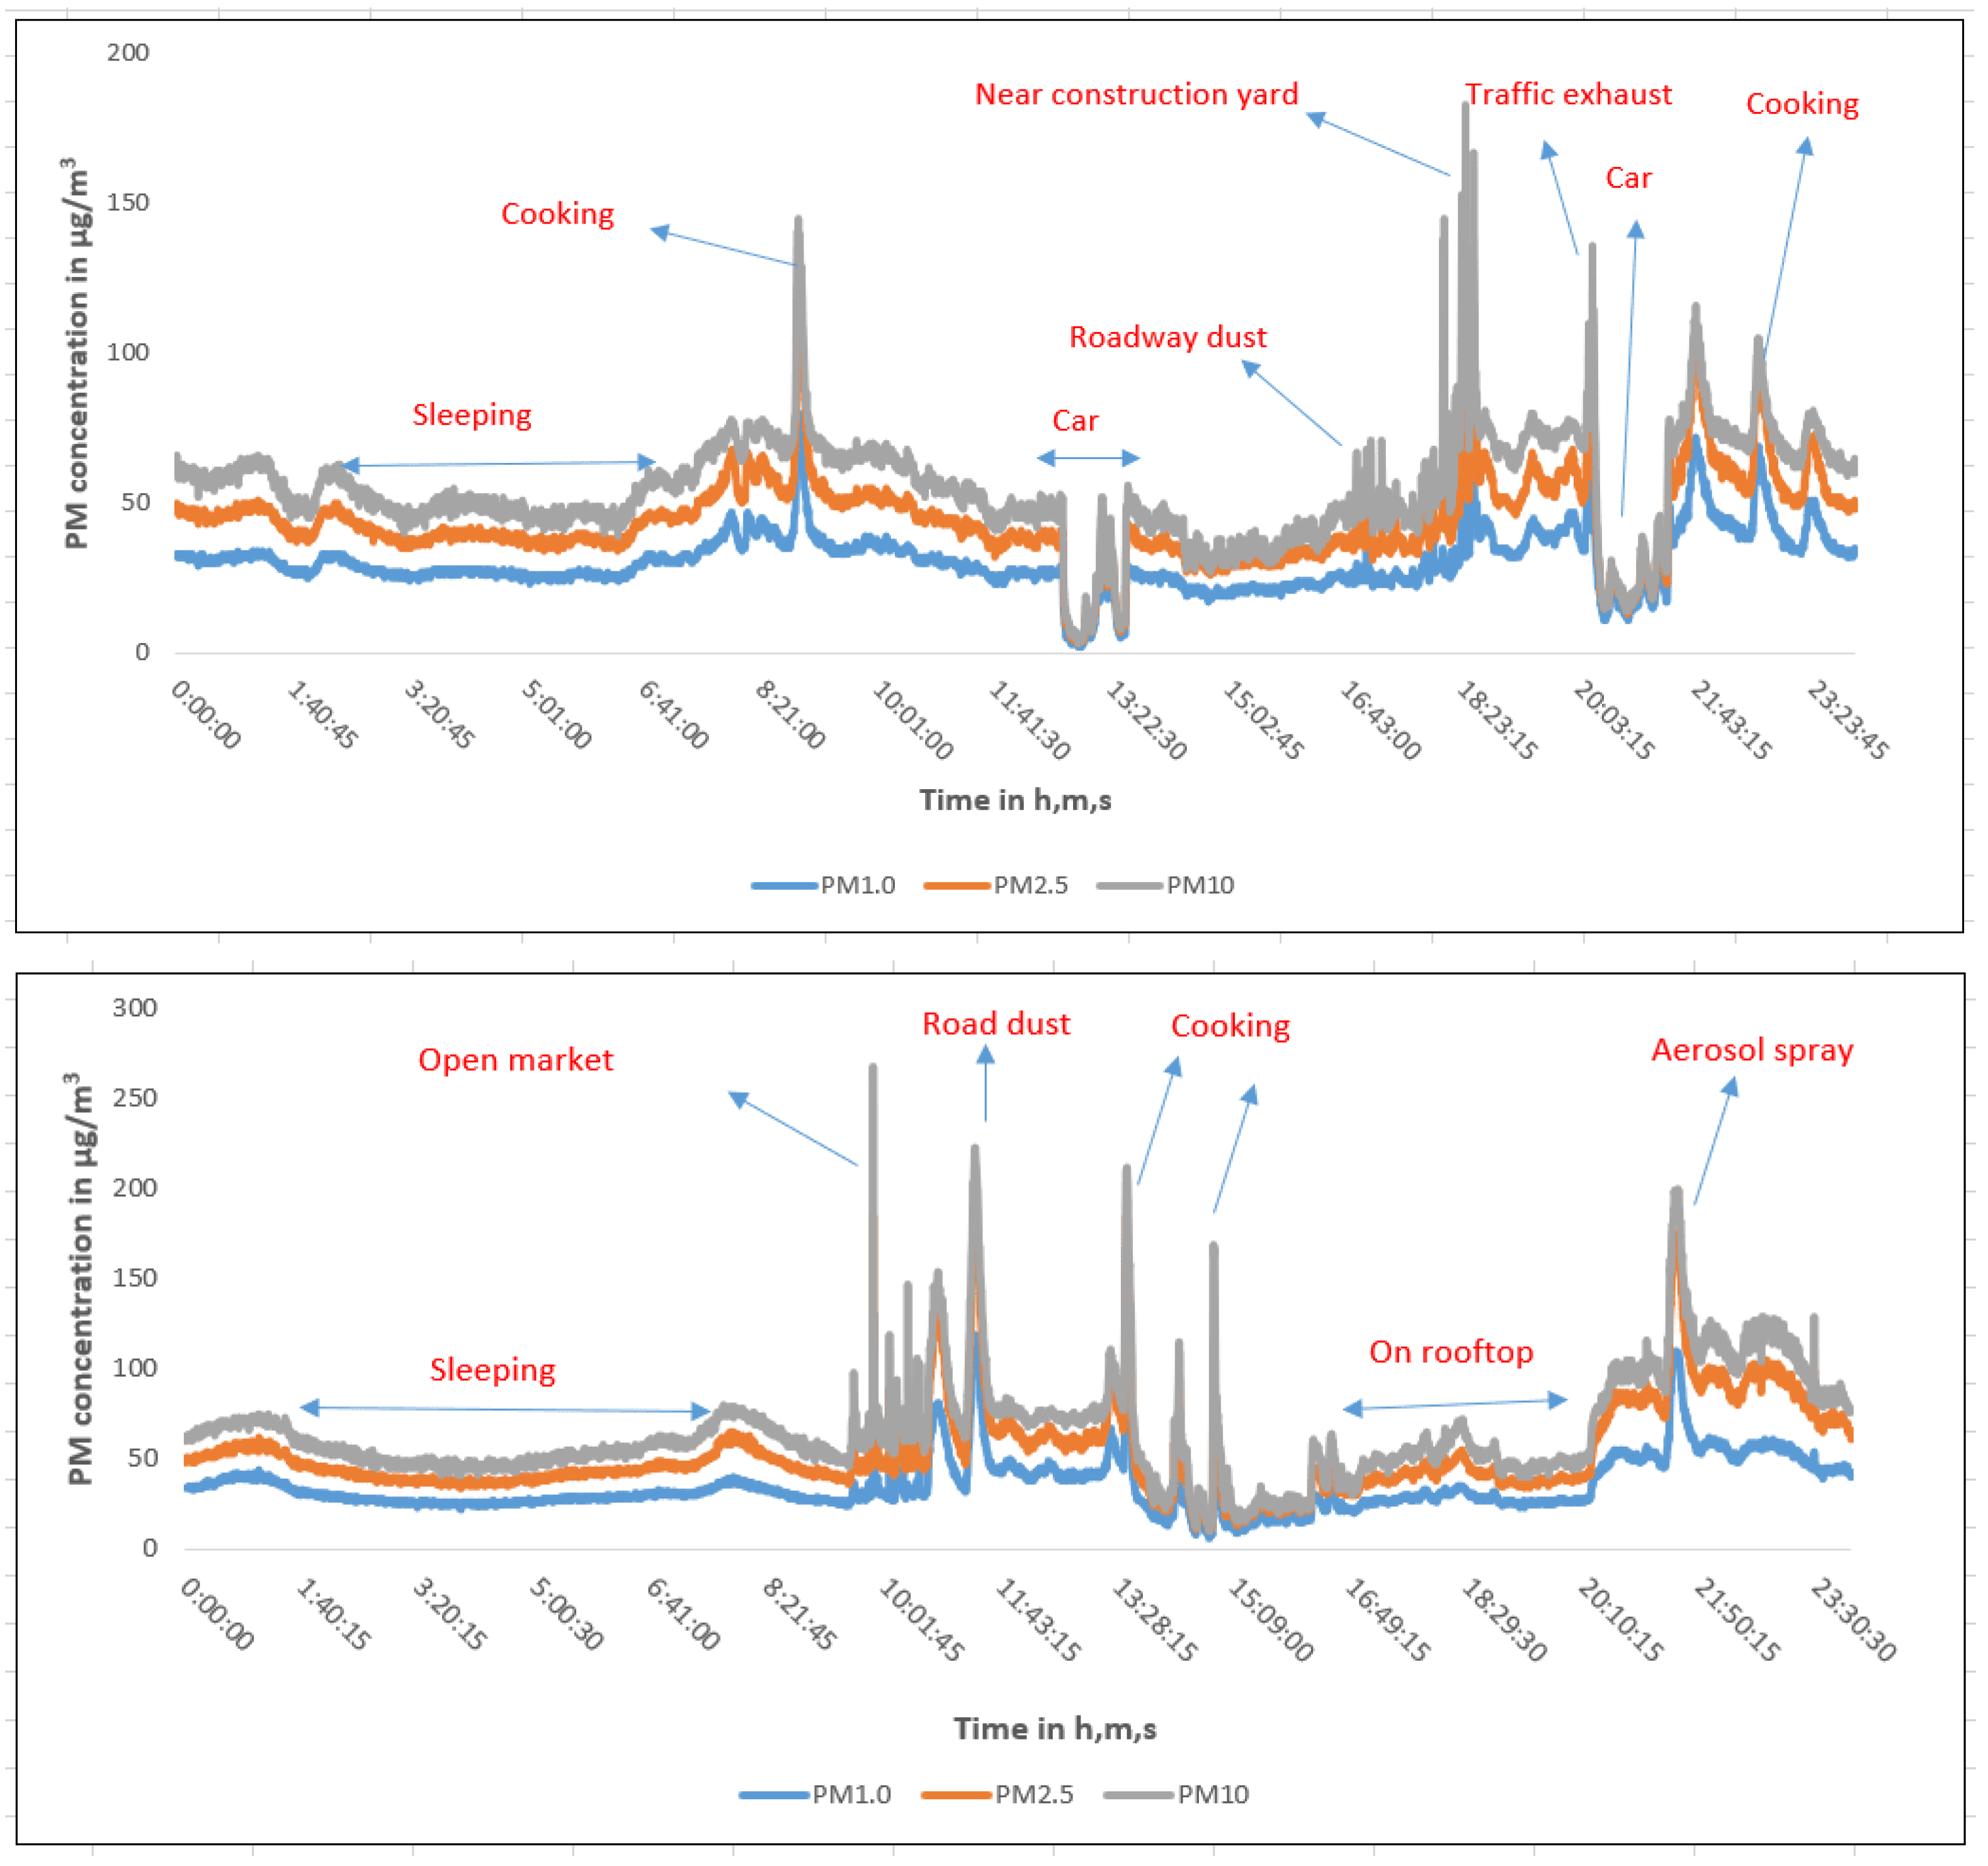
Figure 1. Time series of particulate matter (PM1.0, PM2.5, and PM10) concentrations at different microenvironments in Dhaka city. (Upper panel: day 1; Bottom panel: day 2).
Atmosphere 15 00897 g001
Figure 2. Variation of particulate matter (PM1.0, PM2.5, and PM10) concentrations during the sampling days for the assessment of PM exposure at different microenvironments.
Atmosphere 15 00897 g002
Figure 3. Day–night comparison of particulate matter: (a) PM1.0, (b) PM2.5, and (c) PM10 for the assessment of PM exposure in different microenvironments.
Atmosphere 15 00897 g003
Figure 4. Variation of PM2.5 concentration in different microenvironments.
Atmosphere 15 00897 g004
Figure 5. Hazard Quotient of PM2.5 in different microenvironments in Dhaka city.
Atmosphere 15 00897 g005
Table 1. Description of sampling sites for the assessment of particulate matter at different microenvironments.
Microenvironment SitesDescription
ResidenceVery densely populated and polluted area in Bashabo, Dhaka
Shopping mall (AC)Multi-storied air-conditioned shopping malls
Shopping market (non-AC)Highly dense and congested markets, e.g., Mouchak, Anarkoli, and Nilkhet Book Market
CarFour-wheel drive in urban and highway routes
Public BusOverloaded with passengers that move around the city
RestaurantsVarious restaurants with kitchens inside in Central Dhaka
University Research LaboratoryEnclosed room with few people
Table 2. Hazard quotient due to exposure to PM2.5 in different microenvironments.
Parameters Residence Public Transport Laboratory Car Restaurant Shopping
Mall (AC)
Shopping
Market
(Non-AC)
C (µg/m3)62.35 59.06 42.01 22.63 78.87 20.08 59.51
IR (m3/day)21.03 21.03 21.03 21.03 21.03 21.03 21.03
EF (days)365 365 210 312 150 60 156
ED (year)15 15 4 15 15 15 15
AT (days)5475 5475 840 4680 2250 900 2340
BW (kg)53.5 53.5 53.5 53.5 53.5 53.5 53.5
FADD
(µg/kg/day)
24.51 23.22 16.51 8.89 31 7.89 23.39
SADD
(µg/kg/day)
25.55 25.55 25.55 25.55 25.55 25.55 25.88
HQ0.96 0.91 0.64 0.35 1.21 0.31 1.01
Hazard
Level
Low Low Low Low Moderate Low Moderate
Disclaimer/Publisher’s Note: The statements, opinions and data contained in all publications are solely those of the individual author(s) and contributor(s) and not of MDPI and/or the editor(s). MDPI and/or the editor(s) disclaim responsibility for any injury to people or property resulting from any ideas, methods, instructions or products referred to in the content.