1. Introduction
Femtosecond laser-induced fluorescence spectroscopy (FLIFS) and femtosecond laser-induced optical breakdown spectroscopy (FLIBS) are important tools for remote diagnostics of atmospheric aerosols using LiDAR techniques. High intensity values inherent to ultrashort optical radiation allow for overcoming the energy threshold for the realization of nonlinear-optical effects of multiphoton absorption and optical breakdown of matter inside the particles and provide for the receiving of the emission signal from particles at long distances in the atmosphere via the lidars [
1,
2,
3,
4,
5,
6,
7]. At sufficiently high laser intensity, a dyed liquid particle exposed to optical radiation can be multiphoton-excited and exhibiting nonlinear emission in the spectral band of dye fluorescence. For example, for a typical laser dye (fluorescein-uranine, C
20H
12O
5), the center of the broad spectral fluorescence band is located near the wavelength λ = 525 nm, while the absorption band center is located around 500 nm. Obviously, since the energy of the near-infra-red (IR) laser radiation quantum (carrier wavelength 800 nm) is less than the energy difference of the absorption levels of the dye molecule, the two-photon-excited fluorescence (TPEF) of the main energy transition of uranine is possible. As a result of TPEF, two quanta of incident radiation are absorbed by the dye molecule in one quantum event (one-step), and then the lower excited vibrational sublevel is released through the radiative transition to the ground singlet state.
The fluorescence arising in the droplet, which can be treated as secondary radiation, emerges mainly in the vicinity of the internal optical focuses, the so-called “hot spots” [
8,
9]. During the propagation away from the hot spots, this secondary radiation experiences refraction on the internal spherical surface of the mother particle. This results in a nonhomogeneous spatial distribution of the TPEF far from the particle (the receiving plane). On the other hand, the specific type of angular distribution of dye emission is also influenced by the very nature of the excitation of secondary radiation, namely, by the multiphoton order (
m) of the excitation. In ref. [
8], multiphoton-excited fluorescence (two- and three-photon) angular patterns in ethanol and methanol droplets with 25 ÷ 40 μm radius containing coumarin 510 or tryptophan dyes are experimentally and theoretically investigated under the irradiation of a IR femtosecond Ti:sapphire laser with a typical pulse energy of several microjoules. The main result reported in this work is that the maximal intensity of droplet fluorescence is observed in the backward direction, i.e., towards the direction of incidence of the excitation radiation.
In our previous work [
9], by means of the numerical finite-difference time-domain (FDTD) simulation, we showed that the higher the values of the
m-photon order, the more narrow-directed the radiation pattern of nonlinear emission from particles becomes. Meanwhile, emission from sufficiently large droplets with sizes
d >> λ is always characterized by anomalously enhanced backward luminescence.
It is worth noting that the method of light-induced fluorescence stimulated by femtosecond laser radiation is not yet sufficiently developed for use on long-range atmospheric links [
7]. Primarily, this is due to the challenges of controlling the nonlinear propagation of a high-power laser pulse at long distances because of the manifestation of the filamentation phenomenon [
10]. The spatial position of the filamentation region is known to be considerably sensitive to the laser pulse power, beam quality, phase modulation, optical polarization, etc. [
11,
12]. Here, as a prospective opportunity for remote optical sensing of the atmosphere, one can propose the specific ultra-broadband laser radiation in the form of the so-called post-filamentation light channels, which will further be referred to as the postfilaments. These postfilaments, in fact, can be treated as the highly confined optical traces of the filaments [
13,
14]. Importantly, although high, the typical postfilament intensity is insufficient for medium ionization and creating a plasma in air. However, the postfilaments still possess high intensity (up to a hundred GW/cm
2), causing their reduced angular divergence due to Kerr self-focusing [
15], and are confidently registered at a length of several kilometers [
16]. This eliminates the necessity for precise positioning of the plasma region along the optical path to impact the test object since the postfilaments extend over much longer ranges than the regular filaments, and one should only control the filamentation onset distance and not its length. Moreover, the impact of such a plasma-free postfilament formed during femtosecond pulse propagation in air on a denser object (solid target, aerosol) leads to plasma formation in this object itself [
15] with the emission of spectral lines of detected substances. At the same time, we could not find any literature or experimental data on the remote fluorescence measurements from aerosols placed not in the filamentation region but in the region of plasma-free postfilament propagation.
In the present work, we experimentally demonstrate the use of the postfilaments formed during the femtosecond laser pulse filamentation in air for the realization of the FLIFS method in a dyed liquid aerosol with different dispersion compositions. Our study shows not only the possibility of remote detection of aerosol dye fluorescence spectra excited by the plasma-free light channels but also paves the way for increasing the efficiency of MPEF through femtosecond pulse structuring via stochastic phase modulation by a heated air jet with random refractive index perturbations.
2. Experiment
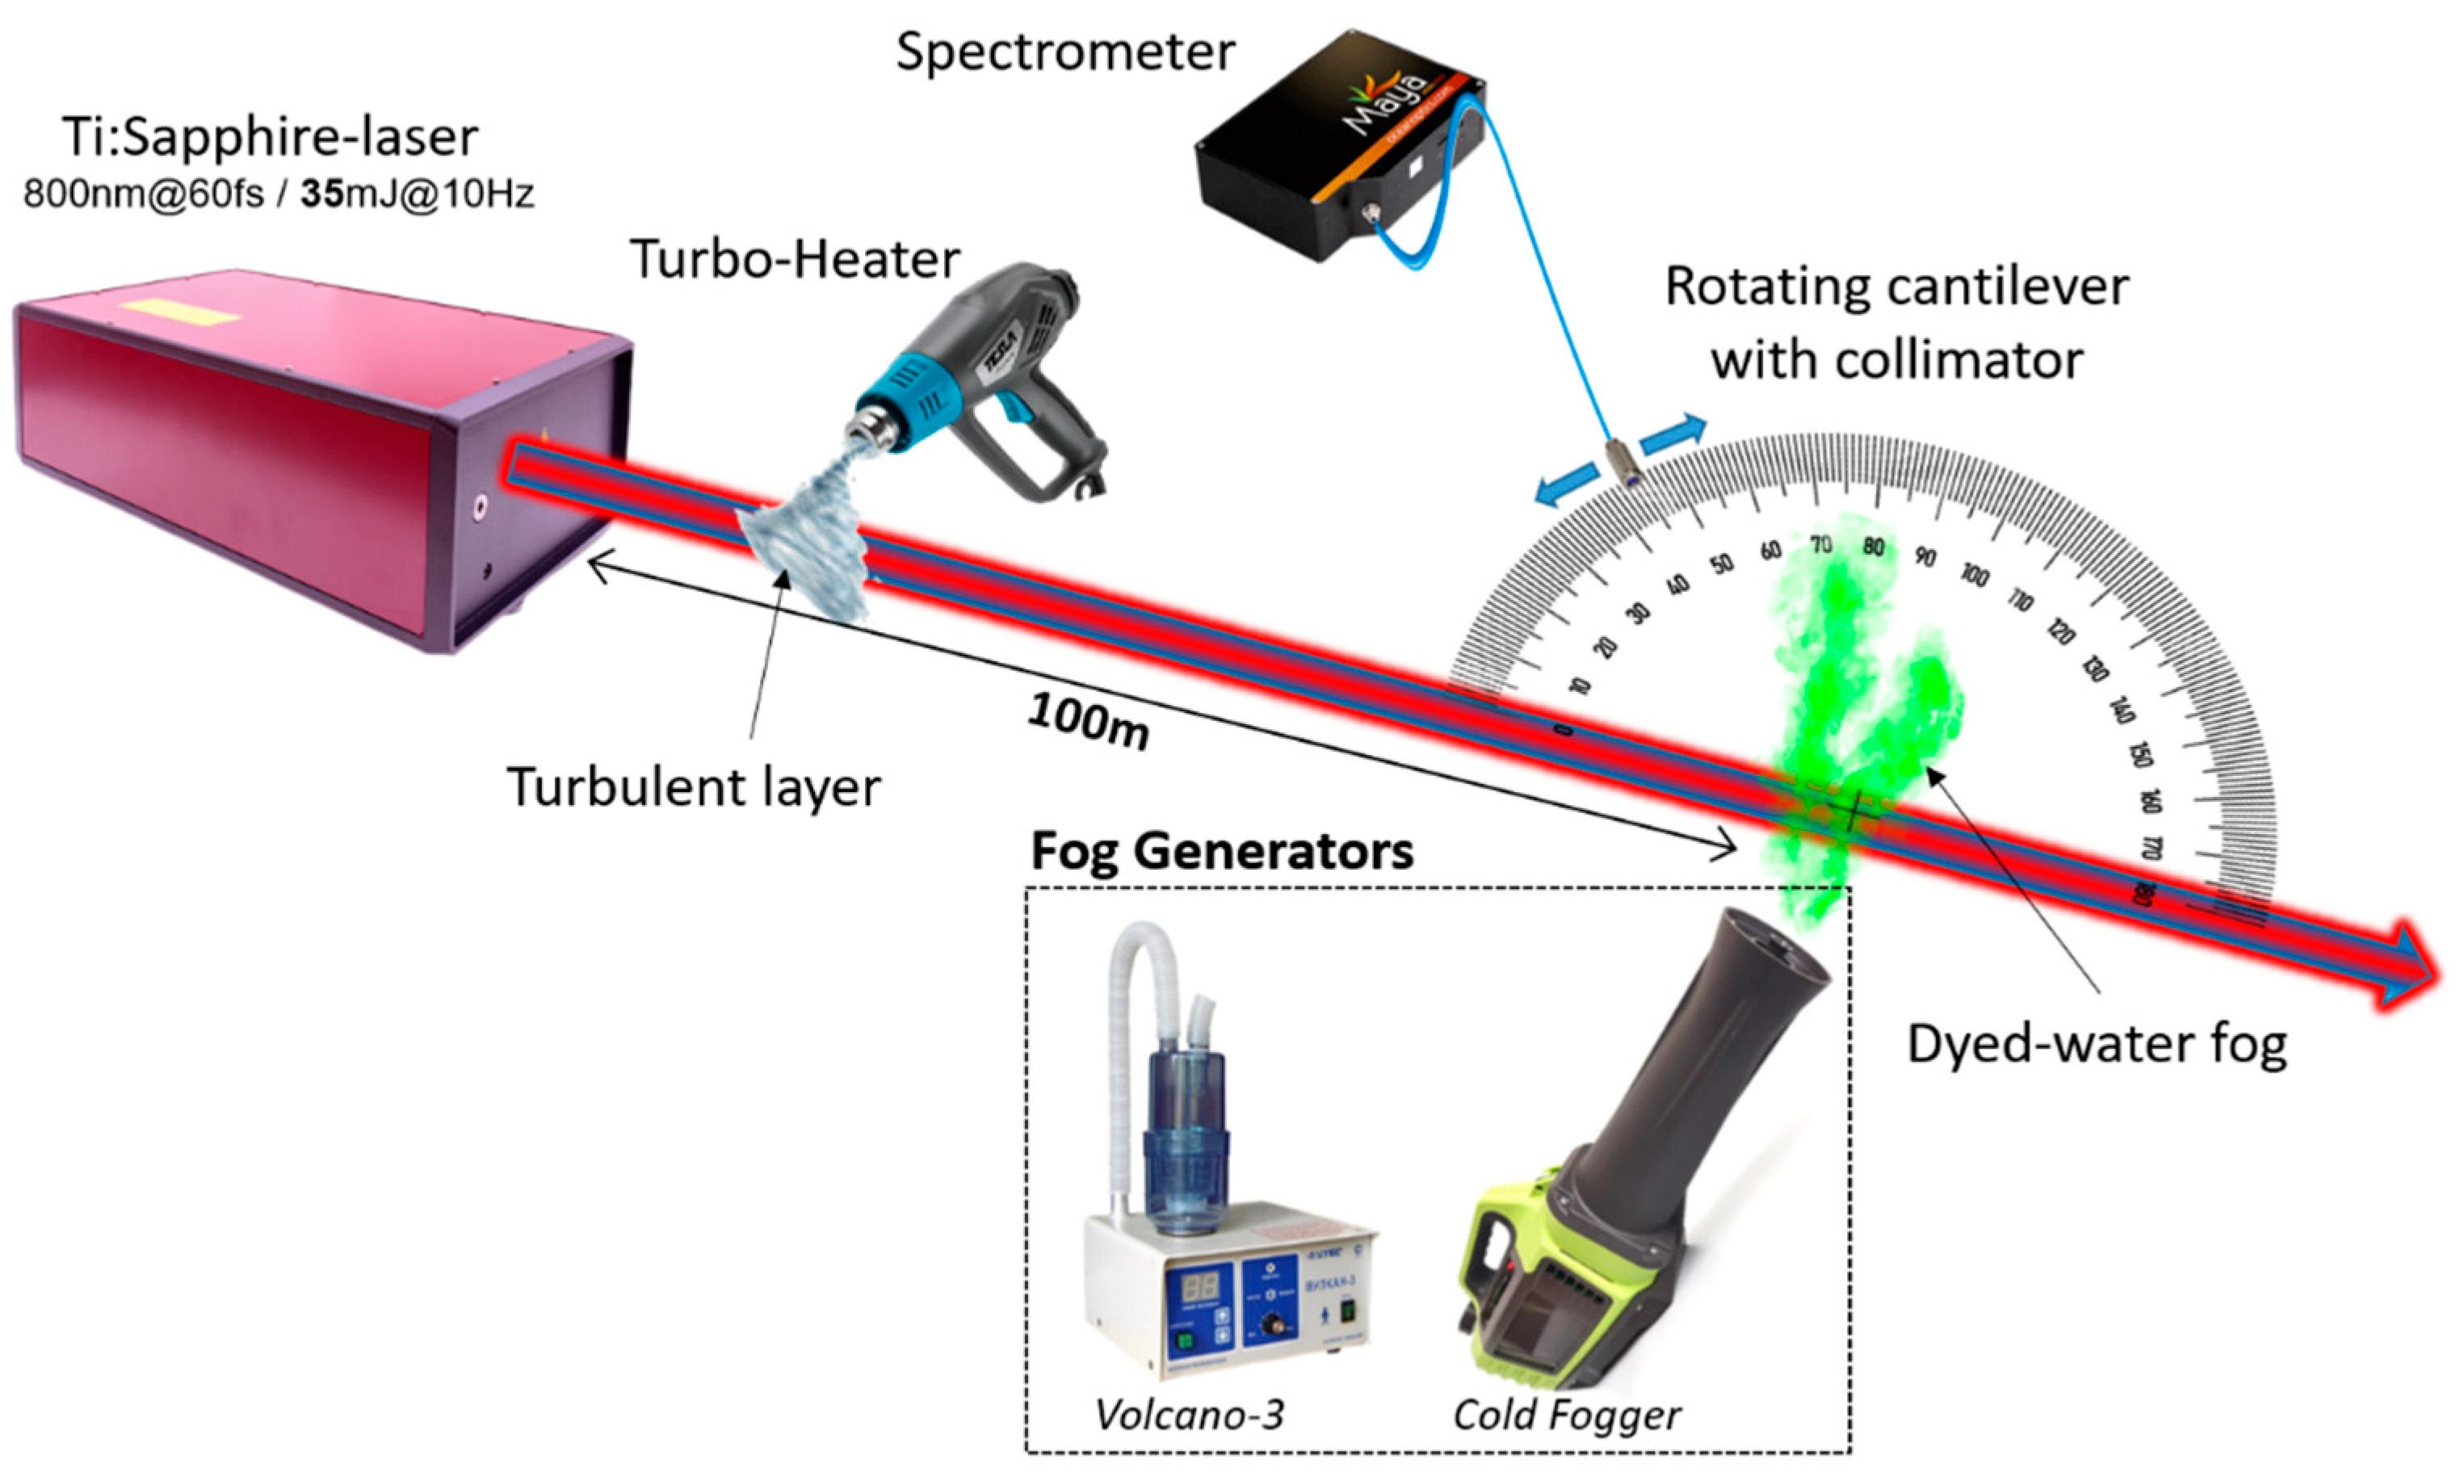
Experimental schematics on the remote recording of the fluorescence in aqueous aerosol droplets doped with the uranine dye (concentration, approx. 0.4 g/L) are presented in
Figure 1. The droplet emission originates from two-photon absorption and subsequent radiative relaxation of dye molecules exposed to GW-level femtosecond laser pulses produced by a Ti:sapphire laser oscillator. Optionally, a laser pulse may experience specific modulation using a thin layer of heated turbulent air, which imposes stochastic phase modulation of the optical pulse when passing through it.
Recently [
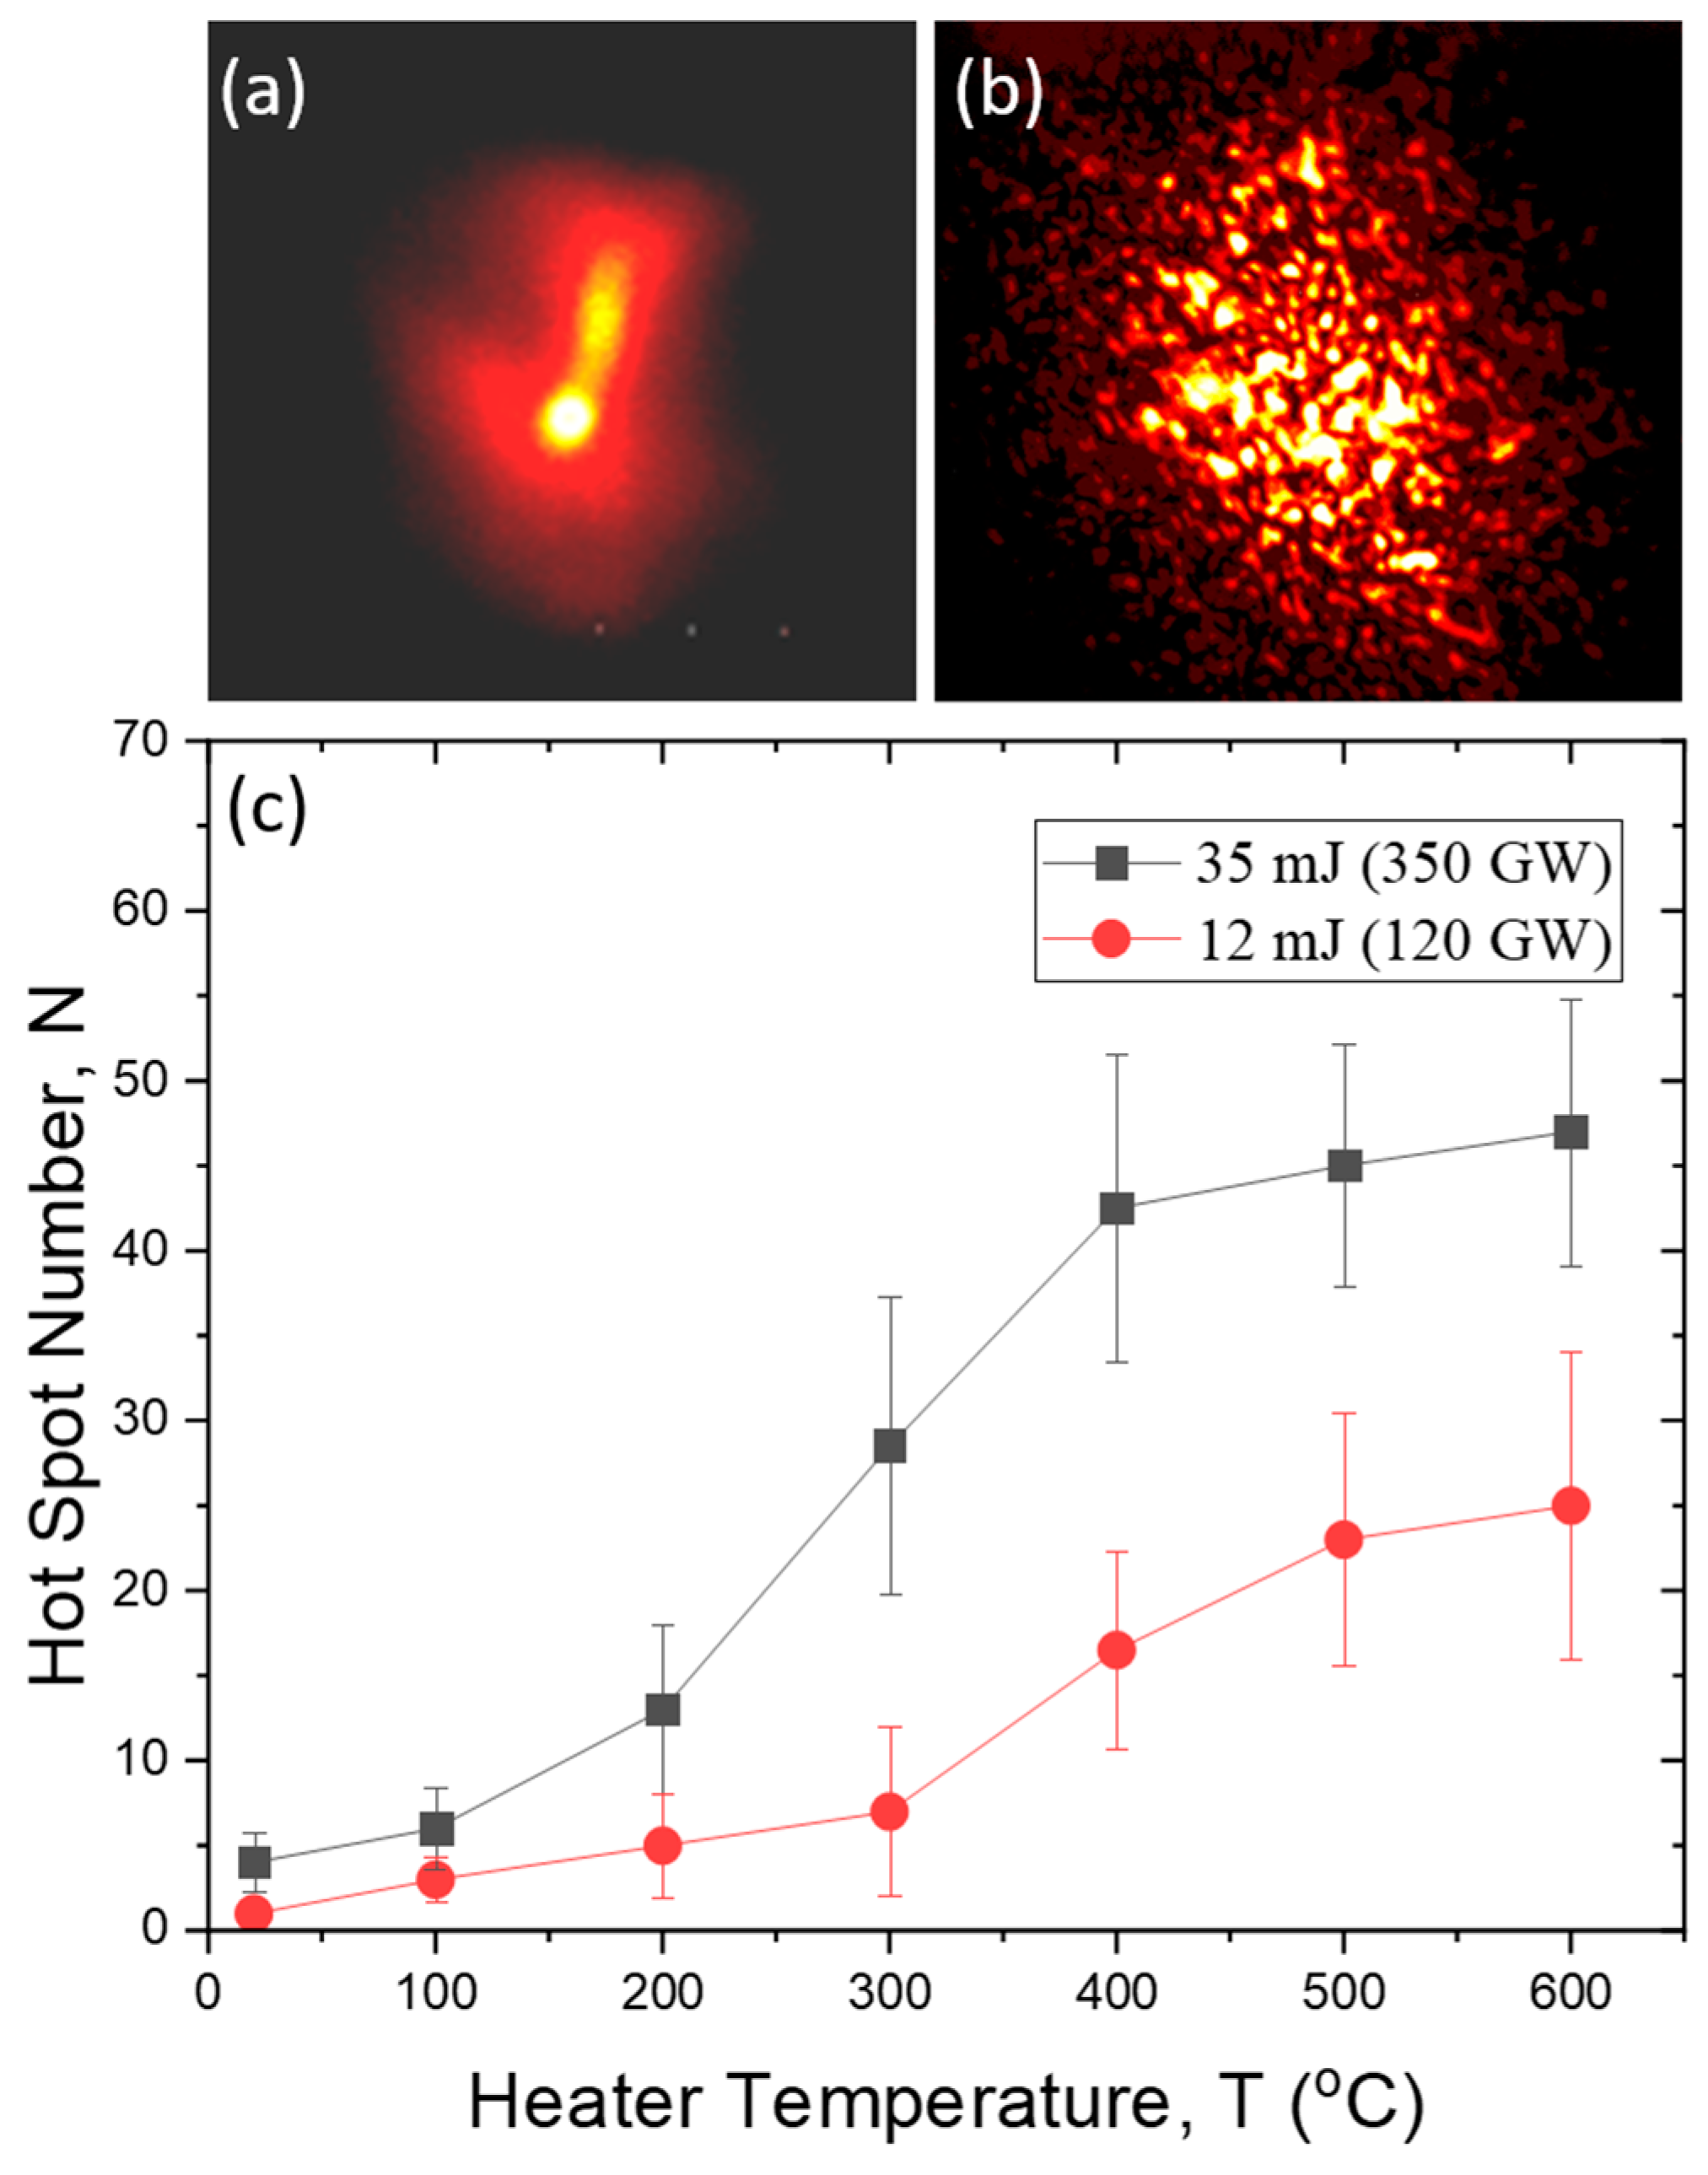
17], our experimental studies on the influence of turbulence on laser beam filamentation showed that the application of a thin but intense turbulent layer in the optical path of high-power laser radiation propagation leads to intensity redistribution in the beam cross section due to the inhomogeneities of air refractive index, which initiates small-scale stochastic optical beam collapse and the formation of high-intensity hot spots (HSs) during the propagation. As an example,
Figure 2a,b demonstrates the images of the transverse structure of a 35 mJ femtosecond laser beam traveling a 100 m air path (a) without a turbulent layer and (b) when a turbo-heater is switched on.
For the creation of a turbulent phase layer, our experimental setup provides for an air heating device with a variable temperature of the heating element. During our experiments, the air turbo-heater (fan) is placed at a distance of about 8 m from the laser output window at a lateral distance of 10 cm relative to the beam axis. The average thickness of the turbulent jet is about 2 cm.
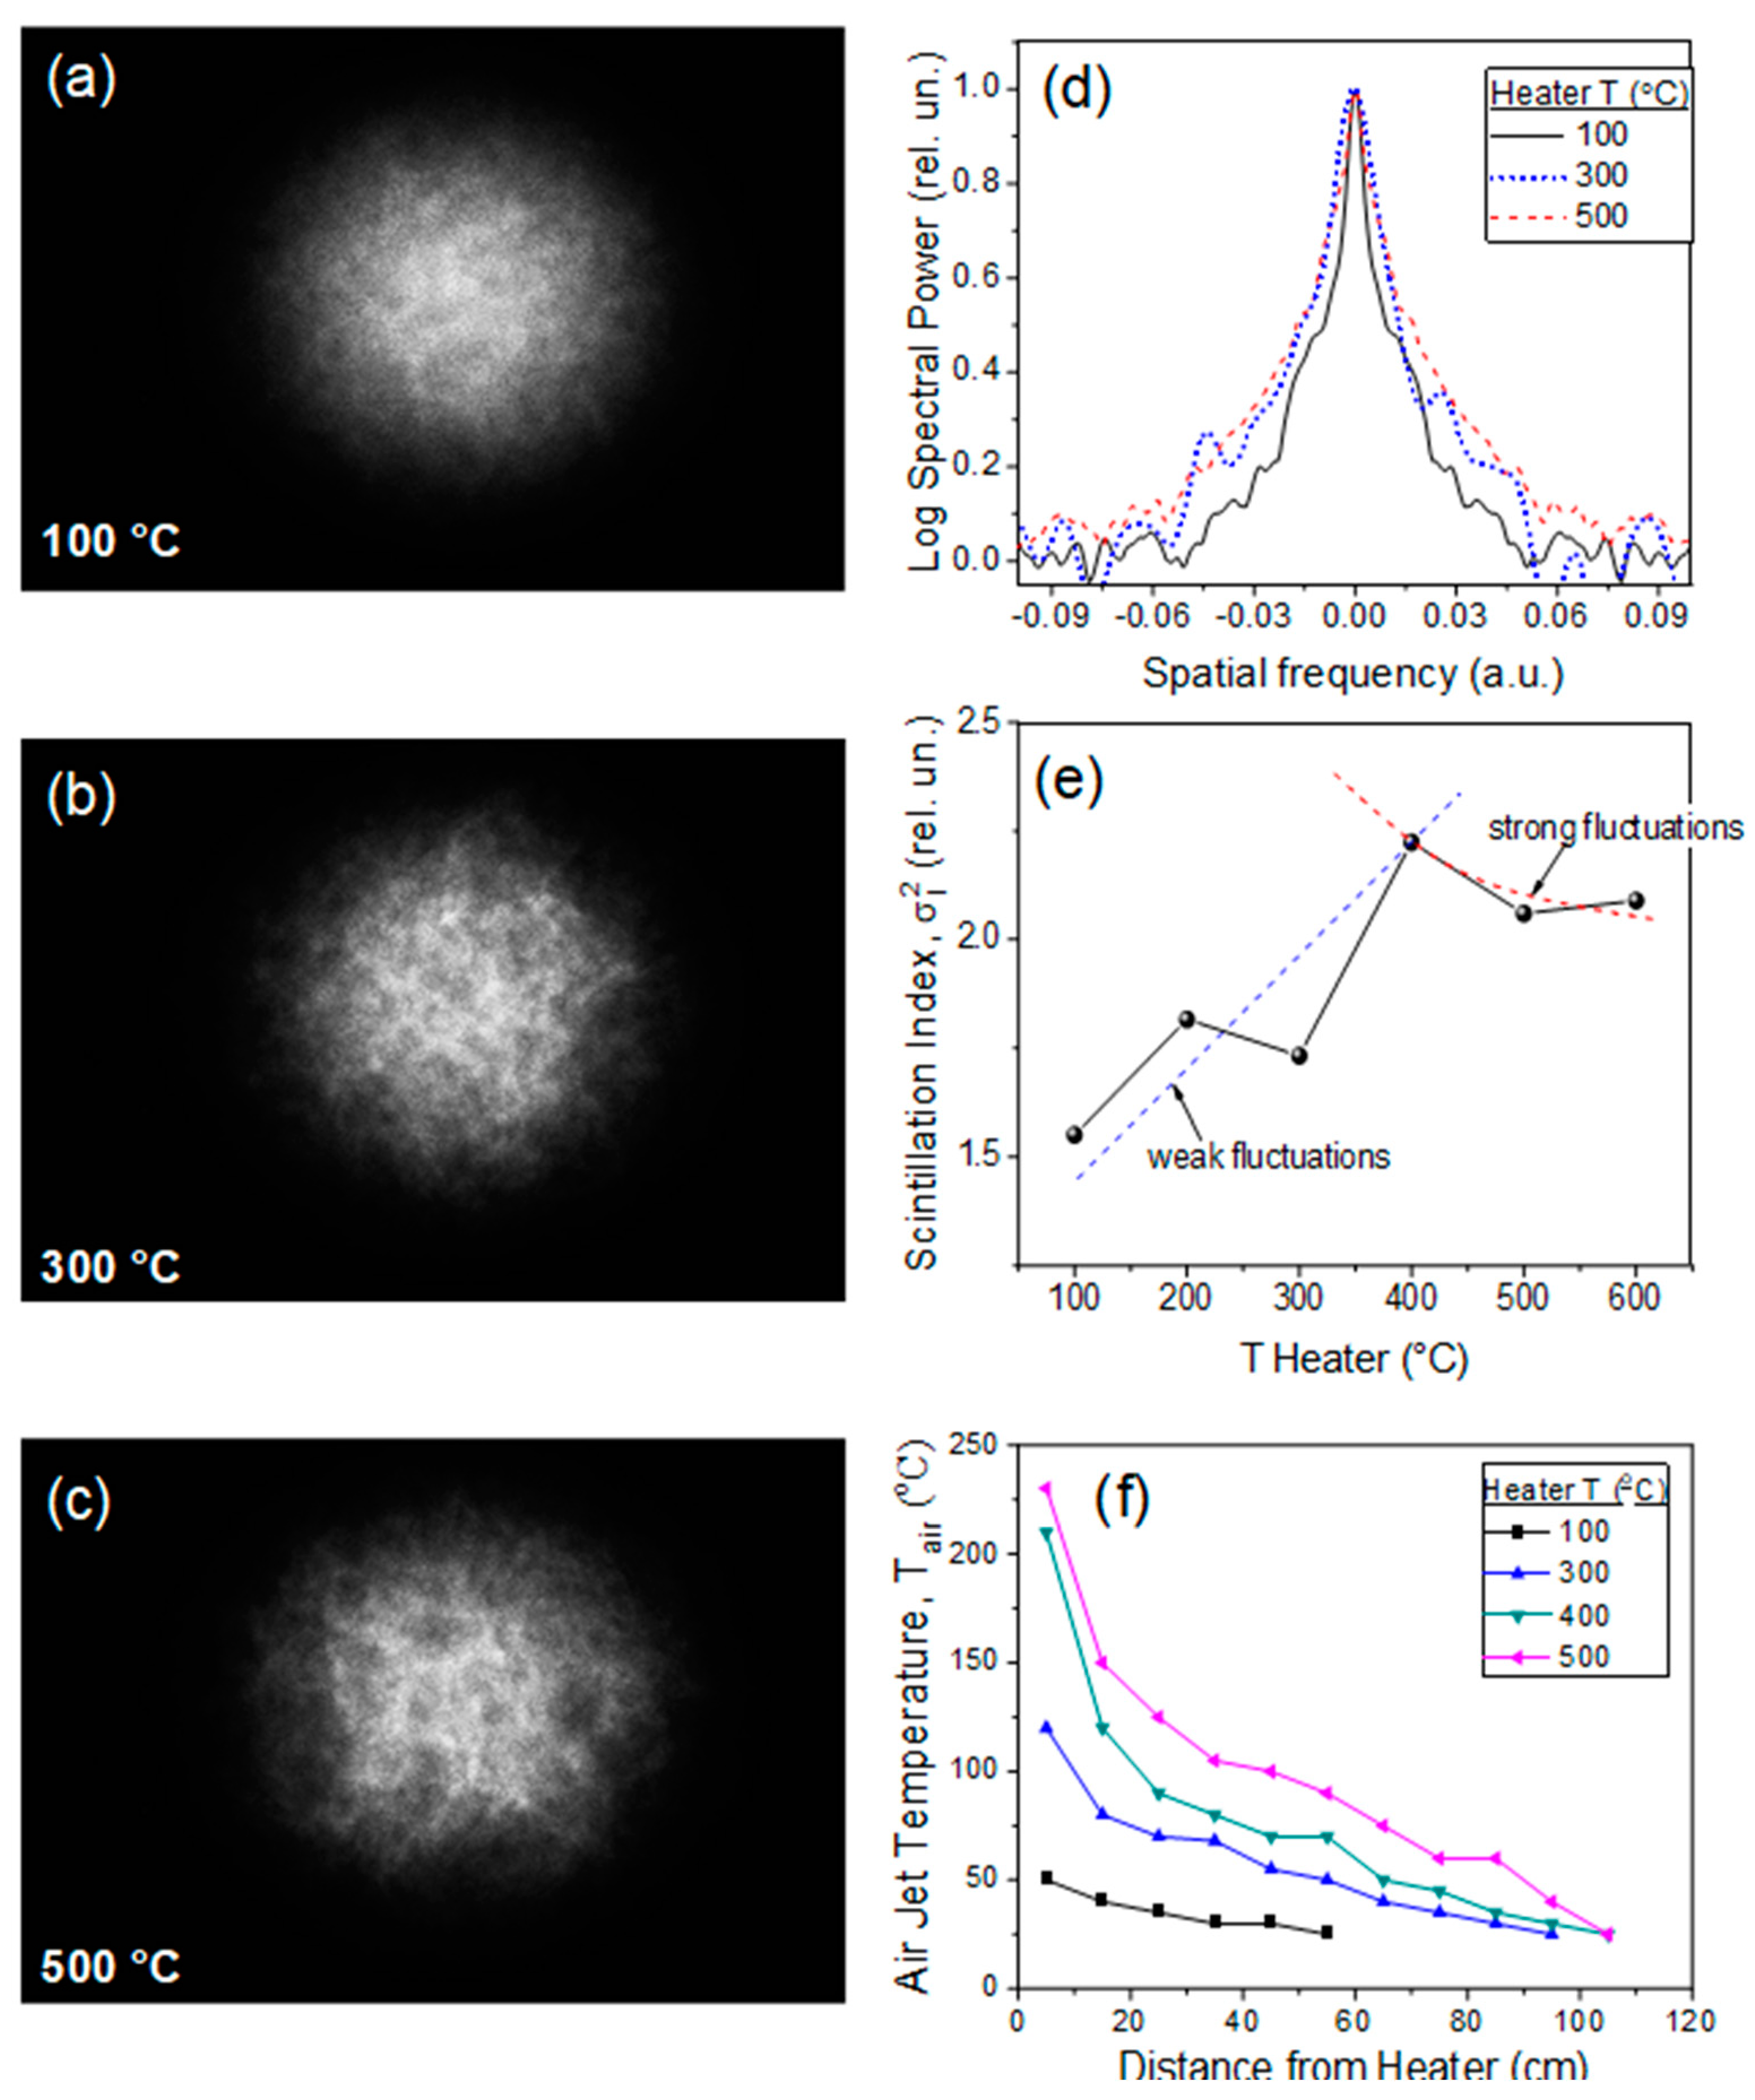
Figure 2c shows the number of intense post-filamentation channels formed in the laser beam as a function of the heater temperature for the laser pulse with an energy of 12 and 35 mJ. As seen, both dependencies on the graph approach certain saturation level at the heater temperature T > 400 °C, which, according to
Figure 3f, corresponds to the air temperature T
air inside the optical beam of about 160 °C. Importantly, neither the characteristic HS intensity nor HS fluence were measured in our experiments. Practically, HS intensity is impossible to measure because of the ultrashort pulse duration. HS fluence can be assessed from the beam profile images similar to
Figure 2a,b as several times lower than that for a Gaussian beam in a calm atmosphere. It is worth noting that placing the turbulent layer in the optical path causes a more than 10-fold increase in the number of intense postfilaments.
Notably, all spatial beam fluence profiles are digitally filtered and post-processed to better emphasize the fluence hot spots. To this end, the raw beam images taken from the digital camera after passing the uranine-doped aerosol are first subjected to background noise subtraction at 1/e2 of the maximal value, then they are filtered using the Butterworth algorithm to cut off high spatial frequencies, and finally, are normalized to the maximum. The HS counting procedure is implemented automatically by the home-made FORTRAN code by binarizing the resulting beam images and applying a standard connected area search algorithm.
For the characterization of optical turbulence in this spatially localized layer, we calculate the turbulence structural function in the framework of the “2/3” law in the Kolmogorov–Obukhov statistical theory. In particular, the structural function, or more specifically, the structural constant of the refractive index
can be measured from the statistics of the probe He–Ne laser beam (wavelength 630 nm) scintillation index
(dispersion of intensity fluctuations) after the propagation through a turbulent layer, considering the Kolmogorov or Karman spatial spectrum [
18]. A standard measurement scheme is used, including a photodetector and a point diaphragm (0.1 mm diameter aperture) aimed at the center of the laser beam with a 2 Hz data accumulation rate. The information collected over a selected time interval (2 min) is then statistically averaged. Examples of probe beam speckle structures are shown in
Figure 3a–c for different temperature regimes of the fan heater.
Figure 3d illustrates the power spectrum of the scintillation index
measured in the central beam area. Obviously, a change in the heater temperature affects not only the temporal statistics of the laser beam intensity pulsations but also its spatial spectrum. In this figure, 1D intensity profiles (along the horizontal axis) are plotted after a test laser beam passes through a turbulent layer created at different heater temperatures. The intensity profiles shown in this figure are pre-processed using a digital spatial filter to cut off the high-frequency noise components. It is clear that the amplitude of low-frequency perturbances increases sharply along with the fan temperature.
The data of
time series statistical processing is summarized in
Figure 3e. As seen, the normalized turbulent intensity pulsations first grow up to the value
≈ 2.25 and then demonstrate a smooth decrease to
= 2.05 with the increasing of the conditional air jet temperature T. The extremum of the scintillation index is observed for T = 400 °C. The character of the obtained dependence points to a certain analogy with the well-known result of Rytov theory for the behavior of the optical wave intensity dispersion in a random inhomogeneous medium [
19]. According to this theory, two asymptotes can be distinguished in the dependence
corresponding to the regimes of a weak,
, and strong turbulence:
.
These asymptotes are plotted in
Figure 3e by dashed lines and are calculated through the least-squares fitting procedure of the measurement data. This allows one to estimate the conditional range of
values, within which the turbulence strength of the fan air jet could change when switching the heater temperature regimes. It turned out that the thermal regime switching from 100 °C to 600 °C conditionally corresponds to the change of structural turbulence constant in the range of 7·10
−9 m
−2/3 ≤
≤ 3·10
−7 m
−2/3. As expected, these values are close to those given in previous similar studies on femtosecond pulse filamentation [
18,
20], but at the same time they are significantly higher than the typical values of atmospheric turbulence, where, as a rule,
≤ 10
−10 m
−2/3.
In the experimental measurements, a fine-dispersed water fog with a modal particle diameter
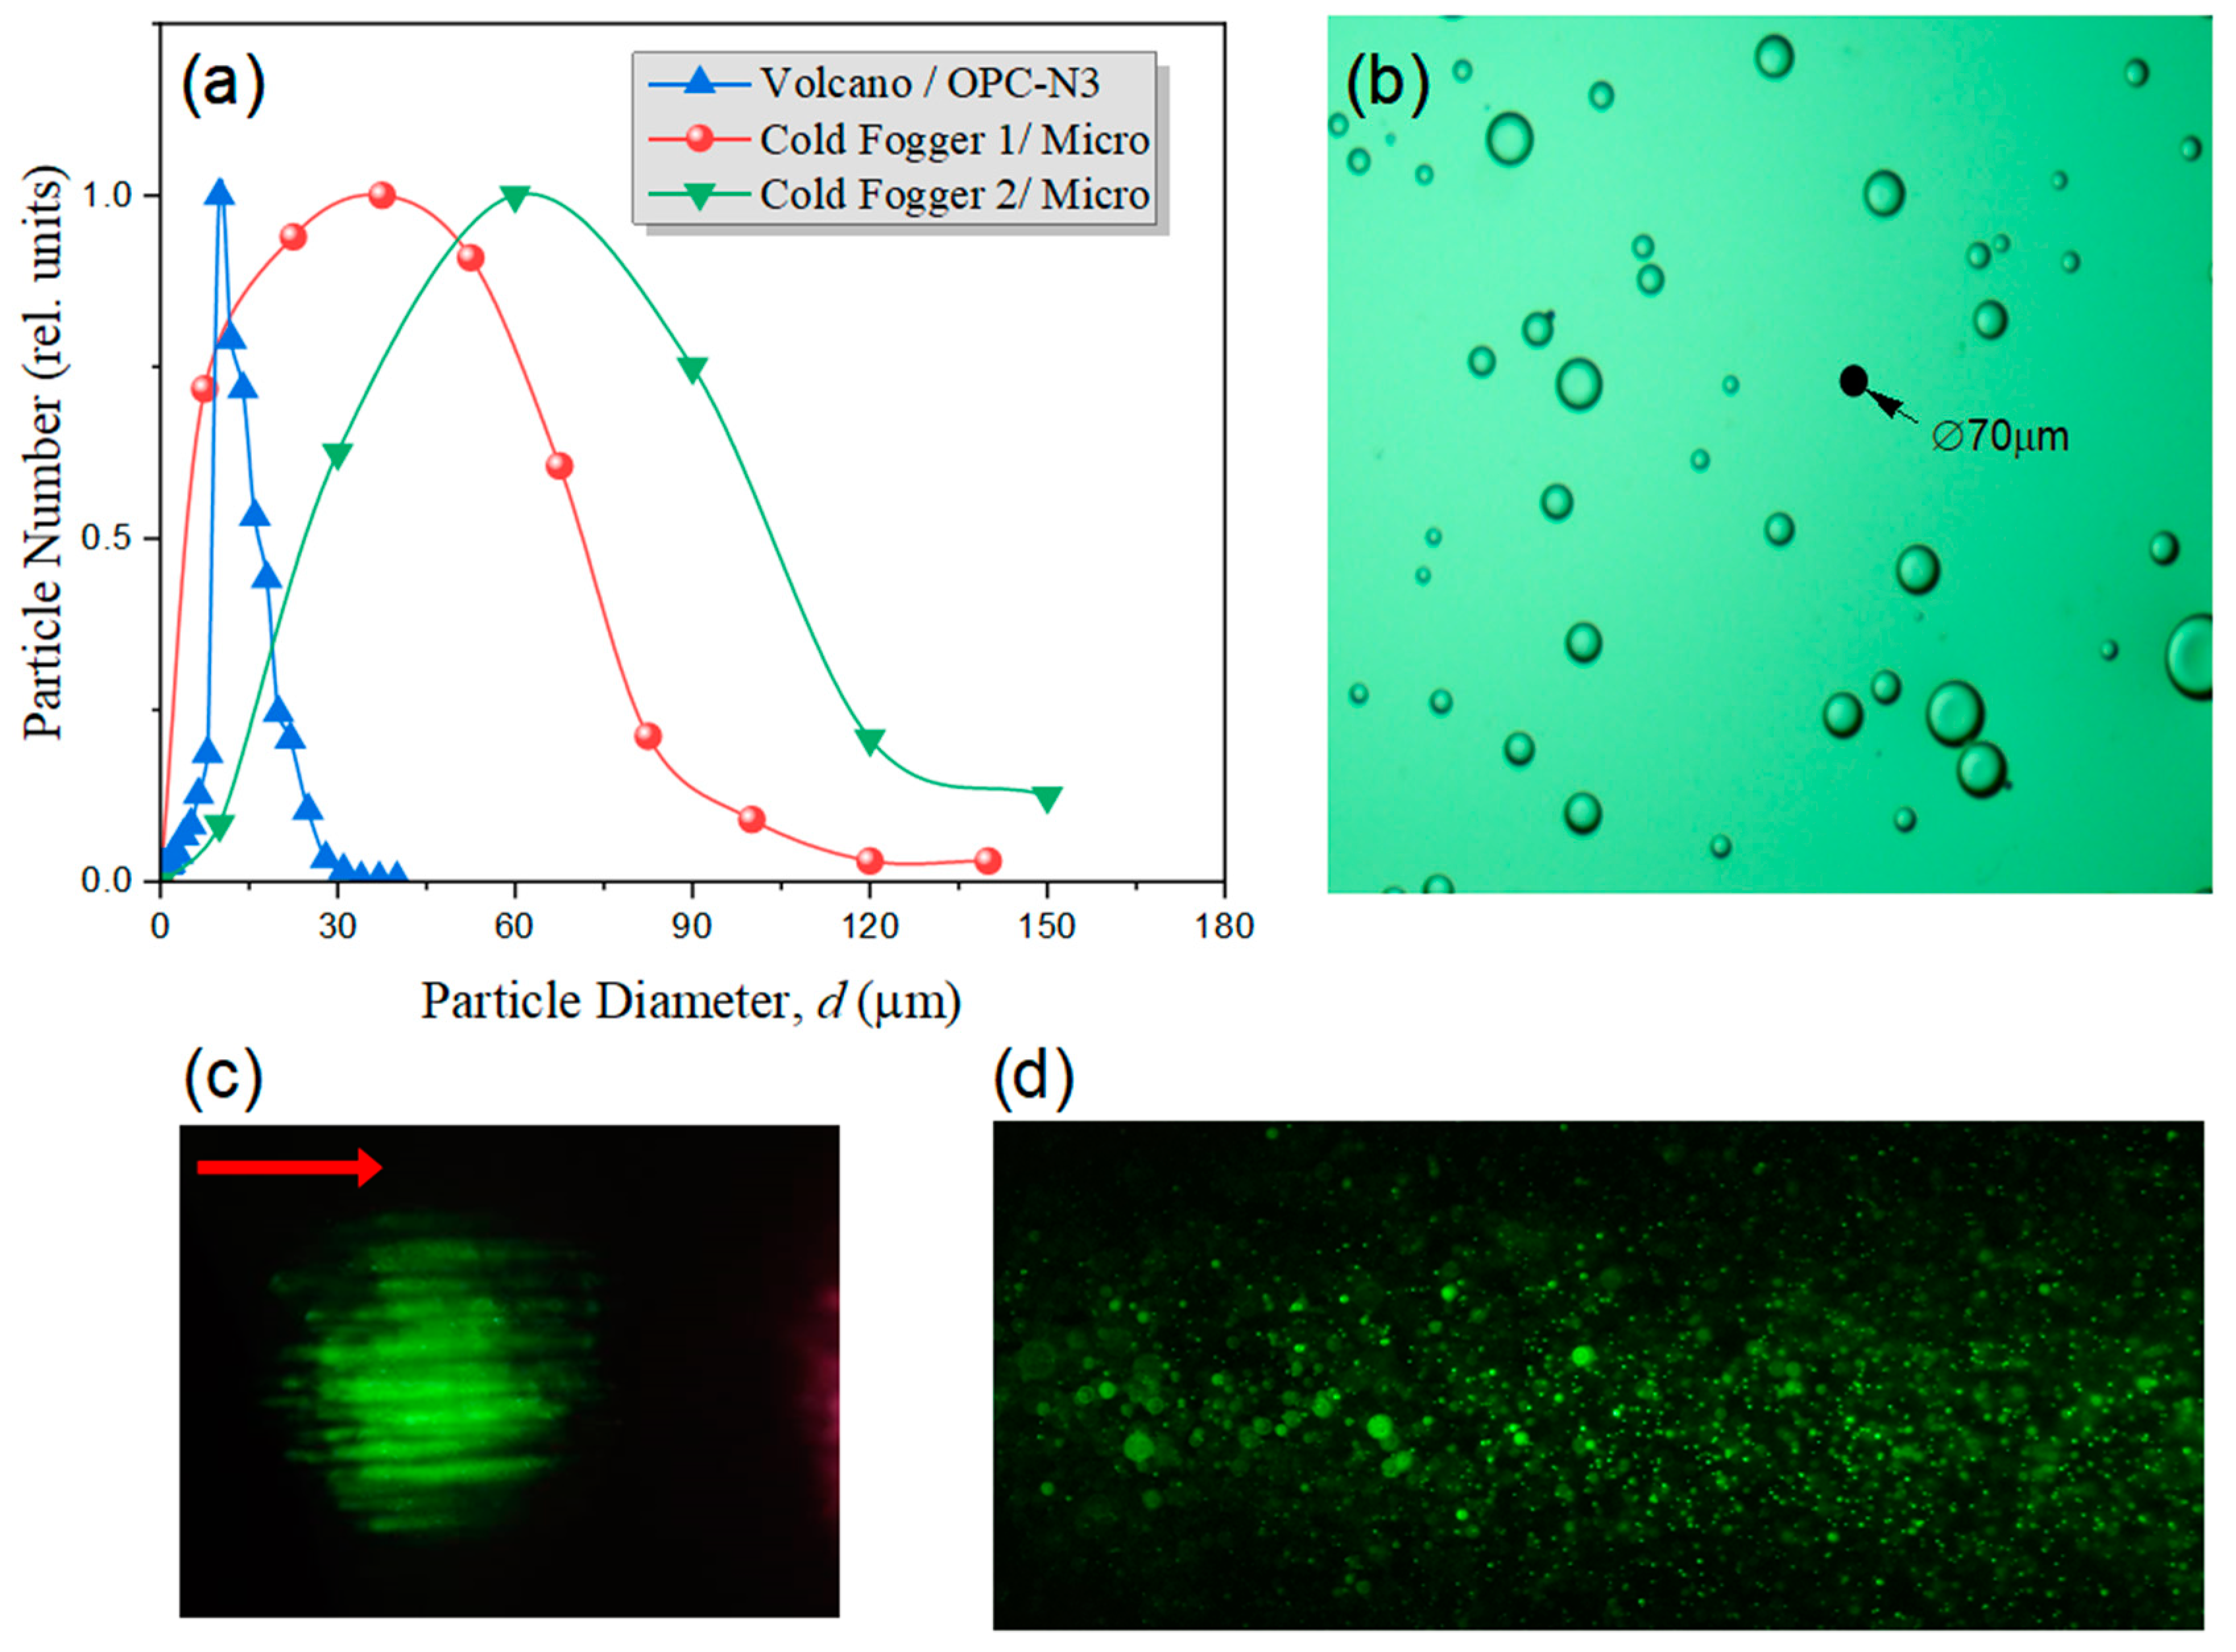
d ≈ 12 μm is produced by the ultrasonic generator Volcano-3. The particle size distribution measured by the optical dust sensor (Alphasense OPC-N3) is presented in
Figure 4. Effective particle concentration
n in a fog is estimated from the measurements of aerosol transparency at the wavelength of a low-power CW He-Ne laser (λ = 632 nm) in the approximation of droplet monodisperse distribution. For this type of water aerosol, the particle concentration is approximately
n ≈ 10
4 cm
−3.
When measuring the angular distribution of aerosol fluorescence intensity, the acquisition time for every angle is 2 min. This includes 15 separate fluorescence spectra accumulated over a time of 8 s for each. The range of angle measurement is from 20° to 170° because of the design limit of the receiving apparatus, which obscures the laser beam for larger and smaller receiving angles. The aerosol generators and the goniometer are mounted on a movable trolley with an optical table located at a distance of 110 m from the laser source. Notably, the test optical path for a laser pulse is mounted in a closed air space located in the corridor of the admirative building with thermostable conditions. A sufficiently long distance between the heated air layer (turbulent screen) and aerosol stream completely avoids their mutual influence.
Another type of liquid aerosol used, a coarse aerosol with modal particle diameter
d = 40 or 60 μm (see
Figure 4a), is created by an atomizing aerosol generator (Cold Fogger SF-720) equipped with two nozzles, respectively. In this case, the particle concentration is approximately two orders lower than for the fine-dispersed aerosol. Importantly, both commercial aerosol generators produce a well spatially bounded and highly directed stream of cold-water particles. To measure the size distribution of particles, they are deposited on a transparent slide with an oil layer and processed using the software of the digital microscope “Mikmed-6 LOMO”. A magnified image of the deposited aerosol is exemplified in
Figure 4b. The images in
Figure 4c,d show fine- and coarse-dispersed aerosol luminescence in visible light excited by an IR femtosecond laser pulse spatially modulated by a turbulent layer.
These images show the green luminescence of dyed aerosol particles when irradiated with near-infrared radiation after the nonlinear propagation of 100 m in air. In addition, the two-photon fluorescence of aerosols is realized mainly in the form of intense channels that are formed within the femtosecond IR beam cross-section.
3. Results and Discussion
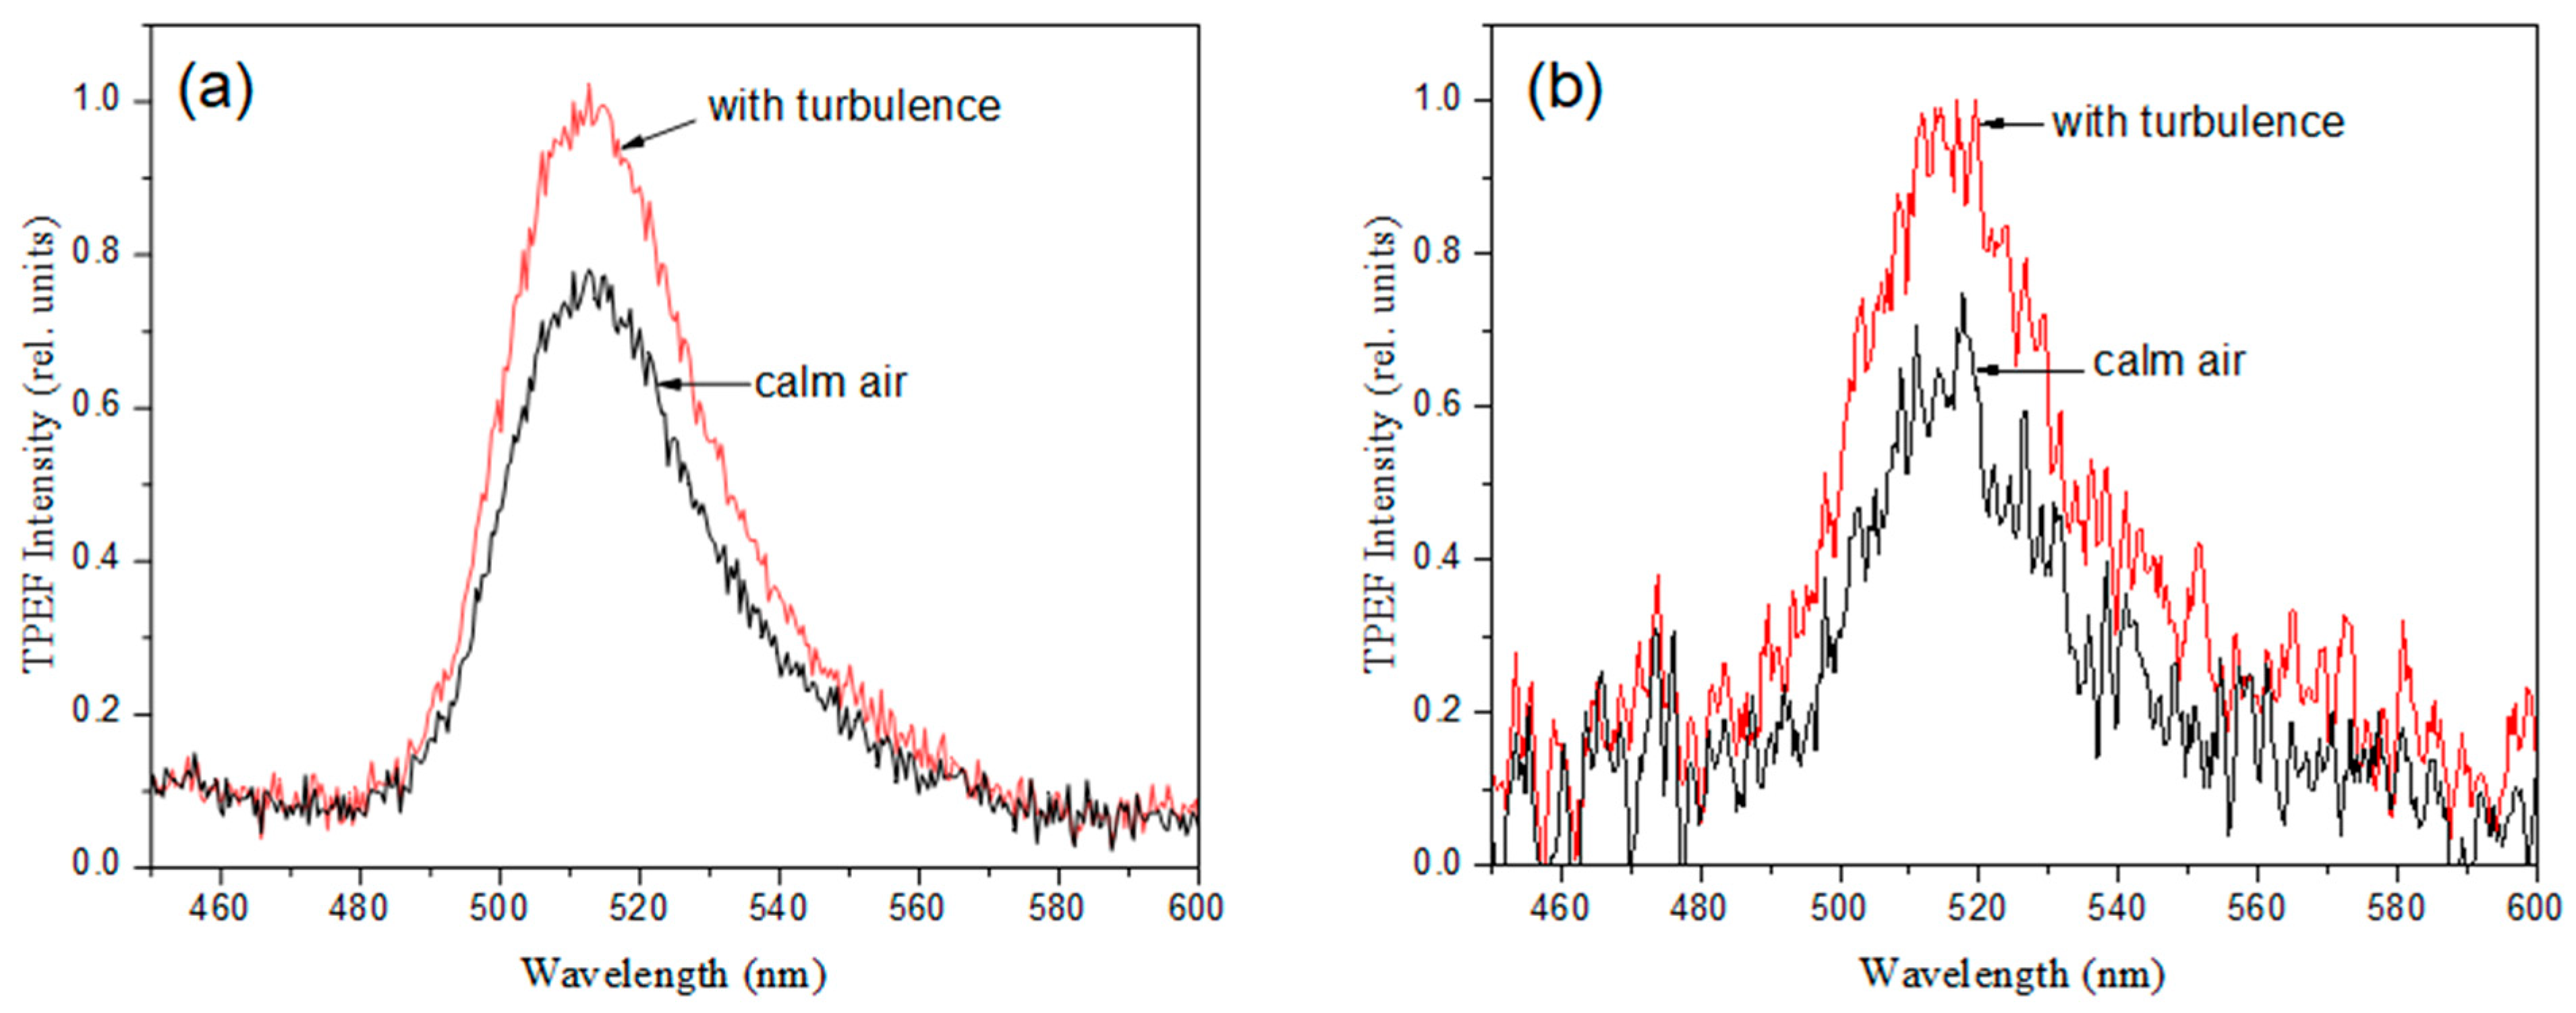
Dyed aerosol fluorescence spectra are presented in
Figure 5a,b for the cases with and without pulse turbulence modulation. Obviously, the installation of a turbulent layer in the optical path of a femtosecond laser pulse causes spatial beam structuring and leads to an increase in the fluorescence intensity of droplets. This is because the spatially structured optical radiation produces significantly more hot spots that almost fully populate the beam cross-section, with numerous light channels interacting with the aerosol jet. Due to this dense postfilament filling, the aerosol volume produces a more intensive fluorescence compared to a conventional Gaussian-profiled beam (i.e., without turbulence modulation) which generates only a few postfilaments (see
Figure 2a). The degree of nonlinear aerosol emission enhancement due to turbulence in the laser beam at the central wavelength, 520 nm, of the uranine fluorescence band is approximately 20% for fine-dispersed aerosols and 30% for larger particles. This circumstance opens prospects for increasing the sensitivity and selectivity of methods for determining small concentrations of substances by femtosecond fluorescence spectroscopy using specially structured laser radiation.
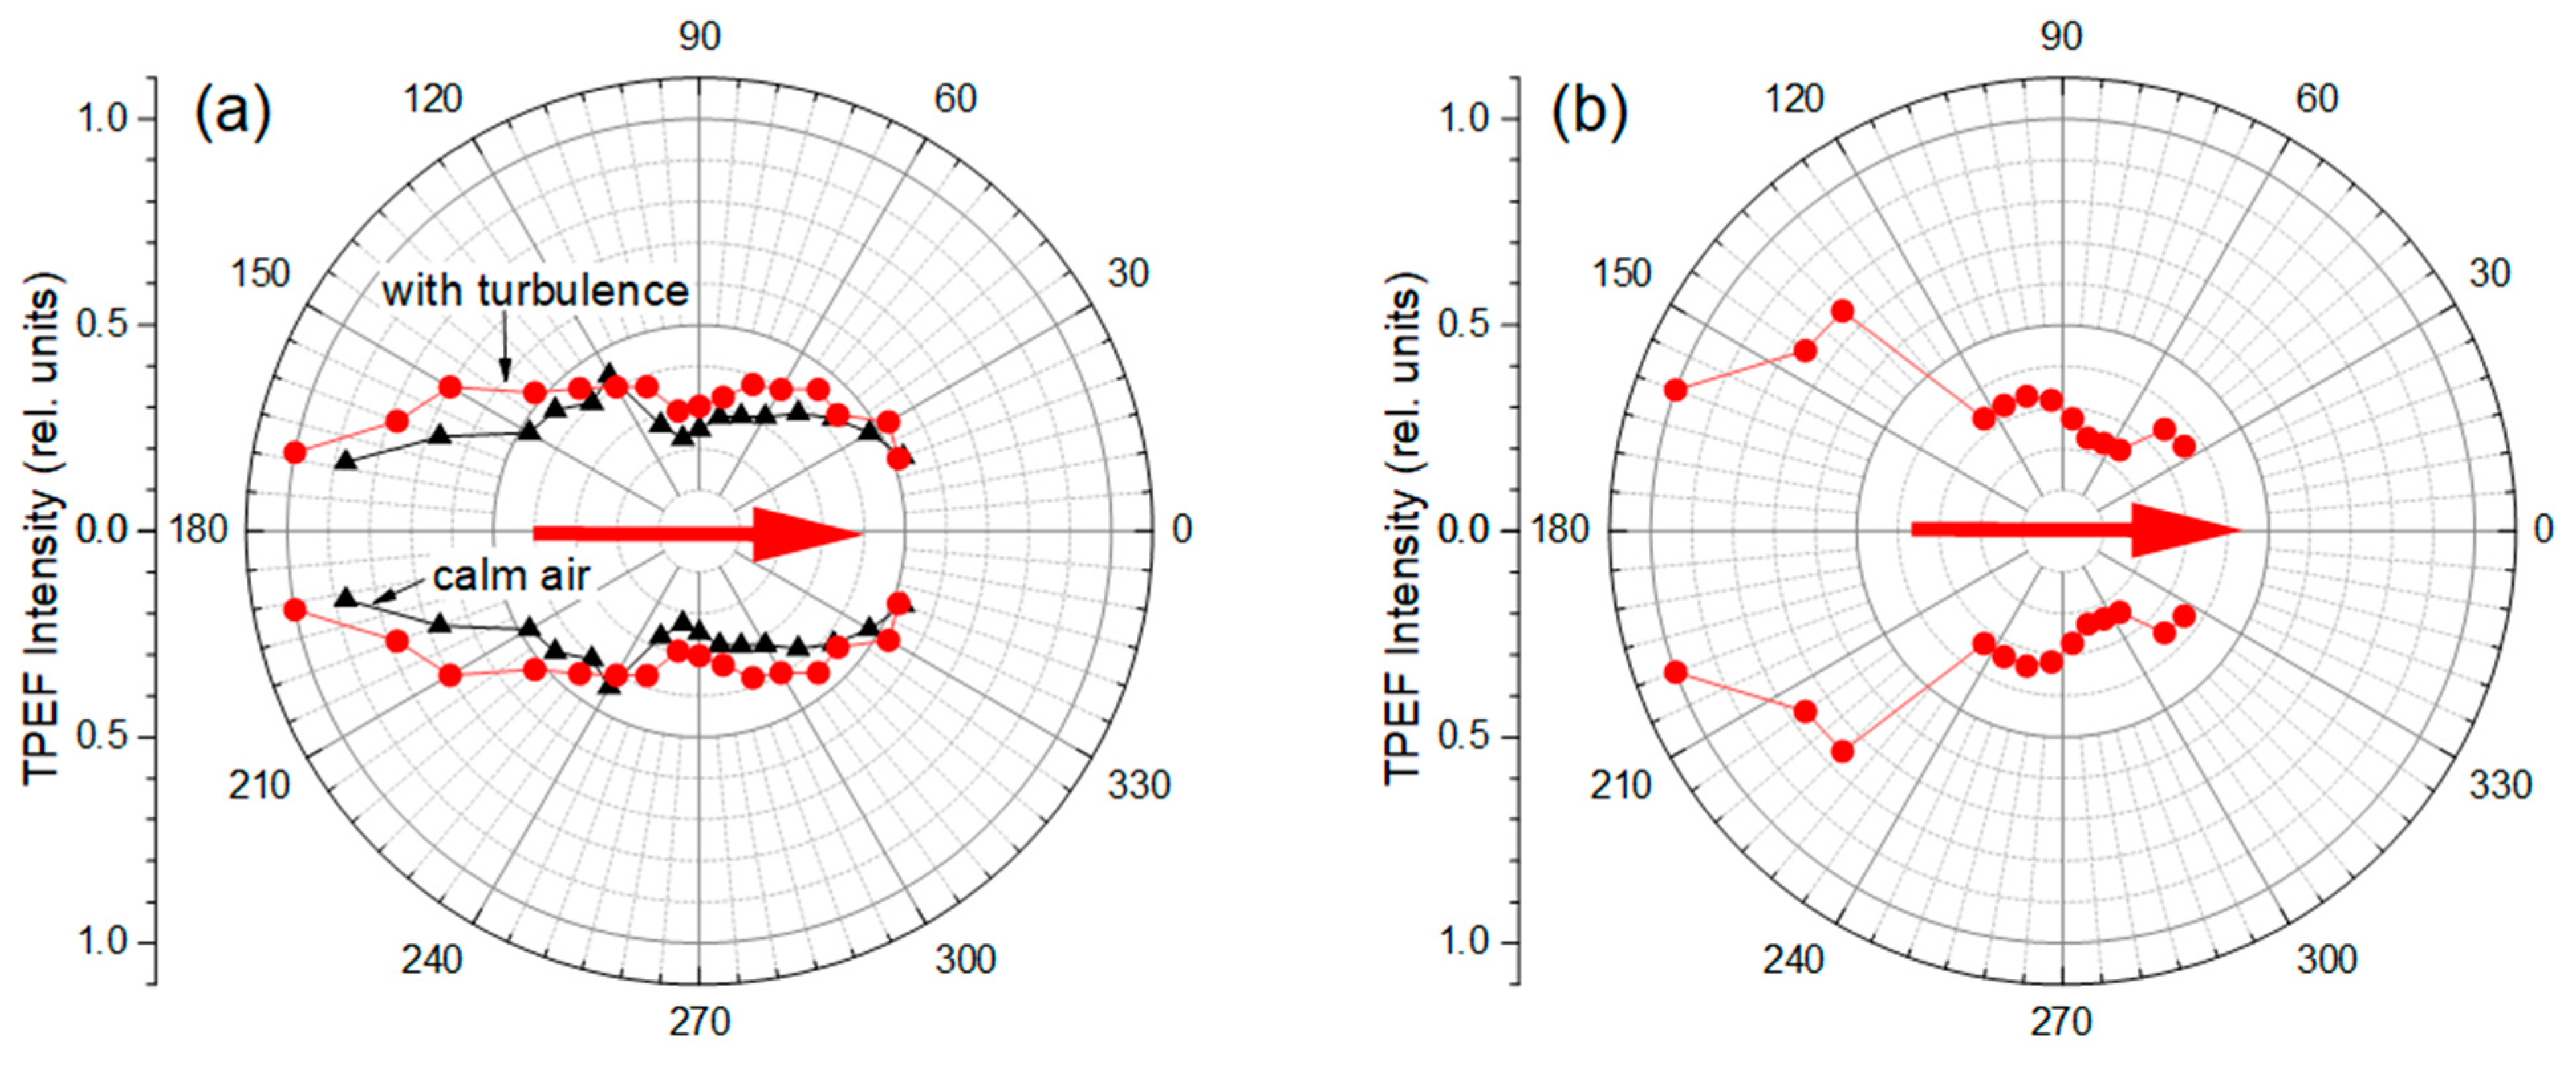
The angular distribution of fluorescence from dyed aqueous droplets is shown in
Figure 6a,b. These data are obtained by the spectral accumulation of aerosol droplet emission for each receiving direction in the whole spectral range of measurements. As seen, in general, the TPEF angle distribution exhibits a quasi-dipole shape with a minimum intensity in the transverse direction, i.e., along the polarization of incident IR optical radiation, and with pronounced asymmetry in the forward-backward directions. The maximum of the two-photon droplet emission is observed in the angular range of approximately 160 to 170 degrees relative to the direction of femtosecond pulse exposure. The measured TPEF angular shape is characteristic both for the fine aerosol (
Figure 6a) and coarse-dispersed particles (
Figure 6b). The degree of forward–backward fluorescence asymmetry reaches about two times for fine-dispersed fog and almost three times for coarse-dispersed fog.
It is worth noting that the dimensionless Mie parameter (ρ = π
d/λ) for the majority of particles in the distributions considered (
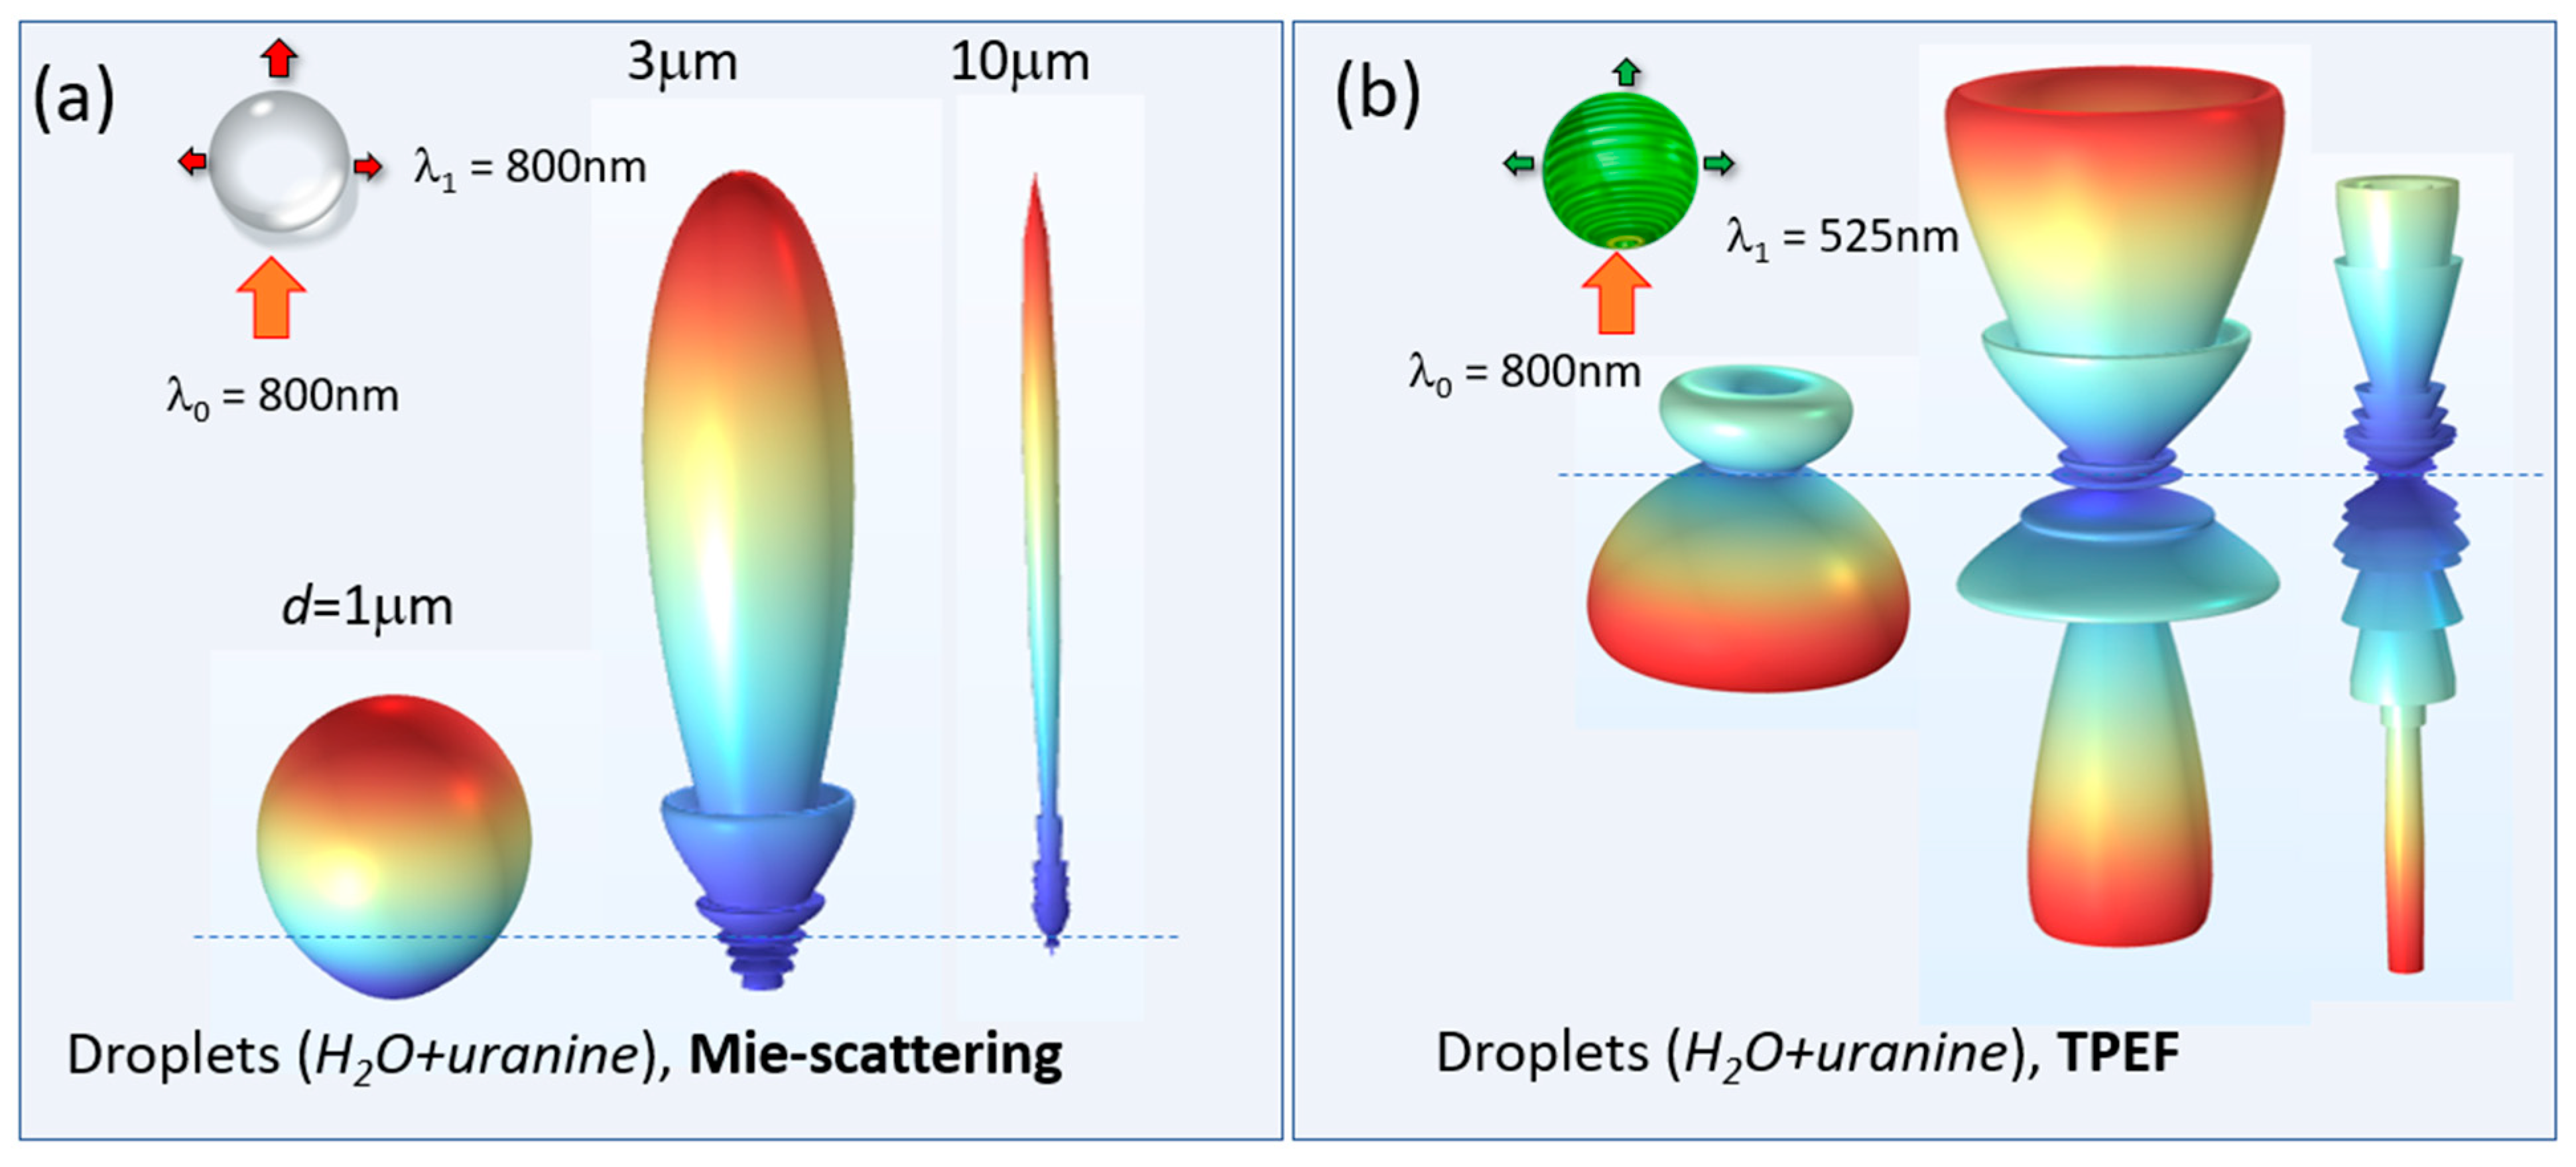
Figure 4a) corresponds to the criterion of an optically large particle (ρ >> 1) at the wavelength of the incident radiation λ = 800 nm, which in the case of elastic optical scattering should lead to a sharp asymmetry of the scattered field with the predominance of forward Mie-scattering. Indeed, our theoretical simulation of Mie-scattering and nonlinear fluorescence of aqueous particles shown in
Figure 7a,b clearly demonstrates fundamental differences in the angular distribution of elastic scattering and the nonlinear TPEF process in dyed water droplets [
21].
This specific feature of dyed-droplet emission stimulated by a high-intensive laser was reported earlier [
8,
21,
22]. Obviously, “secondary” emission arising in a droplet volume (plasma emission, or TPEF) is localized mainly in the vicinity of the internal focuses, and by exiting, the particle experiences multiple refractions and reflections on the spherical liquid-air interface. This causes a nonuniform character in the angular distribution of emission far from the particle (at the receiver area). In addition, the particular shape of the droplet emission phase function is also influenced by the character of the emission mechanism, namely, the multiphoton-order (
m) of the excitation process. As shown [
8], the higher the values of
m, the more forward–backward–directed the angular distribution of nonlinear emission from spherical particles. A qualitative explanation of this effect is given based on the reciprocity principle of light rays emitted by fluorescence sources within a spherical particle [
22].
The theoretical simulation of the nonlinear droplet emission is based on the numerical solution of Equation (1) by means of the finite element method implemented in the COMSOL Multiphysics software package (6.0). Since the emission of photons by a molecule/ion occurs spontaneously, in the numerical model, the emitting dipoles at each point of the particle are generally not correlated either in phase or in direction.
During the simulation of spontaneous emission from a spherical particle within the stationary problem formulation, it is assumed that each molecule of matter inside the liquid particle behaves as a dipole that first absorbs some energy fraction of optical field E
i(r) incident on the aerosol particle at the wavelength λ
0 and then spontaneously emits a quantum of light at the shifted wavelength λ
1. Clearly, by neglecting the non-radiative relaxation mechanisms, the rate γ
d of spontaneous emission of a dipole (dipole transition probability) is proportional to the scalar product of the dipole moment of the corresponding transition p
d and the local field strength E
i raised to power
m:
where
m is the number of simultaneously absorbed optical field quanta.
Following the considerations of ref. [
21], the equation describing the spontaneous fluorescence from a spherical particle is the inhomogeneous Helmholtz equation, which is solved within the stationary problem formulation:
Here,
k0 is the wave number in free space, ε
1 is medium permittivity, and the polarization source P
1 depends randomly on the radiating dipole spatial position
:
where we use the notation
for the optical intensity,
, and
denotes a randomly oriented unit vector of the dipole (
). Obviously, the rate of energy exchange of the optical field with a dipole in a unit volume of matter for the case of two-photon absorption (
m = 2) depends on the square of the pumping intensity
Ii:
.
In the simulations, the statistics on the droplet emission are gathered by setting different (usually a hundred variants) spatial distributions of dipole moments inside a particle with random dipole moment directions
. For each of these variants, the solution to problem (1)–(2) is carried out separately. All the calculation series are eventually averaged over the spatial coordinates, and the resulting angular distribution of the nonlinear droplet emission is obtained in the far-field region by using Stratton–Chu integrals [
23].
Recalling
Figure 7, one can see that with increasing particle radius, the angular distribution of the Mie-scattering is noticeably elongated in the forward direction, i.e., toward the value of 0°, while in the case of TPEF, the angular distribution, on the contrary, deforms in the opposite direction, i.e., has a maximum in the direction toward the laser incidence as in the experiments. Interestingly, in the transverse direction, both types of optical droplet emission show a decrease in intensity.
