Article

Interannual Fluctuations and Their Low-Frequency Modulation of Summertime Heavy Daily Rainfall Potential in Western Japan

by
Takashi Mochizuki
Department of Earth and Planetary Sciences, Kyushu University, Fukuoka 819-0395, Japan
Atmosphere 2024, 15(7), 814; https://doi.org/10.3390/atmos15070814
Submission received: 30 April 2024 / Revised: 22 June 2024 / Accepted: 2 July 2024 / Published: 7 July 2024

Abstract

:
Heavy rainfall under the conditions of the changing climate has recently garnered considerable attention. The statistics on heavy daily rainfall offer vital information for assessing present and future extreme events and for clarifying the impacts of global climate variability and change, working to form a favorable background. By analyzing a set of large-ensemble simulations using a global atmospheric model, this study demonstrated that two different physical processes in global climate variability control the interannual fluctuations in the 99th- and 90th-percentile values of summertime daily rainfall (i.e., the potential amounts) on Kyushu Island in western Japan. The 90th-percentile values were closely related to large-scale horizontal moisture transport anomalies due to changes in the subtropical high in the northwestern Pacific, which was usually accompanied by basin-scale warming in the Indian Ocean subsequent to the wintertime El Niño events. The contributions of the sea surface temperatures over the northern Indian Ocean and the eastern tropical Pacific Ocean showed low-frequency modulations, mainly due to the influences of the global warming tendency and the interdecadal variability in the climate system, respectively. In contrast, tropical cyclone activity played a major role in changing the 99th-percentile value. The potentials of both the tropical cyclone intensity and the existence density fluctuated, largely owing to the summertime sea surface temperature over the tropical Pacific, which can be modulated by the El Niño diversity on interdecadal timescales.

1. Introduction

Heavy rainfall has recently garnered considerable attention due to changing climatic conditions. To assess the risk of heavy rainfall, reliable predictions of future climate change are required on a global scale to provide a realistic background of regional phenomena, in addition to on regional and local scales to represent individual phenomena. Annual to interdecadal climate variability is one of the most pressing background challenges and one of the major research foci in the Coupled Model Intercomparison Project (CMIP) [1,2,3]. To date, predictive skills for global climate variability have been realized [4,5,6,7,8], in addition to basin-scale climate modes, for example, in the Atlantic [9,10,11] and Pacific [12,13]. Furthermore, specifically for summertime rainfall in East Asia (i.e., a seasonal mean state), predictive skills have been verified on interannual timescales [14,15]. Notably, the primary targets of these prediction experiments are usually the seasonal mean rainfall rather than the direct estimation of extreme weather statistics. Beyond the interannual timescales, in particular, the model resolution is usually coarse and insufficient for directly estimating extreme weather statistics, mainly due to the huge computational resources required.
Datasets of large samples and at a fine resolution enable us to directly estimate the probabilistic features of extreme events in a specific region, in addition to the seasonal mean states, and to clarify the impacts of global climate variability on them. Recently, sets of large-ensemble simulations of global atmospheric models driven by observed and/or projected sea surface temperatures (SSTs) have been compiled. For example, the Database for Policy Decision Making for Future Climate Changes (d4PDF) contains sets of 100-member ensemble simulations of a high-resolution global atmospheric model (approximately 60 km in a horizontal grid) driven by the observed SSTs with small perturbations [16], which was also dynamically downscaled to 20 km horizontal resolution data using a regional atmospheric model [17]. Focusing on areas around Japan, the d4PDF dataset has been widely used to evaluate the potential impacts of global warming on high-frequency events such as tropical cyclone activity [18,19] and heavy rainfall and snow events [20,21]. It should be noted that the prescribed SSTs predominantly show slower changes than the atmospheric disturbances and control not the gridded rainfall on a specific day, but the probability of gridded daily rainfall during a specific season. Hereafter, this likelihood of rainfall at a specific location over a defined period (e.g., the summer season) is referred to as rainfall potential.
Based on the above leading edges in the research areas of annual to interdecadal predictions in the CMIP protocol and the probabilistic estimation of the extreme event potential, Mochizuki [22] most recently validated the multi-year potential predictability for the storm activity and wintertime heavy precipitation potential in East Asia by combining the initialized decadal hindcasts of the global climate model with large ensembles of high-resolution atmospheric simulation output. Firstly, they defined the so-called transbasin variability [23,24] as a major predictive component of global SST variability by analyzing a set of initialized hindcasts. Then, they identified the wintertime heavy precipitation potential associated with storm activity in East Asia as a variable closely related to the transbasin variability by using the d4PDF dataset. The statistics on heavy daily rainfall associated with global climate variability and change should offer vital information for realizing the potential predictability. Nevertheless, when this approach is applied to the summer season, a distinct issue emerges due to multiple processes, rather than a singular one, that independently influence the summertime heavy rainfall potential. For example, Kawase et al. [25] and Imada and Kawase [26] recently indicated the contributions of two global climate variabilities to controlling the potential chance of local heavy rainfall events (i.e., the frequency of extreme events in the summer season) in specific areas of Kyushu Island, which has high mountains in its center. Their analyses of the downscaled dataset focused on localized rainfall and, hence, on specific areas such as the east and west of Kyushu Island. They demonstrated that the heavy daily rainfall events in the east and west of Kyushu Island are closely related to changes in the tropical cyclone and subtropical high, respectively. They also indicated that, as a simultaneously simulated global climate state, heavy daily rainfall events in the eastern and western areas are possibly linked to the central Pacific El Niño Southern Oscillation (CP-ENSO) [27,28,29] and the occurrence of basin-scale warming in the Indian Ocean [30,31], respectively.
Therefore, aiming to contribute to the above predictive utility for extreme weather event statistics, this study enhances our understanding of the probabilistic relationship between global SST fluctuations and the summertime heavy daily rainfall potential in greater detail. As significant focuses, this study specifically concentrated on the summertime heavy rainfall potential on Kyushu Island in western Japan as a target area, where heavy daily rainfall is observed in summer (Figure 1A), and the direct clarification of the contribution of the global SST variability, since the rainfall potential was estimated by the d4PDF as a global model simulation output driven by the observed SST. The d4PDF dataset enabled us to evaluate the SST-driven interannual variability in the probability of extreme events without using the downscaling technique [32].
Note that, in contrast with some estimation methods of the potential chance of heavy rainfall presented in previous studies [25,26], this study assessed the interannual fluctuations in the potential amount of heavy daily rainfall (i.e., the intensity of extreme events in the summer season). Since the shape of the probability density function of daily rainfall in a large-ensemble simulation is not rectangular, logically speaking, the potential chance can be expected to represent highly asymmetric deviations corresponding to increasing and decreasing shifts of the seasonal mean value, as discussed in the Section 4 below. This study estimated the percentile values (i.e., the rainfall amount potential) of the summertime daily rainfall on Kyushu Island to examine potential fluctuations in the shape of the probability density function using the d4PDF dataset and clarified the dominant processes responsible for the interannual variability in relation to the global climate variability, working to form a favorable background.
In addition, this study explored possible low-frequency modulation, particularly in the spatiotemporal structures of the influential SST anomalies, on the heavy rainfall potential estimated by the d4PDF, because the relationship between the global SST variability and the heavy rainfall potential can modulate beyond the decadal timescale. Based on the seasonal mean rainfall amounts derived from rain-gauge observations, for example, Fujiwara and Kawamura [33] recently found an increasing tendency for the amplitude of interannual fluctuations in the summertime rainfall on Kyushu Island in relation to the basin-scale warming in the Indian Ocean, although their focus was not directed at the heavy rainfall potential estimated by a set of large-ensemble simulations, unlike this study. Some studies have indicated that the subtropical high [34] and tropical cyclone activity [35] in the northwestern Pacific can contribute to decadal fluctuations in the summertime mean rainfall in East Asia.
The remainder of this paper is organized as follows. Section 2 describes the data used in this study. Section 3.1 defines the interannual variations in the heavy daily rainfall potential by using the percentile values of large samples and clarifying the dominant processes responsible for the interannual variability, forming favorable backgrounds. In Section 3.2, the seasonal evolution of the SST anomalies that control the heavy daily rainfall and their low-frequency modulation are discussed. Some issues, such as the signal–noise ratio, are discussed in Section 4. The conclusions are presented in Section 5.

2. Materials and Methods

2.1. Datasets

This study analyzed 100-member ensembles of the d4PDF dataset covering the period from 1981 to 2010, during which the SST data were available for simulation and evaluation with a relatively high reliability [36,37] and the gauge-based daily precipitation observation data were available for validation with a high quality, particularly in Japan, due to the Automated Meteorological Data Acquisition System (AMeDAS) operated by the Japan Meteorological Agency. The d4PDF dataset was compiled as a set of 60-year-long (1951–2010), 100-member ensemble simulations of a high-resolution global atmospheric model (approximately 60 km in a horizontal grid) [16]. As described by Mizuta et al. [16], ensembles of the initial conditions of the atmospheric variables were taken from snapshots of the so-called historical simulation performed by themselves in the CMIP. As the boundary condition, the objective analysis of SST data, cobe-sst2 [36,37], was used with small perturbations toward obtaining a sufficiently large ensemble spread as a coupled climate system, even in atmospheric model simulations. The temporal evolutions of the concentrations of greenhouse gases, aerosols, and ozone were given as boundary conditions based on the observations.
To validate the interannual variations in the rainfall potential, this study used gauge-based daily precipitation observations with a 0.5-degree resolution taken from the NOAA Climate Prediction Center (CPC) global unified gauge-based daily precipitation dataset [38,39].
In addition to daily precipitation for calculating the 99th- and 90th-percentile daily rainfall values at each grid point of the 60 km resolution version, this study analyzed the monthly means of atmospheric variables in the d4PDF dataset to clarify the controlling climate processes. The objective analysis of the SST data, cobe-sst2 [36,37], was also used to discuss the potential contribution of global-scale interannual SST variability.
This study also analyzed tropical cyclone track data [40] based on the 60 km version of the d4PDF dataset to evaluate the contribution of tropical cyclone activity to the heavy rainfall potential. Using information related to the location of the simulated tropical cyclone center, this study calculated the track density at each grid point. This dataset also contains the values of the maximum wind speed and sea level pressure of the tropical cyclone center for each tropical cyclone, meaning that this study could estimate the tropical cyclone intensity. Since the method to identify the tropical cyclone was well tuned, for example, the time series of the number of tropical cyclone geneses in the western North Pacific were in good agreement with the observations [40].

2.2. Methods

To define the major characteristics of the heavy daily rainfall potential, this study calculated the 99th- and 90th-percentile daily rainfall values at each grid point of the 60 km resolution version for each summer (June–August). These percentile values were defined from 9200 samples in summer, as this study used the daily output of 100 ensembles from June to August (92 days). This study estimated the 99th- and 90th-percentile values of daily heavy rainfall averaged over Kyushu Island (31° N–34° N and 129° E–132° E), which can be considered the heaviest rainfall amount and the heavy rainfall amount observed several times in a specific summer in a statistical sense, respectively. While these thresholds are commonly used values in statistical analyses, they consequently represent two different processes controlling the heavy rainfall potential on Kyushu Island, as described below.
On Kyushu Island in western Japan, whose size is zonally almost 250 km and meridionally approximately 350 km (Figure 1A), the CPC gauge-based daily rainfall data show a large standard deviation in July, suggesting that a heavy rainfall event can take place with a higher possibility than in other areas. The spatial resolution of the dataset imposes a limitation in representing phenomena, as discussed in the Section 4 below. The 60 km resolution in d4PDF, equivalent to a 0.5-degree resolution in CPC gauge-based data, does not fully represent the local structures (e.g., cloud cells, meso-gamma-scale convection) of the heavy rainfall and the influences of the complicated topography. Nevertheless, heavier rainfall along the coastline (e.g., particularly along the southern coast of Japan) and the influences of the mountain chain are well simulated, as observed (Figure 1B).
The heavy daily rainfall potentials for each summer, as described above, represent the interannual variability in the 99th- and 90th-percentile values for Kyushu Island, P(i), where i represents the year number for the period between 1981 and 2010 (i.e., i = 1, 2, …, 30). To discuss physical processes controlling the interannual variability by clarifying the spatiotemporal variations in other related physical variables (e.g., atmospheric variables, the SST, and the 99th- and 90th-percentile values in other areas), X(x,y,i), this study calculated the correlation coefficients at each grid point as
corr (x,y) = cov(X,P)/[std(X) std(P)],
and the linear regression coefficients as
regr (x,y) = cov(X,P)/cov(P,P),
where cov and std denote the covariance and standard deviation, respectively. Note that the physical variables, X(x,y,i), are not only the seasonal mean states that provide favorable backgrounds, but also the statistical values for tropical cyclones. In addition, correlations with the heavy rainfall amounts of the CPC gauge-based observation, rather than those derived from the d4PDF simulation, can offer valuable insights for validation.
The relationship between the global SST variability and the 99th- and 90th-percentile values independently estimated for each summer can possibly show temporal modulation beyond the timescale of a decade (hereafter referred to as low-frequency modulation for convenience). In addition to the static relationship during the period of 1981–2010, this study discussed possible temporal modulation by comparing interannual fluctuations in the heavy daily rainfall and the related physical variables between the early and recent periods of the analysis period (1981–2010). The differences may be due to the contributions of the rising tendency of the SST as well as the interdecadal variability and represent the modulation of the interannual relationship between the global SST variability and the heavy rainfall potential. This study explored low-frequency modulation by applying an envelope approach. For all physical variables X(i), where i represents the year number for the period between 1981 and 2010 (i.e., i = 1, 2, …, 30), this study applied low-frequency envelopes with cosine and sine functions of a period of 120 years as
Xc (i) = cos (π/2 ∗ i/30) X(i)
and
Xs (i) = sin (π/2 ∗ i/30) X(i),
respectively. Consequently, for the analysis period over 30 years (i.e., 1981–2010), the estimated time series Xc and Xs were weighted toward the early and recent periods, respectively. This envelope approach, without reducing the number of samples, should provide great insights into illustrating the low-frequency modulation of the influential SST patterns on the heavy daily rainfall potential on Kyushu Island.

3. Results

3.1. Interannual Fluctuations in Heavy Daily Rainfall Potential

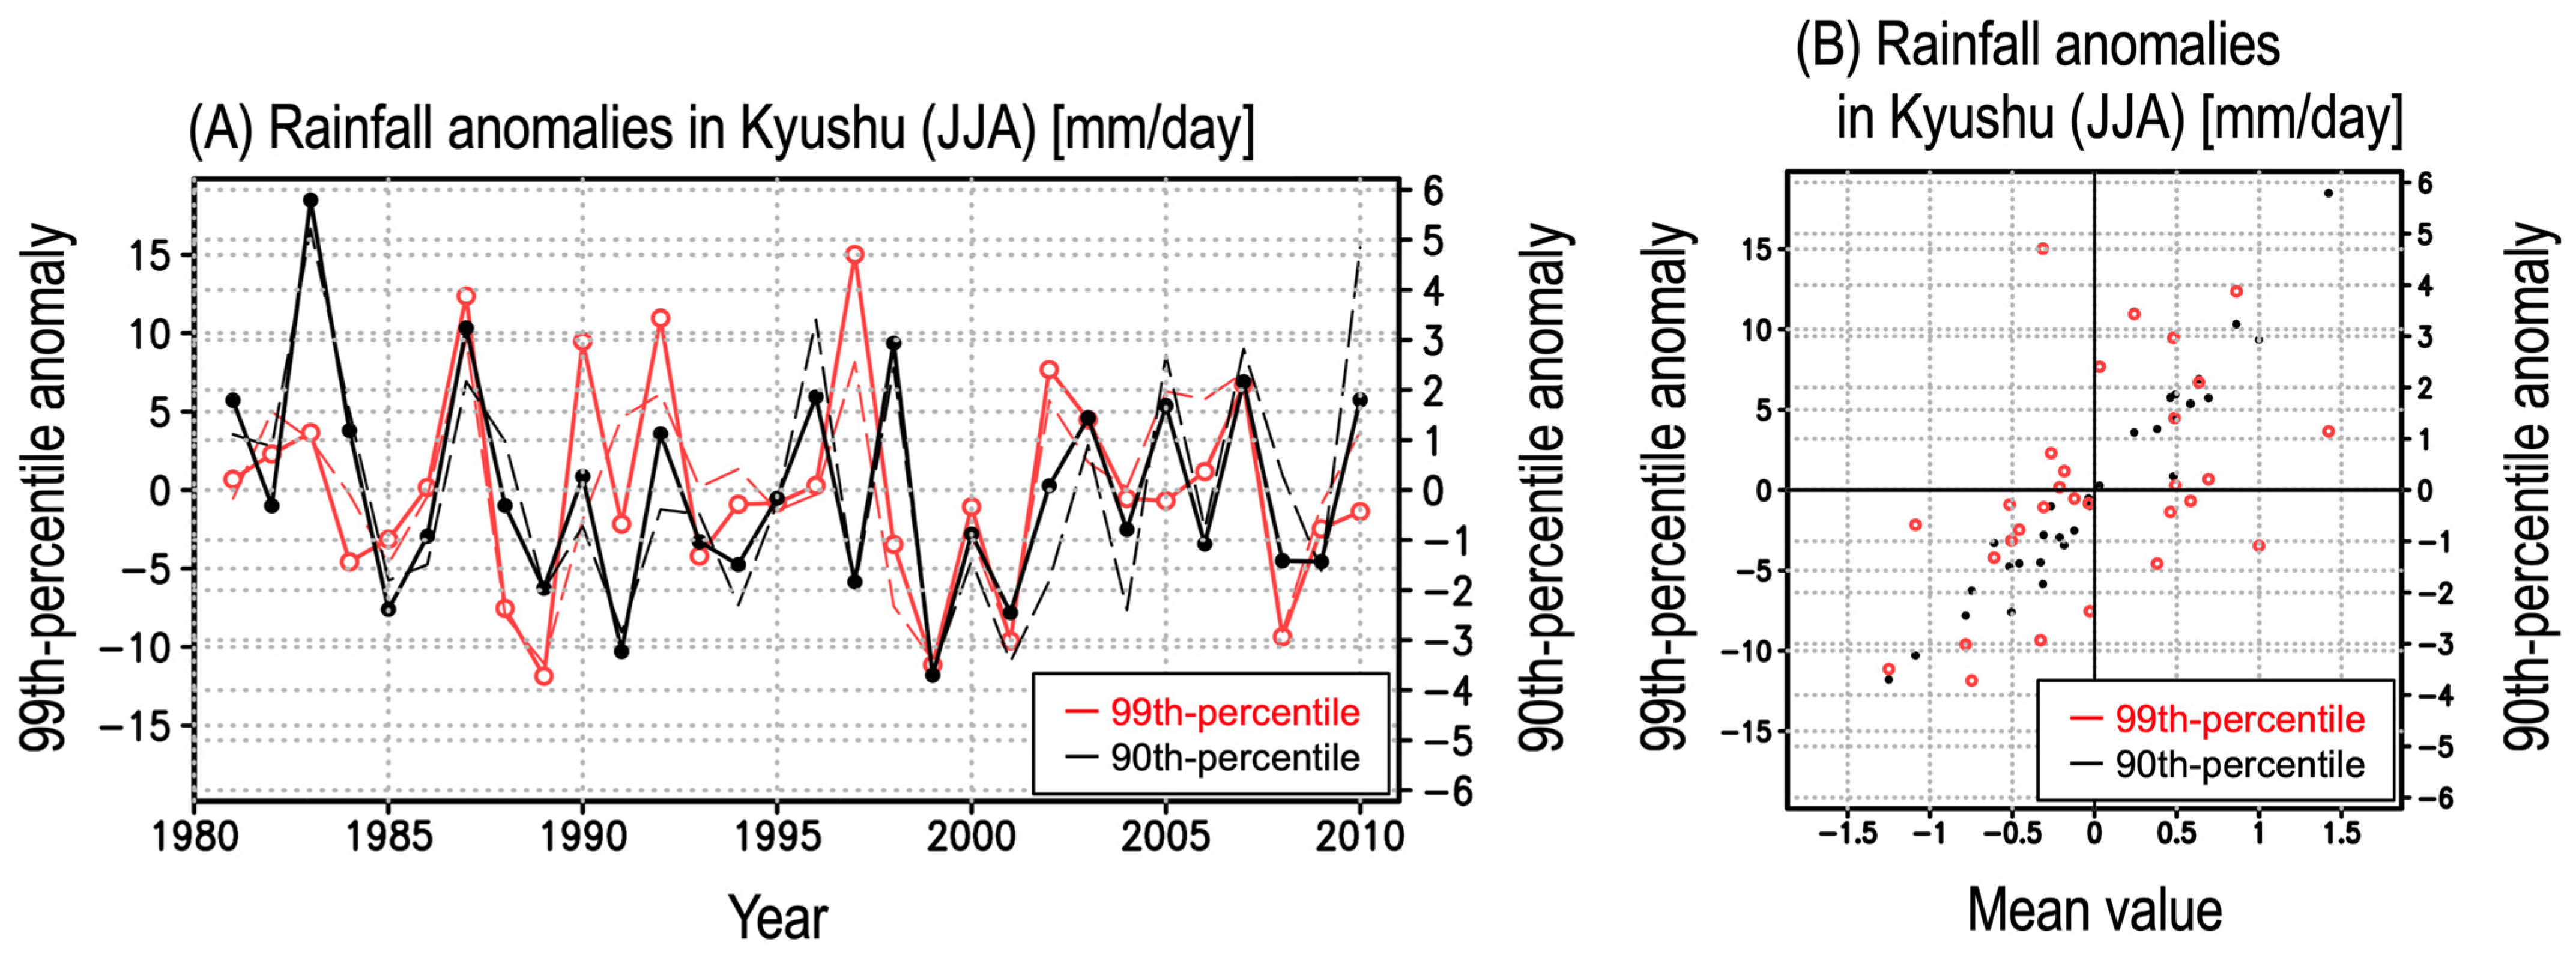
The 99th- and 90th-percentile values of daily rainfall showed similar interannual fluctuations (red and black solid lines in Figure 2A) (correlation coefficient: 0.436). These interannual fluctuations reflect the probability density function of daily rainfall in each summer. In addition to these two percentile values, the seasonal mean value is a commonly used indicator characterizing the probability density function. As shown in Figure 2B, this study checked the similarity of the anomalies in the interannual fluctuations between the mean value and the percentile values. When compared to the seasonal mean value of the daily rainfall (Figure 2B), the 90th-percentile value showed almost the same fluctuation (correlation coefficient: 0.971). In contrast, the 99th-percentile value fluctuation, corresponding to the changes in the tail of the probability density function, showed relatively large uncertainties (correlation coefficient: 0.492), suggesting that the interannual variations in the 99th- and 90th-percentile values can be different when governing physical processes rather than only the amplitude.
Note that another subset of d4PDF, which was compiled using the pseudo-observed SST with the warming tendency due to anthropogenic forcing being removed (i.e., the so-called NAT simulation), represents similar interannual fluctuations for both the 99th- and 90th-percentile values (broken lines in Figure 2A) (the correlation coefficients of the 99th- and 90th-percentile values between the two datasets were 0.818 and 0.887, respectively). Since the differences between the two datasets were limited to an insignificant level, even in linear trends, the global warming tendency only had a slight direct influence on the interannual fluctuations in the heavy daily rainfall potential.
While the 99th- and 90th-percentile values showed similar time series (Figure 2A), the correlation maps of the observed SSTs were quite different (Figure 3). This study explored the physical processes controlling the interannual fluctuations in these percentile values separately. The 90th-percentile values were strongly related to basin-scale warming in the Indian Ocean (Figure 3B), suggesting the contribution of the so-called Indo-western Pacific Ocean capacitor [30,31]. When the SST was high in the Indian Ocean (particularly in the northern Indian Ocean), for example, a high-pressure anomaly was formed around Southeast Asia [30] and the accompanying moisture transport was enhanced from the Indian Ocean to the Pacific Ocean through the subtropics [31]. The negative vorticity simulated south of Japan (Figure 3B) indicated that the subtropical high in the northwestern Pacific (south of Japan) was enhanced [30,31]. Consequently, strong moisture transport from the tropics along the western edge of the enhanced northwestern Pacific subtropical high (Figure 3B) contributed to enhancing the probability of a large amount of heavy rainfall on Kyushu Island. Note that, while this study calculated the percentile values of daily rainfall during the period from June to August, the interannual variations were primarily controlled by the July climate state. The strong subtropical high accompanied by an anomalous positive vorticity and low pressure around Japan (Figure 3B) excited the active Baiu front and enhanced the heavy rainfall potential [25].
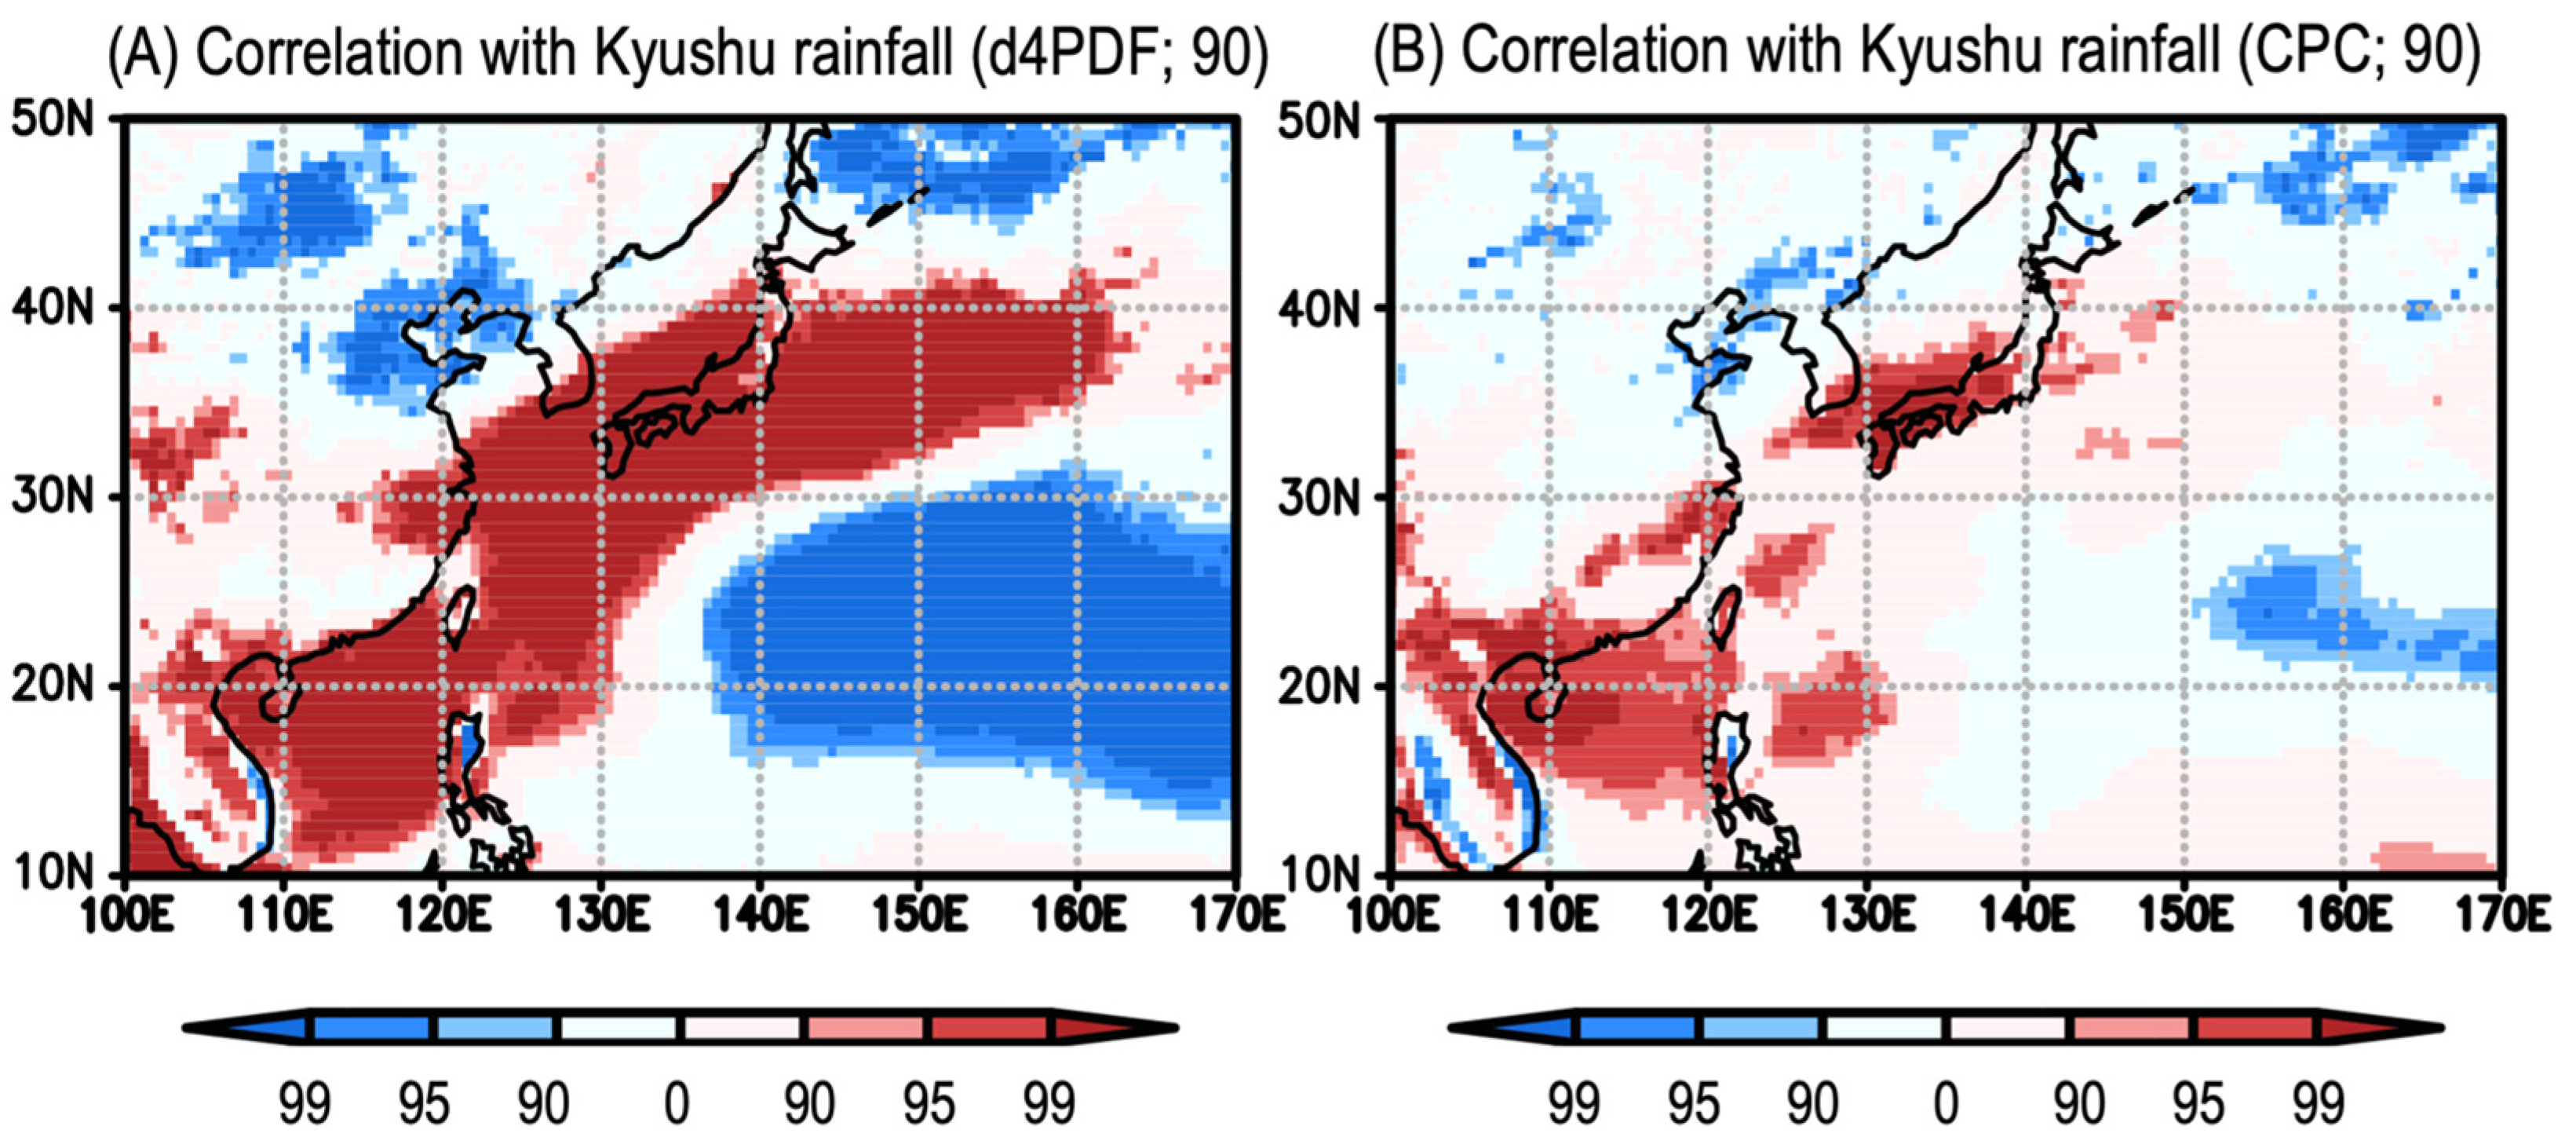
Along the pathway of the enhanced moisture transport southwest of Japan (Figure 3B) in addition to Kyushu Island, the 90th-percentile values in July simultaneously fluctuated on interannual timescales (Figure 4A). While the 90th-percentile values on Kyushu Island were enhanced, in contrast, these values were reduced under the accompanying enhanced northwestern Pacific subtropical high (Figure 4A). While it is not easy to validate these results for the percentile values of heavy daily rainfall by using the actual observations with limited numbers of samples, even roughly estimated values for the interannual fluctuation in the observations can provide insights for validation. When using the CPC global unified gauge-based daily precipitation dataset, the fourth heaviest values of the observed daily rainfall in the 31 days of July, which can be regarded as an observational proxy of the 90th-percentile values for convenience, displayed a similar correlation map to the 90th-percentile values on Kyushu Island (Figure 4B). The significant signals in western Japan validated the interannual fluctuation in the 90th-percentile values in d4PDF, while those over the South China Sea and the East China Sea suggested the validity of the effectiveness of the moisture transport changes along the western edge of the northwestern Pacific subtropical high and from the tropics.
In contrast, the 99th-percentile values were closely related to the seasonal mean state over the tropical Pacific (Figure 3A). When the central and eastern tropical Pacific SSTs were higher than normal, showing a spatial pattern resembling that of the positive phase of the Interdecadal Pacific Oscillation (IPO) [41]—namely, a combination of positive ENSO events and the Pacific Meridional Mode [42]—the Pacific trade wind along the equator is reduced around the international dateline. In the western tropical Pacific, anomalously high and low pressures were simulated over the maritime continent and north of 10° N, respectively. Simultaneously, the Pacific trade winds were weakened along the equator, and the Southeast Asian summer monsoon trough could be strengthened. Differing from the case of 90th-percentile values (Figure 3B), direct contributions of large-scale circulation anomalies do not exceed significant levels around Japan (Figure 3A). Nevertheless, tropical SSTs can contribute to modulating the 99th-percentile rainfall potential through rare events, such as tropical cyclones (Figure 5), as some studies have indicated that the ENSO modulates tropical cyclone activity in the northwestern Pacific [35,43,44]. When the tropical Pacific SST was higher than normal, the tropical cyclone track density shifted southeastward (Figure 5C) [44,45]. It is known that, in such cases, because the lifetime of each tropical cyclone should be longer [43,46], their intensity—the maximum wind speed and sea level pressure of the tropical cyclone center—is enhanced in the northwestern Pacific (Figure 5A,B). In addition to both the potential chance of a tropical cyclone and the enhanced intensity of a passing tropical cyclone (Figure 5C), the tropical cyclones south of Japan (Figure 5A,B) can remotely enhance the 99th-percentile rainfall potential [47].
According to the enhanced existence density of tropical cyclones around 15° N in the northwestern Pacific (Figure 5C), the 99th-percentile values in July simultaneously fluctuated on interannual timescales along this statistically common pathway of tropical cyclones (Figure 6A). When using the CPC global unified gauge-based daily precipitation dataset for validation in a similar manner to the 90th-percentile values (Figure 4B), the heaviest values of the observed daily rainfall in the 31 days of July showed a positive correlation over western Japan, suggesting the validity of the results of the d4PDF (Figure 6B). Note that there were no significant signals south of Japan. Since this observation represents one sample of the time trajectory rather than the probability density, the influence of tropical cyclones on heavy rainfall is quite limited to a narrow area along this pathway only, with a high uncertainty.

3.2. Low-Frequency Modulation in Influential SST Patterns

The global warming tendency due to anthropogenic forcing may have only had a slight direct influence on the interannual fluctuations in the heavy daily rainfall potential during the period of 1981–2010 (Figure 2A). Nevertheless, the rising tendency of SSTs as well as the interdecadal variability can modulate the relationships between the heavy daily rainfall potential and the global climate state (i.e., the spatiotemporal structures of influential SSTs outlined in Figure 3). Knowledge of the possible modulation in the seasonal evolution of influential SST anomalies can help us to enhance our ability to obtain prediction information of the summertime heavy daily rainfall potential [14].
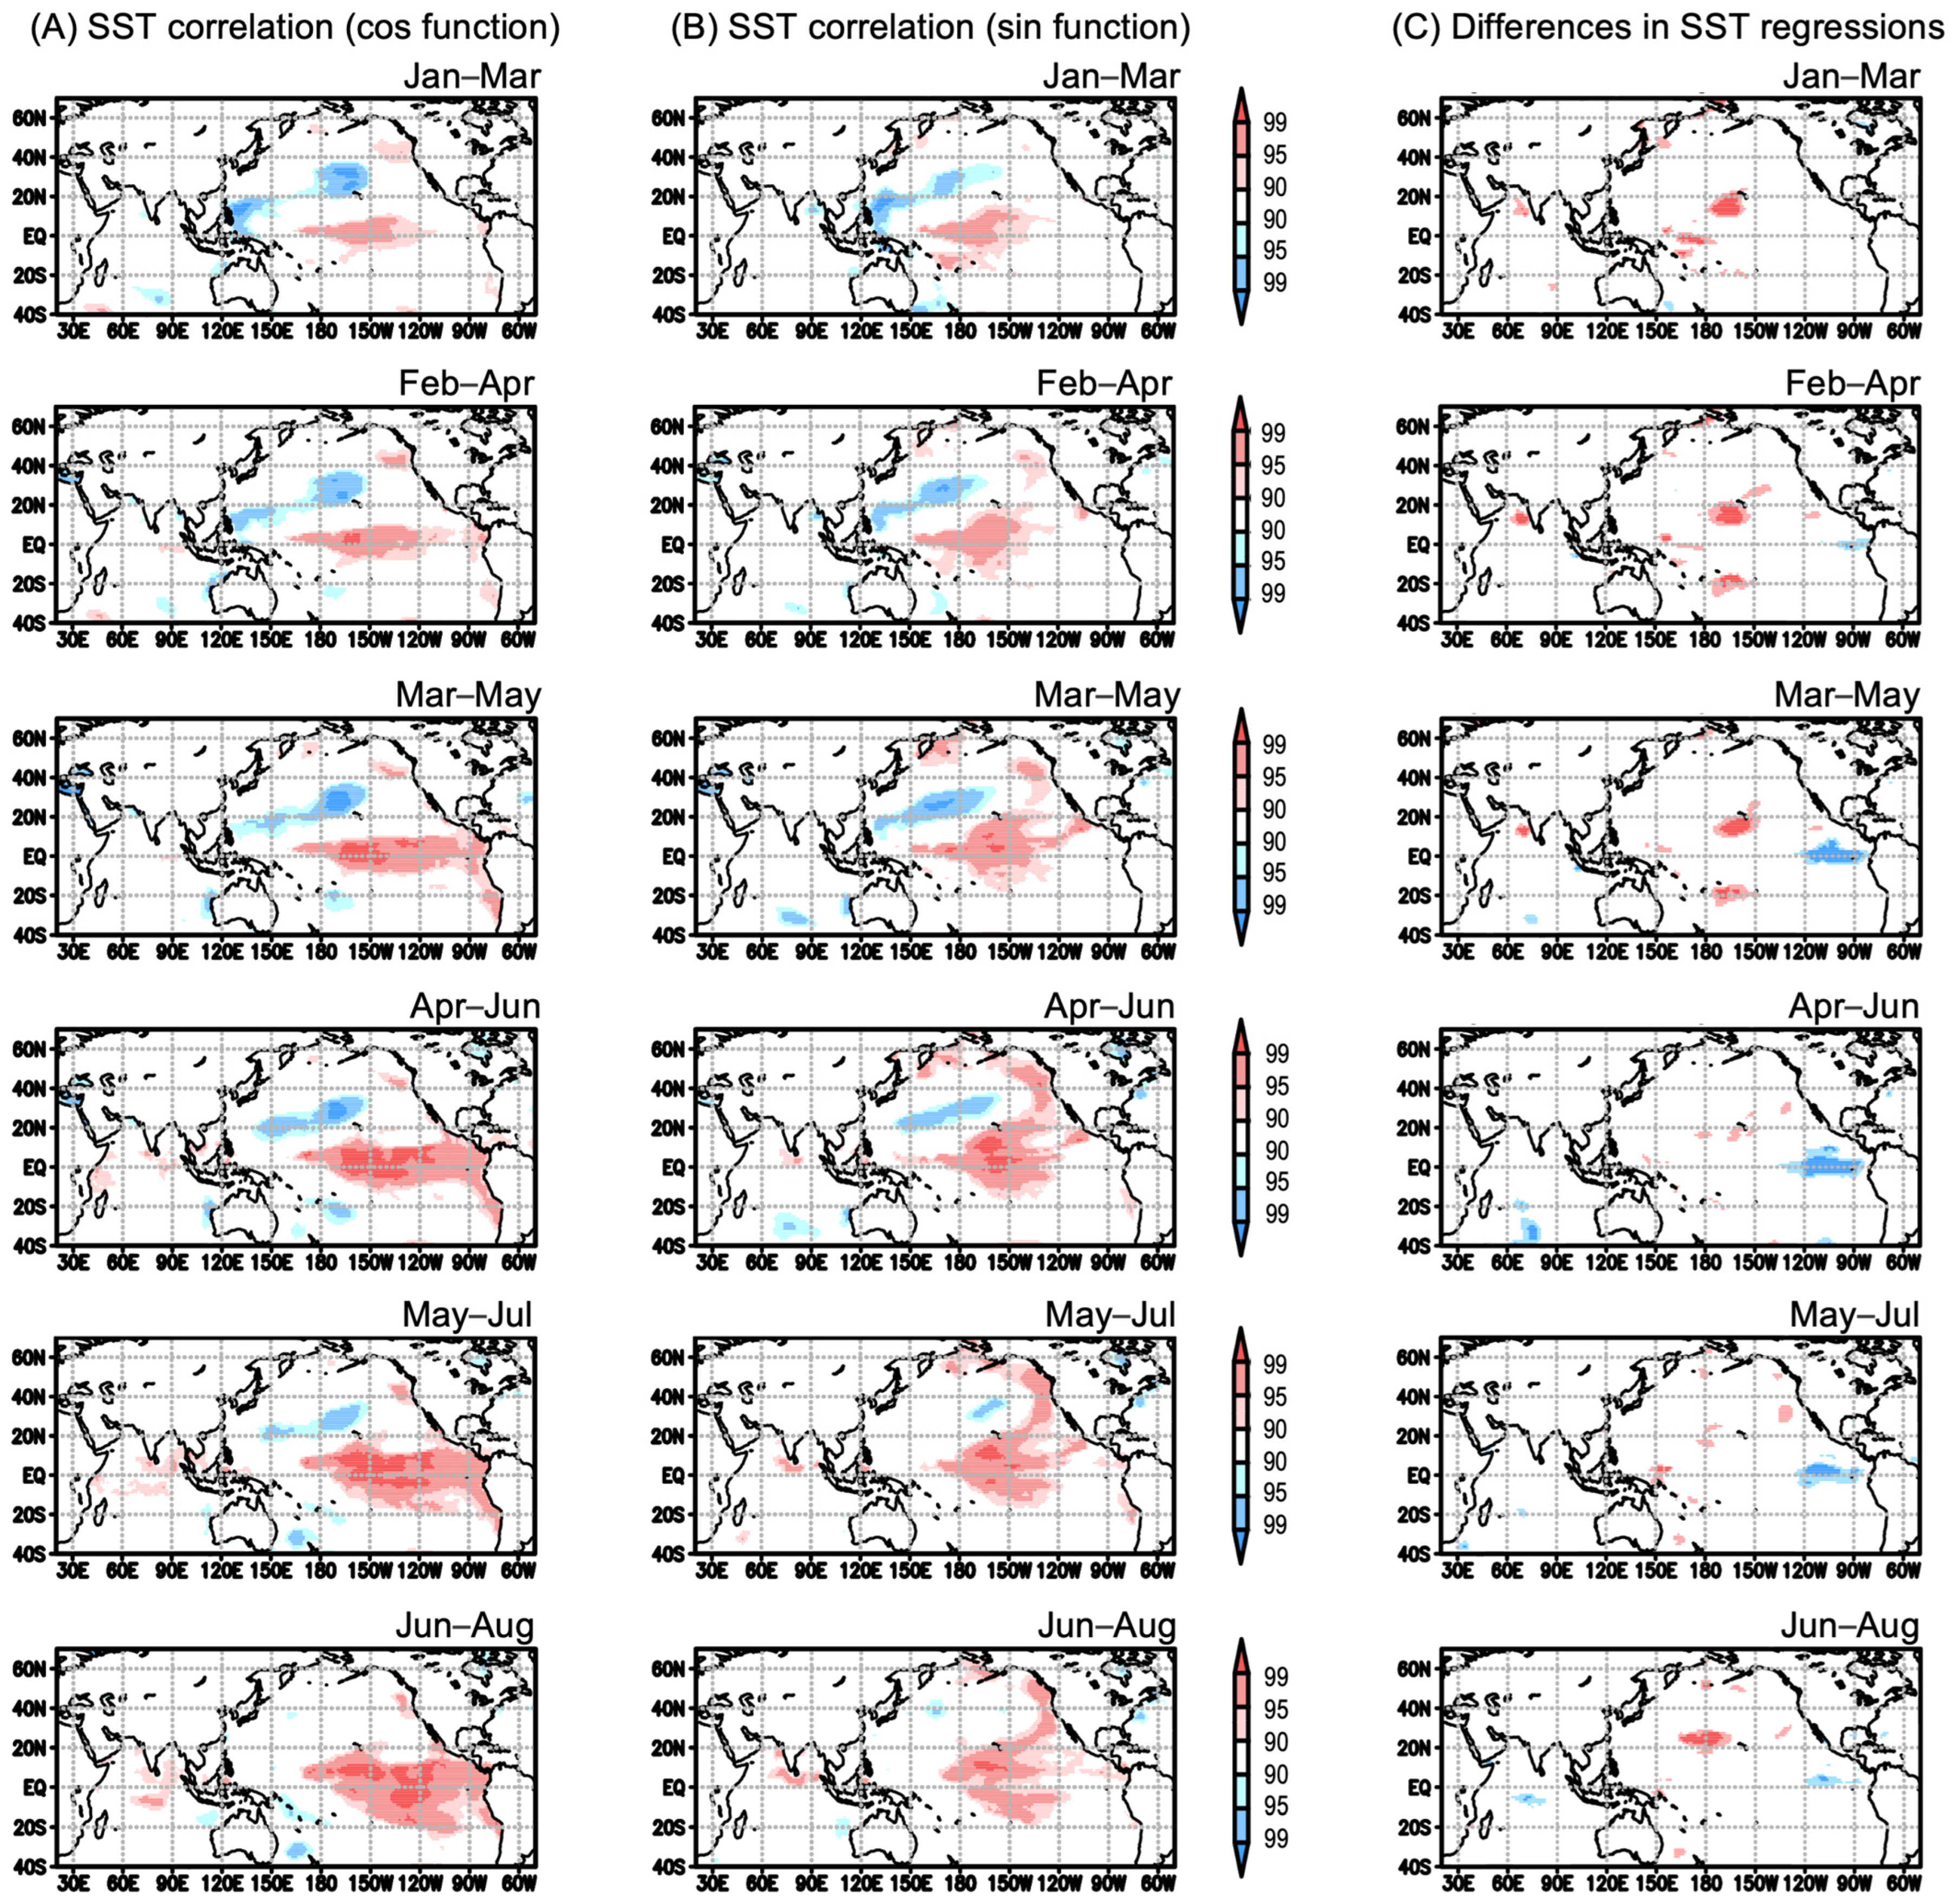
As described in Section 2, this study explored possible low-frequency modulation by applying an envelope approach to compare the seasonal evolution of the SST patterns contributing to interannual fluctuations in the heavy daily rainfall between the early and recent periods. Figure 7A represents the seasonal evolution of SSTs correlated with the 99th-percentile rainfall time series with a cosine envelope applied, Xc, to illustrate the SST patterns observed in boreal winter, spring, and summer, mainly in the early years. The summertime tropical Pacific SST anomaly showing an El Niño-like pattern directly contributed to the 99th-percentile values of the daily rainfall potential. While an ENSO signal in the tropics usually reached a peak in winter, the tropical Pacific SSTs in spring and summer mainly affected the summertime heavy rainfall potential. The differences in SST regression between the two enveloped data points were particularly large in the eastern equatorial Pacific in spring and early summer (Figure 7C), suggesting the contribution of the ENSO diversity, namely the recent weakening of the eastern tropical Pacific SST anomaly [35,48,49,50].
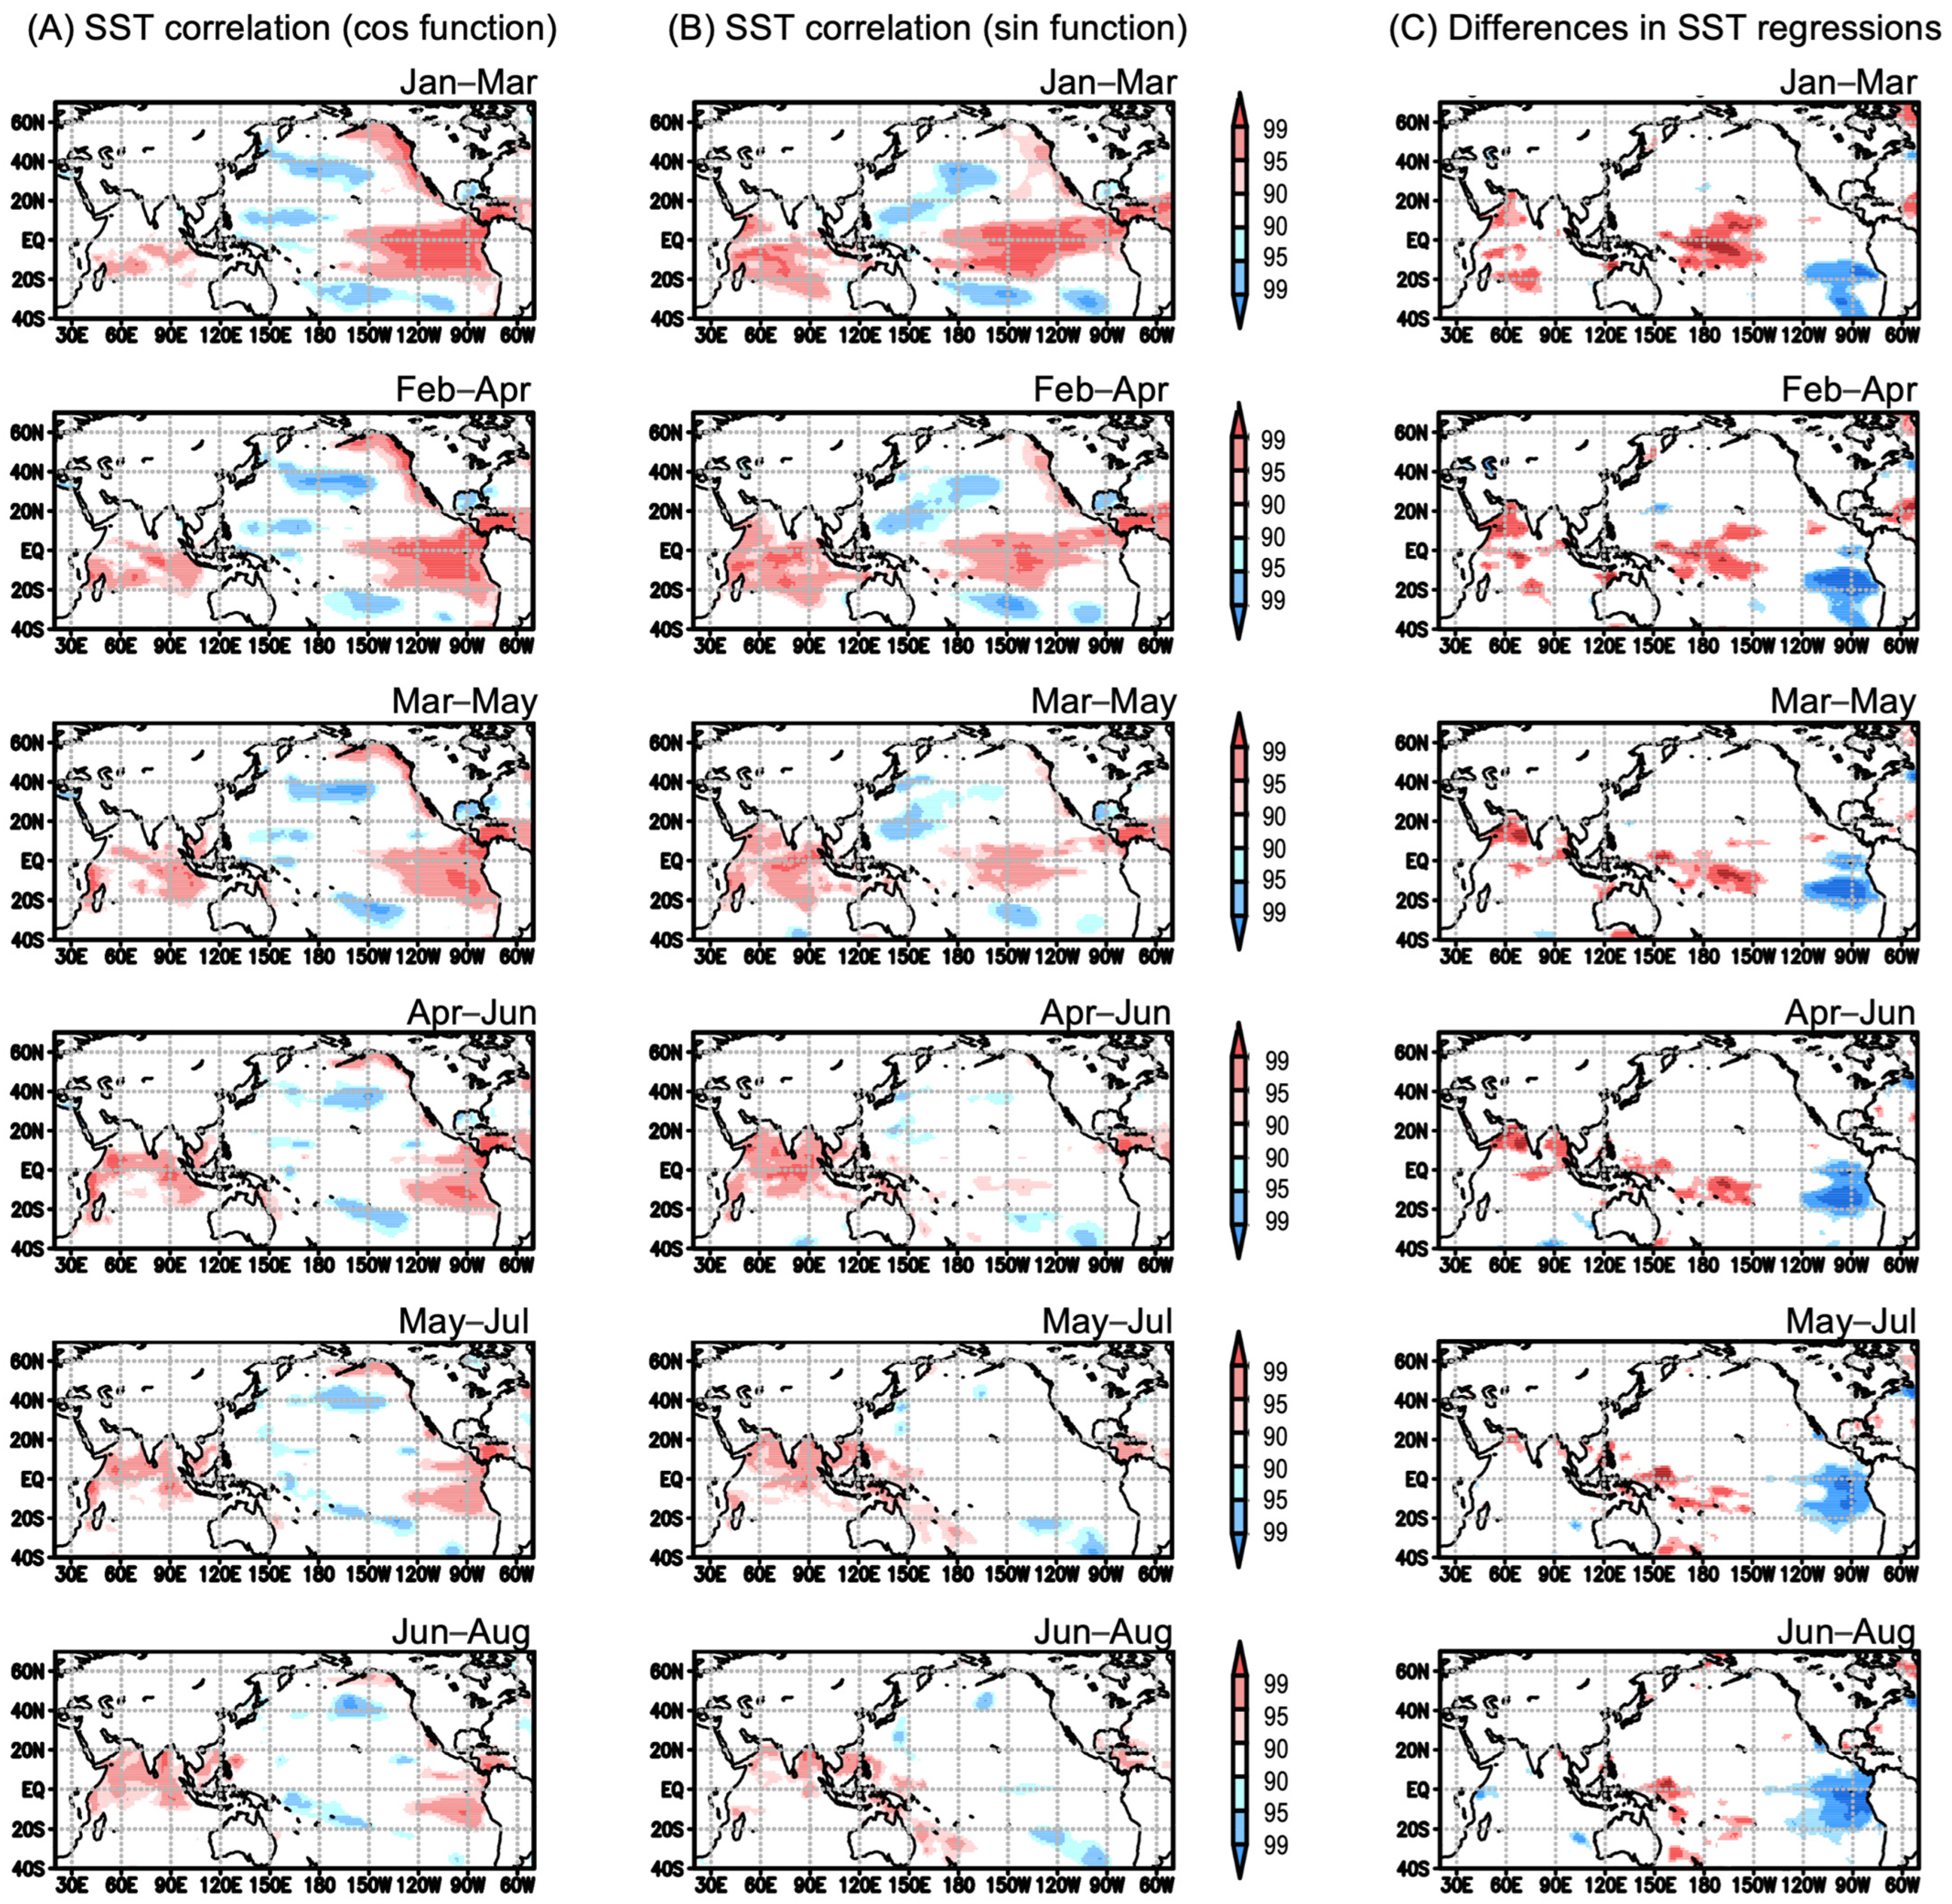
For the 90th-percentile values, in contrast, the seasonal evolution of the influential SSTs suggested a footprint-like process (Figure 8). The wintertime El Niño events were observed prior to the basin-scale warming in the Indian Ocean in spring and summer [30,31], as well as the maritime continent and the South China Sea [51]. In recent years, the SST anomaly of the wintertime El Niño was shifted to the central Pacific and that in the eastern tropical Pacific rapidly decayed on seasonal timescales (Figure 8B). The interdecadal trend, mainly due to a positive-to-negative phase change in the IPO [52,53], possibly with the recent increase in CP-ENSO-type fluctuations [35,48,49,50], can form the zonal contrast as a low-frequency difference in the influential SST pattern (Figure 8C). In addition, the basin-scale warming in the Indian Ocean subsequent to a wintertime El Niño event occurred earlier in recent years (Figure 8A,B), probably because the atmosphere–ocean thermal coupling, particularly the wind–evaporation–SST feedback [54,55], can be enhanced through a nonlinear SST-evaporation relationship under the observed warming tendency in the upper Indian Ocean [56].
Figure 7 and Figure 8 indicate the decisive role of the tropical Pacific SST. For the 99th-percentile values, the tropical SST anomaly showed an El Niño-like pattern throughout the plotted period (i.e., winter, spring, and summer) (Figure 7), while the summertime signals were much clearer. For the 90th-percentile values, while the summertime SST anomaly was mainly found over the Indian Ocean, the wintertime SST anomaly showed an El Niño-like pattern (Figure 8), suggesting an Indo-western Pacific capacitor effect again [30,31]. Therefore, the 99th- and 90th-percentile values shared the wintertime SST anomaly in the tropical Pacific, implying that they are not totally independent in physical processes for interannual fluctuations.

4. Discussion

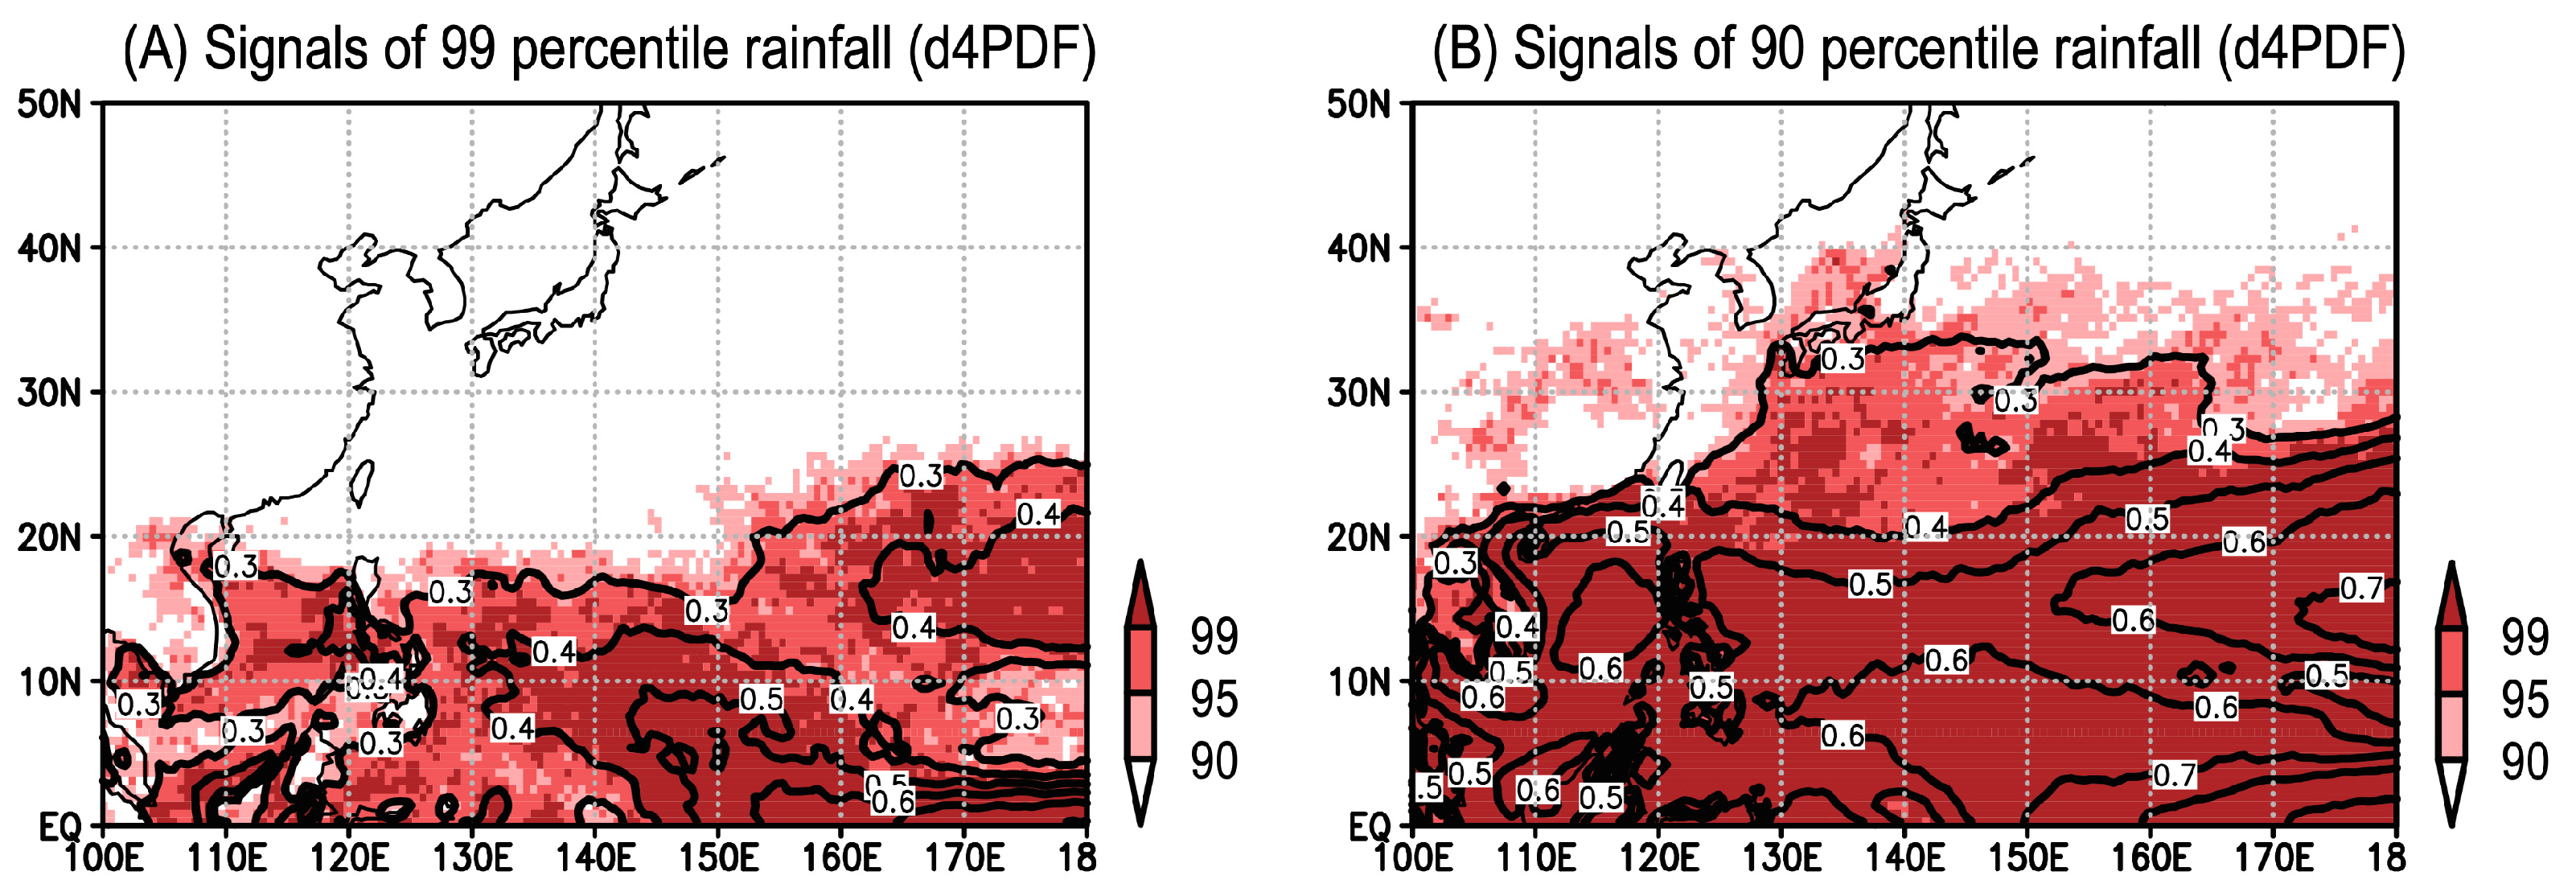
Since the d4PDF dataset is a set of 100 ensemble simulations driven by the observed SST, the probability distribution of daily rainfall at each grid point can be estimated using 9200 samples (i.e., 92 days in 100 ensembles) for each summer. The signal–noise ratio based on the so-called perfect model anomaly correlation approach [22,26] provides insight into the validity of discussing the relationships between the rainfall potential and the SST variability, which was verified using the d4PDF dataset. As the observed SST time series was a solution to the climate system, one member from the 100 ensembles was selected as a pseudo-observation. The 99th- and 90th-percentile values for rainfall were defined using the other 99 ensembles as pseudo-ensemble simulations. The anomaly correlation coefficient of the results of the pseudo-observation and the pseudo-ensembles (i.e., 99 ensembles) represented a potential signal due to the perfectly given SST against the noise generated mostly in the atmosphere. This calculation of the anomaly correlation between a randomly sampled pseudo-observation and the resultant pseudo-simulations was repeated, and the averages of the correlations should represent the areas where the interannual fluctuations in the daily rainfall potential would be logically controllable by the SST (Figure 9). The perfect model anomaly correlations for the 90th-percentile values exceeded significant levels around Japan, in addition to the tropical areas (Figure 9B). The average of the correlation value for the area-averaged 90th percentiles over Kyushu Island was 0.35, and 98% of the samples showed positive correlation values. On the other hand, that of the 99th-percentile values was limited to 0.20 (Figure 9A), probably due to the signal–to–noise paradox [7,26,57], in addition to the noisy time series of the heaviest rainfall in each season. Note that, even though the 99th-percentile values of local rainfall displayed relatively high levels of noise at the individual grid point, the spatial pattern of the seasonal mean SST anomaly (Figure 3A) and the associated changes in the tropical cyclone statistics (Figure 5) indicate a significant relationship with the 99th-percentile values.
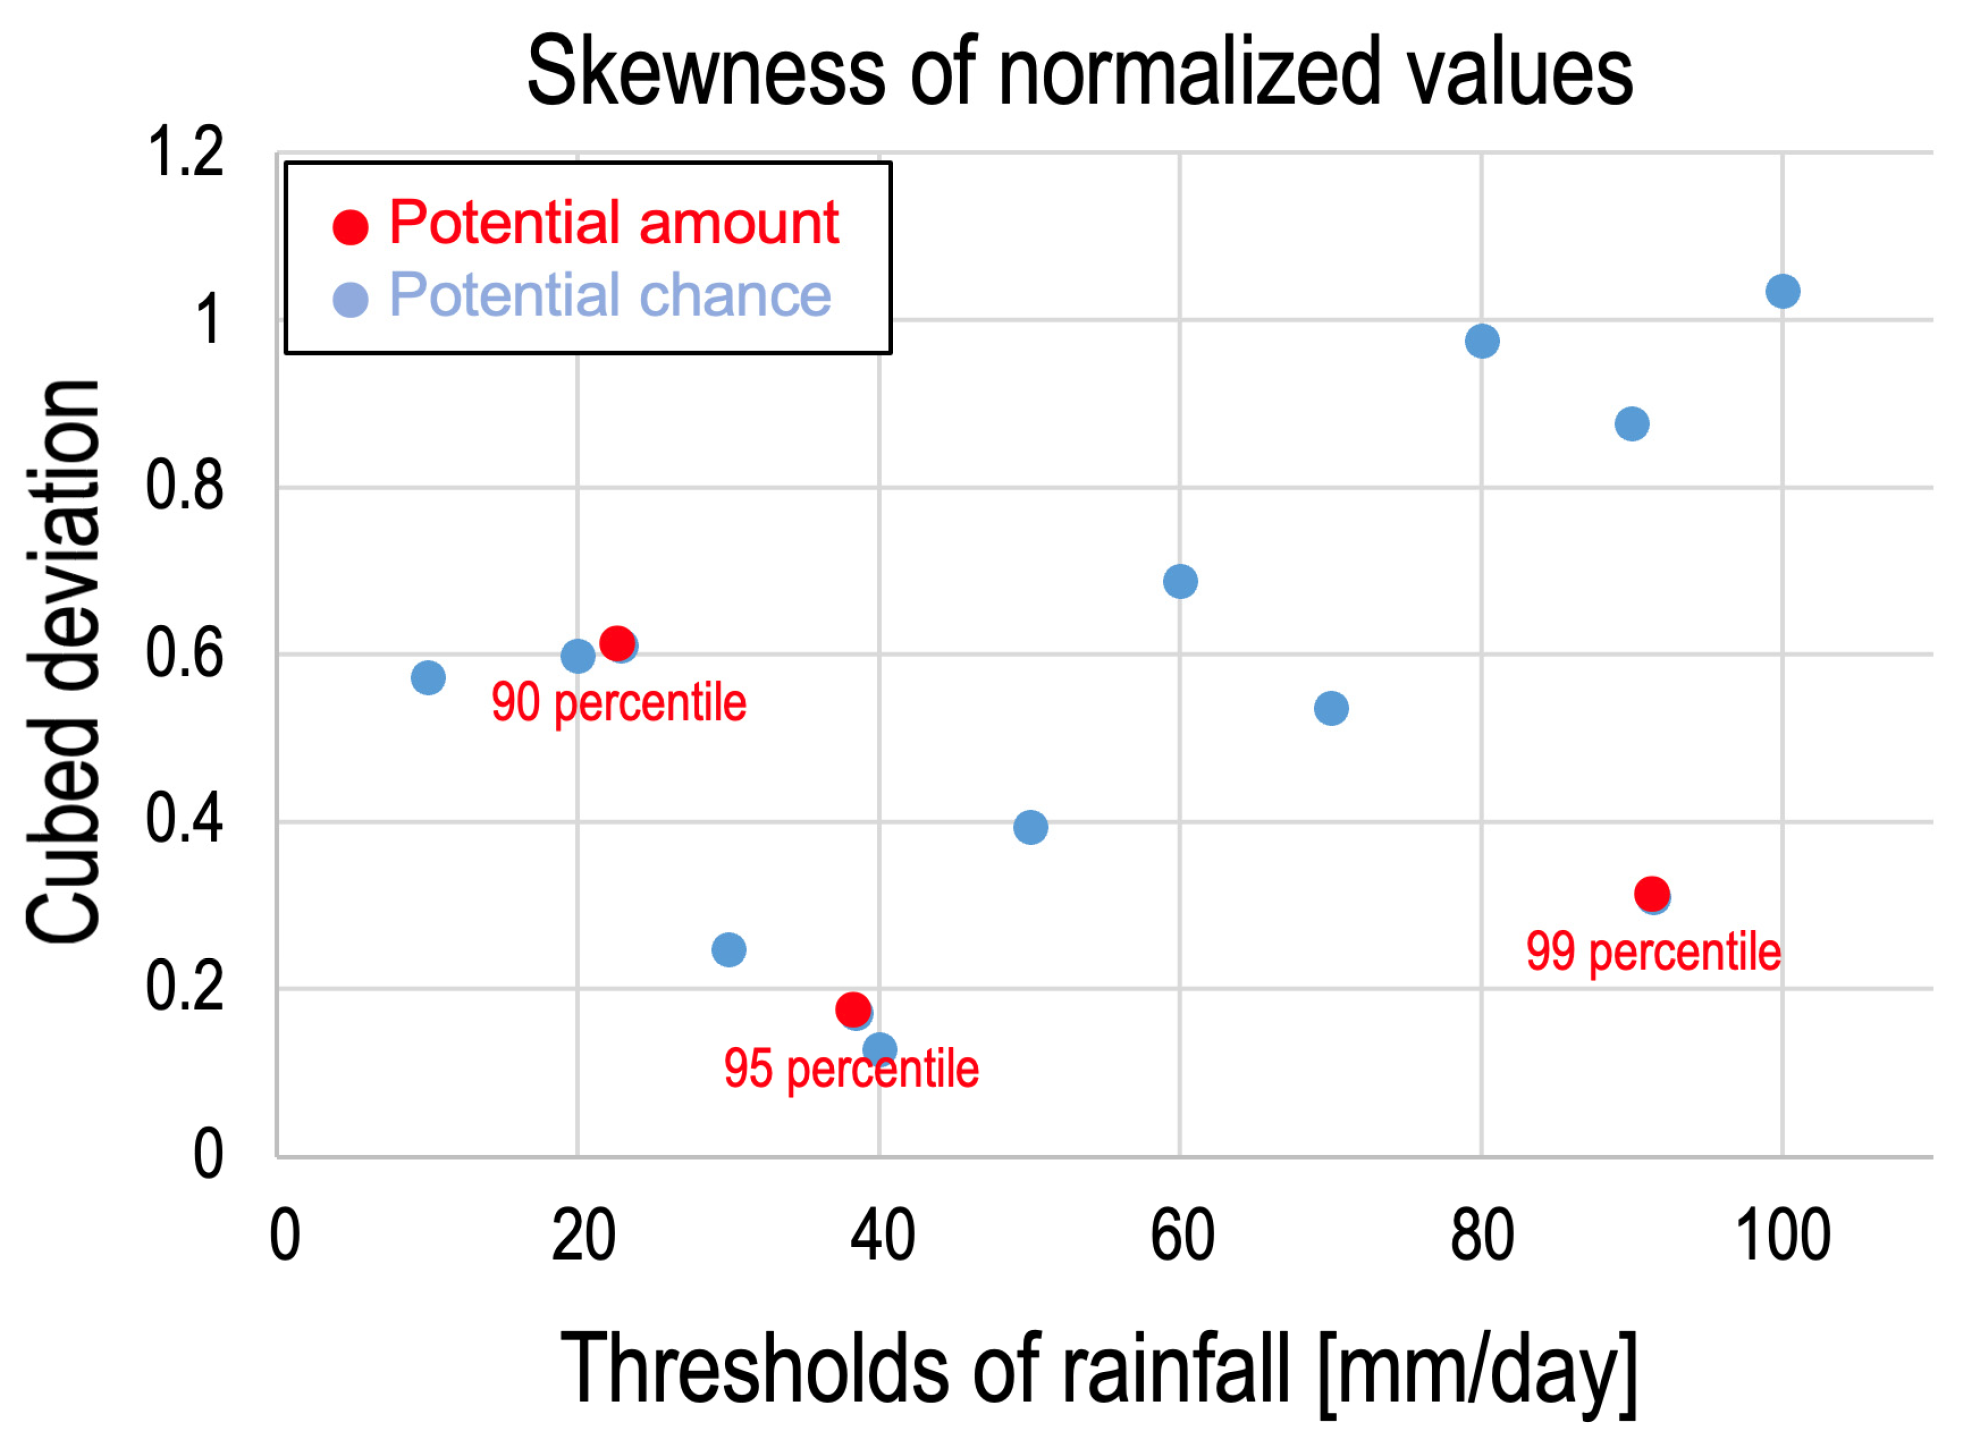
The above results are based on the potential amount of heavy daily rainfall rather than the potential chance usually discussed towards disaster prevention [26], estimated by counting the total number of occurrences of heavy rainfall satisfying a specific intensity. While the potential amount (intensity) can usually deviate together with the potential chance (frequency), from the definitions, a difference can be found in the skewness of the interannual fluctuations. Since the shape of the probability density function of daily rainfall in a large-ensemble simulation is not rectangular, the potential chance can be expected to represent highly asymmetric deviations corresponding to increasing and decreasing shifts of the seasonal mean value. In contrast, the potential amount, such as the 99th- or 90th-percentile value, represents a specific value of extremely heavy daily rainfall and should relatively suppress this asymmetry. On Kyushu Island, in fact, the skewness of the interannual fluctuations, defined as the cubed deviations in the normalized values, of the 99th-percentile rainfall was much smaller than that of the corresponding value of the potential chance (Figure 10). Note that the skewness of the 90th- and 95th-percentile values was quite similar to that of the potential chance, because the interannual fluctuations in the probability density function practically reflected the modification of the shapes in addition to the upward and downward shifts in the seasonal mean value.
As described in Section 2.2, the 60 km spatial resolution of the d4PDF dataset imposes a limitation on representing phenomena. A major phenomenon causing the summertime daily heavy rainfall on Kyushu Island is a band-shaped rainfall system, usually referred to as Senjo-Kousuitai in Japan [58,59]. This system has a length of 50–300 km and a width of 20–50 km [59], and convective cells line up and either pass or stagnate for several hours at a specific area, partly due to the topography. Kato [59] demonstrated through the numerical reproducibility of the observed events that an atmospheric model requires a fine resolution of at least 2 km to resolve the formation and development processes of the convective cells. These processes are not explicitly simulated in the 60 km version of the d4PDF dataset, representing a limitation of this study. Simulations with a higher-resolution model, including a dynamical downscaling approach, can enable us to take into account complicated processes directly, thus probably helping to more precisely estimate the distribution and intensity of localized heavy rainfall. Finer resolution data could also be helpful in reducing the spatial smoothing influences when discussing the intensity of local heavy rainfall. By defining favorable environmental conditions for the occurrence of a band-shaped rainfall event, Kato [59] indicated that, in addition to some local conditions (e.g., large water vapor flux, distance to a level of free convection, high relative humidity), regional atmospheric conditions (e.g., synoptic-scale ascending motions) were useful indicators for making diagnostic forecasts of individual events. This suggests the potential contribution of regional variability, and even a model with a relatively coarse resolution can possibly represent the statistical influences on the localized rainfall intensity through cloud parameterizations. Moreover, the AMeDAS rain-gauge observation network, which provides local station data rather than gridded data with a nearly 17 km spatial resolution, should be able to represent localized heavy rainfall due to the band-shaped rainfall system. Kato [60] most recently indicated that summertime heavy rainfall events were mainly observed over western Kyushu Island, likely corresponding to large standard deviations in the gridded data shown in Figure 1. They found that the observed frequency of heavy rainfall events was closely related to changes in the water vapor flux, thereby speculating a considerable influence by the synoptic-scale pressure pattern changes rather than the local atmospheric conditions [60]. This may be consistent with the results of this study in terms of the potential contribution of the northwestern subtropical high. While direct estimates using a high-resolution model can further enhance our understanding of heavy rainfall events, the results of previous studies, which indicate a potential contribution of large-scale variability to the statistics of localized heavy rainfall, also add value to this study, even when using simulation data with a 60 km resolution.

5. Conclusions

This study investigated the interannual variations in the summertime heavy rainfall potential on Kyushu Island in western Japan by analyzing a set of large-ensemble simulations (i.e., the d4PDF dataset) from a percentile perspective. This study demonstrated that two indicators for the heavy daily rainfall potential, defined as the 99th- and 90th-percentile values, are primarily controlled by different physical processes and, hence, show different interannual fluctuations. The interannual fluctuation in the 90th-percentile values was mainly controlled by large-scale horizontal moisture transport anomalies due to changes in basin-scale warming in the Indian Ocean and the resultant enhanced subtropical high in the northwestern Pacific in summer, mostly subsequent to the wintertime El Niño events. The contributions of the northern Indian Ocean and the eastern tropical Pacific Ocean showed low-frequency modulations, mainly due to the influences of the global warming tendency and the interdecadal variability in the climate system, respectively. In contrast, the probabilistic features of tropical cyclone activity played a major role in changing the 99th-percentile value. The potentials of both the tropical cyclone intensity and the existence density fluctuated, largely owing to the summertime SSTs over the tropical Pacific, which can be modulated by the El Niño diversity on interdecadal timescales.
In recent ocean observations, the Indian Ocean exhibited a stronger warming tendency than other oceans [61,62], while the Pacific Ocean’s SST was characterized by the positive-to-negative phase shift of the IPO [52,53] with an increase in CP-ENSO-type fluctuations [35,49,50]. In this regard, the observed SST tendency can provide more favorable conditions for basin-scale warming in the Indian Ocean [63], but less favorable conditions for the preceding ENSO events and the tropical cyclone activity changes towards enhancing the heavy rainfall potential in recent years [35,64]. This tropical Pacific SST tendency can logically work to form a reducing trend in the heavy daily rainfall potential, while the simulated linear trend did not satisfy a significant level (Figure 2A). Significant low-frequency modulation was found in seasonal evolution and influential SST patterns (Figure 7 and Figure 8).
Regarding the potential implications contributing to the above predictive utility for extreme weather event statistics, these two thresholds can be useful indicators for identifying the contributions of individual processes separately. In addition, consciousness of possible low-frequency modulation is necessary, particularly for enhanced atmosphere–ocean coupling due to the global warming tendency and the ENSO diversity, when diagnosing the probability of extreme weather events using global climate prediction data and large-ensemble simulation data.

Funding

This work was supported by JSPS KAKENHI, grant numbers JP19H05703, JP24K00707, JP24H00369, and JP24H02229.

Institutional Review Board Statement

Not applicable.

Informed Consent Statement

Not applicable.

Data Availability Statement

The d4PDF data are available at https://d4pdf.diasjp.net/d4PDF.cgi?target=GCM&lang=en (accessed on 21 June 2024). The objective analysis of the SST data is available at https://climate.mri-jma.go.jp/pub/ocean/cobe-sst2/ (accessed on 21 June 2024). The CPC global unified gauge-based analysis of the daily precipitation dataset is available at https://psl.noaa.gov/data/gridded/data.cpc.globalprecip.html (accessed on 21 June 2024).

Acknowledgments

The authors thank S. Yamaguchi and R. Inoue for their support in using the d4PDF dataset. We also thank MEXT program, JPMXD0722680395.

Conflicts of Interest

The author declares no conflicts of interest.

References

  1. Meehl, G.A.; Hu, A.; Tebaldi, C. Decadal prediction in the Pacific region. J. Clim. 2010, 23, 2959–2973. [Google Scholar] [CrossRef]
  2. Meehl, G.A.; Goddard, L.; Boer, G.; Burgman, R.; Branstator, G.; Cassou, C.; Corti, S.; Danabasoglu, G.; Doblas-Reyes, F.; Hawkins, E.; et al. Decadal climate prediction: An update from the trenches. Bull. Am. Meteorol. Soc. 2013, 95, 243–267. [Google Scholar] [CrossRef]
  3. Eyring, V.; Bony, S.; Meehl, G.A.; Senior, C.A.; Stevens, B.; Stouffer, R.J.; Taylor, K.E. Overview of the Coupled Model Intercomparison Project Phase 6 (CMIP6) experimental design and organization. Geosci. Model Dev. 2016, 9, 1937–1958. [Google Scholar] [CrossRef]
  4. Doblas-Reyes, F.J.; Andreu-Burillo, I.; Chikamoto, Y.; Garcia-Serrano, J.; Guemas, V.; Kimoto, M.; Mochizuki, T.; Rodrigues, L.R.L.; van Oldenborgh, G.J. Initialized near-term regional climate change prediction. Nat. Commun. 2013, 4, 1715. [Google Scholar] [CrossRef]
  5. Choi, J.; Son, S.-W.; Ham, Y.-G.; Lee, J.-Y.; Kim, H.-M. Seasonal-to-interannual prediction skills of near-surface air temperature in the CMIP5 decadal hindcast experiments. J. Clim. 2016, 29, 1511–1527. [Google Scholar] [CrossRef]
  6. Smith, D.M.; Eade, R.; Scaife, A.A.; Caron, L.P.; Danabasoglu, G.; DelSole, T.M.; Delworth, T.; Doblas-Reyes, F.J.; Dunstone, N.J.; Hermanson, L.; et al. Robust skill of decadal climate predictions. Npj Clim. Atmos. Sci. 2019, 2, 13. [Google Scholar] [CrossRef]
  7. Smith, D.M.; Scaife, A.A.; Eade, R.; Athanasiadis, P.; Bellucci, A.; Bethke, I.; Bilbao, R.; Borchert, L.F.; Caron, L.P.; Counillon, F.; et al. North Atlantic climate far more predictable than models imply. Nature 2020, 583, 796–800. [Google Scholar] [CrossRef]
  8. Kataoka, T.; Tatebe, H.; Koyama, H.; Mochizuki, T.; Ogochi, K.; Naoe, H.; Imada, Y.; Shiogama, H.; Kimoto, M.; Watanabe, M. Seasonal to decadal predictions with MIROC6: Description and basic evaluation. J. Adv. Model Earth Syst. 2020, 12, e2019MS002035. [Google Scholar] [CrossRef]
  9. Smith, D.M.; Cusack, S.; Colman, A.W.; Folland, C.K.; Harris, G.R.; Murphy, J.M. Improved surface temperature prediction for the coming decade from a global climate model. Science 2007, 317, 796–799. [Google Scholar] [CrossRef]
  10. Keenlyside, N.S.; Latif, M.; Jungclaus, J.; Kornblueh, L.; Roeckner, E. Advancing decadal-scale climate prediction in the North Atlantic sector. Nature 2008, 453, 84–88. [Google Scholar] [CrossRef]
  11. Yeager, S.G.; Robson, J.I. Recent progress in understanding and predicting Atlantic decadal climate variability. Curr. Clim. Change Rep. 2017, 3, 112–127. [Google Scholar] [CrossRef] [PubMed]
  12. Pohlmann, H.; Jungclaus, J.H.; Köhl, A.; Stammer, D.; Marotzke, J. Initializing decadal climate predictions with the GECCO oceanic synthesis: Effect on the North Atlantic. J. Clim. 2009, 22, 3926–3938. [Google Scholar] [CrossRef]
  13. Mochizuki, T.; Ishii, M.; Kimoto, M.; Chikamoto, Y.; Watanabe, M.; Nozawa, T.; Sakamoto, T.T.; Shiogama, H.; Awaji, T.; Sugiura, N.; et al. Pacific decadal oscillation hindcasts relevant to near-term climate prediction. Proc. Natl. Acad. Sci. USA 2010, 107, 1833–1837. [Google Scholar] [CrossRef] [PubMed]
  14. Takaya, Y.; Kosaka, Y.; Watanabe, M.; Maeda, S. Skillful predictions of the Asian summer monsoon one year ahead. Nat. Commun. 2021, 12, 2094. [Google Scholar] [CrossRef] [PubMed]
  15. Zhou, Z.-Q.; Xie, S.-P.; Zhang, R. Historic Yangtze flooding of 2020 tied to extreme Indian Ocean conditions. Proc. Nat. Acad. Sci. USA 2021, 118, e2022255118. [Google Scholar] [CrossRef] [PubMed]
  16. Mizuta, R.; Murata, A.; Ishii, M.; Shiogama, H.; Hibino, K.; Mori, N.; Arakawa, O.; Imada, Y.; Yoshida, K.; Aoyagi, T.; et al. Over 5000 years of ensemble future climate simulations by 60 km global and 20 km regional atmospheric models. Bull. Am. Meteorol. Soc. 2017, 98, 1383–1398. [Google Scholar] [CrossRef]
  17. Fujita, M.; Mizuta, R.; Ishii, M.; Endo, H.; Sato, T.; Okada, Y.; Kawazoe, S.; Sugimoto, S.; Ishihara, K.; Watanabe, S. Precipitation changes in a climate with 2-K surface warming from large ensemble simulations using 60-km global and 20-km regional atmospheric models. Geophys. Res. Lett. 2020, 46, 435–442. [Google Scholar] [CrossRef]
  18. Hatsuzuka, D.; Sato, T.; Yoshida, K.; Ishii, M.; Mizuta, R. Regional projection of tropical-cyclone-induced extreme precipitation around Japan based on large ensemble simulations. Sci. Online Lett. Atmos. 2020, 16, 23–29. [Google Scholar] [CrossRef]
  19. Takabatake, D.; Inatsu, M. Summertime precipitation in Hokkaido and Kyushu, Japan in response to global warming. Clim. Dyn. 2022, 58, 1671–1682. [Google Scholar] [CrossRef]
  20. Kawase, H.; Murata, A.; Mizuta, R.; Sasaki, H.; Nosaka, M.; Ishii, M.; Takayabu, I. Enhancement of heavy daily snowfall in central Japan due to global warming as projected by large ensemble of regional climate simulations. Clim. Change 2016, 139, 265–278. [Google Scholar] [CrossRef]
  21. Hatsuzuka, D.; Sato, T. Future changes in monthly extreme precipitation in Japan using large-ensemble regional climate simulations. J. Hydrometeorol. 2019, 20, 563–574. [Google Scholar] [CrossRef]
  22. Mochizuki, T. Multi-year potential predictability of the wintertime heavy precipitation potentials in East Asia. Geophys. Res. Lett. 2024, 51, e2024GL108312. [Google Scholar] [CrossRef]
  23. Chikamoto, Y.; Timmermann, A.; Luo, J.-J.; Mochizuki, T.; Kimoto, M.; Watanabe, M.; Ishii, M.; Xie, S.-P.; Jin, F.-F. Skillful multi-year predictions of tropical trans-basin climate variability. Nat. Commun. 2015, 6, 6869. [Google Scholar] [CrossRef] [PubMed]
  24. McGregor, S.; Timmermann, A.; Stuecker, M.F.; England, H.; Merrifield, M.; Jin, F.F.; Chikamoto, Y. Recent walker circulation strengthening and Pacific cooling amplified by Atlantic warming. Nat. Clim. Change 2014, 4, 888–892. [Google Scholar] [CrossRef]
  25. Kawase, H.; Imada, Y.; Sasaki, H.; Nakaegawa, T.; Murata, A.; Nosaka, M.; Takayabu, I. Contribution of historical global warming to local-scale heavy precipitation in western Japan estimated by large ensemble high-resolution simulations. J. Geophys. Res. 2019, 124, 6093–6103. [Google Scholar] [CrossRef]
  26. Imada, Y.; Kawase, H. Potential seasonal predictability of the risk of local rainfall extremes estimated using high-resolution large ensemble simulations. Geophys. Res. Lett. 2021, 48, e2021GL096236. [Google Scholar] [CrossRef]
  27. Ashok, K.; Behera, S.K.; Rao, S.A.; Weng, H.; Yamagata, T. El Niño Modoki and its possible teleconnection. J. Geophys. Res. 2007, 112, C11007. [Google Scholar] [CrossRef]
  28. Kug, J.-S.; Jin, F.-F.; An, S.-I. Two types of El Niño events: Cold tongue El Niño and warm pool El Niño. J. Clim. 2009, 22, 1499–1515. [Google Scholar] [CrossRef]
  29. Song, J.; Klotzbach, P.J.; Duan, Y. Differences in western north Pacific tropical cyclone activity among three El Niño phases. J. Clim. 2020, 33, 7983–8002. [Google Scholar] [CrossRef]
  30. Xie, S.-P.; Hu, K.; Hafner, J.; Tokinaga, H.; Du, Y.; Huang, G.; Sampe, T. Indian Ocean capacitor effect on Indo-western Pacific climate during the summer following El Niño. J. Clim. 2009, 22, 730–747. [Google Scholar] [CrossRef]
  31. Xie, S.-P.; Kosaka, Y.; Du, Y.; Hu, K.; Chowdary, J.S.; Huang, G. Indo-western Pacific ocean capacitor and coherent climate anomalies in post-ENSO summer: A review. Adv. Atmos. Sci. 2016, 33, 411–432. [Google Scholar] [CrossRef]
  32. Panagoulia, D.; Bárdossy, A.; Lourmas, G. Diagnostic statistics of daily rainfall variability in an evolving climate. Adv. Geosci. 2006, 7, 349–354. [Google Scholar] [CrossRef]
  33. Fujiwara, K.; Kawamura, R. Appearance of a quasi-quadrennial variation in Baiu precipitation in southern Kyushu, Japan, after the beginning of this century. Sci. Online Lett. Atmos. 2022, 18, 181–186. [Google Scholar] [CrossRef]
  34. Yu, T.; Feng, J.; Chen, W.; Hu, K.; Chen, S. Enhanced tropospheric biennial oscillation of the East Asian summer monsoon since the late-1970s. J. Clim. 2022, 35, 1613–1628. [Google Scholar] [CrossRef]
  35. Zhao, H.; Wang, C. On the relationship between ENSO and tropical cyclones in the western North Pacific during the boreal summer. Clim. Dyn. 2019, 52, 275–288. [Google Scholar] [CrossRef]
  36. Hirahara, S.; Ishii, M.; Fukuda, Y. Centennial-scale sea surface temperature analysis and its uncertainty. J. Clim. 2014, 27, 57–75. [Google Scholar] [CrossRef]
  37. Ishii, M.; Fukuda, Y.; Hirahara, S.; Yasui, S.; Suzuki, T.; Sato, K. Accuracy of global upper ocean heat content estimation expected from present observational data sets. Sci. Online Lett. Atmos. 2017, 13, 163–167. [Google Scholar] [CrossRef]
  38. Xie, P.; Yatagai, A.; Chen, M.; Hayasaka, T.; Fukushima, Y.; Liu, C.; Yang, S. A gauge-based analysis of daily precipitation over East Asia. J. Hydrometeorol. 2007, 8, 607–626. [Google Scholar] [CrossRef]
  39. Chen, M.; Shi, W.; Xie, P.; Silva, V.B.S.; Kousky, V.E.; Wayne Higgins, R.; Janowiak, J.E. Assessing objective techniques for gauge-based analyses of global daily precipitation. J. Geophys. Res. 2008, 113, D04110. [Google Scholar] [CrossRef]
  40. Yoshida, K.; Sugi, M.; Mizuta, R.; Murakami, H.; Ishii, M. Future changes in tropical cyclone activity in high-resolution large-ensemble simulations. Geophys. Res. Lett. 2017, 44, 9910–9917. [Google Scholar] [CrossRef]
  41. Trenberth, K.E.; Hurrell, J.W. Decadal atmosphere-ocean variations in the Pacific. Clim. Dyn. 1994, 9, 303–319. [Google Scholar] [CrossRef]
  42. Chiang, J.C.H.; Vimont, D.J. Analogous Pacific and Atlantic meridional modes of tropical atmosphere–ocean variability. J. Clim. 2004, 17, 4143–4158. [Google Scholar] [CrossRef]
  43. Zhao, H.; Wu, L.; Zhou, W. Interannual changes of tropical cyclone intensity in the western North Pacific. J. Meteorol. Soc. Jpn. 2011, 89, 243–253. [Google Scholar] [CrossRef]
  44. Zhang, W.; Graf, H.-F.; Leung, Y.; Herzog, M. Different El Niño types and tropical cyclone landfall in East Asia. J. Clim. 2012, 25, 6510–6523. [Google Scholar] [CrossRef]
  45. Wu, M.C.; Chang, W.L.; Leung, W.M. Impacts of El Niño-Southern Oscillation events on tropical cyclone landfalling activity in the western North Pacific. J. Clim. 2004, 17, 1419–1428. [Google Scholar] [CrossRef]
  46. Camargo, S.J.; Robertson, A.W.; Gaffney, S.J.; Smyth, P.; Ghil, M. Cluster analysis of typhoon tracks. Part II: Large-scale circulation and ENSO. J. Clim. 2007, 20, 3654–3676. [Google Scholar] [CrossRef]
  47. Yoshida, N.; Kawamura, R.; Kawano, T.; Mochizuki, T.; Iizuka, S. Remote dynamic and thermodynamic effects of typhoons on Meiyu–Baiu precipitation in Japan assessed with bogus typhoon experiments. Weather Clim. Extrem. 2023, 41, 100578. [Google Scholar] [CrossRef]
  48. Feng, J.; Lian, T.; Ying, J.; Li, J.; Li, G. Do CMIP5 models show El Nino diversity? J. Clim. 2019, 33, 1619–1641. [Google Scholar] [CrossRef]
  49. Mochizuki, T.; Watanabe, M. Observed and hindcasted subdecadal variability of the tropical Pacific climate. ICES J. Mar. Sci. 2019, 76, 1271–1279. [Google Scholar] [CrossRef]
  50. Mochizuki, T.; Watanabe, M. Atlantic impacts on subdecadal warming over the tropical Pacific in the 2000s. Front. Clim. 2022, 4, 1040352. [Google Scholar] [CrossRef]
  51. Xie, M.; Wang, C.; Chen, S. The role of the maritime continent SST anomalies in maintaining the Pacific–Japan pattern on decadal time scales. J. Clim. 2022, 35, 1079–1095. [Google Scholar] [CrossRef]
  52. Kosaka, Y.; Xie, S.-P. The tropical Pacific as a key pacemaker of the variable rates of global warming. Nat. Geosci. 2016, 9, 669–673. [Google Scholar] [CrossRef]
  53. Meehl, G.A.; Hu, A.; Santer, B.D.; Xie, S.-P. Contribution of the Interdecadal Pacific Oscillation to twentieth-century global surface temperature trends. Nat. Clim. Change 2016, 6, 1005–1008. [Google Scholar] [CrossRef]
  54. Xie, S.-P.; Philander, S.G.H. A coupled ocean-atmosphere model of relevance to the ITCZ in the eastern Pacific. Tellus 1994, 46A, 340–350. [Google Scholar] [CrossRef]
  55. Kawamura, R.; Matsuura, T.; Iizuka, S. Role of equatorially asymmetric sea surface temperature anomalies in the Indian Ocean in the Asian summer monsoon and El Nino-Southern Oscillation coupling. J. Geophys. Res. 2001, 106, 4681–4693. [Google Scholar] [CrossRef]
  56. Chen, S.; Chen, W.; Xie, S.-P.; Yu, B.; Wu, R.; Wang, Z.; Lan, X.; Graf, H.-F. Strengthened impact of boreal winter North Pacific Oscillation on ENSO development in warming climate. Npj Clim. Atmos. Sci. 2024, 7, 69. [Google Scholar] [CrossRef]
  57. Eade, R.; Smith, D.; Scaife, A.; Wallace, E.; Dunstone, N.; Hermanson, L.; Robinson, N. Do seasonal-to-decadal climate predictions underestimate the predictability of the real world? Geophys. Res. Lett. 2014, 41, 5620–5628. [Google Scholar] [CrossRef]
  58. Kato, T. Statistical study of band-shaped rainfall systems, the Koshikijima and Nagasaki Lines, observed around Kyushu Island, Japan. J. Meteorol. Soc. Jpn. 2005, 83, 943–957. [Google Scholar] [CrossRef]
  59. Kato, T. Quasi-stationary band-shaped precipitation systems, named “Senjo-Kousuitai”, causing localized heavy rainfall in Japan. J. Meteorol. Soc. Jpn. 2020, 98, 485–509. [Google Scholar] [CrossRef]
  60. Kato, T. Interannual and diurnal variations in the frequency of heavy rainfall events in the Kyushu area, western Japan during the rainy season. Sci. Online Lett. Atmos. 2024, 20, 191–197. [Google Scholar] [CrossRef]
  61. Luo, J.-J.; Sasaki, W.; Masumoto, Y. Indian Ocean warming modulates Pacific climate change. Proc. Natl. Acad. Sci. USA 2012, 109, 18701. [Google Scholar] [CrossRef]
  62. Mochizuki, T.; Kimoto, M.; Watanabe, M.; Chikamoto, Y.; Ishii, M. Interbasin effects of the Indian Ocean on Pacific decadal climate change. Geophys. Res. Lett. 2016, 43, 7168–7175. [Google Scholar] [CrossRef]
  63. Zhang, Z.Q.; Sun, X.G.; Yang, X.Q. Understanding the inter-decadal variability of East Asian summer monsoon precipitation: Joint influence of three oceanic signal. J. Clim. 2018, 31, 5485–5506. [Google Scholar] [CrossRef]
  64. Liu, K.S.; Chan, J.C.L. Inactive period of western North Pacific tropical cyclone activity in 1998-2011. J. Clim. 2013, 26, 2614–2630. [Google Scholar] [CrossRef]
Figure 1. (A) The standard deviation of the observed daily rainfall in July (1981–2010) in the CPC global unified gauge-based daily precipitation dataset. (B) Same as panel (A), except for the simulated daily rainfall in the d4PDF dataset. The plotted values are the averages of the standard deviations calculated for the individual ensemble member.
Atmosphere 15 00814 g001
Figure 2. (A) Time series of the 99th-percentile (red) and 90th-percentile (black) values (mm/day) of the daily rainfall potential on Kyushu Island from June to August (1981–2010). The plotted values are anomalies derived from 100 ensemble simulations of the d4PDF dataset (solid lines) and those of another subset of d4PDF that was compiled using the pseudo-observed SST with the warming tendency due to anthropogenic forcing being removed (i.e., the so-called NAT simulation) (broken lines). (B) Scatter plots of the 99th-percentile (red) and 90th-percentile (black) values (mm/day) relative to the seasonal mean values (mm/day) derived from 100 ensemble simulations of the d4PDF dataset for the period from June to August each year.
Atmosphere 15 00814 g002
Figure 3. (A) The correlation coefficients of (shaded) the surface temperature anomalies and (contours) the vorticity at 850 hPa relative to the 99th-percentile values of the daily rainfall potential on Kyushu Island during the period from June to August (1981–2010). The plotted values indicate areas where the positive (warm colors) and negative (cool colors) correlation coefficients were significant at the 99, 95, and 90% confidence levels. Green vectors indicate the regression values of the horizontal moisture transport at 850 hPa in areas where the regression values of both the zonal and meridional components were significant at the 90% confidence level. The regression value is the coefficient, regr(x,y), of linear regression, Y(x,y,t) = regr(x,y) ∗ X(t) + b, where X(t) and Y(x,y,t) denote the 99th-percentile values of the daily rainfall potential on Kyushu Island and the plotted variables, respectively. (B) Same as in panel (A), except for the correlation and regression values being relative to the 90th-percentile values of the daily rainfall potential.
Atmosphere 15 00814 g003
Figure 4. (A) The correlation coefficients of the 90th-percentile values of the daily rainfall potential at each grid point relative to those on Kyushu Island in July (1981–2010) in the d4PDF dataset. (B) Same as panel (A), except for the correlations being relative to the fourth-heaviest values of daily rainfall observed on Kyushu Island in the CPC global unified gauge-based daily precipitation dataset.
Atmosphere 15 00814 g004
Figure 5. (A) The shades indicate the correlations in the maximum wind speed of the tropical cyclone center relative to the 99th-percentile values of the daily rainfall potential on Kyushu Island during the period from June to August. The plotted values indicate areas where the correlation coefficients were significant at the 99, 95, and 90% confidence levels. The contours indicate climatological values of the maximum wind speed of the tropical cyclone center (m/s). (B) Same as panel (A), except for the maximum sea level pressure of the tropical cyclone track (hPa). (C) Same as panel (A), except for the tropical cyclone track density (days/year).
Atmosphere 15 00814 g005
Figure 6. (A) Correlation coefficients of the 99th-percentile values of the daily rainfall potential at each grid point relative to those on Kyushu Island in July (1981–2010) in the d4PDF dataset. (B) Same as panel (A), except for correlations being relative to the heaviest values of daily rainfall observed on Kyushu Island in the CPC global unified gauge-based daily precipitation dataset.
Atmosphere 15 00814 g006
Figure 7. (A) The lagged correlation coefficients of 3-month mean observed SSTs relative to the 99th-percentile values of the daily rainfall potential on Kyushu Island during the period from June to August. A cosine envelope was applied to all the data for the analysis period (1981–2010). The plotted values indicate areas where the correlation coefficients are significant at the 99, 95, and 90% confidence levels. (B) Same as in panel (A), except for the application of a sine envelope to the SST and rainfall data for the analysis period. (C) The significant differences in the lagged SST regressions between the sine-enveloped data (see panel (B)) and the cosine-enveloped data (see panel (A)) in an F-test. The lagged regression values were calculated using 3-month mean observed SSTs relative to the 99th-percentile values of the daily rainfall potential on Kyushu Island during the period from June to August. The regression value is the coefficient, regr(x,y), of linear regression, Y(x,y,t) = regr(x,y) ∗ X(t) + b, where X(t) and Y(x,y,t) denote the 99th-percentile values of the daily rainfall potential on Kyushu Island and the plotted variables, respectively.
Atmosphere 15 00814 g007
Figure 8. Same as in Figure 7, except that the lagged correlation and regression values are relative to the 90th-percentile values of the daily rainfall potential on Kyushu Island during the period from June to August.
Atmosphere 15 00814 g008
Figure 9. (A) The perfect model anomaly correlation coefficients of the 99th-percentile values of the summertime daily rainfall potential in 100 ensembles of the d4PDF dataset. The contours represent the average of the correlation coefficients of interannual fluctuations. The shades represent the areas where more than 90% of the perfect model ensembles indicated positive correlation values, as a proxy for significant levels of the correlation coefficients. (B) Same as in panel (A), except for the 90th-percentile values of the daily rainfall potential.
Atmosphere 15 00814 g009
Figure 10. The skewness of the probability density of daily rainfall on Kyushu Island, defined as the cubed deviation of the normalized values for a specific threshold. The blue and red dots indicate the skewness values of the potential chances exceeding a specific rainfall intensity (i.e., 10, 20, 30, …, 100 mm/day) and the potential amounts of daily heavy rainfall (i.e., 99th-, 95th-, and 90th-percentile values), respectively.
Atmosphere 15 00814 g010
Disclaimer/Publisher’s Note: The statements, opinions and data contained in all publications are solely those of the individual author(s) and contributor(s) and not of MDPI and/or the editor(s). MDPI and/or the editor(s) disclaim responsibility for any injury to people or property resulting from any ideas, methods, instructions or products referred to in the content.