Article

Particulate Matter in the Eastern Slovakia Region: Measurement, Monitoring, and Evaluation

1
Department of Theoretical and Industrial Electrical Engineering, Faculty of Electrical Engineering and Informatics, Technical University of Košice, 042 00 Košice, Slovakia
2
Department Computers and Informatics, Faculty of Electrical Engineering and Informatics, Technical University of Košice, 042 00 Košice, Slovakia
*
Author to whom correspondence should be addressed.
Atmosphere 2024, 15(7), 802; https://doi.org/10.3390/atmos15070802
Submission received: 27 May 2024 / Revised: 18 June 2024 / Accepted: 2 July 2024 / Published: 4 July 2024

Abstract

:
The paper focuses on the measurement of PM and other meteorological parameters in a small region of central Europe—eastern Slovakia and northeastern Hungary. Due to the increasing availability of sensors measuring not only PM, but also temperature, humidity, pressure, VOC, NOx, and CO2, new possibilities arise in terms of comparing (mainly in terms of correlation) PM and the other measured parameters, thus generating a large amount of data for evaluation. The correlations found are typical for inland conditions, thus able to map other regions of the world. The presented measurements can also be used to predict the evolution of PM with alerts for people with respiratory diseases, or in virtual reality using a digital twin of a humanoid robot.

1. Introduction

The global concern about PM is related to the decline in air quality, environmental degradation, and consequent human morbidity and premature deaths (according to the World Health Organization, more than 7 million people die prematurely due to air pollution [1], including 1.2 million in India [2]). The negative impact of PM on the respiratory and cardio-vascular systems of humans (children, the elderly, and pregnant women are particularly adversely affected) presents complications with respiration, asthma, lung cancer, cardiac arrest, and the aforementioned premature deaths [3,4,5,6,7,8,9,10,11,12,13]. Gastrointestinal tract problems have also been observed as a negative impact of PM on human health [14,15]. The research on the negative effects is not complete and newer studies are still emerging, such as [16,17,18,19,20]. Research on PM is now broadening not only to assess the impact of PM on human health, but also on plants [21].
PM originates from a variety of sources, which may be natural (such as desert sand, volcanic smoke, pollen, or sea salt) or anthropogenic (originating in human activities such as fuel combustion, heating, transportation, construction, or industrial activities, etc.) [22]. According to Slovak Hydrometeorological Institute reports, in 2021 [23] and 2022 [24] in the Slovak Republic, the largest source of PM emissions in all regions was due to heating [25], except for the Bratislava and Košice urban agglomerations, where PM originating in road traffic (Bratislava agglomeration) [26,27] or from point sources (Košice agglomeration) [28,29] was predominant. Point sources of air pollution are medium and large sources of air pollution registered in the NEIS database [30]. Point sources include power plants, steel factories, foundries, incinerators, wood and pulp processors, paper mills, refineries, and chemical production facilities. Typically, these sources emit pollutants through tall chimneys to ensure adequate dilution before reaching ground level. However, specific weather conditions can limit this dispersion, causing pollutants to remain near the source and settle at the ground level, resulting in poor air quality. Point sources of air pollution may have a range of influence from 0.5 to 1 km, but, depending on the source and the surrounding population, it may increase to a larger area, e.g., 5 to 10 km from the source [31]. The locations of all point sources of pollution in Slovakia are shown in Figure 1.
The layperson interested in the subject can currently find information on PM or the air quality index (AQI) on mobile phones in selected weather forecasting apps. Most of the time, this is local information or information about a specific location in the app. If one is interested in PM concentrations and global trends, the website https://waqi.info/ (accessed on 3 July 2024) [32] may be useful. There is a colorful distribution of PM concentrations and, after zooming in on the map and selecting a location, the user can see the number of measured parameters, their changes over the last 12 h, and also the change in air parameters over the last 12 months in the form of a heat map. The information for the different locations that are shown can also include a forecast of the parameters from 0 to 6 days. Data on the website is collected from 50,000 stations in 2000 major cities from 132 countries. These are the official data from each county’s respective Environmental Protection Agency (EPA). Data from each EPA is measured using professional monitoring equipment [33]. The site uses multiple forecast models for locations. For example, for Brazil, it uses the BRAMS forecast model [34]. Forecast models for Asia and India are based on predicting wind direction and wind speed [35,36], while the forecast model for India considers the population density for predicting anthropogenic PM [36]. In this way, the average person interested in the topic of PM and other related factors influencing air quality can obtain a quick overview both globally and locally.
If one is interested in tracking the dynamic changes in the environment or correlation between individual measured parameters, the AQI data provided by the website mentioned earlier will no longer be sufficient. It will be necessary to buy an instrument for measuring PM (which is a more costly solution), or to design and build a device for measuring PM and other influencing factors, e.g., meteorological factors, precursors of PM, or other air pollutants (which would be a less expensive solution), followed by a data evaluation and analysis of the measured parameters. Such has been the case for PM measurements in Thailand [37], Myanmar [38], Taiwan [39], Romania [40], Canary Islands [41], Seoul, Korea [42], etc. A fair number of papers deal with measurements near oceans or seas, and fewer with typical inland areas, if we do not consider deserts [43]. Our interest in measurement and the evaluation of measurements in the interior of the European continent is not unique. There are known measurements in the borderlands between the Czech Republic and Poland [44,45], in and around Krakow, (Poland) [46,47], in Germany [48], in Prague [49], Brno [50], and Ostrava [51,52] (Czech Republic), or Žilina (Slovak Republic) [19]. However, these are measurements within the city or the wider surroundings, mostly carried out at pollution sources (an exception is Kraków, a city located in a valley).
Slovak Republic is positioned in the middle of Europe, so we first became interested in PM values in Košice, in the vicinity of the city and then in more distant regions. Our first PM-related measurements were based on a relatively short-term measurement in the city of Košice, Slovak Republic (east of Slovakia). Subsequently, more measuring points were added in villages and towns located in the east of Slovakia. In this way, we obtain PM information over a larger area compared to the works of [19,44,45,46,47,48,49,50,51,52]. However, in papers [46] and [47], the area of Kraków and the surrounding towns and villages is much more densely sampled and covered by 100 measuring stations, which allows the authors to obtain a better resolution of PM concentrations with respect to the geographical area of the measured territory.
Currently, the city of Košice is in a region where the largest contributor to air pollution is U. S. Steel (or Nippon Steel Corporation, as it will be after its sale). U. S. Steel is the largest air polluter in Slovakia [53]. In 2022, emissions from U. S. Steel accounted for 15.20% of pollution that originates from point sources of air pollution in Slovakia and 62.82% in the Košice region. The factory is 11 km to the south-southeast of the Technical University of Košice campus by air. Figure 2 illustrates the visible air pollution and the factory at different times and from different positions of the image acquisition.
There are other sources of pollution in the city of Košice, such as the main Košice heating plant (Figure 3a) and smaller heating plants (Figure 3b). Thus, in our papers [54,55,56,57,58], information on PM concentrations and the correlation between PM and meteorological factors were gradually collected. At the beginning, only PM, pressure, temperature, and humidity were measured. Later, wind speed and CO2 were also measured at some locations. As the Sensirion sensors were gradually improved, VOC and NOx could also be measured. This article gives an overview of the development of PM and other variables and their correlation during 2023.
The growing interest in monitoring PM, temperature, humidity, and air pressure, particularly as it relates to the needs of sensitive individuals, stems from the recognition that air quality greatly affects our health and well-being. PM is one of the main air pollutants that can cause a variety of health problems, from respiratory problems to serious respiratory illnesses and cardiovascular problems. The overall motivation for measuring these variables is to understand the processes underlying PM, as well as the relationships between PM and other measured variables, in order to potentially further exploit the measured data, for example in the field of artificial intelligence and deep learning, which cannot be utilized without a sufficient amount of measured data and a proper understanding of these relationships.
A very interesting field in terms of the use of such measurements is also the field of artificial intelligence and robotics, especially at the level of human–robot interaction (HRI) [59,60]. The field concerns humanoid robot assistance for people in risky areas with polluted air [61]. The assistance may include informing about pollution levels, recommending and offering protective equipment and navigating around the most dangerous or limited areas [62]. The data obtained in the way described in this article can also become an excellent knowledge base not only for the field of the ecology and environment, but also for development in the abovementioned field of artificial intelligence and HRI.

2. Materials and Methods

2.1. Sensors

We used the SEN5x sensors in our measuring devices, namely SEN54 and SEN55. Most of our measuring devices contain SEN54, which measures PM, typical particle size (TPS), the VOC index, temperature, and humidity, while some devices (the locations of which are specified in Section 2.3) use SEN55, which measures the NOx index in addition to all the other parameters. SEN5x uses the optical method for measuring PM, based on the interaction between the particles and light. SEN5x contains a laser (660 nm wavelength) and a photodiode measuring the intensity and angle of the light scattered by the particles, which is strongly dependent on the ratio of the size of the particle to the wavelength of incident light [63,64]. MS5611 measures atmospheric pressure [65]. In some measuring locations, CO2 is measured by SCD41 [66], and anemometer WH-SP-WS01 measures wind speed [67]. The accuracy of sensors is shown in Table 1.
Since the SEN5x are low-cost sensors, it is important to determine their reliability by comparing them with reliable measured data. As a source of reliable data, we can consider the SHMÚ, which publishes the measurement results on its website. The SHMÚ measures PM2.5 and PM10 at a number of measuring stations. In the city of Košice, the nearest station is located on Štefánikova Street, 1.1 km from the Department of Theoretical and Industrial Electrical Engineering, where the measurement station “Košice-TUKE” is located. The measurements were carried out between 22 October and 31 December 2022.
We investigate the correlation between the following:
1.
PM10 Košice-TUKE and PM10 SHMÚ-Štefánikova,
2.
PM2.5 Košice-TUKE and PM2.5 SHMÚ-Štefánikova.
The calculated correlation coefficients are presented in Figure 4. According to [68], there is a particularly strong correlation between two parameters if |r| ≥ 0.8. For values of 0.4 ≤ |r| ≤ 0.8, the author reports a moderately strong correlation. From this, we can conclude that there is a very strong correlation for PM2.5, while the correlation for PM10 is at least close to this. However, other literature may define the thresholds for strong correlation differently. For example, according to [69], the correlation is very strong if 0.7 ≤ |r| ≤ 0.9, where r for PM10 would also fall.
The statistical significance of the correlation is determined by the p-value. If the p-value is less than 0.05, the observed correlation is statistically significant and not due to chance. Both p-values are well below the 0.05 threshold (for PM10 the p-value is 2 × 10⁻¹⁴, while for PM2.5 the p-value is 6 × 10⁻¹⁸), from which we can conclude that the correlations are highly statistically significant.
Given the 1.1 km distance between the measuring stations and the strong positive r and extremely low p-values, the low-cost sensor SEN55 performs sufficiently for the purposes of this paper.

2.2. The Measuring Device

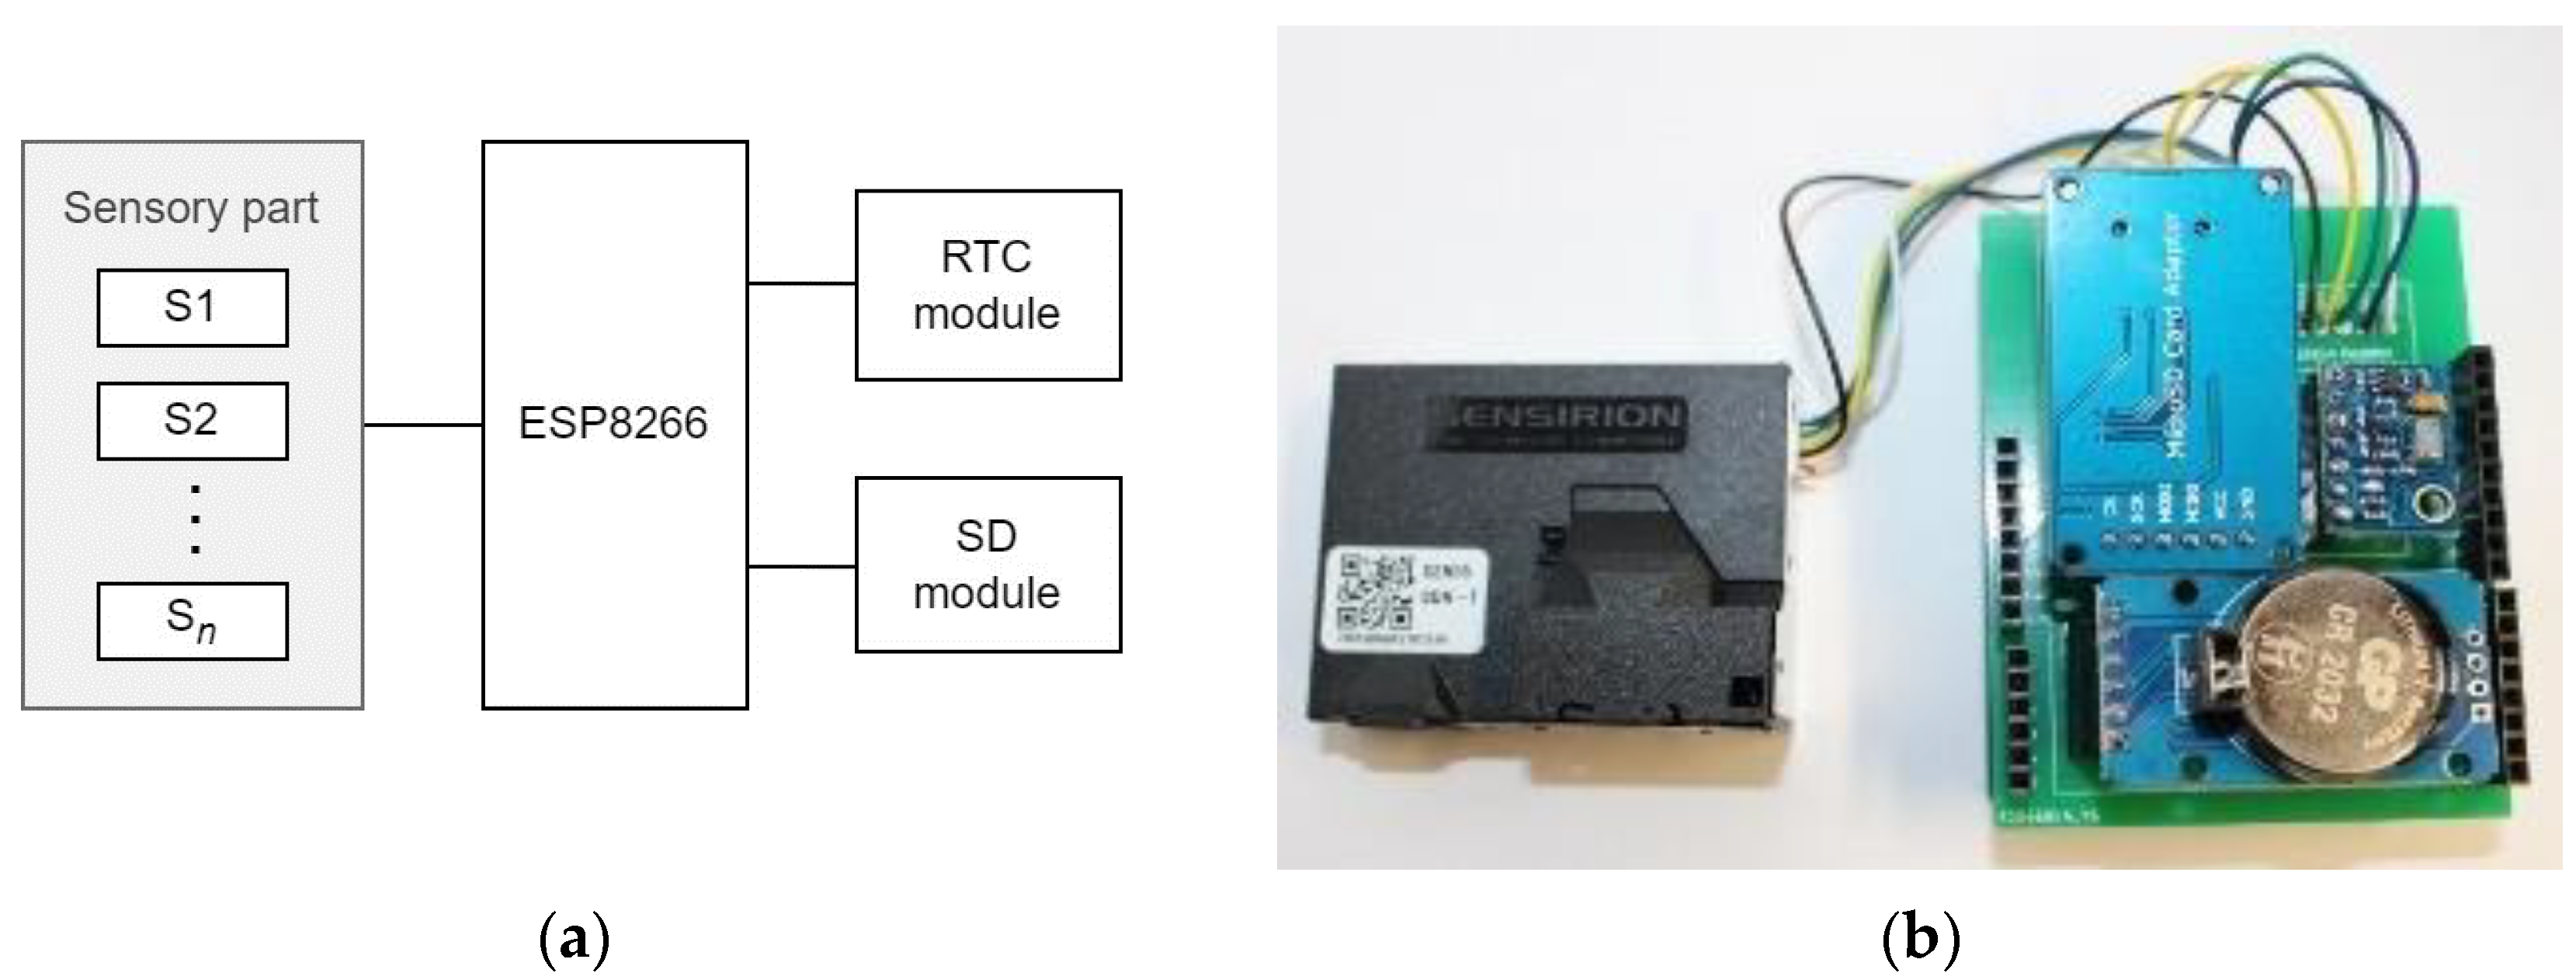
The measuring device (Figure 5) is based on the ESP8266 microcontroller. Other than the sensors and the microcontroller, the device also contains an RTC module for timestamping the measured values and a microSD card module for logging the measured values into a *.csv file every 5 s. The device also sends the values to a time-series database InfluxDB via Wi-Fi every minute [70]. The measurements are visualized using Grafana. It is important to note that all measuring devices contain sensors SEN5x and MS5611. However, in some locations, additional sensors, including SCD41 and an anemometer (WH-SP-WS01), were used. Those locations are specified in Section 2.3.

2.3. The Measuring Locations

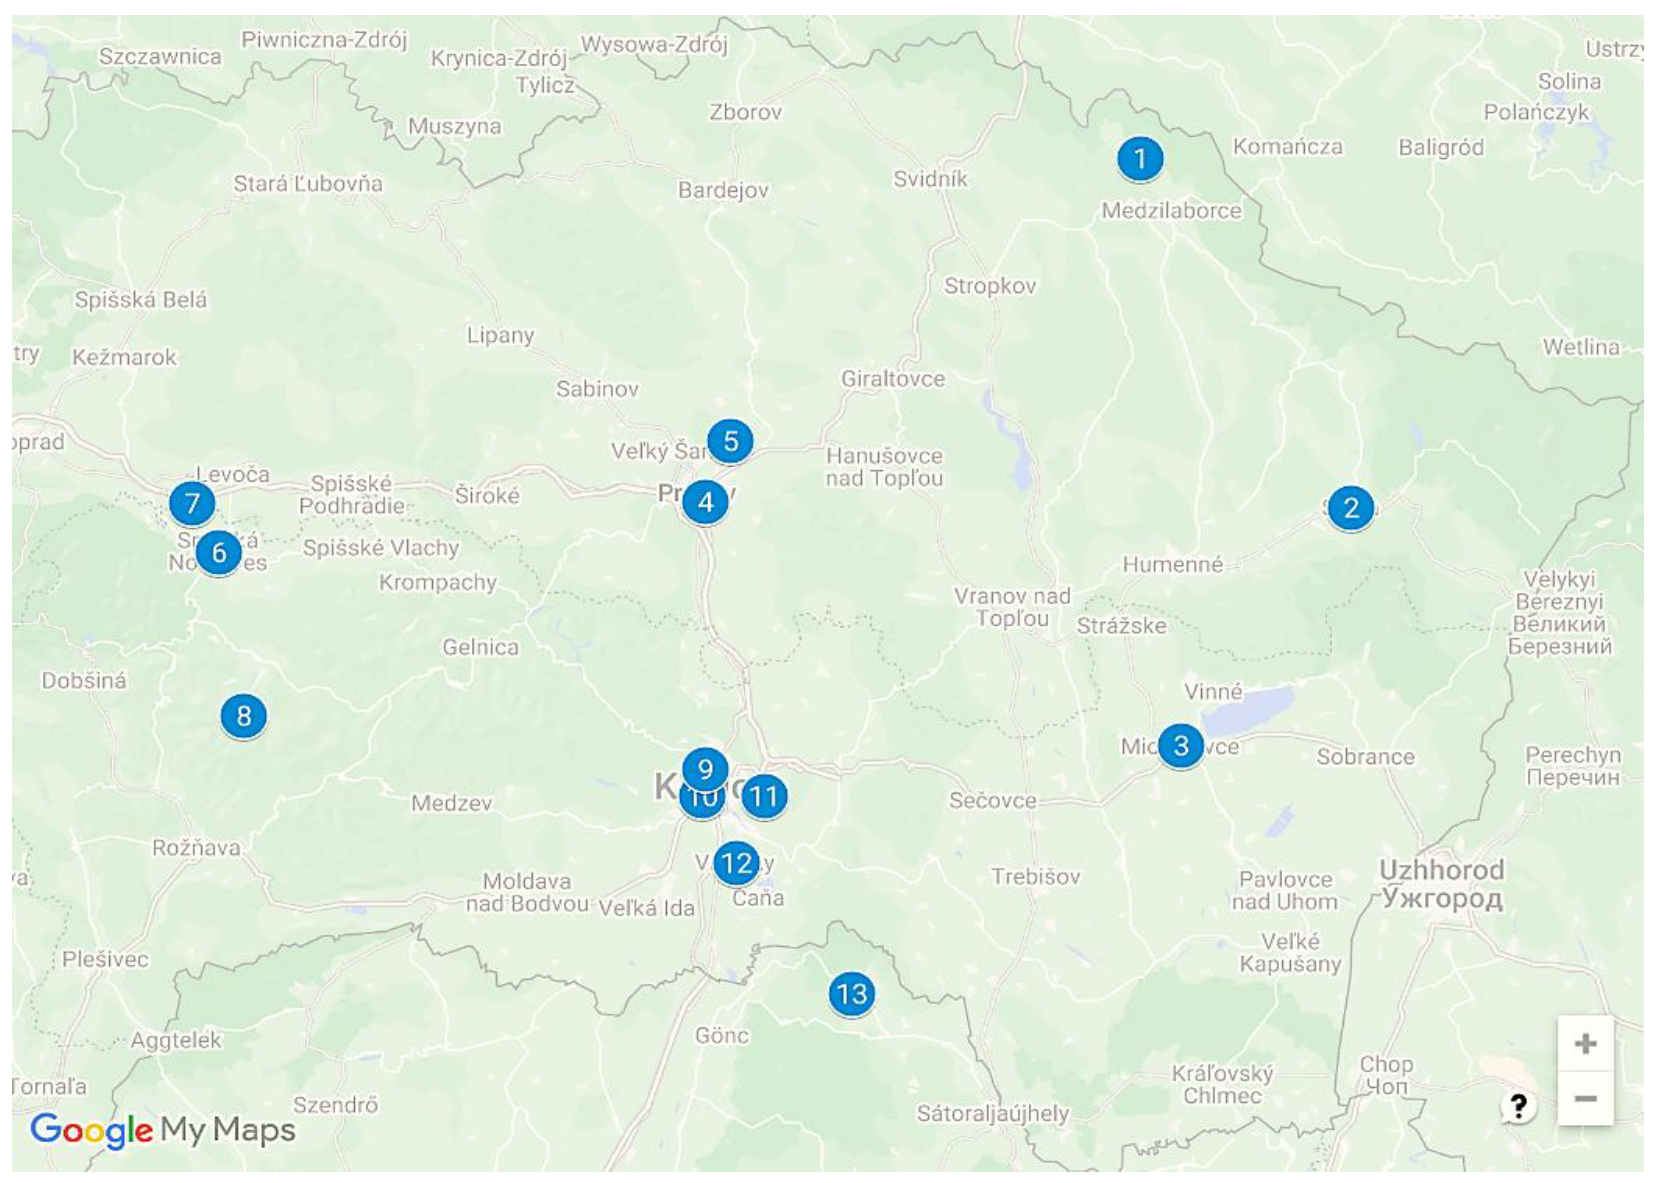
In total, there are thirteen measuring devices. Figure 6 shows their location on the map. Twelve devices are located in eastern Slovakia (1–12), while one device (13. Füzérkomlós) is located in a small Hungarian village 10 km to the south of the Slovakia–Hungary border.
Table 2 contains the description of all measuring locations and the start and end of the measurement. The measurements in two locations (Zdoba, Valaliky) had already ended, while eleven devices continue to carry out the measurements. However, for the purpose of this paper, we will only consider the measurements until the end of 2023. All measurements take place outdoors and are placed either on the windowsill or balcony of the building or outside on the property of the family house. Urban stations are situated in densely populated cities, where high concentrations of buildings, roads, and human activities influence air quality. Suburban stations are located on the outskirts of cities and are characterized by single-family houses in the neighborhood, with a population density that is higher than rural areas yet lower than urban centers. Rural stations are located in villages or sparsely populated areas with minimal traffic and infrastructure. These areas rely heavily on wood combustion for heating. The distance from the roads in the vicinity of the measuring device to nearby point sources of pollution [30,71] and other relevant factors are also specified in Table 2. Despite the fact that [31] specifies the distance of the influence of point sources of pollution up to 10 km, we will also consider U. S. Steel, which is at a distance of 11 km and 11.8 km from the Košice-TUKE and Zdoba stations, respectively, due to U. S. Steel being the largest point polluter in the Slovak Republic [53]. The stations are selected according to the availability of family houses or apartments.
Table 3 further specifies the measured parameters by location. Cells marked with an X denote the measured parameters, while cells marked with a dash (-) are the parameters which were not measured at a given location. While PM, the VOC index, temperature, humidity, and pressure are measured at every location, the same is not the case for the NOx index, CO2, and wind speed (WS), which are only measured in SNV (NOx index), Košice-TUKE (NOx index, CO2, WS), Košice-West (NOx index), Valaliky (WS), Zdoba (WS), and Füzérkomlós (NOx index, CO2, WS).

2.4. Data Analysis

A MATLAB application was created to analyze and visualize the measured data. Hourly, daily, and monthly averages are calculated from the measured values.
The hourly averages (which minimize noise and smooth out short-term fluctuations and outliers) are used for calculating Pearson’s correlation coefficient (r) for the time interval of one day between PM and other parameters (temperature, humidity, pressure, wind speed, VOC, NOx, CO2) using the corrcoef() function [72], which defines Pearson’s correlation with the following expression:
r x , y = 1 n 1 i = 1 n x i μ x σ x · y i μ y σ y ,
where
  • x, y—measured parameters,
  • μx, μy—mean of x and y,
  • σx, σy—standard deviation of x and y,
  • n—number of values in the set.
The resulting correlation coefficient has a range from −1 to +1, with |r| ≥ 0.8 being considered a strong correlation, 0.4 ≥ |r| > 0.8 being considered a moderate correlation, and |r| < 0.4 being a weak correlation [68].
A post hoc test was used to determine the statistical significance of the calculated correlation coefficients. The null hypothesis is that there is no significant correlation between PM and other measured parameters:
H 0 :   ρ = 0 .
The p-value was tested at a significance level α = 0.05 (i.e., if p < α, we can reject the null hypothesis and r is statistically significant). It is calculated alongside r, using the function in the following format:
[ r   p ] = c o r r c o e f ( X , Y ) ,
where
  • r—Pearson’s correlation coefficient,
  • p—p-value,
  • X, Y—parameters, between which the correlation is calculated.
Furthermore, daily average values are used for calculating the AQI (air quality index), which indicates how polluted the air is from a public health standpoint. First, sub-indices are calculated from 1 h, 8 h, or 24 h averages from six air pollutants. SO2 and NO2 use 1 h averages, CO and O3 use 8 h averages, while PM2.5 and PM10 use 24 h averages [73,74]. Since only PM2.5 and PM10 are measured, we will focus only on those air pollutants. It should be noted that the breakpoints for PM2.5 changed on 7 February 2024 [74], which we highlight in Table 4. However, since the measurements were taken in 2022 and 2023, for the evaluation, we still used the breakpoints before the change in 2024. Pollutants PM2.5, O3, and PM10 significantly impact the AQI. Furthermore, [75] indicates that PM2.5 is a critical pollutant influencing the AQI in urban environments, highlighting its significant role in health outcomes and air quality degradation. PM10, although impactful, has a less pronounced effect on the AQI when compared to PM2.5 due to its larger particle size [76]. O3 also contributes to air quality issues, particularly in urban areas with high levels of vehicular emissions and industrial activities. It plays a crucial role in the formation of photochemical smog [77]. These findings are supported by extensive data analysis and predictive modeling [78]. CO, SO2, and NO2 still contribute to air quality degradation and have significant health impacts, though their influence on the overall AQI is typically lower [79,80]. The AQI has six different categories of air quality defined for each pollutant, as can be seen in Table 4.
The sub-index IP for pollutant p can be calculated as follows:
I P = I H i I L o B P H i B P L o C P B P L o + I L o ,
where
  • IP—sub-index for pollutant p,
  • CP—truncated concentration of pollutant p,
  • BPHi—concentration breakpoint ≥ CP,
  • BPLo—concentration breakpoint ≤ CP,
  • IHi—AQI value corresponding to BPHi,
  • ILo—AQI value corresponding to BPLo.
The final AQI is determined as the maximum of the sub-indices for each pollutant as follows:
AQI = max ( I P M 2.5 , I P M 10 , I C O , I S O 2 , I N O 2 , I O 3 ) .
However, due to only measuring PM2.5 and PM10, we only use a maximum of those two sub-indices as follows:
AQI = max ( I P M 2.5 , I P M 10 ) .

3. Results

The results are divided into several parts. One part will focus on PM concentrations, another part will address the AQI, a third part will cover particle sizes, and the final part will examine the correlation of PM with other measured parameters.

3.1. Mass Concentration of PM

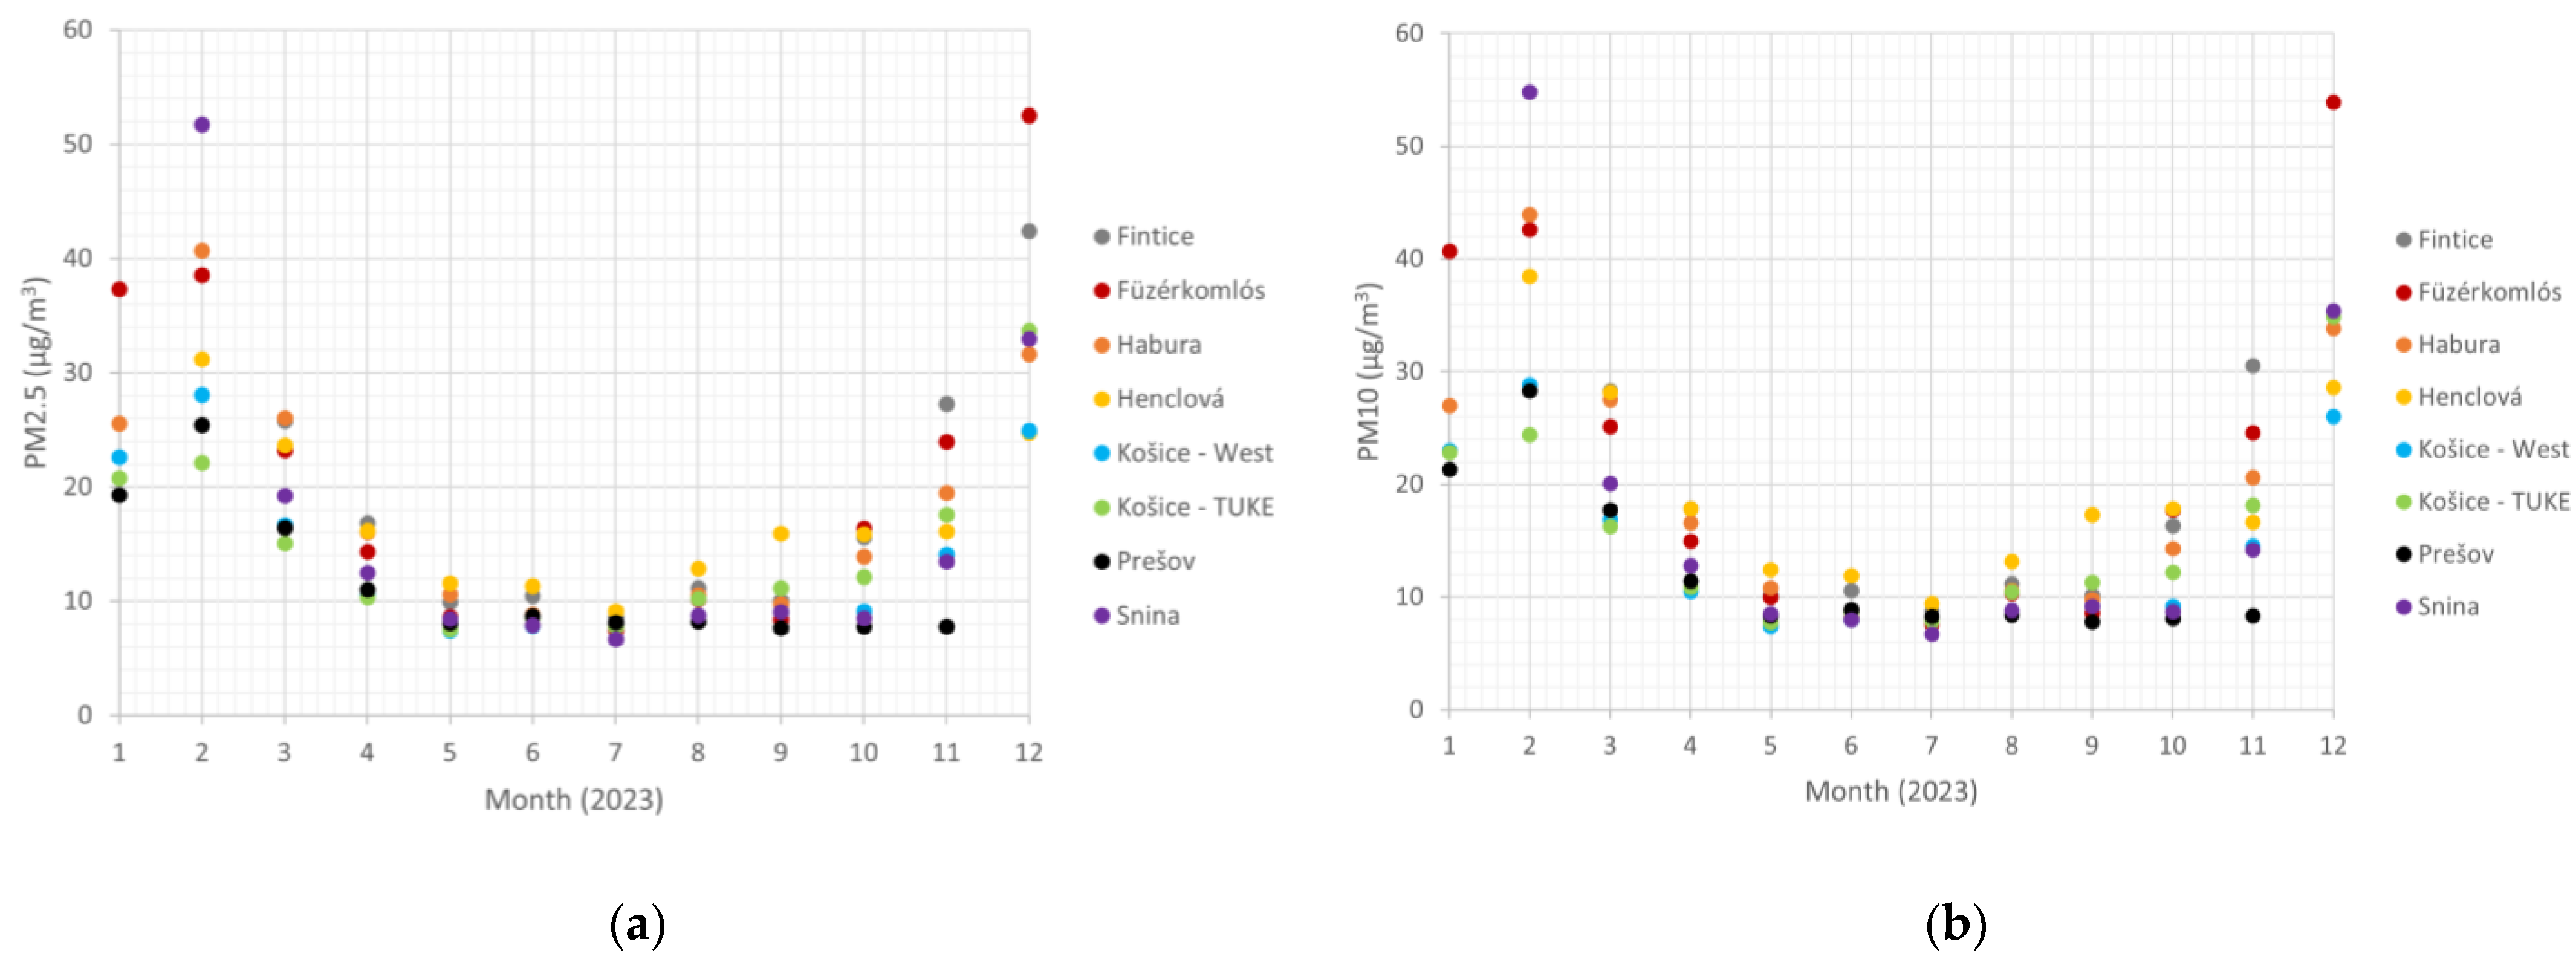
The focus of our measurements is on the particles PM10 and PM2.5. Monthly data are analyzed to investigate the seasonality of PM. Figure 7 presents the monthly averages from long-term measurement stations, categorized by month. We define long-term measurement stations as stations which have at least 10 months of recorded measurements in 2023. Higher concentrations of both PM2.5 (Figure 7a) and PM10 (Figure 7b) appear during the autumn and winter months (especially from November to February). In contrast, lower concentrations are noted in the spring and summer, forming a U-shape pattern in the graphs. These increased concentrations are primarily due to the heating season in autumn and winter. In suburban and rural areas, wood burning in family homes often contributes to poorer air quality.
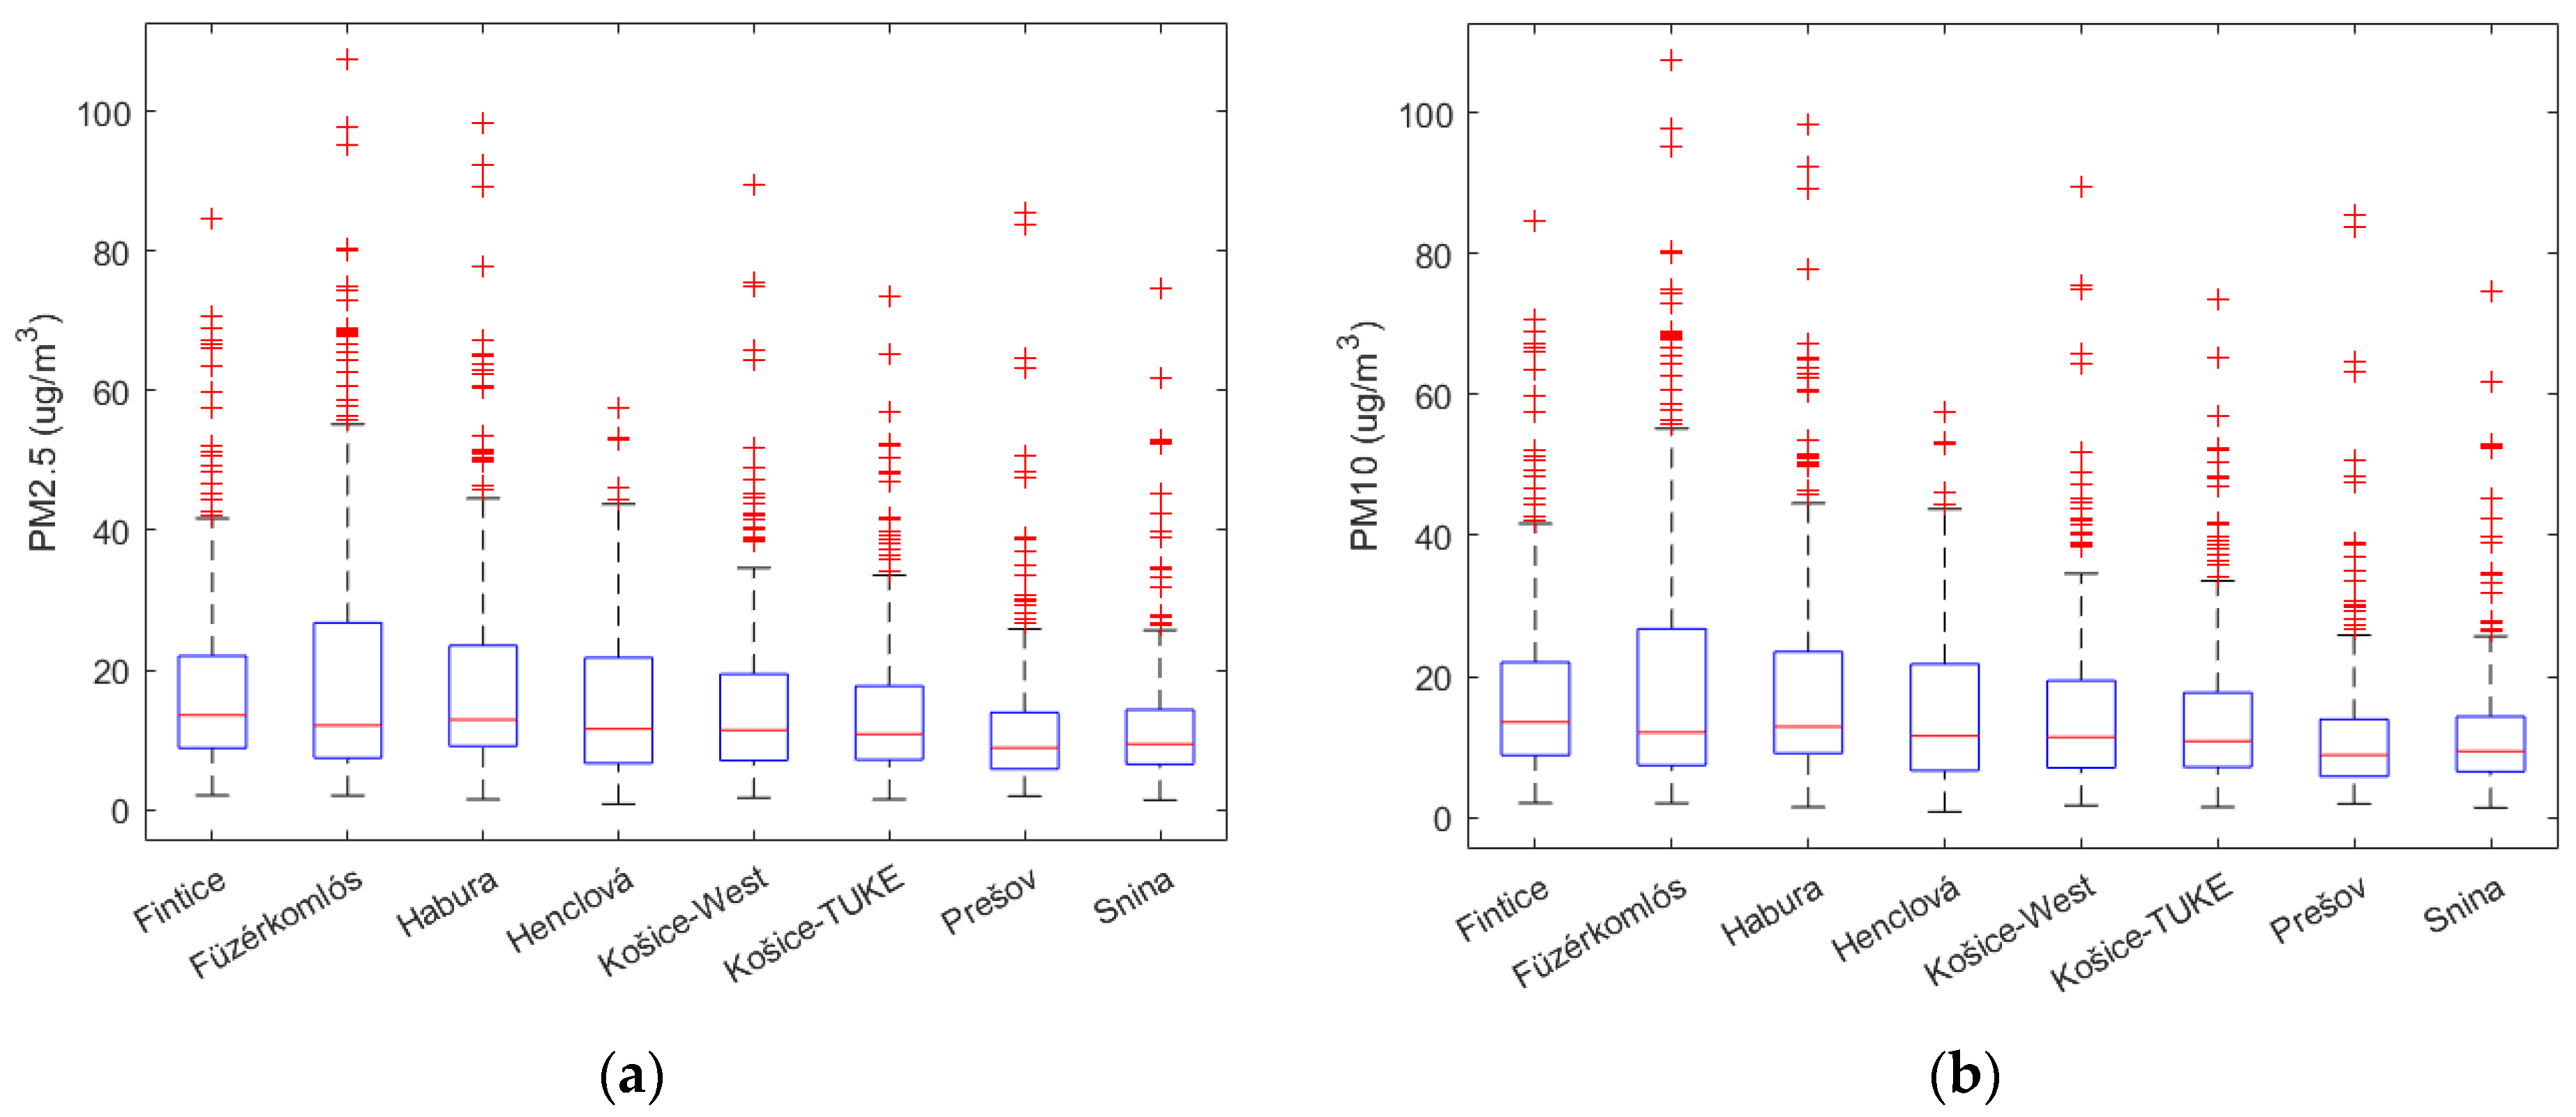
The mass concentrations of long-term measuring stations in 2023 are depicted in Figure 8. The highest mass concentrations were observed in Füzérkomlós, Habura, Fintice, and Henclová, which are the rural-type measuring stations. The lowest mass concentrations can be seen in Prešov (suburban) and Snina (urban) stations. The urban measuring stations in Košice (West, TUKE) have shown higher mass concentrations than Prešov and Snina, but lower than the rural stations. These stations are within the range of influence of point pollution source U. S. Steel in Košice-Šaca.
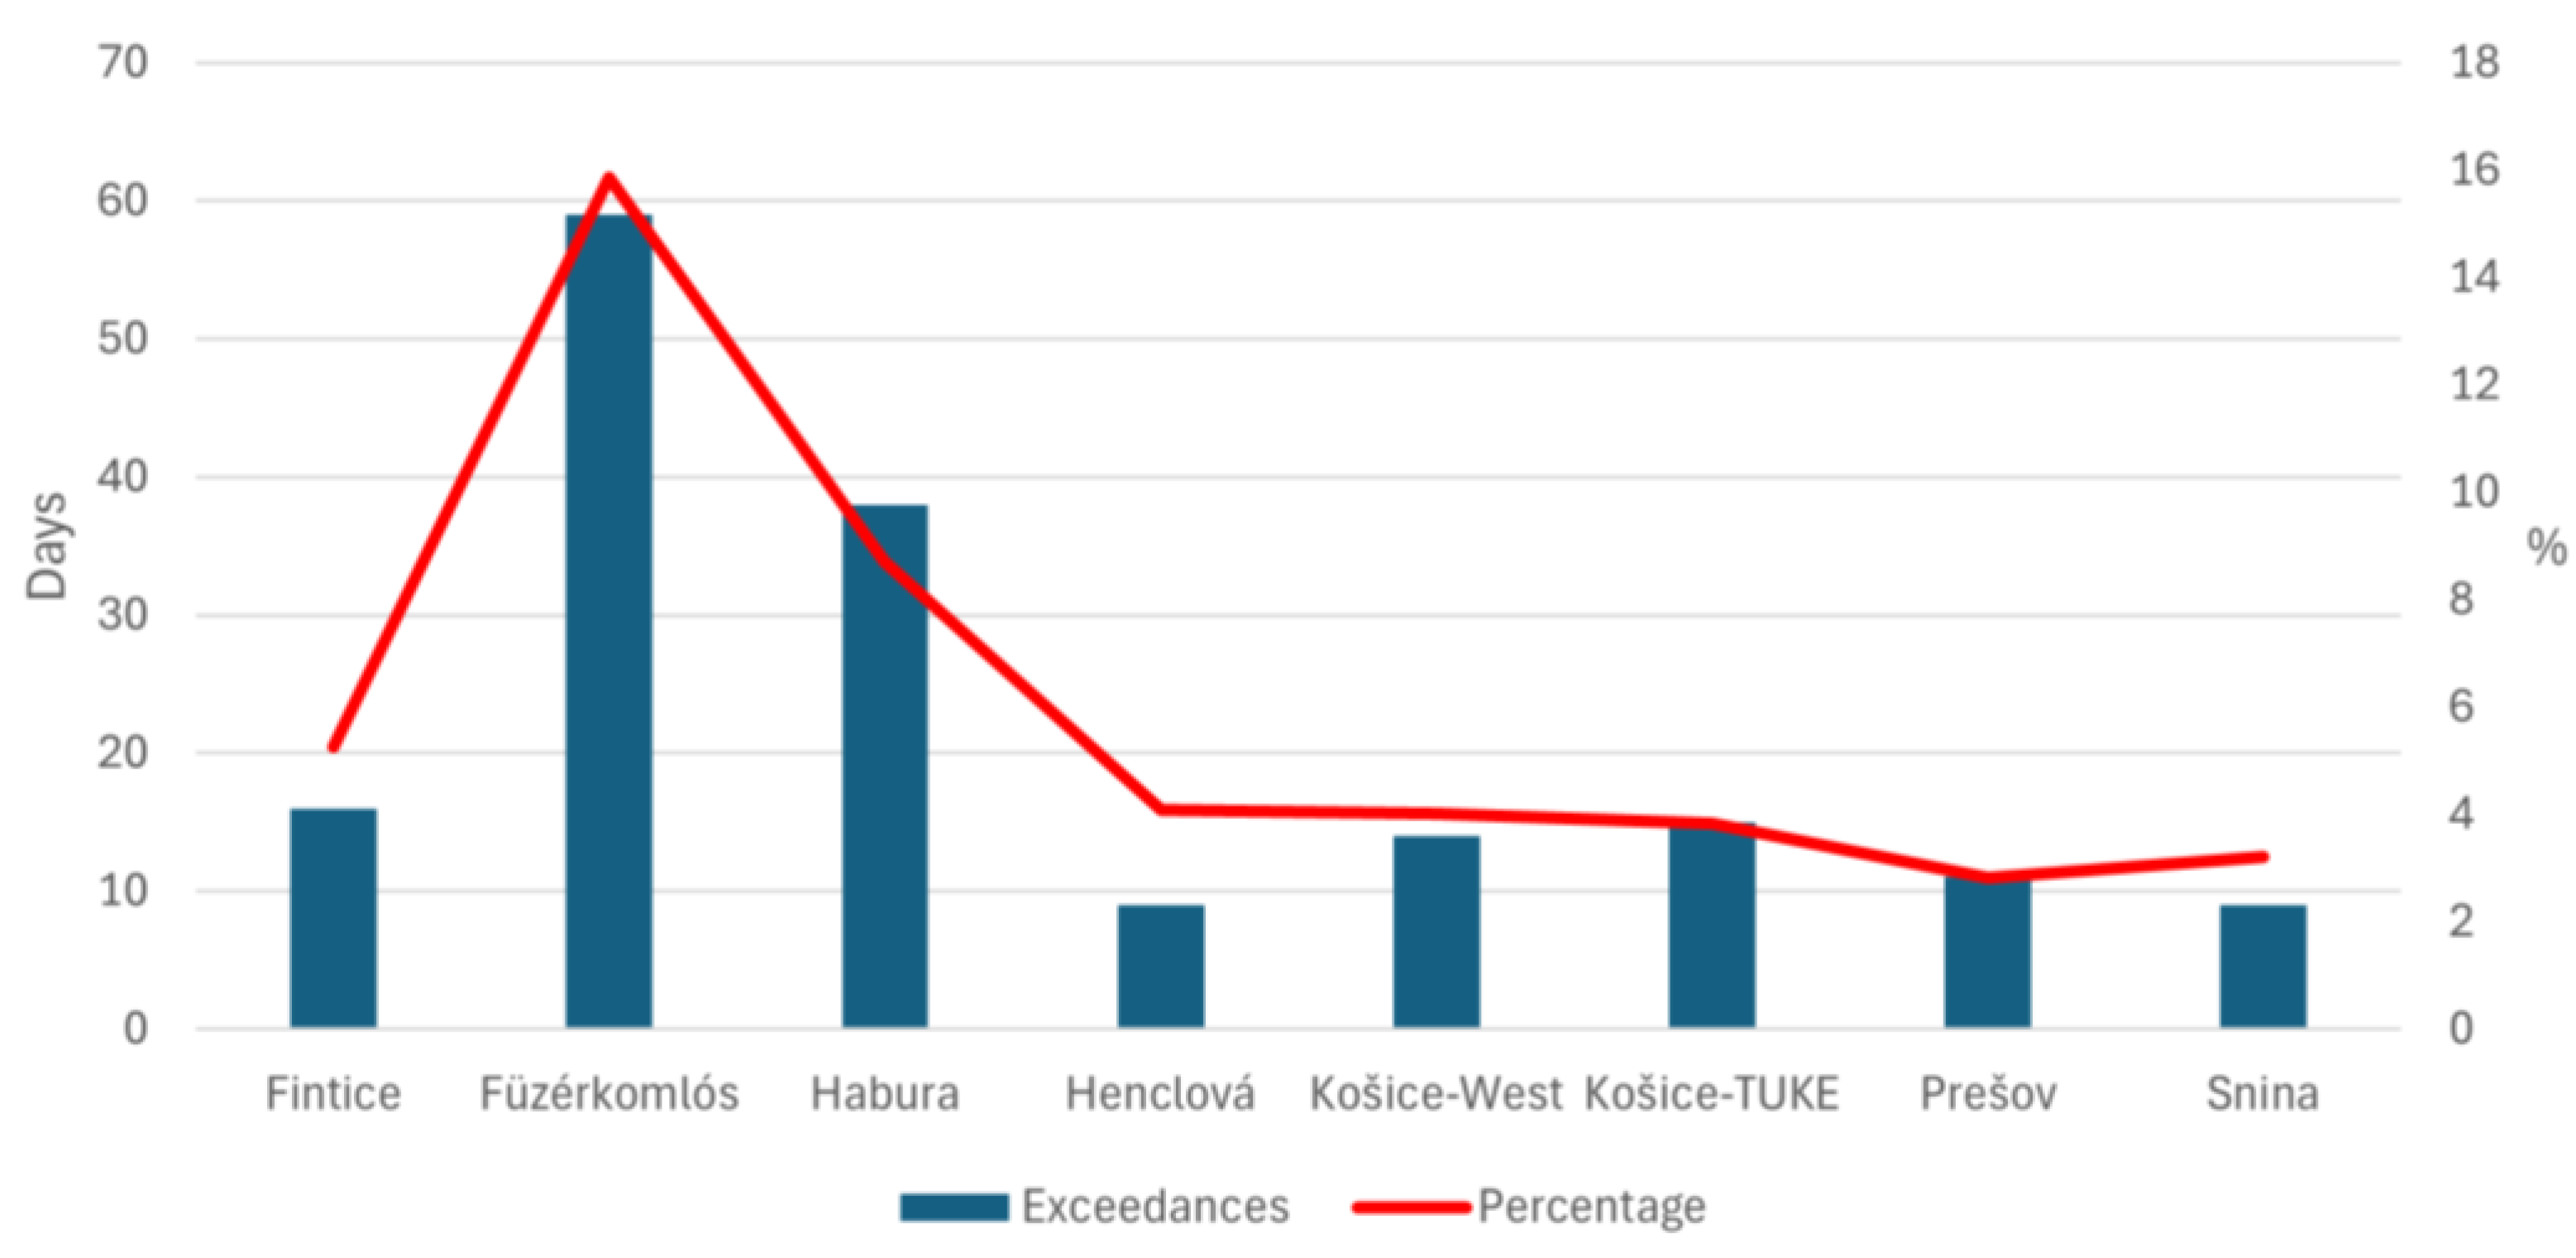
According to WHO [1], the daily average limit value of PM10 is 50 μg/m3. Figure 9 illustrates the number of exceedances of this limit value (depicted by dark blue bars) for the long-term stations in 2023. The highest number exceedances were observed in Füzérkomlós and Habura, which are among our rural stations. Urban stations (Košice-Tuke, Košice-West) and the rural Fintice station follow. The stations with the fewest exceedances were in Prešov (suburban), Snina (urban), and Henclová (rural). For the most part, there is a divide between rural stations (higher mass concentrations, more exceedances) and urban/suburban measuring stations (lower mass concentrations, fewer exceedances).

3.2. Typical Particle Size

The typical particle size (TPS) is an indication of the average particle diameter in the sample of particles measured by the sensor. The lower size limit of particles, which can be measured by SEN5x, is 0.3 μm [63]. While precision is not given for the TPS, we have given precision for each PM size category, as summarized in Table 1.
Figure 10 shows the TPS measurements by location (Figure 10a) and the monthly average values from all locations (Figure 10b). From Figure 10a, it can be seen that the largest values of TPS were measured in Henclová (average ~0.55 μm), then Prešov, Fintice, Habura, and Košice-TUKE. The smallest values of the TPS were recorded in Snina, Košice-West, and Füzérkomlós. Regarding the monthly averages, from the graph shown in Figure 10b, it can be seen that the highest values of the TPS values occur in the winter period and the lowest values in the summer period, similar to the monthly averages of the mass concentration of PM2.5 and PM10 in Figure 6, once again forming a U-shaped pattern in the graph. At higher concentrations of PM, the measured sample contains more particles with a larger diameter, and the TPS is also higher.

3.3. Air Quality Index

The AQI (as well as the correlation coefficients in the next chapter) will be calculated for the measurements of all stations in 2022 and 2023 (including long-term and newly added stations). Figure 11 shows the distribution of the AQI categories, summarized for every measuring location. Out of the six categories, only “Good,” “Moderate,” “Unhealthy for Sensitive Groups,” and “Unhealthy” categories were observed. The categories “Very Unhealthy” and “Hazardous” did not occur even once during the entire measurement period. The most days with “Good” air quality were recorded in Füzérkomlós, Košice-TUKE, Prešov, SNV, and Snina. Košice-TUKE and Snina showed “Good” air quality due to their urban location. The stations Prešov and SNV are suburban, and apparently household heating is not as prevalent there as in the villages. Although Füzérkomlós has many days with good air quality, it also leads in the categories “Unhealthy for Sensitive Groups” and “Unhealthy” as it is a long-term station. “Moderate” air quality prevailed in Fintice, Habura, Iliašovce, Zdoba, (all rural stations) Košice-West (urban station, close to U. S. Steel point source), and Michalovce (measurements were mostly carried out in autumn and winter when the concentrations are higher). In Valaliky, the air quality was most frequently “Unhealthy for Sensitive Groups,” but the measurement was conducted only briefly at the turn of autumn and winter. Overall, more days with an AQI in the “Unhealthy for Sensitive Groups” category were recorded at the Habura and Füzérkomlós stations. The most days with “Unhealthy” air quality were also recorded in Füzérkomlós.

3.4. Correlation between PM and Other Measured Parameters

Investigating the correlation between PM and other measured parameters like temperature, humidity, pressure, wind speed, VOC, nitrogen oxides NOx, and CO2 is crucial for effective air quality management. Understanding these correlations helps gain deeper insight into the relationships between the measured parameters and PM itself. Specifically, we used PM10 particles in the calculations as they contain the full spectrum of particle sizes from 0.3 μm to 10 μm. The procedure for calculating the correlation is described in more detail in Section 2.4.
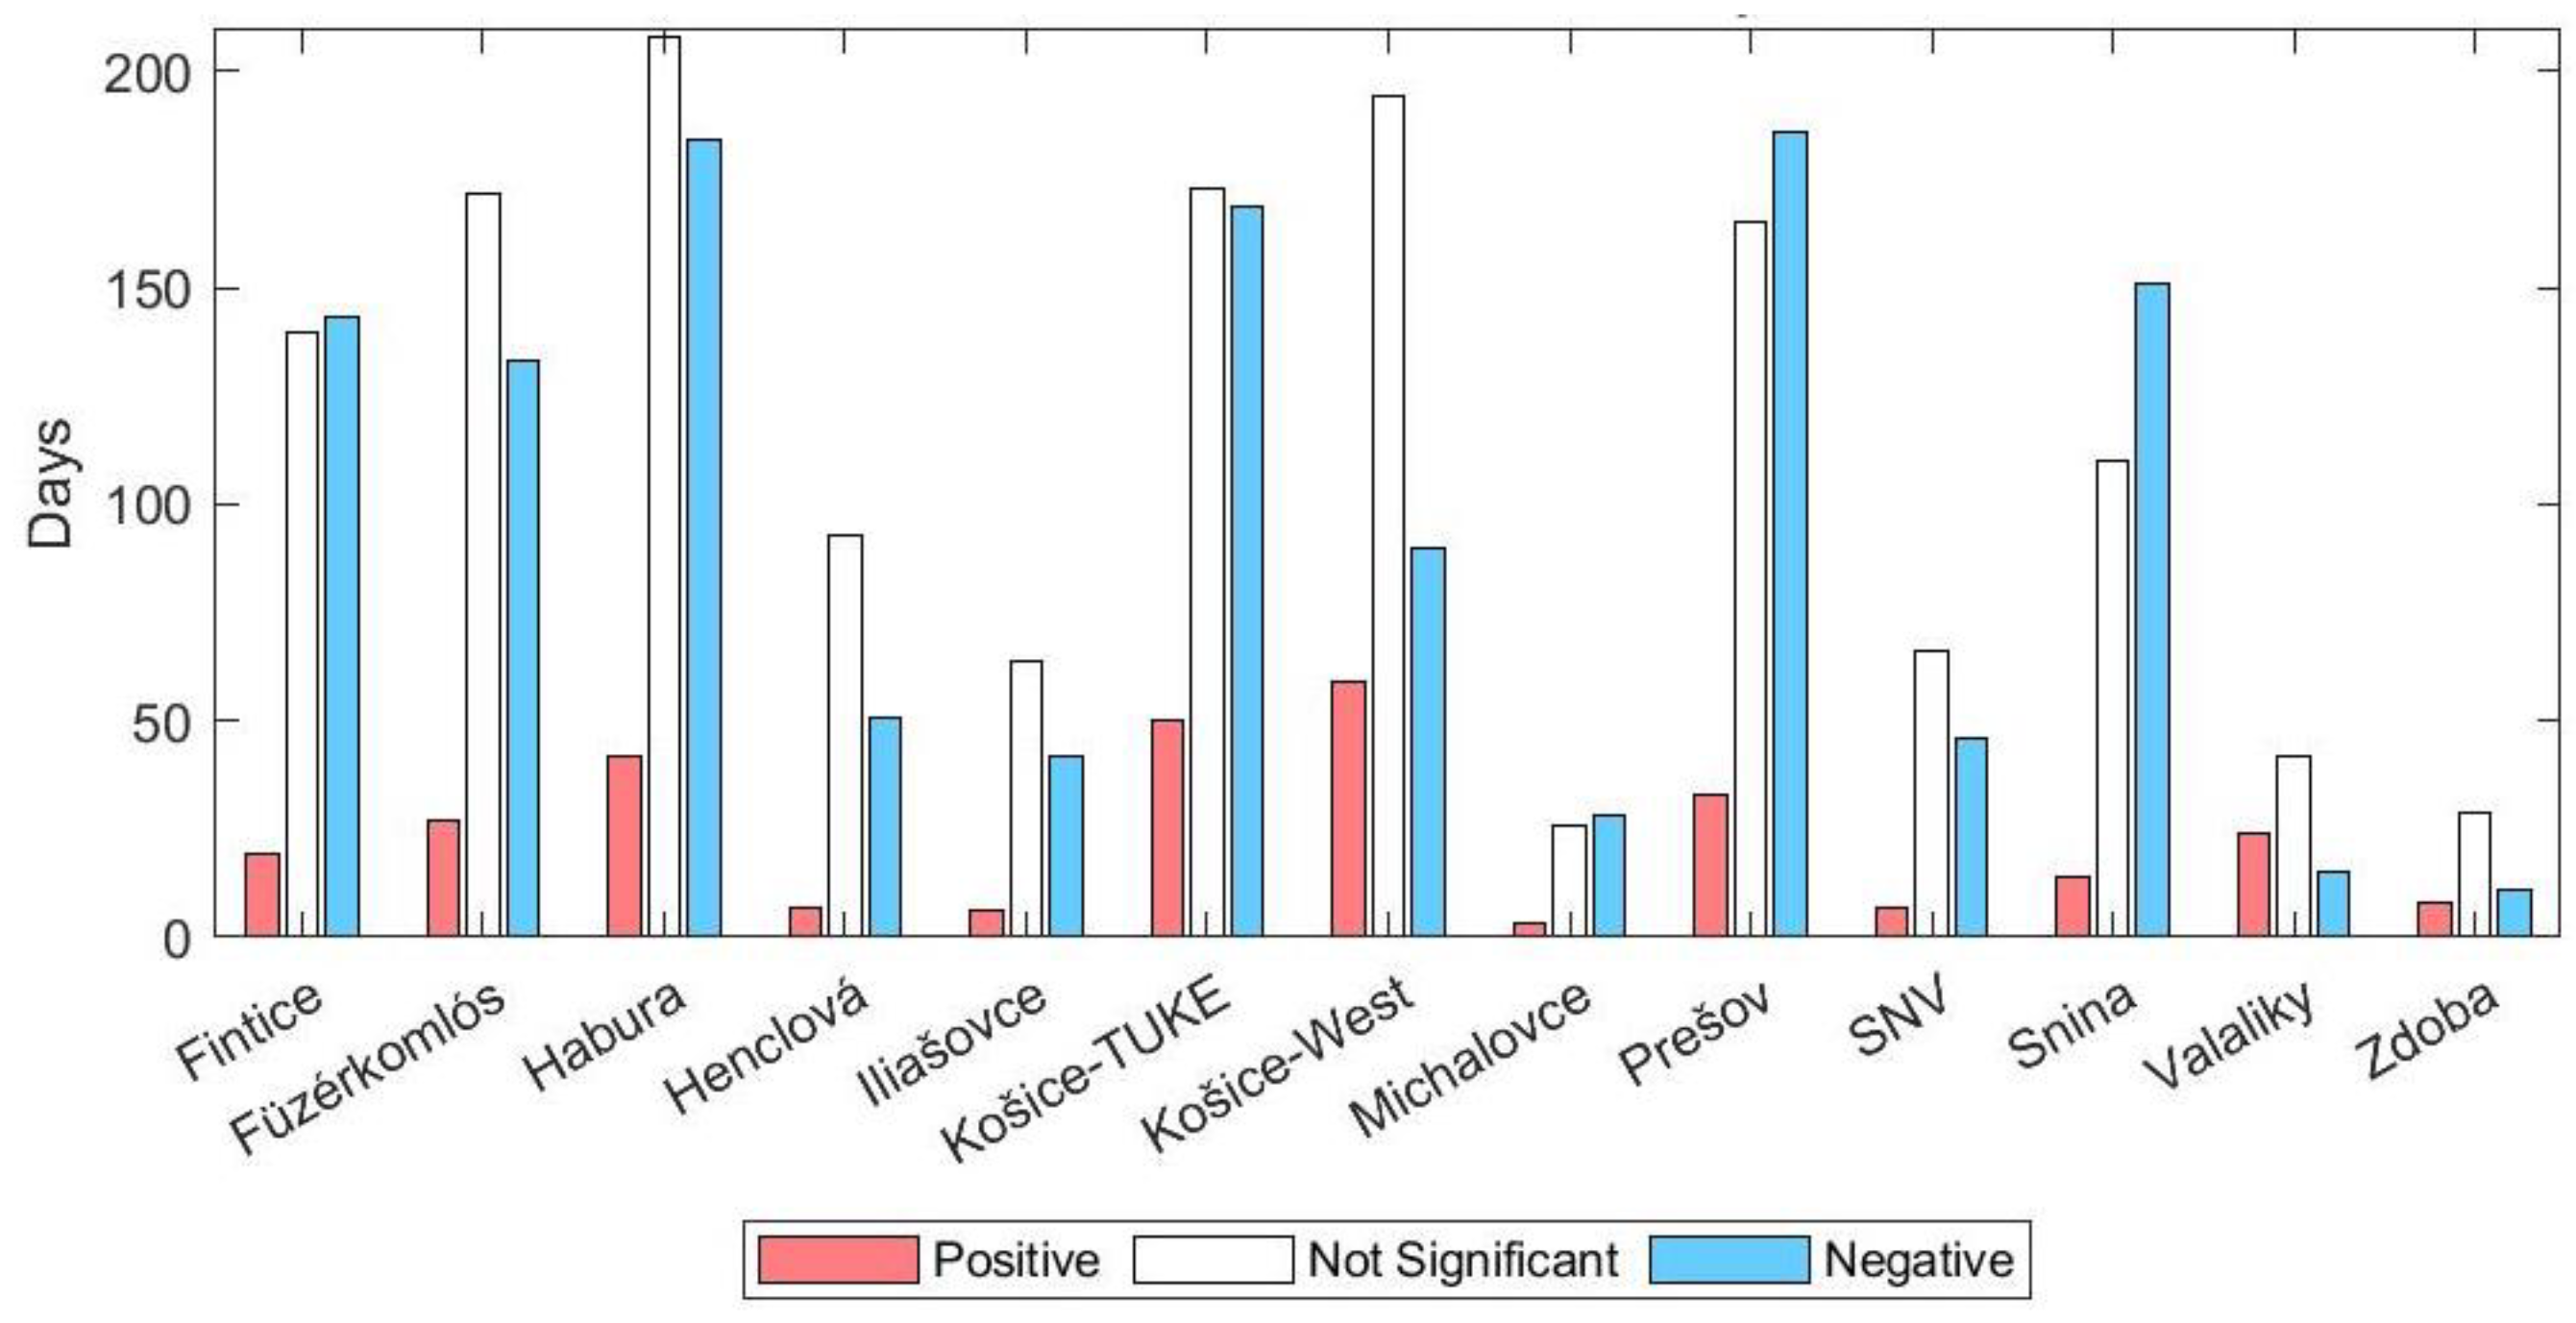
Figure 12 shows a visualization of the days during which Pearson’s correlation coefficient between PM and temperature was positive, negative, or not statistically significant. Positive and negative correlation coefficients are represented by red and blue bars, respectively, while the correlation coefficients that were not statistically significant are represented by white bars. Correlation coefficients that were not statistically significant reached approximately |r| < 0.4, which is roughly in line with [68], which also defines them as having weak or no correlation. This was true not only for the correlation between PM and temperature, but also for correlations between PM and all other measured parameters.
Concerning PM and temperature, almost all statistically significant correlation coefficients tend to be negative. The only exception was the Valaliky station, where a positive correlation prevailed. However, this was a short measurement.
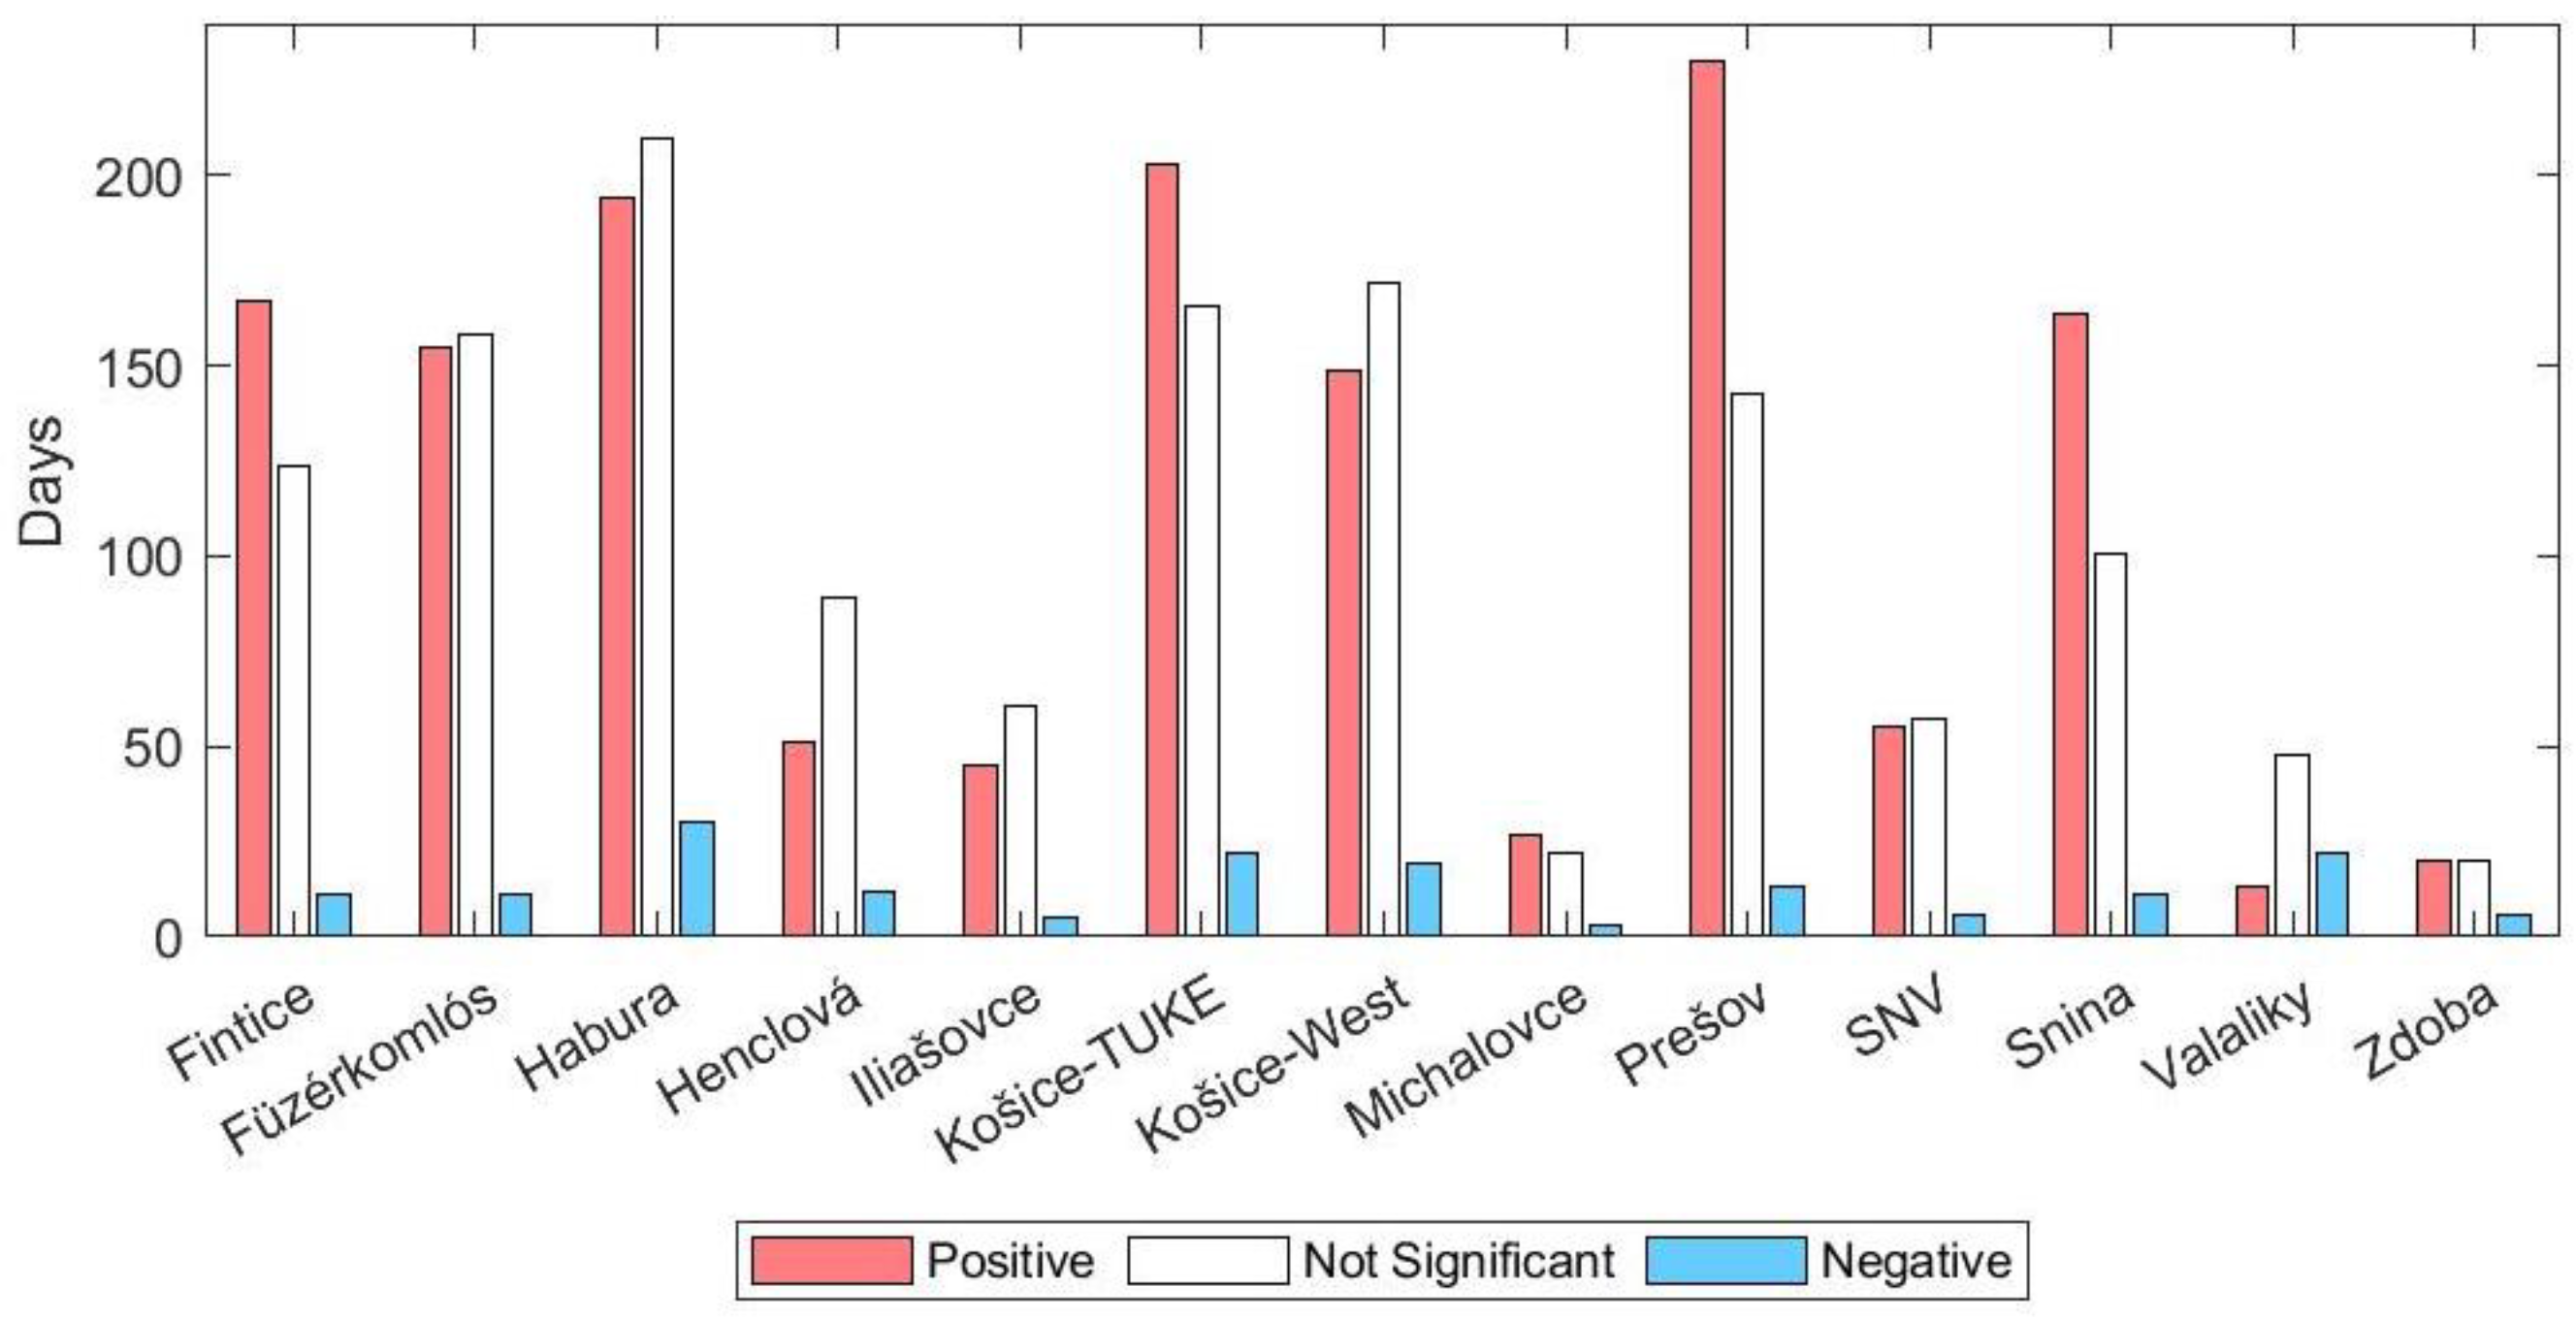
On the other hand, Figure 13 shows a prevalence of positive correlation between PM and humidity. Again, as was evident in the previous case, the only exception is the Valaliky station, where negative correlation was more prominent. However, the fact that most of the correlation coefficients between PM and humidity have the opposite sign to PM and temperature is to be expected, since, in the inland Central European climate, there is a negative correlation between temperature and humidity (humidity decreases with increasing temperature) [81].
The daily summary for correlation between PM and pressure is illustrated in Figure 14. Already at first sight, it can be seen that the number of positive and negative correlation coefficients is more balanced than in the previous correlations (especially at the stations Füzérkomlós, Henclová, Košice-West, Michalovce, Prešov, and Valaliky). However, a positive correlation still prevails in most stations, with the exception of the Füzérkomlós and Košice-West measuring stations, where negative correlation prevails.
Positive correlation (depicted in Figure 15) was found between PM and the VOC index at all monitoring sites during nearly all days of measurement. This correlation is much more evident than for the other variables. Only a very small fraction of days had a positive correlation, and at almost all stations, the positive correlation also outweighed the correlation that was not statistically significant.
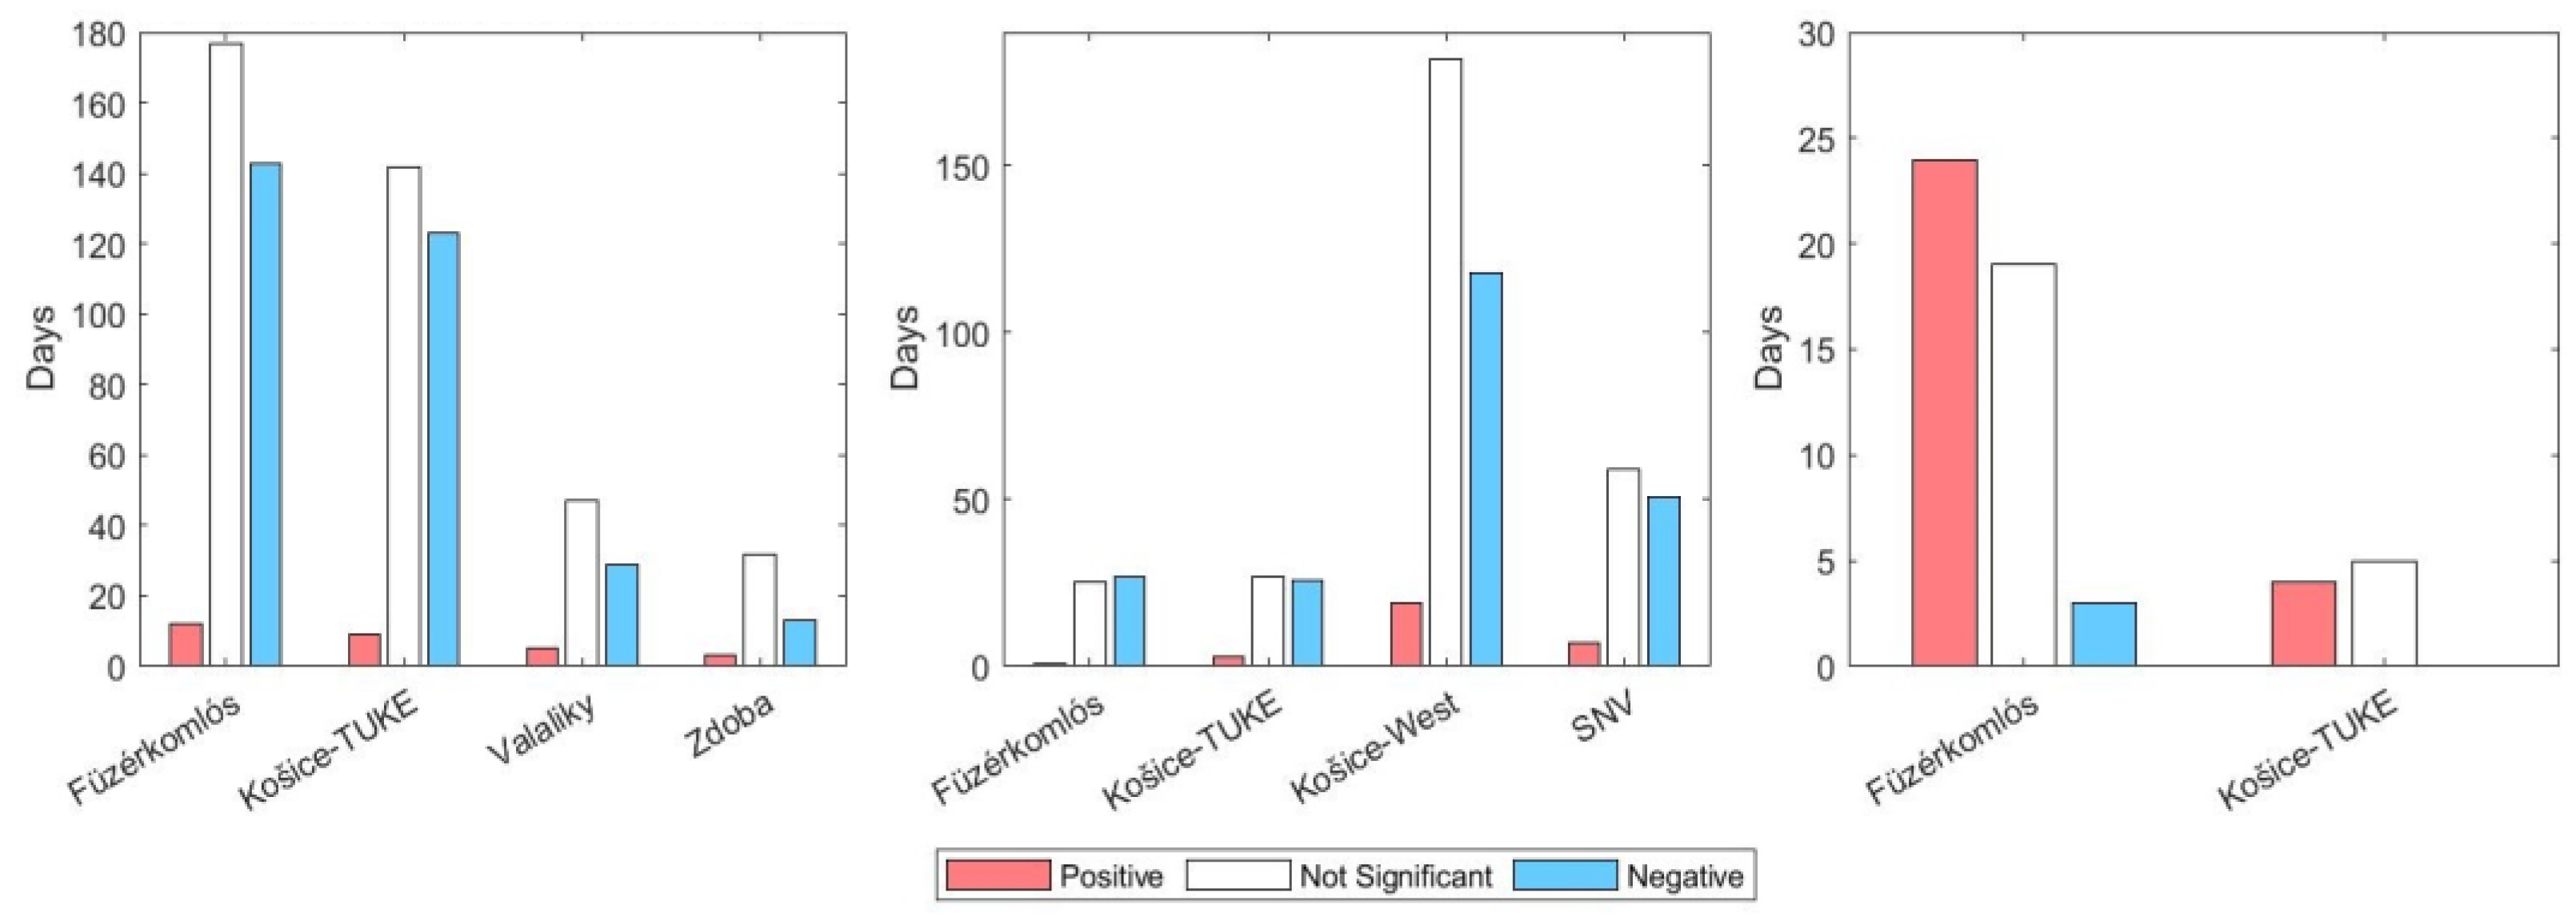
Figure 16 shows the daily summary for correlations between PM and the following remaining measured parameters: wind speed (left), NOx index (middle), and CO2 (right). These parameters were measured only at a select few measuring sites. The negative correlation dominates over the positive correlation for PM/wind speed and PM/NOx index, while for PM/CO2, the positive correlation dominates. However, it should be noted that in most cases, these are short-term measurements (measuring sites in Valaliky, Zdoba, and SNV) or later additions of sensors that measure the parameters (NOx index measured in Füzérkomlós and Košice-TUKE, CO2 measured in Füzérkomlós and Košice-TUKE). Only the wind speed measured in Füzérkomlós and Košice-TUKE and the NOx index measured in Košice-West have been measured over a comparably long period of time to the duration of PM, temperature, humidity, pressure, and VOC index measurements.

4. Discussion

The seasonal variation in PM concentrations, with higher levels in autumn and winter and lower levels in spring and summer, can be attributed to increased emissions from heating sources. The majority of measurement locations are in suburban and rural areas (ten out of thirteen measuring sites, with seven rural and three suburban) where wood combustion is a common way of household heating. Additionally, atmospheric conditions such as lower temperatures can lead to the accumulation of PM, as the dispersion of particles is less effective in these conditions.
The spatial distribution of PM concentrations highlights variability among different measurement stations. Measuring stations in Habura and Füzérkomlós recorded the highest concentrations of PM, as well as the highest number of PM10 exceedances over the WHO limit of 50 μg/m³. When compared to the Krakow study [46], one wonders why these two villages recorded the worst results? It is true that the use of coal as a heating source was common in Slovak villages in the past. While there is a problem with the combustion of coal in Kraków (as well as the neighboring towns and the villages), in Slovakia, the last coal mine was closed, and the last coal-fired power plant also ceased its operation in 2023. Coal has not been used in households for a long time (this also applies to the village of Füzérkomlós). Both villages are located in areas where people make very little use of gas for heating but make extensive use of the most locally available and cheapest fuel, which is wood. During the winter months, the air in the villages is often difficult to breathe (according to the personal experience of the authors of the paper), which is reflected in the overall results of the villages in Figure 8. These findings align with the AQI results, where these areas also recorded most days with poorer air quality (specifically, the “Unhealthy for Sensitive Groups” and “Unhealthy” categories). Urban locations like Košice-TUKE and Košice-West showed better (“Good”) air quality, likely due to fewer residential heating emissions. However, these locations still recorded “Moderate” air quality on many days, indicating the influence of traffic, industrial production (emissions from point sources of air pollution), and other urban activities. The suburban measuring site in Prešov and the urban measuring site in Snina recorded primarily “Good” and “Moderate” air quality. These measuring stations also recorded the lowest concentrations of PM.
The typical particle size (TPS) data indicate that larger particle sizes were recorded during winter months, mirroring the trend in PM mass concentrations. This can be attributed to combustion sources such as wood burning, which emit larger particles when compared to the prevalent sources in warmer months, such as secondary aerosols formed from photochemical reactions. The smaller particle sizes observed in summer months are likely due to increased atmospheric dispersion and the prevalence of secondary particles formed from gaseous precursors like VOC.
The correlations between PM and various meteorological parameters provide the following insights into the factors influencing concentrations of PM:
  • Temperature: The negative correlation indicates that higher temperatures facilitate the dispersion of PM, leading to lower concentrations. Warmer temperatures enhance atmospheric mixing and vertical dispersion, reducing the accumulation of PM near the ground. Colder temperatures contribute to more stable atmospheric conditions, which limit dispersion and increase PM concentrations. From a long-term perspective, colder temperatures in autumn and winter coincide with heating season.
  • Humidity: Increased humidity is more common and can lead to the formation of secondary particles through hygroscopic growth, elevating PM concentrations. Additionally, in Central Europe, there is a negative correlation between temperature and humidity [81], so the PM/humidity correlation is expected to have the opposite trend to the PM/temperature correlation.
  • Pressure: The mixed correlations (leaning positive) suggest that both high and low pressures can influence PM, depending on the weather. High pressures can trap pollutants near the ground, leading to higher PM concentrations. In contrast, low pressures often bring turbulent weather and increased wind speeds, which can enhance pollutant dispersion and reduce PM levels. However, due to the less dynamic nature of pressure (as opposed to other meteorological factors), it may be worthwhile to investigate the correlation from a longer perspective in future research papers.
  • Wind Speed: Higher wind speeds typically enhance the dispersion of pollutants and reduce their concentrations, which explains the negative correlation.
  • VOC: The strong positive correlation indicates that sources emitting VOC, such as traffic and industrial activities, also significantly contribute to PM levels. VOC can undergo photochemical reactions in the atmosphere, leading to the formation of secondary organic aerosols, which are a component of PM.
  • NOx: NOx is often associated with traffic emissions. The negative correlation suggests that other factors influencing PM concentrations prevail over NOx in the measuring locations.
  • CO2: The positive correlation supports the notion that combustion processes are significant contributors to PM levels. Both pollutants are commonly emitted from sources such as residential heating and vehicular emissions. During colder months, the increased use of heating systems leads to higher emissions of both PM and CO2, explaining the observed positive correlation.
The presence of irregularities in correlations (r with opposite sign or r that is not statistically significant) indicate the influence of other factors on PM concentrations. Most of those irregularities were present in the winter and autumn, which suggests that one of those additional factors may be heating season and/or other human activities.

5. Conclusions

The relationship between meteorological conditions, geographical factors, human activities, and PM concentrations can be complex. Based on our results, we can conclude that the higher PM concentrations observed in autumn and winter, particularly in rural and suburban areas where wood combustion is prevalent, underline the significant impact of household heating on air quality. Meteorological factors play a crucial role in shaping PM concentrations, with higher temperatures and wind speeds facilitating the dispersion of pollutants, while colder temperatures and higher humidity favor PM accumulation. Atmospheric pressure variations further influence PM dispersion and concentration. Understanding these influencing conditions and factors is essential for developing strategies to reduce PM pollution and improve air quality.
Regarding the future development of the measurement network, it is necessary to make long-term measurements, especially of the parameters that have been added to the measurement network at a later stage (namely NOx, CO2, and wind speed). It would also be worthwhile to extend the measurements of these variables to as many locations as possible, similar to how it was conducted in Krakow [46]. With such a large number of deployed sensor nodes (100), it would be possible to forecast the evolution of PM in the large, measured areas using similar procedures as in [47], which would provide us with a more comprehensive overview of air quality in the eastern Slovak and eventually even in the central European environment.
Additionally, the presented findings of PM concentrations and correlations in Central European conditions may also be helpful in predicting the development of PM, which will be especially appreciated by people with respiratory problems. The use of measured data goes beyond the field of environmental science, so, as previously mentioned in the introduction, the data obtained in the manner described in this article can also become an excellent knowledge base for development in the field of HRI. The use of virtual reality (VR) technologies using a digital twin of a humanoid robot is excellent. This could facilitate subsequent field tests with real robots in real environments following training, testing, and evaluation in safe virtual environments. However, since the acquisition of real robotic units can be too complicated or expensive, the use of VR and real measured data seems to be a feasible way.

Author Contributions

Conceptualization, S.K. and M.G.; methodology, S.K. and B.S.; software, S.K. and T.V.; validation, M.B. and J.M.; formal analysis, M.B. and P.J.; investigation, M.G. and T.V.; resources, J.D. and M.G.; data curation, J.D. and P.J.; writing—original draft preparation, S.K., M.G. and B.S.; writing—review and editing, S.K., M.G., B.S. and Š.K.; visualization, S.K. and T.V.; supervision, M.G. and J.M.; project administration, B.S. and Š.K.; funding acquisition, B.S. and Š.K. All authors have read and agreed to the published version of the manuscript.

Funding

This work has been supported by the APVV grant no. APVV-21-0105 “Trustworthy human–robot and therapist–patient interaction in virtual reality”.

Institutional Review Board Statement

Not applicable.

Informed Consent Statement

Not applicable.

Data Availability Statement

The data presented in this study are available on request from the corresponding author. The data are not publicly available due to the fact that the study continues, and the data are still being worked on.

Acknowledgments

Our acknowledgement goes to SOS electronic s.r.o. (Pri prachárni 16, 04011 Košice, Slovak republic—www.soselectronic.com) for providing the sensor samples and other supporting material that were essential in solving the problems addressed in this paper.

Conflicts of Interest

The authors declare no conflicts of interest.

References

  1. WHO Global Air Quality Guidelines: Particulate Matter (PM2.5 and PM10) Ozone, Nitrogen Dioxide, Sulfur Dioxide, and Carbon Monoxide. Available online: https://iris.who.int/bitstream/handle/10665/345329/9789240034228-eng.pdf?sequence=1 (accessed on 17 May 2024).
  2. Tikader, M.; Mukhopadhyay, D.; Islam, M.Z. Role of Remote Sensing and GIS in mitigating Particulate Matters that intensify Air pollution in India: A Review. Bull. Environ. Pharmacol. Life Sci. 2023, 12, 402–418. [Google Scholar]
  3. Pope, C.A.; Ezzati, M.; Dockery, D.W. Fine-Particulate Air Pollution and Life Expectancy in the United States. N. Engl. J. Med. 2009, 360, 376–386. [Google Scholar] [CrossRef]
  4. Gehring, U.; Gruzieva, O.; Agius, R.M.; Beelen, R.; Custovic, A.; Cyrys, J.; Eeftens, M.; Flexeder, C.; Fuertes, E.; Heinrich, J.; et al. Air Pollution Exposure and Lung Function in Children: The ESCAPE Project. Environ. Health Perspect. 2013, 121, 1357–1364. [Google Scholar] [CrossRef]
  5. Götschi, T.; Heinrich, J.; Sunyer, J.; Künzli, N. Long-Term Effects of Ambient Air Pollution on Lung Function: A Review. Epidemiology 2008, 19, 690–701. [Google Scholar] [CrossRef]
  6. Dominici, F.; Wang, Y.; Correia, A.W.; Ezzati, M.; Pope, C.A., III; Dockerye, D.W. Chemical Composition of Fine Particulate Matter and Life Expectancy in 95 US Counties Between 2002 and 2007. Epidemology 2015, 26, 556–564. [Google Scholar] [CrossRef]
  7. Kampa, M.; Castanas, E. Human Health Effects of Air Pollution. Environ. Pollut. 2008, 151, 362–367. [Google Scholar] [CrossRef]
  8. Kyung, S.Y.; Jeong, S.H. Particulate-Matter Related Respiratory Diseases. Tuberc. Respir. Dis. 2020, 83, 116–121. [Google Scholar] [CrossRef]
  9. Brook, R.D. Cardiovascular Effects of Air Pollution. Clin. Sci. 2008, 115, 175–187. [Google Scholar] [CrossRef]
  10. Schraufnagel, D.E. The Health Effects of Ultrafine Particles. Exp. Mol. Med. 2020, 52, 311–317. [Google Scholar] [CrossRef]
  11. Dominici, F.; Peng, R.D.; Bell, M.L.; Pham, L.; McDermott, A.; Zeger, S.L.; Samet, J.M. Fine particulate air pollution and hospital admission for cardiovascular and respiratory diseases. JAMA 2006, 295, 1127–1134. [Google Scholar] [PubMed]
  12. Jo, E.J.; Lee, W.S.; Jo, H.Y.; Kim, C.H.; Eom, J.S.; Mok, J.H.; Kim, M.H.; Lee, K.; Kim, K.U.; Lee, M.K.; et al. Effects of particulate matter on respiratory disease and the impact of meteorologival factors in Busan, Korea. Respir. Med. 2017, 124, 79–87. [Google Scholar] [CrossRef] [PubMed]
  13. Ambient (Outdoor) Air Pollution. Available online: https://www.who.int/news-room/fact-sheets/detail/ambient-(outdoor)-air-quality-and-health (accessed on 30 May 2022).
  14. Vignal, C.; Pichavant, M.; Alleman, L.Y.; Djouina, M.; Dingreville, F.; Perdrix, E.; Waxin, C.; Alami, A.O.; Gower-Rousseau, C.; Desreumaux, P.; et al. Effects of urban coarse particles inhalation on oxidative and inflammatory parameters in the mouse lung and colon. Part. Fibre Toxicol. 2017, 14, 46. [Google Scholar] [CrossRef] [PubMed]
  15. Pambianchi, E.; Pecorelli, A.; Valacchi, G. Gastrointestinal tissue as a “new” target of pollution exposure. IUBMB Life 2022, 74, 62–73. [Google Scholar] [CrossRef]
  16. Tianyu, L.; Yang, Y.; Zhiwei, S.; Junchao, D. A comprehensive understanding of ambient particulate matter and its components on the adverse health effects based from epidemiological and laboratory evidence. Part. Fibre Toxicol. 2022, 19, 67. [Google Scholar] [CrossRef]
  17. Abhinandan, K.; Pallavi, S.; Saurabh, S.; Srivastava, A. Human health impacts attributable to inhalation exposure of particulate matter (PM10 and PM2.5) during the Holi festival. Inhal. Toxicol. 2024, 12, 228–239. [Google Scholar] [CrossRef]
  18. Guo, S.-E.; Chi, M.-C.; Hwang, S.-L.; Lin, C.-M.; Lin, Y.-C. Effects of Particulate Matter Education on Self-Care Knowledge Regarding Air Pollution, Symptom Changes, and Indoor Air Quality among Patients with Chronic Obstructive Pulmonary Diseased. Int. J. Environ. Res. Public Health 2020, 17, 15. [Google Scholar] [CrossRef] [PubMed]
  19. Šarkan, B.; Gnap, J.; Loman, M.; Harantová, V. Examining the Amount of Particulate Matter (PM) Emissions in Urban Areas. Appl. Sci. 2023, 13, 1845. [Google Scholar] [CrossRef]
  20. Oguge, O.; Nyamondo, J.; Adera, N.; Okolla, L.; Okoth, B.; Anyango, S.; Afulo, A.; Kumie, A.; Samet, J.; Berhane, K. Fine particulate matter air pollution and health implications for Nairobi, Kenya. Environ. Epidemiol. 2024, 8, e307. [Google Scholar] [CrossRef]
  21. Permana, B.H.; Thiravetyan, P.; Treesubsuntorn, C. Exogenous of different elicitors: Proline and ornithine on Sansevieria trifasciata under particulate matter (PM) and volatile organic compounds (VOC). Environ. Sci. Pollut. Res. 2024, 31, 34028–34037. [Google Scholar] [CrossRef]
  22. Hester, R.E. Airborne Particulate Matter: Sources, Atmospheric Processes and Health; Royal Society of Chemistry: Cambridge, UK, 2016. [Google Scholar]
  23. Air Pollution in the Slovak Republic. 2021. Available online: https://www.shmu.sk/File/oko/rocenky/2021_Sprava_o_KO_v_SR_v2.pdf (accessed on 24 May 2024). (In Slovak).
  24. Air Pollution in the Slovak Republic. 2022. Available online: https://www.shmu.sk/File/oko/rocenky/2022_Sprava_o_KO_SR_v2.pdf (accessed on 24 May 2024). (In Slovak).
  25. Annual Reports on Air Quality in Slovakia. Available online: https://www.shmu.sk/sk/?page=1&id=oko_roc_s (accessed on 15 June 2024). (In Slovak).
  26. Air Pollution in the Slovak Republic 2022: Air Quality Assessment in Agglomeration Bratislava and Zone Bratislava Region. Available online: https://www.shmu.sk/File/oko/rocenky/2022_Priloha_BA_v1.pdf (accessed on 24 May 2024). (In Slovak).
  27. Air Pollution in the Slovak Republic 2021: Air Quality Assessment in Agglomeration Bratislava and Zone Bratislava Region. Available online: https://www.shmu.sk/File/oko/rocenky/2021_Priloha_BA_v2.pdf (accessed on 24 May 2024). (In Slovak).
  28. Air Pollution in the Slovak Republic 2022: Air Quality Assessment in Agglomeration Košice and Zone Košice Region. Available online: https://www.shmu.sk/File/oko/rocenky/2022_Priloha_KE_v1.pdf (accessed on 24 May 2024). (In Slovak).
  29. Air Pollution in the Slovak Republic 2021: Air Quality Assessment in Agglomeration Košice and Zone Košice Region. Available online: https://www.shmu.sk/File/oko/rocenky/2021_Priloha_KE_v2.pdf (accessed on 24 May 2024). (In Slovak).
  30. Emission and Fuel Consumptions Inventory for Medium and Large Stationary Sources in Slovak Republic. Available online: https://neisrep.shmu.sk/main_gui.php (accessed on 24 May 2024). (In Slovak).
  31. Kibble, A.; Harrison, R. Point sources of air pollution. Occup. Med. 2005, 55, 425–431. [Google Scholar] [CrossRef]
  32. World’s Air Pollution: Real-Time Air Quality Index. Available online: https://waqi.info (accessed on 15 May 2024).
  33. World-Wide Air Quality Monitoring Data Coverage. Available online: https://aqicn.org/sources/ (accessed on 17 June 2024).
  34. Air Quality Forecast in South America. Available online: https://aqicn.org/faq/2015-05-30/air-quality-forecast-in-south-america/ (accessed on 17 June 2024).
  35. Air Quality Forecasting—How Accurate Can It Be? Available online: https://aqicn.org/faq/2015-03-23/air-quality-forecasting-how-accurate-can-it-be/ (accessed on 17 June 2024).
  36. Air Quality Forecasting in Northern India. Available online: https://aqicn.org/faq/2016-02-28/air-quality-forecasting-in-northern-india/ (accessed on 17 June 2024).
  37. Yawootti, A.; Wimonthanasit, P.; ChaithanuSate, K.; Sampattagul, S. Comparison of Particulate Matter Monitoring Using Beta Attenuation Monitor and Light Scattering Method in Bangkok Thailand. In Proceedings of the 33rd International Conference on Circuits/Systems, Computers and Communications (ITC-CSCC), Bangkok, Thailand, 4–7 July 2018; pp. 498–501. [Google Scholar]
  38. Yi, E.E.P.N.; Nway, N.C.; Aung, W.Y.; Thant, Z.; Wai, T.H.; Hlain, K.K.; Maung, C.; Yagishita, M.; Ishigaki, Y.; Win-Shwe, T.T.; et al. Preliminary monitoring of concentration of particulate matter (PM2.5) in seven townships of Yangon City, Myanmar. Environ. Health Prev. Med. 2018, 23, 53. [Google Scholar] [CrossRef]
  39. Wang, W.C.V.; Lin, T.H.; Liu, C.H.; Su, C.W.; Lung, S.C.C. Fusion of environmental sensing on PM2.5 and deep learning on vehicle detecting for acquiring roadside PM2.5 concentration increments. Sensors 2020, 20, 4679. [Google Scholar] [CrossRef] [PubMed]
  40. Velea, L.; Udriștioiu, M.T.; Puiu, S.; Motișan, R.; Amarie, D. A Community-Based Sensor Network for Monitoring the Air Quality in Urban Romania. Atmosphere 2023, 14, 840. [Google Scholar] [CrossRef]
  41. Alonso-Pérez, S.; López-Solano, J. Long-Term Analysis of Aerosol Concentrations Using a Low-Cost Sensor: Monitoring African Dust Outbreaks in a Suburban Environment in the Canary Islands. Sensors 2023, 23, 7768. [Google Scholar] [CrossRef] [PubMed]
  42. Choi, Y.; Byun, G.; Lee, J.-T. The Effects of Particulate Matter Alert on Urban Park Visitation in Seoul, Korea: Using Segmented Regression. Int. J. Environ. Res. Public Health 2022, 19, 15372. [Google Scholar] [CrossRef] [PubMed]
  43. Shihab, A.S. Meteorological effects on particulate matter PM10, PM2.5 concentrations with diurnal and seasonal variations in cities neighboring desert lands. Nat. Hazards 2024. [Google Scholar] [CrossRef]
  44. Volná, V.; Hladký, D.; Seibert, R.; Krejčí, B. Transboundary Air Pollution Transport of PM10 and Benzo[a]pyrene in the Czech–Polish Border Region. Atmosphere 2022, 13, 341. [Google Scholar] [CrossRef]
  45. Niedobová, B.; Badawy, W.M.; Dmitriev, A.Y.; Jančík, P.; Chepurchenko, O.E.; Bulavin, M.V.; Belova, M.O. Neutron Activation Analysis of PM10 for Air Quality of an Industrial Region in the Czech Republic: A Case Study. Atmosphere 2022, 13, 479. [Google Scholar] [CrossRef]
  46. Zareba, M.; Dlugosz, H.; Danek, T.; Weglinska, E. Big-Data-Driven Machine Learning for Enhancing Spatiotemporal Air Pollution Pattern Analysis. Atmosphere 2023, 14, 760. [Google Scholar] [CrossRef]
  47. Zareba, M.; Cogiel, S.; Danek, T.; Weglinska, E. Machine Learning Techniques for Spatio-Temporal Air Pollution Prediction to Drive Sustainable Urban Development in the Era of Energy and Data Transformation. Energies 2024, 17, 2738. [Google Scholar] [CrossRef]
  48. Harr, L.; Sinsel, T.; Simon, H.; Esper, J. Seasonal Changes in Urban PM2.5 Hotspots and Sources from Low-Cost Sensors. Atmosphere 2022, 13, 694. [Google Scholar] [CrossRef]
  49. Makeš, O.; Schwarz, J.; Vodička, P.; Engling, G.; Ždímal, V. Determination of PM1 Sources at a Prague Background Site during the 2012–2013 Period Using PMF Analysis of Combined Aerosol Mass Spectra. Atmosphere 2022, 13, 20. [Google Scholar] [CrossRef]
  50. Linda, J.; Pospíšil, J.; Köbölová, K.; Ličbinský, R.; Huzlík, J.; Karel, J. Conditions Affecting Wind-Induced PM10 Resuspension as a Persistent Source of Pollution for the Future City Environment. Sustainability 2022, 14, 9186. [Google Scholar] [CrossRef]
  51. Bílek, J.; Bílek, O.; Maršolek, P.; Buček, P. Ambient Air QualityMeasurement with Low-Cost Optical and Electrochemical Sensors: An Evaluation of Continuous Year-Long Operation. Environments 2021, 8, 114. [Google Scholar] [CrossRef]
  52. Hladký, D.; Krejčí, B. Identification of Causes of Air Pollution in a Specific Industrial Part of the Czech City of Ostrava in Central Europe. Atmosphere 2024, 15, 177. [Google Scholar] [CrossRef]
  53. Emissions Report. 2024. Available online: https://oeab.shmu.sk/app/cmsFile.php?disposition=i&ID=238%27,%20%27Ro%C4%8Denka%202024%27 (accessed on 25 May 2024). (In Slovak).
  54. Kirešová, S.; Guzan, M.; Galajda, P. Measuring Particulate Matter (PM) using SPS30. In 32nd International Conference Radioelektronika; IEEE: Košice, Slovakia, 2022; pp. 160–165. [Google Scholar]
  55. Kirešová, S.; Guzan, M. Determining the Correlation between Particulate Matter PM10 and Meteorological Factors. Eng 2022, 3, 343–363. [Google Scholar] [CrossRef]
  56. Kirešová, S.; Guzan, M.; Sobota, B. Using Low-Cost Sensors for Measuring and Monitoring Particulate Matter with a Focus on Fine and Ultrafine Particles. Atmosphere 2023, 14, 324. [Google Scholar] [CrossRef]
  57. Kirešová, S.; Guzan, M.; Rusyn, V. Particulate Matter PM2.5 and PM10 and Its Impact on Air Quality in Urban and Rural Areas. In Proceedings of the ITTAP’2022: 2nd International Workshop on Information Technologies: Theoretical and Applied Problems, Ternopil, Ukraine, 22–24 November 2022; Volume 3309, pp. 329–337. [Google Scholar]
  58. Kirešová, S.; Rusyn, V.; Guzan, M.; Vorobets, G.; Sobota, B.; Vorobets, O. Utilizing low-cost optical sensor for the measurement of particulate matter and calculating Pearson’s correlation coefficient. In Proceedings of the SPIE 12938, Sixteenth International Conference on Correlation Optics, Chernivtsi, Ukraine, 18–21 September 2023. [Google Scholar] [CrossRef]
  59. Khavas, Z.R. A Review on trust in human-robot interaction. arXiv 2021, arXiv:2105.10045v1. [Google Scholar] [CrossRef]
  60. Lasota, P.A.; Song, T.; Shah, J.A. A Survey of Methods for Safe Human-Robot Interaction. Now Found. Trends 2017, 5, 261–349. [Google Scholar] [CrossRef]
  61. Sobota, B.; Guzan, M.; Kírešová, S.; Korečko, Š. Towards Real-World Data Supported XR Training of Trustworthy Human-Robot Interaction in a Risky Environment. In Proceedings of the 2024 IEEE 22nd World Symposium on Applied Machine Intelligence and Informatics (SAMI), Stará Lesná, Slovakia, 25–27 January 2024; pp. 365–369, ISBN 979-8-3503-1720-6. [Google Scholar]
  62. Alami, R.; Albu-Schaeffer, A.; Bicchi, A.; Bischoff, R.; Chatila, R.; De Luca, A.; De Santis, A.; Giralt, G.; Guiochet, J.; Hirzinger, G.; et al. Safe and dependable physical human-robot interaction in anthropic domains: State of the art and challenges. In Proceedings of the 2006 IEEE/RSJ International Conference on Intelligent Robots and Systems, Beijing, China, 9–15 October 2006. [Google Scholar]
  63. Datasheet SEN5x: Environmental Sensor Node for HVAC and Air Quality Applications. Available online: https://sensirion.com/media/documents/6791EFA0/62A1F68F/Sensirion_Datasheet_Environmental_Node_SEN5x.pdf (accessed on 20 May 2024).
  64. Kirešová, S.; Guzan, M. Measurement of Particulate Matter: Principles and Options of Measurement at Present. Acta Electrotech. Et Inform. 2022, 22, 8–18. [Google Scholar] [CrossRef]
  65. MS5611-01BA03: Barometric Pressure Sensor with Stainless Steel Cap. Available online: https://www.te.com/commerce/DocumentDelivery/DDEController?Action=showdoc&DocId=Data+Sheet%7FMS5611-01BA03%7FB3%7Fpdf%7FEnglish%7FENG_DS_MS5611-01BA03_B3.pdf%7FCAT-BLPS0036 (accessed on 20 May 2024).
  66. SCD4x: Breaking the Size Barrier in CO2 Sensing. Available online: https://sensirion.com/media/documents/48C4B7FB/64C134E7/Sensirion_SCD4x_Datasheet.pdf (accessed on 20 May 2024).
  67. Weather Sensor Assembly p/n 80422. Available online: https://www.argentdata.com/files/80422_datasheet.pdf (accessed on 20 May 2024).
  68. Correlation. Available online: https://statistikapspp.sk/korelacia/ (accessed on 17 May 2024). (In Slovak).
  69. Munk, M. Computer Data Analysis; Constantine the Philosopher University in Nitra: Nitra, Slovakia, 2011; ISBN 978-80-8094-895-5. (In Slovak) [Google Scholar]
  70. Kirešová, S.; Guzan, M.; Sobota, B.; Fedák, V.; Bača, R.; Bakši, D. The Use of Time Series Database in Measurements. In Proceedings of the International Conference on Electrical Drives and Power Electronics (EDPE), The High Tatras, Slovakia, 25–27 September 2023; pp. 1–8. [Google Scholar] [CrossRef]
  71. The Biggest Sources of Air Pollution in the Slovak Republic. Available online: http://www.air.sk/emissions.php (accessed on 21 May 2024). (In Slovak).
  72. Correlation coefficient—MATLAB. Available online: https://www.mathworks.com/help/matlab/ref/corrcoef.html (accessed on 16 May 2024).
  73. Technical Assistance Document for the Reporting of Daily Air Quality—The Air Quality Index (AQI). Available online: https://www.airnow.gov/sites/default/files/2020-05/aqi-technical-assistance-document-sept2018.pdf (accessed on 17 May 2024).
  74. Final Updates to the Air Quality Index (AQI) for Particulate Matter Fact Sheet and Common Questions. Available online: https://www.epa.gov/system/files/documents/2024-02/pm-naaqs-air-quality-index-fact-sheet.pdf (accessed on 15 June 2024).
  75. Liu, H.; Li, Q.; Yu, D.; Gu, Y. Air quality index and air pollutant concentration prediction based on machine learning algorithms. Appl. Sci. 2019, 9, 4069. [Google Scholar] [CrossRef]
  76. Hien, P.; Bac, V.; Tham, H.; Nhan, D.; Vinh, L. Influence of meteorological conditions on PM2.5 and PM10 concentrations during the monsoon season in Hanoi, Vietnam. Atmos. Environ. 2002, 36, 3473–3484. [Google Scholar] [CrossRef]
  77. Huang, K.; Zhuang, G.; Lin, Y.; Wang, Q.; Fu, J.S.; Zhang, R.; Li, J.; Deng, C.; Fu, Q. Impact of anthropogenic emission on air quality over a megacity—Revealed from an intensive atmospheric campaign during the Chinese Spring Festival. Atmos. Chem. Phys. 2012, 12, 11631–11645. [Google Scholar] [CrossRef]
  78. Xing, Q.; Sun, M. Characteristics of PM2.5 and PM10 Spatio-Temporal Distribution and Influencing Meteorological Conditions in Beijing. Atmosphere 2022, 13, 1120. [Google Scholar] [CrossRef]
  79. Kazi, Z.; Filip, S.; Kazi, L. Predicting PM2.5, PM10, SO2, NO2, NO and CO Air Pollutant Values with Linear Regression in R Language. Appl. Sci. 2023, 13, 3617. [Google Scholar] [CrossRef]
  80. Dulac, F.; Hamonou, E.; Sauvage, S.; Kanakidou, M.; Beekmann, M.; Desboeufs, K.; Formenti, P.; Becagli, S.; Di Biagio, C.; Borbon, A.; et al. Summary of recent progress and recommendations for future research regarding air pollution sources, processes, and impacts in the Mediterranean Region. Environ. Monit. Assess. 2022, 543–571. [Google Scholar] [CrossRef]
  81. Vicente-Serrano, S.M.; Nieto, R.; Gimeno, L.; Azorin-Molina, C.; Drumond, A.; El Kenawy, A.; Dominguez-Castro, F.; Tomas-Burguera, M.; Peña-Gallardo, M. Recent changes of relative humidity: Regional connections with land and ocean processes. Earth Syst. Dyn. 2018, 9, 915–937. [Google Scholar] [CrossRef]
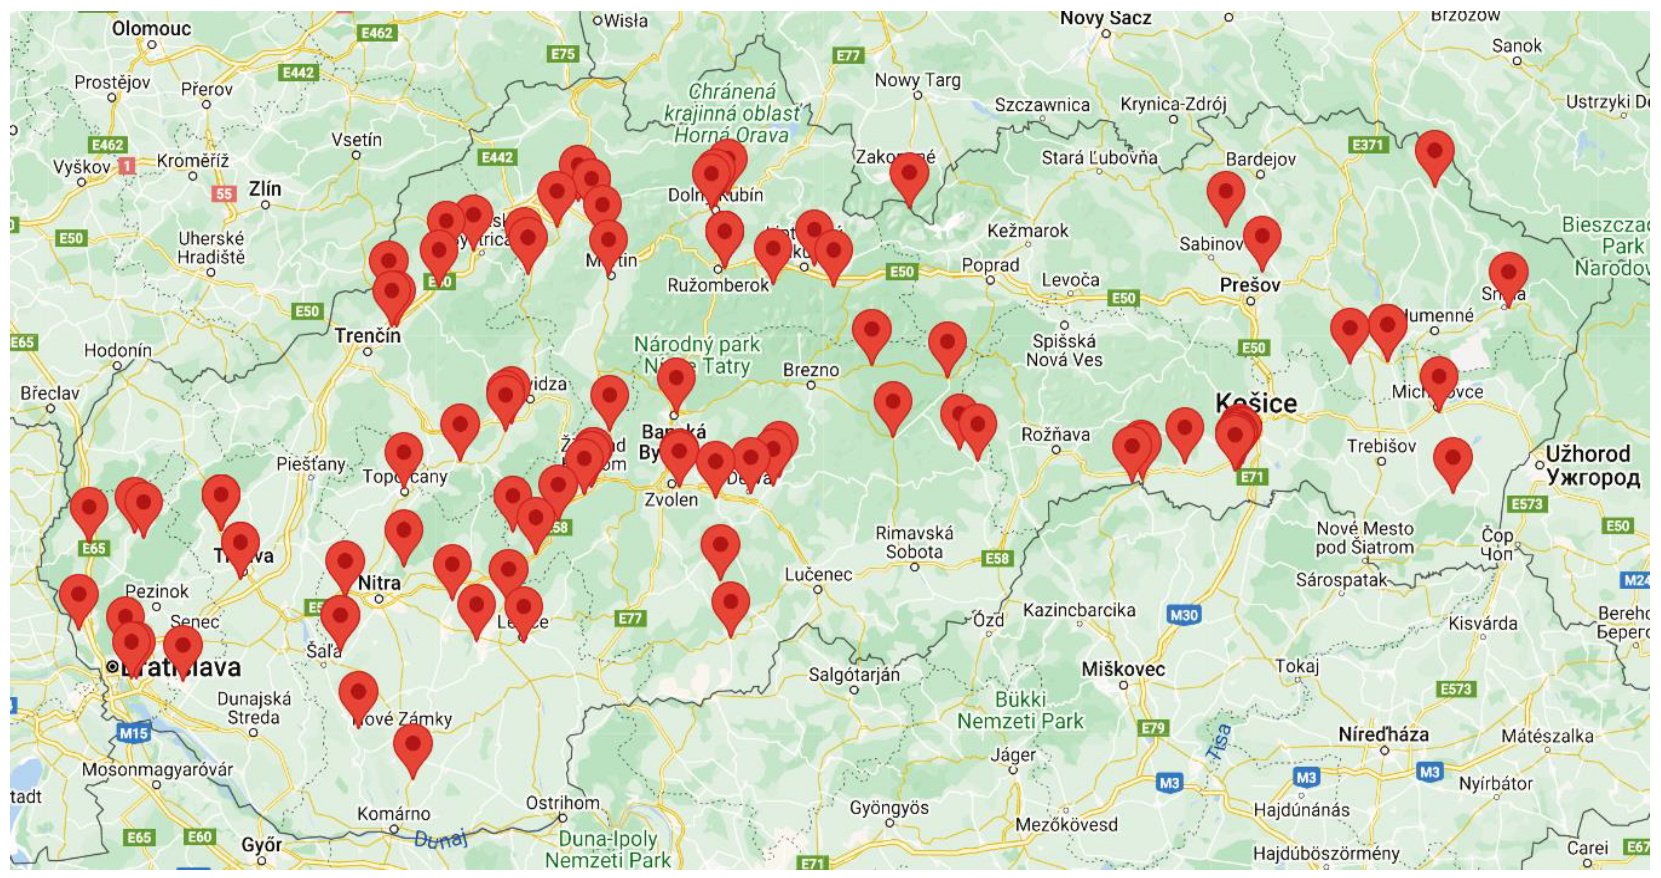
Figure 1. The point sources of air pollution in Slovak republic (red mark).
Atmosphere 15 00802 g001
Figure 2. View of U. S. Steel and its air pollution from a distance of (a) 13 km to the northeast of the factory on 19 July 2022, (b) 7.6 km to the east of the factory on 23 August 2022, (c) 7.6 km to the east of the factory on 20 January 2024, and (d) 12.5 km to the southeast of the factory on 26 March 2024.
Atmosphere 15 00802 g002
Figure 3. Air polluters in the city of Košice: (a) the main heating plant on 8 February 2023, (b) other smaller plants on the outskirts of the city on 26 March 2024.
Atmosphere 15 00802 g003
Figure 4. Correlation between the Košice-TUKE and SHMÚ-Štefánikova stations.
Atmosphere 15 00802 g004
Figure 5. The measuring device: (a) the block diagram of the measuring device; (b) the assembled device with the SEN5x and MS5611 sensors.
Atmosphere 15 00802 g005
Figure 6. The location of the measuring devices marked on the map: 1. Habura, 2. Snina, 3. Michalovce, 4. Prešov, 5. Fintice, 6. Spišská Nová Ves (SNV), 7. Iliašovce, 8. Henclová, 9. Košice-TUKE, 10. Košice-West, 11. Zdoba, 12. Valaliky, 13. Füzérkomlós.
Atmosphere 15 00802 g006
Figure 7. Monthly average of (a) PM2.5 and (b) PM10 mass concentrations in 2023.
Atmosphere 15 00802 g007
Figure 8. The box plot showing daily averages of (a) PM2.5 and (b) PM10 mass concentrations by measuring location in 2023.
Atmosphere 15 00802 g008
Figure 9. Number of exceedances of the daily limit of 50 μg/m3 by measuring location in 2023.
Atmosphere 15 00802 g009
Figure 10. Typical particle size (a) daily averages by measuring location and (b) monthly averages by the month of measurement.
Atmosphere 15 00802 g010
Figure 11. Distribution of AQI categories by measuring location.
Atmosphere 15 00802 g011
Figure 12. Number of days where correlation between PM and temperature was positive, negative, or not statistically significant.
Atmosphere 15 00802 g012
Figure 13. Number of days where correlation between PM and humidity was positive, negative, or not statistically significant.
Atmosphere 15 00802 g013
Figure 14. Number of days where correlation between PM and pressure was positive, negative, or not statistically significant.
Atmosphere 15 00802 g014
Figure 15. Number of days where correlation between PM and VOC was positive, negative, or not statistically significant.
Atmosphere 15 00802 g015
Figure 16. Number of days where the correlation between PM and wind speed (left), PM and NOx (middle), an PM and CO2 (right) was positive, negative, or not statistically significant.
Atmosphere 15 00802 g016
Table 1. Accuracy of sensors.
SensorParameterAccuracy
SEN5xPM1, PM2.5±(5 µg/m3 + 5%) a), ± 10% b)
PM4, PM10±25 µg/m3 a), ± 25% b)
Temperature±0.7 °C
Humidity±6%
Additional T-dependent mass precision limit drift ±0.5%/°C
MS5611Pressure±2.5 hPa
Temperature±0.8 °C
SCD41CO2±(50 ppm + 2.5%) c), ±(50 ppm + 3%) d), ±(40 ppm + 5%) e)
Temperature±9%
Humidity±1.5 °C
a) 0 to 100 µg/m3, b) 100 to 1000 µg/m3, c) 400 to 1000 ppm, d) 1001 to 2000 ppm, e) 2001 to 5000 ppm, a), b) Default conditions of 25 ± 2 °C, 50 ± 10% relative humidity, and 5 V supply voltage.
Table 2. Description of the measuring locations.
LocationTypePlacementSurroundingsPoint SourcesStartEnd
Haburaruraloutside, on a windowsill,
1st floor of a family house
other family houses, low-traffic side road (10 m), forest (200 m)7.5 km (Bytenerg, Medzilaborce)15/10/2231/12/23 *
Sninaurbanbalcony,
3rd floor of an apartment block
main road (20 m)2 km (BEKY, Snina)28/02/2331/12/23 *
Michalovcesuburbanoutside of a family house other family houses, side roads (40 m), main road (120 m)1.8 km (Syráreň Bel, Michalovce)04/10/2331/12/23 *
Prešovsuburbanoutside of a family houseother family houses,
main road (30 m)
8 km (Lomy, Fintice)16/10/2231/12/23 *
Finticeruraloutside of a family houseother family houses,
main road (40 m)
1 km (Lomy, Fintice)01/03/2331/12/23 *
SNVsuburbanin the garden, outside of
a family house (10 m)
other family houses,
side road (20 m), forest (50 m)
-01/09/2331/12/23 *
Iliašovceruralbalcony,
1st floor of a family house
other family houses, side road (10 m), main road (40 m)-01/09/2331/12/23 *
Henclováruraloutside of the family houseother family houses, low-traffic road (5 m), forest (80 m)-03/02/2331/12/23 *
Košice-TUKEurbanoutside, on a windowsill,
1st floor of a university building
low-traffic side road, university campus, park behind which there is main road (200 m)11 km (U. S. Steel, Košice-Šaca)01/10/2231/12/23 *
Košice-Westurbanbalcony,
5th floor of an apartment block
facing toward a park,
away from main road
8.5 km(U. S. Steel, Košice-Šaca)07/10/2231/12/23 *
Zdobaruraloutside of a family houseother family houses, driveway (50 m)11.8 km (U. S. Steel, Košice-Šaca)13/11/2230/12/22
Valalikyruraloutside of a family houseother family houses, side road (40 m)6.4 km (U. S. Steel, Košice-Šaca)08/11/2230/01/23
Füzérkomlósruralin the garden, outside of
a family house (35 m)
other family houses, side road (50 m)-21/11/2231/12/23 *
* The measurements continue to be carried out in 2024.
Table 3. Description of the measuring locations.
LocationPM a)VOC IndexNOx IndexCO2TemperatureRHPressureWS
Habura b)XX--XXX-
Snina b)XX--XXX-
Michalovce b)XX--XXX-
Prešov b)XX--XXX-
Fintice b)XX--XXX-
SNV c)XXX-XXX-
Iliašovce b)XX--XXX-
Henclová b)XX--XXX-
Košice-TUKE c)XXXXXXXX
Košice-West c)XXX-XXX-
Zdoba b)XX--XXXX
Valaliky b)XX--XXXX
Füzérkomlós c)XXXXXXXX
a) Mass and number concentration of PM1/PM2.5/PM4/PM10, number concentration of PM0.5, typical particle size (TPS) measured by SEN54/SEN55, b) locations with SEN54, c) locations with SEN55.
Table 4. AQI categories with regard to concentrations of PM2.5 and PM10.
Air QualityAQIPM2.5 (μg/m3)
(before 7 February 2024)
PM2.5 (μg/m3)
(after 7 February 2024)
PM10 (μg/m3)
Good0–500.0–12.00.0–9.00–54
Moderate51–10021.1–35.49.1–35.455–154
Unhealthy for Sensitive Groups *100–15035.5–55.435.5–55.4155–254
Unhealthy150–20055.5–150.455.5–125.4255–354
Very Unhealthy200–300150.5–250.4125.5–225.4355–424
Hazardous300–500250.4–500.4225.5+425–604
* People with heart or lung disease, older adults, children, and people of lower socioeconomic status.
Disclaimer/Publisher’s Note: The statements, opinions and data contained in all publications are solely those of the individual author(s) and contributor(s) and not of MDPI and/or the editor(s). MDPI and/or the editor(s) disclaim responsibility for any injury to people or property resulting from any ideas, methods, instructions or products referred to in the content.