Abstract
Most of the lightning appears below the cloud or inside the cloud. Unlike conventional lightning, blue jets and gigantic jets (GJ) produce upward discharge since electric discharge occurs as a form of cloud-to-air leader. We analyzed a gigantic jet recorded in the 2022 Taiwan campaign. For our color photograph recorded in the observation, high spatial resolution (150 m) at a close distance (140 km) resolves the important spatial features of the GJ phenomena. First, the GJ propagated upwardly as the fully developed jet with a maximum height of ~80 km above the cloud top ~17 km. After the fully developed stage, the subsequent leader reached its top height of ~30 km with a width of 0.5–1.0 km. The subsequent leader attempted but failed to develop from leader to fully developed jet. The subsequent leader may be interpreted as a negative stepped leader associated with cloud rebrightening, similar to the subsequent stroke in the multi-stroke lightning. Besides, the relatively higher IC flash rates associated with the rise of cloud tops benefit the required meteorological conditions for developing gigantic jets.
1. Introduction
The gigantic jet (GJ) is an electric discharge phenomenon emerging from the cloud top to the bottom of the ionosphere [1,2,3,4,5,6,7,8,9,10,11,12,13,14,15,16]. Recent studies have shown the three evolving steps of developing gigantic jets: leading jets, fully developed jets, and trailing jets, where the subsequent leader process is also involved [3,5,7]. At the first “leading jets” stage, the GJ leaders jump from the cloud to the higher altitude. Similar to long air gap discharge [17], a number of narrow streamer filaments multiply and branch at upward-propagating leader tips. A wider corona-streamer zone higher than leader altitudes forms as the GJ fully developed jet. The GJ is initiated by lightning leaders and expands to a fully developed cone-shaped discharge. After the GJ reaches its max height of at least 70–80 km, the subsequent leader attempted but failed to develop from leader to fully developed jet. The subsequent failed leader process is essential to study the GJ-associated lightning activity in the trailing jet and explain the acting role of GJ processes after a fully developed jet.
The mechanism for the final failed leader over the cloud top in a gigantic jet is still a puzzle. As found in previous studies, the cloud-top point emission associated with the leader process was casually recorded during the fully developed phase in gigantic jets, which is analog to the return stroke in the cloud-to-ground (CG) lightning [3]. The final leader also re-illuminated simultaneously with the cloud brightening, which can be physically considered as the lightning continuous current [7]. Our recorded color images for the gigantic jet show the fully developed jet had a maximum height of ~80 km above the cloud top of ~17 km. After the jump of the leading jet to the fully developed jet, the trailing jet brightened the remains of the fully developed jet to a height of ~60 km. The photograph shows the stepped structure of the subsequent leader, which resembles the stepwise of a cloud-to-air negative leader [18,19]. However, the subsequent leader had a higher altitude of ~30 km and a width of ~0.5–1.0 km. After we analyzed the lightning activity associated with observed GJ and sprites, GJs appeared at the developing stage of the thunderstorm with relatively higher intra-cloud flash rates related to decreasing cloud top temperature.
2. Instruments
The Taiwan Meteor Detector System (TMDS) at Lulin Observatory routinely monitors the meteor activity around Taiwan [20]. The TMDS is an automated multi-station video meteor system equipped to observe meteors as well as record transient luminous events. The TMDS camera system consists of the surveillance color camera (Sony, Japan, IMX290) at a time resolution of 1 s and the low-light-level monochromatic cameras (Watec, Japan, 902h) with a time resolution of 30 frames per second.
For the surveillance camera, the azimuthal and inclination angle was about 0.06 degrees per pixel. In addition to the recorded video data, the World Wide Lightning Location Network (WWLLN) lightning data, known for lightning mean location accuracy of less than 10 km [21], provided us to determine the geolocation (near 122 E, 24 N) of related lightning emission in our recorded images for GJ. The distance from the lightning to the Lulin observatory is about 144 km. We estimated the top of the recorded gigantic jet is located at an altitude of 80 km. The spatial resolution is about 150 ± 20 m at a distance of 144 ± 10 km.
The geometric determination algorithm, a crucial part of our methodology, was developed [22]. We used the background stars of recorded video images in comparison with the star catalog at a recorded time. After the calibration of background stars in the recorded images, we can retrieve the azimuthal and the elevation angle of each pixel for recorded image frames. The geometric data derived from this algorithm is essential for investigating the dynamic heights and sizes of the leading jet, the fully developed phase, and the trailing jet of the gigantic jet.
The GJ-associated extremely low frequency (ELF) data was recorded using a broadband ELF measurement system developed at the AGH University of Science and Technology [23]. The system is installed at the Hylaty geophysical station in the Bieszczady mountains in Poland (49.2036° N, 22.5438° E). The current moment waveform was reconstructed using the method presented by Mlynarczyk, et al. [24] and an ELF propagation model based on Kułak and Młynarczyk [25].
We analyzed the flash activity in the thunderstorm associated with gigantic jets and sprites using the Earth Networks Total Lightning Network (ENTLN) dataset. The ENTLN uses the time-of-arrival detection methodology with GPS technology and sophisticated algorithms to locate and classify lightning types accurately. A sensor includes wideband electrical field recorders (frequency ranging from 1 HZ to 12 MHZ), a GPS receiver, a nano-second GPS-based timing circuit, a digital signal processor, onboard storage, and internet communication equipment. As a result of the advanced predictive abilities and global deployment of ENTLN, it has the potential to significantly improve severe weather warning times over radar and other technologies [26,27,28]. Lightning also helps us to study the electrical activity of thunderstorms. Besides, the cloud’s top temperature and area help us study the meteorological condition of thunderstorms associated with GJ. The cloud top temperature is obtained from the Himawari-8 infrared channel product [29].
3. Results
Figure 1 shows the dynamic sequence with a time resolution of 1 s for the observed GJ at 13:29:32 (LT) on Oct 22 2022. We categorized the period of our recorded GJ as four stages: (1) initiating leaders (Figure 1a), (2) the leader-to-streamer jump to the ionosphere (Figure 1b), (3) new-born corona envelope of leader (Figure 1c), and (4) remains of stepped leaders (Figure 1d). Figure 1a shows the leading jet where the initiation of originating leaders was developed but hidden inside the cloud. In Figure 1b, the lightning leader fully developed as the cone structure of the upper red-dominated streamer region at higher altitudes and the lower filamentary structures of leaders above the previous cloud emissions. Like the negative leader in a long air gap, the high electric potential at the tip of the leader causes the inception of a corona, and the bi-directional space leader may exist as the foremost boundary of the streamer region. The negative leader propagates toward the positive end of the space leader and connects into a junction of the space leader, leading to a strong reillumination [17]. The high-speed camera observation of GJs revealed the leader-to-streamer jumps as the bi-directional process of upward-propagating negative leaders [15]. Figure 1c shows the re-triggering of the corona envelope with a maximum height of ~30 km. The upper streamer region faded away at higher altitudes. Remarkably, the rebrightening leaders appeared around old ones in Figure 1d. The remaining structure of the stepped leaders reveals the intrinsic stepwise characteristics of the subsequent negative leader.
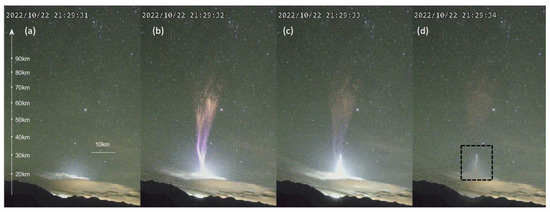
Figure 1.
The observed GJ four stages: (a) first stage is the emission associated with the leading jet embedded in the cloud (not visible); (b) second stage is the fan region of extending streamers (red color) in front of the leader (purple color) and the main trunk of lightning channel (white color); (c) the new forming subsequent leader inside the overexposed corona envelope in white color; (d) the remains of subsequent leader with stepped structure, indicated by black dashed lines.
Figure 2a shows the azimuthal magnetic field component in the arrival direction of the GJ location (the discharge signature is present in). The discharge associated with the recorded signature (green arrow) was so powerful that we can see several occurrences of the round-the-world wave (orange arrows in Figure 2a). Due to a strong dispersion and a much higher attenuation at higher frequencies, most details in the round-the-world wave were lost. The recorded waveform is similar to some other gigantic jets observed in the past [16]. The waveform associated with this gigantic jet (Figure 2a) was recorded at 13:29:32.6 (UT), about 2.4 s after the PC-based camera time (13:29:30.240 UT) of GJ and about 0.6 s before WWLLN detected lightning event (13:29:33.204 UT). Based on our experience with a PC-based camera timing, the delay of ~2.4 s is within a typical range of time uncertainty of such a video recording system. The jets are usually preceded by lightning activity, as shown in the video imagery when they are observed at a small distance (e.g., [7,13,16]). However, previous studies have shown that GLD360/WWLLN might miss the flash activity. The fact that the GJ was detected in the ELF measurements ~0.6 s before the WWLLN flash time suggests that, in our case, WWLLN missed the flash activity. The only reliable time in our situation is the time obtained from the ELF measurements after subtracting the propagation delay of ELF waves. The confluence of these four factors gives us a high confidence that this is indeed the GJ-associated waveform.
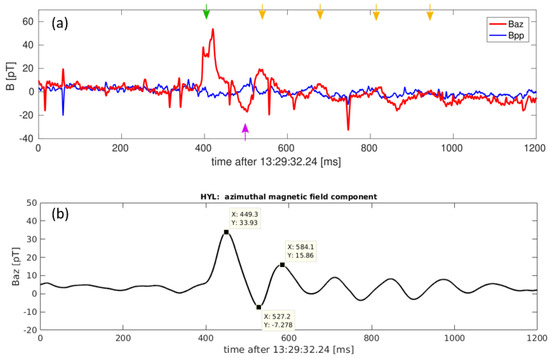
Figure 2.
(a) The Azimuthal magnetic field component (red) and the perpendicular to it (blue) where the green/magenta arrow indicates the current source from the shorter and longer round-the-world paths, and orange arrows represent occurrences of the round-the-world wave, respectively; (b) the azimuthal magnetic field component after a low-pass filter with the 3-dB cutoff frequency of 10 Hz.
Since the GJ-associated signal was very powerful, we can even further validate the ELF recording by confirming the distance between the GJ location and the ELF measurement system. We used the time of arrival of the waves that propagated by the shorter and longer paths (green and magenta arrows in Figure 2a), together with the time of arrival of the round-the-world wave (first orange arrow in Figure 2a). To reveal clearly all the required values, we filtered out the higher frequency components. Figure 2b presents the azimuthal magnetic field component after a low-pass filter with a 3-dB cutoff frequency of 10 Hz. We add markers at the peak values required for the calculations. We can estimate the distance d to the GJ locations using the following relationship [30]: d = tx/2 × dw/tw, where dw is the Earth’s circumference, tw is the propagation time around the world, and tx is the delay between the round-the-world wave and the wave that propagated to the receiver by the longer path. Using the values from the plot, we obtain tw = 584.1 − 449.3 = 134.8 ms and tx = 584.1 − 527.2 = 56.9 ms. The approximate Earth’s circumference is 40,000 km. Therefore, we obtain d = 8442 km, which agrees very well with the distance estimated from other instruments.
Based on the recorded magnetic field component, we reconstructed the current moment waveform, shown in Figure 3a. The obtained waveform shown in Figure 3a looks similar to that in Figure 2, but there is a major difference between them. The method we use to reconstruct the current moment waveform takes into account the EM wave propagation in the Earth-ionosphere waveguide, which is quite complex because each frequency component propagates at a different speed and has a different attenuation. The higher the frequency, the faster the propagation speed, but the higher the attenuation. As a result, we obtained the current moment waveform as it was at the source, where the timing and amplitude of each frequency component were reconstructed using the propagation model. The procedure is described in detail in the cited publication [24].
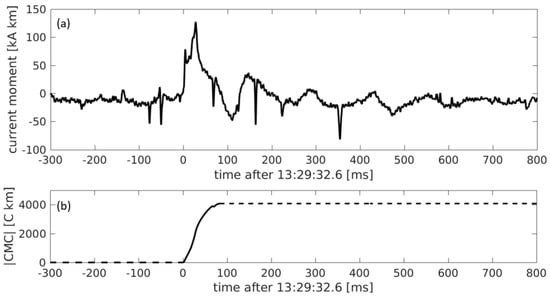
Figure 3.
(a) The current moment waveform and (b) accumulated charge moment change (CMC) of recorded gigantic jet where black solid line indicates CMC. The dashed lines in the left side and the right side represent the CMC’s baseline and its maximum value, respectively.
Since the electromagnetic wave propagation delay was automatically subtracted by the current moment reconstruction method, the resulting timing in Figure 3a is relative to the GJ occurrence time at the source. Figure 3b shows the charge moment change obtained by integrating the current moment waveform. The integration window starts at the assumed beginning of the gigantic jet-associated waveform and ends when the current goes down to zero. The total integration time was 85 ms. The charge moment change is a little underestimated because of a negative discharge in its later part and also because it is possible that the continuing current did not settle completely to zero before the arrival of the wave that propagated by the longer path (visible in the current moment waveform in Figure 3b around t = 100 ms). Based on the current moment waveform, we can tell that the GJ had a negative polarity (negative charges moving upward).
Figure 4 shows the 30 frames per second, or 60 interlaced fields per second, for simultaneous recorded GJ images in Figure 1. The top GJ heights at frame times are labeled in Figure 4a at a time resolution of ~16.7 ms. We use the Matlab function (interp1) with a cubic method to interpolate the GJ heights, indicated by the blue line in Figure 4b, at a time resolution of 1 ms. We plot the GJ velocity in Figure 4c by calculating the time derivative of heights shown in Figure 4b. Below a height of 30 km, the speed increases from 5 × 10⁴ to 7 × 10⁵ m s−1, where the leader from the cloud reaches up to this altitude, and its upward speed is similar to theoretical leader velocity (104–105 m s−1) [11,12,15]. At a height of 35 km, the speed reaches 1 × 10⁶ m s−1, where the GJ upward velocity approximates the streamer’s velocity. Higher than 35 km, the GJ accelerates to 3 × 10⁶ m s−1. The results seem reasonable since the GJ velocity is increasing during the transition of leader-to-streamer velocity (104–106 m s−1) [11,12].
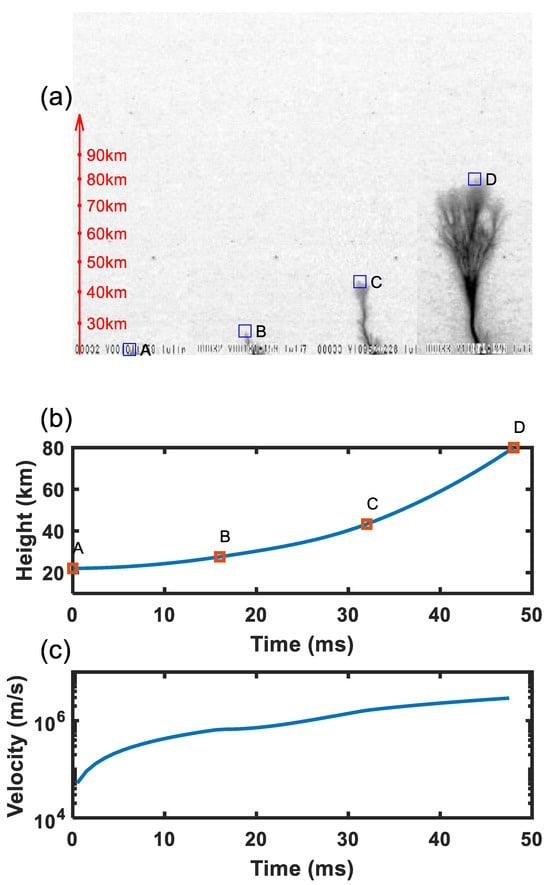
Figure 4.
(a) Our recorded GJ images at a time resolution of 16.7 ms where A–D indicate the GJ’s top altitudes; (b) interpolating heights (blue line) at a time resolution of 1 ms versus labeled heights A–D in red squares, respectively; (c) the derived GJ velocity.
In Figure 5, a GJ subsequent leader’s zoom-in reveals the negative leader’s stepped structure. The subsequent leader shows the wrapped structure which surrounds the old ones. The top of the leader had two branches over the node at a height of ~30 km in Figure 5b (indicated by white arrows). Previous observations also found the branched structures [7]. We estimated the diameter of the final leader in Figure 5c as 0.5–1.0 km (about 3–5 pixels in the image frame). In previous reports, the maximum height of the final leader is 38.3 km with a radius of 0.5–1.0 km [15]. Similar to the events observed by Soula, et al. [7], the lower jet channel broadens significantly to 0.5–1.0 km width measured at 30 km altitude shortly after the GJ fully developed and trailing jet. The stepped structure of the subsequent leader resembles the stepwise of a cloud-to-air negative leader [18,19]. However, the subsequent leader had a higher altitude of ~30 km. A similar IC flash associated with the subsequent leader was also observed in a gigantic jet after the fully developed stage [8]. We will discuss this in the next section.
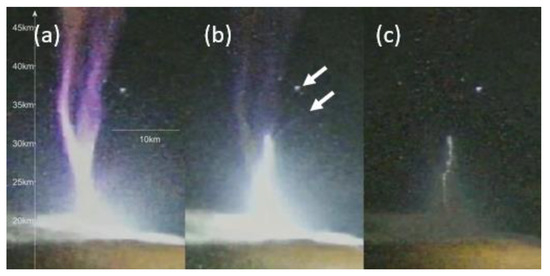
Figure 5.
The zoom-in photograph of Figure 1 for (a) the fully developed stage, (b) the rebrightening final leader stage with two branches (white arrows) over the node at a height of ~30 km, and (c) remains of stepwise structure of negative cloud-to-air leader.
Figure 6 shows the lightning parameters analysis, including IC/CG peak current magnitude and flash rate per 10 min from UT 12:00 to 16:00. One hour before and after the GJ time13:29:32.6 (UT), the IC flash rate increased ~half an hour before the GJ time and had a peak roughly at GJ time. Although the IC flash rate had a maximum between UT 14:10 and 14:50 in the lifespan of this thunderstorm, the decreasing cloud top temperature in Figure 6 indicates the cloud may enter its decay phase with downdrafts inside the cloud. In this period, the CG flash rate also reached its maximum while sprites were observed in the decaying phase of a thunderstorm. That increase in IC activity could provide favorable conditions for the GJ scenario proposed by Krehbiel, et al. [31], where IC may trigger the cloud charge imbalance. The gigantic jets could start as a normal intracloud discharge between a dominant mid-level positive charge and a depleted screening upper-level negative charge that continues propagating out of the top of the storm.
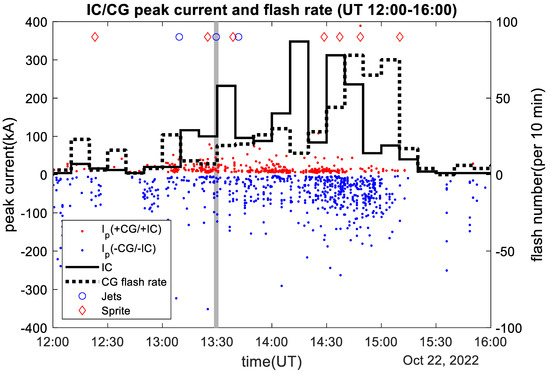
Figure 6.
The IC and CG flash rates per ten minutes are indicated by solid and dashed staired lines in the right axis, and their scatter plots for peak currents were red for positive and blue for negative polarity). The grey vertical line indicates the GJ time13:29:32.6 (UT), while jets and sprites observed in the 2022 Taiwan campaign are labeled with blue open circles and red diamonds.
Krehbiel, et al. [31] pointed out that mixing of the screening charge at the cloud top with the upper positive charged particle may produce gigantic jet discharges. We analyzed the cell area and the cloud top temperature from the Japan Meteorological Agency Himawari satellite to trace the development conditions within the thunderstorm. Figure 7 shows the minimum cloud top temperature (CTT) and the area in units of km2 for the cloud top temperature range (−20~−30 °C, −30~−40 °C, −40~−50 °C, −50~−60 °C, <−60 °C). In Figure 7, we found that, at GJ occurring time, the cloud top time has a local minimum, which corresponds to the highest cloud height at the thunderstorm development stage. The GJ was rarely recorded at ground campaigns since the thunderstorms’ favorable charge structures could be a narrow upper charge region near the end of an intense convective pulse [31,32]. Past observations suggest that the convective pulses creating overshooting tops are a primary driver in creating the charge structures that produce negative gigantic jets [32,33]. The observed GJs over the Indian Ocean were produced in sequences of a few minutes, during short pulses of convection within cells in the phase of development, and characterized by dominant positive cloud-to-ground lightning flashes [16].
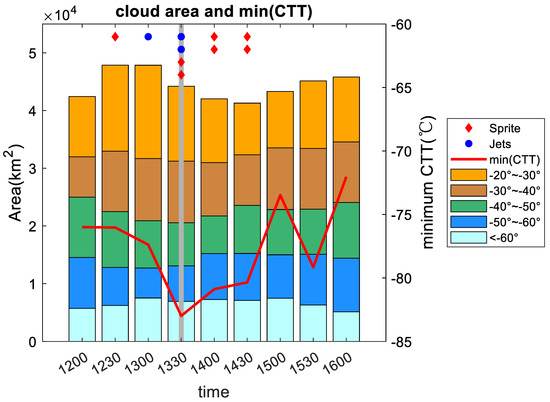
Figure 7.
The statistical results of the area of cloud top temperature range (−20 °C~−30 °C, −30 °C~−40 °C, −40 °C~−50 °C, −50 °C~−60 °C, <−60 °C) where a minimum of Cloud top temperature (CTT) is plotted by red solid line, and the grey vertical line indicates the GJ time13:29:32.6 (UT).
4. Discussion
In our observation, the GJ was recorded in a meteorological environment with a relatively high IC flash rate and the lowest cloud top temperature. After GJ fully developed jets, the interesting phenomena associated with cloud-top emission [3,5,7,15] were subsequently stepped up in observed GJ. The ELF waveform indicates the negative polarity associated with GJ currents, where GJ is an intrinsic -CI (Cloud-to-ionosphere discharge), and the negative leader propagates upward. In comparison with -CI, for negative cloud-to-ground flash (-CG), negative stepped leaders downward strike near the ground. After -CG’s first return stroke, most -CGs have more than one stroke. The number of strokes per flash is 3–5, and the inter-stroke interval is ~60 ms [34]. Besides, the multi-stroke +CG lightning was rare but also few reported by [35,36]. The intrinsic nature of multi-stroke -CG lightning reflects that the negative leader channel to the ground becomes resistive and current cutoff while the recoil leader at the positive side of the bi-directional leader continues to develop as a current impulse in previous leader channels [37,38,39].
For -CG, the cutoff in the negative leader occurs for two reasons: a higher degree of branching and higher propagation speed than positive ones [40]. Under the assumption of similar behavior in GJ leaders after the cutoff of negative leaders in the fully developed GJ, positive leaders in the other end of bidirectional leaders keep active inside the cloud, as shown as cloud emission again in Figure 1c. The recoil leaders could carry negative charges and propagate along the path of the previously existing channel of the positively charged leader back to the leader’s origin [37]. The high-speed video observations also reveal another scenario. The recoil leader was confirmed as a bidirectional leader, which reconnected the original leader channel [41,42]. By attaching to the main leader channel, the recoil leader produces an M-event, which is characterized by a surge in the upward current pulse in the leader’s trunk and the attached recoil leader [41].
Our photographs demonstrate the subsequent leader in Figure 5 with the discontinuous segments, which can be interpreted by a second attempt at a stepped negative leader. After the current cutoff in the fully developed GJ, the rebrightening of subsequent leaders in GJ was also traced by VHF and LF sources, which are interpreted by the positive leader and associated K processes [8]. The intra-cloud lightning activity (e.g., recoil leaders) should sustain extra current impulse associated with observed rebrightening subsequent leader, similar to the common property of multi-stroke -CG lightning. The bi-directional leader develops between and propagates in the opposite direction for the positive and negative charge regions. The intra-cloud emission inside the cloud may be blocked by the horizon since the elevation angle is too low for the ground campaign, which is not easy to observe. The gigantic jet observed in the top view by the satellite FORMOSAT-2 can reveal the cloud charge emission in space [5] [Figure 2]. Two-layer cloud emission implies that the subsequent leader over the cloud top is linked with the following IC activities inside the cloud. Soula, et al. [7] also found a rebrightening of the lower trunk, and the final leader had a branching structure. The re-illumination associated with subsequent leaders could have the following explanation. The stepped structure of a subsequent leader resembles the natural characteristics of a negatively stepped leader. The subsequent leader may be interpreted as a second attempt of negative stepped leader associated with intra-cloud (IC) rebrightening, similar to the subsequent strokes (i.e., dart leader for CG or K leader for IC [39]) in the multi-strokes lightning.
5. Conclusions
The main findings of our GJ developing stages are summarized as follows: (1) originating of lightning leader, (2) streamer-to-leader jump to the ionosphere, (3) corona envelope of leader, and (4) remains of stepped leaders. The re-illumination of subsequent leaders with a max height of 30 km associated with the upper streamer region faded away at higher altitudes. Particularly, the final leader channels appeared around old ones. The stepped structure of the negative leaders reveals their inherent spatial characteristics. Our photographs in the GJ subsequent leader show the discontinuous segments as intrinsic characteristics of negative leaders. In our campaign, we observed 3 GJs and 7 sprites at night on 22 October 2022. After analyzing the flash activity and cloud top temperature, higher IC activity and the rise of cloud top may be two reasons for producing favorable conditions for GJ in this case study.
Author Contributions
Methodology and formal analysis, W.-Q.C. and Y.-M.L.; writing—original draft preparation, W.-Q.C., C.-L.K. and J.M.; ELF data and analysis, J.M.; Video and observation site supports, Z.-Y.L. All authors have read and agreed to the published version of the manuscript.
Funding
This research was funded by MOST 112-2111-M-008-013, MOST 111-2111-M-008-008, and MOST 110-2111-M-008-007 from the National Science and Technology Council in Taiwan.
Institutional Review Board Statement
Not applicable.
Informed Consent Statement
Not applicable.
Data Availability Statement
The raw data supporting the conclusions of this article will be made available by the authors on request. The data are not publicly available due to privacy.
Acknowledgments
The authors would like to thank the assistance and support from the Lulin Observatory at National Central University, especially from Y.-H. Chang, K.-S. Chang, H.-C. Lin, C.-S. Lin, H.-Y. Hsiao, and W.-J. Hou. They would like to thank Bob Holzworth (WWLLN) for providing the lightning data for this study. The cloud top temperature from Himawari-8 that was used in this paper was supplied by the P-Tree System, Japan Aerospace Exploration Agency (JAXA).
Conflicts of Interest
The authors declare no conflict of interest.
References
- Pasko, V.P.; Stanley, M.A.; Mathews, J.D.; Inan, U.S.; Wood, T.G. Electrical discharge from a thundercloud top to the lower ionosphere. Nature 2002, 416, 152–154. [Google Scholar] [CrossRef] [PubMed]
- Lyons, W.A.; Nelson, T.E.; Armstrong, R.A.; Pasko, V.P.; Stanley, M.A. Upward Electrical Discharges From Thunderstorm Tops. Bull. Am. Meteorol. Soc. 2003, 84, 445–454. [Google Scholar] [CrossRef]
- Su, H.T.; Hsu, R.R.; Chen, A.B.; Wang, Y.C.; Hsiao, W.S.; Lai, W.C.; Lee, L.C.; Sato, M.; Fukunishi, H. Gigantic jets between a thundercloud and the ionosphere. Nature 2003, 423, 974–976. [Google Scholar] [CrossRef] [PubMed]
- Cummer, S.A.; Li, J.; Han, F.; Lu, G.; Jaugey, N.; Lyons, W.A.; Nelson, T.E. Quantification of the troposphere-to-ionosphere charge transfer in a gigantic jet. Nat. Geosci. 2009, 2, 617–620. [Google Scholar] [CrossRef]
- Kuo, C.-L.; Chou, J.K.; Tsai, L.Y.; Chen, A.B.; Su, H.T.; Hsu, R.R.; Cummer, S.A.; Frey, H.U.; Mende, S.B.; Takahashi, Y.; et al. Discharge processes, electric field, and electron energy in ISUAL-recorded gigantic jets. J. Geophys. Res. Space Phys. 2009, 114, A04314. [Google Scholar] [CrossRef]
- van der Velde, O.A.; Bór, J.; Li, J.; Cummer, S.A.; Arnone, E.; Zanotti, F.; Füllekrug, M.; Haldoupis, C.; NaitAmor, S.; Farges, T. Multi-instrumental observations of a positive gigantic jet produced by a winter thunderstorm in Europe. J. Geophys. Res. Atmos. 2010, 115, D24301. [Google Scholar] [CrossRef]
- Soula, S.; van der Velde, O.; Montanya, J.; Huet, P.; Barthe, C.; Bór, J. Gigantic jets produced by an isolated tropical thunderstorm near Réunion Island. J. Geophys. Res. Atmos. 2011, 116, D19103. [Google Scholar] [CrossRef]
- Lu, G.; Cummer, S.A.; Lyons, W.A.; Krehbiel, P.R.; Li, J.; Rison, W.; Thomas, R.J.; Edens, H.E.; Stanley, M.A.; Beasley, W.; et al. Lightning development associated with two negative gigantic jets. Geophys. Res. Lett. 2011, 38, L12801. [Google Scholar] [CrossRef]
- Huang, S.-M.; Hsu, R.-R.; Lee, L.-J.; Su, H.-T.; Kuo, C.-L.; Wu, C.-C.; Chou, J.-K.; Chang, S.-C.; Wu, Y.-J.; Chen, A.B. Optical and radio signatures of negative gigantic jets: Cases from Typhoon Lionrock (2010). J. Geophys. Res. Space Phys. 2012, 117, A08307. [Google Scholar] [CrossRef]
- Lee, L.-J.; Huang, S.-M.; Chou, J.-K.; Kuo, C.-L.; Chen, A.B.; Su, H.-T.; Hsu, R.-R.; Frey, H.U.; Takahashi, Y.; Lee, L.-C. Characteristics and generation of secondary jets and secondary gigantic jets. J. Geophys. Res. Space Phys. 2012, 117, A06317. [Google Scholar] [CrossRef]
- da Silva, C.L.; Pasko, V.P. Vertical structuring of gigantic jets. Geophys. Res. Lett. 2013, 40, 3315–3319. [Google Scholar] [CrossRef]
- da Silva, C.L.; Pasko, V.P. Dynamics of streamer-to-leader transition at reduced air densities and its implications for propagation of lightning leaders and gigantic jets. J. Geophys. Res. Atmos. 2013, 118, 13561–13590. [Google Scholar] [CrossRef]
- Liu, N.; Spiva, N.; Dwyer, J.R.; Rassoul, H.K.; Free, D.; Cummer, S.A. Upward electrical discharges observed above Tropical Depression Dorian. Nat. Commun. 2015, 6, 5995. [Google Scholar] [CrossRef] [PubMed]
- Boggs, L.D.; Liu, N.; Peterson, M.; Lazarus, S.; Splitt, M.; Lucena, F.; Nag, A.; Rassoul, H.K. First Observations of Gigantic Jets From Geostationary Orbit. Geophys. Res. Lett. 2019, 46, 3999–4006. [Google Scholar] [CrossRef]
- van der Velde, O.A.; Montanyà, J.; López, J.A.; Cummer, S.A. Gigantic jet discharges evolve stepwise through the middle atmosphere. Nat. Commun. 2019, 10, 4350. [Google Scholar] [CrossRef]
- Soula, S.; Mlynarczyk, J.; van der Velde, O.; Montanya, J.; Leclerc, E. High Production of Gigantic Jets by a Thunderstorm Over Indian Ocean. J. Geophys. Res. Atmos. 2023, 128, e2023JD039486. [Google Scholar] [CrossRef]
- Gallimberti, I.; Bacchiega, G.; Bondiou-Clergerie, A.; Lalande, P. Fundamental processes in long air gap discharges. Comptes Rendus Phys. 2002, 3, 1335–1359. [Google Scholar] [CrossRef]
- Edens, H.E.; Eack, K.B.; Rison, W.; Hunyady, S.J. Photographic observations of streamers and steps in a cloud-to-air negative leader. Geophys. Res. Lett. 2014, 41, 1336–1342. [Google Scholar] [CrossRef]
- Hausknost, G.; Ventre, A.; Soula, S.; Coquillat, S.; Mlynarczyk, J.; Hermant, A. Multi-Instrumental Observation of an Upward Cloud-To-Air Discharge Above a Mediterranean Storm. Geophys. Res. Lett. 2023, 50, e2023GL105146. [Google Scholar] [CrossRef]
- Lin, Z.-Y.; Chi, H.-C.; Wang, B.-H.; Lin, Z.-Y.; Liu, C.-C.; Lee, J.; Lin, H.-C.; Wu, B.; Ma, X.-H.; Liao, C.-H. The current development of the Taiwan Meteor Detector System (TMDS) with a dedication to the Geminids 2017 and 2018. Planet. Space Sci. 2020, 180, 104763. [Google Scholar] [CrossRef]
- Holzworth, R.H.; McCarthy, M.P.; Brundell, J.B.; Jacobson, A.R.; Rodger, C.J. Global Distribution of Superbolts. J. Geophys. Res. Atmos. 2019, 124, 9996–10005. [Google Scholar] [CrossRef]
- Lu, M.-R.; Chen, P.-Y.; Kuo, C.-L.; Chou, C.-C.; Wu, B.-X.; Shinsuke, A.; Su, H.-T.; Hsu, R.-R.; Wang, S.-H.; Lin, N.-H.; et al. Recent work on sprite spectrum in Taiwan. Terr. Atmos. Ocean. Sci. 2017, 28, 625–636. [Google Scholar] [CrossRef][Green Version]
- Mlynarczyk, J.; Kulak, A.; Popek, M.; Iwanski, R.; Klucjasz, S.; Kubisz, J. An analysis of TLE-associated discharges using the data recorded by a new broadband ELF receiver. In Proceedings of the XVI International Conference on Atmospheric Electricity, Nara, Japan, 17–22 June 2018; pp. 17–22. [Google Scholar]
- Mlynarczyk, J.; Bór, J.; Kulak, A.; Popek, M.; Kubisz, J. An unusual sequence of sprites followed by a secondary TLE: An analysis of ELF radio measurements and optical observations. J. Geophys. Res. Space Phys. 2015, 120, 2241–2254. [Google Scholar] [CrossRef]
- Kułak, A.; Młynarczyk, J. A new technique for reconstruction of the current moment waveform related to a gigantic jet from the magnetic field component recorded by an ELF station. Radio Sci. 2011, 46, RS2016. [Google Scholar] [CrossRef]
- Bui, V.; Chang, L.-C.; Heckman, S. A Performance Study of Earth Networks Total Lighting Network (ENTLN) and Worldwide Lightning Location Network (WWLLN). In Proceedings of the 2015 International Conference on Computational Science and Computational Intelligence (CSCI), Las Vegas, NV, USA, 7–9 December 2015; pp. 386–391. [Google Scholar]
- Zhu, Y.; Rakov, V.A.; Tran, M.D.; Stock, M.G.; Heckman, S.; Liu, C.; Sloop, C.D.; Jordan, D.M.; Uman, M.A.; Caicedo, J.A.; et al. Evaluation of ENTLN Performance Characteristics Based on the Ground Truth Natural and Rocket-Triggered Lightning Data Acquired in Florida. J. Geophys. Res. Atmos. 2017, 122, 9858–9866. [Google Scholar] [CrossRef]
- Zhu, Y.; Stock, M.; Lapierre, J.; DiGangi, E. Upgrades of the Earth Networks Total Lightning Network in 2021. Remote Sens. 2022, 14, 2209. [Google Scholar] [CrossRef]
- Bessho, K.; Date, K.; Hayashi, M.; Ikeda, A.; Imai, T.; Inoue, H.; Kumagai, Y.; Miyakawa, T.; Murata, H.; Ohno, T.; et al. An Introduction to Himawari-8/9—Japan’s New-Generation Geostationary Meteorological Satellites. J. Meteorol. Soc. Jpn. Ser. II 2016, 94, 151–183. [Google Scholar] [CrossRef]
- Mlynarczyk, J.; Kulak, A.; Salvador, J. The Accuracy of Radio Direction Finding in the Extremely Low Frequency Range. Radio Sci. 2017, 52, 1245–1252. [Google Scholar] [CrossRef]
- Krehbiel, P.R.; Riousset, J.A.; Pasko, V.P.; Thomas, R.J.; Rison, W.; Stanley, M.A.; Edens, H.E. Upward electrical discharges from thunderstorms. Nat. Geosci. 2008, 1, 233–237. [Google Scholar] [CrossRef]
- Boggs, L.D.; Liu, N.; Riousset, J.A.; Shi, F.; Lazarus, S.; Splitt, M.; Rassoul, H.K. Thunderstorm charge structures producing gigantic jets. Sci. Rep. 2018, 8, 18085. [Google Scholar] [CrossRef]
- Lazarus, S.M.; Splitt, M.E.; Brownlee, J.; Spiva, N.; Liu, N. A Thermodynamic, kinematic and microphysical analysis of a jet and gigantic jet-producing Florida thunderstorm. J. Geophys. Res. Atmos. 2015, 120, 8469–8490. [Google Scholar] [CrossRef]
- Rakov, V.A.; Uman, M.A. Lightning: Physics and Effects; Cambridge University Press: Cambridge, UK, 2003; p. 687. [Google Scholar]
- Urbani, M.; Montanyá, J.; van der Velde, O.A.; Arcanjo, M.; López, J.A. Multi-Stroke Positive Cloud-To-Ground Lightning Sharing the Same Channel Observed With a VHF Broadband Interferometer. Geophys. Res. Lett. 2022, 49, e2021GL097272. [Google Scholar] [CrossRef]
- Yuan, S.; Qie, X.; Jiang, R.; Wang, D.; Sun, Z.; Srivastava, A.; Williams, E. Origin of an Uncommon Multiple-Stroke Positive Cloud-to-Ground Lightning Flash With Different Terminations. J. Geophys. Res. Atmos. 2020, 125, e2019JD032098. [Google Scholar] [CrossRef]
- Shao, X.M.; Krehbiel, P.R.; Thomas, R.J.; Rison, W. Radio interferometric observations of cloud-to-ground lightning phenomena in Florida. J. Geophys. Res. Atmos. 1995, 100, 2749–2783. [Google Scholar] [CrossRef]
- Mazur, V. Triggered lightning strikes to aircraft and natural intracloud discharges. J. Geophys. Res. Atmos. 1989, 94, 3311–3325. [Google Scholar] [CrossRef]
- Jensen, D.P.; Sonnenfeld, R.G.; Stanley, M.A.; Edens, H.E.; da Silva, C.L.; Krehbiel, P.R. Dart-Leader and K-Leader Velocity From Initiation Site to Termination Time-Resolved With 3D Interferometry. J. Geophys. Res. Atmos. 2021, 126, e2020JD034309. [Google Scholar] [CrossRef]
- Mazur, V. Physical processes during development of lightning flashes. Comptes Rendus Phys. 2002, 3, 1393–1409. [Google Scholar] [CrossRef]
- Mazur, V.; Ruhnke, L.H.; Warner, T.A.; Orville, R.E. Recoil leader formation and development. J. Electrost. 2013, 71, 763–768. [Google Scholar] [CrossRef]
- Mazur, V. The physical concept of recoil leader formation. J. Electrost. 2016, 82, 79–87. [Google Scholar] [CrossRef]
Disclaimer/Publisher’s Note: The statements, opinions and data contained in all publications are solely those of the individual author(s) and contributor(s) and not of MDPI and/or the editor(s). MDPI and/or the editor(s) disclaim responsibility for any injury to people or property resulting from any ideas, methods, instructions or products referred to in the content. |
© 2024 by the authors. Licensee MDPI, Basel, Switzerland. This article is an open access article distributed under the terms and conditions of the Creative Commons Attribution (CC BY) license (https://creativecommons.org/licenses/by/4.0/).