Article

Correlation between Lunar Phases and Rainfall Patterns in Mexico

by
Juan Israel Avila-Carrazco
1,
Ángel Alfonso Villalobos-De Alba
2,
Carlos Alberto Olvera-Olvera
1,*,
José I. De La Rosa-Vargas
1,
Héctor Gutiérrez-Bañuelos
3,
Luis Octavio Solís-Sánchez
1,
Santiago Villagrana-Barraza
1,
Manuel de Jesús López-Martínez
1,
Diana Isabel Ortíz-Esquivel
1 and
Germán Díaz-Flórez
1,*
1
Unidad Académica de Ingeniería Eléctrica, Universidad Autónoma de Zacatecas, Campus Siglo XXI, Carretera Zacatecas—Guadalajara Kilómetro 6, Ejido la Escondida, Zacatecas 98160, Mexico
2
Unidad Académica de Ingeniería I, Universidad Autónoma de Zacatecas, Zacatecas 98068, Mexico
3
Unidad Académica de Medicina Veterinaria y Zootecnia, Universidad Autónoma de Zacatecas, Zacatecas 98500, Mexico
*
Authors to whom correspondence should be addressed.
Atmosphere 2024, 15(7), 746; https://doi.org/10.3390/atmos15070746
Submission received: 7 May 2024 / Revised: 4 June 2024 / Accepted: 16 June 2024 / Published: 21 June 2024
(This article belongs to the Section Atmospheric Techniques, Instruments, and Modeling)

Abstract

:
In this study, daily historical records from Mexican weather stations across the country were classified according to corresponding Moon phases at the time of rainfall occurrence: New Moon, Waxing Crescent, First Quarter, Waxing Gibbous, Full Moon, Waning Gibbous, Last Quarter, and Waning Crescent. Out of the 5839 Mexican weather stations analyzed, 2412 met the specified data quality standards, which included a historical daily record period ranging from 30 to 51 years (1960–2011) and a maximum tolerance of 20% missing data. Correlation behavior between Moon phases and historical cumulative rainfall in Mexico was identified at two levels: general and particular. At the general level, the total historical cumulative rainfall by Moon phase was quantified. At the particular level, the correlation patterns between the Moon phases and the highest and lowest historical cumulative rainfall were identified. The results showed that the historical cumulative rainfall was highest at 17.24% during the New Moon and lowest at about 10.01% on average during the Waxing Crescent, First Quarter, and Waning Crescent phases (with 9.64% as the lowest value). During the Waxing Gibbous, Full Moon, and Waning Gibbous phases, rainfall remained at average values of approximately 13.18%. At 89.09% of the weather stations, the rainiest Moon phase was New Moon, and at 56.05%, the least rainy was Waning Crescent. In a few geographical areas, there are clearly defined patterns, which is atypical, given that in other geographical areas, the patterns are typically not so evident. This work demonstrates remarkable and strong correlation behavior between Moon phases and historical cumulative rainfall in Mexico.

1. Introduction

The relationship between the Moon and rainfall has been reported throughout history by many researchers. With time and technological advances, an increasing number of modern researchers have been able to confirm this strong relationship in an increasingly clear way. The Moon’s tidal forces affect the amount of rainfall on Earth; fifteen years of data collected by the National Aeronautics and Space Administration (NASA) and the Japan Aerospace Exploration Agency’s Tropical Rainfall Measuring Mission satellite from 1998 to 2012 showed that rain is indeed slightly lighter when the Moon is overhead (i.e., lunar transit) [1]. However, according to researchers, this change accounts for only about 1 percent of total rainfall variation; so, this change is not enough to affect other aspects of the weather or for people to notice the difference. When the Moon is overhead, its gravity causes Earth’s atmosphere to bulge toward it; so, the pressure or weight of the atmosphere on that side of the planet increases. Higher pressure increases the temperature of air parcels below. Since warmer air can hold more moisture, the same air parcels are now further from their moisture capacity. This variation in atmospheric temperature caused by the Moon has already been reported [2]. Air pressure changes on Earth are linked to the position of the Moon [3,4]; one study examined how the phases of the Moon influence air pressure on Earth. Air pressure can affect the formation of storms that bring rain. Many other scientific studies have demonstrated strong correlations between the Moon and atmospheric phenomena such as the frequency of thunderstorms, atmospheric pressure changes, hurricanes, tidal effects, cloudiness, and surface temperatures, and these have been published in leading scientific journals since the 1960s.
Precipitation events recorded by 1544 weather stations from 1900 to 1949 in the United States were examined by [5]. The researchers only accounted for major rainfall events in a twenty-four-hour period throughout the continental United States. These were represented in charts and contrasted with the lunar cycle over fifty years through statistical analysis. The researchers found a strong tendency for extreme rainfall between the third and fifth days after the New Moon and Full Moon. A similar correlation between heavy rainfall and the lunar cycle in New Zealand was reported by [6]. A 14.75-day cycle found in precipitation data (of the United States for the period 1871–1961) has also been reported, indicating a lunar connection, and that figure is exactly half of the full 29.5-day cycle of the Moon [7]. Studies like these were only the beginning of our modern rediscovery of lunar effects on the Earth’s atmosphere.
A connection between the Moon’s phases and the frequency of thunderstorms has also been identified [8]. Mae DeVoe Lethbridge (1970) analyzed thunderstorm data for twenty-eight years in the United States and contrasted the data with those days when the Moon was at maximum declination and for the days around the Full Moon. A peak of thunderstorm periodicity two days after the Full Moon and when the Moon was at its maximum north declination was found. A very high increase in thunderstorm frequency occurred when these astronomical events combined. New Moon and (smaller) Full Moon peaks in cyclone formation dates in the North Atlantic and Western Pacific have been reported [9]. Significant lunar diurnal tidal terms in the hourly rainfall values recorded in Naples (Italy) from 1950 to 1980 have been identified [10]. A correlation between the Moon phase and daily global temperatures was reported in [11], which noted that the Full Moon reflects a small amount of infrared light back to the Earth, causing warming. In this work [11], using daily temperature data from polar-orbiting satellites that cover the entire Earth, fifteen years of data were compared with the lunar cycle. Although the difference found was negligible, the authors were very confident that the data showed global temperatures to be slightly warmer during the Full Moon. Exactly how this occurs is not known, but it has been suggested that this mechanism generates very subtle heating, which may also account for the correspondence between Moon phases and precipitation, cloudiness, and storms.
Lunar nodal tide effects on the variability of sea levels, temperature, and salinity in the Faroe–Shetland Channel and the Barents Sea have been reported in a hydrographic time series that covered more than 100 years (two of the longest oceanographic time series in the world) [12]. Summer cloud nighttime data obtained between 1994 and 2007 using infrared and visible range measurements taken within the framework of the International Satellite Cloud Climatology Project (ISCCP) have been analyzed [13]. The lunar signal’s contribution to the cloud amount was extracted, and it was found that the extracted lunar signals seemed to fit the theory of lunar gravitational tides. A correlation between the circulation in the lower atmosphere and monthly lunar declination extremes has been shown [14]. Evidence of greater atmospheric tides was found, apparently strong enough to modulate atmospheric pressure, which could affect the formation of storms that bring rain in the higher latitudes when the declination is maximum. The Southern Annular Mode (SAM) is sensitive to tidal forces on a daily time scale [15]. Subsequently, the late-summer SAM can be predicted by considering tidal potential. The seasonal variability in the SAM is also reflected in sea surface temperatures. Using data from 38 moored buoys across the tropical Pacific and Atlantic, it was demonstrated that lunar semidiurnal (L2) signals in surface air temperatures, L2(T), over the ocean provide a unique diagnosis for the strength of air–sea coupling and a useful constraint on the climate model formulations of this coupling [16]. L2(T) signals have only been detected at a single land station (in results published almost a century ago by [2]). Recently, the authors of [1] demonstrated that L2 circulation variations in the troposphere modulate tropical rainfall, and a machine-learning-based rainfall prediction model with the Moon’s phases included as a feature was constructed by [17] to observe its importance level in rainfall prediction and compare its value with other influential factors. Modern technology has allowed us to confirm ancient scientific contributions about the relationship between the Moon cycle and rainfall.
In this study, the Moon’s 29.53-day synodic cycle was divided into eight equal parts, with each corresponding to a Moon phase (New Moon, Waxing Crescent, First Quarter, Waxing Gibbous, Full Moon, Waning Gibbous, Last Quarter, and Waning Crescent).
The correlation behavior between the Moon phases and rainfall is different in each geographical region of the Earth. The objectives of this research were focused on answering the following question:
  • What is the correlation behavior between Moon phases and rainfall (the highest and lowest) in the different geographical areas of Mexico?
The rainfall data quality of the daily historical records from all weather stations located throughout Mexico was evaluated. However, only weather stations that fulfilled an established data quality filter were selected. All daily historical rainfall records were classified according to the phase of the Moon during which they occurred. This research work consisted of a numerical quantification of rainfall by Moon phase; there was no data sampling in this study. The totality of a historical daily rainfall record spanning 30 to 51 years (1960–2011) from 2412 out of 5839 weather stations was analyzed.
This research work was structured into two investigative stages. In the first stage, the general stage, the objective was to identify the correlation behavior between Moon phases and rainfall in Mexico. The total historical cumulative rainfall by Moon phase in Mexico was quantified, and correlation patterns were found. In the second stage, the particular stage, the objective was to identify the correlation behavior between Moon phases and the highest and lowest rainfall in different geographical areas of Mexico. The maximum and minimum historical cumulative rainfall differences between the Moon phases at each weather station were measured, allowing us to identify the geographical locations of Mexican weather stations where Moon phases corresponded to the highest and lowest historical cumulative rainfall. The correlation patterns between the Moon phases and the highest and lowest historical cumulative rainfalls within Mexico were identified. The results are shown in georeferenced maps, tables, and charts.

2. Materials and Methods

2.1. Data Structure

All daily historical records of rainfall were classified according to the phase of the Moon (Figure 1) during which they occurred.
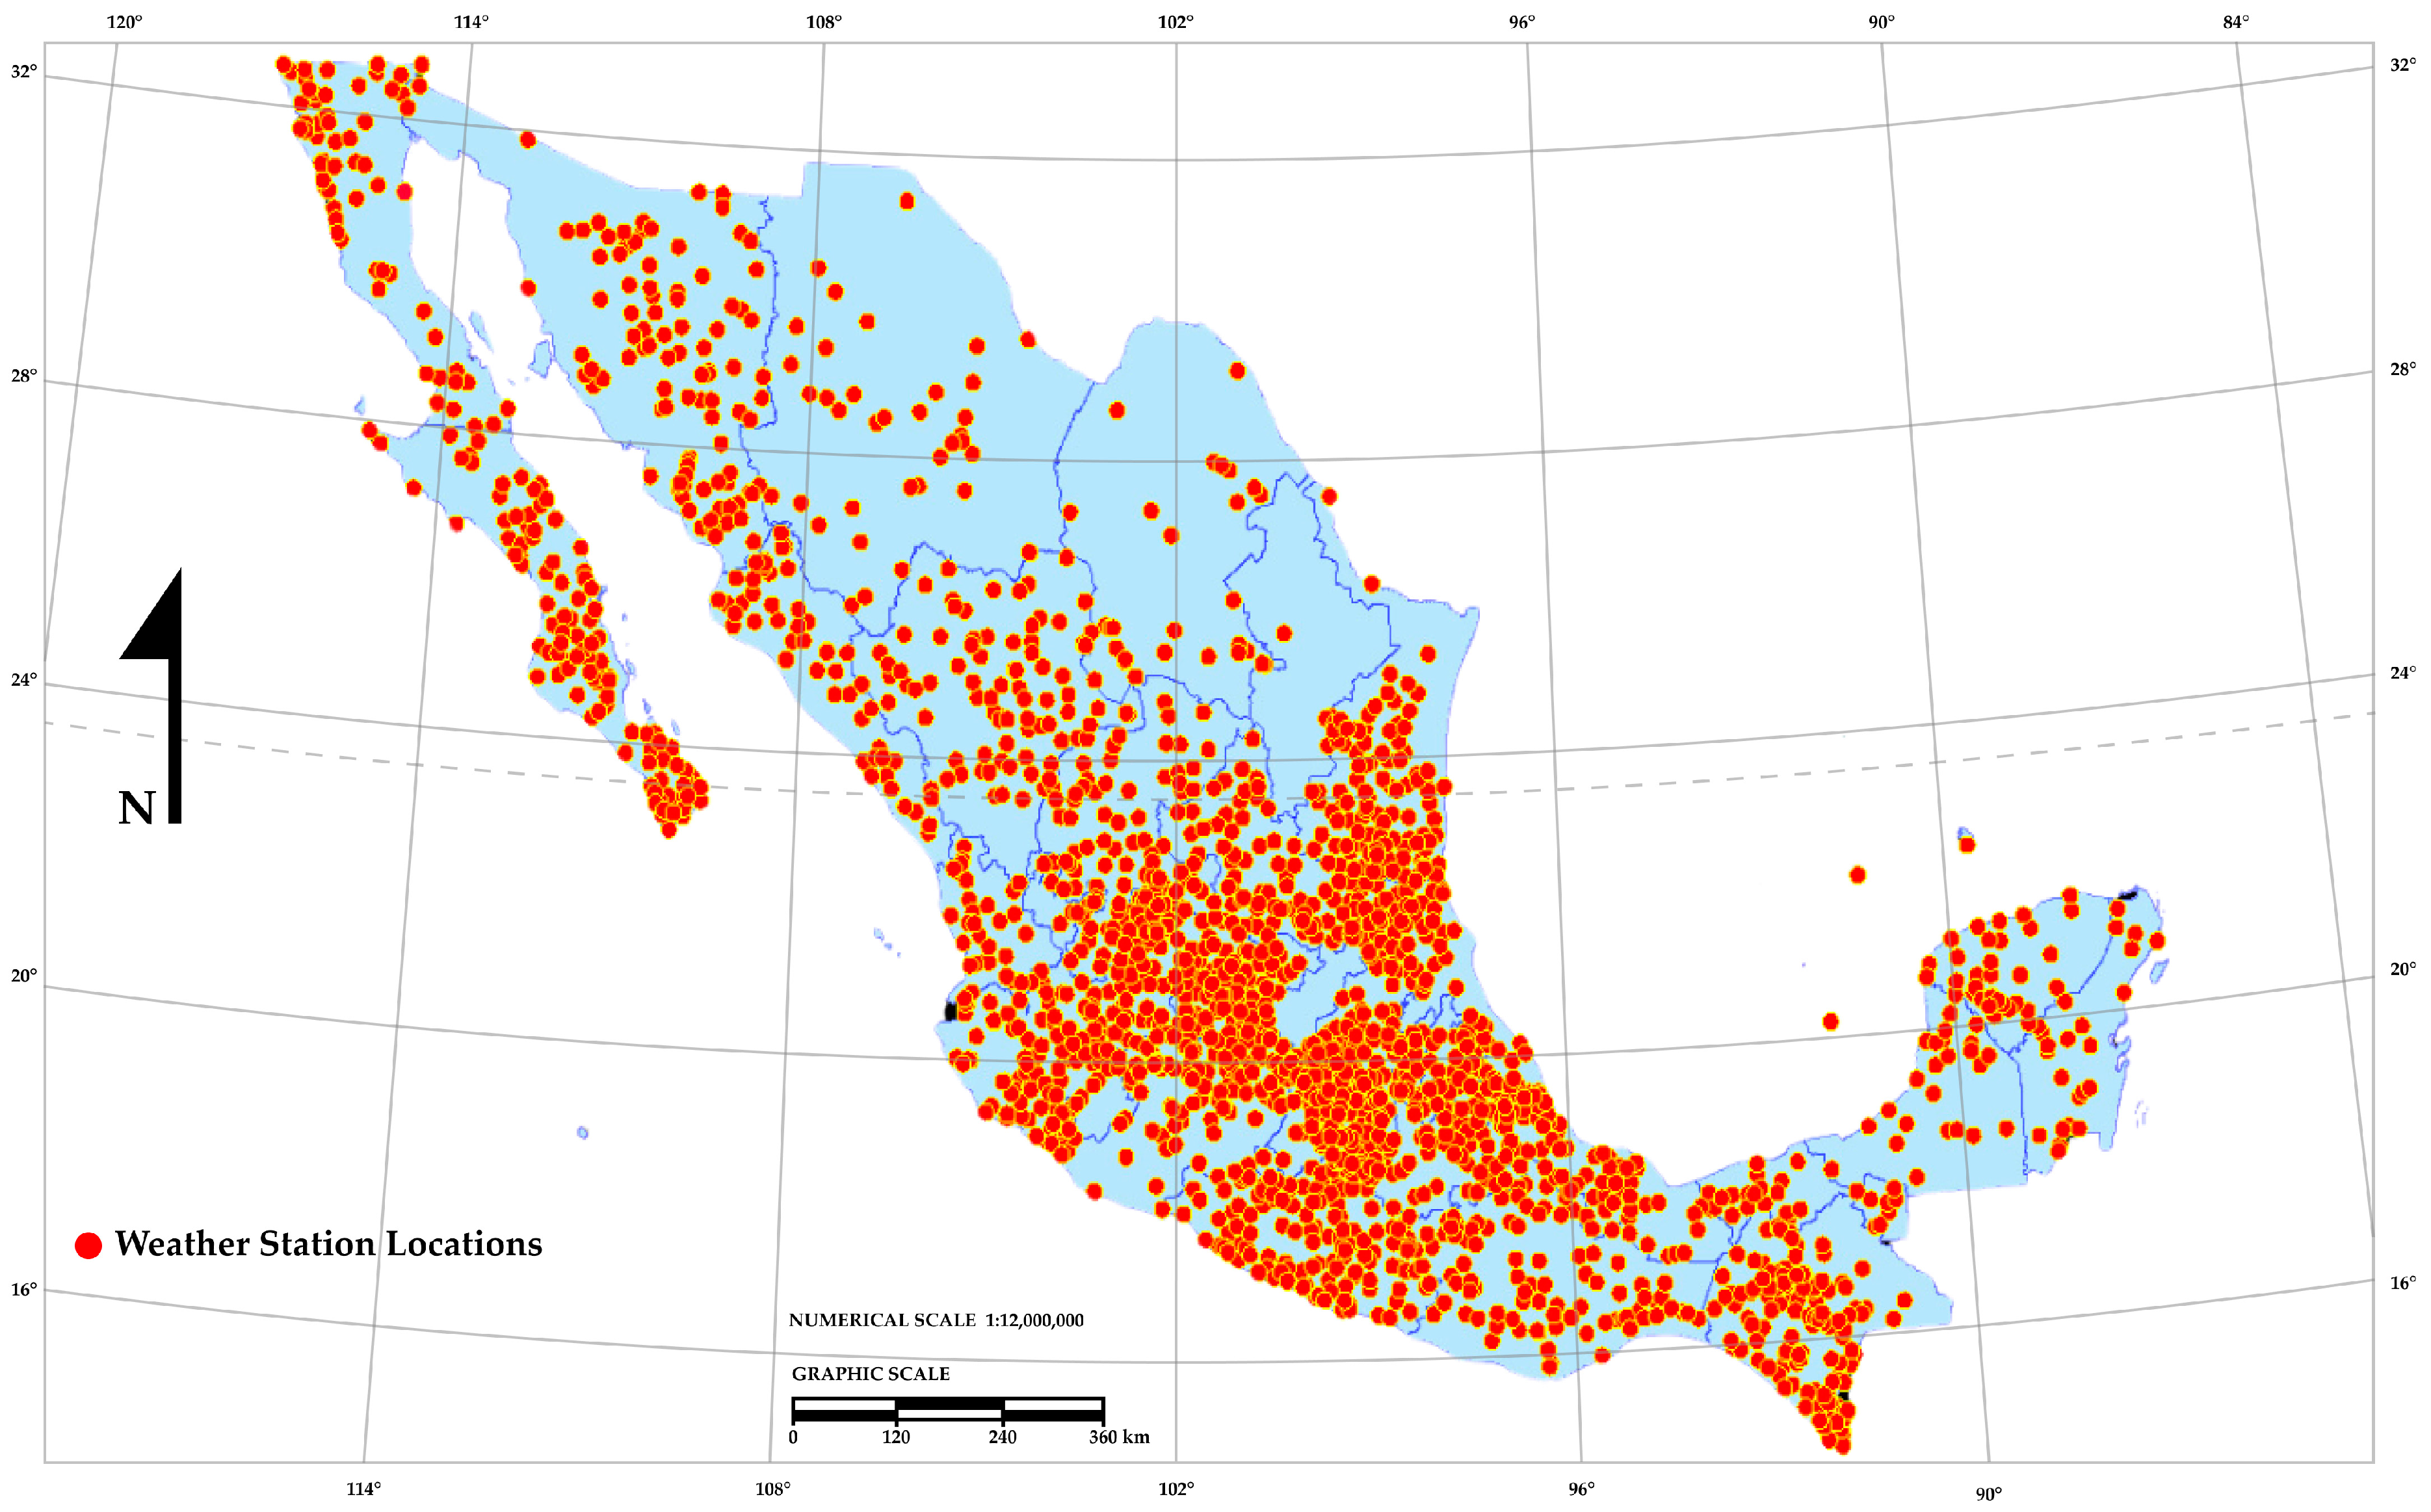
In total, 5839 weather stations located throughout Mexico were analyzed, selecting a study population of 2412 weather stations (Figure 2) that met the data quality standards: a historical daily record period between 30 and 51 years (1960–2011) and a maximum limit of 20% of information missing. The totality of the daily rainfall historical records for each weather station was analyzed; there was no data sampling in this study.

2.2. First Stage of the Investigation: Correlation Behavior between Moon Phases and Historical Cumulative Rainfall in Mexico

To identify correlation behavior between the Moon phases and historical cumulative rainfall in Mexico in the first stage of the investigation, the total historical cumulative rainfall by Moon phase in Mexican territory ( δ ) was quantified by Equation (2); the daily historical rainfall records were classified according to the phase of the Moon during which they occurred. Equation (1) was used to calculate the total historical cumulative rainfall by Moon phase at a weather station  ( γ ) for each weather station in Mexico.
γ = i = 1 n V i ( i f ( Current   Moon   Phase = = t r u e ) )
where:
  • γ = total historical cumulative rainfall by Moon phase at a weather station;
  • V = daily rainfall record classified according to the phase of the Moon.
δ = i = 1 n W i [ γ ]
where:
  • δ = total historical cumulative rainfall by Moon phase in Mexican territory.
  • W = current weather station.
  • γ = total historical cumulative rainfall by Moon phase at a weather station (Equation (1)).

2.3. Second Stage of the Investigation: Correlation Behavior between Moon Phases and the Highest and Lowest Historical Cumulative Rainfall in the Different Geographical Areas of Mexico

To identify correlation behavior between Moon phases and the highest and lowest historical cumulative rainfall in the different geographical areas of Mexico in the second stage of the investigation, two indices were developed: the highest historical cumulative rainfall by Moon phase index ( ω M a x ) , which is defined in Equation (5) as the average percentage difference in historical cumulative rainfall for the Moon phase with the highest historical cumulative rainfall with respect to the other Moon phases at a weather station, and the lowest historical cumulative rainfall by moon phase index ( ω M i n ) , which is defined in Equation (6) as the average percentage difference in historical cumulative rainfall for the Moon phase with the lowest historical cumulative rainfall with respect to the other Moon phases at a weather station. These indices measure the maximum and minimum historical cumulative rainfall difference between the Moon phases in each weather station and identify the geographical locations of Mexican weather stations where the Moon phases have the highest and lowest historical cumulative rainfall. To calculate both indices for each of the weather stations, it is necessary to identify the Moon phases with the highest and lowest historical cumulative rainfall percentages at the weather station of study. For this, the total historical cumulative rainfall of a weather station ( β ) is first calculated with Equation (3); then, with the provided value, the cumulative rainfall percentage by Moon phase at a weather station ( α ) for each Moon phase is obtained with Equation (4). These values will allow us to identify the highest cumulative rainfall percentage by Moon phase at a weather station ( α M a x ) and the lowest cumulative rainfall percentage by Moon phase at a weather station ( α M i n ).
β = i = 1 n γ i
where:
  • β = total historical cumulative rainfall of a weather station;
  • γ = total historical cumulative rainfall by Moon phase at a weather station.
α = γ β 100
where:
  • α = cumulative rainfall percentage by Moon phase at a weather station;
  • γ = total historical cumulative rainfall by Moon phase at a weather station;
  • β = total historical cumulative rainfall of the weather station.
ω M a x = i = 1 n α M a x α i n 1
where:
  • ω M a x  = highest historical cumulative rainfall by Moon phase index (average percentage difference of historical cumulative rainfall of the Moon phase with the highest historical cumulative rainfall with respect to the other Moon phases at a weather station);
  • α M a x = highest cumulative rainfall percentage by Moon phase at a weather station;
  • α = cumulative rainfall percentage by Moon phase at a weather station.
ω M i n = i = 1 n α i α M i n n 1
where:
  • ω M i n = lowest historical cumulative rainfall by Moon phase index (average percentage difference of historical cumulative rainfall of the Moon phase with the lowest historical cumulative rainfall with respect to the other Moon phases at a weather station);
  • α M i n = lowest cumulative rainfall percentage by Moon phase at a weather station;
  • α = cumulative rainfall percentage by Moon phase at a weather station.

2.4. Example of Applying the Methodology with Weather Station 03123

To illustrate the methodology used in the two investigation stages, an example with weather station 03123 is shown in Table 1, Table 2 and Table 3.
  • Application Example of the Methodology in the First Stage of the Investigation
Table 1. Calculation example for α with weather station 03123.
Moon Phaseγ (mm)β (mm)α (%)
New Moon333.81196.827.89
Waxing Crescent50.01196.84.17
First Quarter81.61196.86.81
Waxing Gibbous148.81196.812.43
Full Moon144.01196.812.03
Waning Gibbous166.61196.813.92
Last Quarter220.51196.818.42
Waning Crescent51.51196.84.30
Note. The highest cumulative rainfall percentage by Moon phase at a weather station ( α M a x )  is New Moon with 27.89%, and the lowest cumulative rainfall percentage by Moon phase at a weather station ( α M i n ) is Waxing Crescent with 4.17%.
  • Application Example of the Methodology in the Second Stage of the Investigation
Table 2. Calculation example for ω M a x with weather station 03123.
ω M a x = i = 1 n α M a x α i n 1
α M a x (%) α i (%) α M a x α i (%)
27.894.1723.72
27.896.8121.08
27.8912.4315.46
27.8912.0315.86
27.8913.9213.97
27.8918.429.47
27.894.3023.59
i = 1 n α M a x α i 123.15
ω M a x = 123.15 7 = 17.59 %
Note. ω M a x is defined in Equation (5) as the average percentage difference of cumulative rainfall of the Moon phase with the highest cumulative rainfall with respect to the other Moon phases at the weather station.
Table 3. Calculation example for ω M i n with weather station 03123.
ω M i n = i = 1 n α i α M i n n 1
α i (%) α M i n (%) α i α M i n (%)
27.894.1723.72
6.814.172.64
12.434.178.26
12.034.177.86
13.924.179.75
18.424.1714.25
4.304.170.13
i = 1 n α i α M i n 66.61
ω M i n = 66.61 7 = 9.51 %
Note. ω M i n is defined in Equation (6) as the average percentage difference of cumulative rainfall of the Moon phase with the lowest cumulative rainfall with respect to the other Moon phases at the weather station.

2.5. Interpretation of the Results Obtained from the Application Example of the Methodology to Climatological Station 03123

Starting with the first stage of the investigation, we will illustrate how the corresponding objective was accomplished by quantifying δ using Equation (2). Firstly, let us classify the daily historical records of rainfall according to the phase of the Moon during which they occurred at weather station 03123. By using Equation (1) to calculate γ to obtain the chart in Figure 3, we can see the historical cumulative rainfall classified according to the phase of the Moon during which it occurred.
This same procedure was performed with each of the 2412 weather stations included in the study. Finally, we determined the sum of all these Moon phase rainfall values from each weather station by using Equation (2), thus obtaining the correlation behavior between Moon phases and rainfall in Mexico on a general level.
Next, we will illustrate how we accomplished the second-stage objective—identifying correlation behavior between Moon phases and the highest and lowest cumulative rainfall in the different geographical areas of Mexico—by measuring the maximum and minimum rainfall difference between the Moon phases at the weather stations. To identify the geographical locations of the weather stations, we applied the following indices: ω M a x  and  ω M i n (Equations (5) and (6)). Let us use weather station 03123 (Figure 3) as an example again. Firstly, we calculated β with Equation (3): β = 333.8 + 50.0 + 81.6 + 148.8 + 144.0 + 166.6 + 220.5 + 51.5 = 1196.8   m m .  With this value, we calculated  α using Equation (4) for the first Moon phase (New Moon). Thus, we obtained the following values: α ( N e w M o o n ) = ( 333.8 / 1196.8 ) 100 = 27.89 % . All terms are provided in Table 1, showing that α M a x  is the New Moon phase, with 27.89%, and α M i n is the Waxing Crescent phase, with 4.17%. Considering these values, let us apply Equation (5) to obtain the value of ω M a x  (Table 2) and, finally, apply Equation (6) to obtain the value of ω M i n (Table 3). Both indices constitute a metric that indicates the maximum or minimum cumulative rainfall difference between the Moon phases at the weather station of study. This same procedure was performed with each one of the 2412 weather stations.

2.6. Data Source and Software

We processed the historical daily rainfall record data of the 5839 weather stations by programming a desktop application using the JAVA programming language. The cartographic information was processed through the GEOTOOLS libraries, and the charts were developed using the JFREECHART libraries. The data registered by the Mexican weather station network are part of the public domain and are available to download from the internet (https://smn.conagua.gob.mx/es/observando-el-tiempo/estaciones-meteorologicas-automaticas-ema-s, accessed on 18 December 2018) from the National Water Commission (CONAGUA, its acronym in Spanish).

3. Results

3.1. Correlation Behavior between Moon Phases and Historical Cumulative Rainfall in Mexico

In the first stage of the investigation, δ was quantified using Equation (2) to fulfill the objective. The results are shown in Figure 4 and Table 4, corresponding to 2412 weather stations that met the established data quality standard filter.
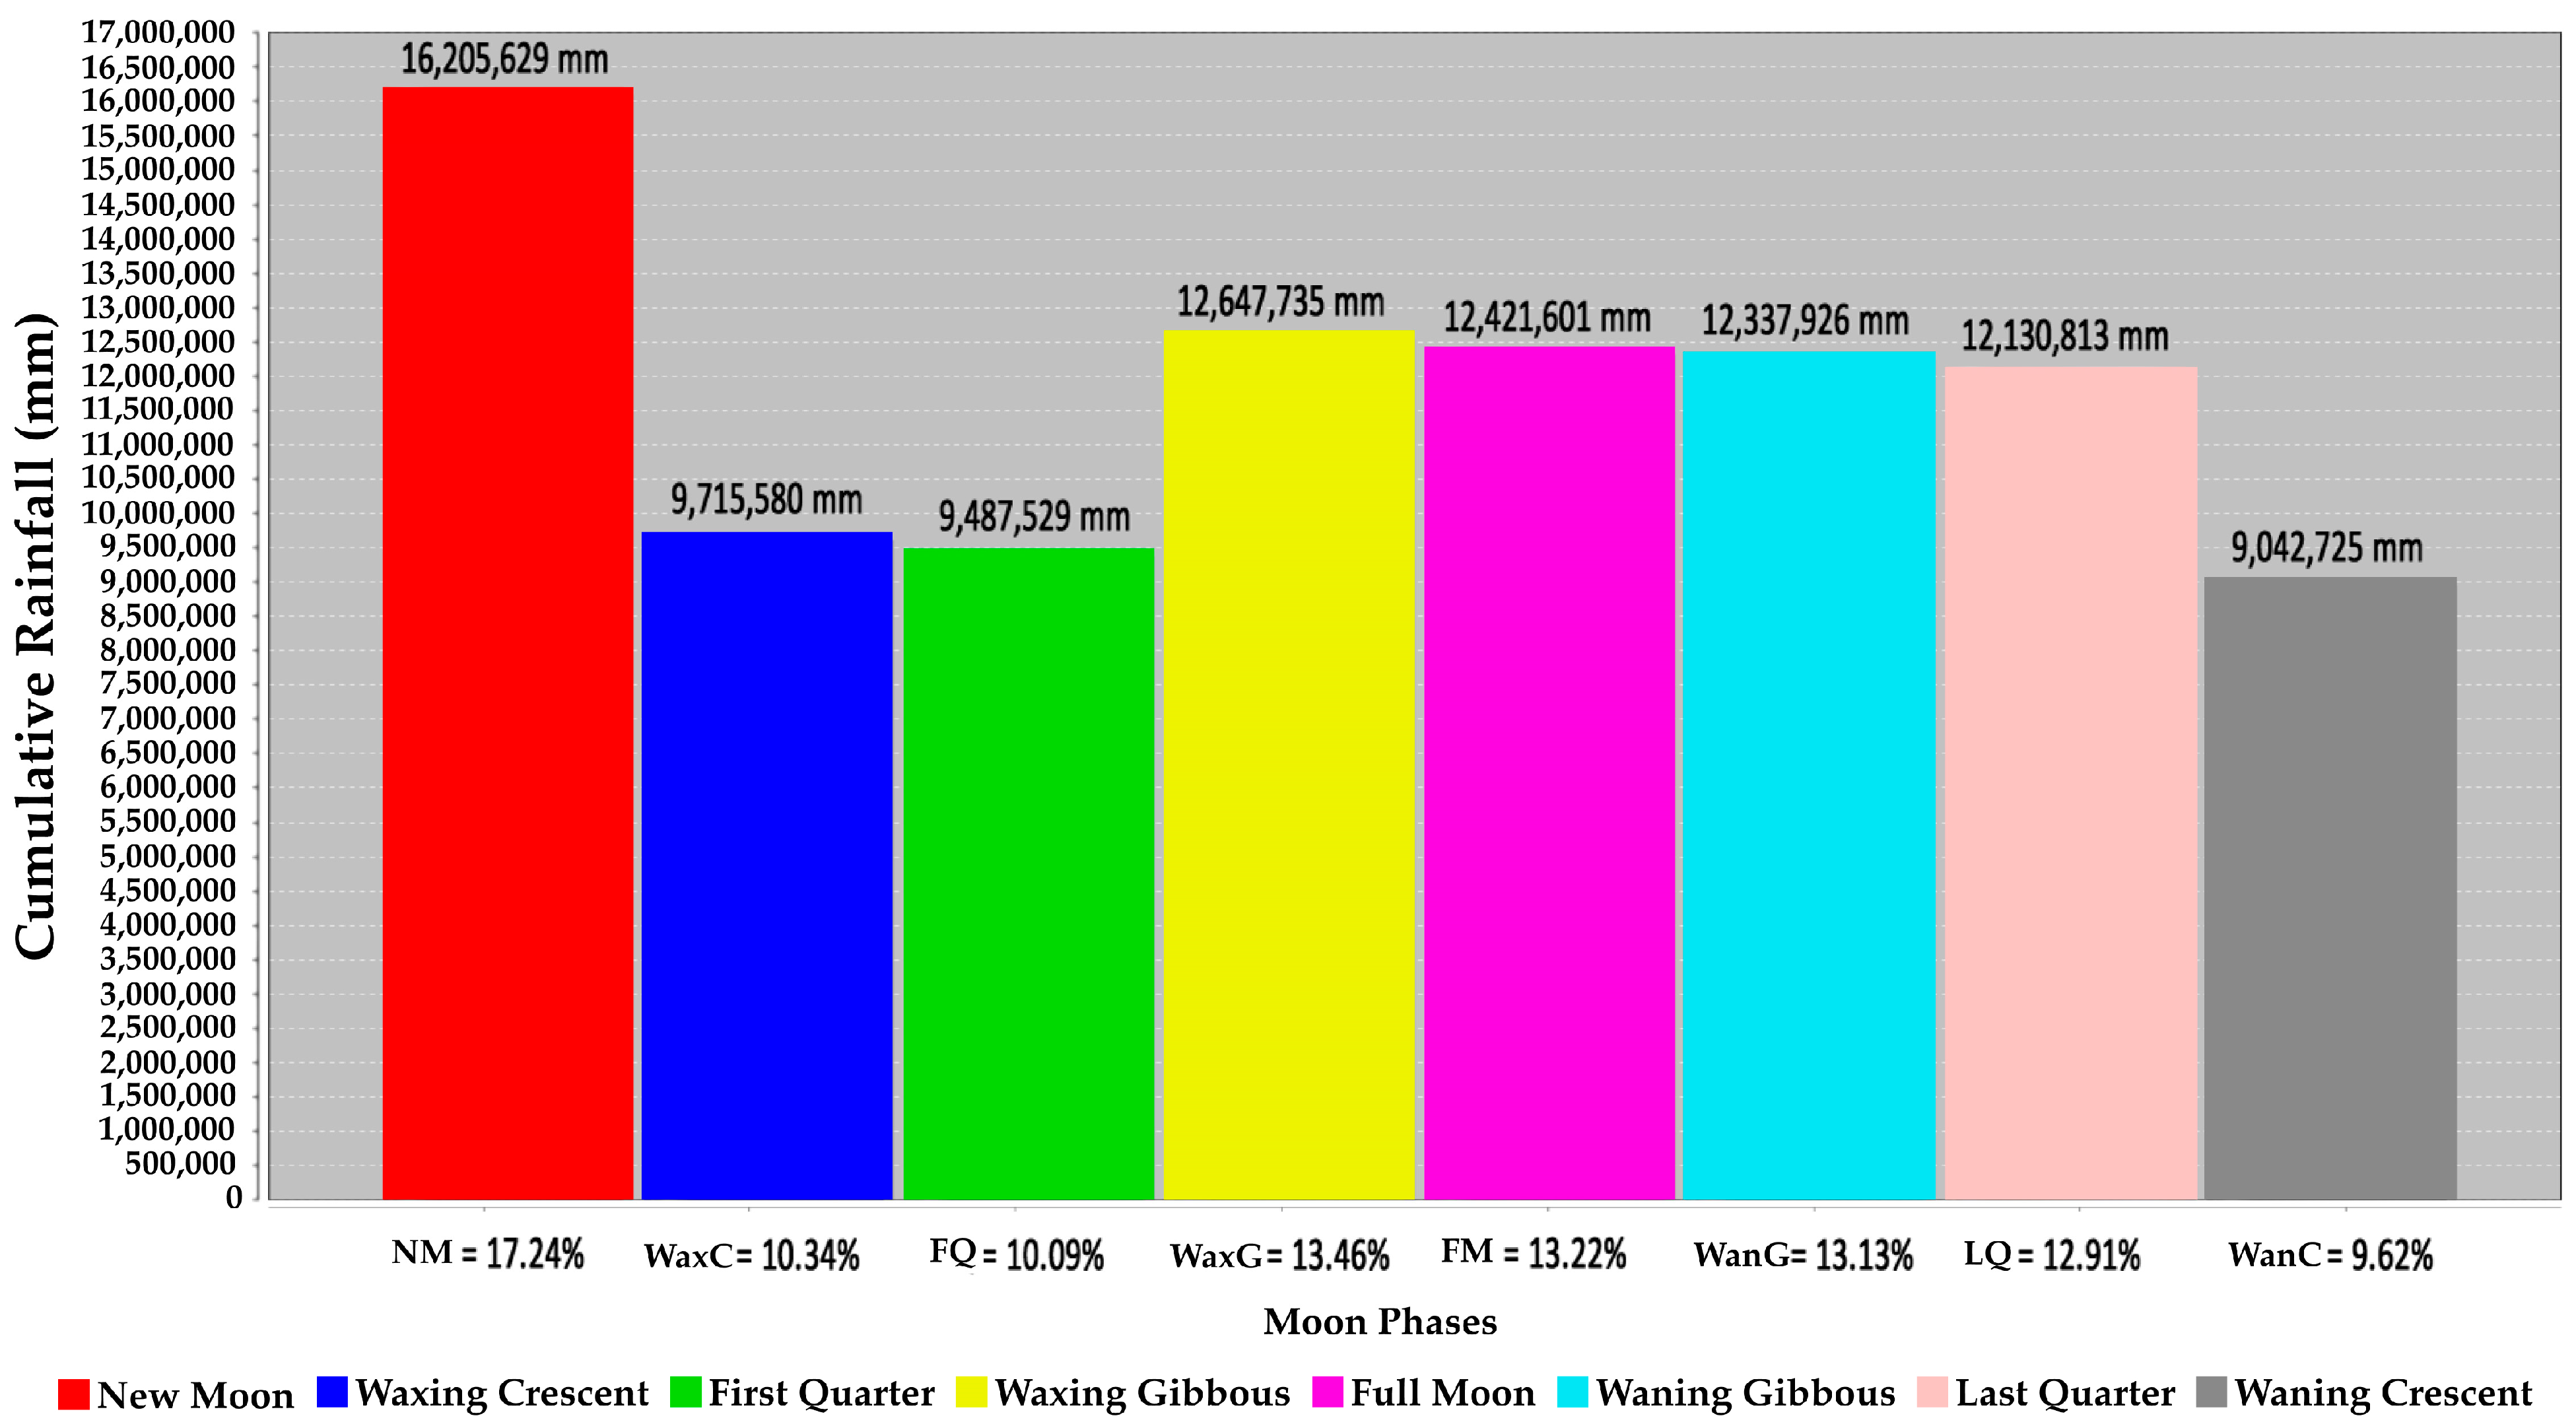
The results (Figure 4) show that the correlation behavior between Moon phases and historical cumulative rainfall in most of Mexico was as follows: the New Moon phase stands out as having the highest historical cumulative rainfall by Moon phase with 16,205,629 mm or 17.24%, and the Waning Crescent phase stands out as having the least cumulative historical rainfall by Moon phase with 9,042,725 mm, or 9.62%. The rainfall behavior tendencies for each Moon phase show that the rainiest Moon phase is the New Moon at the beginning of the cycle, with 17.24%, whereas the amount of rainfall descends drastically for Waxing Crescent to 10.34%; it then continues slightly downward in the First Quarter with 10.09%. Next, the amount increases to 13.46% during the Waxing Gibbous phase, and during the Full Moon, the trend remains in a slightly downward direction at 13.22%, continuing to decline slightly during the Last Quarter to 12.91%, finally decreasing considerably and reaching the minimum during the Waning Crescent phase with 9.62% of the historical cumulative rainfall. A natural classification for the Moon phases can be observed in their correlation behavior with historical cumulative rainfall in Mexico; the Moon Phases can be grouped into three proportion types based on historical cumulative rainfall (Table 4): maximum, minimum, and medium.
The maximum is during the New Moon (with 17.24%). The medium values are the Waxing Gibbous, Full Moon, and Waning Gibbous phases (with 13.18% on average). The minimums are the Waxing Crescent, First Quarter, and Waning Crescent phases (with 10.01% on average), with the latter having the least historical accumulated rainfall by Moon phase, with 9.62%.

3.2. Correlation Behavior between Moon Phases and the Highest and Lowest Historical Cumulative Rainfall in the Different Geographical Areas of Mexico

In the second stage of the investigation, the maximum and minimum rainfall differences between the Moon phases at the weather stations were measured to fulfill the objective, and the geographical locations of 2412 weather stations were identified by implementing the indices ω M a x  and  ω M i n (Equations (5) and (6)) to identify their historical rainfall records. To show all the results in a general and integral way, ω M a x and ω M i n were georeferenced in maps (Figure 5 and Figure 6); the results are shown in Table 5, Table 6 and Table 7 and Figure 7 and Figure 8.

3.2.1. Highest Historical Cumulative Rainfall by Moon Phase Index ω M a x in Mexico

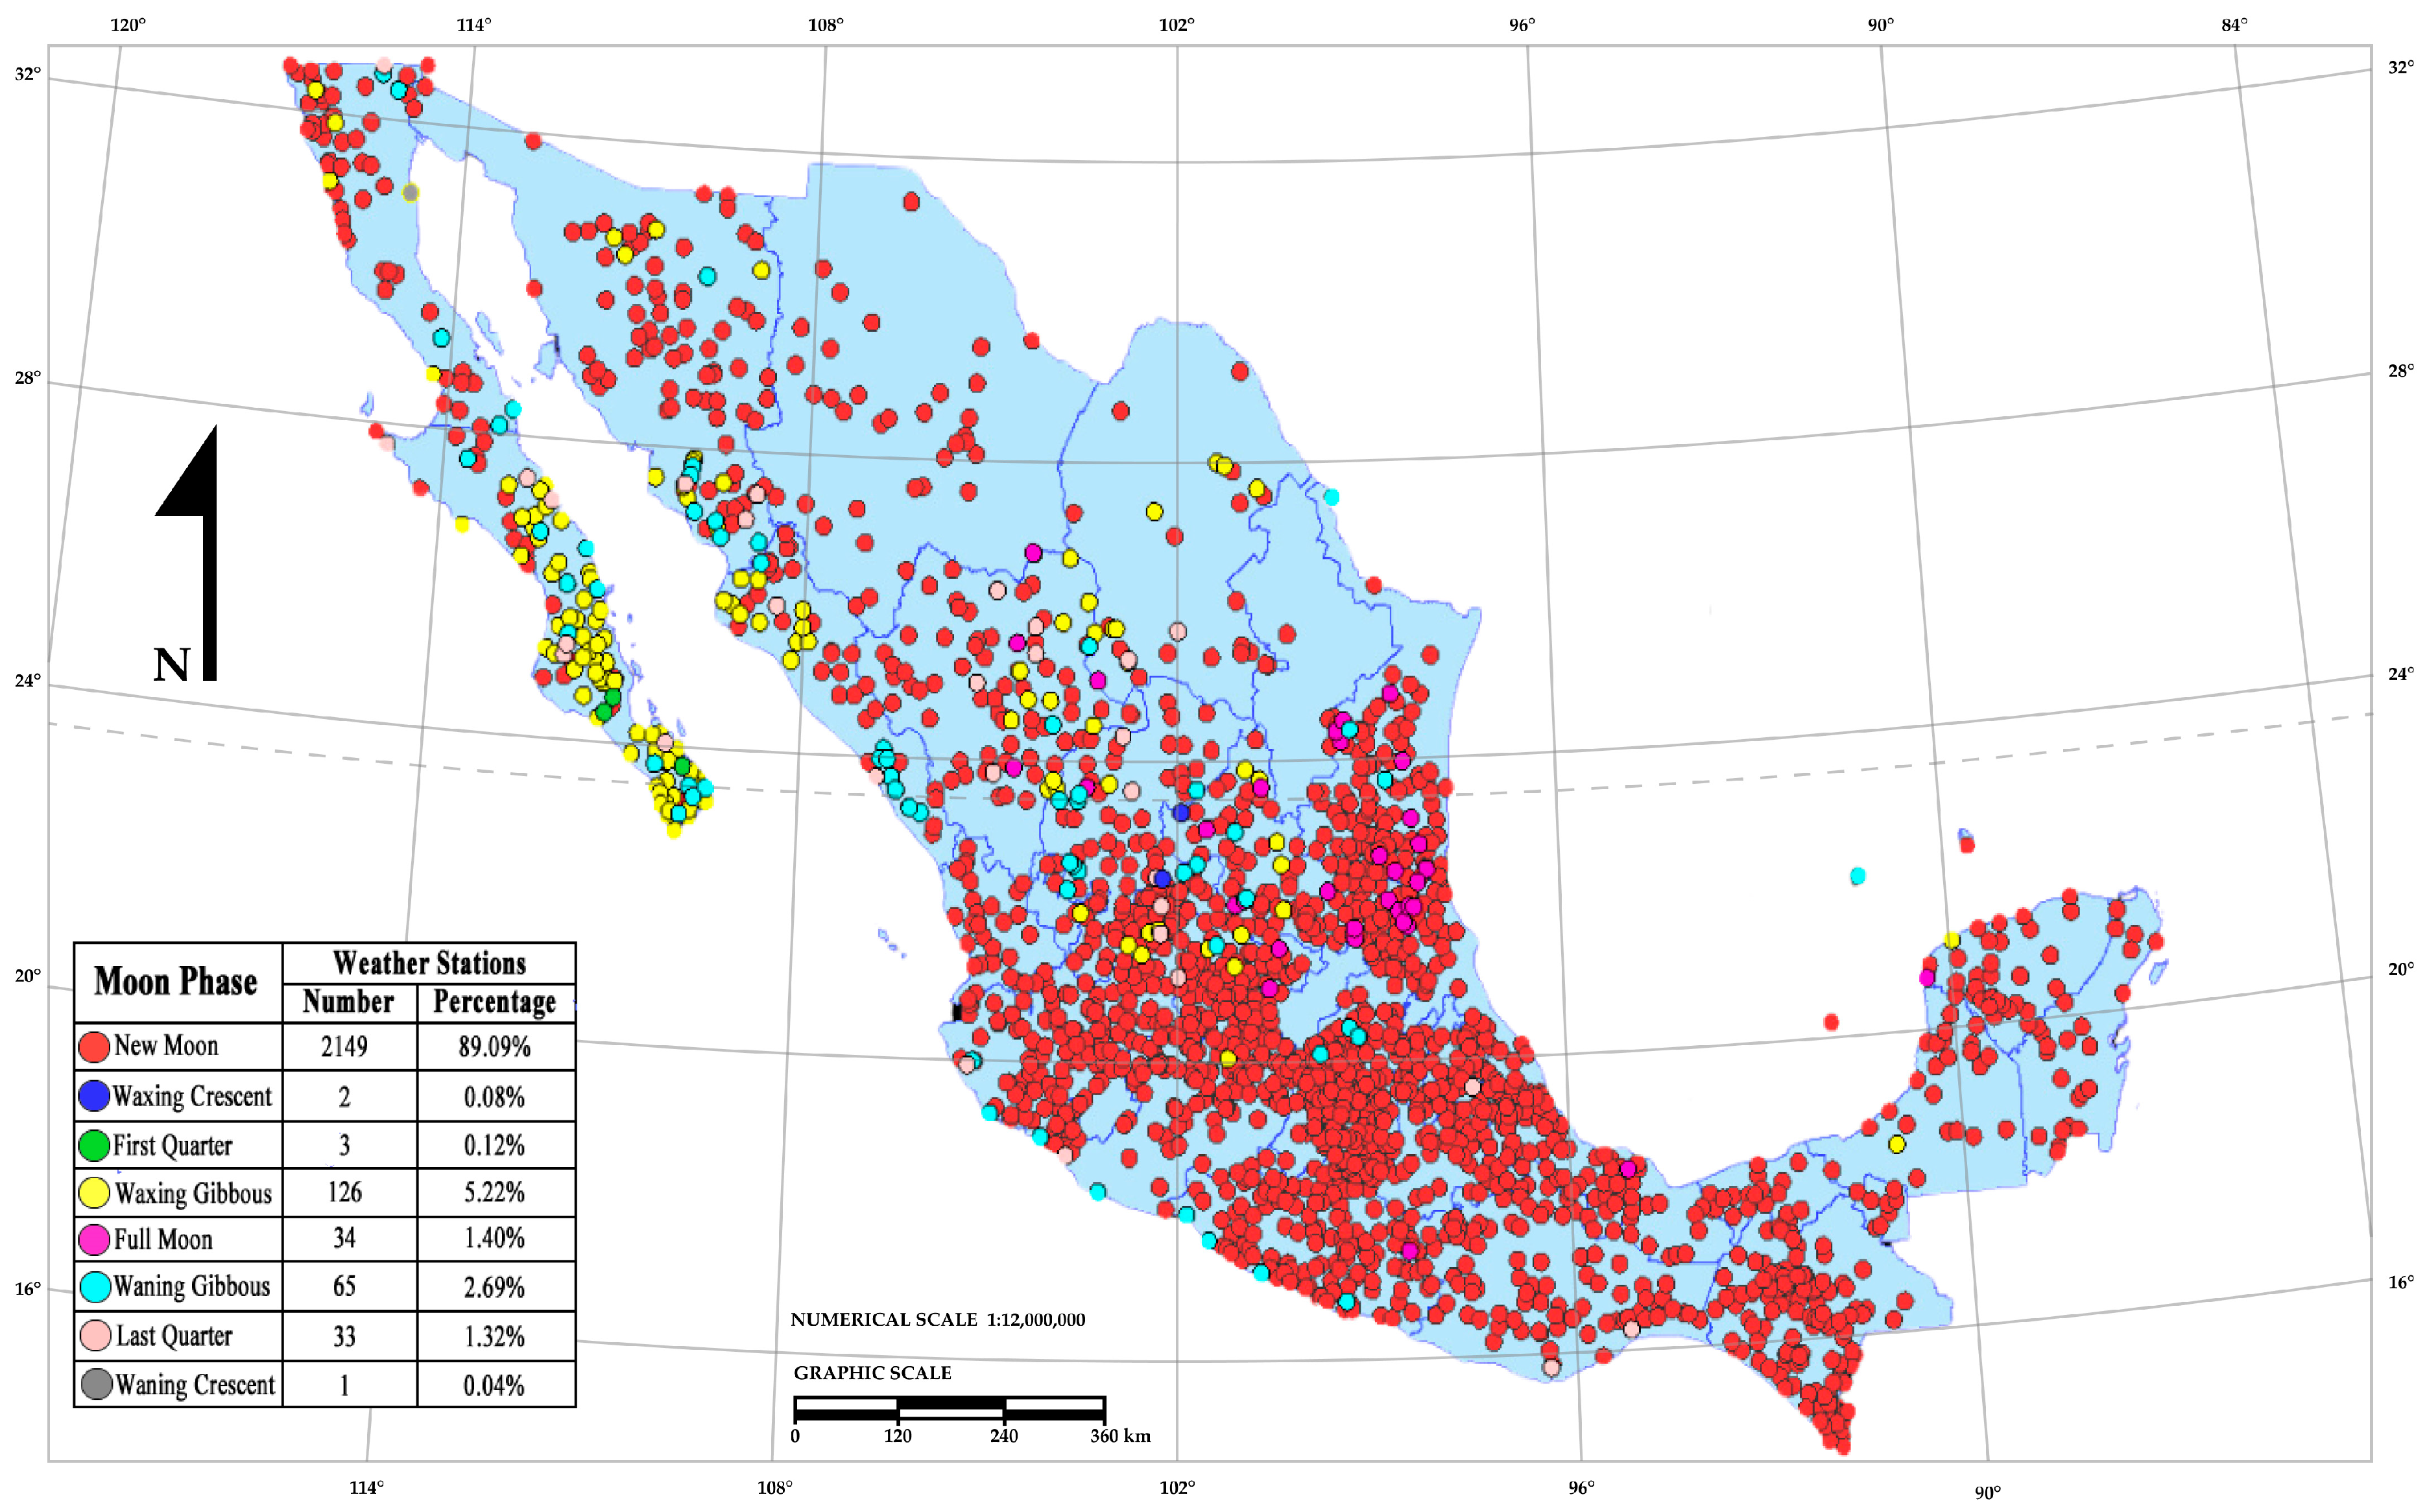
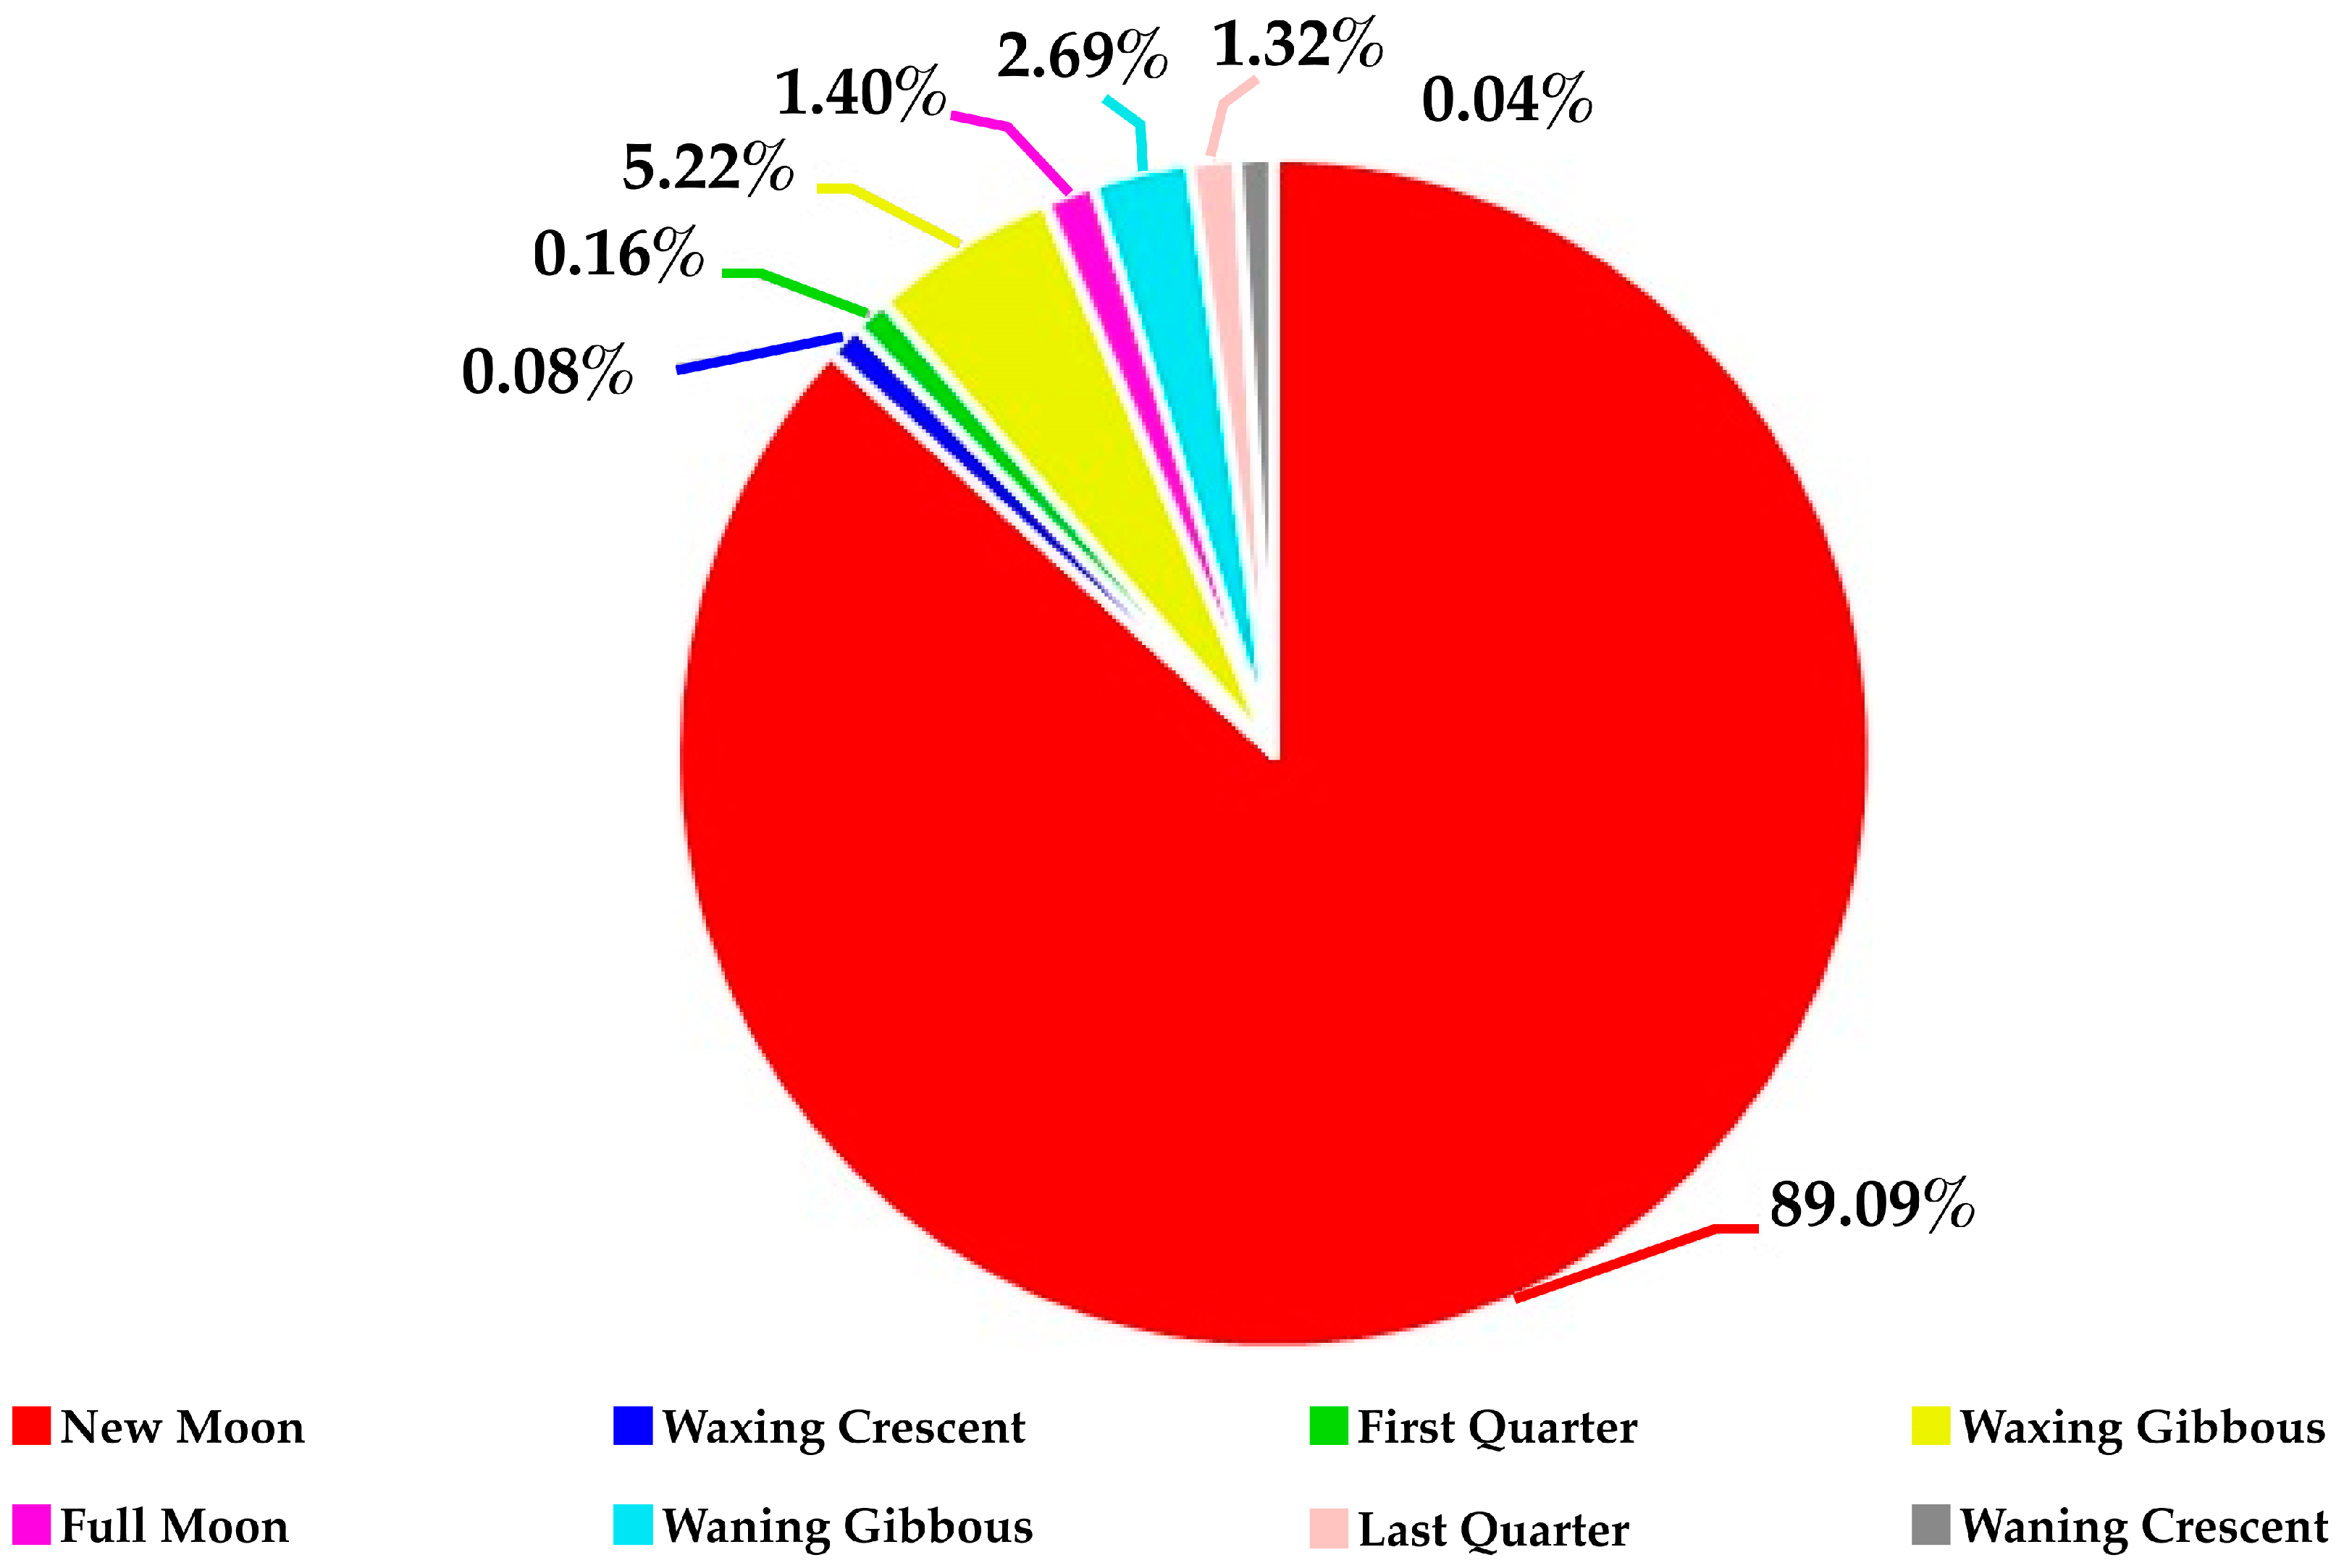
The results (Figure 5 and Figure 7, Table 5) for the 2412 weather stations evaluated by ω M a x indicate that the New Moon stands out as the dominant phase with the highest historical cumulative rainfall with 2149 (89.09%) of the weather stations in Mexican territory (Figure 5 and Figure 7) and an  ω M a x  interval between 1.809% and 17.59% (an average interval of 5.521%) (Table 5).
At 89.09% of Mexican weather stations, it rains more on average during the New Moon at an interval between 1.809% and 17.59% (an average interval of 5.521%) compared with the other Moon phases. The New Moon phase shows a homogeneous and dominant distribution, with the highest historical rainfall in most of Mexico, except for the state of Baja California Sur, where the Waxing Gibbous phase has the highest historical cumulative rainfall, together with its appearances in the central and northern parts of Mexico, for a total of 126 (5.22%) weather stations. In a very minimal proportion, albeit geographically significantly, there were minimal Waning Gibbous manifestations at 65 (2.67%) weather stations and Last Quarter manifestations at 33 (1.32%) weather stations. This shows that these Moon phases have the highest historical cumulative rainfall principally in the northcentral areas of Mexico and in geographical areas aligned to beaches in the coastal states of the Pacific Ocean, such as Oaxaca, Guerrero, Michoacán, Colima, Jalisco, Sinaloa, the southern part of Sonora, Baja California, and Baja California Sur. In a very minimal proportion of 34 (1.40%) weather stations, albeit with a maximum concentration, the Full Moon phase had the highest historical cumulative rainfall at the border intersections of the Tamaulipas, San Luis Potosi, and Veracruz states.

3.2.2. Lowest Historical Cumulative Rainfall by Moon Phase Index ( ω M i n ) in Mexico

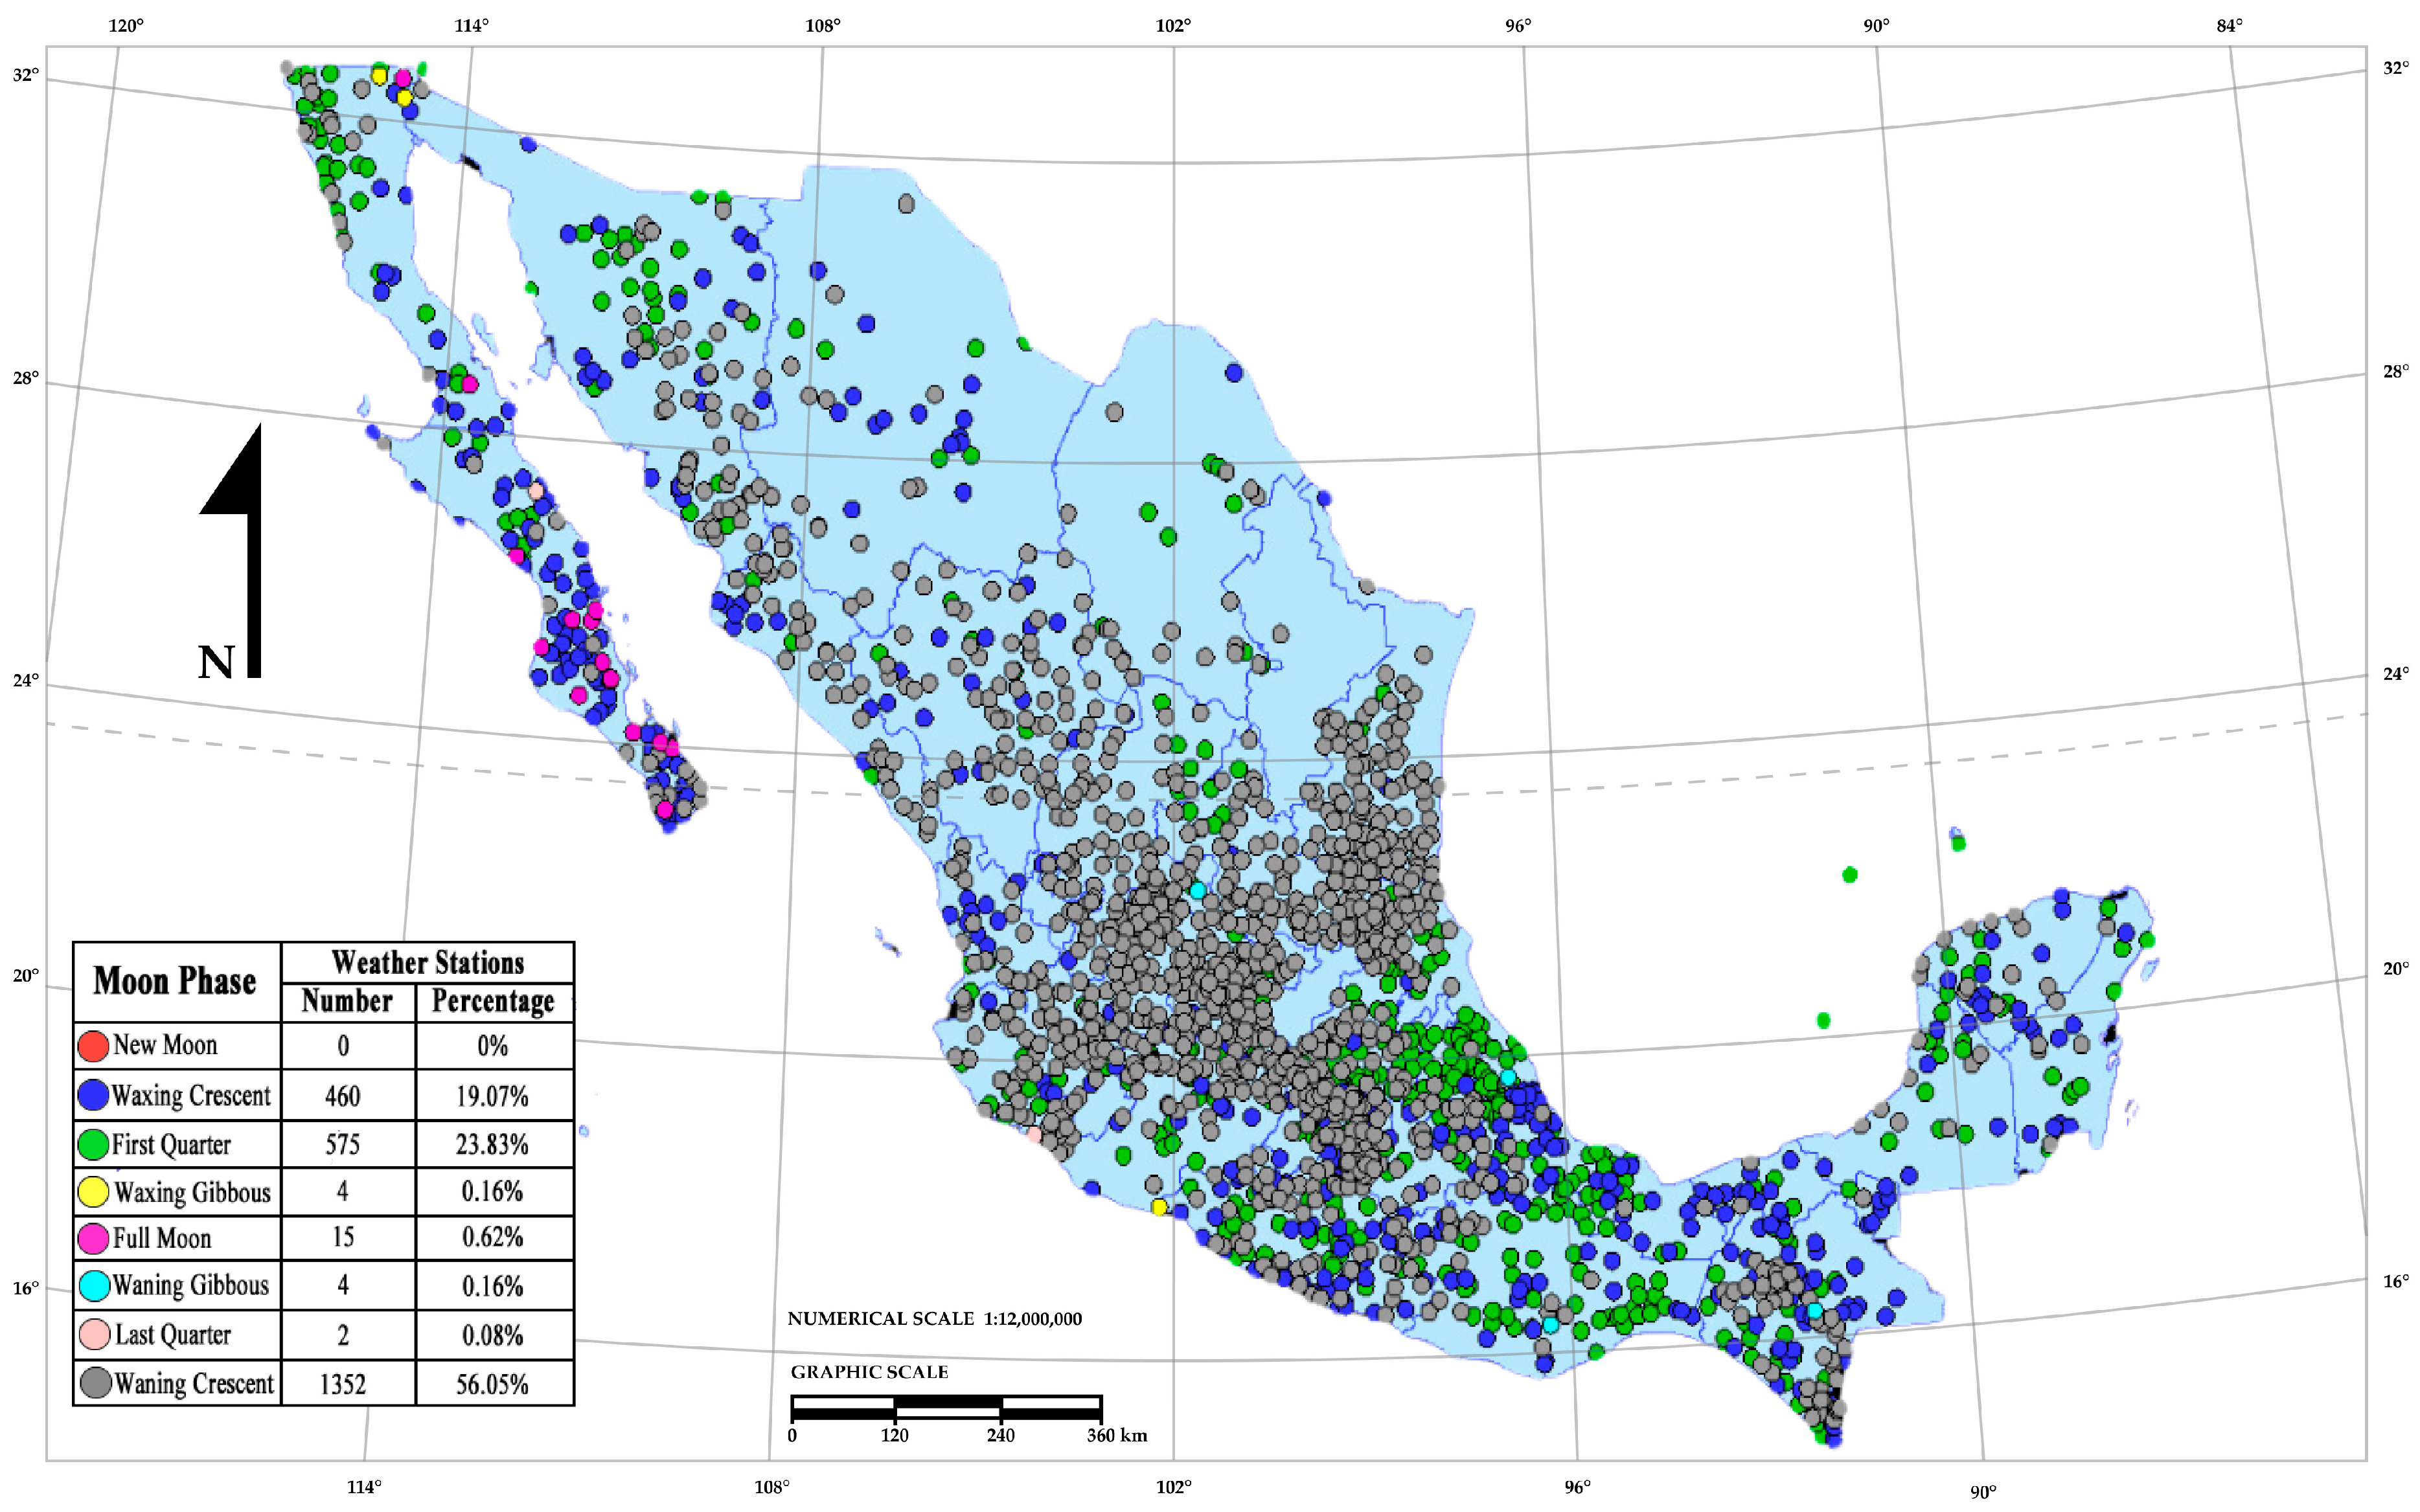
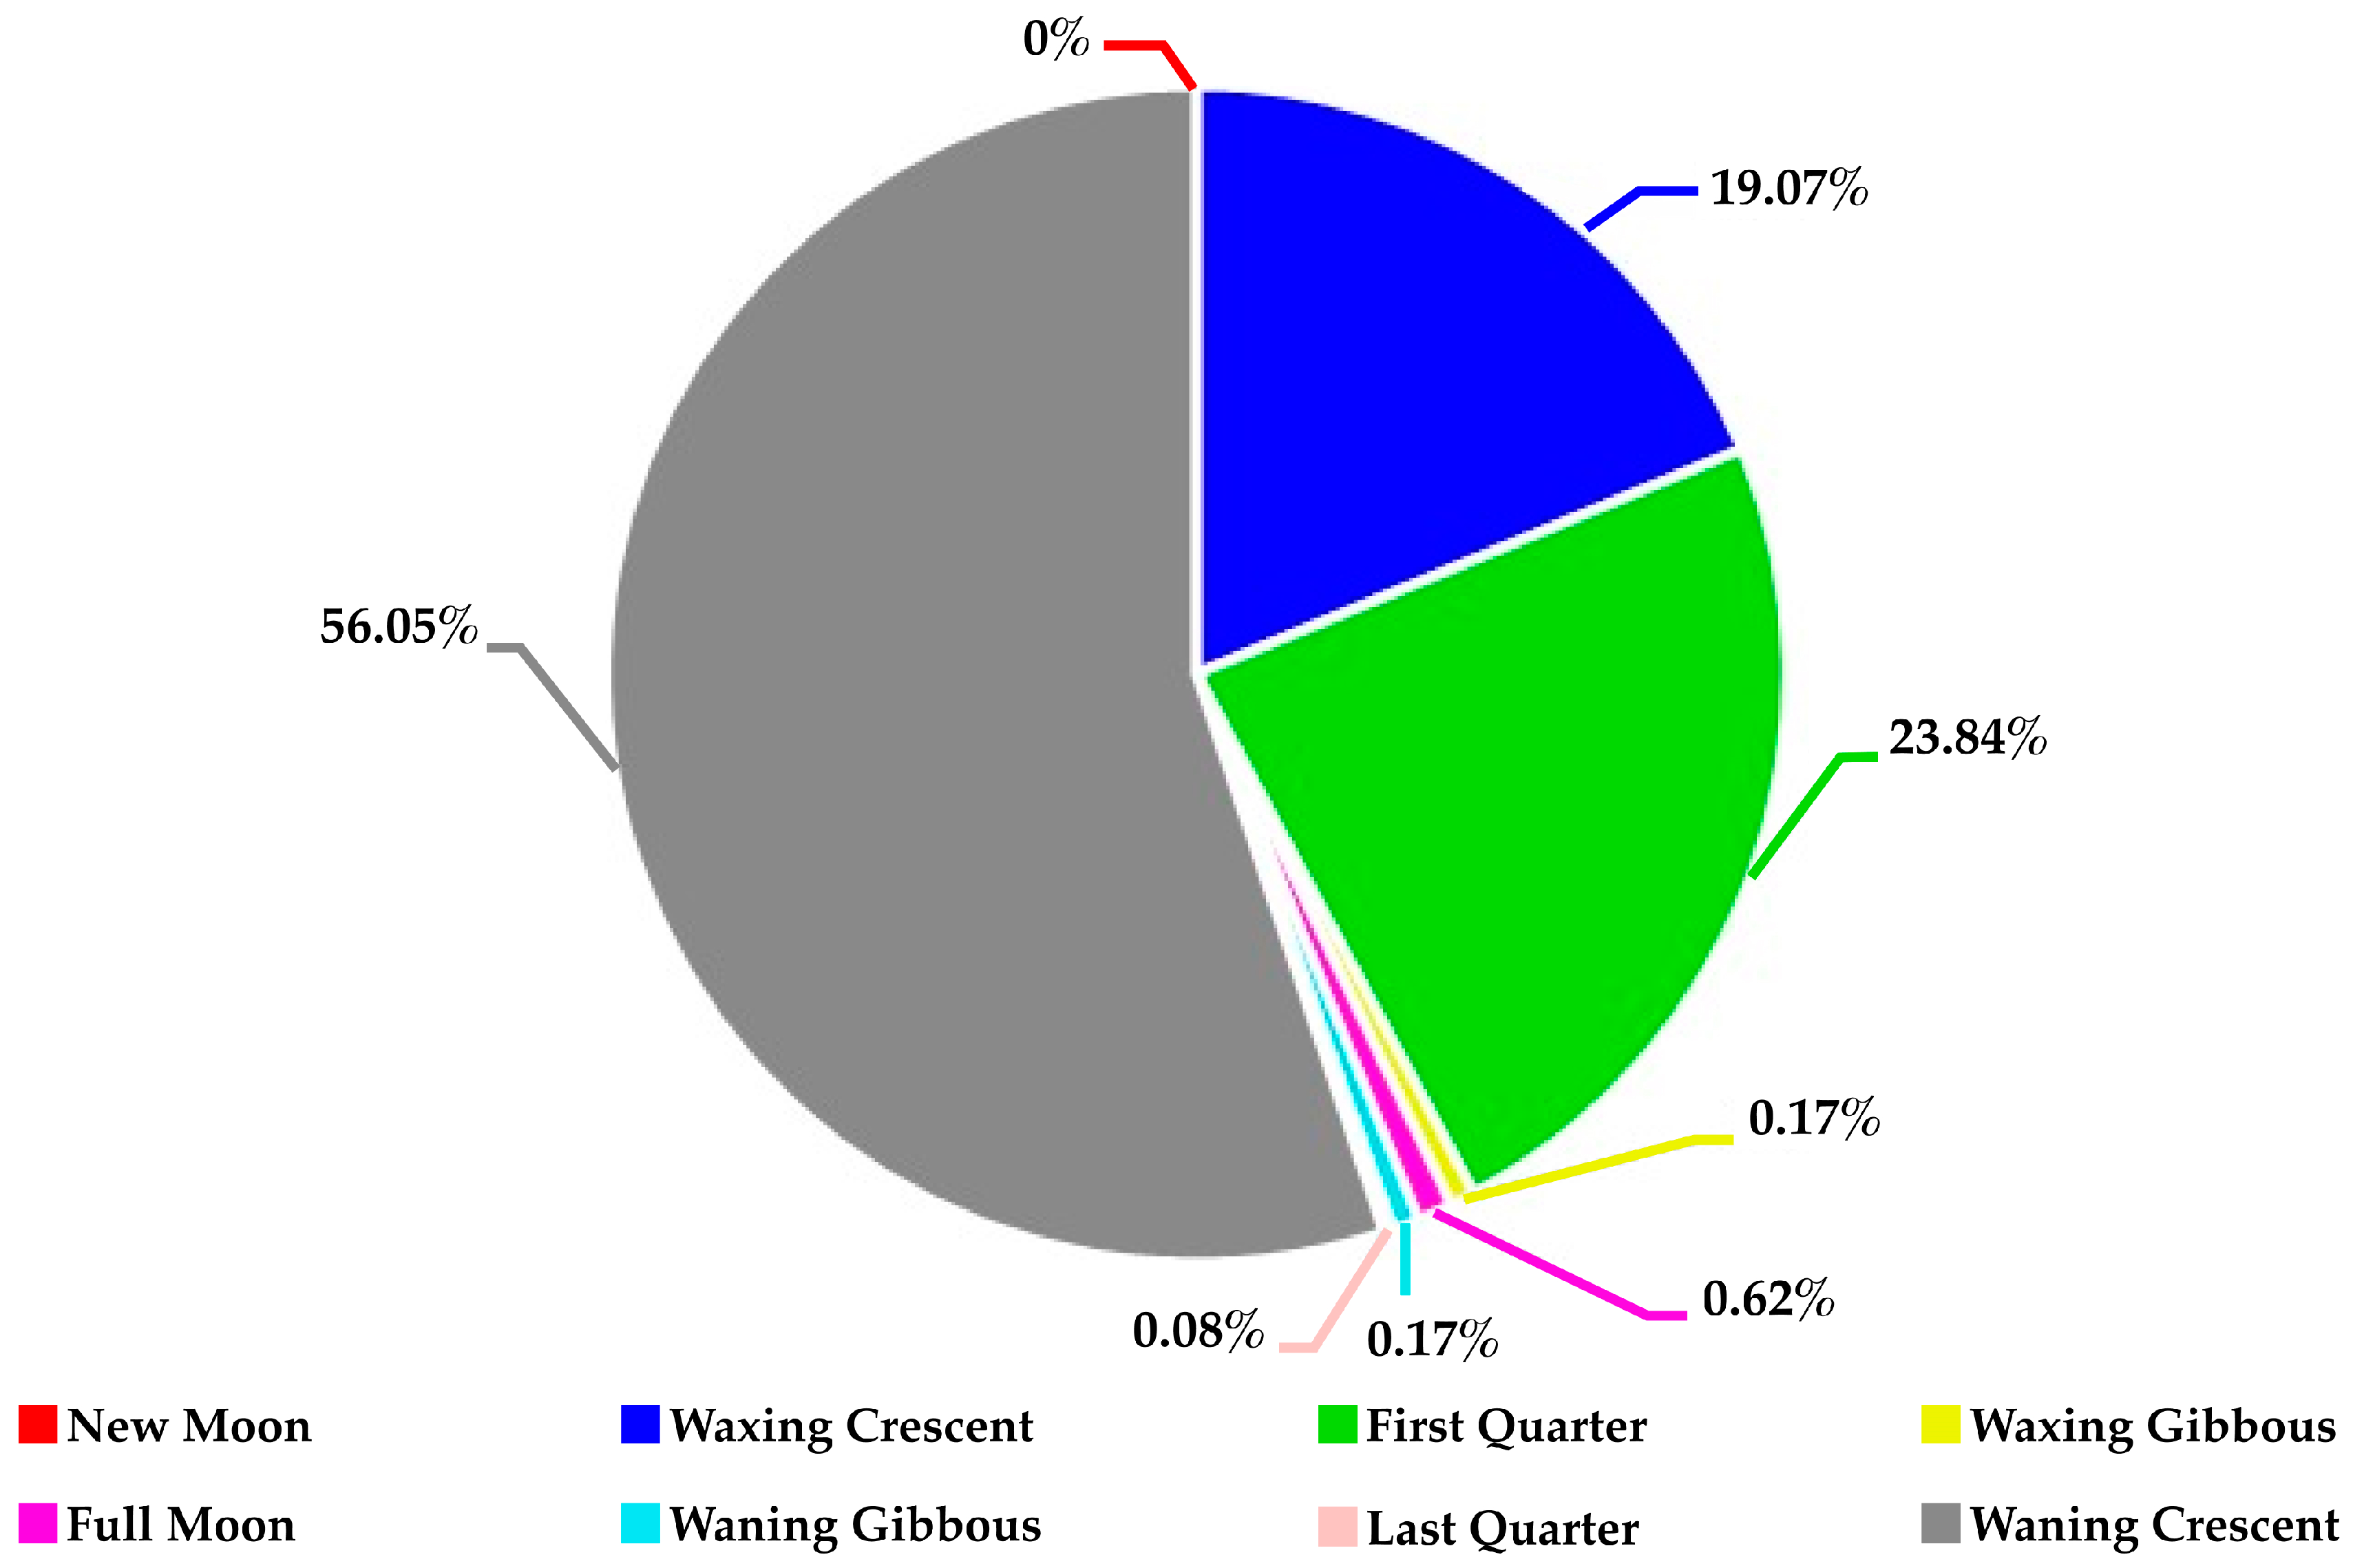
On the other hand, the results (Figure 6 and Figure 8, Table 6) for the 2412 Mexican weather stations evaluated by ω M i n indicate that the Waning Crescent phase stands out as the dominant phase with the lowest historical cumulative rainfall for 1352 (56.05%) Mexican weather stations (Figure 6 and Figure 8) and a ω M i n  interval between 1.481% and 9.042% (an average interval of 4.125%) (Table 6).
At 56.05% of Mexican weather stations, it rains less on average during the Waning Crescent phase at an interval between 1.481% and 9.042% (an average interval of 4.125%) compared with the other Moon phases. The Waning Crescent phase shows a homogeneous and dominant distribution, with the lowest historical cumulative rainfall in most of Mexico. The First Quarter phase has the second lowest historical cumulative rainfall, at 575 (23.83%) weather stations, manifesting principally in southern Mexico. The Waxing Crescent phase has the third lowest historical cumulative rainfall at 460 (19.07%) weather stations, manifesting principally on the Pacific coast. In a very minimal proportion—albeit geographically significant for its almost total concentration in Baja California Sur for 15 (0.62%) weather stations—the Full Moon phase has the lowest historical cumulative rainfall. Both ω M a x  and  ω M i n indicate that the correlation behavior between Moon cycles and rainfall in Baja California Sur is very different from that of most of Mexico; it is the only geographical area where the ω M a x evaluation shows that Waxing Gibbous is the dominant phase with the highest historical cumulative rainfall. In the ω M i n evaluation, Waxing Crescent is the dominant phase with the lowest historical cumulative rainfall by Moon phase. This is the only Mexican state where the Full Moon has the lowest historical cumulative rainfall.

3.2.3. Highest Historical Cumulative Rainfall by Moon Phase Index ( ω M a x ) vs. Lowest Historical Cumulative Rainfall by Moon Phase Index  ( ω M i n )

The results show clear positive and negative correlations between the Moon phases with the highest and lowest historical cumulative rainfall (Table 7) and clear grouping patterns in the geographical areas of Mexico (Figure 5 and Figure 6).
The Moon phases manifested opposite values in the ω M a x  and  ω M i n evaluations. While New Moon stands out as the dominant phase with the highest historical cumulative rainfall for 89.09% (2149) of the 2412 weather stations in the ω M a x evaluation), no weather stations were registered in the ω M i n evaluation, and while Waning Crescent stands out as the dominant phase with the lowest historical cumulative rainfall for 56.05% (1352) of the 2412 weather stations in the ω M i n evaluation, only one weather station was registered in the ω M a x evaluation. The same behavior can be observed for all the other Moon phases (Table 7). Evident and remarkable positive and negative correlations between the Moon phases can be observed in the results, certifying their high congruence and reliability.

4. Discussion

The Moon synodic cycle affects the rainfall of the different geographical regions of the Earth in different ways. This study describes how the Moon cycle affects the rainfall in Mexico and offers a methodology to measure the relationship between the Moon cycle and rainfall in a specific geographical region of the Earth. Mexico has a variety of climates and micro-climates, so the correlation behavior between the Moon cycle and rainfall is different in each of its geographical areas. This research not only contributes a study on the correlation behavior between the Moon cycle and rainfall in specific geographical areas of Mexico on a national level, but also contributes a methodology based on indices that accurately define this relationship in any specific geographic location of the world.
At present, we have abundant and easily accessible information. Modern computational technologies greatly facilitate analyses of large amounts of information in relatively short periods [19]. In the past, researchers did not have these advantages. Even with the limited infrastructure of their time, a correlation between heavy rainfall and the lunar cycle was found by [5,6,11]. With modern advances in computational technology and an abundance of information, we can process and analyze a much greater amount of information, without limitations on the study variables, taking into account not only the statistical correlation behavior of the data but also the spatial correlation behavior [20]. We can easily share the analyzed information to facilitate reproducibility and improve results. With these advantages, many other researchers that have demonstrated strong correlations between the Moon and rainfall, like [8,9,10] and others, can be more broadly supported and substantiated.
The climate-monitoring network of Mexico consists of about 5839 weather stations operated by CONAGUA; not all weather stations met the established data quality standards in this study: historical daily rainfall records between 30 and 51 years (1960–2011) and a maximum limit of 20% missing information. We reported the general correlation behavior between Moon phases and rainfall, and it is possible to identify this behavior in climatological stations with historical daily rainfall records with a minimum of up to 1 year of data. The data quality standards established here were used to achieve solid consolidation in the certainty of the results and to cover 100% of Mexican territory; as such, only 2412 (41.30%) stations were selected by the quality filter. Nevertheless, this number of weather stations was sufficient for identifying correlation behavior between the Moon synodic cycle and rainfall throughout Mexico.

5. Conclusions

5.1. Correlation Behavior between Moon Phases and Rainfall in Mexico

In the first stage of the investigation, this work identified the correlation behavior between the Moon phases and rainfall in Mexico. The results (Figure 4 and the Table 4) showed the following:
  • Moon phases can be grouped into three proportion types based on the historical cumulative rainfall in Mexico (Table 4): maximum, minimum, and medium. This shows that rainfall is maximized during the New Moon and minimized during the Waxing Crescent, First Quarter, and Waning Crescent phases (the latter showing the lowest historical rainfall); during the Waxing Gibbous, Full Moon, and Waning Gibbous phases, rainfall remains at medium values.
  • For rainfall forecasts based on Moon phases for any day of the year, and most of Mexico, we can conclude the following: during the New Moon, the probability and amount of rainfall are maximized; during the Waxing Crescent, First Quarter, and Waning Crescent phases, they are minimized; and during the Waxing Gibbous, Full Moon, and Waning Gibbous phases, they remain at medium values.

5.2. Correlation Behavior between Moon Phases and the Highest and Lowest Historical Cumulative Rainfall in the Different Geographical Areas of Mexico

In the second stage of the investigation, this work identified the correlation behavior between Moon phases and the highest and lowest historical cumulative rainfall in the different geographical areas of Mexico. The results shown in the maps of Figure 5 and Figure 6, Table 5, Table 6 and Table 7, and the pie charts of Figure 7 and Figure 8 reveal the following:
  • The correlation grouping patterns identified in the maps demonstrate that the correlational behavior between Moon phases and precipitation aligns with the patterns described in the initial stage of the investigation for the majority of Mexico. However, the analysis revealed atypical geographic patterns in certain areas where this correlation deviated significantly from the majority of Mexico; however, it still exhibits well-defined correlation grouping patterns. An exemplary case can be observed in Baja California Sur, where the correlation behavior is distinctly defined but diverges significantly from the patterns observed in most of Mexico.
  • The results showed clear positive and negative correlations between the Moon phases with the highest and lowest historical cumulative rainfall (Table 7) and clear grouping patterns in the geographical areas of Mexico (as shown in maps in Figure 5 and Figure 6). The Moon phases manifested opposite values in the ω M a x and ω M i n evaluations.
  • The correlation behavior between the Moon cycle and rainfall can be defined and is different in each geographic region.
  • A clear correlation between the Moon synodic cycle and rainfall was demonstrated.
  • The Moon cycle is a strong variable for forecasting rainfall, under the condition that correlational behavior with respect to the lunar cycle is accurately identified in the historical rainfall records within the geographical area of study; this can be achieved with a minimum period of 30 years of historical rainfall records.

Author Contributions

Conceptualization, C.A.O.-O., G.D.-F. and J.I.A.-C.; writing—original draft preparation, C.A.O.-O. and G.D.-F.; writing—review and editing, H.G.-B., S.V.-B., M.d.J.L.-M., L.O.S.-S., Á.A.V.-D.A. and D.I.O.-E.; supervision, Á.A.V.-D.A., J.I.D.L.R.-V., G.D.-F. and C.A.O.-O. All authors have read and agreed to the published version of the manuscript.

Funding

This research received no external funding.

Institutional Review Board Statement

Not applicable.

Informed Consent Statement

Not applicable.

Data Availability Statement

The original contributions presented in the study are included in the article, further inquiries can be directed to the corresponding author/s or first author. The data are not publicly available due to privacy.

Acknowledgments

The authors thank the CONAHCYT and the Doctorate in Science of Engineering Program at the Autonomous University of Zacatecas for the scholarship provided.

Conflicts of Interest

The authors declare no conflicts of interest.

References

  1. Kohyama, T.; Wallace, J.M. Rainfall variations induced by the lunar gravitational atmospheric tide and their implications for the relationship between tropical rainfall and humidity. Geophys. Res. Lett. 2016, 43, 918–923. [Google Scholar] [CrossRef]
  2. Chapman, S. The Lunar Diurnal Variation of Atmospheric Temperature at Batavia, 1866–1928. R. Soc. Lond. Proc. Ser. A 1932, 137, 1–24. [Google Scholar] [CrossRef]
  3. Sabine, E. On the Lunar Atmospheric Tide at St. Helena. Philos. Trans. R. Soc. Lond. 1847, 137, 45–50. [Google Scholar] [CrossRef]
  4. Kohyama, T.; Wallace, J.M. Lunar gravitational atmospheric tide, surface to 50 km in a global, gridded data set. Geophys. Res. Lett. 2014, 41, 8660–8665. [Google Scholar] [CrossRef]
  5. Bradley, D.A.; Woodbury, M.A.; Brier, G.W. Lunar synodical period and widespread precipitation. Science 1962, 137, 748–749. [Google Scholar] [CrossRef] [PubMed]
  6. Adderley, E.E.; Bowen, E.G. Lunar component in precipitation data. Science 1962, 137, 749–750. [Google Scholar] [CrossRef] [PubMed]
  7. Brier, G.W.; Bradley, D.A. The Lunar Synodical Period and Precipitation in the United States. J. Atmos. Sci. 1964, 21, 386–395. [Google Scholar] [CrossRef]
  8. Lethbridge, M.D. Relationship between Thunderstorm Frequency and Lunar Phase and Declination. J. Geophys. Res. 1970, 75, 5149–5154. [Google Scholar] [CrossRef]
  9. Carpenter, T.H.; Holle, R.; Fernandez-Partagas, J.J. Observed Relationships Between Lunar Tidal Cycles and Formation of Hurricanes and Tropical Storms. Mon. Weather Rev. 1972, 100, 451–460. [Google Scholar] [CrossRef]
  10. Palumbo, A. Lunar daily variations in rainfall. J. Atmos. Terr. Phys. 1986, 48, 145–148. [Google Scholar] [CrossRef]
  11. Balling, R.C.; Cerveny, R.S. Influence of lunar phase on daily global temperatures. Science 1995, 267, 1481–1483. [Google Scholar] [CrossRef] [PubMed]
  12. Yndestad, H.; Turrell, W.R.; Ozhigin, V. Lunar nodal tide effects on variability of sea level, temperature, and salinity in the Faroe-Shetland Channel and the Barents Sea. Deep-Sea Res. I 2008, 55, 1201–1217. [Google Scholar] [CrossRef]
  13. Pertsev, N.; Dalin, P. Lunar semimonthly signal in cloudiness: Lunar-phase or lunar-declination effect? J. Atmos. Sol.-Terr. Phys. 2010, 72, 713–717. [Google Scholar] [CrossRef]
  14. Krahenbuhl, D.S.; Pace, M.B.; Cerveny, R.S.; Balling, R.C. Monthly lunar declination extremes’ influence on tropospheric circulation patterns. J. Geophys. Res. Atmos. 2011, 116, 1–5. [Google Scholar] [CrossRef]
  15. Malherbe, J.; Engelbrecht, F.A.; Landman, W.A. Response of the Southern Annular Mode to tidal forcing and the bidecadal rainfall cycle over subtropical southern Africa. J. Geophys. Res. Atmos. 2014, 119, 2032–2049. [Google Scholar] [CrossRef]
  16. Sakazaki, T.; Hamilton, K. Discovery of a lunar air temperature tide over the ocean: A diagnostic of air-sea coupling. Clim. Atmos. Sci. 2018, 1, 25. [Google Scholar] [CrossRef]
  17. Vishwakarma, D.K.; Singh, A.; Kushwaha, A.; Sharma, A. Comparative Study on Influence of Moon’s Phases in Rainfall Prediction. In Proceedings of the 2021 2nd Global Conference for Advancement in Technology (GCAT), Bangalore, India, 1–3 October 2021; IEEE: Piscataway, NJ, USA, 2021; pp. 1–8. [Google Scholar]
  18. Lang, K.R. Astrophysical Data: Planets and Stars; Springer Science & Business Media: Berlin, Germany, 2012. [Google Scholar] [CrossRef]
  19. Pan, X.; Wu, H.; Chen, S.; Nanding, N.; Huang, Z.; Chen, W.; Li, C.; Li, X. Evaluation and Applicability Analysis of GPM Satellite Precipitation over Mainland China. Remote Sens. 2023, 15, 2866. [Google Scholar] [CrossRef]
  20. Zuo, H.; Lou, Y.; Li, Z. Spatiotemporal Variation of Hourly Scale Extreme Rainstorms in the Huang-Huai-Hai Plain and Its Impact on NDVI. Remote Sens. 2023, 15, 2778. [Google Scholar] [CrossRef]
Figure 1. The Moon synodic cycle (MSC) has a duration that may vary from 29.18 to 29.93 days. The long-term average duration is 29.5305882 days [18]. This is the time required for the Moon to move to the same position (same phase) as seen by an observer on Earth. Each Moon phase represents an MSC interval. We considered 8 Moon phases: New Moon (0% to 12.5% of MSC), Waxing Crescent (12.5% to 25% of MSC), First Quarter (25% to 37.5% of MSC), Waxing Gibbous (37.5% to 50% of MSC), Full Moon (50% to 62.5% of MSC), Waning Gibbous (62.5% to 75% of MSC), Last Quarter (75% to 87.5% of MSC), and Waning Crescent (87.5% to 100% of MSC).
Atmosphere 15 00746 g001
Figure 2. The 2412 weather station locations fulfilled the established data quality standards: minimum record period between 30 and 51 years (1960–2011) and a maximum limit of 20% of information missing.
Atmosphere 15 00746 g002
Figure 3. Historical cumulative rainfall by Moon phase for weather station 03123 in Baja California Sur, Mexico, based on 30 years of complete data. Notable differences in rainfall between Moon phases are shown, with the New Moon having the highest cumulative rainfall (27.89%) and the Waxing Crescent the lowest (4.17%). These patterns were identified for 2412 weather stations across Mexico.
Atmosphere 15 00746 g003
Figure 4. Historical cumulative rainfall by Moon phase for the 2412 weather stations located throughout Mexico. The New Moon phase stands out as having the highest historical cumulative rainfall by Moon phase with 16,205,629 mm (17.24%), and the Waning Crescent phase stands out as having the lowest historical cumulative rainfall by Moon phase with 9,042,725 mm (9.62%).
Atmosphere 15 00746 g004
Figure 5. Locations and results for 2412 weather stations evaluated by ω M a x . The New Moon stands out as the dominant phase with the highest historical cumulative rainfall for 2149 (89.09%) of the weather stations in Mexico.
Atmosphere 15 00746 g005
Figure 6. Proportions of 2412 weather stations in Mexico evaluated by ω M a x . New Moon stands out as the dominant phase with the highest historical cumulative rainfall for 89.09% of the total weather stations in Mexico.
Atmosphere 15 00746 g006
Figure 7. Locations and results for 2412 weather stations evaluated by ω M i n . Waning Crescent stands out as the dominant phase with the lowest historical cumulative rainfall for 1352 (56.05%) Mexican weather stations.
Atmosphere 15 00746 g007
Figure 8. The pie chart shows the proportions of 2412 Mexican weather evaluated by ω M i n . Waning Crescent stands out as the dominant phase with the lowest historical cumulative rainfall for 56.05% of Mexican weather stations.
Atmosphere 15 00746 g008
Table 4. Classification of Moon phases by historical cumulative rainfall.
Moon PhaseMaximumMinimumMedium
New Moon17.24%
Waxing Crescent 10.34%
First Quarter 10.09%
Waxing Gibbous 13.46%
Full Moon 13.22%
Waning Gibbous 13.13%
Last Quarter 12.91%
Waning Crescent 9.62%
Averages17.24%10.01%13.18%
Note. The table shows the results for historical cumulative rainfall by Moon phase for 2412 weather stations in Mexico. The Moon phase with the maximum rainfall value is the New Moon (with 17.24%). The Moon phases with medium rainfall values are Waxing Gibbous, Full Moon, and Waning Gibbous (with 13.18% on average). The Moon phases with minimum rainfall values are Waxing Crescent, First Quarter, and Waning Crescent (10.01% on average), with the latter having the least historical accumulated rainfall by Moon phase, with 9.62%.
Table 5. Evaluation results for ω M a x .
Moon PhaseWeather Stations ω M a x
NumberPercentageIntervalAverage of the Interval
New Moon214989.09%[1. 809% to 17.59%]5.521%
Waxing Crescent20.08%[3. 139% to 3.997%]3.568%
First Quarter40.16%[4. 219% to 7.626%]5.642%
Waxing Gibbous1265.22%[2. 641% to 17.521%]6.111%
Full Moon341.40%[1.97% to 7.197%]4.101%
Waning Gibbous652.69%[2. 135% to 9.609%]4.372%
Last Quarter321.32%[2. 256% to 9.212%]4.806%
Waning Crescent10.04%00
Note. The table shows the results for 2412 Mexican weather stations evaluated by ω M a x . New Moon stands out as the dominant phase with the highest historical cumulative rainfall for 2149 (89.09%) of the weather stations and an ω M a x  interval between 1.809% and 17.59% (an average interval of 5.521%).
Table 6. Evaluation results for ω M i n .
Moon PhaseWeather Stations ω M i n
NumberPercentageIntervalAverage of the Interval
New Moon0000%
Waxing Crescent46019.07%[1.978% to 11.044%]4.132%
First Quarter57523.84%[1.941% to 9.104%]3.831%
Waxing Gibbous40.17%[2.789% to 5.246%]3.625%
Full Moon150.62%[2.5% to 8.36%]6.071%
Waning Gibbous40.17%[2. 547% to 4.684%]3.204%
Last Quarter20.08%[2. 246% to 4.859%]3.553%
Waning Crescent135256.05%[1.481% to 9.042%]4.125%
Note. The table shows the results for 2412 Mexican weather stations evaluated by ω M i n . The Waning Crescent stands out as the dominant phase with the lowest historical cumulative rainfall by Moon phase for 1352 (56.05%) of the weather stations and a ω M i n  interval between 1.481% and 9.042% (an average interval of 4.125%).
Table 7. Comparative results between ω M a x and ω M i n .
Moon PhaseWeather Stations
ω M a x ω M i n
NumberPercentageNumberPercentage
New Moon214989.09%00%
Waxing Crescent20.08%46019.07%
First Quarter30.12%57523.83%
Waxing Gibbous1265.22%40.16%
Full Moon341.40%150.62%
Waning Gibbous652.69%40.16%
Last Quarter321.32%20.08%
Waning Crescent10.04%135256.06%
Note. New Moon stands out as the dominant phase with the highest historical cumulative rainfall, with 89.09% or 2149 of the 2412 weather stations evaluated by ω M a x and 0 weather stations evaluated by  ω M i n , whereas Waning Crescent stands out as the dominant phase with the lowest historical cumulative rainfall, with 56.05% or 1352 of the 2412 of the weather stations evaluated by  ω M i n and 1 weather station evaluated by  ω M a x . Evident and remarkable positive and negative correlations can be observed in the results, certifying their high congruence and reliability.
Disclaimer/Publisher’s Note: The statements, opinions and data contained in all publications are solely those of the individual author(s) and contributor(s) and not of MDPI and/or the editor(s). MDPI and/or the editor(s) disclaim responsibility for any injury to people or property resulting from any ideas, methods, instructions or products referred to in the content.