
Analysis of the Multi-Dimensional Characteristics of City Weather Forecast Page Views and the Spatiotemporal Characteristics of Meteorological Disaster Warnings in China
 , ,
, ,
Abstract
1. Introduction
2. Study Domain and Data
2.1. Study Domain
2.2. Data
3. Results
4. Discussions
5. Conclusions
- (1)
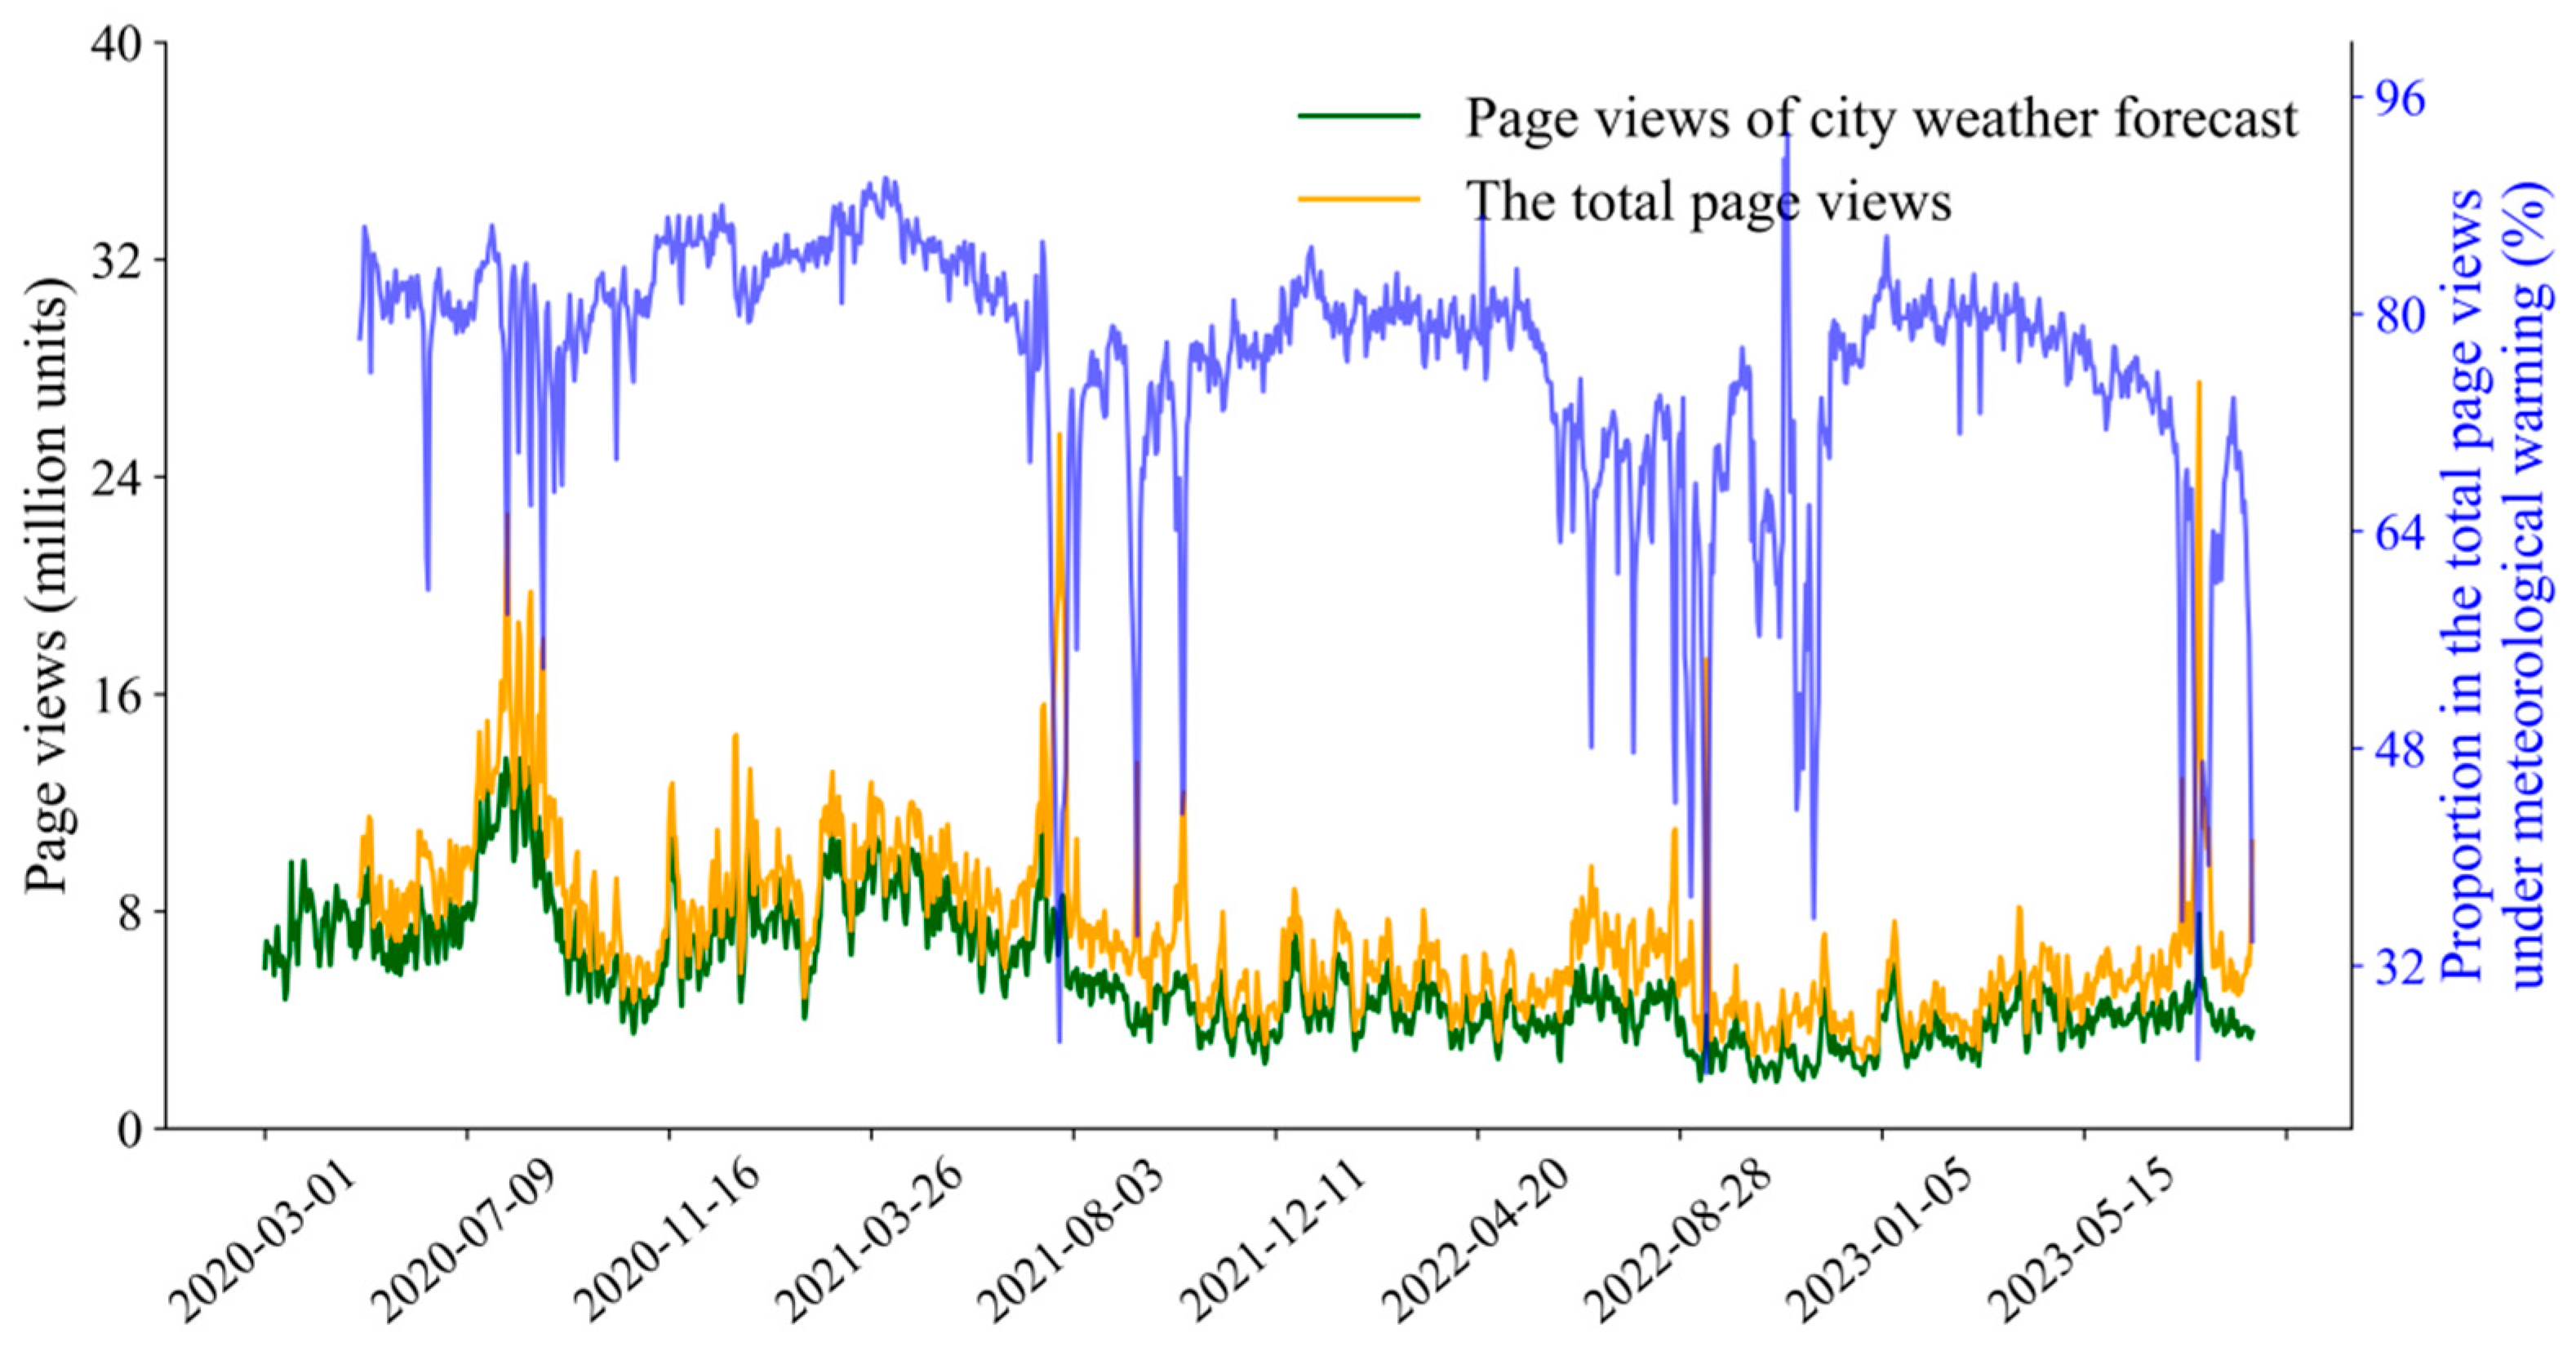
- The prevalence of heat waves, typhoons, severe convective weather, and geological hazards triggered by heavy rainfall during the flood season has heightened public awareness and engagement with weather forecasts.
- (2)
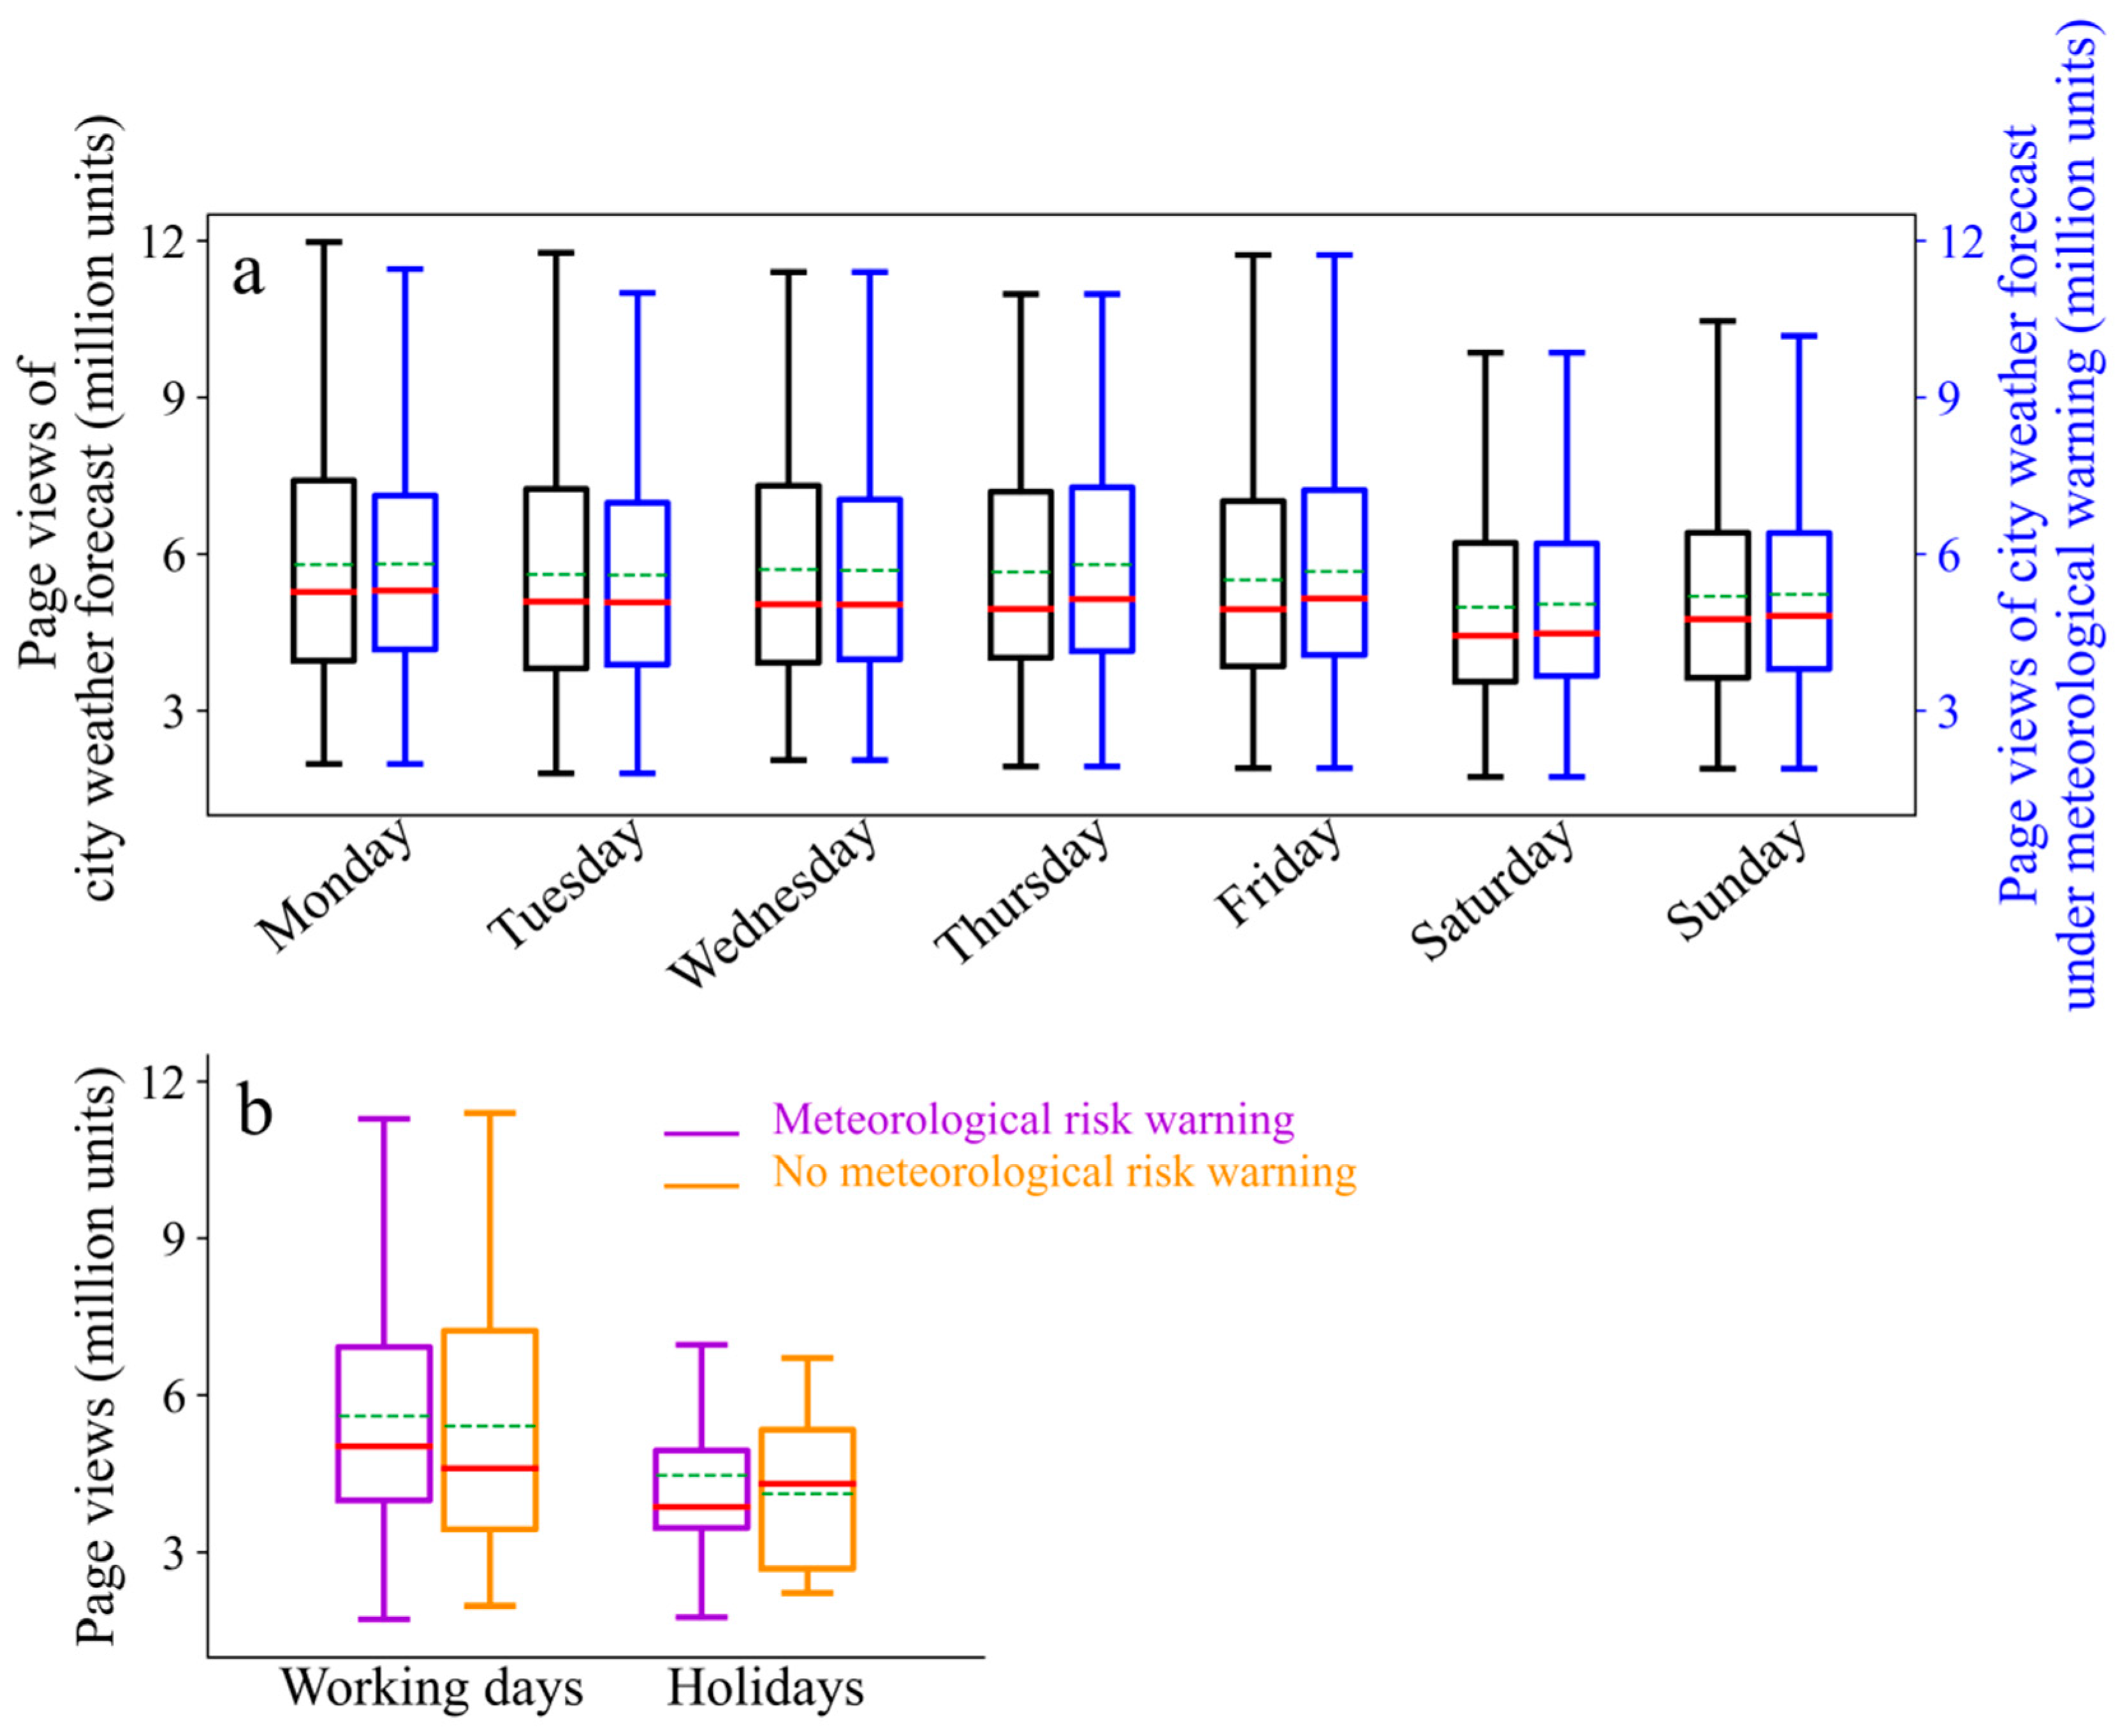
- In contrast to weekends and holidays, weekdays witnessed a heightened focus on weather among the public. The disparity in city weather forecast page views between weekdays and national statutory holidays is even more pronounced.
- (3)
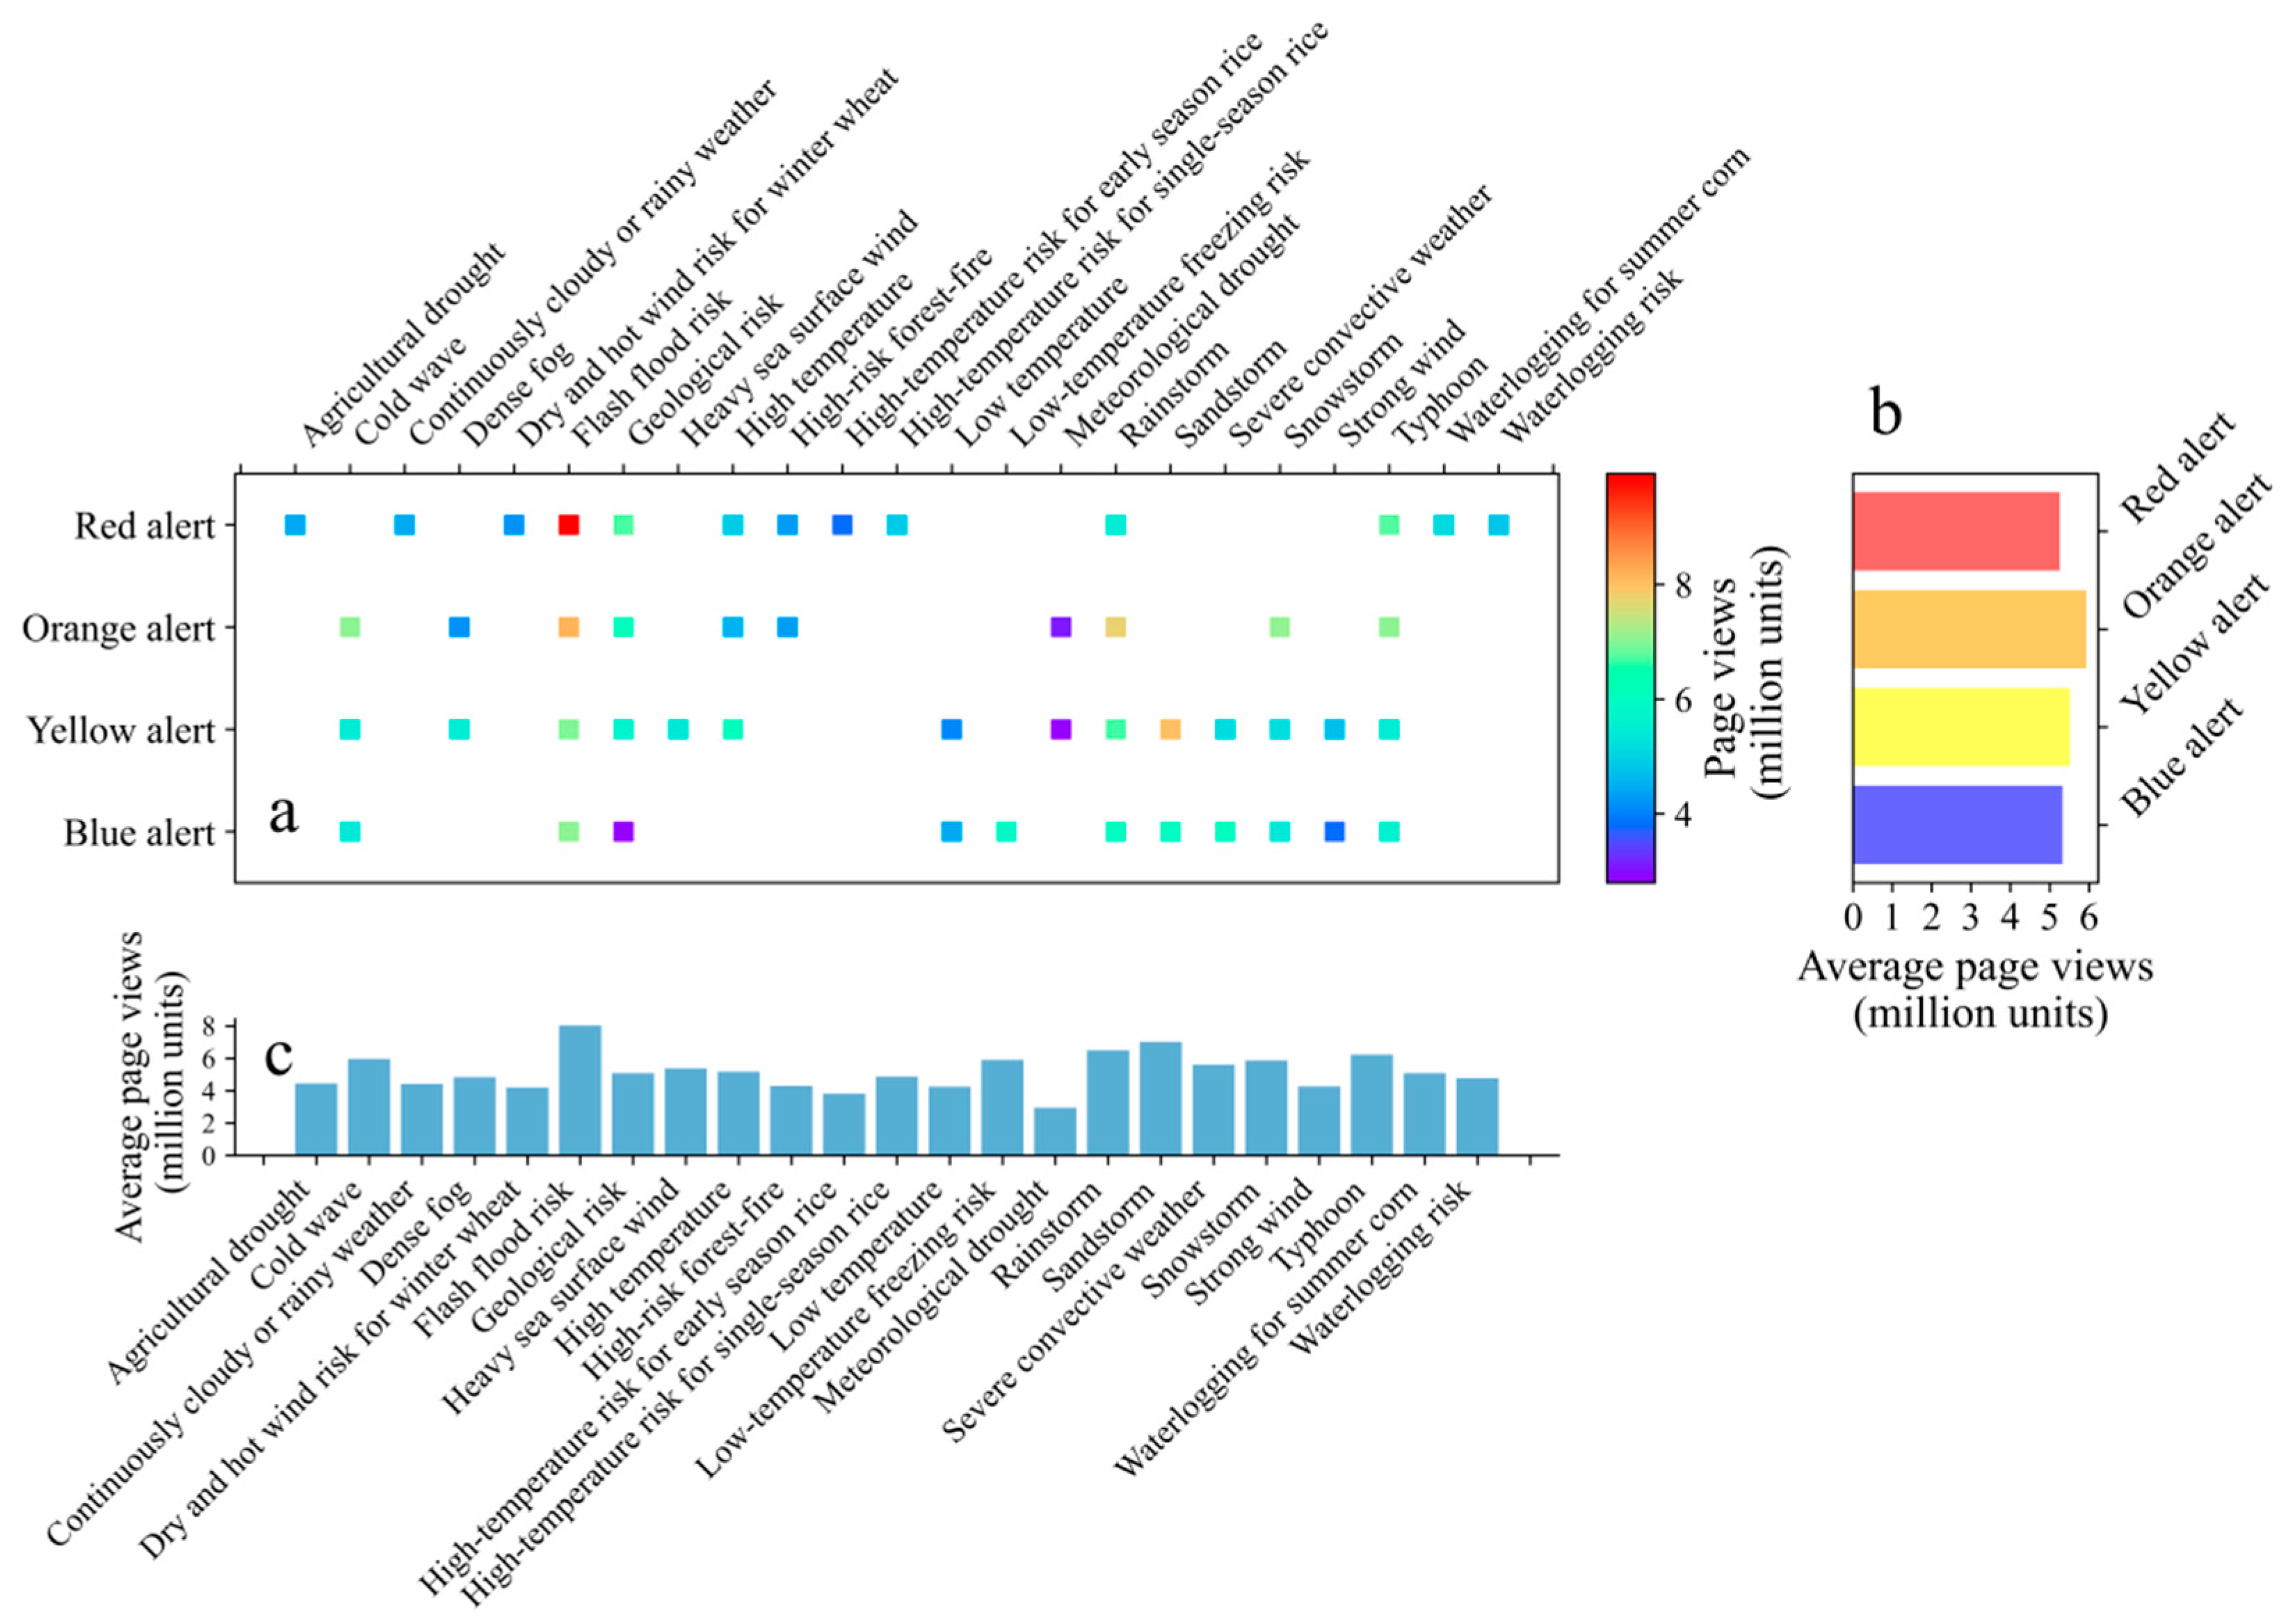
- Under various red meteorological disaster warnings, the public’s primary concerns were flash floods, typhoons, and geological risks. During orange alerts, flash floods, rainstorms, typhoons, snowstorms, and cold waves dominated the public’s attention. For yellow alerts, sandstorms were the most notable concern, while meteorological droughts remained relatively unheeded.
- (4)
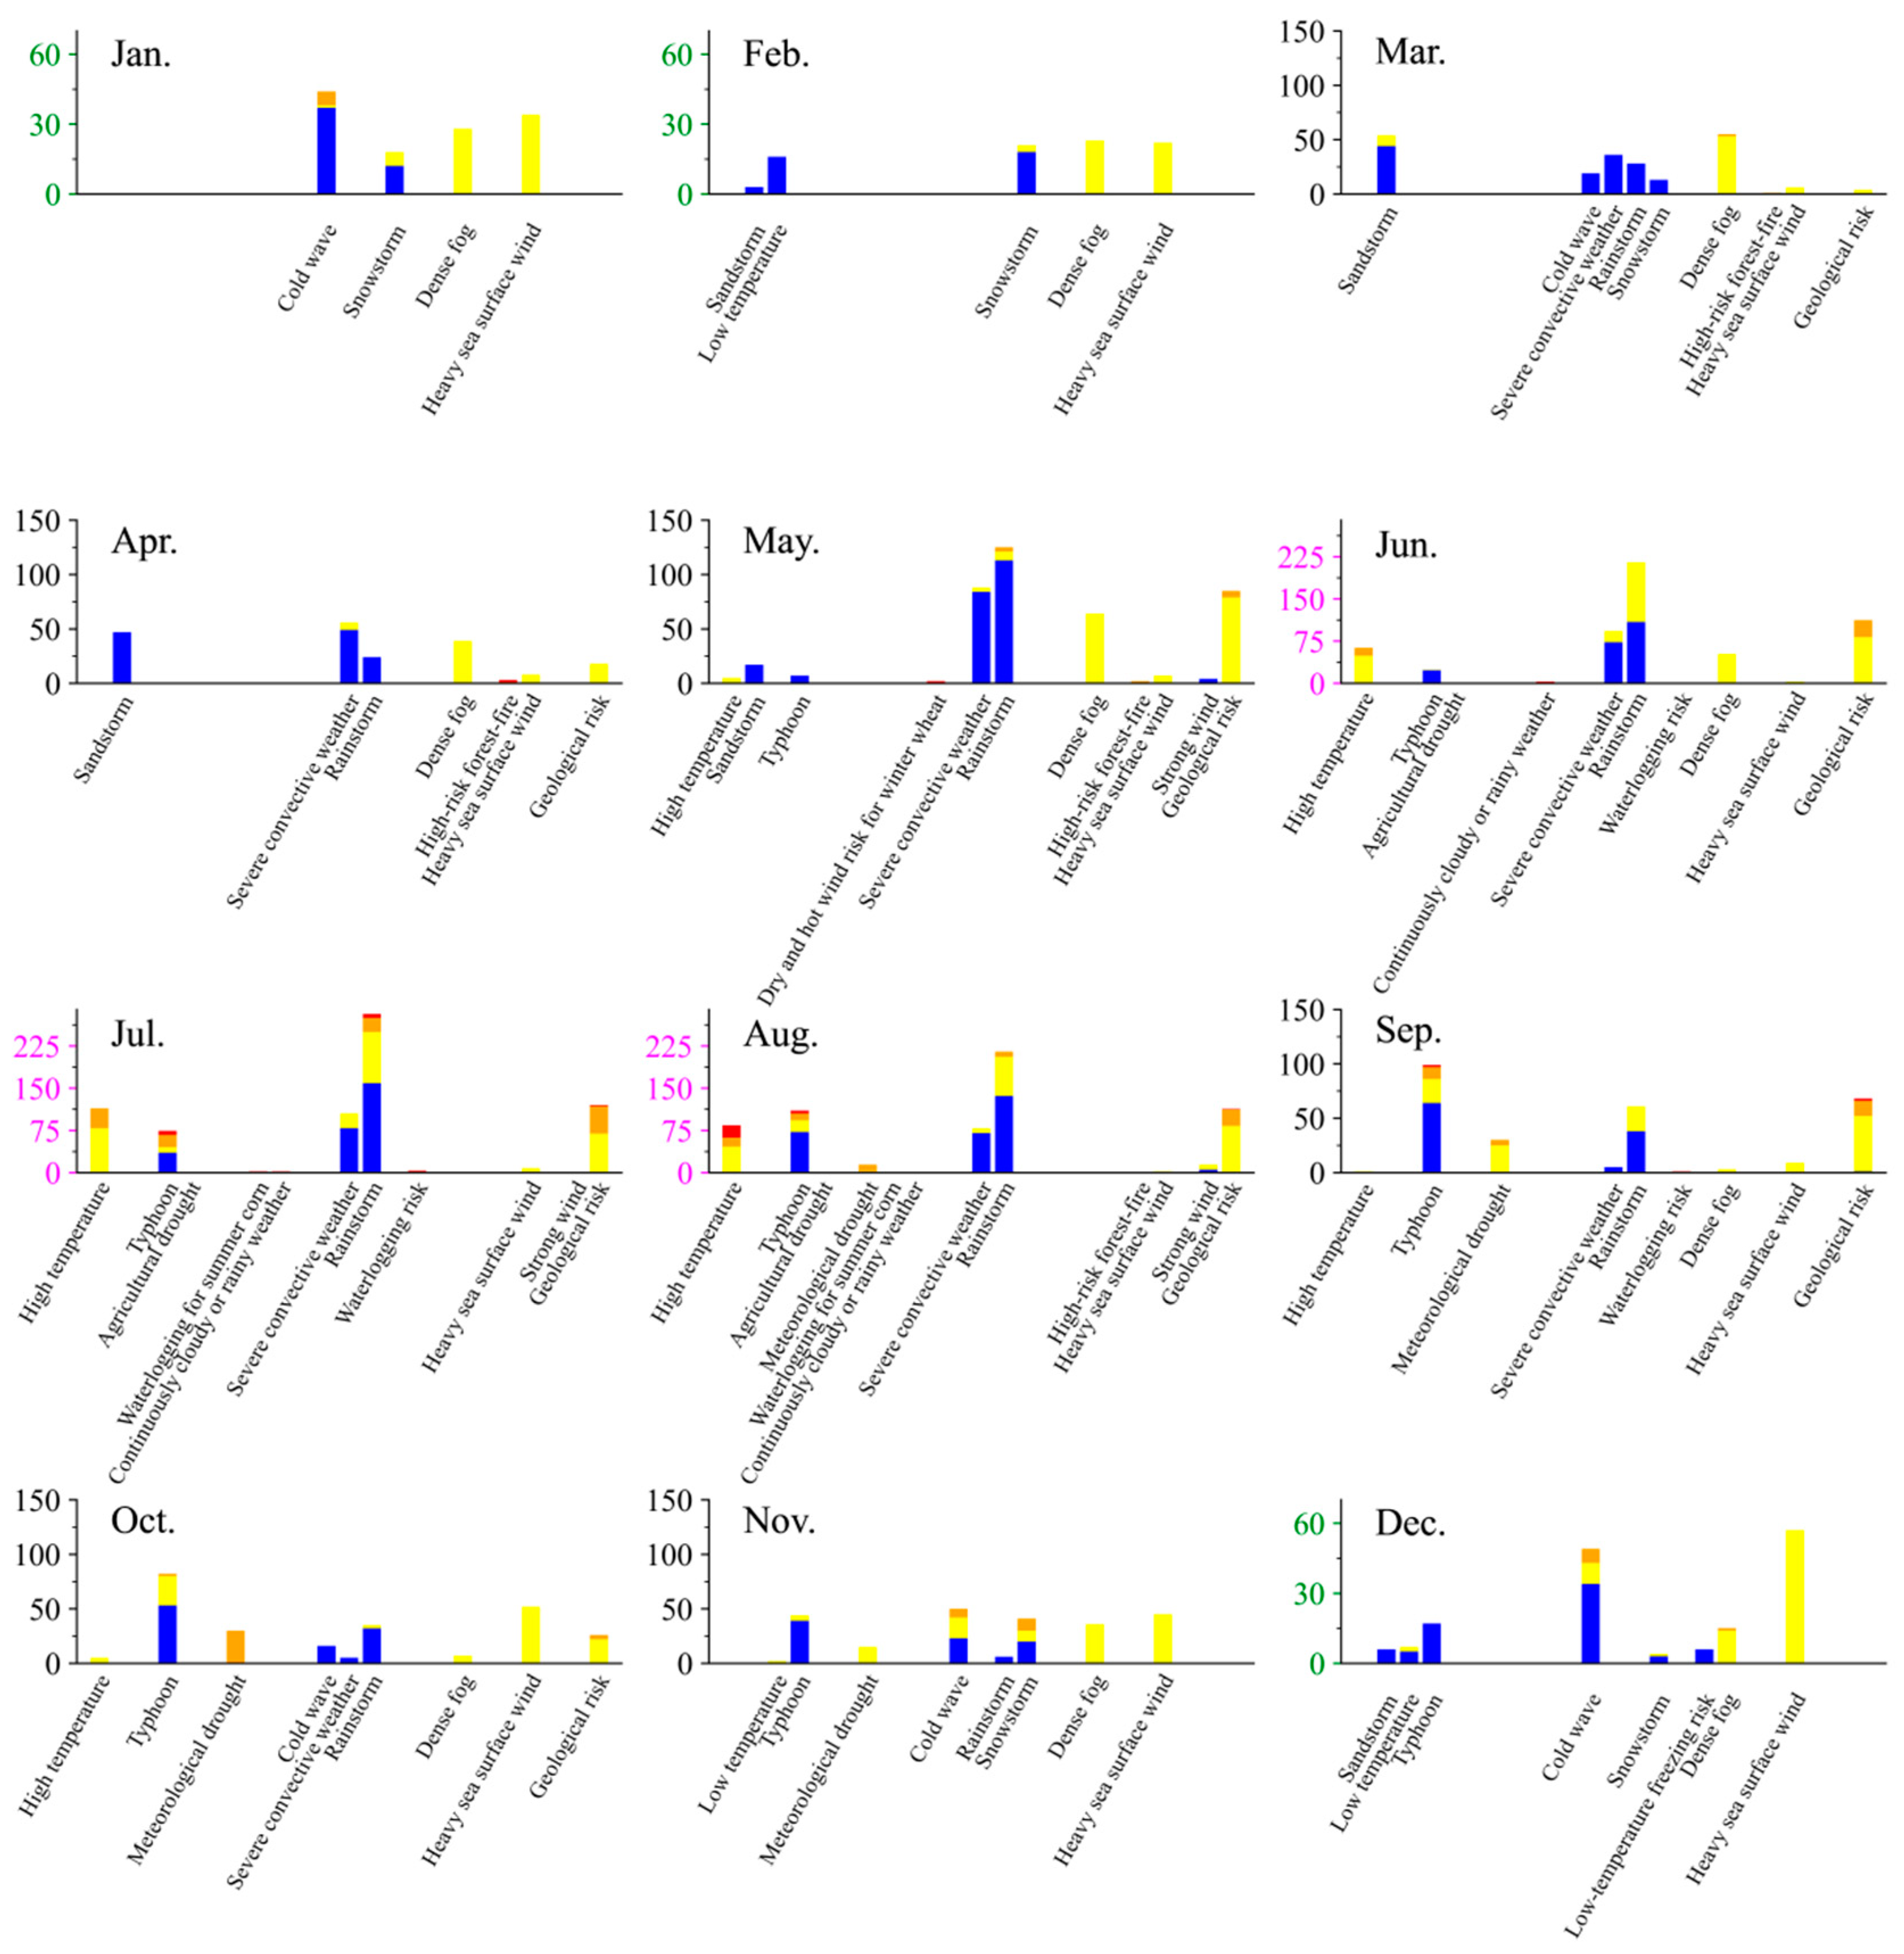
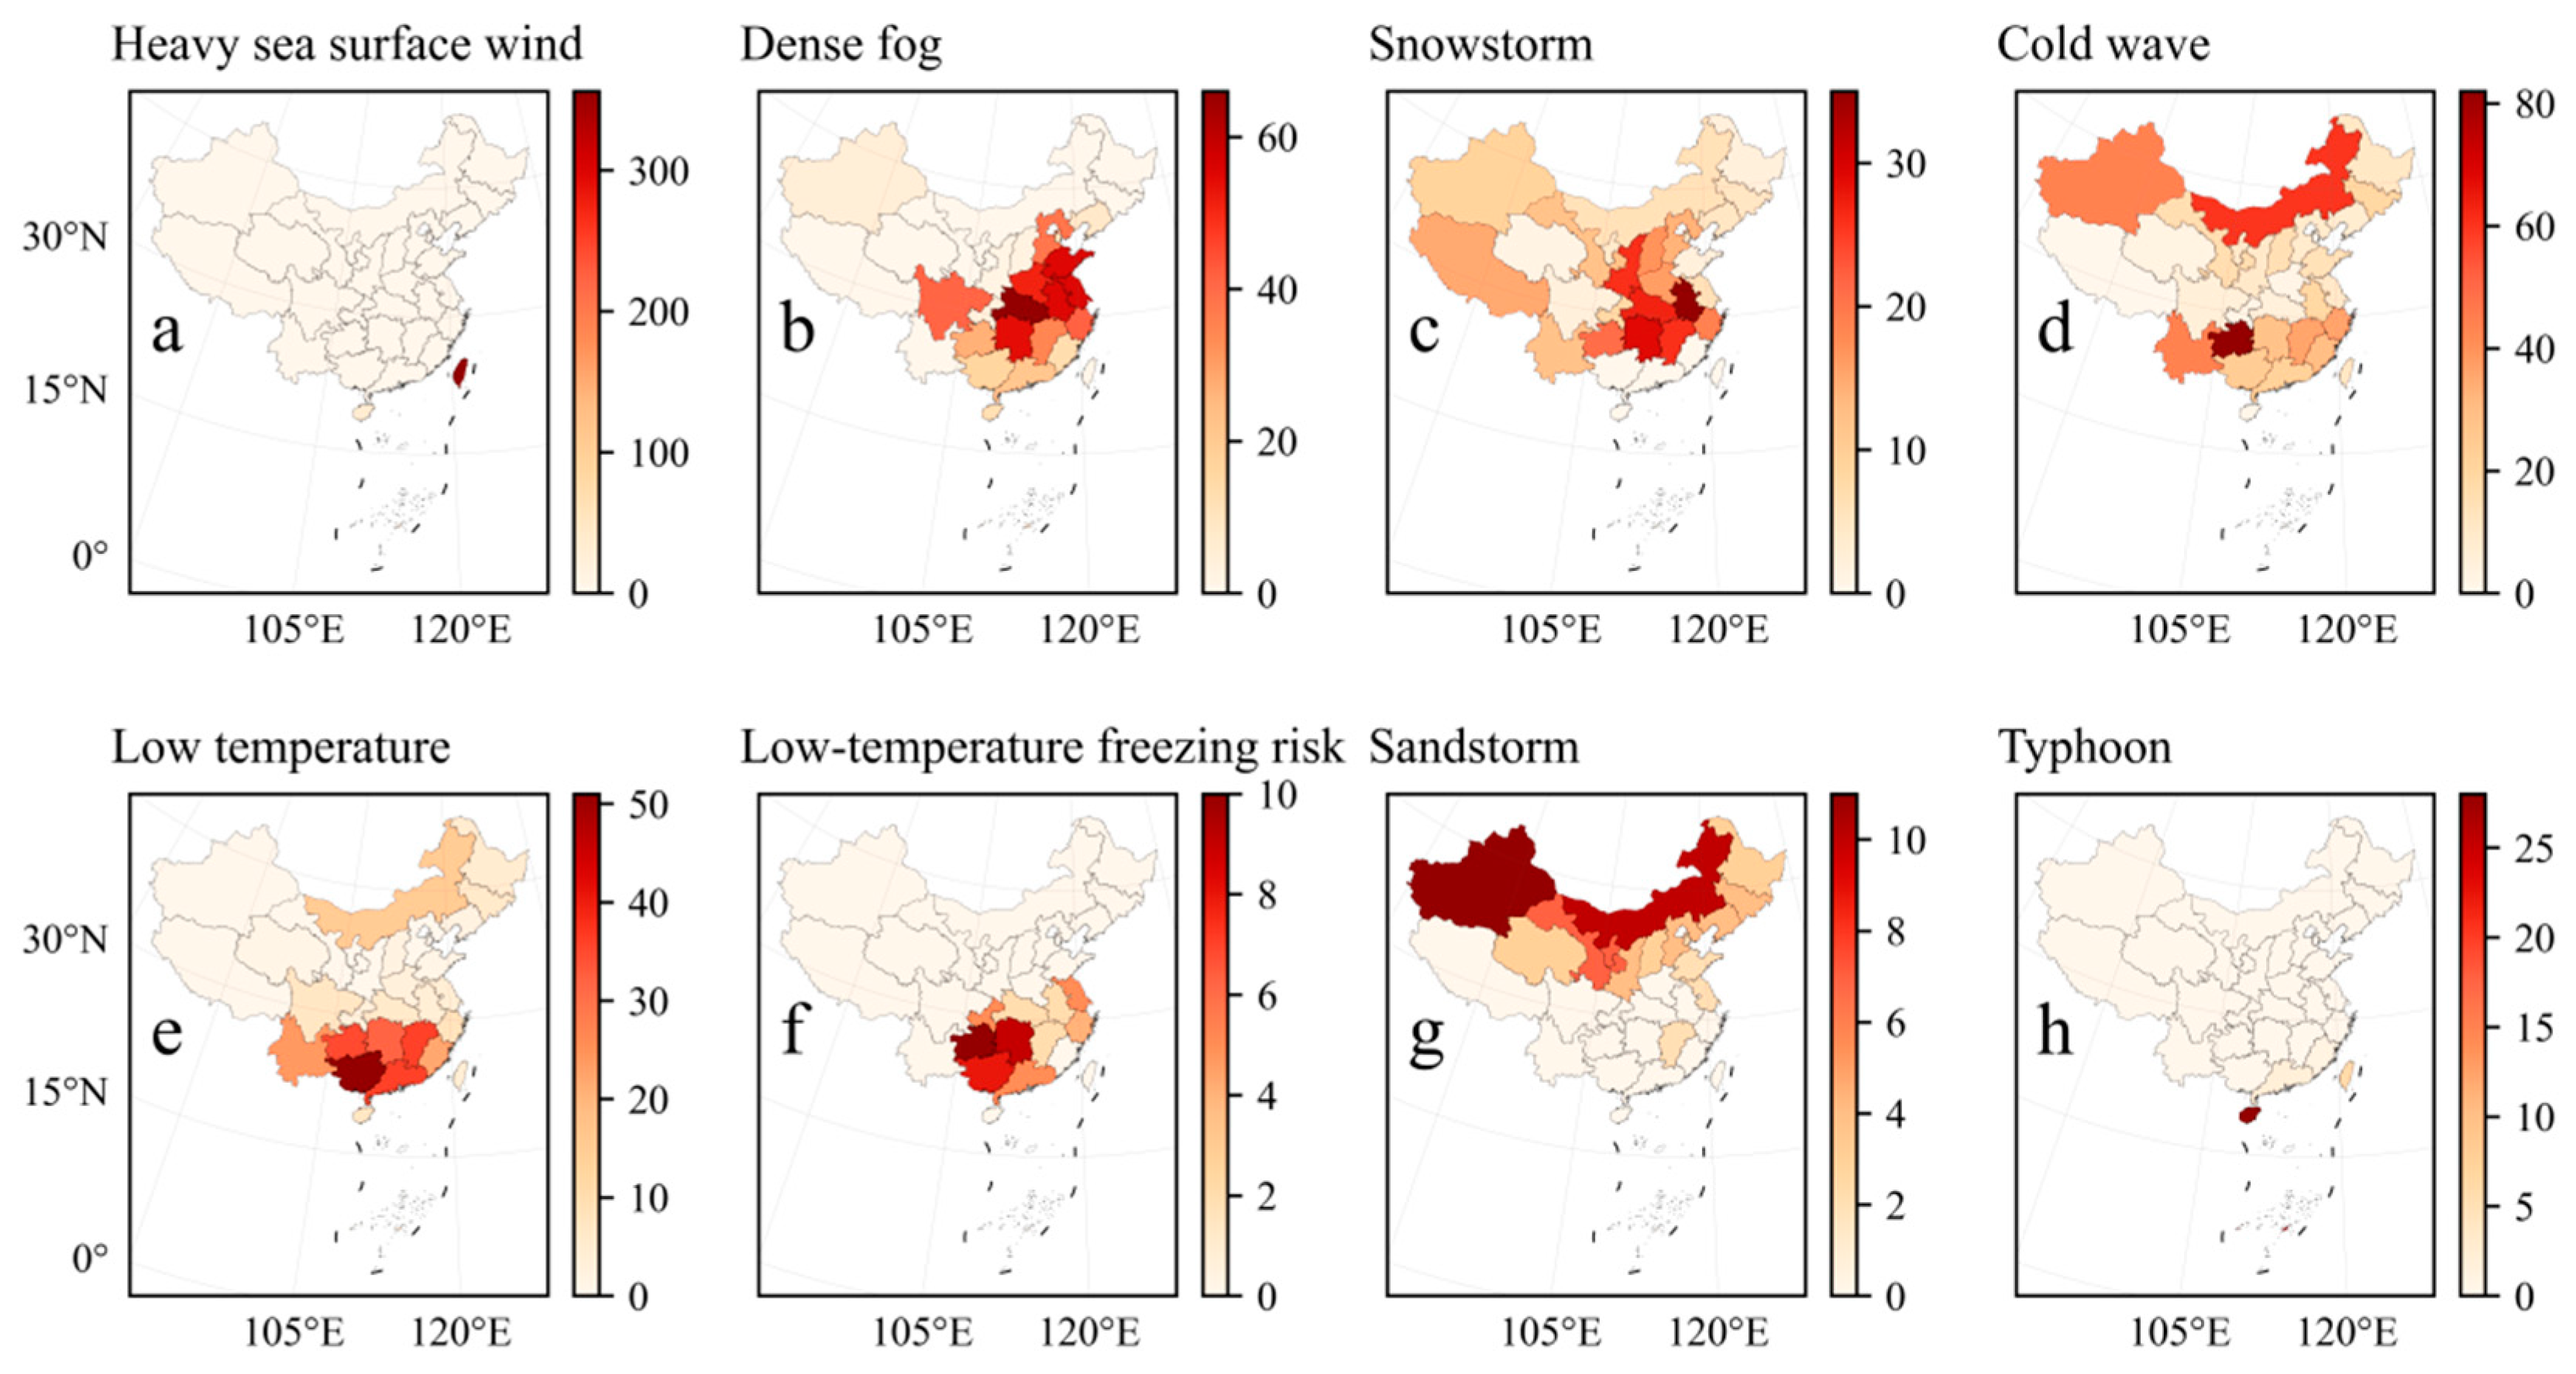
- Examining the temporal dimension of meteorological warnings, it becomes evident that summer sees a notably higher issuance of such warnings compared to other seasons. Specifically, typhoons and rainstorms are the primary concerns in July, while August brings warnings for high temperatures and additional typhoons. Additionally, warnings for heavy sea surface winds, another highly seasonal phenomenon, are predominantly issued during winter.
- (5)
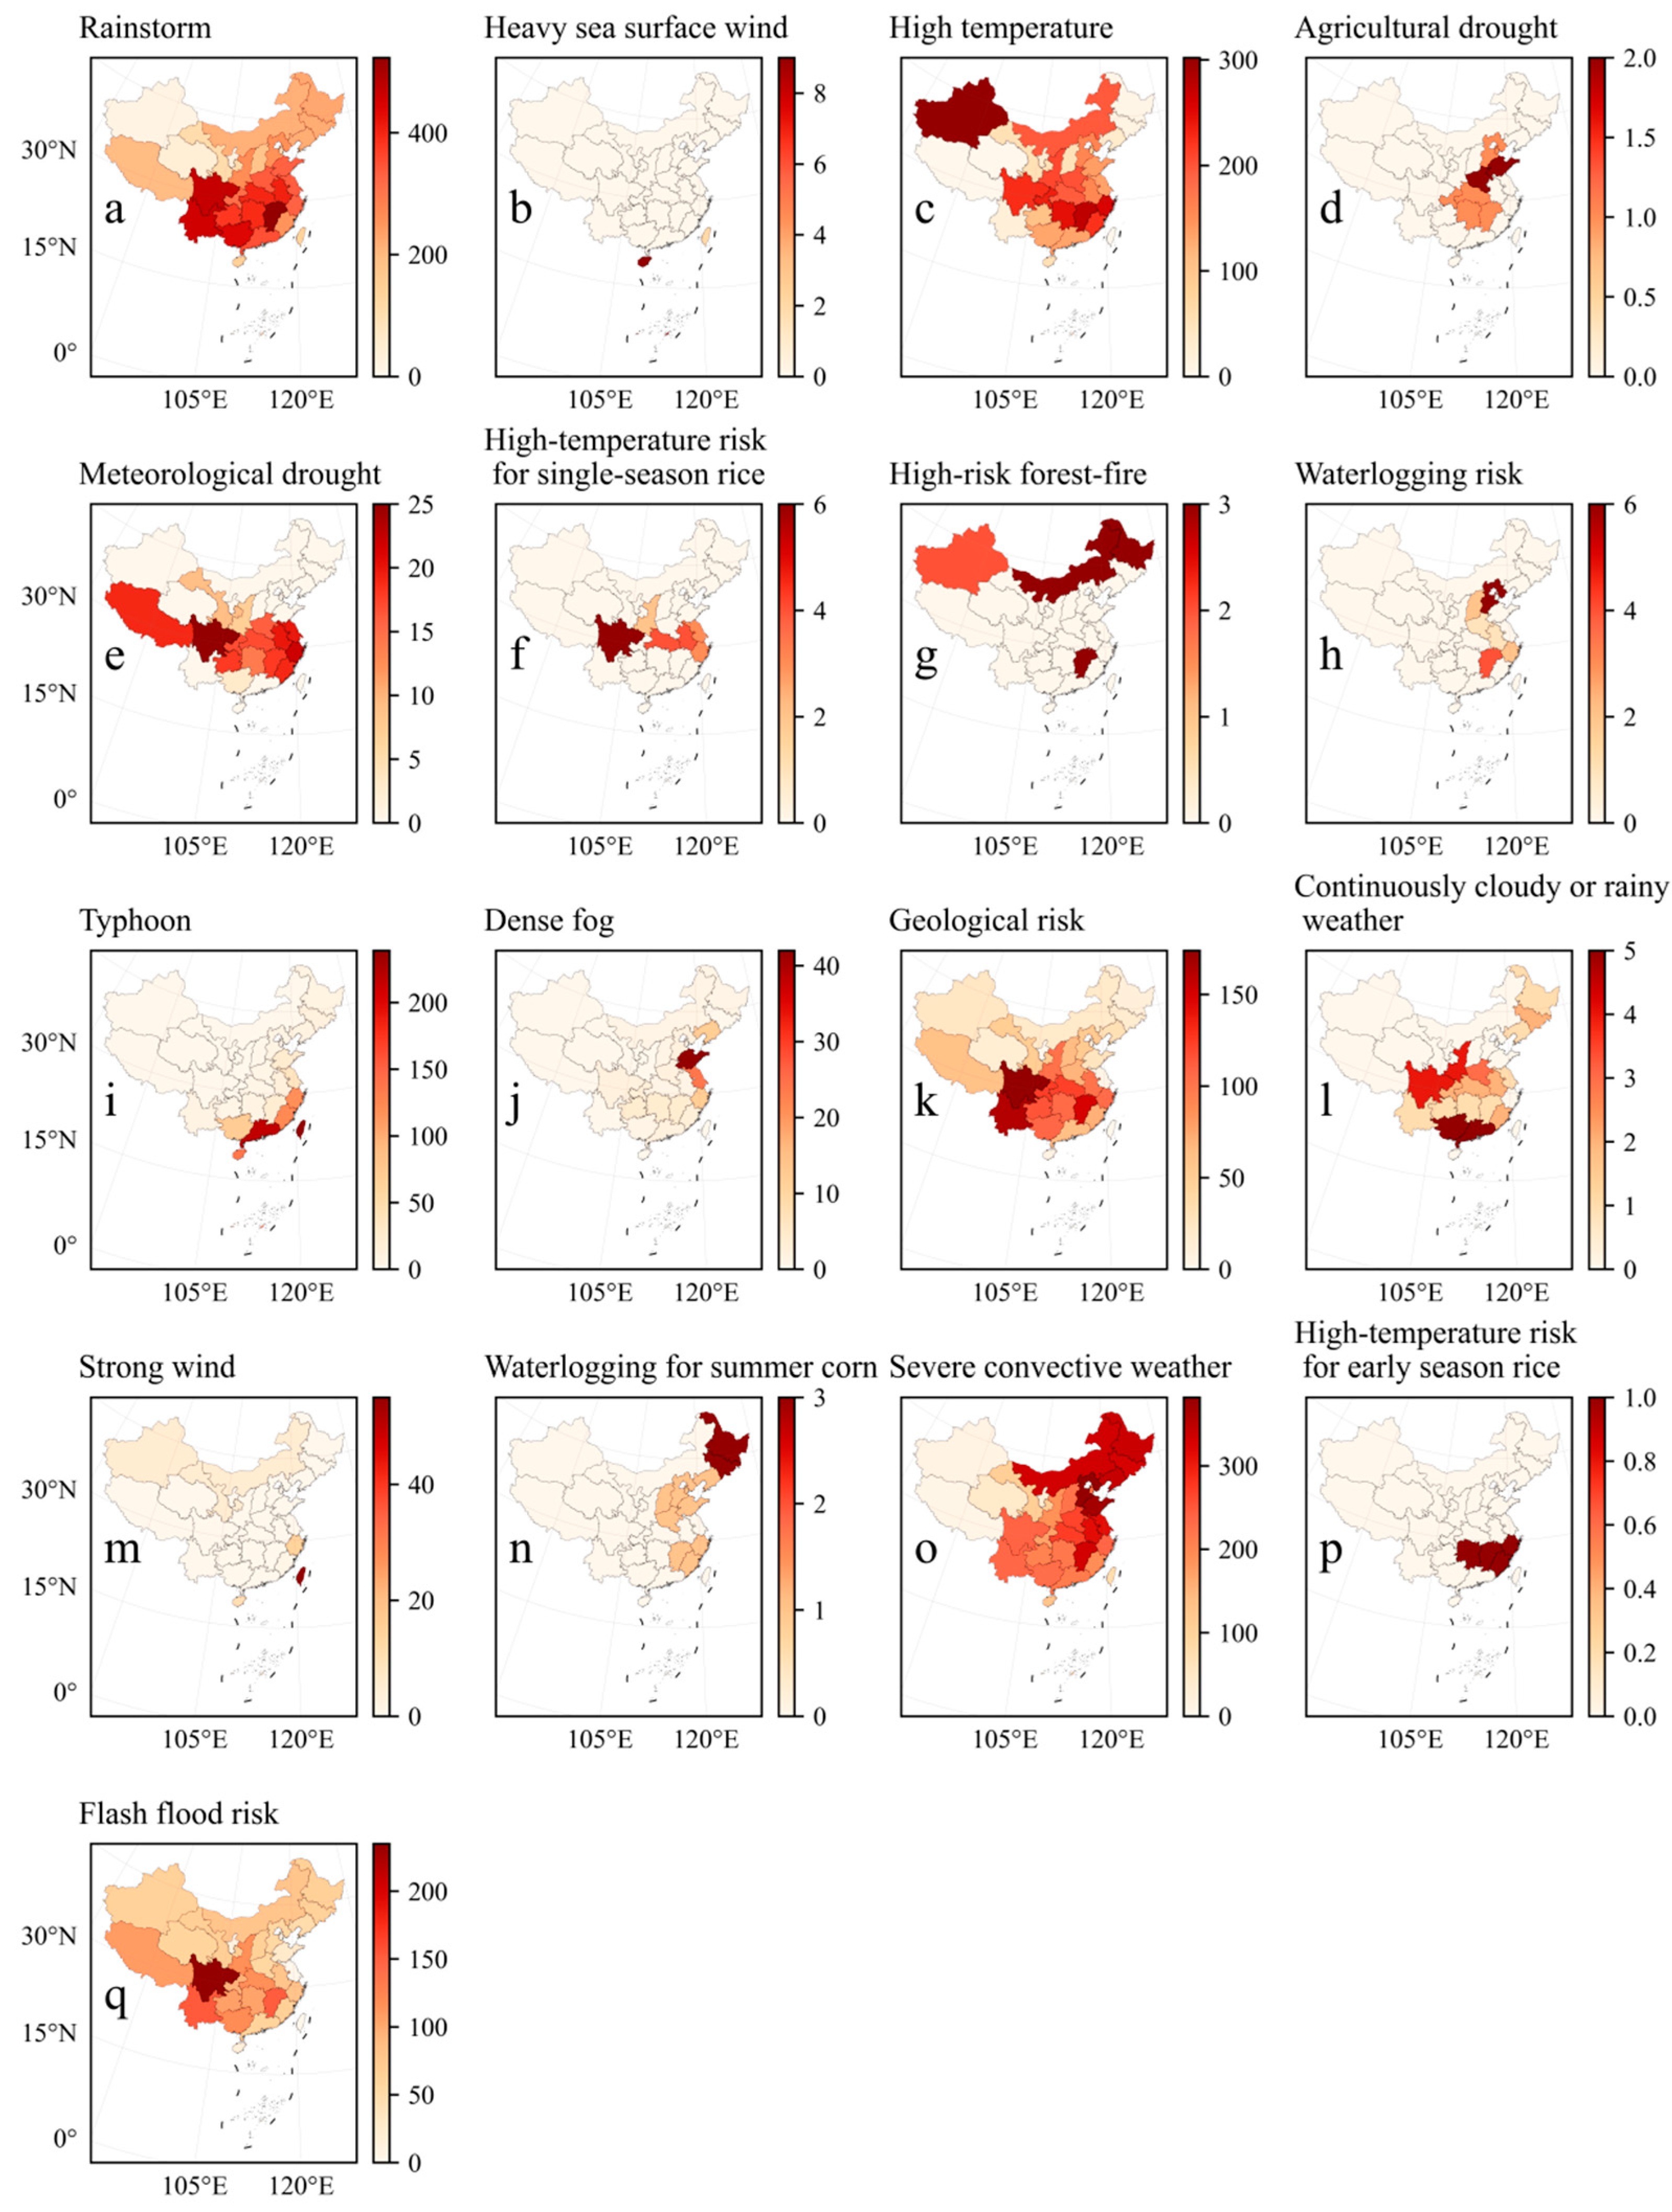
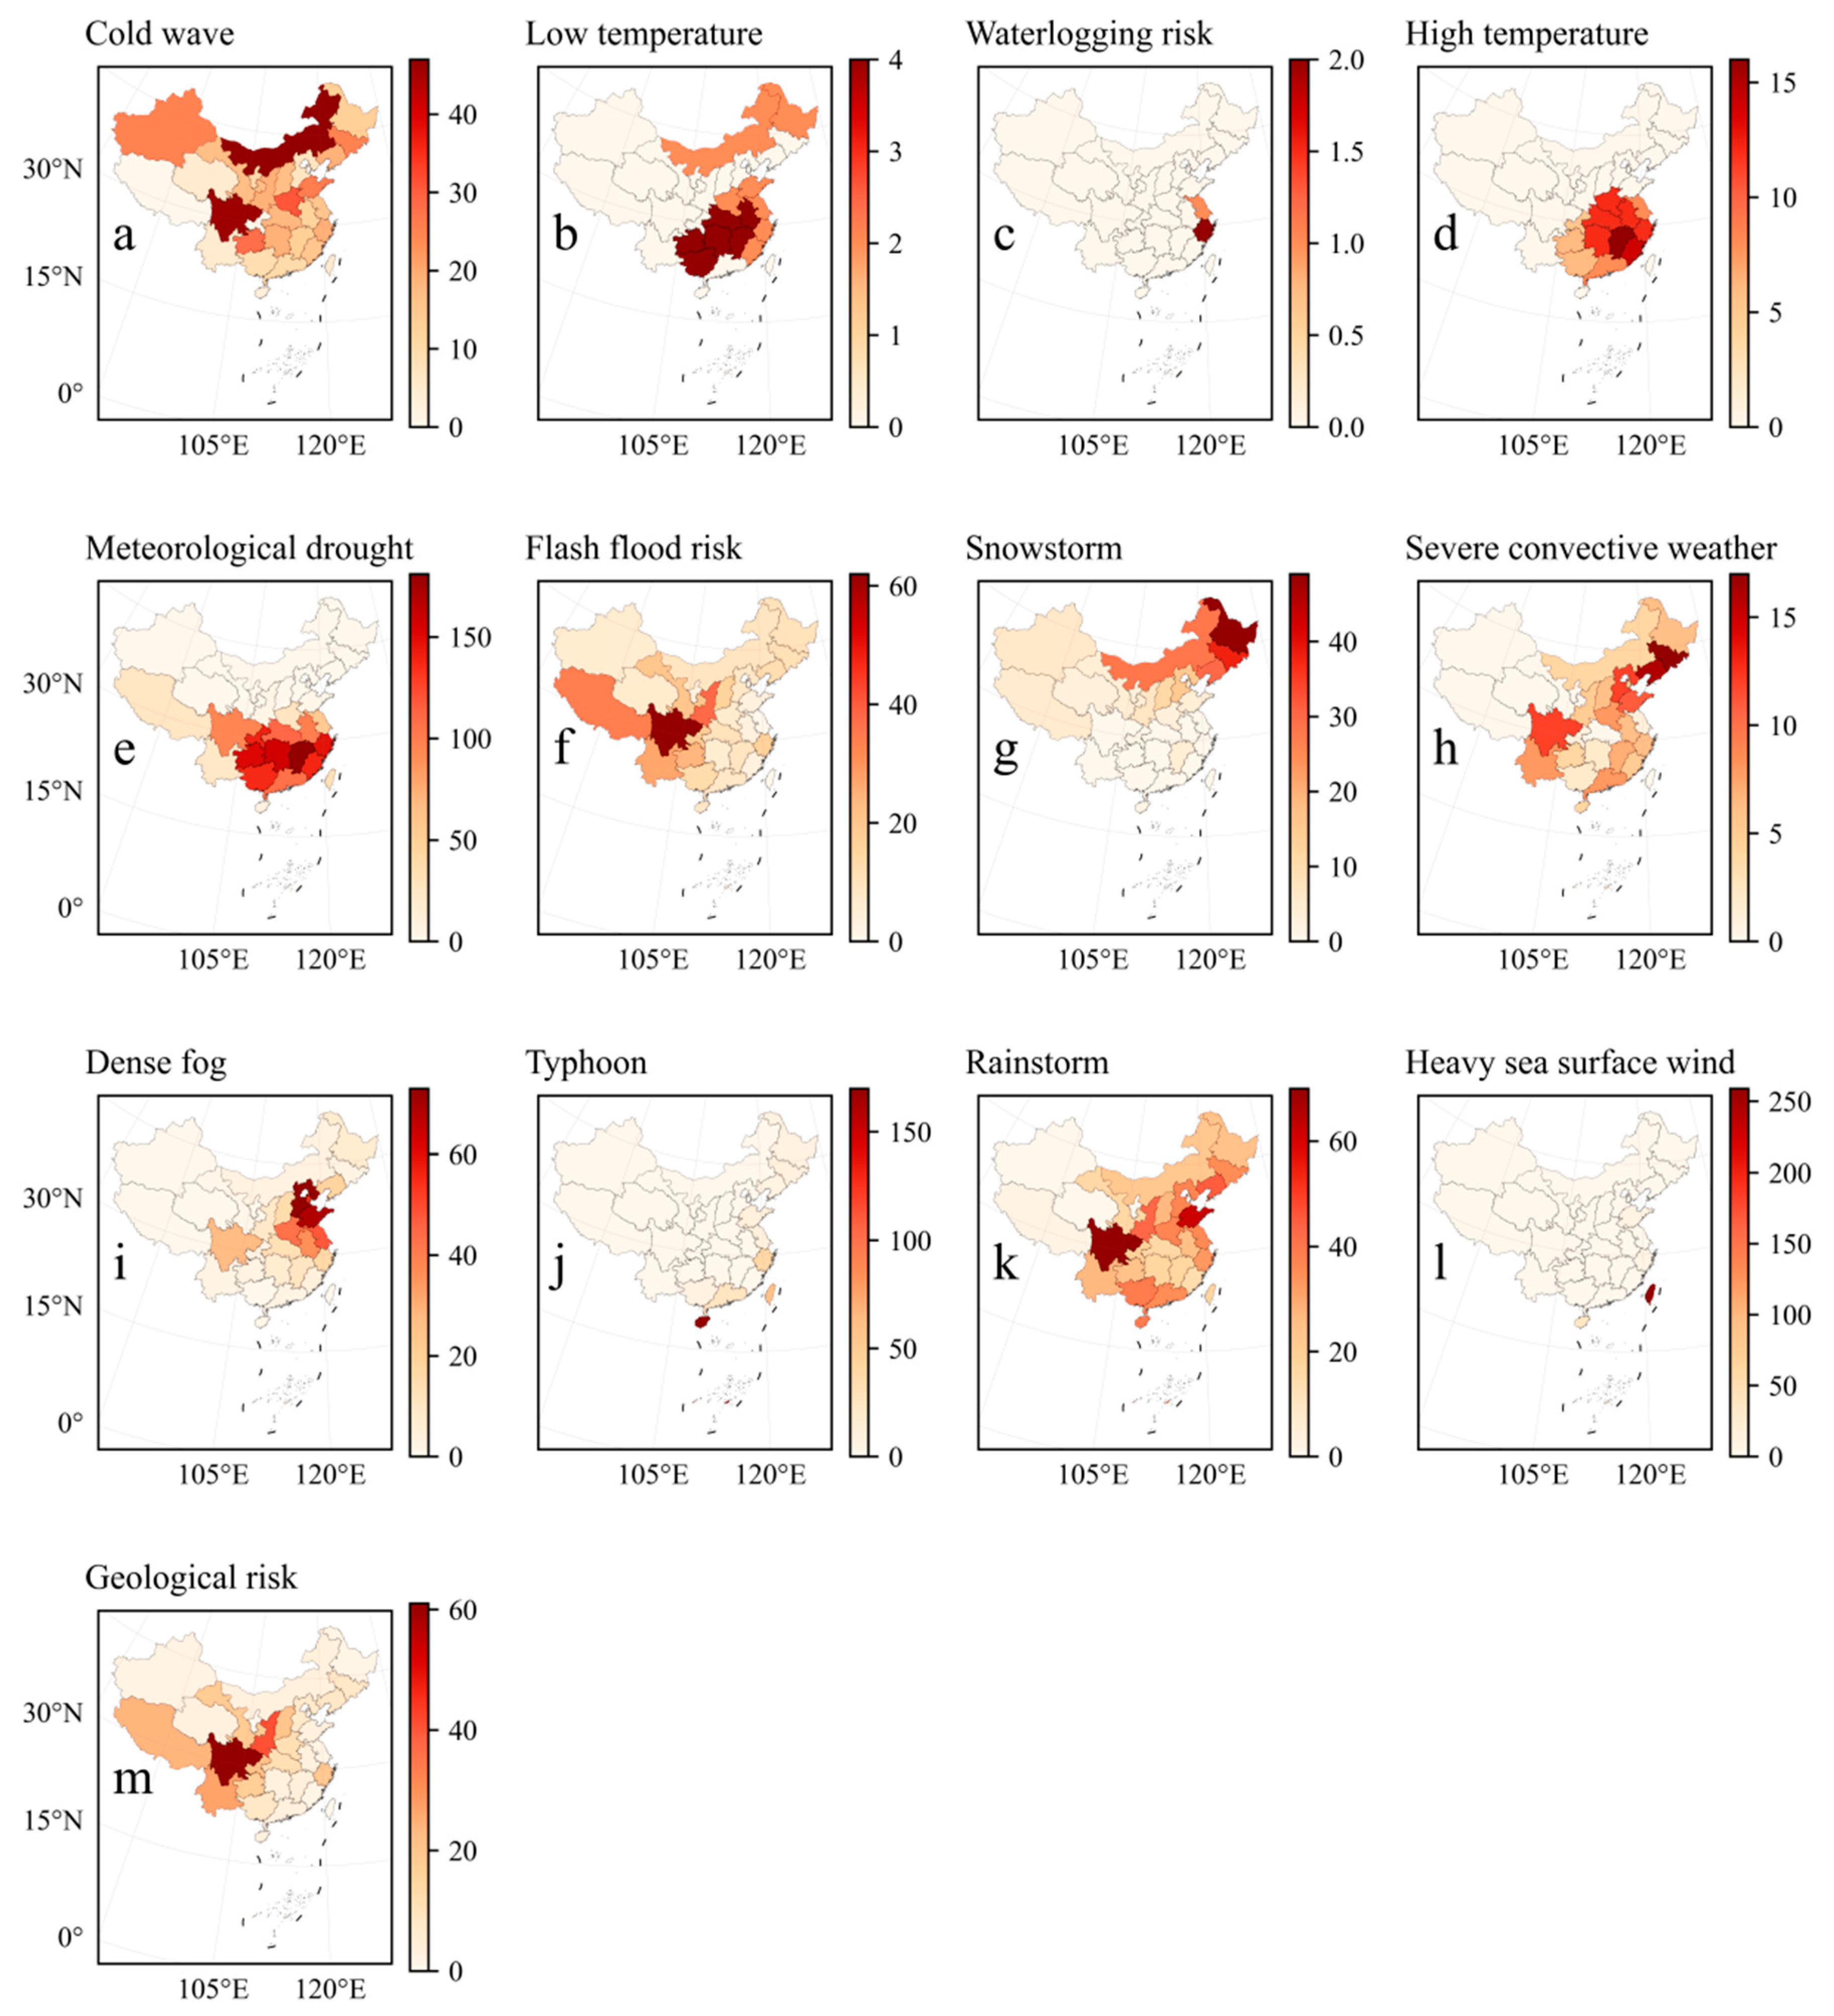
- Regionally, the most prevalent warnings were directed towards severe convection weather events in southern China, particularly affecting regions such as Jiangxi, Guangxi, and Hunan Province.
Author Contributions
Funding
Institutional Review Board Statement
Informed Consent Statement
Data Availability Statement
Acknowledgments
Conflicts of Interest
References
- Meng, M.; Zhang, J.; Wong, Y.D.; Au, P.H. Effect of weather conditions and weather forecast on cycling travel behavior in Singapore. Int. J. Sustain. Transp. 2016, 10, 773–780. [Google Scholar] [CrossRef]
- van der Velde, M.; Biavetti, I.; El-Aydam, M.; Niemeyer, S.; Santini, F.; van den Berg, M. Use and relevance of European Union crop monitoring and yield forecasts. Agric. Syst. 2019, 168, 224–230. [Google Scholar] [CrossRef]
- Bhawna, S.; Kaur, G.K.; Singh, S.S. Comparative analysis of weather forecast from different weather websites for ludhiana, punjab. Agric. Res. J. 2021, 58, 903–912. [Google Scholar] [CrossRef]
- Wang, S. Characteristics of meteorological information dissemination on websites. Adv. Meteorol. Sci. Technol. 2017, 7, 59–61. (In Chinese) [Google Scholar]
- Zhu, X.; Feng, M. A study of efficient communication channels of public weather services information. Yuejiang Acad. J. 2017, 9, 25–34+145. (In Chinese) [Google Scholar] [CrossRef]
- Li, H. Current Situation and Countermeasures of the Development of Hunan Meteorological New Media Advertising. New Media Res. 2018, 2018, 21–24. (In Chinese) [Google Scholar] [CrossRef]
- Liu, J.; Dong, Y.; Liu, Z.; Chen, D. Applying ontology learning and multi-objective ant colony optimization method for focused crawling to meteorological disasters domain knowledge. Expert Syst. Appl. 2022, 198, 116741. [Google Scholar] [CrossRef]
- Feng, Y.; Dong, W. Operation status and strategy analysis of meteorological Tiktok short video in public meteorological services. Zhejiang Meteorol. 2021, 42, 28–31. (In Chinese) [Google Scholar] [CrossRef]
- Xu, X.; Tang, Q. Meteorological disaster frequency at prefecture-level city scale and induced losses in mainland China during 2011–2019. Nat. Hazards 2021, 109, 827–844. [Google Scholar] [CrossRef]
- WMO. Mortality and Economic Losses from Weather, Climate and Water Extremes; WMO: Geneva, Switzerland, 2021. [Google Scholar]
- Li, Y.; Zhao, S.; Wang, G. Spatiotemporal variations in meteorological disasters and vulnerability in China during 2001–2020. Front. Earth Sci. 2021, 9, 789523. [Google Scholar] [CrossRef]
- Zhao, S.S.; Gao, G.; Huang, D.P.; He, W.P. Characteristics of Meteorological Disaster Losses in China from 2004 to 2013. J. Meteorol. Environ. 2017, 33, 101–107. [Google Scholar] [CrossRef]
- Ding, J.; Cuo, L.; Zhang, Y.; Zhu, F. Monthly and annual temperature extremes and their changes on the Tibetan Plateau and its surroundings during 1963–2015. Sci. Rep. 2018, 8, 11860. [Google Scholar] [CrossRef] [PubMed]
- Qi, K.; Zhu, J.; Zheng, X.; Wang, G.G.; Li, M. Impacts of the world’s largest afforestation program (Three-North Afforestation Program) on desertification control in sandy land of China. GISci. Remote Sens. 2023, 60, 2167574. [Google Scholar] [CrossRef]
- Yin, Z.; Wan, Y.; Zhang, Y.; Wang, H. Why super sandstorm 2021 in North China? Natl. Sci. Rev. 2022, 9, nwab165. [Google Scholar] [CrossRef] [PubMed]
- Wang, Y.; Zhang, Q.; Wang, S.P.; Wang, J.S.; Yao, Y.B. Characteristics of agro-meteorological disasters and their risk in Gansu Province against the background of climate change. Nat. Hazards 2017, 89, 899–921. [Google Scholar] [CrossRef]
- Shi, J.; Cui, L. Spatial and temporal characteristics of four main types of meteorological disasters in East China. Atmósfera 2020, 33, 233–247. [Google Scholar] [CrossRef]
- Ding, J.; Zhang, G.; Gao, J.; Wang, S.; Xue, B.; Wang, K.; Yang, J.; Jiang, R.; Lian, J. The rainfall thresholds and soil characteristics of large geological disasters in Zhejiang, China. Arab. J. Geosci. 2022, 15, 559. [Google Scholar] [CrossRef]
- Xuan, L.Z.; Yang, H. Performance Comparison of Machine-learning Models for Analyzing Weather and Traffic Accident Correlations. J. Inf. Commun. Converg. Eng. 2023, 21, 225. [Google Scholar] [CrossRef]
- Ali, F.; Khan, Z.H.; Khattak, K.S.; Gulliver, T.A. The effect of visibility on road traffic during foggy weather conditions. IET Intell. Transp. Syst. 2024, 18, 47–57. [Google Scholar] [CrossRef]
- Kim, S.; Park, E. Prediction of flight departure delays caused by weather conditions adopting data-driven approaches. J. Big Data 2024, 11, 11. [Google Scholar] [CrossRef]
- Parsons, L.A.; Masuda, Y.J.; Kroeger, T.; Shindell, D.; Wolff, N.H.; Spector, J.T. Global labor loss due to humid heat exposure underestimated for outdoor workers. Environ. Res. Lett. 2022, 17, 014050. [Google Scholar] [CrossRef]
- Zhang, W.; Ding, N.; Han, Y.; He, J.; Zhang, N. The impact of temperature on labor productivity-evidence from temperature-sensitive enterprises. Front. Environ. Sci. 2023, 10, 1039668. [Google Scholar] [CrossRef]
- Gibb, K.; Beckman, S.; Vergara, X.P.; Heinzerling, A.; Harrison, R. Extreme heat and occupational health risks. Annu. Rev. Public Health 2024, 45. [Google Scholar] [CrossRef] [PubMed]
- Junlapeeya, P.; Lorga, T.; Santiprasitkul, S.; Tonkuriman, A. A descriptive qualitative study of older persons and family experiences with extreme weather conditions in northern thailand. Int. J. Environ. Res. Public Health 2023, 20, 6167. [Google Scholar] [CrossRef] [PubMed]
- Li, W.; Jiang, R.; Zhao, Y.; Zhu, J.; Yang, S. Emergency management decision of urban rainstorm and flood disasters based on similar cases analysis. Nat. Hazards 2023, 116, 753–768. [Google Scholar] [CrossRef]
- Zeng, T.; Gong, Q.; Wu, L.; Zhu, Y.; Yin, K.; Peduto, D. Double-index model of landslide meteorological warning based on the I-D threshold. Bull. Geol. Sci. Technol. 2024, 43, 262–274. (In Chinese) [Google Scholar] [CrossRef]
- Wang, B.; Zhao, F.; Cheng, H.; Xu, L. Study on system methods of meteorological early warning and prediction system of geological hazards in Anhui Province. Shandong Land Resour. 2022, 38, 60–64. (In Chinese) [Google Scholar] [CrossRef]
- Hong, B.; Shao, B.; Wang, B.; Zhao, J.; Qian, J.; Guo, J.; Xu, Y.; Li, C.; Zhu, B. Using the meteorological early warning model to improve the prediction accuracy of water damage geological disasters around pipelines in mountainous areas. Sci. Total Environ. 2023, 889, 164334. [Google Scholar] [CrossRef] [PubMed]
- Li, S.; Wang, Y.; Huang, H.; Huang, L.; Chen, Y. Study on typhoon disaster assessment by mining data from social media based on artificial neural network. Nat. Hazards 2023, 116, 2069–2089. [Google Scholar] [CrossRef]
- Qin, X.; Wu, Y.; Lin, T.; Gao, L. Urban Flood Dynamic Risk Assessment Based on Typhoon Rainfall Process: A Case Study of Typhoon “Lupit”(2109) in Fuzhou, China. Remote Sens. 2023, 15, 3116. [Google Scholar] [CrossRef]
- Trošelj, J.; Nayak, S.; Hobohm, L.; Takemi, T. Real-time flash flood forecasting approach for development of early warning systems: Integrated hydrological and meteorological application. Geomat. Nat. Hazards Risk 2023, 14, 2269295. [Google Scholar] [CrossRef]
- El-Bagoury, H.; Gad, A. Integrated Hydrological Modeling for Watershed Analysis, Flood Prediction, and Mitigation Using Meteorological and Morphometric Data, SCS-CN, HEC-HMS/RAS, and QGIS. Water 2024, 16, 356. [Google Scholar] [CrossRef]
- Jin, E.Z.; Wang, Y.G.; Xu, Z.X.; Yan, X.F.; Wang, X.K. Hydrometeorological-modeling-based analysis and risk assessment of a torrential rainfall flash flood in a data deficient area in Wenchuan County, Sichuan Province, China. Stoch. Environ. Res. Risk Assess. 2024, 38, 33–50. [Google Scholar] [CrossRef]
- Li, L.; She, D.; Zheng, H.; Lin, P.; Yang, Z. Elucidating Diverse Drought Characteristics from Two Meteorological Drought Indices (SPI and SPEI) in China. J. Hydrometeorol. 2020, 21, 1513–1530. [Google Scholar] [CrossRef]
- Fu, S.; Zhang, H.; Zhong, Q.; Chen, Q.; Liu, A.; Yang, J.; Pang, J. Spatiotemporal variations of precipitation concentration influenced by large-scale climatic factors and potential links to flood-drought events across China 1958–2019. Atmos. Res. 2023, 282, 106507. [Google Scholar] [CrossRef]
- Ning, G.; Luo, M.; Bi, X.; Liu, Z.; Zhang, H.; Huang, M.; Huang, X.; Yang, Y.; Wu, S. Large-scale moisture transport and local-scale convection patterns associated with warm-sector heavy rainfall over South China. Atmos. Res. 2023, 285, 106637. [Google Scholar] [CrossRef]
- Xiao, Z.; Yao, C. Thermal and Dynamical Characteristics of Landfalling Severe Typhoons in South China against Different Monsoon Backgrounds. Atmosphere 2023, 14, 338. [Google Scholar] [CrossRef]
- Qi, Q.; Jiang, B.; Ma, W.; Marley, G. Trend analysis and spatial distribution of meteorological disaster losses in China 2022, 2004–2015. Atmosphere 2022, 13, 208. [Google Scholar] [CrossRef]
- Zhao, X.; Yu, M.; Pan, S.; Jin, F.; Zou, D.; Zhang, L. Spatio-temporal distribution and trends monitoring of land desertification based on time-series remote sensing data in northern China. Environ. Earth Sci. 2023, 82, 263. [Google Scholar] [CrossRef]
- Yan, K.; Wang, F.; Fan, G.; Liu, Y.; Nam, K.; Zhang, B. The Azijue debris flow induced by rainfall on 30 August 2020 in Ganluo County, Sichuan Province, southwestern China. Landslides 2023, 20, 771–788. [Google Scholar] [CrossRef]
- Tu, X.; Yao, R.; Hu, L.; Xu, D.; Yang, H. Observation and simulation study on the macro–microphysical characteristics of a coastal fog offshore Zhejiang Province of China. Atmos. Res. 2023, 282, 106537. [Google Scholar] [CrossRef]
- Gao, Y.; Liu, D.; Yan, S.; Zhou, W.; Wang, H.; Zu, F.; Mei, Q.; Yi, C.; Sheng, Y. Influence of sea-land breeze on the formation and dissipation of severe dense fog and its burst reinforcement in the Yellow Sea coastal area, China. Sci. China Earth Sci. 2024, 67, 432–449. [Google Scholar] [CrossRef]


| No. | Meteorological Risk | No. | Meteorological Risk |
|---|---|---|---|
| 1 | Agricultural drought | 13 | Low temperature |
| 2 | Cold wave | 14 | Low-temperature freezing risk |
| 3 | Continuously cloudy or rainy weather | 15 | Meteorological drought |
| 4 | Dense fog | 16 | Rainstorm |
| 5 | Dry and hot wind risk for winter wheat | 17 | Sandstorm |
| 6 | Flash flood risk | 18 | Severe convective weather |
| 7 | Geological risk | 19 | Snowstorm |
| 8 | Heavy sea surface wind | 20 | Strong wind |
| 9 | High temperature | 21 | Typhoon |
| 10 | High-risk forest fire | 22 | Waterlogging for summer corn |
| 11 | High-temperature risk for early-season rice | 23 | Waterlogging risk |
| 12 | High-temperature risk for single-season rice |
Disclaimer/Publisher’s Note: The statements, opinions and data contained in all publications are solely those of the individual author(s) and contributor(s) and not of MDPI and/or the editor(s). MDPI and/or the editor(s) disclaim responsibility for any injury to people or property resulting from any ideas, methods, instructions or products referred to in the content. |
© 2024 by the authors. Licensee MDPI, Basel, Switzerland. This article is an open access article distributed under the terms and conditions of the Creative Commons Attribution (CC BY) license (https://creativecommons.org/licenses/by/4.0/).
Share and Cite
Zhang, F.; Ding, J.; Chen, Y.; Yu, T.; Zhang, X.; Guo, J.; Liu, X.; Wang, Y.; Liu, Q.; Song, Y. Analysis of the Multi-Dimensional Characteristics of City Weather Forecast Page Views and the Spatiotemporal Characteristics of Meteorological Disaster Warnings in China. Atmosphere 2024, 15, 615. https://doi.org/10.3390/atmos15050615
Zhang F, Ding J, Chen Y, Yu T, Zhang X, Guo J, Liu X, Wang Y, Liu Q, Song Y. Analysis of the Multi-Dimensional Characteristics of City Weather Forecast Page Views and the Spatiotemporal Characteristics of Meteorological Disaster Warnings in China. Atmosphere. 2024; 15(5):615. https://doi.org/10.3390/atmos15050615
Chicago/Turabian StyleZhang, Fang, Jin Ding, Yu Chen, Tingzhao Yu, Xinxin Zhang, Jie Guo, Xiaodan Liu, Yan Wang, Qingyang Liu, and Yingying Song. 2024. "Analysis of the Multi-Dimensional Characteristics of City Weather Forecast Page Views and the Spatiotemporal Characteristics of Meteorological Disaster Warnings in China" Atmosphere 15, no. 5: 615. https://doi.org/10.3390/atmos15050615
APA StyleZhang, F., Ding, J., Chen, Y., Yu, T., Zhang, X., Guo, J., Liu, X., Wang, Y., Liu, Q., & Song, Y. (2024). Analysis of the Multi-Dimensional Characteristics of City Weather Forecast Page Views and the Spatiotemporal Characteristics of Meteorological Disaster Warnings in China. Atmosphere, 15(5), 615. https://doi.org/10.3390/atmos15050615