Article

Impact of Meteorological Conditions on PM2.5 Pollution in Changchun and Associated Health Risks Analysis

1
College of New Energy and Environment, Jilin University, Changchun 130015, China
2
Key Laboratory of Groundwater Resources and Environment, Ministry of Education, Jilin University, Changchun 130015, China
3
Jilin Province Key Laboratory of Water Resources and Environment, Jilin University, Changchun 130015, China
*
Author to whom correspondence should be addressed.
Atmosphere 2024, 15(5), 616; https://doi.org/10.3390/atmos15050616
Submission received: 10 April 2024 / Revised: 5 May 2024 / Accepted: 15 May 2024 / Published: 20 May 2024
(This article belongs to the Section Air Quality and Health)

Abstract

:
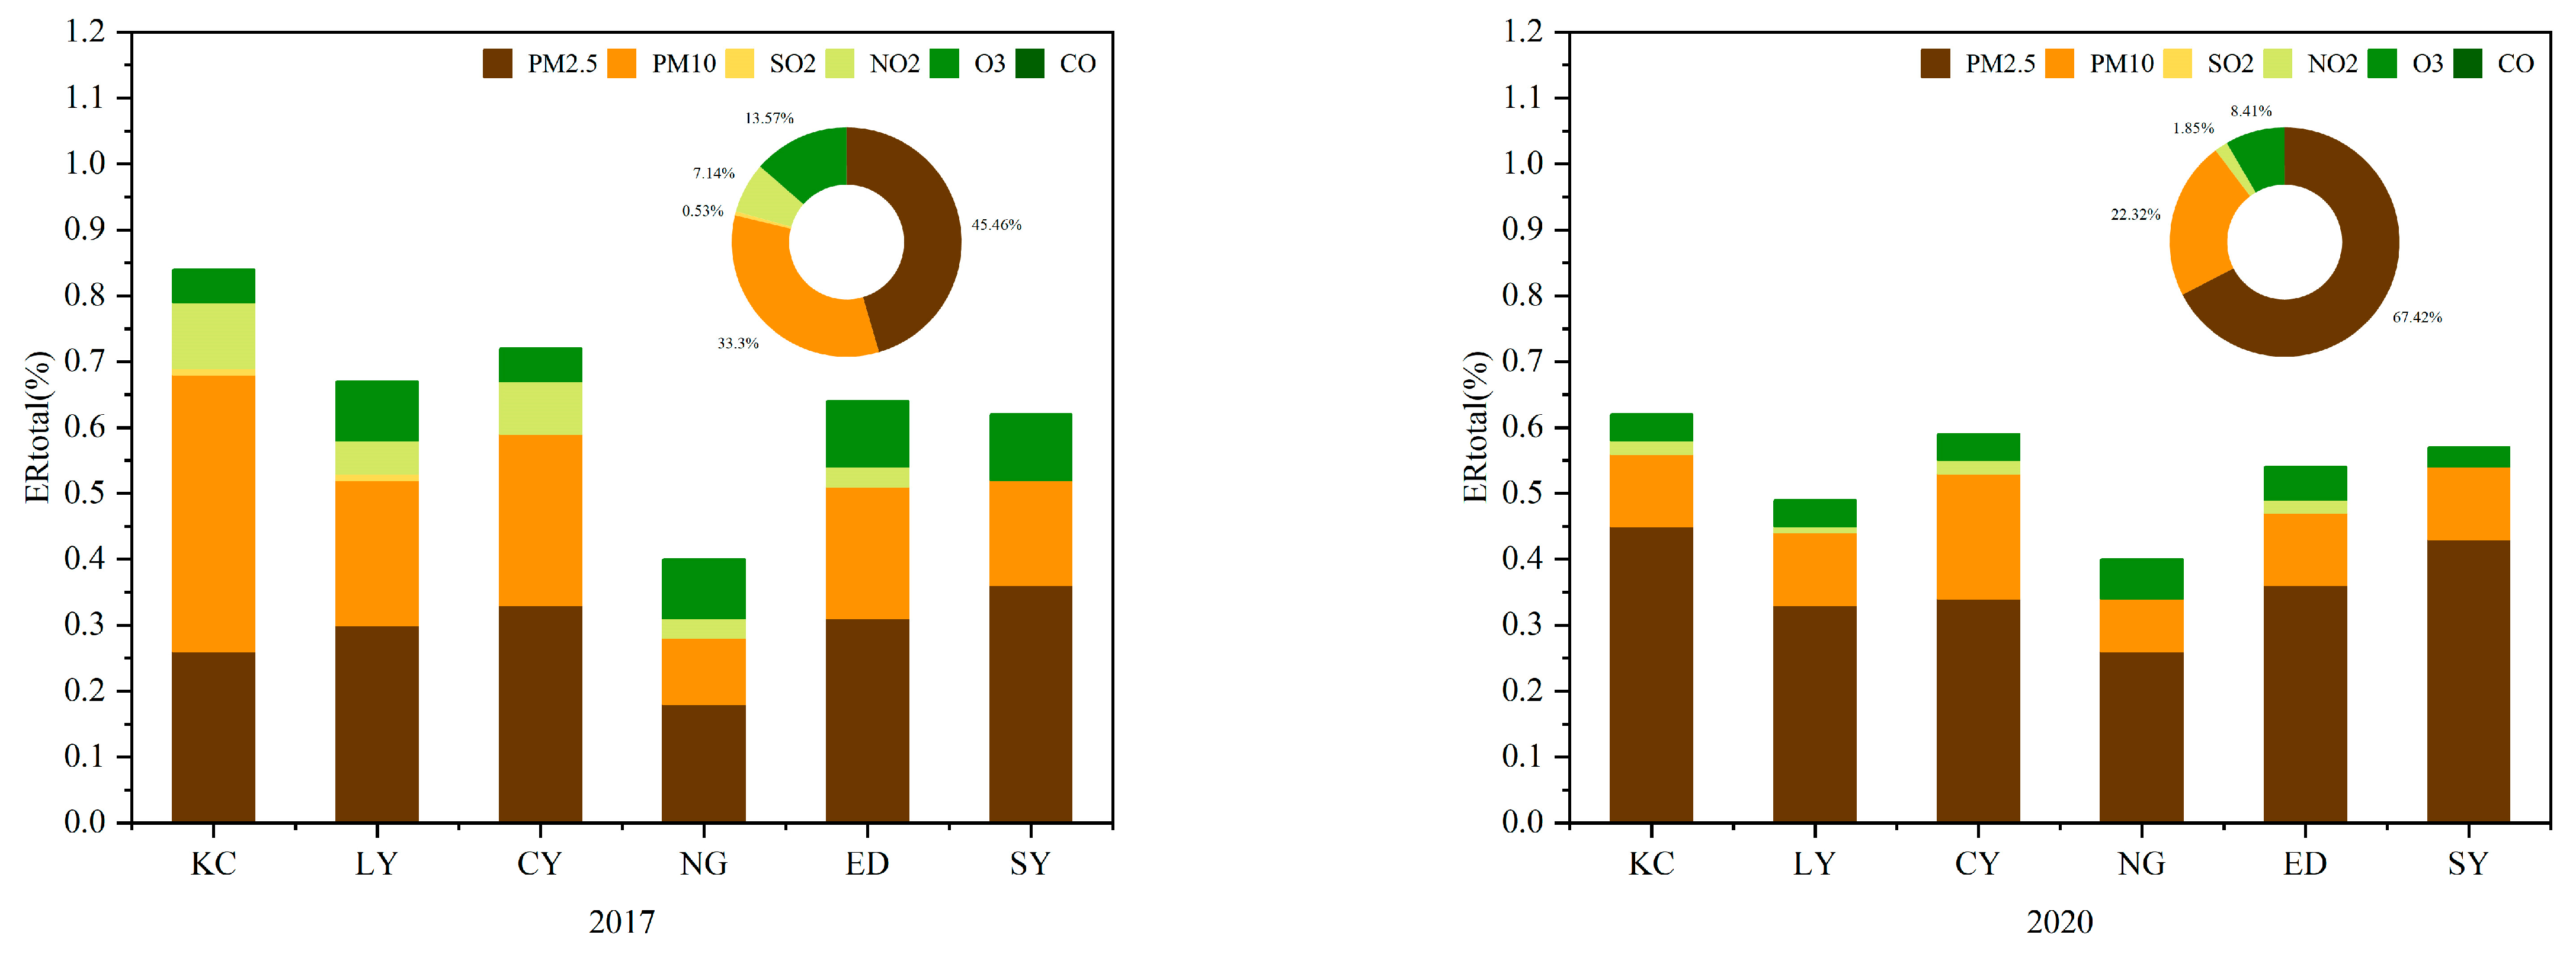
The escalating concern regarding increasing air pollution and its impact on the health risks associated with PM2.5 in developing countries necessitates attention. Thus, this study utilizes the WRF-CMAQ model to simulate the effects of meteorological conditions on PM2.5 levels in Changchun, a typical city in China, during January 2017 and January 2020. Additionally, it introduces a novel health risk-based air quality index (NHAQI) to assess the influence of meteorological parameters and associated health risks. The findings indicate that in January 2020, the 2-m temperature (T2), 10-m wind speed (WS10), and planetary boundary layer height (PBLH) were lower compared to those in 2017, while air pressure exhibited a slight increase. These meteorological parameters, characterized by reduced wind speed, heightened air pressure, and lower boundary layer height—factors unfavorable for pollutant dispersion—collectively contribute to the accumulation of PM2.5 in the atmosphere. Moreover, the NHAQI proves to be more effective in evaluating health risks compared to the air quality index (AQI). The annual average decrease in NHAQI across six municipal districts from 2017 to 2020 amounts to 18.05%. Notably, the highest health risks are observed during the winter among the four seasons, particularly in densely populated areas. The pollutants contributing the most to the total excess risk (ERtotal) are PM2.5 (45.46%), PM10 (33.30%), and O3 (13.57%) in 2017, and PM2.5 (67.41%), PM10 (22.32%), and O3 (8.41%) in 2020. These results underscore the ongoing necessity for PM2.5 emission control measures while emphasizing the importance of considering meteorological parameters in the development of PM2.5 reduction strategies.

1. Introduction

In recent years, rapid urbanization and industrialization have propelled the country’s economy forward and enhanced the convenience of people’s lives. However, this progress has also led to the emergence of air pollution issues in many Chinese cities, particularly concerning fine particulate matter (PM2.5) pollution [1,2]. PM2.5 refers to fine particulate matter with a diameter less than 2.5 μm, originating primarily from human activities’ primary PM2.5 emissions and natural sources, as well as secondary PM2.5 generated through chemical reactions with other substances upon entering the atmospheric environment [3,4]. Numerous studies have demonstrated that meteorological conditions play a significant role in influencing the mass concentration of PM2.5 and, consequently, urban air quality. For instance, a study conducted in Northern China revealed a positive correlation between relative humidity and PM2.5 levels, whereas wind speed exhibited a negative correlation with PM2.5 [5]. In addition to relative humidity and wind speed, PM2.5 levels were found to be negatively correlated with surface temperature and planetary boundary layer height (PBLH) in previous studies [5,6]. The study by Zhai et al. confirmed that meteorological conditions significantly contribute to the variability of air quality in many regions of China [4]. Air quality models are frequently employed to gain a comprehensive understanding of and forecast air pollution issues. For instance, the Weather Research and Forecasting/Community Multiscale Air Quality (WRF-CMAQ) model enables the quantification of the impacts of anthropogenic emissions and meteorological conditions on PM2.5 [7,8]. Related studies have demonstrated that the interannual variation in atmospheric pollutant concentrations (e.g., PM2.5, NO2, and O3) and inter-city pollution transport processes in the Beijing-Tianjin-Hebei and Eastern provinces regions are influenced not only by anthropogenic emissions but also by meteorological conditions that cannot be overlooked [9,10,11].
Furthermore, excessive air pollutants not only degrade the quality of the air environment but also exert a significant impact on human health and climate change [12,13]. Past epidemiological research has indicated that atmospheric pollutants contribute to a range of human diseases, including lung diseases, respiratory ailments, cardiovascular disorders, and even malignancies [14,15,16]. Moreover, they lead to elevated morbidity and premature mortality among exposed populations. A study conducted in the Beijing-Tianjin-Hebei region revealed that exposure to PM2.5 resulted in 120,000 premature deaths (95% CI: 80,000, 150,000) in the region in 2013 [17]. In a nationwide study conducted across China, it was determined that 1.8 million premature deaths were attributable to PM2.5 exposure in 2017 (95% CI: 1.6 million, 2 million), marking a 31% increase compared to 2005 [18]. Atmospheric pollutants also influence the spread of epidemics, as evidenced by several studies correlating the number of novel coronavirus infections (COVID-19) with air pollutants [19,20,21,22].
In 2012, China introduced the latest Ambient Air Quality Standards (AAQS), which provide detailed guidelines on the utilization of the Air Quality Index (AQI). AQI serves as a crucial indicator for assessing air quality, and numerous studies have explored the relationship between AQI changes and pollutants [23,24]. However, due to AQI’s reliance on the maximum calculated value among six pollutants, it may not adequately characterize overall air quality or assess the adverse effects of individual pollutants on public health. To address this limitation, Kyrkilis et al. and Hu et al. proposed the aggregate air quality index (AAQI) and health risk-based air quality index (HAQI) as alternatives to AQI [25,26]. Subsequently, Ma et al. introduced an enhanced version of HAQI to improve its accuracy. Several subsequent studies utilizing HAQI have demonstrated its superior effectiveness over AQI in assessing population health [27,28,29].
The rapid onset and global dissemination of COVID-19, which emerged around the Chinese New Year in 2020, prompted stringent quarantine measures by the Chinese government. These measures included the implementation of town and city lockdowns and restrictions on transportation. Consequently, emissions of most air pollutants decreased, leading to significant changes in air quality. This provided a unique opportunity to investigate the impacts of anthropogenic emissions and meteorological conditions on air quality [30,31]. Some studies have revealed that in certain areas, air pollution levels were more pronounced in January 2020 compared to previous years, indicating a correlation between reduced social activity and heightened pollution levels [32,33]. This observation warrants further attention and investigation.
As the capital city of Jilin Province, Changchun is situated in the heart of Northeast China. Its primary industries revolve around automobile manufacturing and agricultural product processing. However, the city also grapples with environmental pollution and associated public health issues due to frequent biomass burning and high coal consumption, factors that cannot be overlooked [32]. However, most recent studies have predominantly focused on regions such as Beijing-Tianjin-Hebei, the Yangtze River Delta, the Pearl River Delta, and Southwest China, leaving fewer studies conducted in other areas. In light of this gap, this paper selects Changchun as the study area and utilizes the WRF-CMAQ model to examine the influence of meteorological conditions on PM2.5 concentrations in Changchun during January 2017 and January 2020. Additionally, it assesses the health risks associated with air pollutants in these two time periods based on the enhanced HAQI. The findings of this study aim to provide valuable insights for policymakers in formulating more effective emission reduction strategies.

2. Data and Methods

2.1. Data Collection

The hourly mass concentration data of PM2.5 pollutants utilized in this study were sourced from the publication platform of the China National Environmental Monitoring Center (CNEMC, http://106.37.208.233:20035/ (accessed on 7 April 2023)). Specifically, the data were collected from 10 state-controlled automatic atmospheric environmental monitoring stations and one meteorological monitoring station located in Changchun (Table 1). All data underwent pre-processing in accordance with the Technical Regulation for Ambient Air Quality Assessment. This involved excluding spatial and temporal anomalies in the monitoring results to ensure data quality. The number of valid data obtained adhered to the relevant regulations outlined in the Ambient Air Quality Standards (AAQS). Ground-based meteorological monitoring data in Changchun were obtained from the China Meteorological Data Service Center (CMDSC, http://data.cma.cn (accessed on 10 April 2023)), and rigorous quality checks were conducted on the data to evaluate the WRF model.

2.2. Model Configuration

In this study, the WRF-CMAQ model was employed to simulate the spatial and temporal distribution of PM2.5 concentration (versions WRF v3.9.1 and CMAQ v5.3.2). Figure 1 illustrates the three-level nested domains of the study area. The outermost domain encompassed the three northeastern provinces with a grid resolution of 27 km × 27 km; the middle domain covered Jilin province with a grid resolution of 9 km × 9 km; and the innermost domain focused on Changchun with a grid resolution of 3 km × 3 km. The initial and boundary conditions for the meteorological inputs in the WRF model were obtained from the National Centers for Environmental Prediction (NCEP) final analysis data (FNL), featuring a temporal resolution of 6 h and a spatial resolution of 1.0° × 1.0°. The gridded emission inventory required for the CMAQ model was derived from the Multi-scale Emission Inventory Model for China (MEIC, http://meicmodel.org/ (accessed on 16 March 2023)), developed by Tsinghua University. This study utilized the 2017 regional anthropogenic source pollutant and greenhouse gas (GHG) emission data from Tsinghua University’s emission source inventory for China, encompassing SO2, NOx, CO, NH3, VOCs, PM2.5, PMcoarse, BC, OC, CO2, and other pollutants. VOCs were allocated based on the CB06 atmospheric chemistry mechanism. The inventory provided gridded emission data for various pollutants at a horizontal resolution of 0.25°, categorized into five sectors: power, industry, residential, transport, and agriculture [34,35]. To conform the emission inventory data to the input format required by the CMAQ model, the Inventory Spatial Allocation Tools (ISAT) were utilized for further spatial and temporal allocation of the emission inventory [36]. Spatial allocation coefficients were established based on town grid data for electricity sources, road network grid data for transportation sources, farmland grid data for agricultural sources, industrial grid data for industrial and mining sources, and GDP grid data for residential sources.

2.3. Evaluation Indicators

In order to evaluate the effectiveness of WRF-CMAQ simulations, six statistical indicators, namely correlation coefficient I, mean fraction bias (MFB), mean fraction error (MFE), normalized mean bias (NMB), normalized mean error (NME), and Root Mean Square Error (RMSE), are used to validate the system simulation results. R indicates the degree of agreement between the simulated value and the trend of the monitored value, with a value closer to 1 indicating better simulation quality. MFB reflects the fractional bias of the simulated value from the mean of the monitored value, while MFE represents the mean absolute error of the simulated value from the mean of the monitored value. NMB reflects the average direction and degree of bias from the monitored value, while NME indicates the average absolute degree of bias from the monitored value for each simulated value. RMSE is a commonly used measure of the accuracy of a model’s predictions and is used to measure the degree of discrepancy between observations and model predictions. The meteorological parameters evaluated included temperature at 2 m (T2), wind speed at 10 m (WS10), and wind direction at 10 m (WD10), and the pollutant evaluated was PM2.5. Emery et al. [37] and Boylan and Russell et al. [38] proposed that the model performance criteria are considered satisfactory when −60% ≤ MFB ≤ 60% and MFE ≤ 75%, or when NMB ≤ ±30% and NME ≤ 50%, and R ≥ 0.40. The specific formulas for the six indicators are as follows [39]:
R = i = 1 N m i m ¯ O i O ¯ i = 1 N m i m ¯ 2 i = 1 N O i O ¯ 2
N M B = i = 1 N m i O i i = 1 N O i
N M E = i = 1 N m i O i i = 1 N O i
M F B = 1 N i = 1 N m i O i ( O i + m i ) / 2
M F E = 1 N i = 1 N m i O i ( O i + m i ) / 2
R M S E = 1 N i = 1 N m i O i 2
where N is the number of samples, mi is the simulation result at moment i, Oi is the monitoring result at moment i, m ¯ is the mean value of the simulation result, and O ¯ is the mean value of the monitoring result.

2.4. Health Assessment

2.4.1. AQI

Referring to the Ambient Air Quality Standards (AAQS) and the Technical Regulation on Ambient Air Quality Index, the air quality sub-index (AQIi) for individual pollutant i is calculated using Equation (7), and the total AQI for six pollutants is calculated using Equation (8), as follows:
A Q I i = A Q I i , j A Q I i , j 1 C i , j C i , j 1 × C i , m C i , j 1 + A Q I i , j 1 , j > 1
A Q I i = A Q I i , 1 × C i , m C i , 1 , j = 1
A Q I = m a x A Q I 1 , A Q I 2 , , A Q I n , n = 1 , 2 , , 6
where i is the pollutant category, j is the health risk category, Ci,m is the observed concentration of pollutant i, AQIi,j and AQIi,j−1 are the maximum limits of AQI corresponding to the jth and j−1th risk category nearest to the observed concentration of pollutant i, and Ci,j and Ci,j−1 are the maximum limits of concentration corresponding to the jth and j−1th risk category nearest to the observed concentration of pollutant i, respectively. The range of AQI values and the corresponding pollutant concentration limits and health categories obtained from the Ministry of Ecology and Environment of China are shown in Table 2.

2.4.2. Novel Health Risk-Based Air Quality Index (NHAQI)

The excess risk (ER) of the pollutant was introduced to represent HAQI [26]. In this case, the relative risk of pollutant i (RRi) is calculated as follows:
R R i = exp β i C i , m C i , 0 , C i , m > C i , 0
where β i is the exposure-response relationship coefficient that can represent the excess health risk associated with each unit increase in concentration of pollutant i. According to Shang et al. [40], each 1 µg/m3 increase in the concentration of six pollutants: PM2.5, PM10, SO2, NO2, and O3, corresponds to 0.038%, 0.032%, 0.081%, 0.13%, and 0.048%, of β i ; each 1 mg/m3 increase in the concentration of CO corresponds to β i is 3.7%. Ci,m is the observed concentration of pollutant i and Ci,0 is the baseline concentration of pollutant i, which is the maximum health concentration limit, using the upper limit of pollutant concentration of the AAQS 24-h secondary standard (Table 2). In particular, when Ci,m is less than or equal to Ci,0, RRi = 1, which is considered a health risk at this time. The ERi for pollutant i is calculated as follows:
E R i = R R i 1
The total ER for all six pollutants is calculated as follows:
E R t o t a l = i = 1 n E R i = i = 1 n R R i 1
where ERtotal was classified as an arbitrary index between 0 and 10 in the study by Cairncross et al. [41] to represent the excess health risk from air pollution. Hu et al. defined C i , m * to represent the equivalent concentration of pollutant i when ERi equals ERtotal [26], and if we use Equation (13) to calculate C i , m * directly, it may lead to high results in subsequent calculations of HAQI, so this study used the novel HAQI (NHAQI) instead of HAQI [29]. Using the segmentation function, when C i , m C i , 0 , i.e., the observed concentration of pollutant i does not cause additional health risk, the observed concentration Equation (14) is still used; when C i , m > C i , 0 , i.e., the observed concentration of pollutant i causes additional health risk, Equation (13) is used to calculate. In addition, the equivalent relative risk ( R R i * ) of pollutant i is calculated as follows:
R R i * = E R t o t a l + 1 = exp β i C i , m * C i , 0
C i , m * = ln R R i * β i + C i , 0 ,     C i , m > C i , 0
C i , m * = C i , m ,     C i , m C i , 0
The equivalent concentration of pollutant i, C i , m * is used instead of Ci,m to calculate NHAQIi, which is calculated as follows:
N H A Q I i = A Q I i , j A Q I i , j 1 C i , j C i , j 1 × C i , m * C i , j 1 + A Q I i , j 1 ,    j > 1
N H A Q I i = A Q I i , 1 × C i , m * C i , 1 ,    j = 1
N H A Q I = m a x N H A Q I 1 ,   N H A Q I 2 , , N H A Q I n , n = 1 , 2 , , 6

2.5. Scenario Settings

To evaluate the influence of meteorological conditions on the change of PM2.5 in Changchun City in January 2017 and January 2020, this study utilized the emission inventory of 2017 and meteorological data of 2017 for WRF-CMAQ model simulation in January 2017. Similarly, for January 2020, the emission inventory of 2017 and meteorological data of 2020 were used for the WRF-CMAQ model simulation. This approach allows for the investigation of the impact of meteorological conditions on air quality in 2020 through simulations. The details are summarized in Table 3.

3. Results and Discussion

3.1. Model Performance

3.1.1. WRF Model

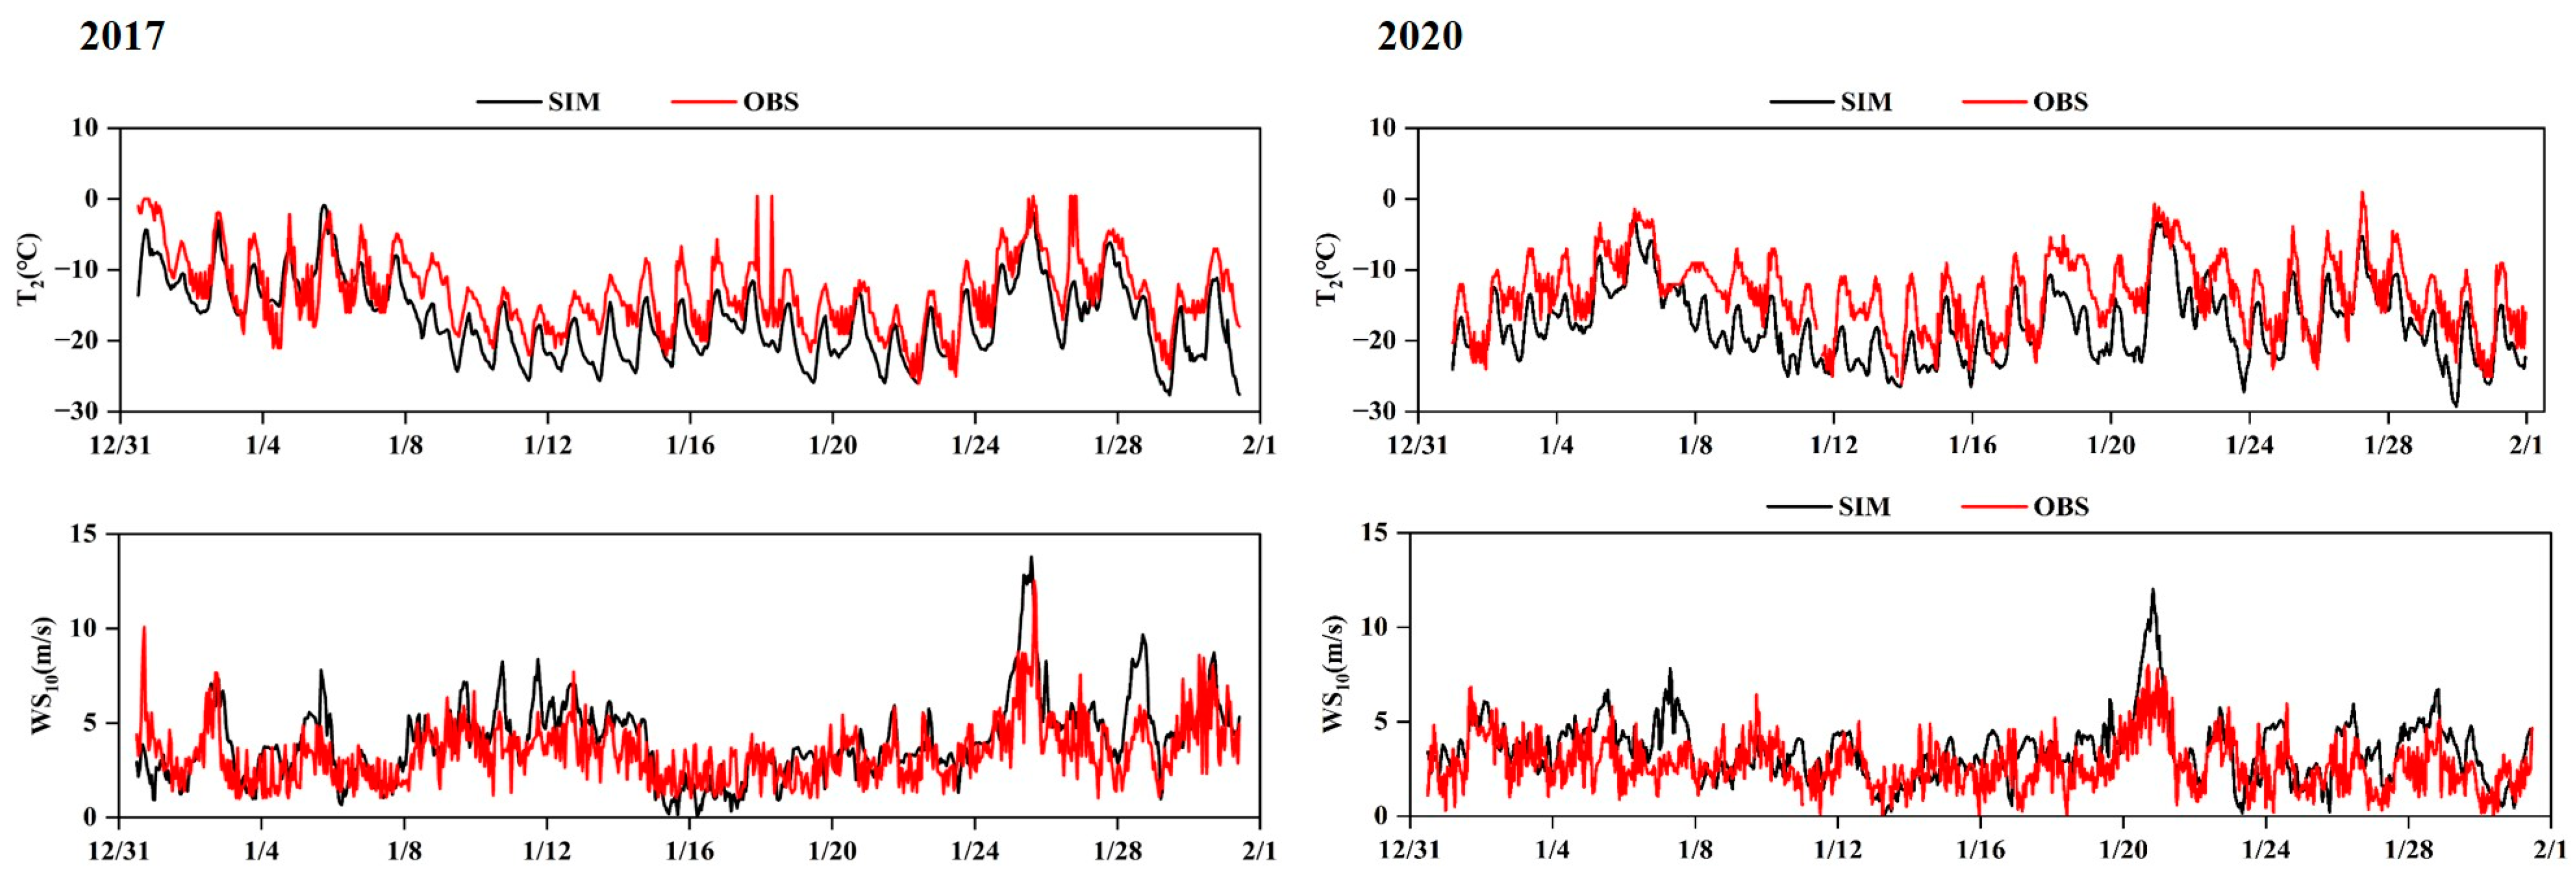
In this study, the accuracy of the WRF model simulation is initially verified, focusing on meteorological parameters including T2, WS10, and WD10. The comparison of the WRF model simulation results with the monitoring results is presented in Table 4 and Figure 2. It is evident that the WRF model effectively replicates the peaks and trends of meteorological parameters. Regarding meteorological parameters in 2017, the simulated value of T2 in January was recorded as −16.72 °C, which is 3.57 °C lower than the observed value. Conversely, the simulated mean values of wind speed and direction in January are higher than the monitored mean by 0.62 m/s and 17.7°, respectively, indicating minor differences.
In 2020, T2 followed a similar trend as observed in 2017, displaying lower values than the observed ones. This underestimation of T2 by the model is consistent with findings from other studies, suggesting a possible correlation with the physicochemical scheme employed in the model [42,43]. Overall, the R of T2, WS10, and WD10 are all above 0.5, indicating a strong correlation. The R of WS10 and WD10 are lower than those of T2, which is consistent with the results of other scholars, suggesting relatively poorer simulation accuracy for wind speed and direction compared to T2 due to the subsurface effects on the surface wind field. In terms of NMB, NME, MFB, MFE, and RMSE, January 2017 is simulated better than January 2020 for all three meteorological parameters. This difference in simulation quality between the two time periods may be attributed to frequent and drastic meteorological changes in July 2020. Notably, the NMB for T2 in 2020 reaches 74.22%, which may be related to limitations in the planetary boundary layer scheme and microphysical scheme used in the present model for temperature simulation [44]. Overall, the WRF model effectively captures meteorological parameters such as T2 and WS10, providing relatively accurate input data for the CMAQ model.

3.1.2. CMAQ Model

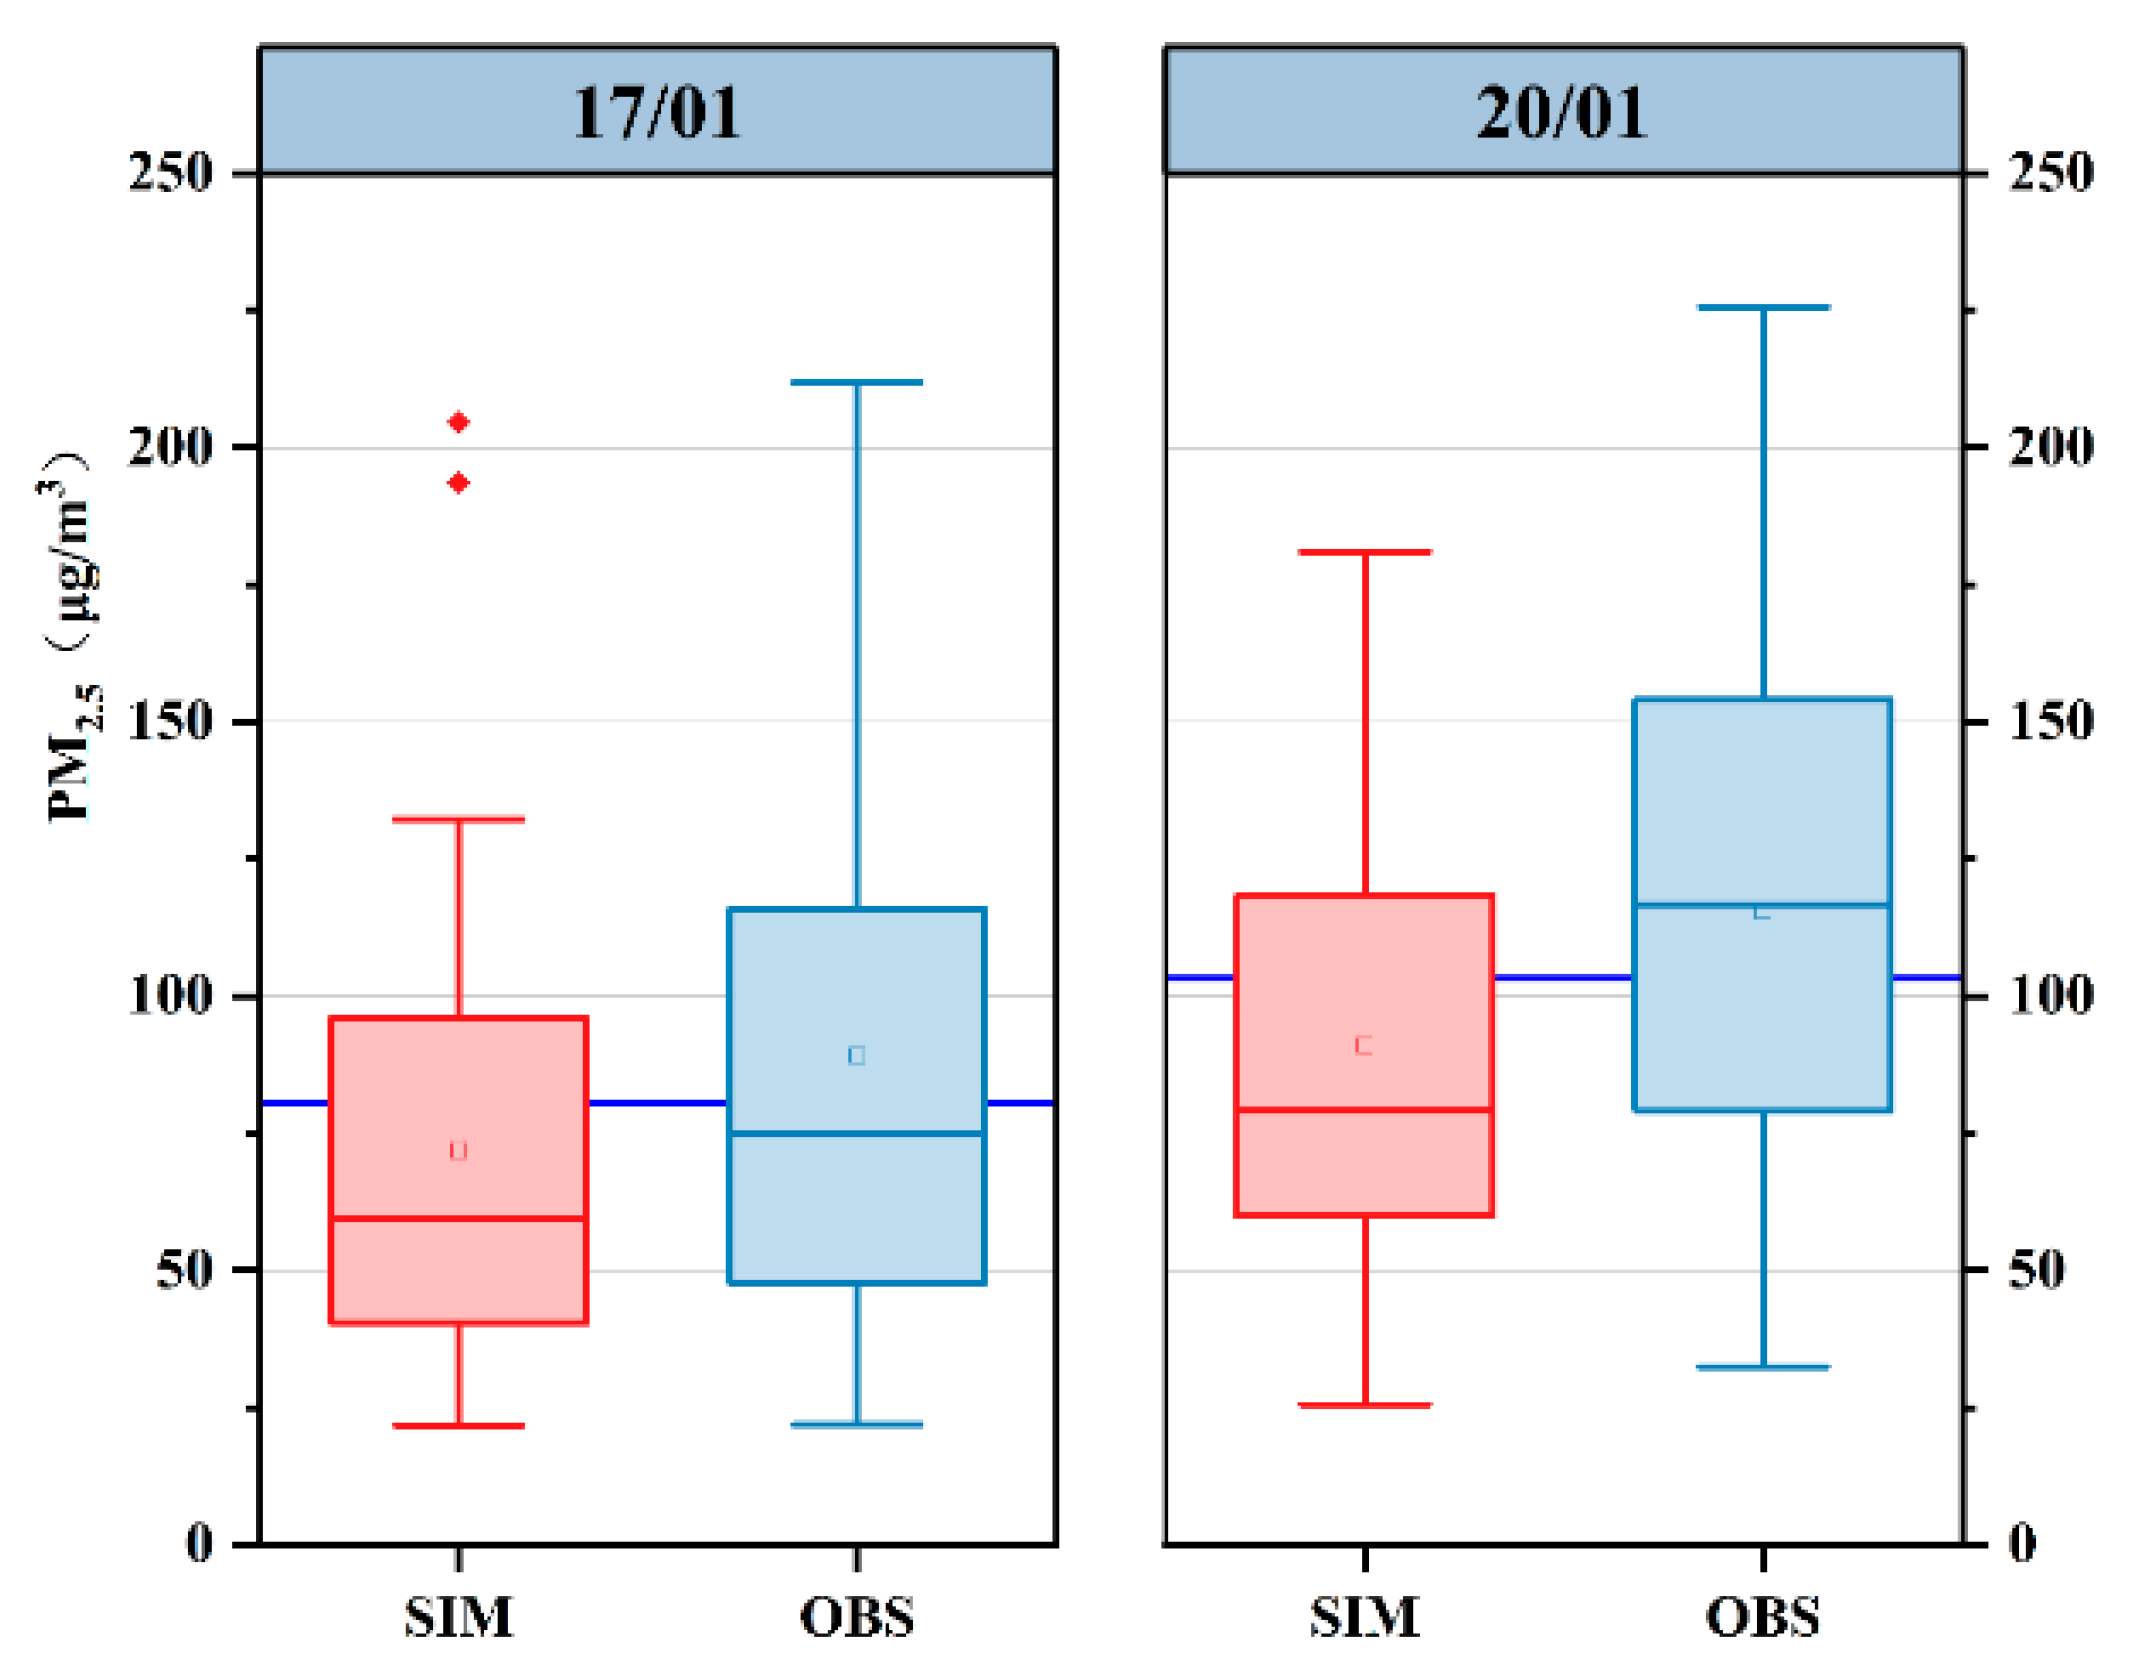
The CMAQ model was employed to simulate the same time period as the WRF model. Figure 3 presents box plots of simulated and monitored PM2.5 values in Changchun for January 2017 and 2020. It is evident that the simulated PM2.5 values for both 2017 and 2020 are slightly lower than the observed values. Specifically, the simulated average PM2.5 value in January 2017 was 71.95 μg/m3, whereas the observed average value was 89.23 μg/m3. In January 2020, the simulated average PM2.5 value was 91.14 μg/m3, while the observed average value was 115.10 μg/m3. Notably, the simulated average PM2.5 value in January 2020 was 26.7% higher than that in January 2017, while the observed average value was 28.9% higher. The difference between the two is relatively small.
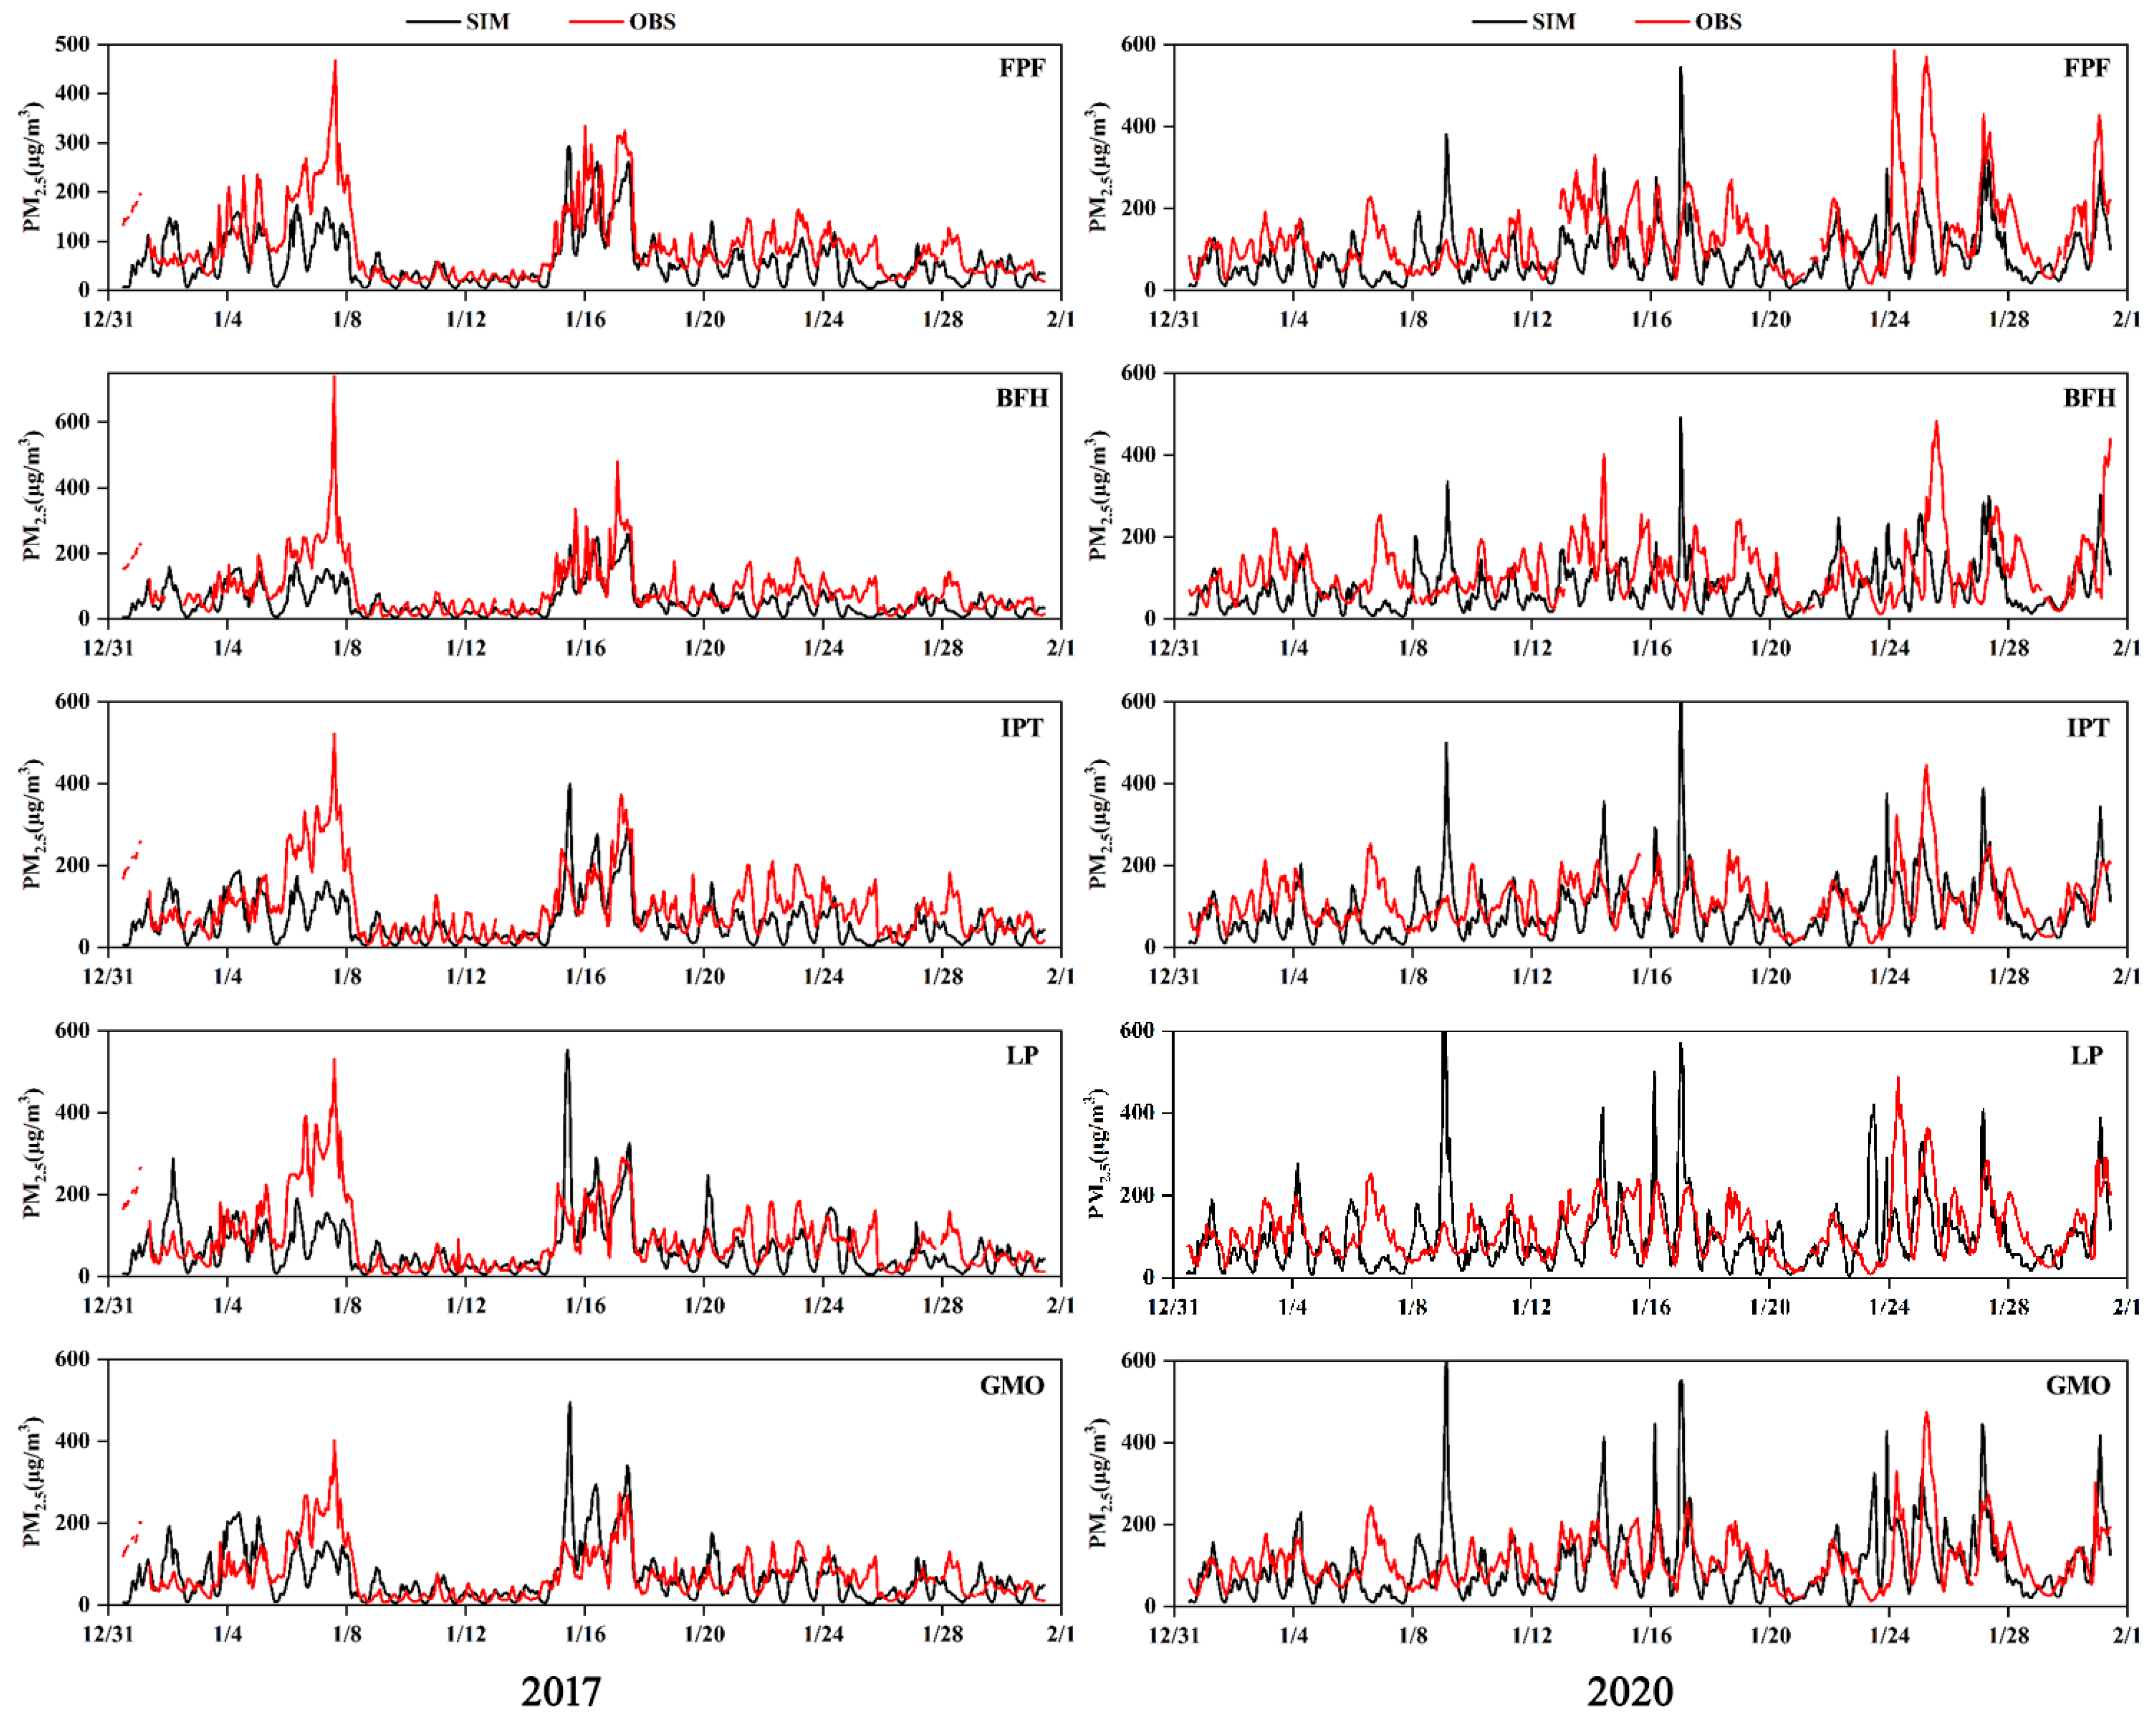
To evaluate the simulation results of the CMAQ model, PM2.5 hourly monitoring data from five national air quality monitoring stations located in the built-up area of Changchun were selected for validation, as shown in Figure 4. Table 5 presents the statistical results of PM2.5 concentration simulation compared to monitoring values. It is evident that the simulation performance for January 2017 is significantly better than that for January 2020, with the former outperforming the latter in all evaluation indicators. Overall, the NMB values ranged from 0.042 to 0.41, and the NME values ranged from 0.48 to 0.61 for all sites in both years, with an average NMB value of 0.26 and an average NME value of 0.59. The higher NME may be attributed to uncertainties in the parameter program and the emission inventories [45,46]. Furthermore, the MFB and MFE of all sites satisfy the criteria of −60% ≤ MFB ≤ 60%, and MFE ≤ 75%. In summary, the validation results of the CMAQ model are acceptable for subsequent analysis.
Observing Figure 4, it is evident that the CMAQ model effectively captures the peak variations of pollutants, and the observed and simulated values exhibit similar trends. Notably, the model performs well in simulating heavy pollution episodes from 15–17 January 2017. However, it is observed that the IPT, LP, and GMO sites tend to overestimate PM2.5 pollution levels. Overall, the simulated values for each site tend to be lower, resulting in an underestimation of PM2.5 pollution from 6–8 January 2017 and 24–28 January 2020. This discrepancy may stem from deviations between the inventory building results and actual source emissions, particularly in terms of spatial and temporal distribution. Additionally, some bias may be present in the topographic resolution and the WRF-CMAQ model’s representation of complex topographic meteorological fields and pollutant concentration distribution fields. Therefore, in alignment with previous findings, it can be concluded that meteorological conditions in January 2020 were more unfavorable for pollutant dispersion compared to January 2017, resulting in higher PM2.5 concentrations [32,33].

3.1.3. The Influence of Meteorological Parameters on PM2.5

To investigate the influence of meteorological parameters on PM2.5 concentrations, this paper compares the differences between 2017 and 2020 based on meteorological parameters such as T2, WS10, air pressure, and PBLH. Figure 5a depicts the temperature trends for January 2017 and 2020. The average temperature in January 2017 was −16.7 °C, whereas the average temperature in January 2020 was −17.8 °C, indicating a 1.1 °C lower temperature in 2020 compared to 2017. Figure 5b,c illustrate that the overall wind speed is lower in 2020 than in 2017, with the average wind speed in January 2017 being 4.04 m/s and the average wind speed in January 2020 being 3.47 m/s. Notably, during the period of severe pollution from 24–28 January 2020, wind speeds were significantly lower compared to the same period in 2017. Lower wind speeds are more conducive to the accumulation of pollutants, which raises concerns regarding air quality during this period.
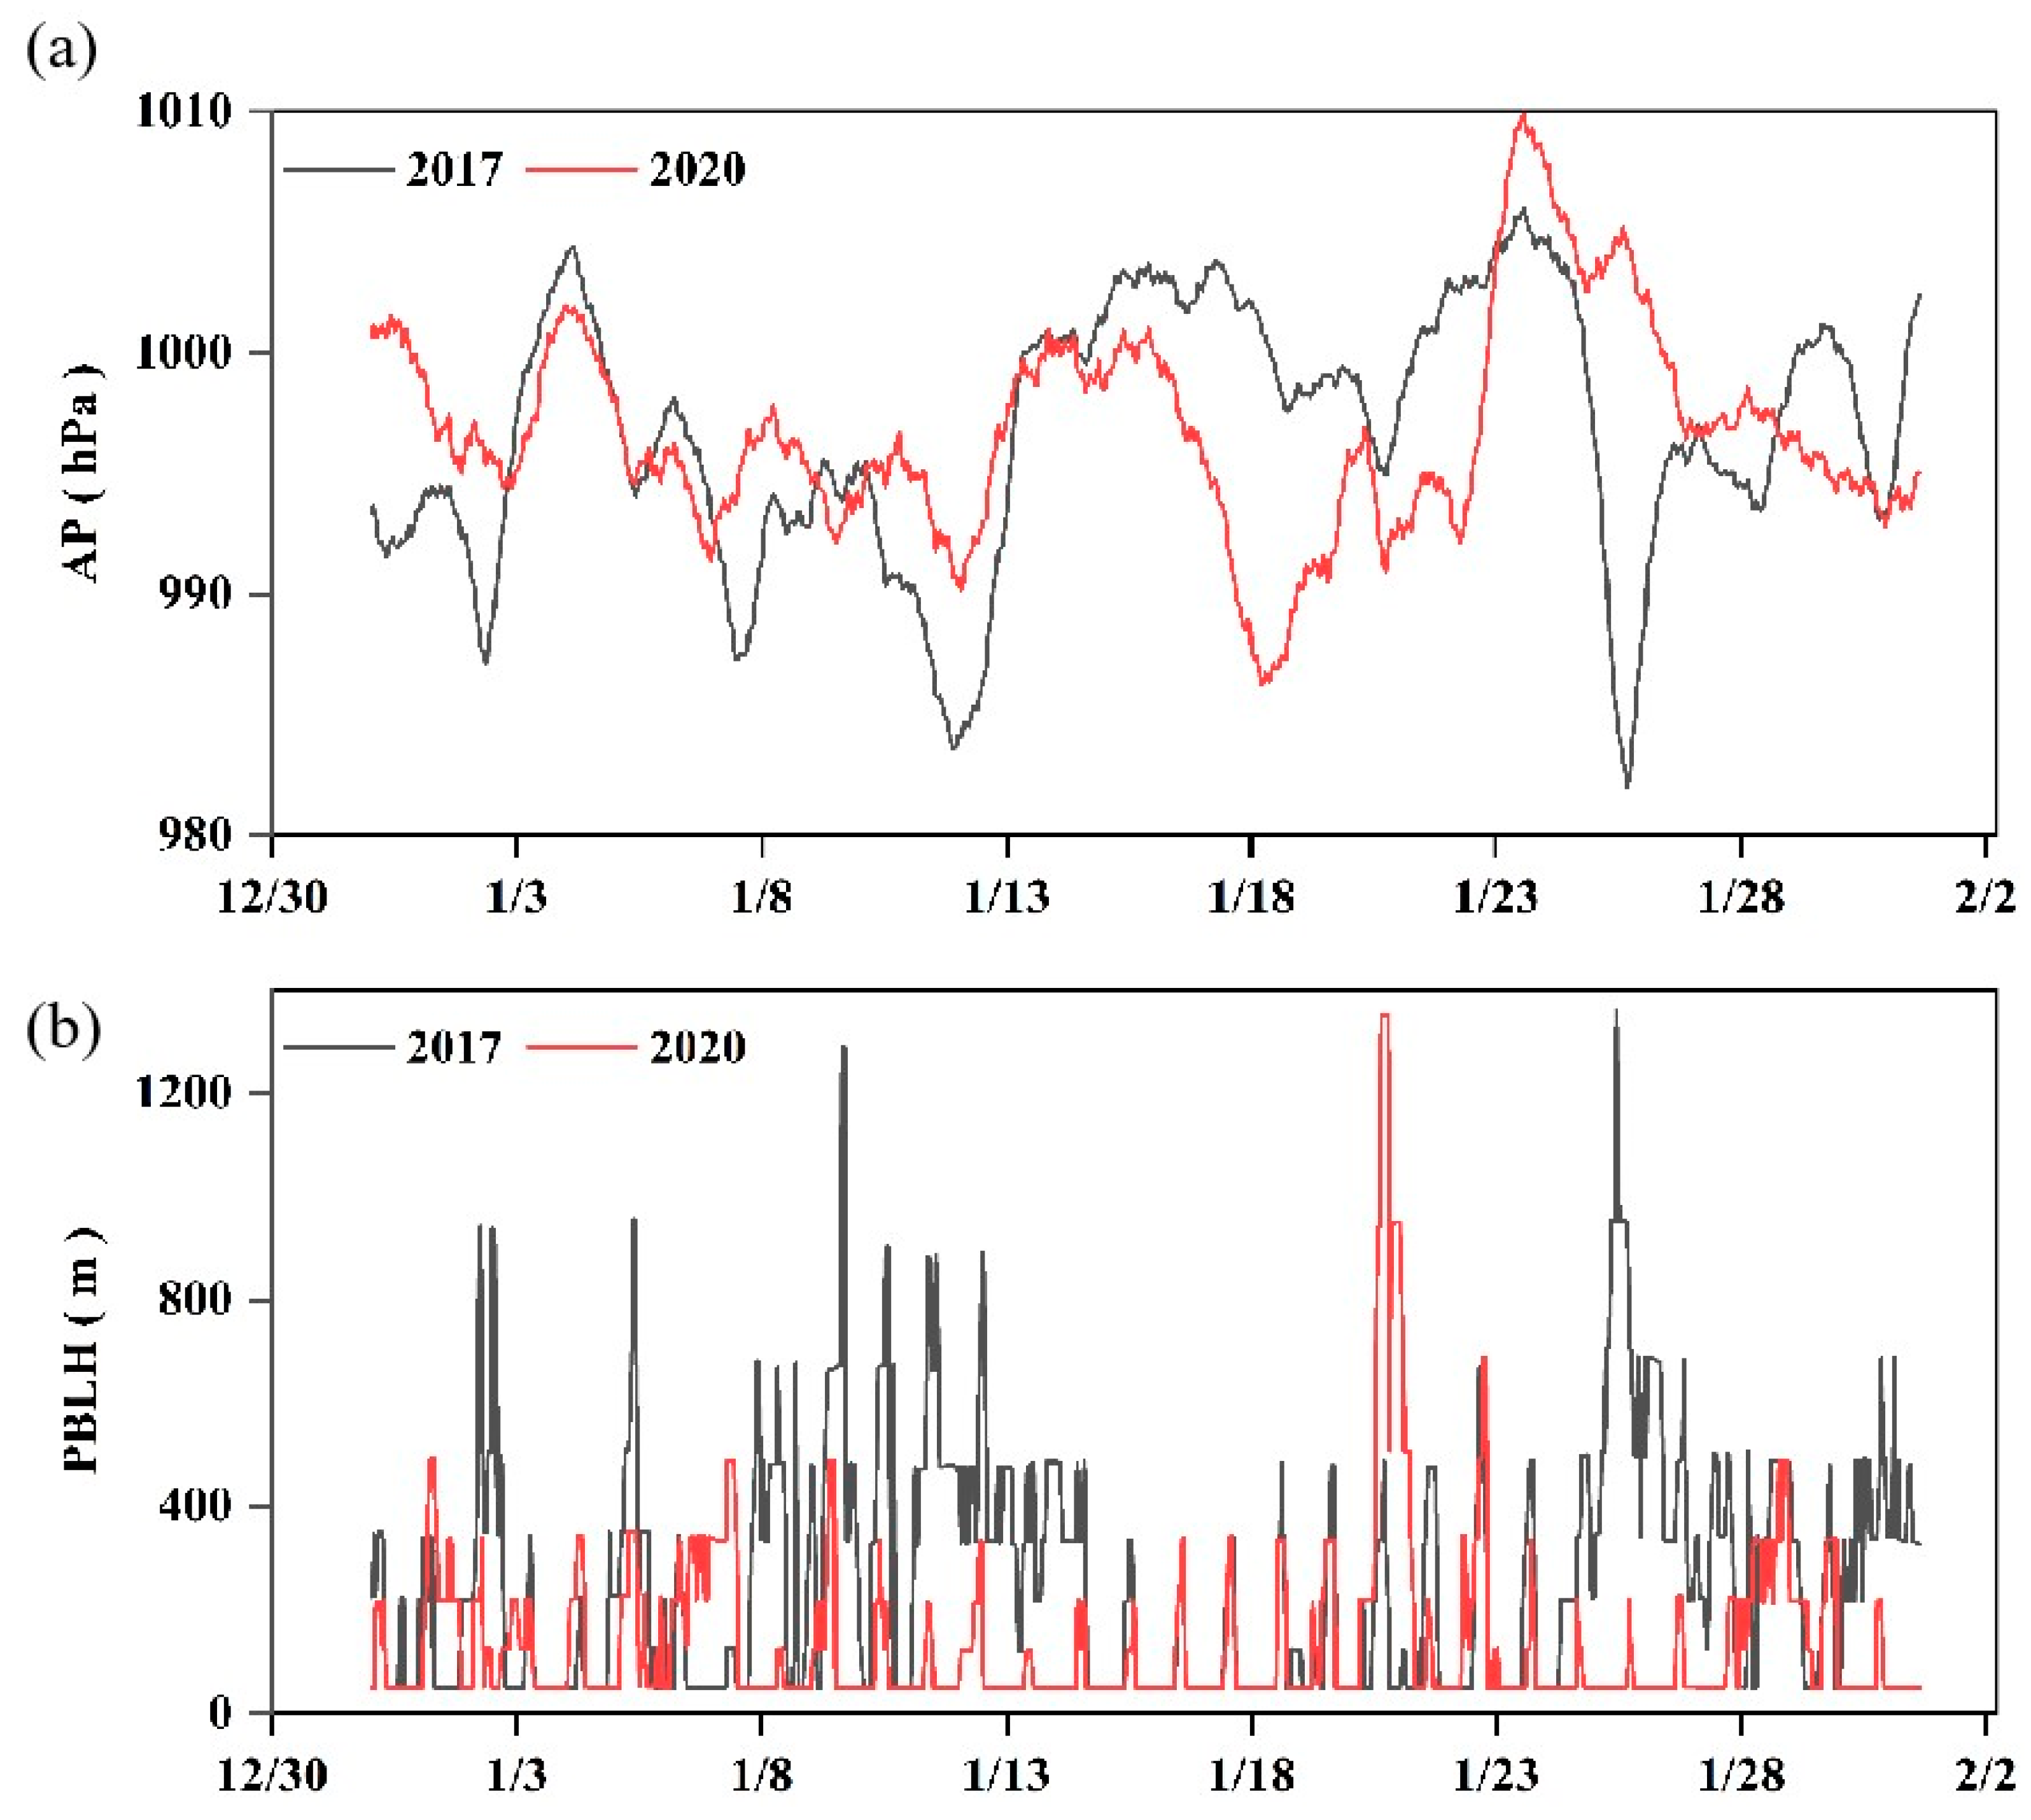
The barometric pressure values depicted in Figure 6a reveal that the difference between 2017 and 2020 is not significant, but there are higher barometric pressure values during periods of heavy PM2.5 pollution, such as 6–8 January and 15–18 January 2017, and 24–28 January 2020. During periods of high pressure, low wind speeds accompany the sinking movement of air, which tends to create a sinking inversion and hinder the upward diffusion of pollutants. Consequently, PM2.5 pollution is more likely to occur. In Figure 6b, the PBLH for January 2017 and 2020 are compared. The monthly average value of PBLH in January 2017 was 259 m, whereas the monthly average value of PBLH in January 2020 was 138 m, representing an 87.7% decrease compared to 2017. Notably, during the pollution period of 24–28 January 2020, the PBLH was significantly lower than in 2017. There is a significant negative correlation between PBLH and PM2.5 pollution. From the above analysis, it is evident that the meteorological parameters contributing to higher PM2.5 pollution in January 2020 compared to January 2017 include lower wind speeds, higher air pressure, and lower boundary layer heights. These conditions favor the accumulation of PM2.5 in the atmosphere and hinder its dispersion, thus exacerbating pollution levels. Therefore, it is imperative to consider the influence of meteorological parameters when developing strategies to mitigate PM2.5 pollution.

3.2. Interannual Spatial and Temporal Distribution of AQI and NHAQI

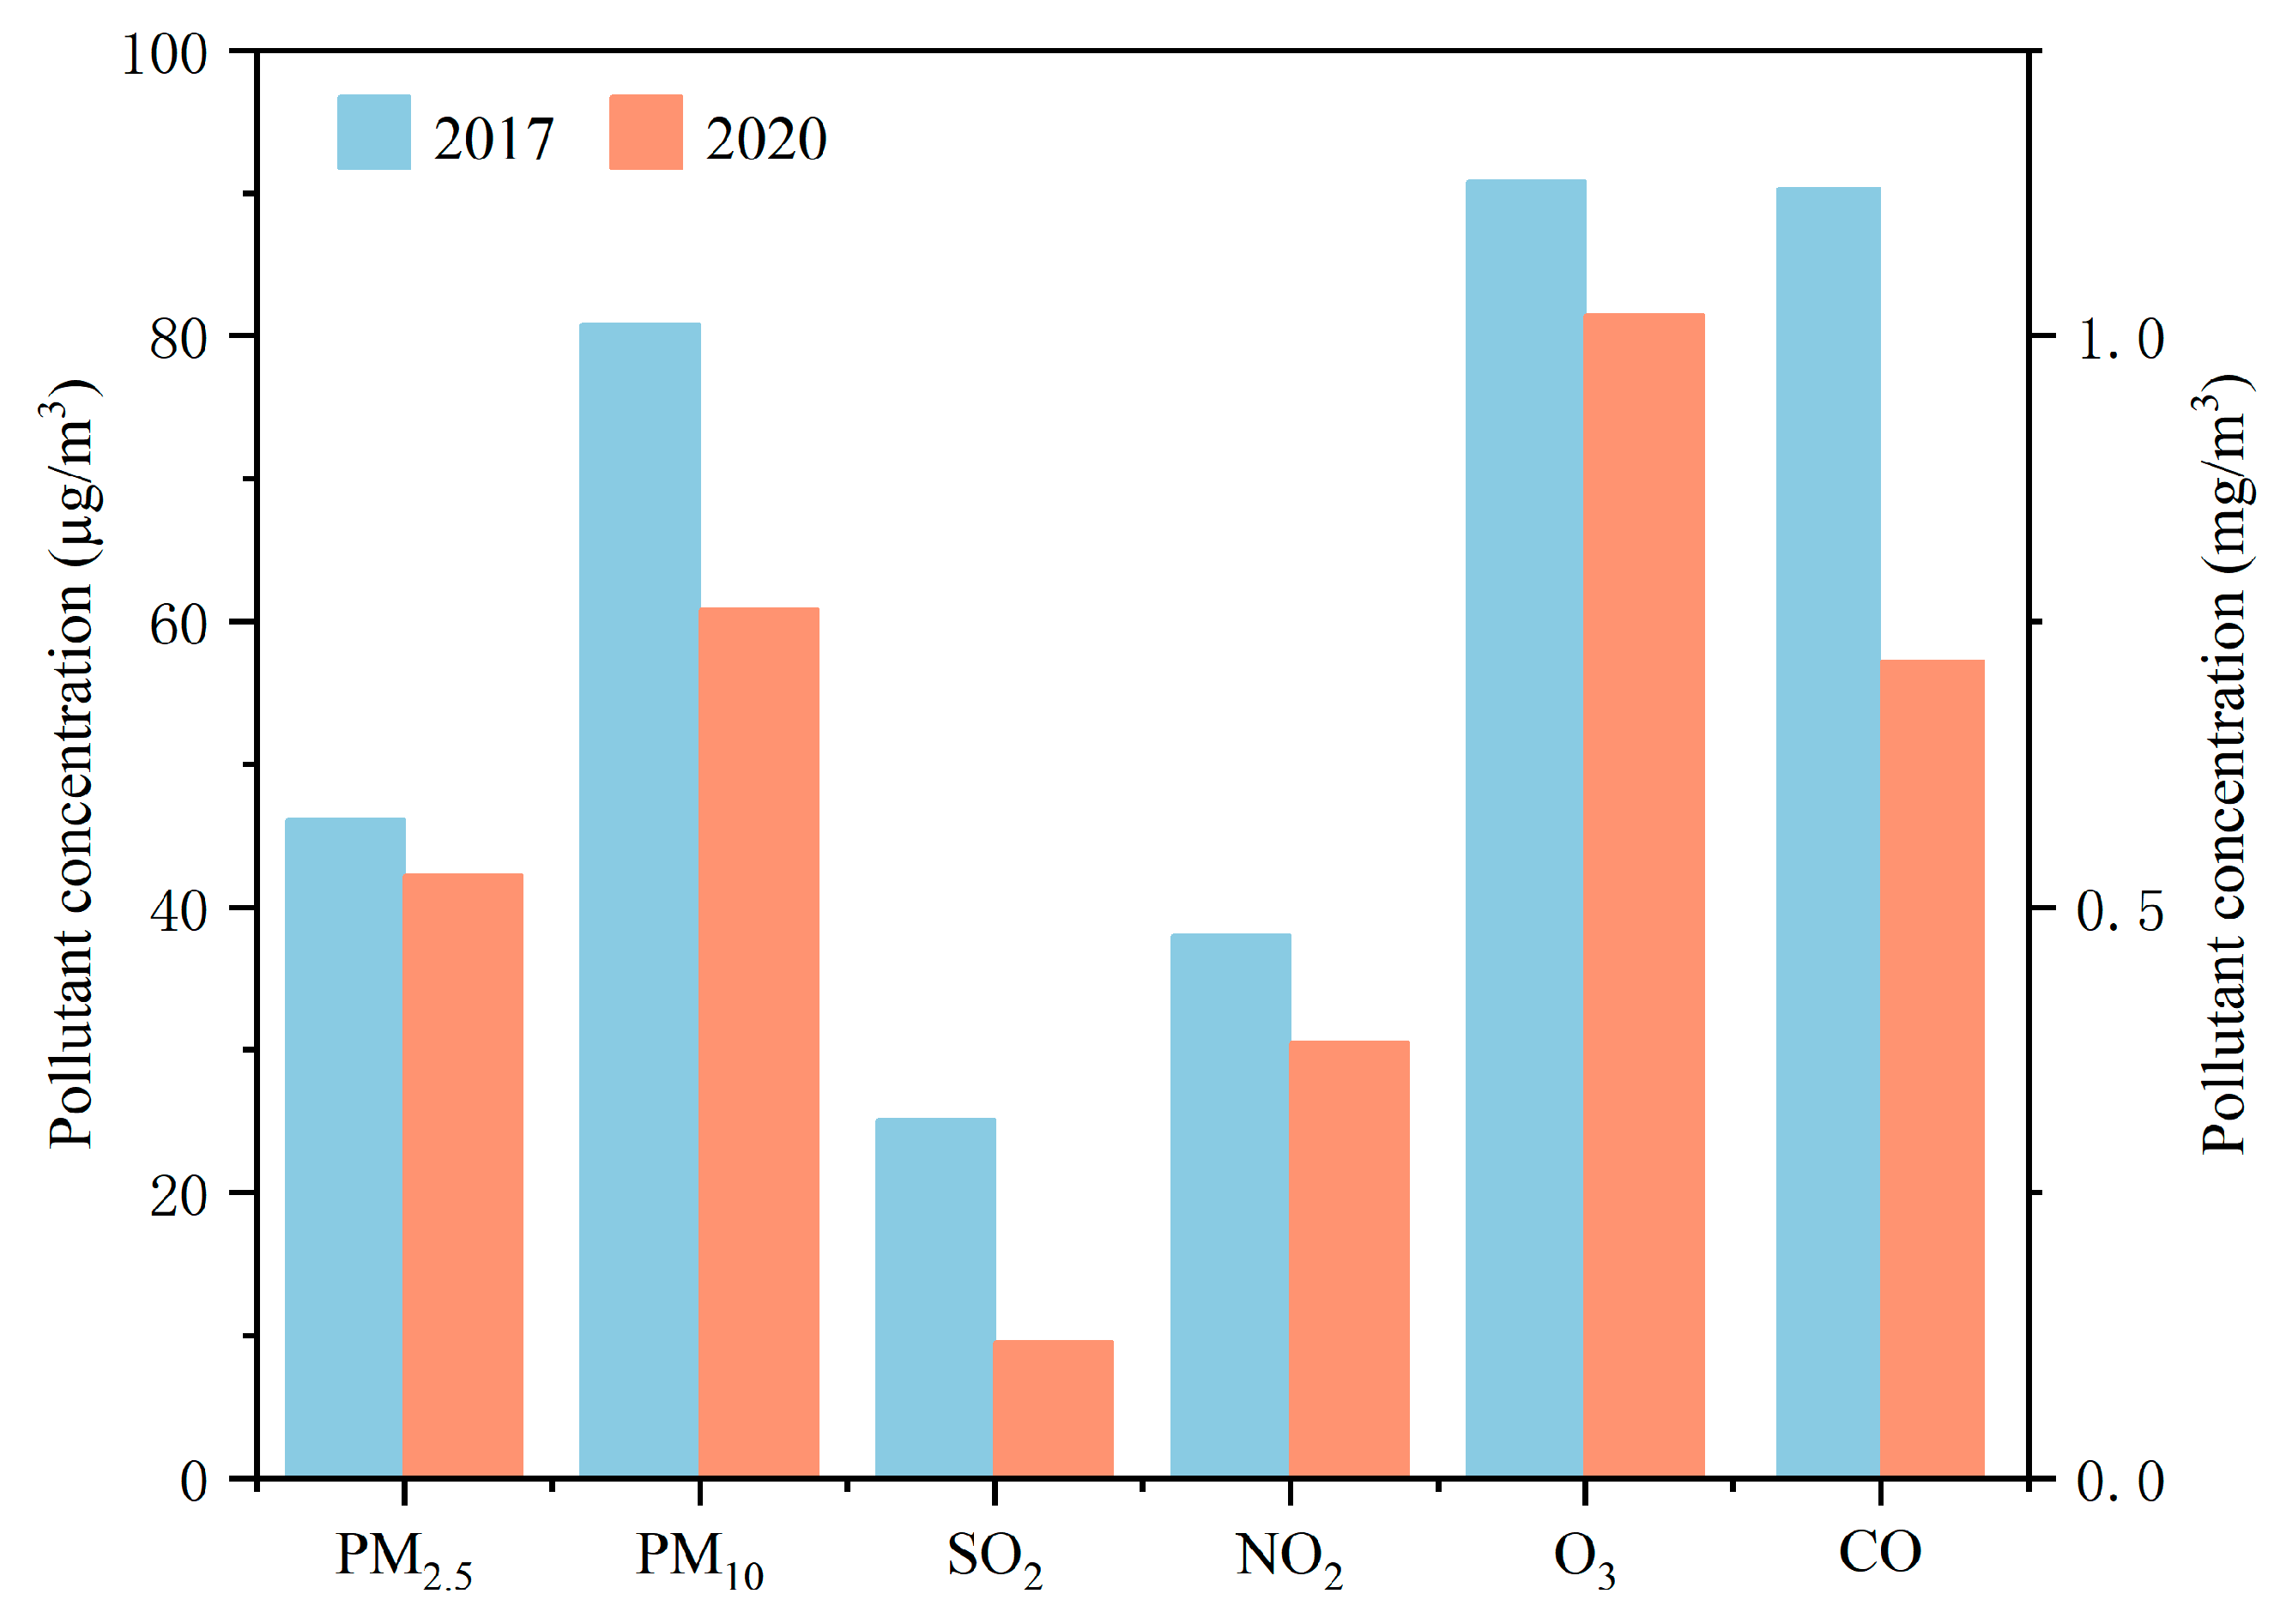
Figure 7 shows the comparison of the annual average mass concentrations of six pollutants in Changchun in 2017 and 2020 (Data from 10 state-controlled atmospheric environment automatic monitoring stations in Changchun). From 2017 to 2020, there was a significant reduction in all six pollutants (PM2.5, PM10, SO2, NO2, O3, CO) by 8.39% (3.87 µg/m3), 24.68% (19.94 µg/m3), 62.05% (15.57 µg/m3), 19.62% (7.45 µg/m3), 10.38% (9.43 µg/m3), and 36.65% (0.41 mg/m3). Among them, the reduction in SO2 is the most significant, while the reduction in PM2.5 is not satisfactory, which may be related to the severe meteorological conditions in 2020.
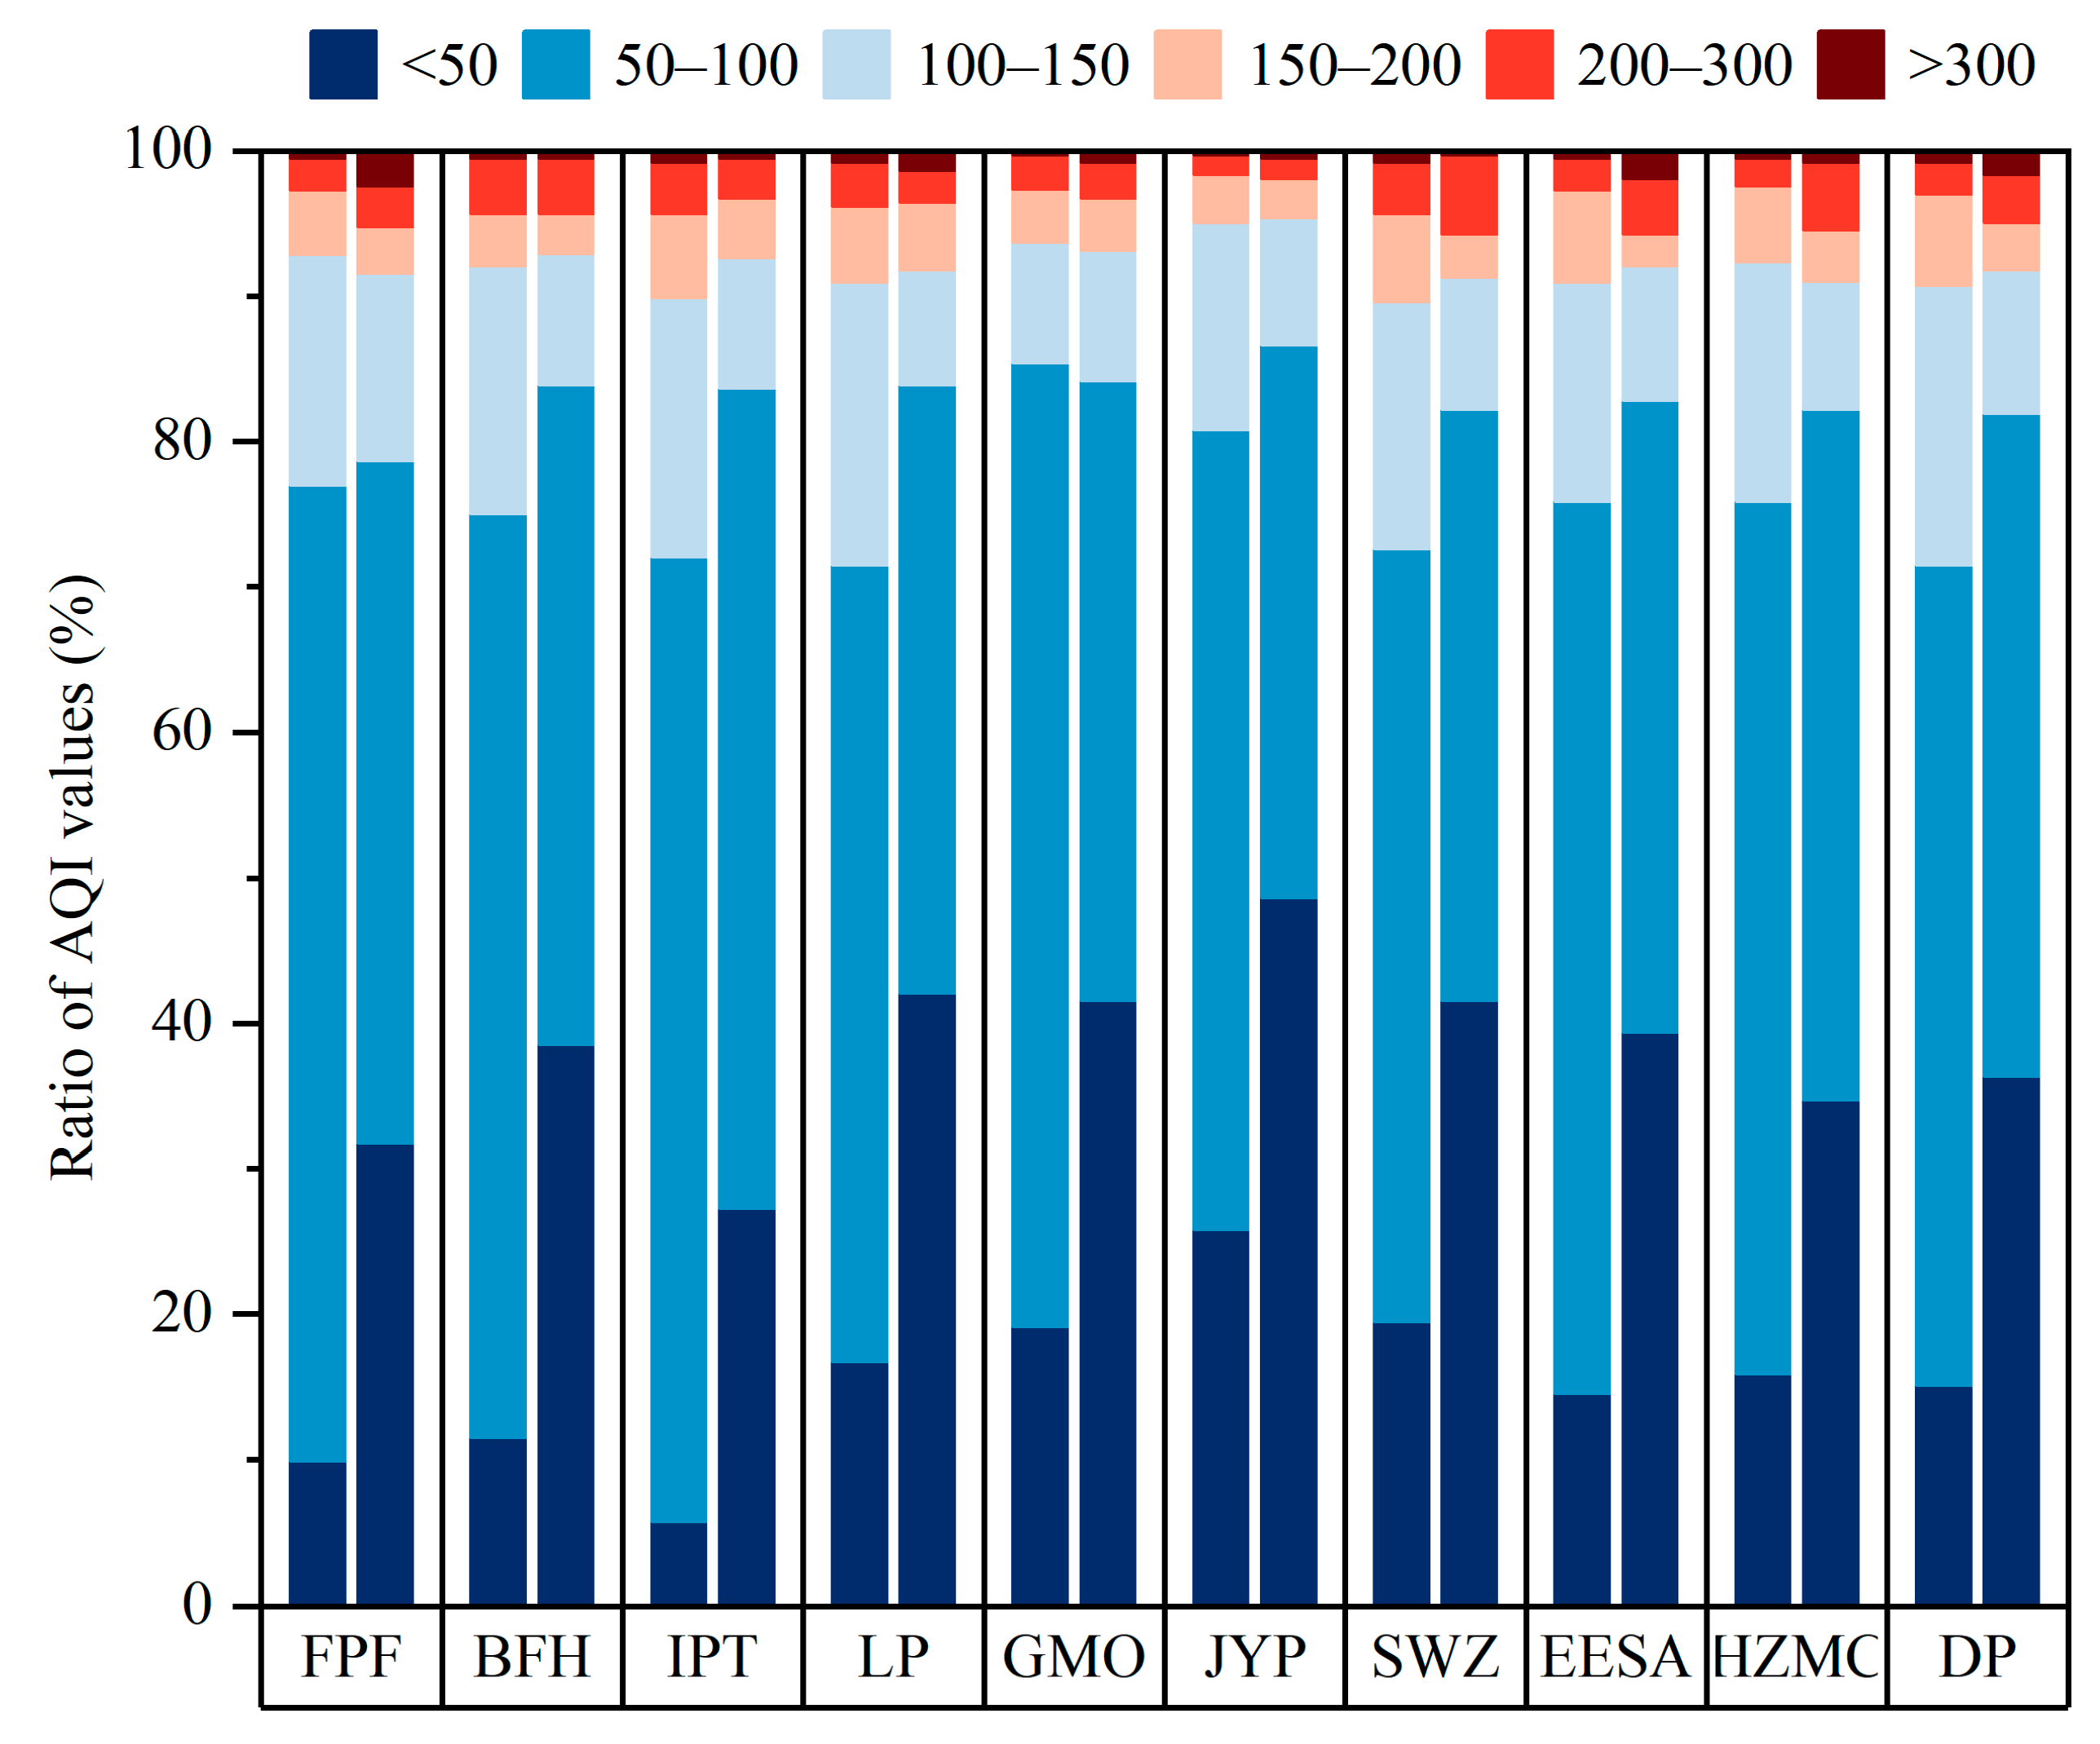
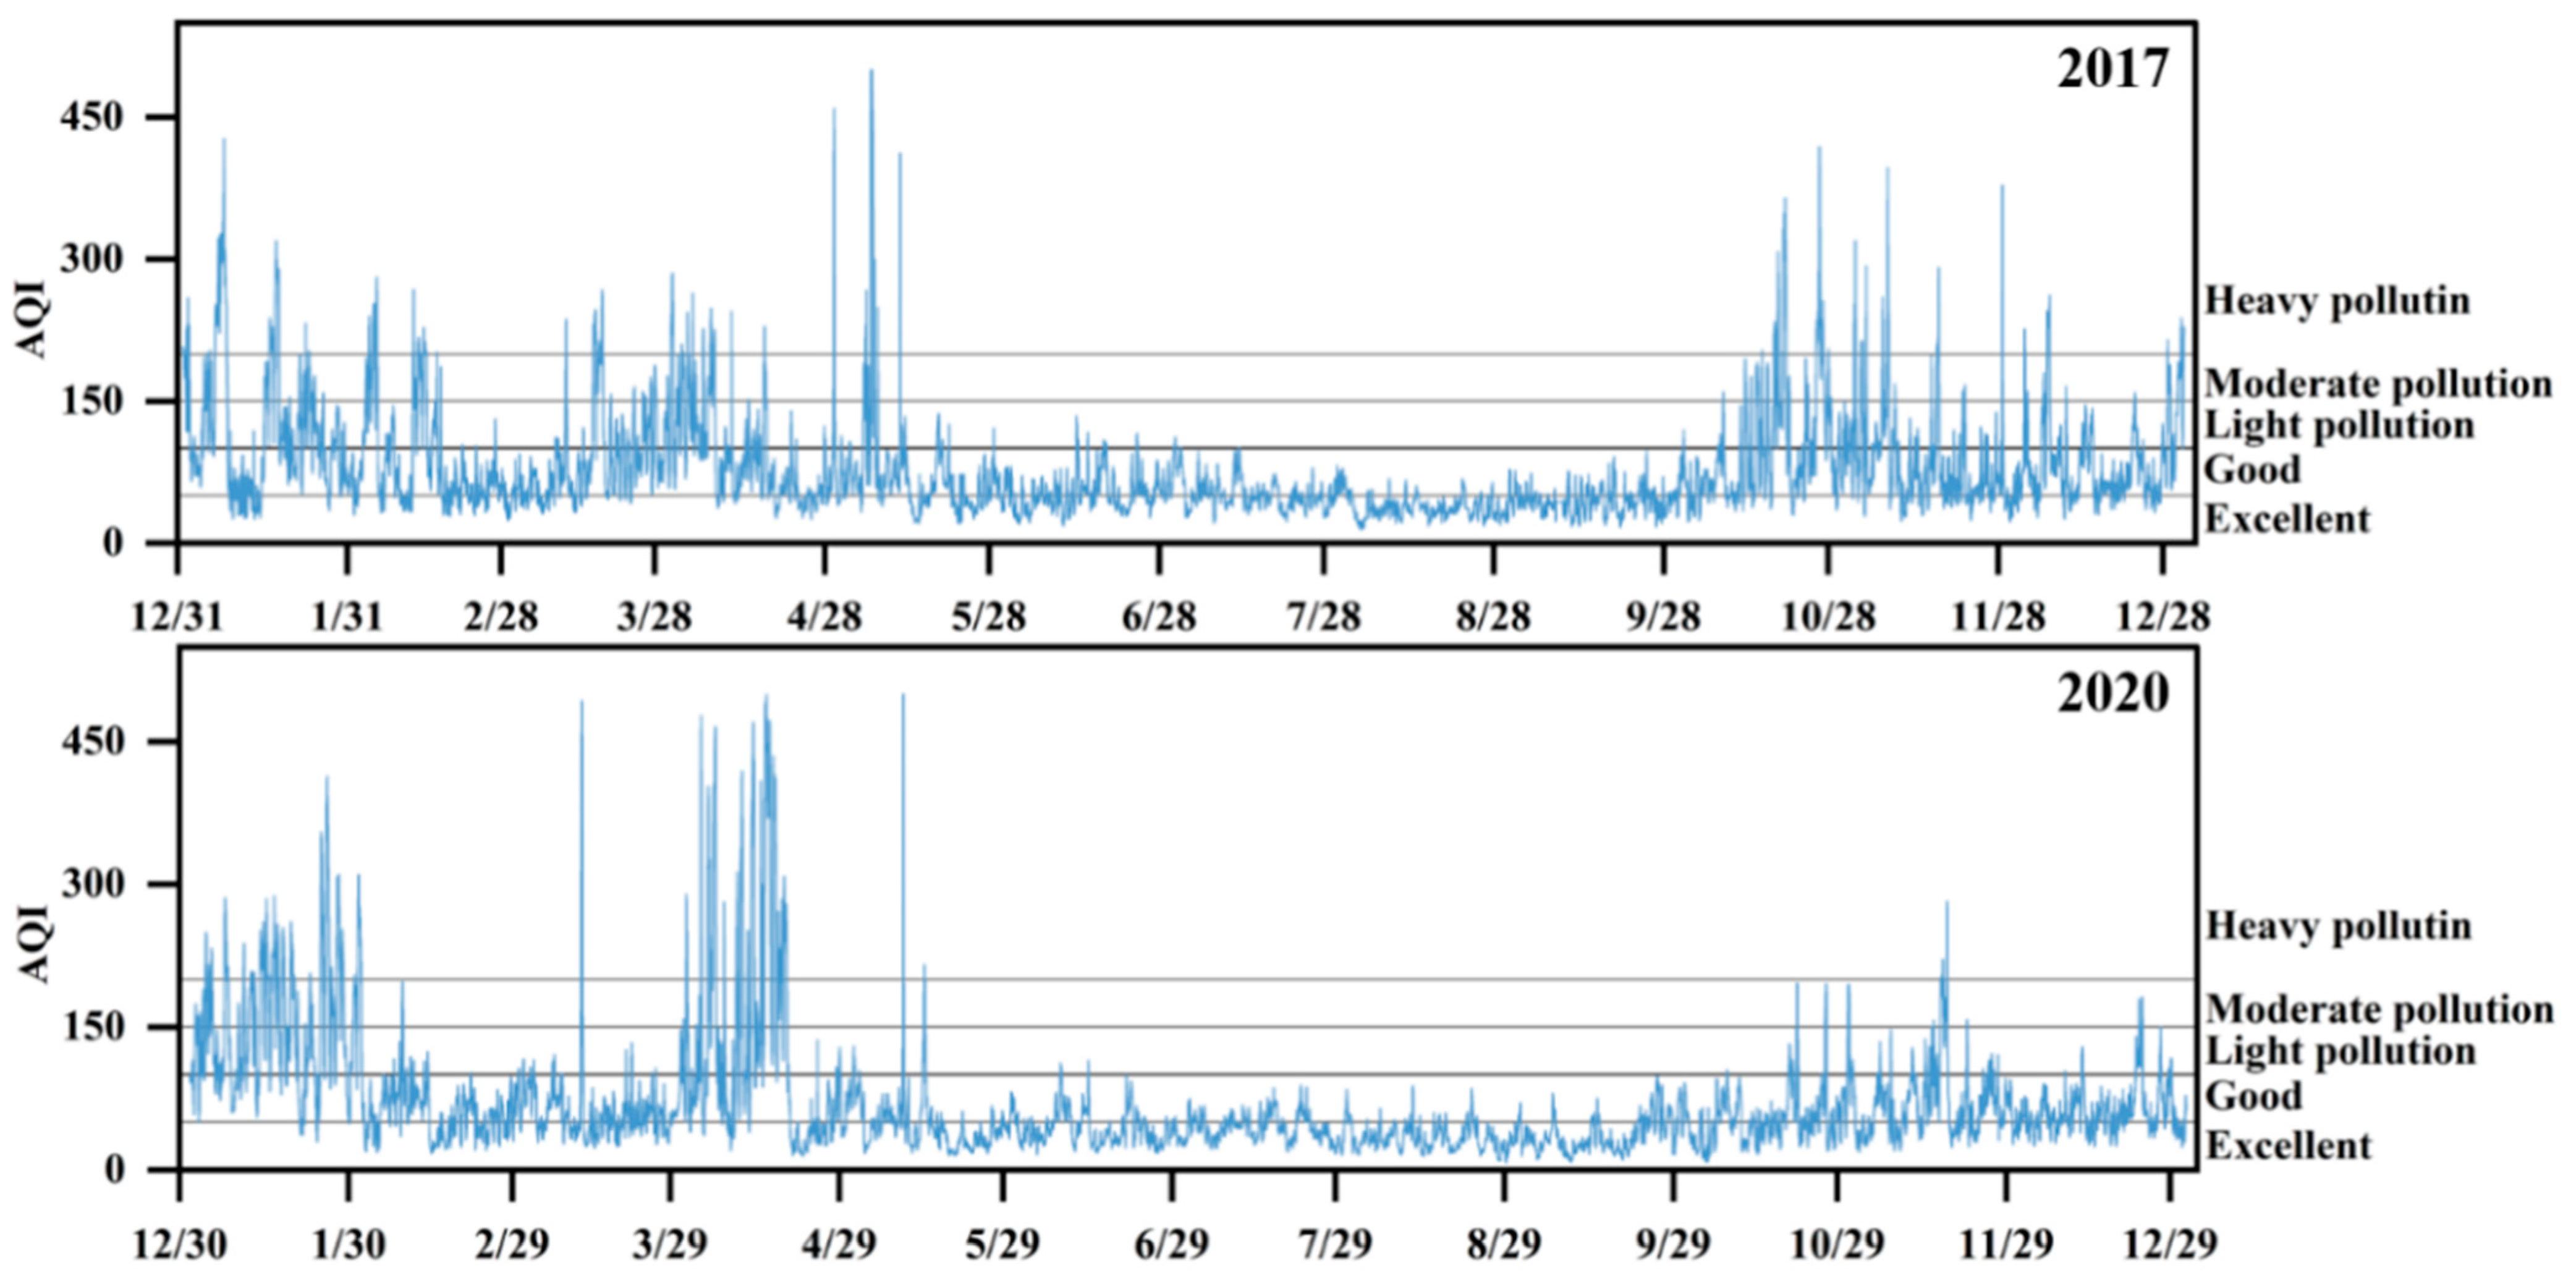
The AQI quantifies air quality, and the level of pollution is positively correlated with the magnitude of the Air Quality Index (AQI) values. Figure 8 shows the percentage of days in 2017 and 2020 for each of the six AQI health categories. Compared to 2017, air quality at all ten sites in 2020 will improve significantly, with an average increase of 84.2 days for excellent (AQI < 50) and 29.9 days for excellent and good (AQI < 100). While the number of days for excellent pollution increases significantly, the number of days for serious and very severe pollution (AQI > 200) increases by an average of 4.2 days from 2017 to 2020. We then analyze the average AQI hourly concentrations in Changchun for 2017 and 2020, as shown in Figure 9. The four seasons in Changchun are divided into spring (4.20–6.30), summer (7.01–8.10), autumn (8.11–10.10), and winter (1.1–4.19 and 10.11–12.31) according to the climatic seasonal division method. It can be seen that the overall pattern of air quality in Changchun is more polluted in the winter and less polluted in the summer. In 2017, the monthly average AQI value was highest in January at 118.87, followed by October at 99.2. In addition, it is worth noting that the highest hourly AQI value of the year occurred in May, mainly because of a strong dust storm weather process in Changchun starting on 6 May 2017. The dusty weather came from the Inner Mongolia Plateau and affected Changchun from 4 May. AQI from 6–8 was in the range of 116 to 256, making Changchun have the highest AQI hourly value for the year in May. The hourly AQI values in 2020 remain low in summer, with the most severe pollution in January, when the monthly average AQI value is 152.77, 28.5% higher year-on-year compared to 2017. The number of days in January 2017 when the daily average AQI reached moderately polluted and above (AQI > 150) was 9, and the number of days in January 2020 when the daily average AQI reached moderately polluted and above (AQI > 150) was 14, which suggests that pollution is significantly worse in January 2020 than in 2017. The monthly average AQI value in April 2020 is only lower than that in January, at 132.56, which is 48.2% higher than the same period in 2017, due to the impact of the COVID-19 epidemic, which led to an increase in emission sources as work resumed and production resumed in April in various places. And the spring of 2020 saw a large, high-intensity open straw burning in the northeast, which was the main cause of heavy pollution. This was accompanied by static meteorological conditions and the presence of inversions, which aggravated the accumulation of pollutants. Changchun Municipal Government issued an emergency yellow alert for heavy air pollution on 15 April, and the air quality improved on the 19th.
The NHAQI used in this paper is more effective for representing health risks compared to the AQI, and Figure 10 shows the distribution of days in each category for the NHAQI based on the health classification categories of the AQI, including 2017 and 2020. When the AQI is excellent or good (AQI < 100), the NHAQI is also excellent or good because there is no excess risk ER at this time. When the AQI is light pollution (100 < AQI < 150), the percentage of days when the NHAQI is light or moderate pollution is 92% and 8% in 2017 and 100% and 0% in 2020, respectively. When the AQI is moderate pollution (150 < AQI < 200), the percentage of days with moderate and serious pollution in the NHAQI is 59% and 41% in 2017 and 79% and 21% in 2020, respectively. When AQI is serious pollution (200 < AQI < 300), the percentage of days with NHAQI of serious and very severe pollution is 78% and 22% in 2017 and 58% and 41% in 2020, respectively. When AQI is very severe pollution (AQI > 300), NHAQI is also very severe pollution. Compared with 2017, the number of days with NHAQI of light and moderate pollution in 2020 has decreased and the air quality has improved, but the number of days with serious pollution and above has increased, which can bring an increased health risk to the exposed population. Overall, AQI is inadequate in characterizing the health risk from air pollution, and there is an underestimation.
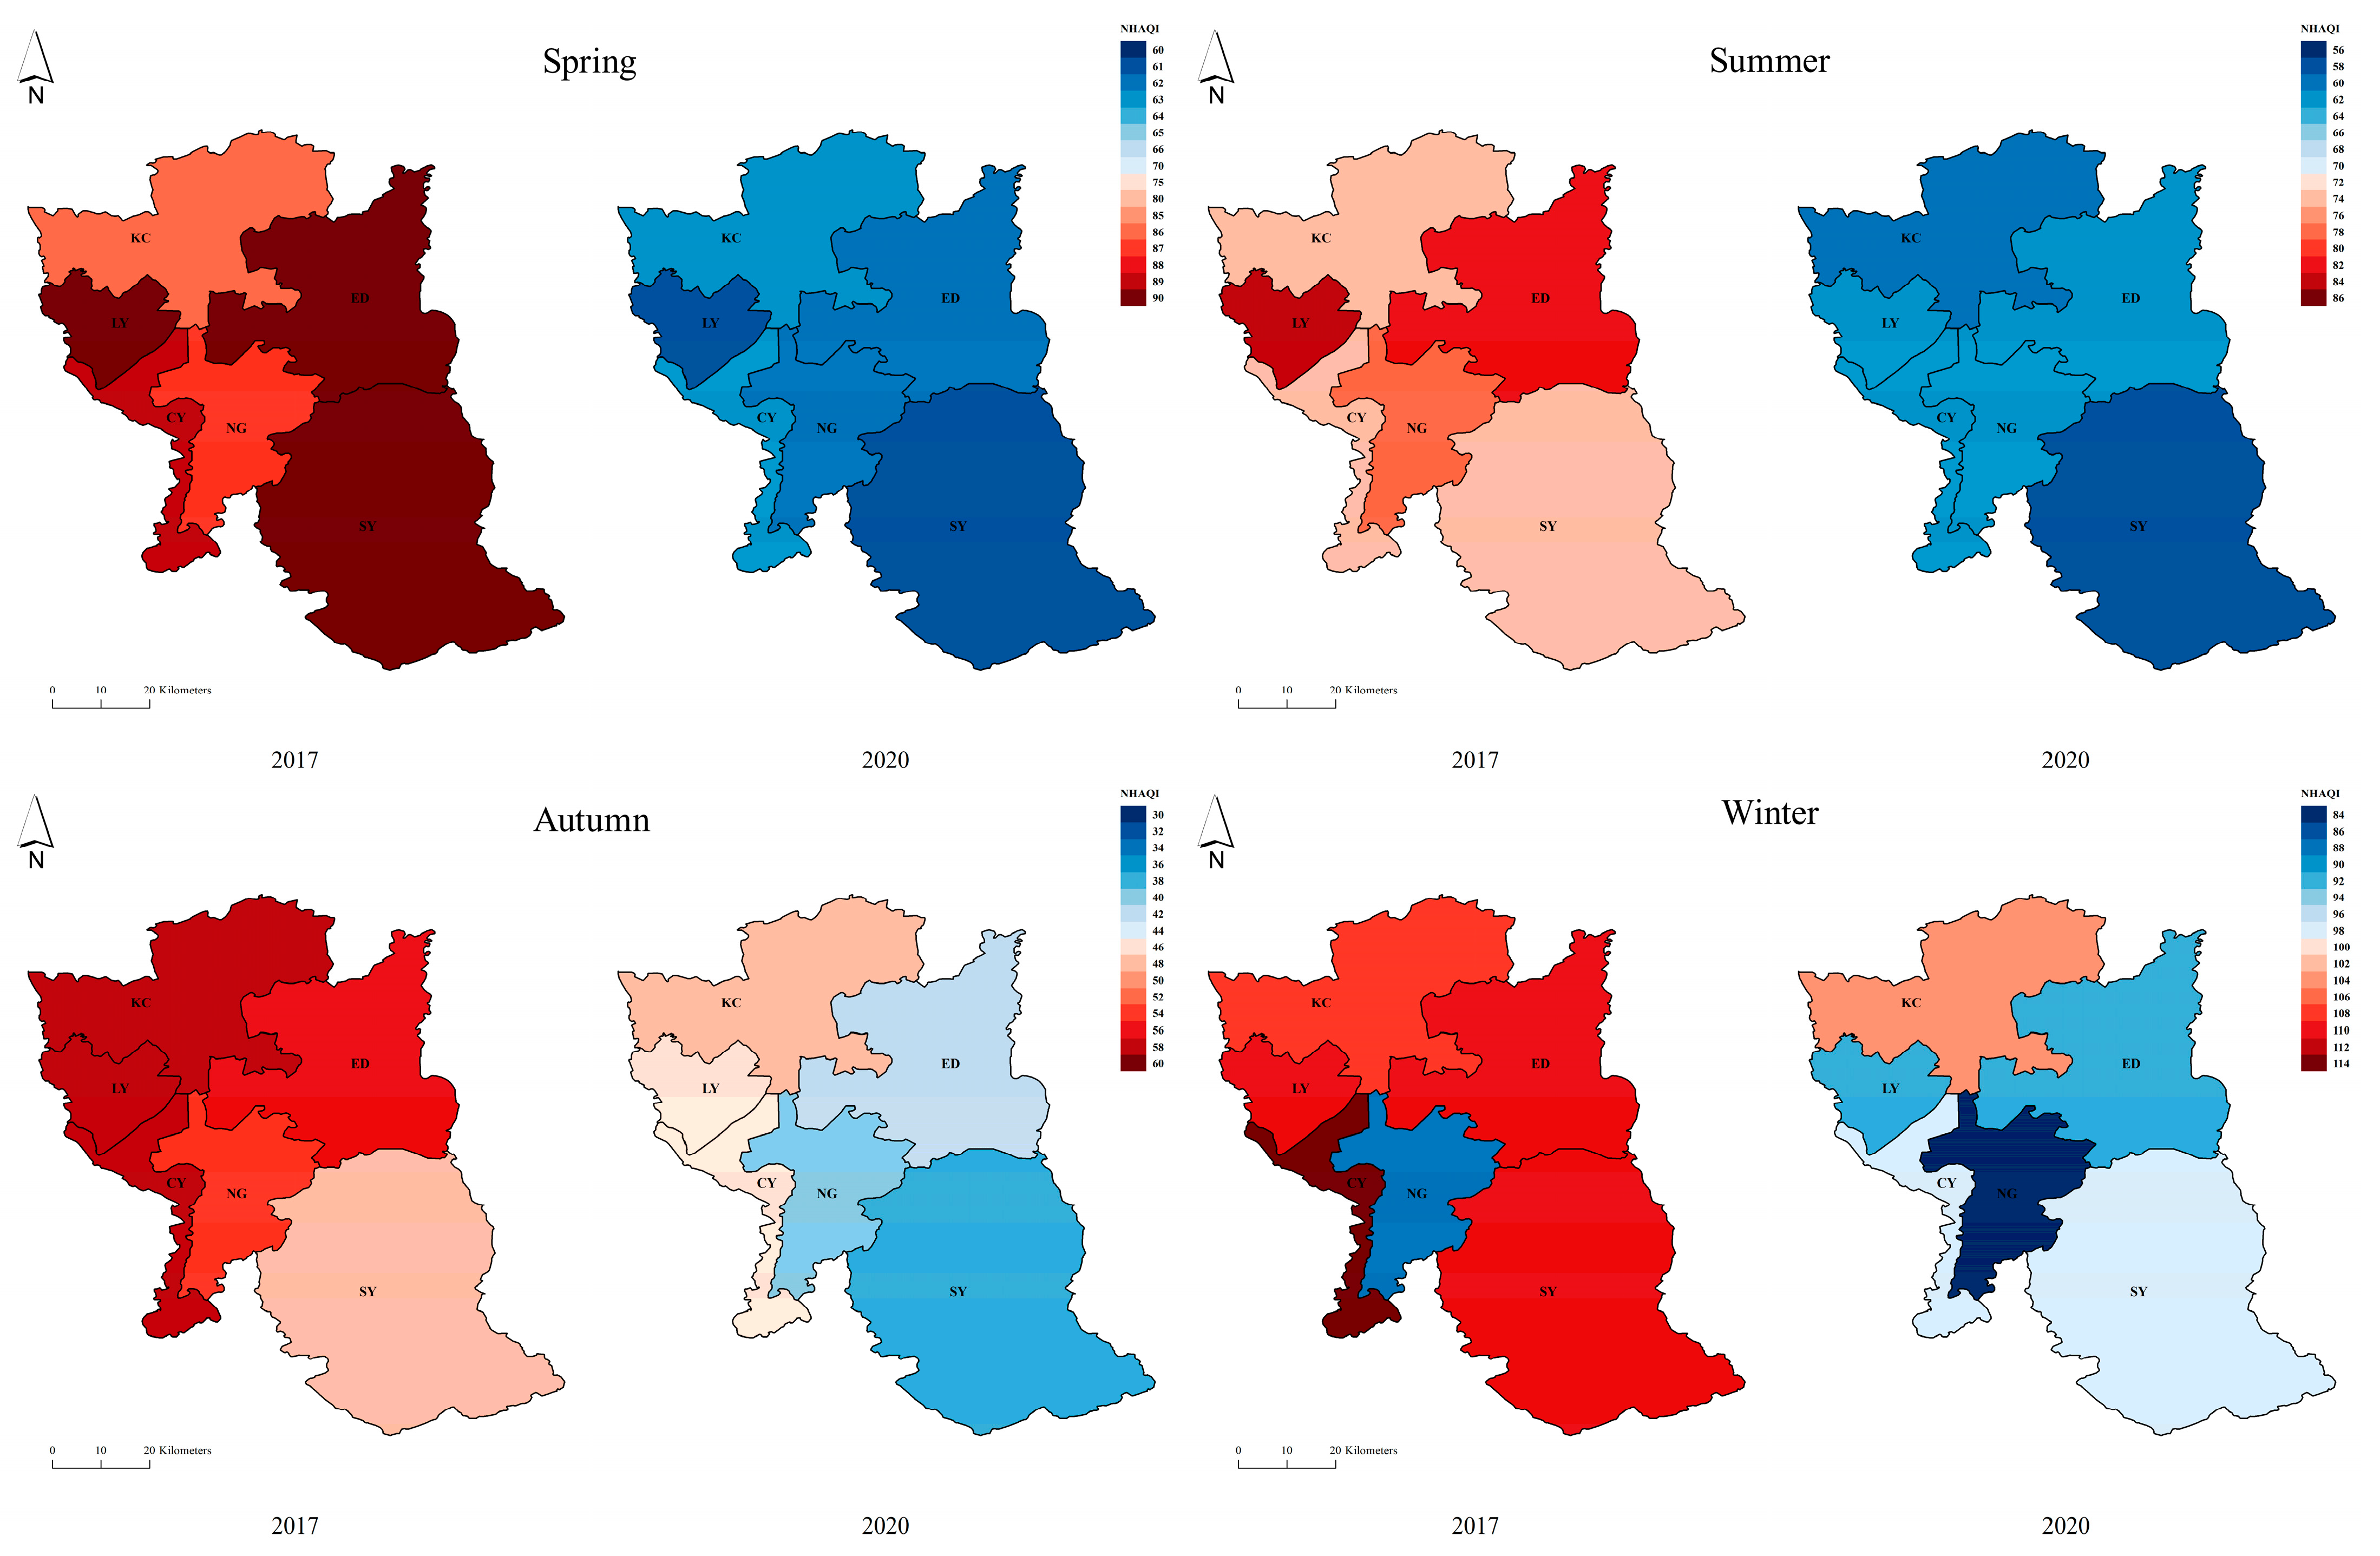
The spatial distribution of the seasonal average NHAQI is studied based on six administrative districts of Changchun city (KC: Kuancheng district, LY: Lvyuan district, CY: Chaoyang district, NG: Nanguan district, ED: Erdao district, and SY: Shuangyang district), as shown in Figure 11. All four seasons show a significant improvement in air quality from 2017 to 2020, with the annual average NHAQI decreasing from 80.87 in 2017 to 66.27 in 2020. The NHAQI in the spring of both years is good (50 < NHAQI < 100), with a 29.43% decrease in 2020 compared to 2017, the largest decrease among the four seasons, but high NHAQI is observed in all areas on 6 May 2017 due to dust storms, and in April 2020 due to straw burning in the suburbs of Changchun, from 5 April lasted until 18 April, during which the NHAQI is serious pollution and above. The NHAQI values in summer and autumn are excellent or good (NHAQI < 100), decreasing by 18.20% and 18.14%, respectively, with LY, NG, and ED having relatively higher NHAQI in summer and KC, LY, CY, and ED having relatively higher NHAQI in autumn, which is mainly due to the short and relatively stable meteorology in summer and autumn in Changchun, where the air quality index is mainly influenced by anthropogenic emissions. And these five areas are all located in the main urban area, where anthropogenic emissions are more intensive. In the long winter of 2017, NHAQI values were above light pollution (NHAQI > 100) except for NG, which can pose a risk to population health, probably due to the need for coal burning for thermal heating in winter and frequent atmospheric stagnation in meteorological conditions. In 2020, although it decreased by 8.241% compared to 2017, the NHAQI in KC still showed light pollution, which may be related to the prevailing northwesterly winds in winter in Changchun. In general, NG shows low NHAQI in any season due to the presence of National Forests in the area and the large area of green space, in addition to the fact that pollution is more severe in spring and winter than in summer and fall, especially in densely populated areas.
Figure 12 shows the ERtotal of six administrative regions in Changchun for 2017 and 2020. the average ERtotal for 2017 is 0.65%, and among the six administrative regions, NG has the smallest ER value of 0.40%, and KC, CY, and LY have higher than average ER values of 0.84%, 0.72%, and 0.67%, respectively. The pollutants that contribute most to the ERtotal are PM2.5, PM10, and O3, with 45.46%, 33.30%, and 13.57%, respectively, and CO does not cause excess health risk. The average ERtotal in 2020 decreased by 0.11% compared to 2017, and all six regions decreased significantly except NG, which remained unchanged, and KC and CY, which had above-average ER values of 0.63% and 0.58%, respectively. The pollutants contributing most to ERtotal are still PM2.5, PM10, and O3, with 64.71%, 22.32%, and 8.41%, respectively, which shows that the control of PM10 and O3 is very effective, but the control of PM2.5 has weakened.

4. Conclusions

This paper investigates the effect of meteorological conditions on PM2.5 through the simulation results of the WRF-CMAQ model and assesses the exposure risk of pollutants to the population using the NHAQI index and ER. The results show that the higher PM2.5 in January 2020 is mainly due to the influence of meteorological conditions. By studying the effect of meteorological parameters on PM2.5, we found that T2, WS10, and PBLH were all lower in January 2020 than in January 2017, while the air pressure was slightly higher than in January 2017. During the heavy PM2.5 pollution period from 24–28 January 2020, T2, WS10, and PBLH were negatively correlated with PM2.5 concentrations, while air pressure was positively correlated. The lower wind speed and larger air pressure, as well as the lower boundary layer height, are factors that favor the accumulation of PM2.5 in the atmosphere and are not easily diffused, causing pollution. The average number of days with excellent and good air quality (AQI < 100) in 2020 is 29.9 days more than the annual average in 2017, but AQI is lacking in evaluating health risks, so NHAQI is introduced. The NHAQI of all six municipal districts in Changchun decreased significantly from 2017 to 2020, but the four districts with a relatively high population (i.e., KC, LY, CY, and ED) had relatively high NHAQI values and the highest NHAQI in winter among the four seasons. The pollutants that contribute most to the ERtotal shift are PM2.5, PM10, and NO2 in 2017 and PM2.5 and PM10 in 2020. This paper will contribute to the future pollutant control strategy of Changchun City.
However, there are some issues in this study that still lead to the creation of uncertainty. First, due to the limitations of the inventory data, the 2017 MEIC inventory data is used as the inventory input for case 2, which leads to errors in the subsequent simulations, and this study will continue to research updated inventory files to improve them. Secondly, this study do not take into account the effect of meteorological conditions on PM2.5 without considering the effect of long-distance transmission on the local area, which may lead to uncertainty in the results and still requires further research. Thirdly, the national exposure-response relationship coefficients are used in this paper to represent Changchun City, and we will further refine the coefficients in the future by combining epidemiologic studies and clinical data. Finally, the calculation of NHAQI and ER may generate statistical errors, and further research is needed for NHAQI to account for the interactions between pollutants.

Author Contributions

Conceptualization, X.L. and J.W.; Data curation, C.F. and X.L.; Formal analysis, X.L. and J.L.; Investigation, X.L.; Methodology, X.L., J.L. and J.T.; Supervision, C.F., J.T. and J.W.; Visualization, X.L., J.L. and J.T.; Writing—original draft, X.L.; Writing—review and editing, C.F. and J.W. All authors have read and agreed to the published version of the manuscript.

Funding

This research received no external funding.

Institutional Review Board Statement

Not applicable.

Informed Consent Statement

Not applicable.

Data Availability Statement

The original contributions presented in the study are included in the article, further inquiries can be directed to the corresponding author/s.

Acknowledgments

The authors would like to thank the group members of Laboratory 537 and 142 of Jilin University for their help and guidance for this study. Additionally, the authors would like to thank the MEIC team from Tsinghua University for providing the Multiscale Emission Inventory of China (MEIC).

Conflicts of Interest

The authors declare that they have no known competing financial interests or personal relationships that could have appeared to influence the work reported in this paper.

References

  1. Chan, K.L.; Wang, Z.; Ding, A.; Heue, K.-P.; Shen, Y.; Wang, J.; Zhang, F.; Shi, Y.; Hao, N.; Wenig, M. MAX-DOAS measurements of tropospheric NO2 and HCHO in Nanjing and a comparison to ozone monitoring instrument observations. Atmos. Chem. Phys. 2019, 19, 10051–10071. [Google Scholar] [CrossRef]
  2. Xu, T.; Zhang, C.; Liu, C.; Hu, Q. Variability of PM2.5 and O-3 concentrations and their driving forces over Chinese megacities during 2018-2020. J. Environ. Sci. 2023, 124, 1–10. [Google Scholar] [CrossRef] [PubMed]
  3. Liu, C.; Chen, R.; Sera, F.; Vicedo-Cabrera, A.M.; Guo, Y.; Tong, S.; Coelho, M.S.Z.S.; Saldiva, P.H.N.; Lavigne, E.; Matus, P.; et al. Ambient Particulate Air Pollution and Daily Mortality in 652 Cities. N. Engl. J. Med. 2019, 381, 705–715. [Google Scholar] [CrossRef] [PubMed]
  4. Zhai, S.; Jacob, D.J.; Wang, X.; Shen, L.; Li, K.; Zhang, Y.; Gui, K.; Zhao, T.; Liao, H. Fine particulate matter (PM2.5) trends in China, 2013-2018: Separating contributions from anthropogenic emissions and meteorology. Atmos. Chem. Phys. 2019, 19, 11031–11041. [Google Scholar] [CrossRef]
  5. Yang, Q.; Yuan, Q.; Li, T.; Shen, H.; Zhang, L. The Relationships between PM2.5 and Meteorological Factors in China: Seasonal and Regional Variations. Int. J. Environ. Res. Public Health 2017, 14, 1510. [Google Scholar] [CrossRef] [PubMed]
  6. Miao, Y.; Liu, S.; Guo, J.; Yan, Y.; Huang, S.; Zhang, G.; Zhang, Y.; Lou, M. Impacts of meteorological conditions on wintertime PM2.5 pollution in Taiyuan, North China. Environ. Sci. Pollut. Res. 2018, 25, 21855–21866. [Google Scholar] [CrossRef] [PubMed]
  7. Duan, W.; Wang, X.; Cheng, S.; Wang, R.; Zhu, J. Influencing factors of PM2.5 and O-3 from 2016 to 2020 based on DLNM and WRF-CMAQ. Environ. Pollut. 2021, 285, 117512. [Google Scholar] [CrossRef] [PubMed]
  8. Kitayama, K.; Morino, Y.; Yamaji, K.; Chatani, S. Uncertainties in O-3 concentrations simulated by CMAQ over Japan using four chemical mechanisms. Atmos. Environ. 2019, 198, 448–462. [Google Scholar] [CrossRef]
  9. Chen, D.; Jin, X.; Fu, X.; Xia, L.; Guo, X.; Lang, J.; Zhou, Y.; Wei, W. Impact of Inter-Annual Variation in Meteorology from 2010 to 2019 on the Inter-City Transport of PM2.5 in the Beijing-Tianjin-Hebei Region. Sustainability 2022, 14, 6210. [Google Scholar] [CrossRef]
  10. Fang, C.; Qiu, J.; Li, J.; Wang, J. Analysis of the meteorological impact on PM2.5 pollution in Changchun based on KZ filter and WRF-CMAQ. Atmos. Environ. 2022, 271, 118924. [Google Scholar] [CrossRef]
  11. Shen, Y.; Jiang, F.; Feng, S.; Zheng, Y.; Cai, Z.; Lyu, X. Impact of weather and emission changes on NO2 concentrations in China during 2014–2019. Environ. Pollut. 2021, 269, 116163. [Google Scholar] [CrossRef] [PubMed]
  12. Wang, W.; Chen, C.; Liu, D.; Wang, M.; Han, Q.; Zhang, X.; Feng, X.; Sun, A.; Mao, P.; Xiong, Q.; et al. Health risk assessment of PM2.5 heavy metals in county units of northern China based on Monte Carlo simulation and APCS-MLR. Sci. Total Environ. 2022, 843, 156777. [Google Scholar] [CrossRef]
  13. Wang, J.; Li, J.; Li, X.L.; Fang, C.S. Characteristics of Air Pollutants Emission and Its Impacts on Public Health of Chengdu, Western China. Int. J. Environ. Res. Public Health 2022, 19, 16852. [Google Scholar] [CrossRef] [PubMed]
  14. Humphrey, J.L.; Reid, C.E.; Kinnee, E.J.; Kubzansky, L.D.; Robinson, L.F.; Clougherty, J.E. Putting Co-Exposures on Equal Footing: An Ecological Analysis of Same-Scale Measures of Air Pollution and Social Factors on Cardiovascular Disease in New York City. Int. J. Environ. Res. Public Health 2019, 16, 4621. [Google Scholar] [CrossRef] [PubMed]
  15. Rodrigues, S.D.; Ueda, R.M.; Barreto, A.C.; Zanini, R.R.; Souza, A.M. How atmospheric pollutants impact the development of chronic obstructive pulmonary disease and lung cancer: A var-based model. Environ. Pollut. 2021, 275, 116622. [Google Scholar] [CrossRef] [PubMed]
  16. Xia, S.Y.; Huang, D.S.; Jia, H.; Zhao, Y.; Li, N.; Mao, M.Q.; Lin, H.; Li, Y.X.; He, W.; Zhao, L. Relationship between atmospheric pollutants and risk of death caused by cardiovascular and respiratory diseases and malignant tumors in Shenyang, China, from 2013 to 2016: An ecological research. Chin. Med. J. 2019, 132, 2269–2277. [Google Scholar] [CrossRef] [PubMed]
  17. Li, X.; Zhao, H.Y.; Xue, T.; Geng, G.N.; Zheng, Y.X.; Li, M.; Zheng, B.; Li, H.Y.; Zhang, Q. Consumption-based PM2.5-related premature mortality in the Beijing-Tianjin-Hebei region. Sci. Total Environ. 2021, 800, 149575. [Google Scholar] [CrossRef] [PubMed]
  18. Liu, M.; Saari, R.K.; Zhou, G.X.; Li, J.; Han, L.; Liu, X.A. Recent trends in premature mortality and health disparities attributable to ambient PM2.5 exposure in China: 2005-2017. Environ. Pollut. 2021, 279, 116882. [Google Scholar] [CrossRef] [PubMed]
  19. Akan, A.P. Transmission of COVID-19 pandemic (Turkey) associated with short-term exposure of air quality and climatological parameters. Environ. Sci. Pollut. Res. 2022, 29, 41695–41712. [Google Scholar] [CrossRef]
  20. Coccia, M. How (Un)sustainable Environments Are Related to the Diffusion of COVID-19: The Relation between Coronavirus Disease 2019, Air Pollution, Wind Resource and Energy. Sustainability 2020, 12, 9709. [Google Scholar] [CrossRef]
  21. Coccia, M. High health expenditures and low exposure of population to air pollution as critical factors that can reduce fatality rate in COVID-19 pandemic crisis: A global analysis. Environ. Res. 2021, 199, 111339. [Google Scholar] [CrossRef] [PubMed]
  22. Akan, A.P.; Coccia, M. Changes of Air Pollution between Countries Because of Lockdowns to Face COVID-19 Pandemic. Appl. Sci. 2022, 12, 12806. [Google Scholar] [CrossRef]
  23. Gope, S.; Dawn, S.; Das, S.S. Effect of COVID-19 pandemic on air quality: A study based on Air Quality Index. Environ. Sci. Pollut. Res. 2021, 28, 35564–35583. [Google Scholar] [CrossRef] [PubMed]
  24. Yan, D.; Chen, G.; Lei, Y.; Zhou, Q.; Liu, C.; Su, F. Spatiotemporal Regularity and Socioeconomic Drivers of the AQI in the Yangtze River Delta of China. Int. J. Environ. Res. Public Health 2022, 19, 9017. [Google Scholar] [CrossRef] [PubMed]
  25. Kyrkilis, G.; Chaloulakou, A.; Kassomenos, P.A. Development of an aggregate Air Quality Index for an urban Mediterranean agglomeration: Relation to potential health effects. Environ. Int. 2007, 33, 670–676. [Google Scholar] [CrossRef]
  26. Hu, J.L.; Ying, Q.; Wang, Y.G.; Zhang, H.L. Characterizing multi-pollutant air pollution in China: Comparison of three air quality indices. Environ. Int. 2015, 84, 17–25. [Google Scholar] [CrossRef] [PubMed]
  27. Lei, R.Y.; Nie, D.Y.; Zhang, S.M.; Yu, W.N.; Ge, X.L.; Song, N.H. Spatial and temporal characteristics of air pollutants and their health effects in China during 2019-2020. J. Environ. Manag. 2022, 317, 115460. [Google Scholar] [CrossRef] [PubMed]
  28. Luo, H.P.; Guan, Q.Y.; Lin, J.K.; Wang, Q.Z.; Yang, L.Q.; Tan, Z.; Wang, N. Air pollution characteristics and human health risks in key cities of northwest China. J. Environ. Manag. 2020, 269, 110791. [Google Scholar] [CrossRef] [PubMed]
  29. Ma, Y.X.; Cheng, B.W.; Li, H.P.; Feng, F.L.; Zhang, Y.F.; Wang, W.C.; Qin, P.P. Air pollution and its associated health risks before and after COVID-19 in. Environ. Pollut. 2023, 320, 121090. [Google Scholar] [CrossRef]
  30. Feng, X.; Zhang, X.; He, C.; Wang, J. Contributions of Traffic and Industrial Emission Reductions to the Air Quality Improvement after the Lockdown of Wuhan and Neighboring Cities Due to COVID-19. Toxics 2021, 9, 358. [Google Scholar] [CrossRef] [PubMed]
  31. Huang, X.; Ding, A.; Gao, J.; Zheng, B.; Zhou, D.; Qi, X.; Tang, R.; Wang, J.; Ren, C.; Nie, W.; et al. Enhanced secondary pollution offset reduction of primary emissions during COVID-19 lockdown in China. Natl. Sci. Rev. 2021, 8, nwaa137. [Google Scholar] [CrossRef]
  32. Gao, H.; Wang, J.; Li, T.; Fang, C. Analysis of Air Quality Changes and Influencing Factors in Changchun during the COVID-19 Pandemic in 2020. Aerosol Air Qual. Res. 2021, 21, 210055. [Google Scholar] [CrossRef]
  33. Xue, W.; Shi, X.; Yan, G.; Wang, J.; Xu, Y.; Tang, Q.; Wang, Y.; Zheng, Y.; Lei, Y. Impacts of meteorology and emission variations on the heavy air pollution episode in North China around the 2020 Spring Festival. Sci. China-Earth Sci. 2021, 64, 329–339. [Google Scholar] [CrossRef] [PubMed]
  34. Li, M.; Liu, H.; Geng, G.N.; Hong, C.P.; Liu, F.; Song, Y.; Tong, D.; Zheng, B.; Cui, H.Y.; Man, H.Y.; et al. Anthropogenic emission inventories in China: A review. Natl. Sci. Rev. 2017, 4, 834–866. [Google Scholar] [CrossRef]
  35. Zheng, B.; Tong, D.; Li, M.; Liu, F.; Hong, C.P.; Geng, G.N.; Li, H.Y.; Li, X.; Peng, L.Q.; Qi, J.; et al. Trends in China’s anthropogenic emissions since 2010 as the consequence of clean air actions. Atmos. Chem. Phys. 2018, 18, 14095–14111. [Google Scholar] [CrossRef]
  36. Wang, K.; Gao, C.; Wu, K.; Liu, K.Y.; Wang, H.F.; Dan, M.; Ji, X.H.; Tong, Q.Q. ISAT v2.0: An integrated tool for nested-domain configurations andmodel-ready emission inventories for WRF-AQM. Geosci. Model Dev. 2023, 16, 1961–1973. [Google Scholar] [CrossRef]
  37. Emery, C.; Liu, Z.; Russell, A.G.; Odman, M.T.; Yarwood, G.; Kumar, N. Recommendations on statistics and benchmarks to assess photochemical model performance. J. Air Waste Manag. Assoc. 2017, 67, 582–598. [Google Scholar] [CrossRef] [PubMed]
  38. Boylan, J.W.; Russell, A.G. PM and light extinction model performance metrics, goals, and criteria for three-dimensional air quality models. Atmos. Environ. 2006, 40, 4946–4959. [Google Scholar] [CrossRef]
  39. Powers, J.G.; Klemp, J.B.; Skamarock, W.C.; Davis, C.A.; Dudhia, J.; Gill, D.O.; Coen, J.L.; Gochis, D.J.; Ahmadov, R.; Peckham, S.E.; et al. The Weather Research and Forecasting Model Overview, System Efforts, and Future Directions. Bull. Am. Meteorol. Soc. 2017, 98, 1717–1737. [Google Scholar] [CrossRef]
  40. Shang, Y.; Sun, Z.W.; Cao, J.J.; Wang, X.M.; Zhong, L.J.; Bi, X.H.; Li, H.; Liu, W.X.; Zhu, T.; Huang, W. Systematic review of Chinese studies of short-term exposure to air pollution and daily mortality. Environ. Int. 2013, 54, 100–111. [Google Scholar] [CrossRef]
  41. Cairncross, E.K.; John, J.; Zunckel, M. A novel air pollution index based on the relative risk of daily mortality associated with short-term exposure to common air pollutants. Atmos. Environ. 2007, 41, 8442–8454. [Google Scholar] [CrossRef]
  42. Chen, D.S.; Xie, X.; Zhou, Y.; Lang, J.L.; Xu, T.T.; Yang, N.; Zhao, Y.H.; Liu, X.X. Performance Evaluation of the WRF-Chem Model with Different Physical Parameterization Schemes during an Extremely High PM2.5 Pollution Episode in Beijing. Aerosol Air Qual. Res. 2017, 17, 262–277. [Google Scholar] [CrossRef]
  43. Hong, C.P.; Zhang, Q.; Zhang, Y.; Tang, Y.H.; Tong, D.; He, K.B. Multi-year downscaling application of two-way coupled WRF v3.4 and CMAQ v5.0.2 over east Asia for regional climate and air quality modeling: Model evaluation and aerosol direct effects. Geosci. Model Dev. 2017, 10, 2447–2470. [Google Scholar] [CrossRef]
  44. Zhang, Y.; Zhang, X.; Wang, L.T.; Zhang, Q.; Duan, F.K.; He, K.B. Application of WRF/Chem over East Asia: Part I. Model evaluation and intercomparison with MM5/CMAQ. Atmos. Environ. 2016, 124, 285–300. [Google Scholar] [CrossRef]
  45. Hu, J.; Chen, J.; Ying, Q.; Zhang, H. One-year simulation of ozone and particulate matter in China using WRF/CMAQ modeling system. Atmos. Chem. Phys. 2016, 16, 10333–10350. [Google Scholar] [CrossRef]
  46. Zhang, Y.; Wu, S.Y. Fine Scale Modeling of Agricultural Air Quality over the Southeastern United States Using Two Air Quality Models. Part II. Sensitivity Studies and Policy Implications. Aerosol Air Qual. Res. 2013, 13, 1475–1491. [Google Scholar] [CrossRef]
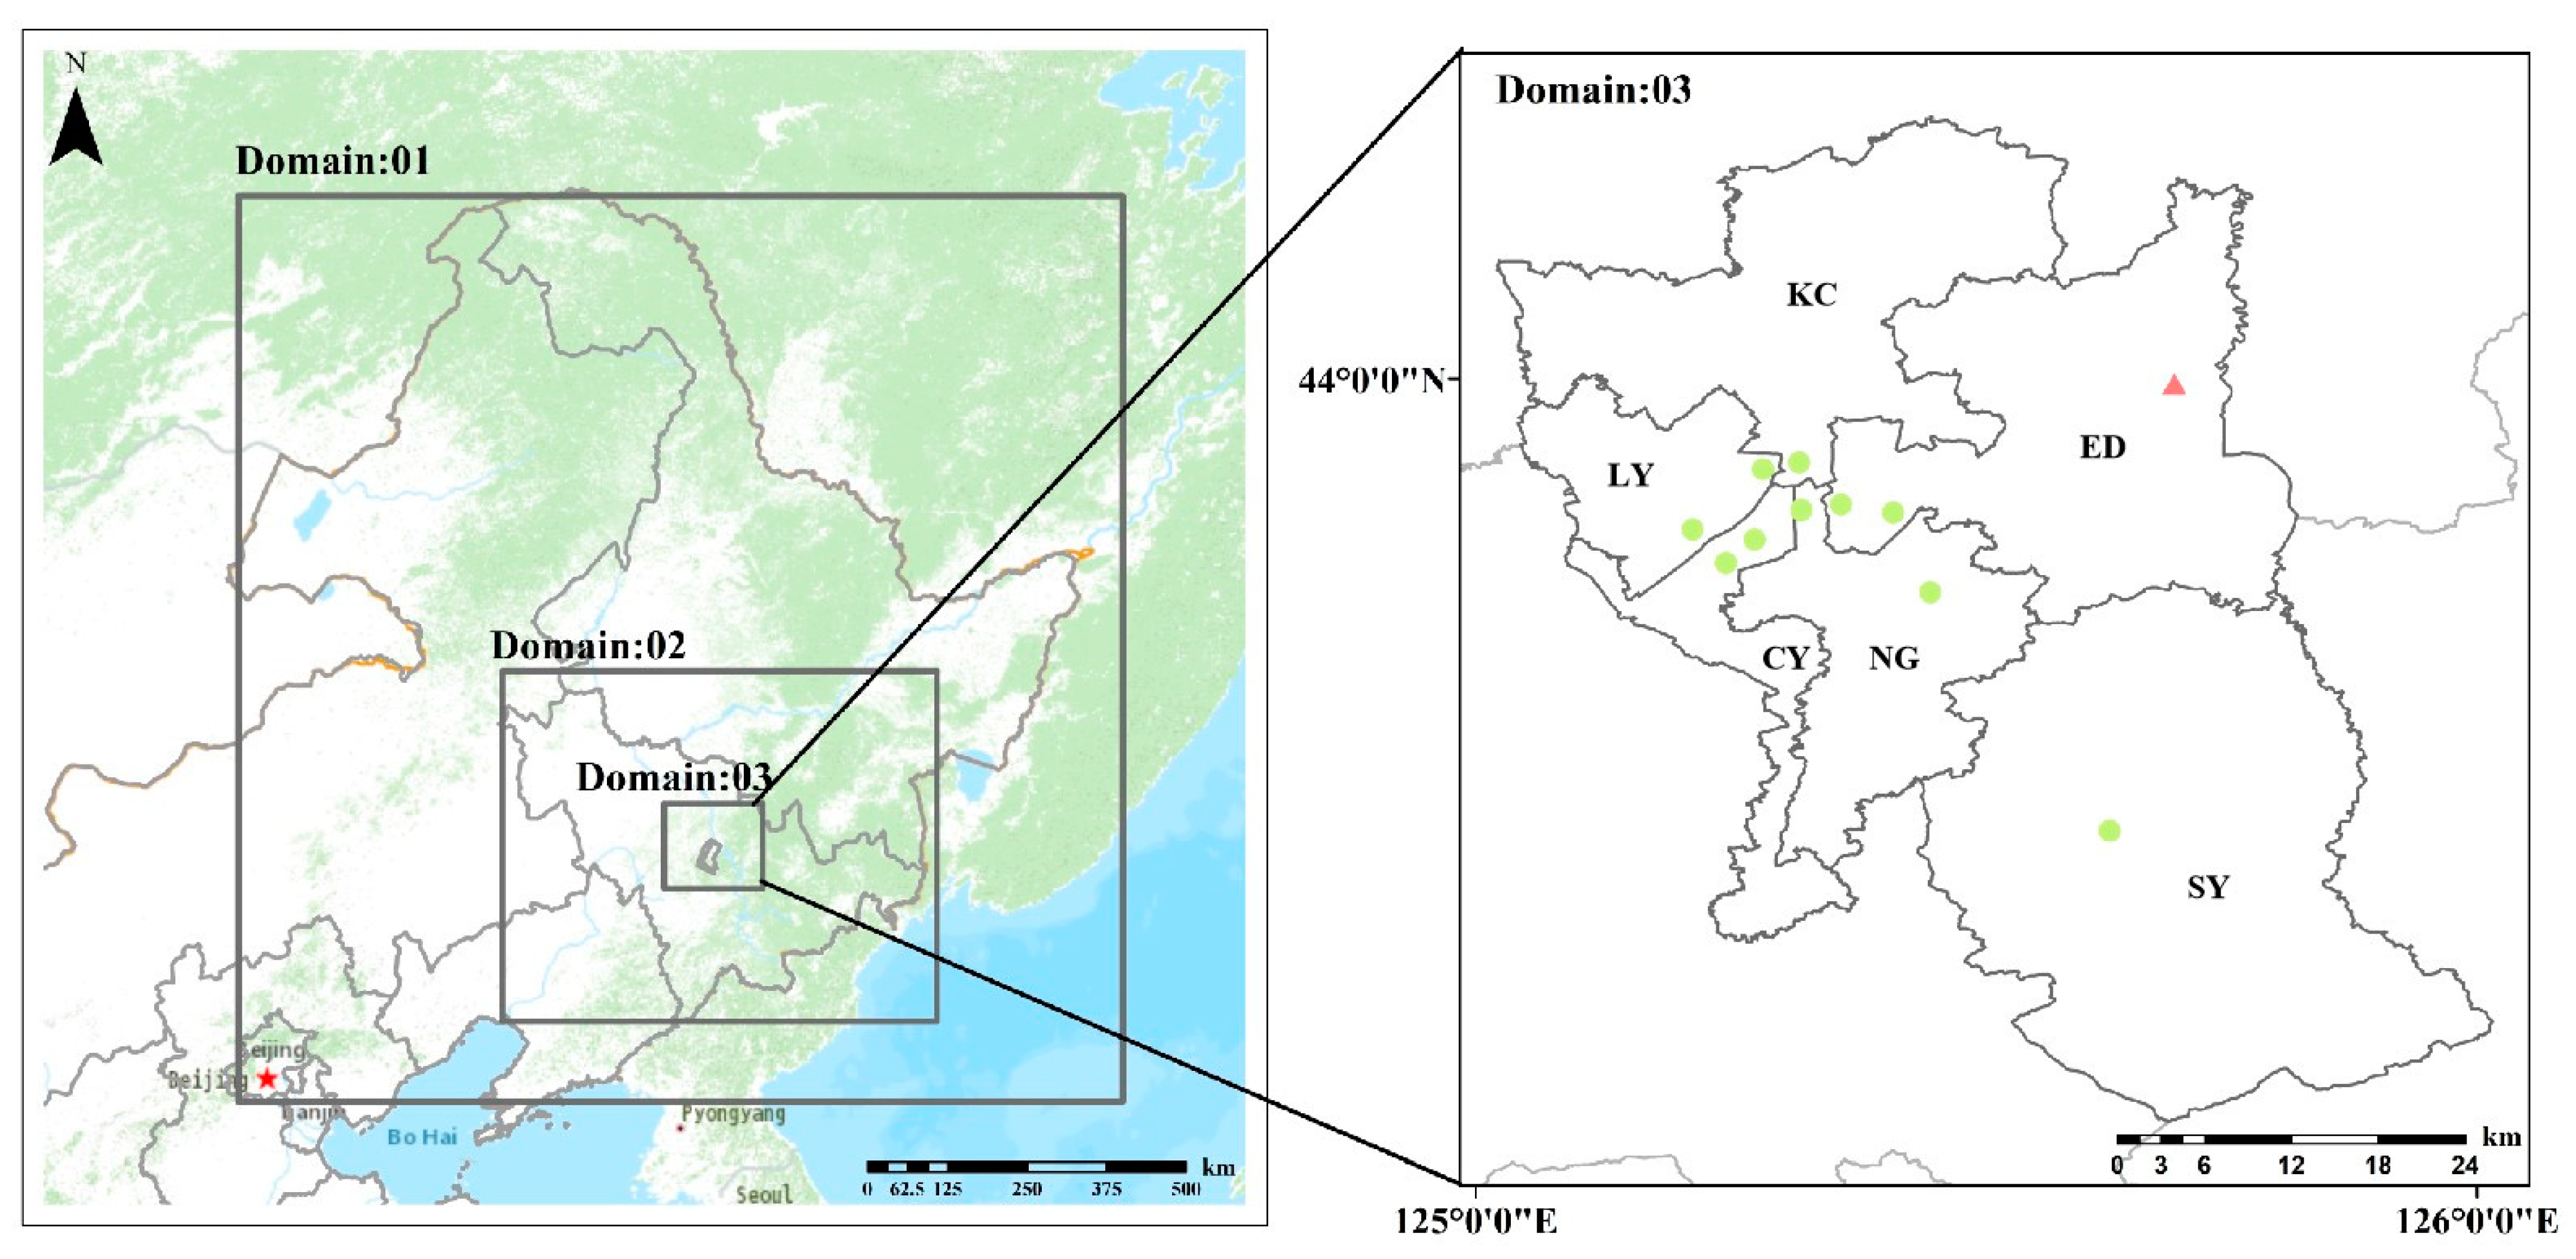
Figure 1. Study area (green circles shown atmospheric monitoring stations; red triangular represents meteorological stations, KC: Kuancheng District, LY: Lvyuan District, CY: Chaoyang District, NG: Nanguan District, ED: Erdao District, SY: Shuangyang District).
Atmosphere 15 00616 g001
Figure 2. Simulation results of WRF meteorological parameters in Changchun in 2017 and 2020 (2017 on the left, 2020 on the right).
Atmosphere 15 00616 g002
Figure 3. Box plot of daily average PM2.5 values in Changchun, January 2017–2020.
Atmosphere 15 00616 g003
Figure 4. CMAQ simulation results for each monitoring station in Changchun City in January 2017 and 2020 (2017 on the left, 2020 on the right).
Atmosphere 15 00616 g004
Figure 5. T2 (a), WS10 (b), and Wind Rose of Changchun (c: left: 2017, right: 2020) in January from 2017 to 2020 in Changchun.
Atmosphere 15 00616 g005
Figure 6. AP (a) and PBLH (b) in January from 2017 to 2020 in Changchun.
Atmosphere 15 00616 g006
Figure 7. Annual average mass concentrations of six pollutants in Changchun in 2017 and 2020 (The left y-axis is applicable to PM2.5, PM10, SO2, NO2, and O3, and the right y-axis is applicable to CO).
Atmosphere 15 00616 g007
Figure 8. Percentage of days in six AQI health categories in Changchun in 2017 and 2020.
Atmosphere 15 00616 g008
Figure 9. Hourly change in air quality index in Changchun in 2017 and 2020.
Atmosphere 15 00616 g009
Figure 10. Distribution of NHAQI days in each category for 2017 and 2020 based on AQI health category determination.
Atmosphere 15 00616 g010
Figure 11. Spatial distribution of four-season NHAQI in Changchun city districts in 2017 and 2020 (KC: Kuancheng District, LY: Lvyuan District, CY: Chaoyang District, NG: Nanguan District, ED: Erdao District, SY: Shuangyang District).
Atmosphere 15 00616 g011
Figure 12. Average Total Excess Health Risk Values for Changchun City in 2017 and 2020.
Atmosphere 15 00616 g012
Table 1. List of the 10 individual air quality monitoring sites and the meteorological station.
NumberNameAbbr.Longitude (°E)Latitude (°N)
1Food Products FactoryFPF125.3143.92
2Bus Factory HospitalBFH125.2943.90
3Institute of Posts and TelecommunicationsIPT125.3043.85
4Labor ParkLP125.3743.87
5Gardern Management OfficeGMO125.3243.88
6Jingyue ParkJYP125.4643.79
7Economic Development Zone Environment Sanitary AdministrationEESA125.4243.87
8High-Tech Zone Management CommitteeHZMC125.2543.82
9Daishan ParkDP125.2243.85
10ShuaiwanziSWZ125.6343.55
11Longjia Airport Meteorological StationLJA125.7044.00
Table 2. Ranges of AQI values and the corresponding pollutant concentration limits and health categories.
AQIPM2.5PM10SO2NO2COMDA8 O3CategoryHealth Risks
(μg/m3)(μg/m3)(μg/m3)(μg/m3)(mg/m3)(μg/m3)
0–50355050402100ExcellentSatisfactory, no risk
51–10075150150804160GoodAcceptable, may be a moderate risk for a very small number of people
101–15011525047518014215Light pollutionUnhealthy for sensitive people (children, older adults, etc.)
151–20015035080028024265Moderate pollutionUnhealthy (everyone begins to have adverse health effects)
201–300250420160056536800Serious pollutionVery unhealthy (everyone experience more serious health effects)
301–4003505002100750481000Very severe pollutionHazardous (healthy people have significant symptoms)
401–5005006002620940601200
Table 3. Different scenarios were considered in this study.
Scenarios NameMeteorologicalEmission
Case1Meteorological of January 2017Emissions listing of 2017
Case2Meteorological of January 2020Emissions listing of 2017
Table 4. Statistical metrics for WRF model evaluation over Changchun in 2017 and 2020.
Meteorological ParametersYearMonitoring Mean ValueSimulated Mean ValueRNMBNMEMFBMFERMSE
T2 (°C)2017−13.15−16.720.83 **27.16%−31.40%28.37%33.88%4.66
2020−13.23−17.830.79 **74.22%39.80%34.36%35.98%4.92
WS10 (m/s)20173.424.040.64 **18.25%39.00%12.82%38.79%1.05
20202.683.470.51 **28.80%51.69%25.76%47.28%1.44
WD10 (degree)2017271.49289.150.74 **9.40%12.98%5.89%7.86%28.61
2020223.08238.640.68 **7.29%25.83%8.69%22.87%67.13
** By significant level 0.01 (two-sided) test.
Table 5. Error statistics of simulated PM2.5 concentrations and monitoring values in Changchun.
Monitoring SitesStatistical IndicatorsJanuary 2017January 2020
FPFSimulated Mean Value58.1084.55
Monitoring Mean Value90.46133.34
R0.67 **0.43 **
NMB35.57%36.00%
NME48.86%55.00%
MFB47.00%46.00%
MFE65.40%70.00%
BFHSimulated Mean Value54.0096.63
Monitoring Mean Value89.32112.82
R0.64 **0.23 **
NMB40.29%32.00%
NME51.35%60.14%
MFB48.00%41.20%
MFE69.29%68.21%
IPTSimulated Mean Value63.1591.82
Monitoring Mean Value99.05119.96
R0.55 **0.30 **
NMB36.37%17.20%
NME53.67%52.00%
MFB43.00%28.00%
MFE70.78%62.00%
LPSimulated Mean Value67.16101.10
Monitoring Mean Value97.93115.90
R0.49 **0.31 **
NMB26.50%12.10%
NME56.48%55.00%
MFB28.00%23.00%
MFE69.11%61.00%
GMOSimulated Mean Value68.46101.25
Monitoring Mean Value72.26108.96
R0.52 **0.31 **
NMB4.16%7.00%
NME58.70%56.00%
MFB10.00%21.00%
MFE66.36%61.01%
** By significant level 0.01 (two-sided) test.
Disclaimer/Publisher’s Note: The statements, opinions and data contained in all publications are solely those of the individual author(s) and contributor(s) and not of MDPI and/or the editor(s). MDPI and/or the editor(s) disclaim responsibility for any injury to people or property resulting from any ideas, methods, instructions or products referred to in the content.