Article

About the Possible Solar Nature of the ~200 yr (de Vries/Suess) and ~2000–2500 yr (Hallstadt) Cycles and Their Influences on the Earth’s Climate: The Role of Solar-Triggered Tectonic Processes in General “Sun–Climate” Relationship

Bulgarian Academy of Sciences—Institute of Astronomy, Blvd Tsarigradsko Shausee 72, 1784 Sofia, Bulgaria
Atmosphere 2024, 15(5), 612; https://doi.org/10.3390/atmos15050612
Submission received: 28 December 2023 / Revised: 5 February 2024 / Accepted: 12 February 2024 / Published: 19 May 2024
(This article belongs to the Special Issue The Influence of Solar Cyclicity on the Earth’s Climate)

Abstract

:
(1) Introduction: The subject of the present study concerns the analysis of the existence and long time evolution of the solar ~200 yr (de Vries/Suess) and ~2400 yr (Hallstadt) cycles during the recent part of the Wurm ice epoch and the Holocene, as well as their forcing on the regional East European climate during the last two calendar millennia. The results obtained here are compared with those from our previous studies, as well as with the results obtained by other authors and with other types of data. A possible scenario of solar activity changes during the 21st century, as well as different possible mechanisms of solar–climatic relationships, is discussed. (2) Data and methods: Two types of indirect (historical) data series for solar activity were used: (a) the international radiocarbon tree ring series (INTCAL13) for the last 13,900 years; (b) the Schove series of the calendar years of minima and maxima and the magnitudes of 156 quasi 11 yr sunspot Schwabe–Wolf cycles since 296 AD and up to the sunspot cycle with number 24 (SC24) in the Zurich series; (c) manuscript messages about extreme meteorological and climatic events (Danube and Black Sea near-coast water freezing), extreme summer droughts, etc., in Bulgaria and adjacent territories since 296 and up to 1899 AD, when the Bulgarian meteorological dataset was started. A time series analysis and χ2-test were used. (3) Results and analysis: The amplitude modulation of the 200 yr solar cycle by the 2400 yr (Hallstadt) cycle was confirmed. Two groups of extremely cold winters (ECWs) during the last ~1700 years were established. Both groups without exclusion are concentrated near 11 yr sunspot cycle extremes. The number of ECWs near sunspot cycle minima is about 2 times greater than that of ECWs near sunspot cycle maxima. This result is in agreement with our earlier studies for the instrumental epoch since 1899 AD. The driest “spring-summer-early autumn” seasons in Bulgaria and adjacent territories occur near the initial and middle phases of the grand solar minima of the Oort–Dalton type, which relate to the downward phases and minima of the 200 yr Suess cycle. (4) Discussion: The above results confirm the effect of the Sun’s forcing on climate. However, it cannot be explained by the standard hypothesis for total solar irradiation (TSI) variations. That is why another hypothesis is suggested by the author. The mechanism considered by Svensmark for galactic cosmic ray (GCR) forcing on aerosol nuclei was taken into account. However, in the hypothesis suggested here, the forcing of solar X-ray flux changes (including solar flares) on the low ionosphere (the D-layer) and following interactions with the Earth’s lithosphere due to the terrestrial electric current systems play a key role for aerosol nuclei and cloud generation and dynamics during sunspot maxima epochs. The GCR flux maximum absorption layer at heights of 35–40 km replaces the ionosphere D-layer role during the sunspot minima epochs.

1. Introduction

1.1. Solar Activity through the Holocenee

The problem of solar–climatic relations during the Holocene epoch (the present interglacial epoch, i.e., the last ~11,000 years) is often and closely related to studies and comparison of so-called “historical” solar activity and climatic time series spectra. On the basis of many studies over the last few decades, it was established that statistically significant quasi-cyclic oscillations of ~200 and ~2000/2200–2500 years (labeled also as “Hallstadt”, see below) are the most frequent features in the above-mentioned time series types. That is why the studies of problems regarding these cycles are of great importance for better understanding solar–climatic relationships during the present interglacial epoch, as well as for better understanding the physical mechanisms of the Sun’s and climate variations.
The longest solar activity instrumental time series for sunspot numbers and group sunspot numbers covers the last ~400–420 years, since 1700 as mean yearly values and since 1749 as mean monthly ones [1,2,3]. The instrumental sunspot activity data for the 17th century since 1610 are known too roughly. They contain serious uncertainties, mainly due to the technical imperfection of the used telescopes, as well as due to the grand solar Maunder minimum (1642–1720) [3]. The corresponding solar instrumental time series for radio-bursts, flares, coronal mass ejections, etc., are significantly shorter. None of them exceed 70–75 years. The continuous data for geomagnetic Ap and Aa indexes, which are sometimes used as solar activity proxies, are also relatively short. They start in 1932 and 1868, respectively.
That is why different types of indirect proxies are used for solar activity reconstruction over longer time intervals exceeding near and before the 17th century. They are often called “historical” solar activity records [4].
There are three basic types of historical solar activity data series, based on different methods for their building.

1.1.1. Method of Witness

The first type is called “method of witness” [5]. In this case, the solar activity level for the corresponding calendar moment is estimated on the basis of documenting messages for specific events in the corresponding epoch. These events are considered as indirect indications for extremely high or low solar activity, such as observed aurora, giant sunspots and/or sunspot groups visible to the naked eye, bright comets, powerful earthquakes, extremely cold winters, dry and hot summers, etc. These messages are based on direct observations of authors or on indirect information (tales of eyewitnesses).
A classic example of using the witness method is the so-called “Schove series” named after its author, the British scientist Derek J. Schove, at the beginning of the 1950s [6]. This is a dataset for the main sunspot Schwabe–Wolf cycle macro-parameters (the calendar years of sunspot cycle minima and maxima and the near-maximum magnitude index). The Schove series was built on the basis of a very large number of ancient and/or medieval messages for the last ~2600 years since 642 BC. The latter relate mainly to descriptions of aurora, as well as giant sunspots, extreme climatic events, earthquakes, and tree ring width data. The Schove series has been continuous since 296 AD. There are a lot of missing data during the earlier epoch and especially before 219 BC, as well as in the 3rd century. The Schove series was improved by this author at the beginning of the 1980s [7].

1.1.2. Solar Activity and “Cosmogenic” Radio-Isotopes

The second type of historical solar data is based on measurements of relative and/or absolute abundances of atmospheric radio-isotopes. They are generated in the stratosphere and upper troposphere due to the interaction of galactic cosmic ray (GCR) particles (mainly protons) and atmospheric atoms and molecules. Since the GCR flux penetrating into the Earth’s atmosphere is in a reverse relationship with the solar wind flux and the total solar magnetic flux, the production of “cosmogenic” isotopes anticorrelates with the sunspot activity level (“Forbush-effects” [8,9,10]). The relatively non-stable radioactive “cosmogenic” isotope atoms, after their production in the stratosphere, connect to a natural physico-chemical cycle in the Earth’s environment, specific to the corresponding chemical elements. The final deposit of corresponding atoms occurs in natural objects with layer or ring structures on the surface, such as tree rings, polar and mountain glaciers, corals, speleological samples, marine and lake sediments, etc. A calendar calibration for the different parts of these layer or ring structures is possible. The last fact, in addition to highly precise measurements of cosmogenic isotope atoms and a correction for the half-life time, gives the opportunity for the reconstruction of isotope atom abundance as well as GCR flux penetration into the Earth’s atmosphere in the past. As the final result, solar activity levels in the corresponding epochs can be extracted.
There are currently two main groups of solar activity historical data based on precise cosmogenic isotope measurements, namely for 14C and 10Be, respectively. We should note some significant differences between the datasets based on these kinds of atoms. The used data, methods, obtained results, and their analysis, including also the reconstructions of solar activity behavior in the past, are described in a great number of papers and books from the 1950s to the present. The published materials cited here are only a very small part of all of them [11,12,13,14,15,16,17,18,19,20].

1.1.3. The “Nitrate Method”

The third, a relatively new method of historical solar activity data extraction, is based on measurements of nitrate components (NOx) in polar and mountain glaciers [21,22]. These data can indicate the effects of strong solar proton events. However, the noise in these data is too high and they are not usable at this stage for very long calendar intervals in the past.

1.2. The ~200 yr (Suess) and 2000–2500 yr (Hallstadt) Cycles in Solar Activity and Climate

On the basis of a detailed comparison between the parameters of separate Schwabe–Wolf sunspot cycles (SC) in his series, Derek Schove showed that this most-expressed sunspot activity oscillation retains its quasi-periodic stability with a mean duration of ~11.1 years during the last two thousand years [6,7]. However, the other results of Schove’s study are also very interesting and important for our present study, because they relate to sunspot activity changes on quasi-century and super-century time scales.
Schove “de facto” confirmed the existence of a quasi-periodic sunspot oscillation with a duration of 7 Sc, i.e., ~77–78 years. This cycle was first established by Gleissberg in 1944 [23] using a morphological analysis of the instrumental Zurich sunspot series; since 1749. On the other hand, the picture of this quasi-century cycle is much more complicated, because in the Schove series, not only does a 77 yr cycle exist, but there is also a “multiplet” of oscillations with durations in the range from 50–55 to 130 years. However, the most interesting result relates to Schove establishing a sunspot cyclic tendency with a duration of 176–180 years, i.e., ~16 Sc. After 1000 AD, the minima of this quasi bi-century cycle occurs in the odd-numbered calendar centuries. (Note: In this paper, the signature “AD” for calendar years is usually avoided since the 15th century as default. For the first calendar millennia, it is always used due to possible relations to older calendar dates, which belong to the BC epoch. The signature “BC” (before Christ) is always used where it needs to be.).
About a year earlier, i.e., in 1954, Anderson reported the establishment of a 169 yr cycle in sunspot activity on the basis of instrumental data analysis since 1749 [24]. On the other hand, in 1957, a sunspot cycle with a duration of 176–180 years was established by Bonov [25] on the basis of analysis of the longest instrumental sunspot activity data series since 1610.
In 1958, the Netherlands scientist Hessel de Vries systematic secular variations in the carbon-14 density in annual tree ring widths. They were interpreted as real fluctuations in the standard 14C density depletion model that follows from the radioactive half-time law (“de Vries effect” [11]). In the 1960s, it was shown that the above-mentioned fluctuations are connected to long-term solar activity variations [13] and that they have been cyclic with a mean period of ~200 years during the last ~1300 years [12]. The existence of a bi-century cycle in the cosmogenic isotope 14C and 10Be time series, as well as its solar origin during the last ~50 years, was reported by many other authors [14,15,16,26]. The 200 yr oscillation is often also labeled the “Suess cycle” in honor of one of its co-discoverers, the Austrian-American chemist and nuclear physicist Hans Eduard Suess ((1909–1993), https://en.wikipedia.org/wiki/Hans_Suess; accessed on 15 December 2023).
Indeed, the first report about the existence of a quasi bi-millennial (2000–2500 yr) cycle in the Holocene carbon-14 tree ring data was made by Houtermans in 1971 [27].
In 1997, Komitov [28], using the T-R periodogram algorithm (see Section 2.2), obtained a strong quasi bi-century cycle with a mean duration of 204 years (~18.5 Sc) in the continuous part of the Schove series (since 296 AD). A 204 yr cycle was also found in the tree ring 14C for the same time interval in the same study. The delay of the 14C data relative to the Schove series was established to be 2 Sc, i.e., ~22 years. Thus, the evidence that the bi-century Suess cycle in radiocarbon data corresponds to the bi-century cycle in the Schove series was obtained. The 14C data delay corresponds well to the so-called “resident time” that follows from the 14C physical transfer processes in the Earth‘s environment. We note that a 176–180 yr cycle was determined by J.D. Schove on the basis of visual morphological comparisons for the 11 yr cycle magnitudes. The 200–210 yr cycle amplitude modulation by 2000–2500 yr has been studied in [15,29,30] (see below for more details).
During the last few decades, there has been an international program for studies of 14C variations in different natural reservoirs (tree rings, speleological structures, corals, lake sediments, etc.) known as the IntCal Working Group (IWG). The basic aim of this group is the (int)er(cal)ibration of radiocarbon data, which are obtained from different natural reservoirs in different places of the world and methods. Thus, the label IntCal or INTCAL for the data products of this group is used.
It was pointed out by Eddy [31] that the last radiocarbon 2000–2500 yr cycle maximum corresponds well to the very deep sunspot grand solar Mau{nder minimum in the 17th century. On the other hand, Eddy also suggested that the previous Holocene 14C maxima also corresponded to the sunspot Maunder type minima. Recently, the radiocarbon quasi bi-millennial cycle, as well as its solar origin, was analyzed in detail by Damon and Sonett [15]. The label “Hallstadt” for the quasi bi-millennial 2000–2500 yr cycle has been used since the 1970s, but no recently than 1990. (Note: Hallstadt is a town in Germany, Bavaria, from which region many tree samples for radiocarbon studies during the second half of the 20th century were sourced.) Evidence that the amplitude of the 200–210 yr cycle is modulated by the Hallstadt cycle were found by these authors; the highest Suess cycle amplitudes correspond to radiocarbon Hallstadt maxima (i.e., sunspot Maunder-type minima), while the weakest 200–210 yr cycles occur during the radiocarbon Hallstadt minima epochs, i.e., highest sunspot activity. Thus, each Hallstadt cycle is divided into two phases with a mean duration of 1000 to 1200–1250 years.
In 1993, Dergachev and Chistyakov suggested a more detailed model for the amplitude structure of the Hallstadt cycle [32]. According to the latter, the Hallstadt can be divided into four phases, as follows:
  • The initial active increasing phase, with a general upward tendency of the quasi 11 yr Schwabe–Wolf cycle amplitudes. It starts after a Maunder-type minimum and has a duration of 300–400 years.
  • “Plateau”—a relatively quiet phase with a duration of 600–800 years, when the Schwabe–Wolf cycle amplitudes are predominantly moderate or high.
  • Main upward phase—a tendency for new sunspots to increase. The Hallstadt cycle reaches its maximum.
  • The long descending phase reaching the next Maunder-type minimum approximately 2200–2400 yrs after the previous one.
The amplitude modulation of the quasi 200 yr Suess cycle by the Hallstadt was also confirmed by Komitov et al. [29] and Bonev et al. [30] for the Holocene tree ring 14C data, as well as for the Schove series [29].
In 2003 and later in 2013, Komitov and Kaftan [33,34] suggested another improved amplitude structure model of the Hallstadt cycle. A new moment in relation to the Dergachev–Chistyakov model is the addition of a secondary minimum between the “plateau” and the main upward phase. This secondary minimum phase lasts approximately 300–400 years and it is not as deep as the Maunder-type minima. It follows from this model that the Hallstadt could be considered as formed from two waves with durations of 1000–1200 years. The first one is lower and its maximum corresponds to the “plateau” phase, while the maximum of the second wave is the main Hallstadt cycle maximum.
These and other facts regarding the quasi bi-century and quasi bi-millennial cycles in the historical solar activity data series and in the context of the results obtained in the present study are given in Section 5 (“Discussion”).
The first reports on the existence of quasi bi-century oscillations in the climate are too difficult to trace in the bibliographic sources. It can be considered as certain that at the beginning of the 1960s, such reports already existed [35,36]. There is an estimate by Damon in 1968 that solar-modulated quasi 200 yr climatic oscillations cause mean variations in global temperature of ~0.8 °C [15]. Recently, the presence of strong ~200-year solar–climate variations was discussed by Dergachev and Chistyakov [32], Dergachev [16,37], Wang et al. [38], Hodell et al. [39], andAbdussamatov [40]. It is also interesting to note the study by Raspopov et al. [41] regarding the quasi 200 yr cyclic oscillations in the annual tree ring widths of Juniperus turkestanica in Central Asia. The main visible effect of the Suess solar cycle’s influence on climate is a good coincidence of the grand solar minima of Oort, Wolf, Spoerer, Maunder, and Dalton (in the 11th, 13–14th, 15th, 17th and 19th centuries, respectively). The corresponding serious decreases in planetary mean temperatures are in the range of 0.3–0.4 to ~1 °C but are typically ~0.8 °C [15].
The first reports on a climatic 2000–2500 yr cycle during the Holocene are dated around 1970–1975. The quasi bi-millennia oscillation was established in glacier dynamics [42,43,44]. The corresponding temperature minima of the above-mentioned oscillation were labeled as “little ice epochs” (LIE) [37,42,43,44]. The evidence that the little ice epochs are in coincidence with the Maunder-type minima of the radiocarbon Hallstadt cycle is given by Eddy [32,43]. Damon and Sonett also related the little ice epochs to the Maunder-type minima of the Hallstadt cycle [15]. It is interesting in this study that evidence of Hallstadt modulation of the planetary temperature during the great Wurm ice epoch is also given. Hallstadt forcing on climate is also a subject of the papers by Dergachev and Chistyakov [32] as well as by Dergachev [4,37]. Examples of the above mentioned are the traces of the LIE cycle in the World Ocean level, as well as the migrations of human population in the Arctic and sub-Arctic regions during the Holocene. Evidence that there is a serious influence of the LIE-cycle (and the Hallstadt, correspondingly) on large-scale social events, such as the great migration periods during documented history, i.e., the last 5000–5500 years, are given by the author [45]. This example demonstrates how large-scale solar activity influences on climate can seriously affect historical processes. The latter makes the problem of the long-term solar activity variations (and especially the Suess and Hallstadt cycles), as well as their forcing on climate, even more important and interesting.
That is why the subject of our present study is also focused on the historical data for solar activity and their relationship to the climate. Two types of results will be presented in this paper. One part of them was obtained already between 2000 and 2010, but at this moment they have not been presented in reviewed papers partly or in full. The other part is based on new analysis and/or data.
The separated tasks are as follows:
  • Time series analysis by using the T-R periodogram algorithm [28,45,46] of the last version of tree ring width 14C series (INTCAL13) during the last 13,900 years (i.e., the most recent part of the Wurm ice epoch plus the Holocene) [47]. This task involves searching for the existence and statistical significance of cycles in the range of periods from 10 to 10,000 years with a focus on the Suess (200–210 yr) and Hallstadt (2000–2500 yr) cycles.
  • Study of the amplitude evolution of the Suess cycle on the basis of INTCAL13 data during the recent Wurm and Holocene and a possible modulation by the Hallstadt or other cycles of longer duration. A comparison with the results of earlier studies is made [15,28,30].
  • Comparison of the results obtained for 14C in 1 and 2 with the corresponding ones for the continuous part of the Schove series, i.e., the last ~1700 years since 296 AD. How does the continuous part of the Schove series relate to the Hallstadt cycle?
  • Analysis of extreme climate events (very cold winters and hot/dry summers etc.) in relation to the corresponding phases of the quasi 11 yr Schwabe–Wolf, ~200 yr Suess, and 2000–2500 yr Hallstadt cycles during the last ~1700 years. The Schove series is used as a solar activity proxy.
The description of the used data and methods are given in Section 2 (“Data and methods”), the obtained results and their analysis are presented in Section 3 (“Results and Analysis”). A detailed discussion is presented including, additionally, comparisons of the presented results with those obtained by numerical models of stratosphere 14 C production and, on this basis, a reconstruction of the heliosphere modulation potential during almost the entire Holocene is possible [48]. A comparison of the present results with other historical solar activity datasets, namely the Chinese catalogue of giant visible sunspots [49], is made. A discussion about possible mechanisms of solar–climatic relationships is also given there. A summary of the main results is given in Section 5.

2. Data and Methods

2.1. Data

The free available INTCAL13 time series [47], containing the relative variations in 14C concentration in annual tree ring widths compared to the international radiocarbon standard (Δ14C%), was used for studying their general T-R spectra during the last ~13,900 years (the recent Wurm and Holocene). The used calendar interval is 11,000 BC–1900 AD. The time series step of INTCA13 in this calendar interval is 5 years. The second main task, for which INTCAL13 was used, is the study of the Suess cycle amplitude modulation by the Hallstadt. The corresponding methods, based on the T-R periodogram algorithm, are described in Section 2.2.
The continuous part of the Schove series since 296 AD was taken on the basis of its second (last) release [7]. The macro-parameters of the last few Schwabe–Wolf sunspot cycles including up to SC24 were taken on the basis of the “classical” instrumental data (SILSO_v1) founded by Rudolph Wolf [1]. I note that the SILSO_v1 series was updated in the Belgium Royal Observatory until 1 July 2015. After that, it was replaced by the new SILSO_v2 series [50]. It should be pointed out that the magnitude index of quasi 11 yr sunspot Schwabe–Wolf cycles is calibrated according to the classic Wolf number (i.e., SILSO_v1 standard) [1,2]; thus, SILSO_v2 is not suitable for the aims of the present study. The used-here numbering of sunspot cycles in the Schove series (SH) started in 284 AD. It coincided with the Schwabe–Wolf sunspot cycle minimum according to [1,2] and was assigned the number SH0. The next cycle, starting in 296 AD, became number SH1, etc., while in the sunspot cycle, Zurich series number 24 (SC24) is numbered in our Schove series version as SH156. Thus, the even-odd numbering in the Schove series and in the Zurich series is saved for one and the same quasi 11 yr sunspot cycles.
As it is mentioned above, the Chinese catalogue of giant eye-visible sunspots was published by Wittmann and Xu [49]. In the present study, it is used in the Discussion part (Section 4).
The data on extreme climate events in Bulgaria and adjacent territories before 1899 are based on messages from the Late Antique, the Bulgarian Middle Age epoch, and the Ottoman Empire epoch (before 1800 AD), in manuscript type, while during the 19th century, both Bulgarian manuscripts and printing sources were available. They can be classified as types of events, as follows:
  • Danube low basin river full freezing (DF);
  • Black Sea coast water full freezing (BSF);
  • Very cold winters, but without information for Danube or Black Sea freezing events (CW);
  • Dry and hot summers with serious economic, social and/or military effects (DHS);
  • Very tormentuous summer season (VTS);
  • Very cold and rainy summer (CRS);
  • Warm winter (WW)
  • Other extreme (non-climate) events, like epidemics (EPs) or earthquakes/volcanos (EVs).
The basic source for extreme climatic events during the Late Antique (the 3rd–7th centuries) and the Bulgarian Middle Ages (the 7th–14th centuries) is the Vasil Zlatarski monograph “History of the Bulgarian State in Middle Ages” [51]. An additional important manuscript source is the “Chronicle” of Theophanes Confessor [52], especially for the events during the 6th–8th centuries. Other information, which relates to Danube and Black Sea coast-water freezing even since 250 AD, was taken from the Bulgarian web address www.moreto.net/novini.php?n=31575/ accessed on 15 December 2023. The total number of extreme climatic events during the Late Antique and Bulgarian Middle Ages is 24, and 17 of them relate to extremely cold winters (DF and/or BSF), 2 to warm winters (WW), 1 to a very tormentuous summer season (VTS), and 4 to dry and hot summers (DS).
The list of the used phenomena, of which 37 occurred before the instrumental era and 7 during the last one, is shown in Table 1.
The data about extreme climatic events, which were found for the first three centuries of the Ottoman empire period, i.e., 1396–1700 AD, are also relatively poor. The corresponding sources can be found in [53,54]. The data for the 19th century used in this study are published in [55,56,57]. On the other hand, the data for the epoch 1780–1898 were complemented by the dendrochronological climatic data for the European beech (Fagus sylvatica) vegetation season (April-October) for the epoch 1780–1899 [46].
The total number of the found extreme climatic events on the territory of Bulgaria for the whole pre-instrumental interval 296–1898 AD is 36 (Table 1). There are also three other non-climatic events added—the continuous seismic activity period (EQ) plus the epidemic of scarlet fever (EP), where both phenomena coincide in time with a very rainy (and maybe warm?) winter season in 1037 AD.
This dataset, on first glance, seems too poor for quantitative analysis. It is strongly necessary to note that no primarily preferable selection procedure over these data was made. Thus, they are not applicable for time series analysis. However, on the other hand, it is possible to use them to study the distribution of these extreme climate events in relation to the quasi 11 yr sunspot Schwabe–Wolf cycle or to study the phases of the Suess and Hallstadt cycles during the last ~1700 years (see Section 3 and Section 4).

2.2. Methods

The T-R periodogram algorithm (or T-R Periodogram Analysis, TRPA) was used here for the detection of statistically significant cycles in the studied Schove and INTCAL13 series. In the basic version, the TRPA was suggested by the author in 1986 [58]. Recently, additional improvements have been made by the author [28,46], as well as by Bonev et al. [30]. The “standard mode” of TRPA was also recently described in detail in [46] (see also the brief description in Section 2.2.1).
As has already been noted in Section 1, one of important tasks of this work is to study the amplitude evolution of the quasi bi-century (Suess) cycle and, if it exists, to detect possible amplitude modulation by the Hallstadt cycle. Two procedures based on TRPA were used here, one using the “integral power index” S (see [27,46]) and one using the TRPA scalogram mode [45].

2.2.1. Integral Power Index S

As was shown in our works cited above [28,46,59], the essential moment in TRPA is least square procedure scanning with a simple periodic function of the type:
φ ( t ) = Y ( t ) A 0 = A cos ( 2 π t T ) + B sin ( 2 π t T )
with a monotonic increase in the period T in the range between To and Tmax for each scan with a linear step ΔT. Y(t) are the values of the time series terms for moments t, which are defined by their number, i.e., t = 0, 1, 2 … N − 1. N is the number of terms in the time series for moments t. A0 is the average value of the time series values, i.e.,
A 0 = t = 0 N 1 Y ( t ) N
For each derived minimized function φ(t,T), the corresponding coefficient of correlation R(T) is calculated. The coefficient of correlation R(T) is taken as a criterion for the relationship between the real data series Y(t) and minimized function ϕ(t) for the corresponding period T if the condition R(T)/σR ≥ 3.46 is valid. For more details regarding statistical significance of cycles in TRPA, see [46].
This is the standard, most often used case of this method.
In the course of the TRPA procedure, the coefficients A(T) and B(T), as well as the amplitude a ( T ) = A ( T ) 2 + B ( T ) 2 , are also calculated. On this basis, a transition from the T-R spectrum R(T) to amplitude ones is possible. On the other hand, the parameter
S = T 1 T 2 a ( T ) d T
called the “integral power index” is used [27,46].
This is a very useful parameter to investigate the amplitude evolution of a simple cycle, if its period T varies in the different parts of the investigated time series Y(t) around a mean value Tm while in the range [T1,T2]. In this case, it needs to take a “window” from L consequent terms of the time series, where L << N but is longer than the studied cycle of mean duration Tm. The stages are as follows:
  • Y(t) is scanned by the “window”, whose length is L, starting from the initial term Y(0) to Y(L − 1), on the next step from Y(1) to Y(L), etc. Thus, from the primary Y(t) time series, from length L, one could derive NL + 1 “sub-series” using this “smoothing window” operation. The center of each ith sub-series (smoothing window) is tc = t + L/2.
  • For each derived “sub-series” with length L, the TRPA procedure is provided. It needs a spectra interval [T0,Tmax] to be chosen so that the limits T1 and T2 of S are inward.
  • The calculation of S using the Formula (4) for all consequent “sub-series” follows. The amplitude variations of the oscillations in the range [T1,T2] and mean period Tm can be shown on the two-dimensional plot (tc,S(tc)).
  • The obtained S(tc) series can be investigated by TRPA or another time series analysis procedure for searching cycles and/or trends. Thus, the amplitude modulation of the detected cycle with a mean duration Tm in the primary Y(t) series by longer cycles is possible.
In our case, “smoothed windows” (sub-series) with a length of L = 300 years for the calculation of S-parameters for the bi-century cycle (S200) with a mean duration Tm = 204 yr both in the Schove series and INTCAL13 (the latter is 11,000 years) were used. The low (T1) and upper (T2) limits are 170 and 237 years, correspondingly, for INTCAL13.

2.2.2. TRPA-Scalograms

The TRPA-scalograms are another way to present the T-R spectra, which were obtained by using the “smoothed window” procedure for the corresponding selected sub-series. This is an analogue of scalograms used in wavelet analysis [59]. The software procedure developed by the author allows for the building of TRPA scalograms not only for the amplitudes a(tc,T), but also for the coefficient of correlation R(tc,T) and ratio R(tc,T)/σR [45].

3. Results and Analysis

3.1. The INTCAL13 Tree Ring Data Series

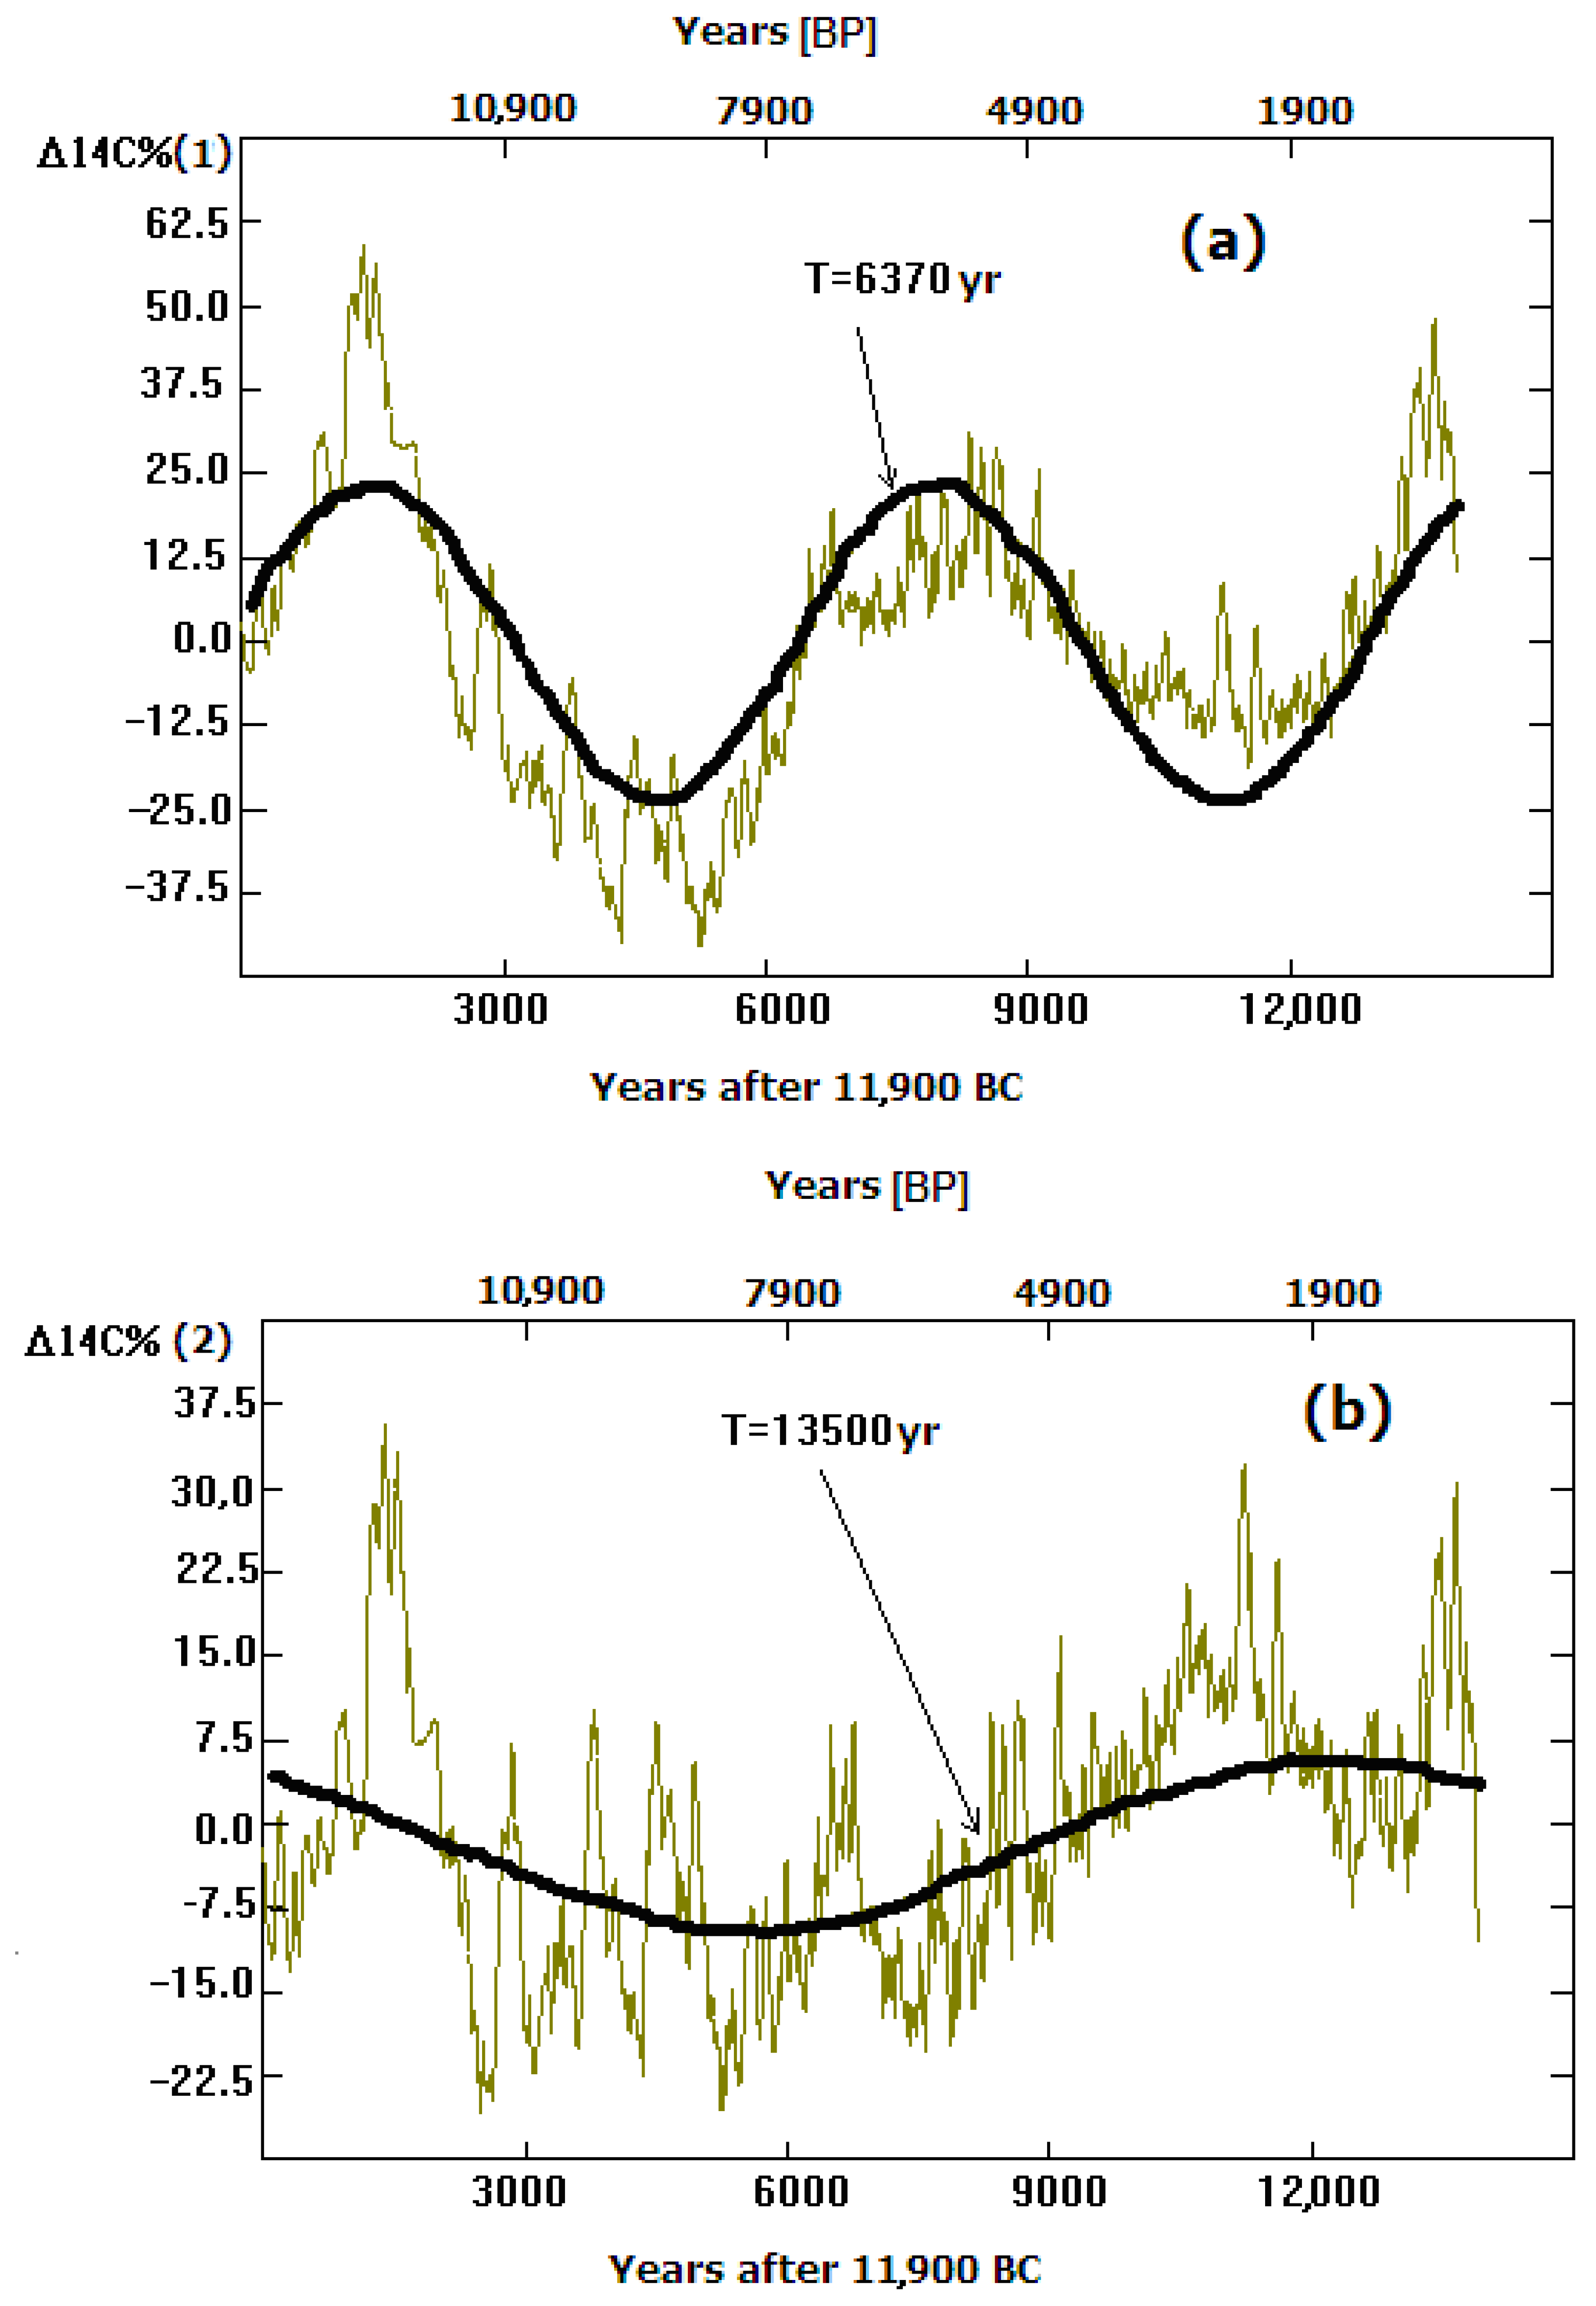
In Figure 1, the primary Δ14C% INTCAL13 series for the calendar interval 11,000 BC–1900 AD is shown. A super-millennial downward trend is clearly visible. The origin of the latter is too complex and might be caused by different reasons—the Earth’s magnetic dipole intensity and extremely long solar activity changes, changes in “interstellar wind” parameters near the Solar system, the transition process between the Wurm and the Holocene epochs in relation to biosphere changes, etc. For the first steps of the present study, the trend is not interesting and needs just to be removed. One can note in advance, that there is an overall effect of the geomagnetic dipole moment M, solar activity, climate, and biosphere changes.
It was found that the best fit is based on linear regression, in which the coefficient of correlation with the primary data is r = −0.957.
The residual data after removing the general trend are shown in Figure 2a. A strong cycle with a duration of ~6370 years is visible there. The TRPA procedure, which was applied to the residual series, gives a more exact value for this cycle of about T = 6370 years.
The demodulation procedure (removing of a 6370 yr cycle from the residual series) was performed. The “second-generation” residual is shown in Figure 2b. There is also a weaker, but also clearly visible quasi-periodic wave, whose duration is comparable with that of the whole series. The TRPA procedure gives a period of T = 13,500 years for this “hyper-cycle”.
It is interesting that both detected cycles, which are damaging in the primary Δ14C% series, have a very close to resonance relationship, since 13,500 yr/6370 yr ≈ 2. It is an indicator of their possible origin, which may be geomagnetic field variations. It is also interesting that they are both second and fourth harmonics, correspondingly, of the cycle of the Earth’s rotation axis precession (T ≈ 25,600 yrs).
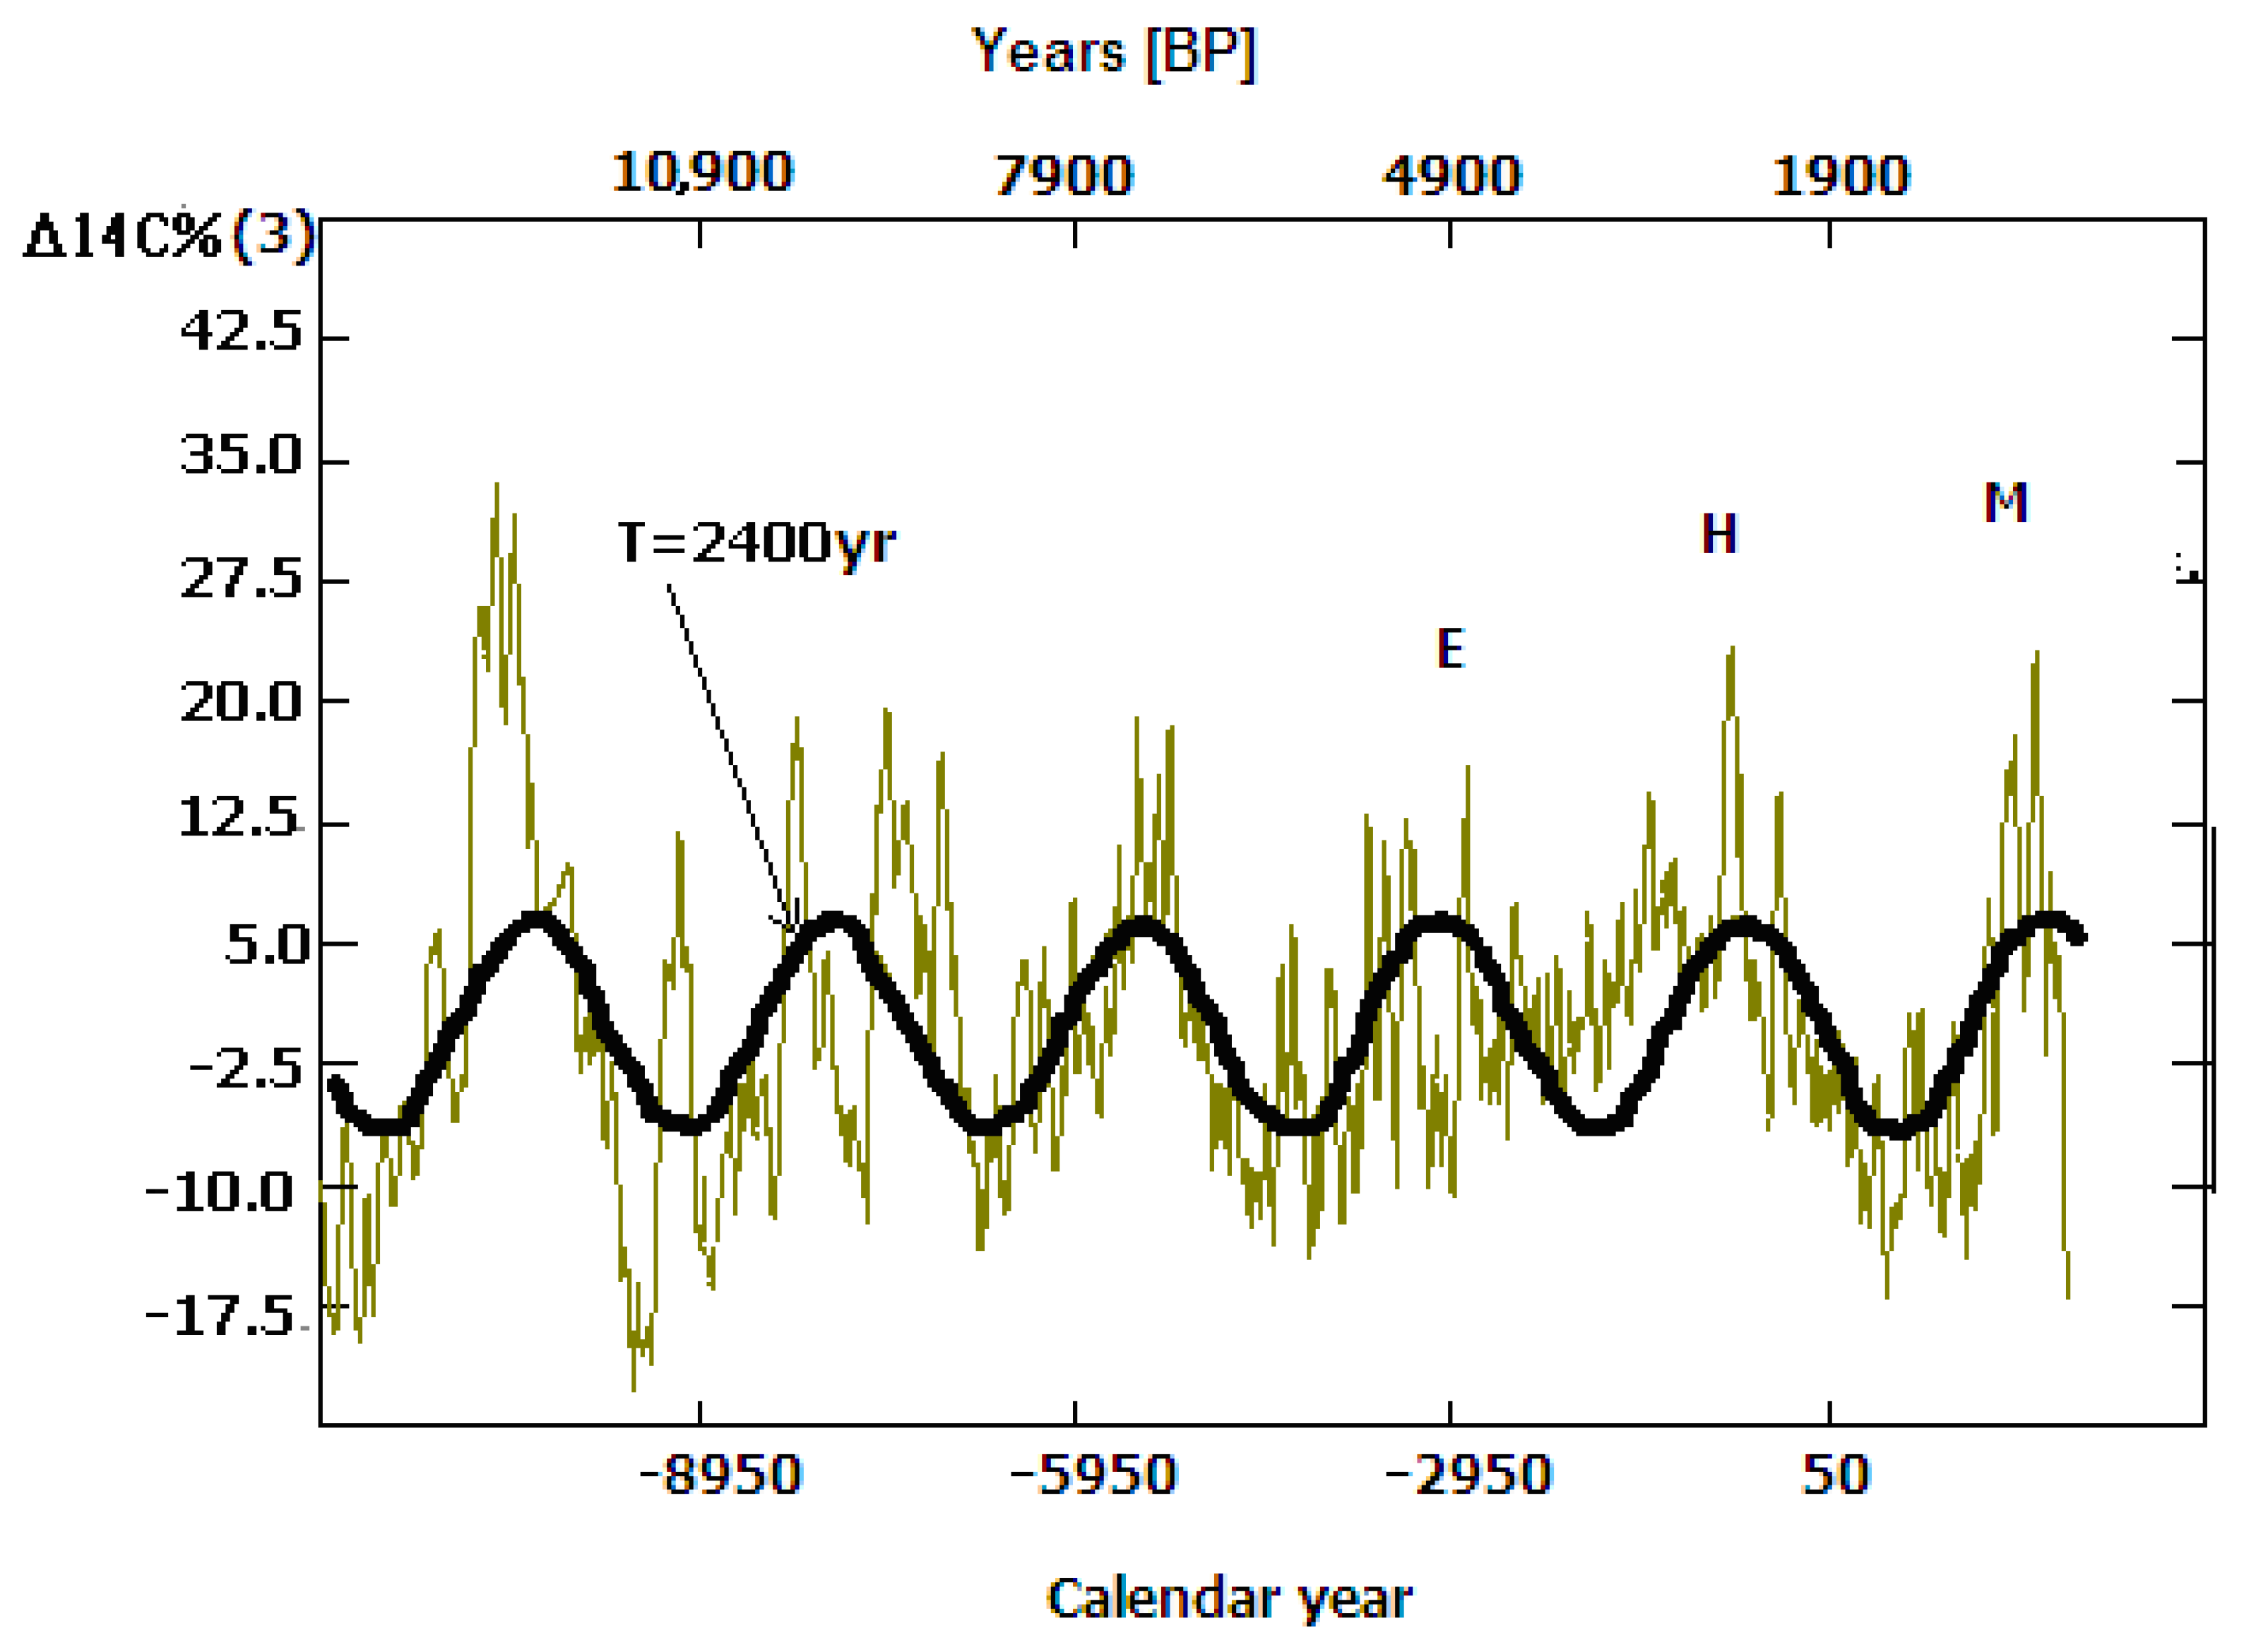
A new residual time series was demodulated again by removing the 13,500 yr cycle and the final residual time series, which is interesting for the present study. It is shown in Figure 3.
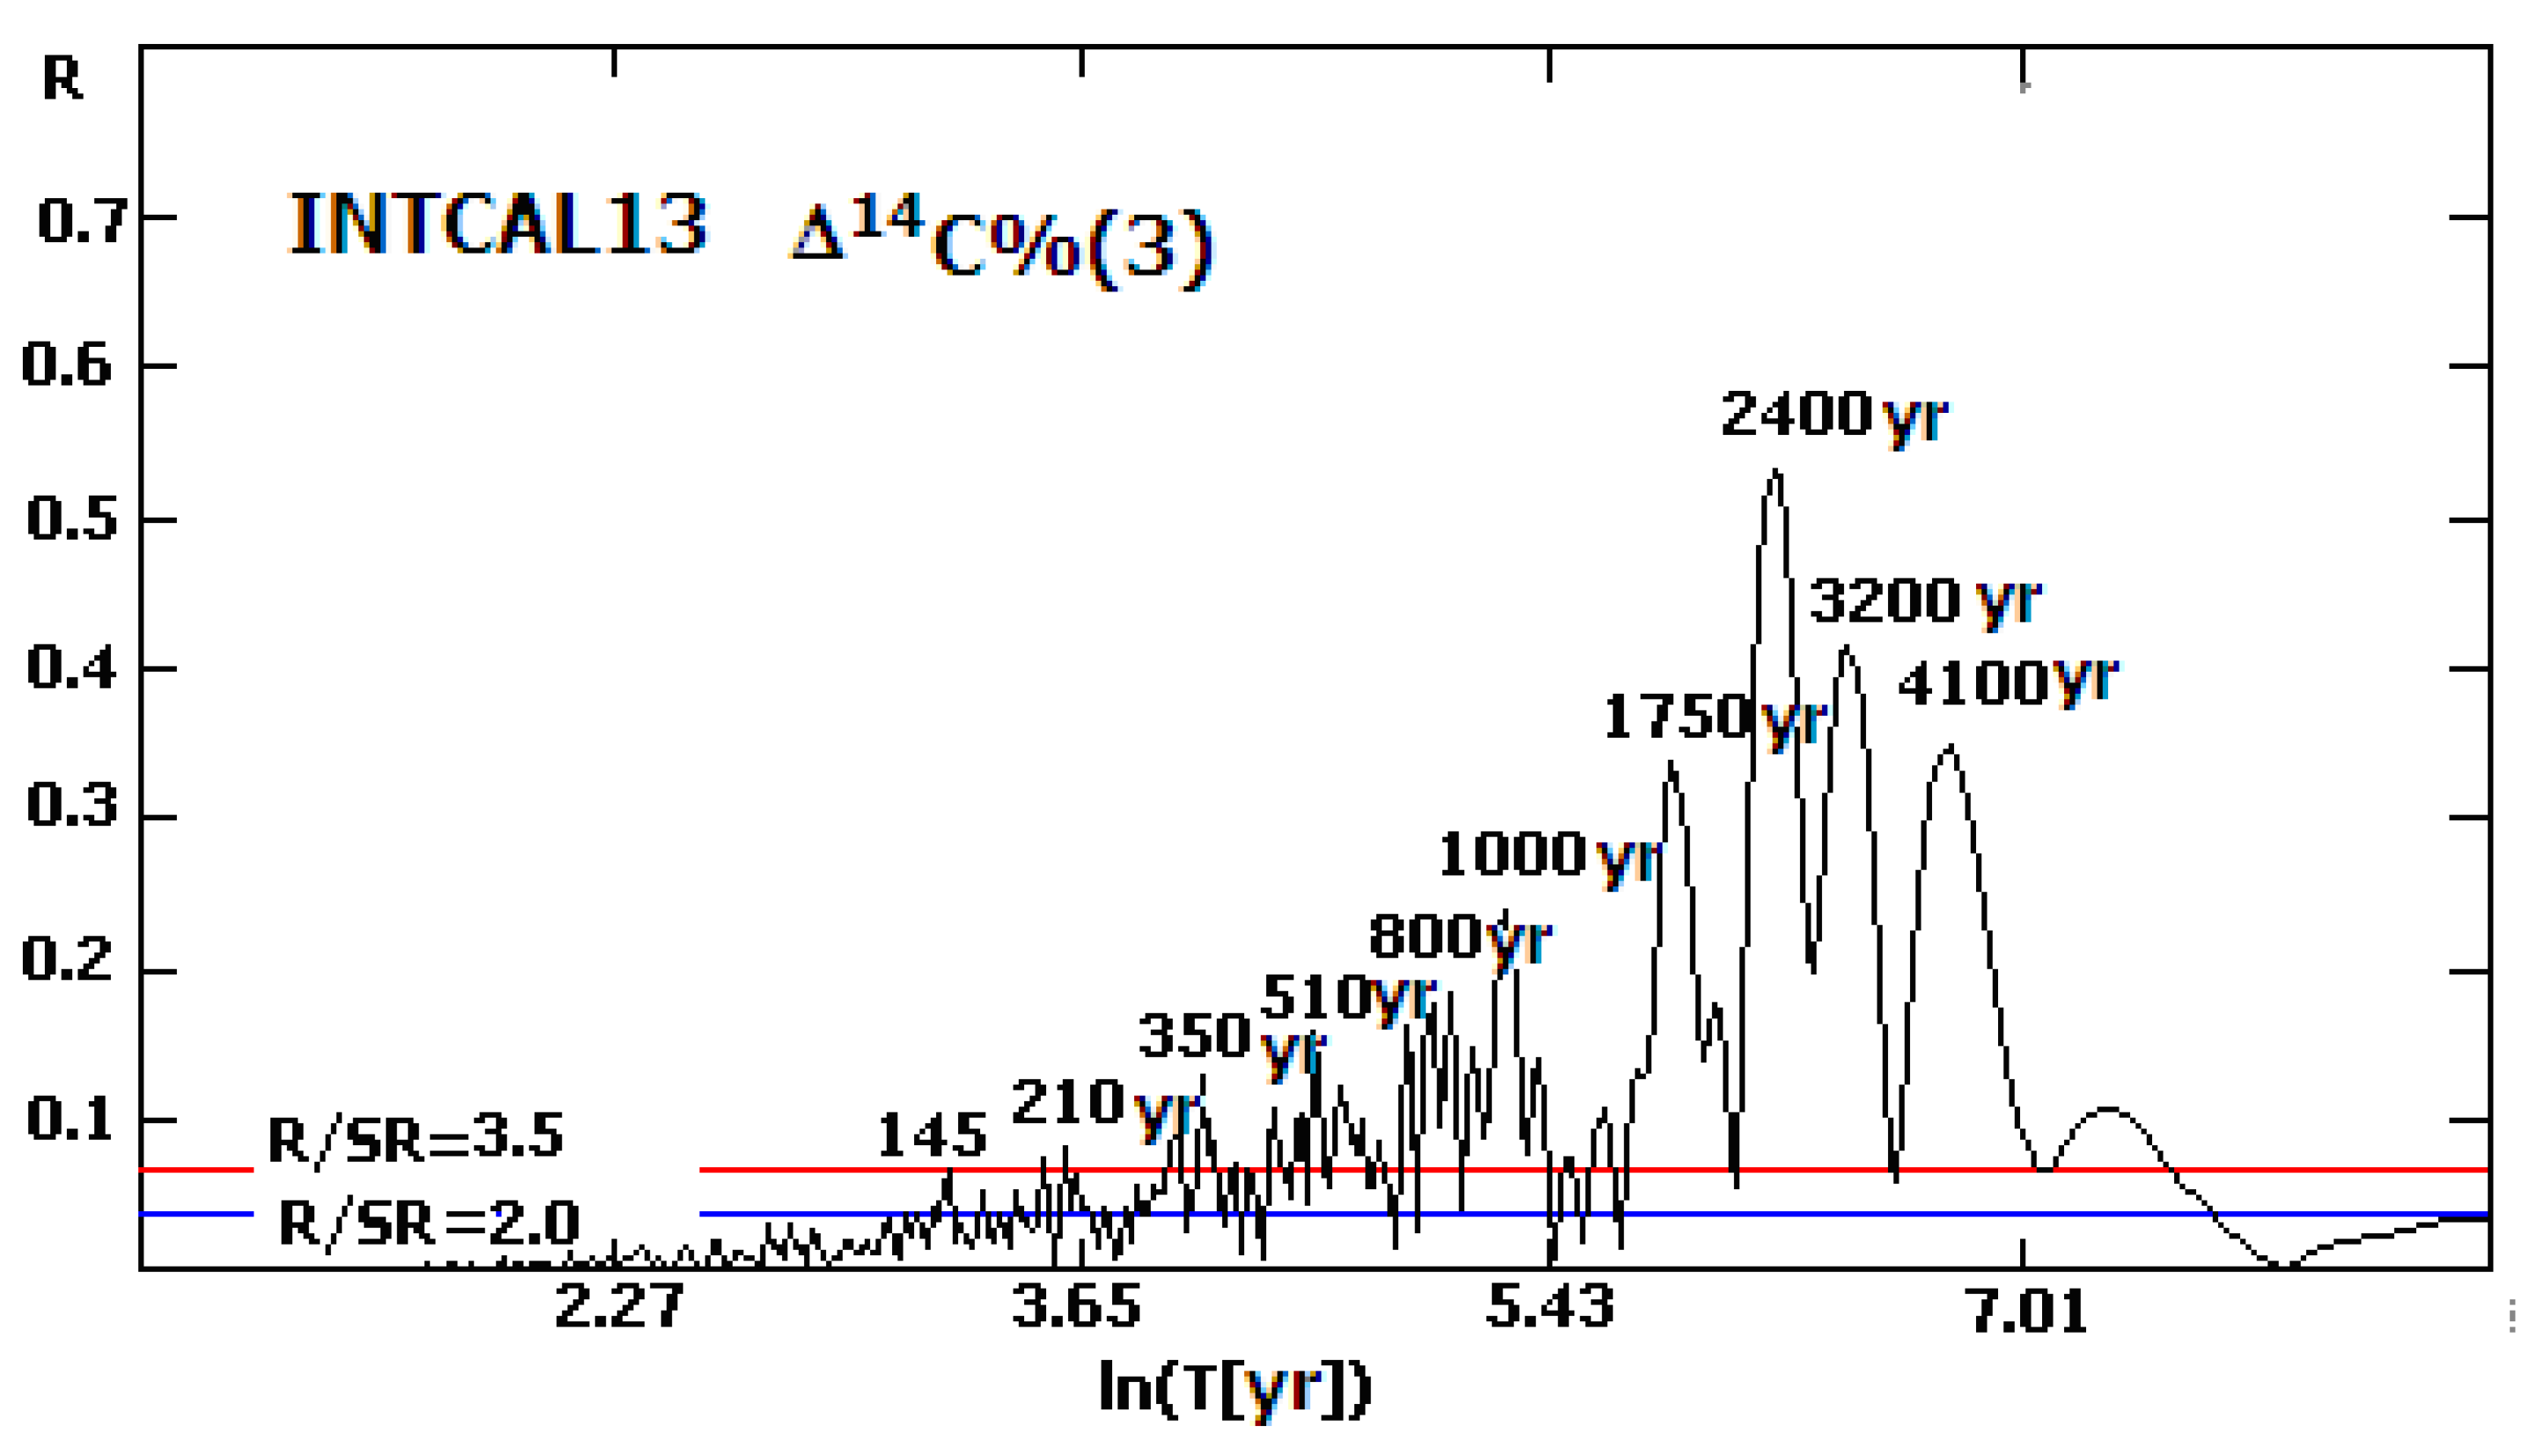
The corresponding T-R-periodogram of Δ14C%(3) is shown in Figure 4. Except for the most powerful 2400 yr (Hallstadt) cycle, there are also statistically significant oscillations with durations of 145, 210, 350, 510, 800, 1000, 1750, 3200, and 4100 years.
It is not clear in this stage what the origin of the 3200 and 4200 yr oscillations is, but there are some indications that the 1750 yr cycle may be connected to the long-term solar activity changes.
On the other hand, there are earlier studies by Kopecky in the 1980s where evidence for the existence of 1100–1200 yr long scale solar activity changes were suggested on the basis of historical data [60]. A weak but statistically reliable oscillation (trend-“hyper-cycle”) of duration 1200 yr was found by Komitov and Kaftan in the Schove series [33]. A slightly shorter 800–900 yr cycle was found in the tree ring radiocarbon series [15,28]. That is why it is quite possible that the detected 800 and 1000 yr cycles in the T-R spectrum in Figure 4 are also in relation to solar activity changes. It is possible that the so-called “Bond cycle” (see [61]) relates to the 1000–1200 yr radiocarbon/solar oscillations or to the 1750 yr ones.
A statistically reliable 350 yr cycle was detected in the continuous part of the Schove series in our previous studies [28,33], as well as in the tree ring 14C data [28] since 296 AD. Independent indirect evidence that a cycle of duration 350–400 years exists in solar activity behavior could lead to the consideration of a link to the bright comet registration in the past [62].
The T-R spectrum in Figure 4 confirms the existence of quasi bi-centurial (Suess) cycle in the tree ring 14C data series. As is shown, the corresponding ratio R/σR = 4.27 essentially exceeds the critical threshold of the “red noise”, which is equal to 3.46 [27,46]. Taking into account that the 210 yr cycle is contained more than 60 times in the whole interval of 13,900 years, one can conclude that this oscillation is a very stable feature in the 14C data series and, consequently, in solar activity dynamics during the Holocene and the late Wurm ice epoch.
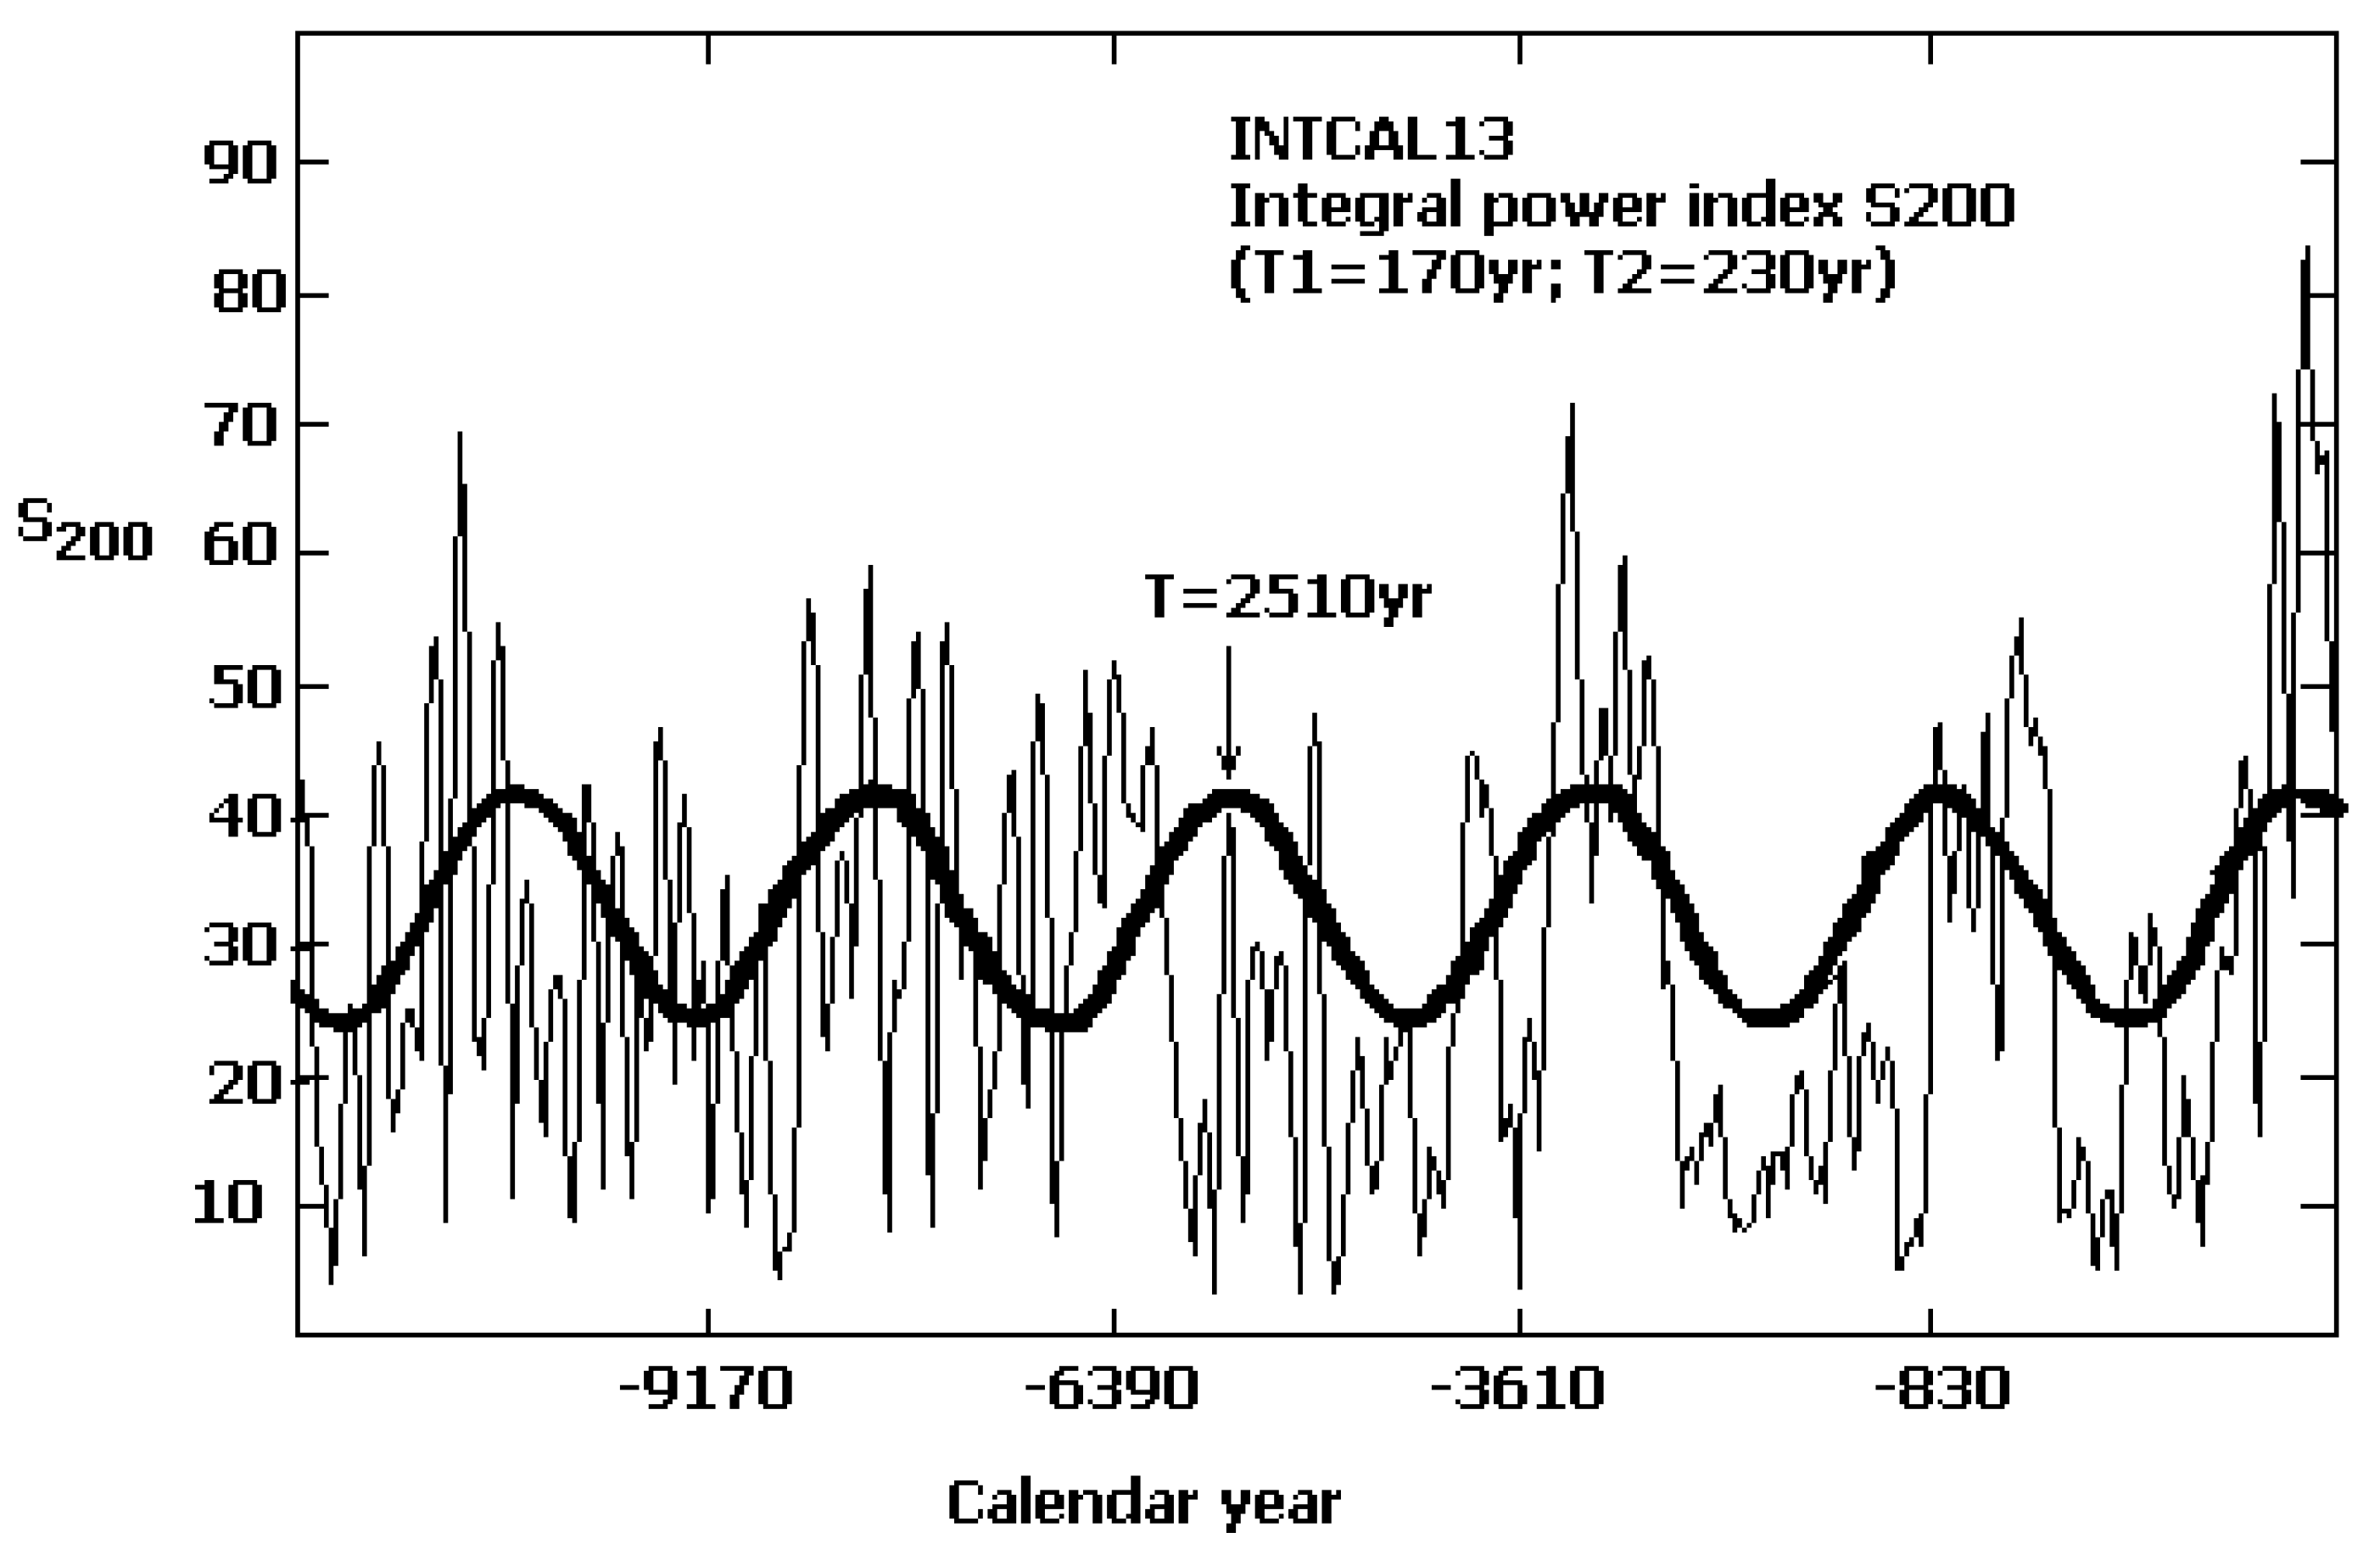
The integral power index for the Suess cycle S200 was calculated for T1 = 170 yr and T2 = 230 yr and a smoothing window width of 300 years. These parameters are the same as used in our previous study in 2004 [29], which was based on the INTCAL98 [14] and as on the newest to the corresponding moment INTCAL04 series [63] as an additional control test. Regarding the studied interval covered the last 10,000 years, i.e., unlike the present study, it did not include the most recent part of the Wurm and the first ~1500 years after that. The present plot of S200 is shown in Figure 5.
As in our previous study [29], a quasi bi-millennial oscillation is well seen. It is clearly visible since around 7000–7500 years before present, i.e., ~5000–5500 BC. The mean length of the quasi bi-millennial cycle for S200 in [29] was determined as 2300 yr vs. 2510 yr in the present study. The present new T-R spectrum of S200 series for INTCAL13 is shown in Figure 6.
The above-mentioned difference between the old and new determined values for the S200 quasi bi-millennial cycle is caused mainly by the including of an additional 3900 years from the INTCAL13 series (the interval 13,900–10,000 BP). It contains the last two millennia of the Wurm ice epoch as well as the earliest approximately two millennia of the transition epoch between the Wurm and the “persisting” Holocene, which started at about 8000 BP (6000 BC). This transition period is not only characterized by fast mean planetary temperature increasing, but it is also connected with a serious instability in total CO2 and related 14C total atmosphere contents due to overall plant mass increasing.
That is why the Hallstadt (2000–2500 yr) quasi-periodic wave is seriously damaged both in the 14ΔC%(3) and S200 series (Figure 3 and Figure 5). It can also be seen there that a strong ~2000 yr wave is present before the transition between the Wurm and the Holocene, which exists since ~8000 BP (~6000 BC) when the 2000–2500 yr oscillation is restored. It is most clearly expressed during the last three millennia since 1000–1200 BC.
Additional evidence for this statement can be seen in Figure 7 and Figure 8 where TR-scalograms of the ratio R/SR for the “residual” 14ΔC% (3) and S200 series are shown. This parameter is preferred in the present study due to its very high sensitivity and especially near the extreme points in scalograms, where R/SR (tc,T) reaches local maxima. While the main aim of the scalogram in Figure 7 is to study the Hallstadt cycle amplitude and frequency/period evolution, a smoothed window step of 100 years was used. On the X-axis, the calendar moments for each smoothed window epoch are presented, and on the Y-axis, there are the periods of the T-R-spectrum. The Suess (bi-century) cycle scalogram was built in a similar way. The lower and upper period limits (T1 and T2, respectively) for the Suess cycle are plotted in Figure 8 by black lines. The colors in both scalograms (10 grey degrees scaled in Figure 7 and 10-colors scaled in Figure 8) were chosen as most optimal for the corresponding cases.
As is shown in Figure 7, an analogue of the Hallstadt cycle exists during the earliest two millennia of the 14C%(3) series as a wave with a length of ~2000 years. The above-mentioned time interval coincides with the most recent part of the Wurm ice epoch. During the next 3000 years up to ~6000 BC, the Hallstadt (2000–2500 yr) oscillation was transformed to a longer and less expressed one with a length of about 3200–3500 years. This corresponds to the transition interval between the end of the Wurm and the beginning of the persistent Holocene epoch. As idiscussed above, this transition epoch most relates to fast climate warming and total planetary plant mass increasing. However, the causes of this natural event are not clear enough. Despite this, the effects of the Milankovich theory [64] are traditionally considered as the main factor for such climate changes in short geological time scales and especially during the Pleistocene (the last ~650,000 years).
Since the end of the transition epoch, the Hallstadt cycle is well traced, and its duration is on average 2000–2500 yrs. It is best expressed near the calendar moments 7200 BC, 5500–5000 BC, ~3500 BC, and after 1000 BC until the modern epoch.
As is shown in Figure 3, both maxima of the 2000–2500 yr 14C cycle (i.e., deep solar activity minima) occurred in the 15th–17th (labeled as “M”—Maunder) and 9th–6th centuries (“H”—Homer). Earlier in this reverse order, there was a significantly weaker radiocarbon maximum near ~3000–3500 BC, labeled as “E” (Egyptian), as well as the maximum near 5500 BC.
An interesting feature in Figure 7 relates to the oscillation in length of 1000–1200 years. It is stronger during the recent Wurm, the Wurm–Holocene transition epoch, and the earlier Holocene until ~2000 BC. During the last four millennia, the 1000–1200 yr cycle is generally weakly detectable.
The Suess cycle R/SR evolution during the recent Wurm and Holocene can be traced on the scalogram in Figure 8. The Suess cycle band is marked with two horizontal lines for T1 = 170 yr and T2 = 230 yr, respectively. The R/SR parameter variations, unlike those of the 2000–2500 yr cycle in Figure 7, are in too wide of a range. This is why in Figure 8, the epochs, where R/SR is merely statistically reliable, are not shown. On the scalogram, the last one has well-expressed local peaks both in relation to the adjacent epochs and the oscillations with periods T in a range of 300 years.
As is shown on the scalogram (Figure 8), there are a few episodes featuring the highest Suess cycle. They are as follows:
-
At the beginning of INTCAL13 tree ring Δ14C series,
-
From ~8300 to 8400 BP, i.e., 6300–6400 BC,
-
From ~5500 to 5000 BC (Hallstadt 14C maximum and grand solar minimum),
-
At ~3000 BC (“E”—Egyptian) minimum),
-
From ~900 to 500 BC (Hallstadt 14C maximum and grand solar “H” (Homer) minimum),
-
From ~400 to 700 AD, relative weak (14C maxima epoch, deep and continuous solar minimum, featured in the Schove series (see also the text below as well as in Figure 9),
-
From 1400 to 1700 AD—the last Hallstadt (Spoerer-Maunder) minimum.
Figure 9. The S200 power index in Schove series (296–2020 AD).
Atmosphere 15 00612 g009
In general, one can say that the Hallstadt cycle modulation of S200 is most clearly traced during the last 7000–7500 years and that its first certain manifestation relates namely to this epoch. In the climatic aspect, the corresponding epoch is labeled as the “Atlantic” and it is the warmest one during the whole Holocene in accordance with the presented paleoclimate data [42,65].
As is also shown in Figure 8, during the transition Wurm–Holocene epoch, the Suess cycle was seriously damaged. The dominating oscillation in the studied range is longer than 240 years and near 250–270 years.
Generally, the results obtained by TR-scalograms (Figure 7 and Figure 8) confirm those obtained by standard T-R periodogram analysis and integral power index analysis for the Suess cycle (Figure 3, Figure 4, Figure 5 and Figure 6) in INTCAL13 tree ring radiocarbon data. They can be summarized as follows:
5.
The quasi bi-millennial 2000–2500 yr Hallstadt cycle is well expressed during the last ~8000 years, around the end of the Wurm–Holocene transition epoch. It is also detected during the final phase of the Wurm as a ~2000 yr oscillation. The 2000–2500 yr cycle is damaged during the transition Wurm–Holocene epoch ~9500 to 6500 BC.
6.
The Hallstadt radiocarbon cycle peaks four times during the last ~9000 years. Due to the “Forbush effect”, they correspond to grand solar Maunder-type minima, while in the climatic aspect, they correspond to little ice epochs.
7.
The 200 yr Suess cycle amplitudes are modulated by the Hallstadt cycle phase. They increase during the rising phases and peak near the local radiocarbon Hallstadt cycle maxima, i.e., the downward 2000–2500 yr solar activity cycle phases and until and near the Maunder-type solar minima. On the contrary, during the highest solar activity phases, i.e., radiocarbon Hallstadt cycle minima, the Suess cycle amplitudes also are minimal.
8.
It follows from combining conclusions 2 and 3 that in the climate change aspect, the Earth’s planetary cooling epochs relate to the falling phases of solar 2000–2500 yr cycles and simultaneously to ~200 yr solar cycle amplitude increases.
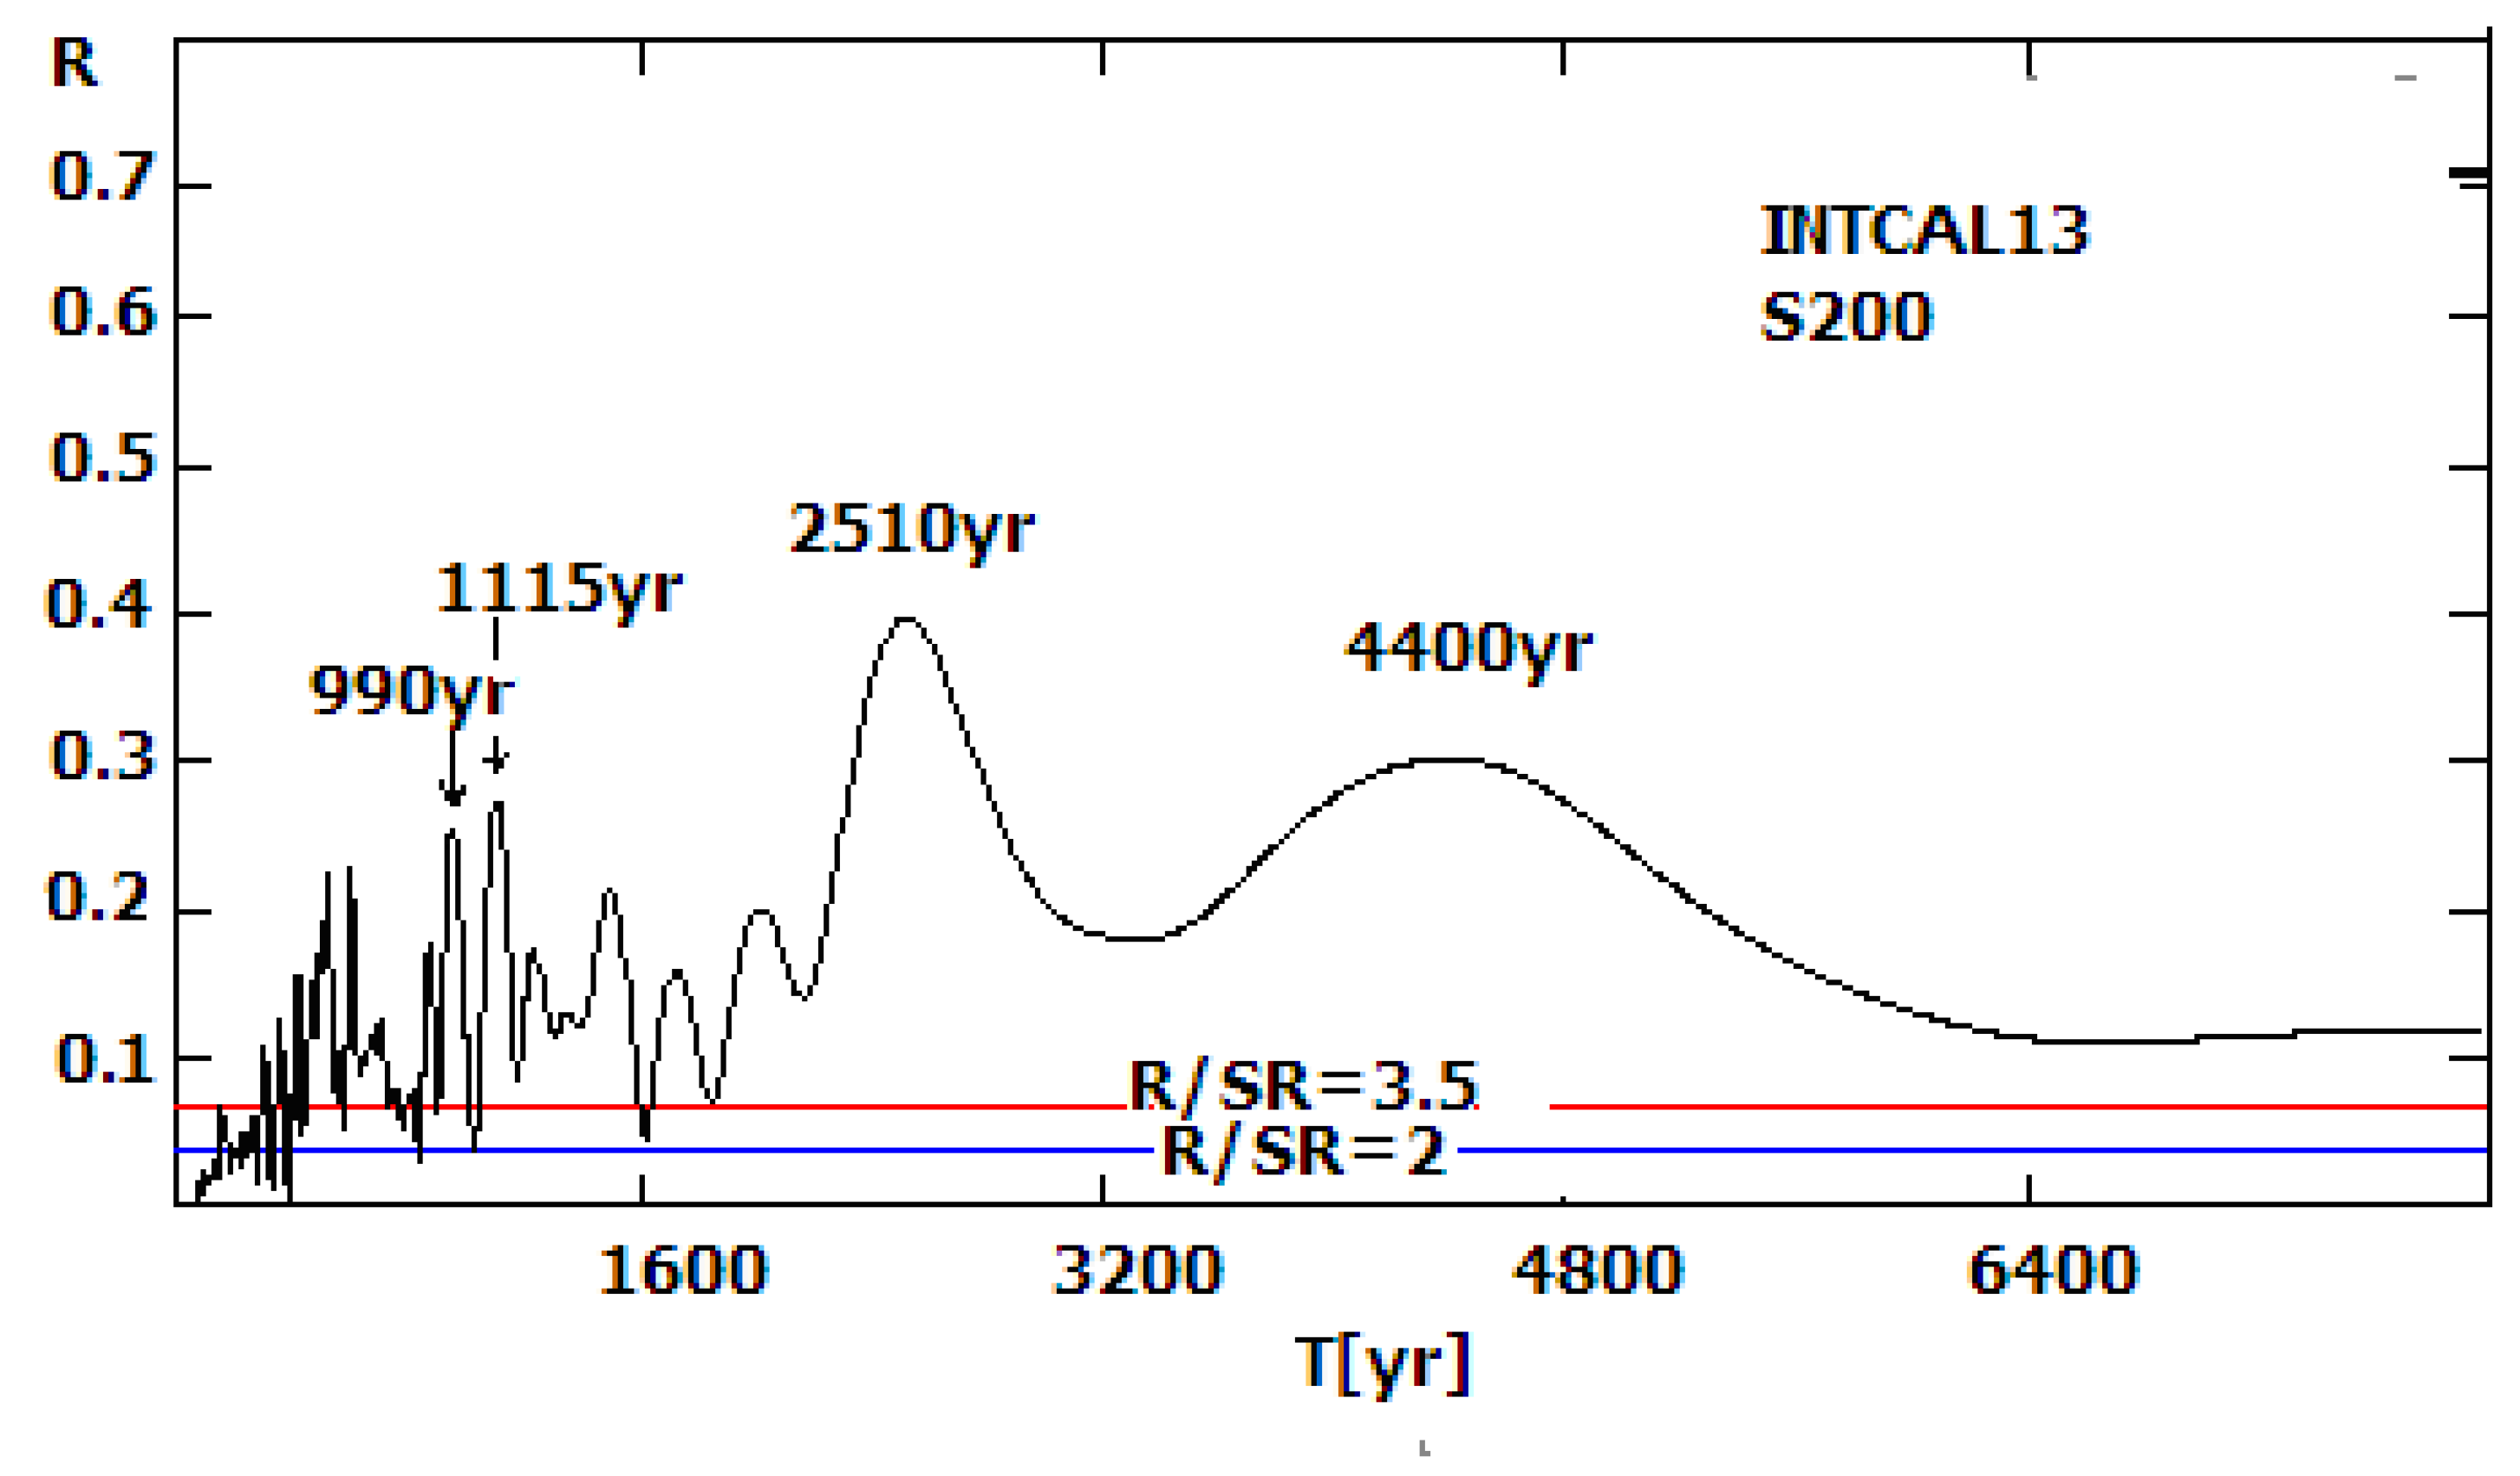
It should also be noted that a modulation effect of the 1000–1200 yr radiocarbon/solar activity cycle on 200 yr ones also exists. This is shown in Figure 6, where, on the S200 index T-R correlogram, the peaks of R related to 990 yr and 1115 yr cycles are higher than the R/SR = 3.5 for the red noise threshold [46].

3.2. The Hallstadt and Suess Cycle Relationship in the Schove Series (296–2009)

For studying the Suess cycle amplitude modulation by the Hallstadt, the Schove series continuous part (296–2000 AD) was also used. Its length of approximately 1700 years covers about 60% from the mean length of the 2000–2500 yr cycle. This calendar interval covers the most recent part of the plateau, secondary minimum, main upward, and near-maximum phase and the main downward phase of the previous Hallstadt cycle, as well as the last Maunder-type minimum and initial upward phase of the present one.
The parameters for calculating the S200 series were taken as almost the same as those in the case for INTCAL13. The smoothed window width was chosen to be 27 SHCL or 298.07 years (SHCL is the mean length of the Schove series sunspot cycle, equal to 11.04 years for the interval 296–1996 AD). The low and upper limit parameters T1 and T2 are 15.5 SHCL and 21 SHCL, i.e., 171 and 232 years, correspondingly. The obtained S200 series is shown in Figure 9.
The S200 is relatively low during the first calendar millennia until 1000 AD. A temporary weak rising is observed during the calendar interval ~400–720 AD. It corresponds to the end of the plateau and the start of secondary minimum of the previous 2000–2500 yr solar cycle. It is followed by a ~350 yr long interval when S200 reaches the deepest minimum for the last ~1700 years. The solar activity level corresponds to the main rising and maximum phase of the previous Hallstadt.
A long rising tendency of S200 begins since the first half of the 11th century. It temporarily weakens in the 12th century and the first half of the 13th one. Approximately after 1250 AD, the rising of S200 is restored, relatively slowly until ~1350 AD and essentially faster after that. The maximum epoch of the solar 200 yr cycle magnitude occurs between 1550 and 1700 AD and corresponds to the last quasi bi-millennial solar cycle epoch. The last one is associated usually with the Maunder minimum (1642–1715). However, it should be taken into account the fact that S200 maxima belong to the smoothing window, whose calendar center minimum should rather relate to the 16th century. Thus, the question of whether the Maunder minimum is the absolute minimum of the present Hallstadt cycle or whether that would be the adjacent previous Spoerer grand minimum is debatable.

3.3. Extreme Climatic Phenomena in Bulgarian and Adjacent Territories during the Last ~1700 Years. Relations to Solar Activity

There are in total 35 most extreme climatic phenomena in the calendar interval 296–1899 that are included in Table 1. Three additional non-climatic phenomena that occurred during the interval between 863 and 1037 AD interesting in the climate aspect are included. There are also additional 11 climatic phenomena that occurred during the instrumental epoch after 1899 AD. These data are used for comparison and, on this basis, for better interpretation of the historical ones. They are placed at the bottom of Table 1.
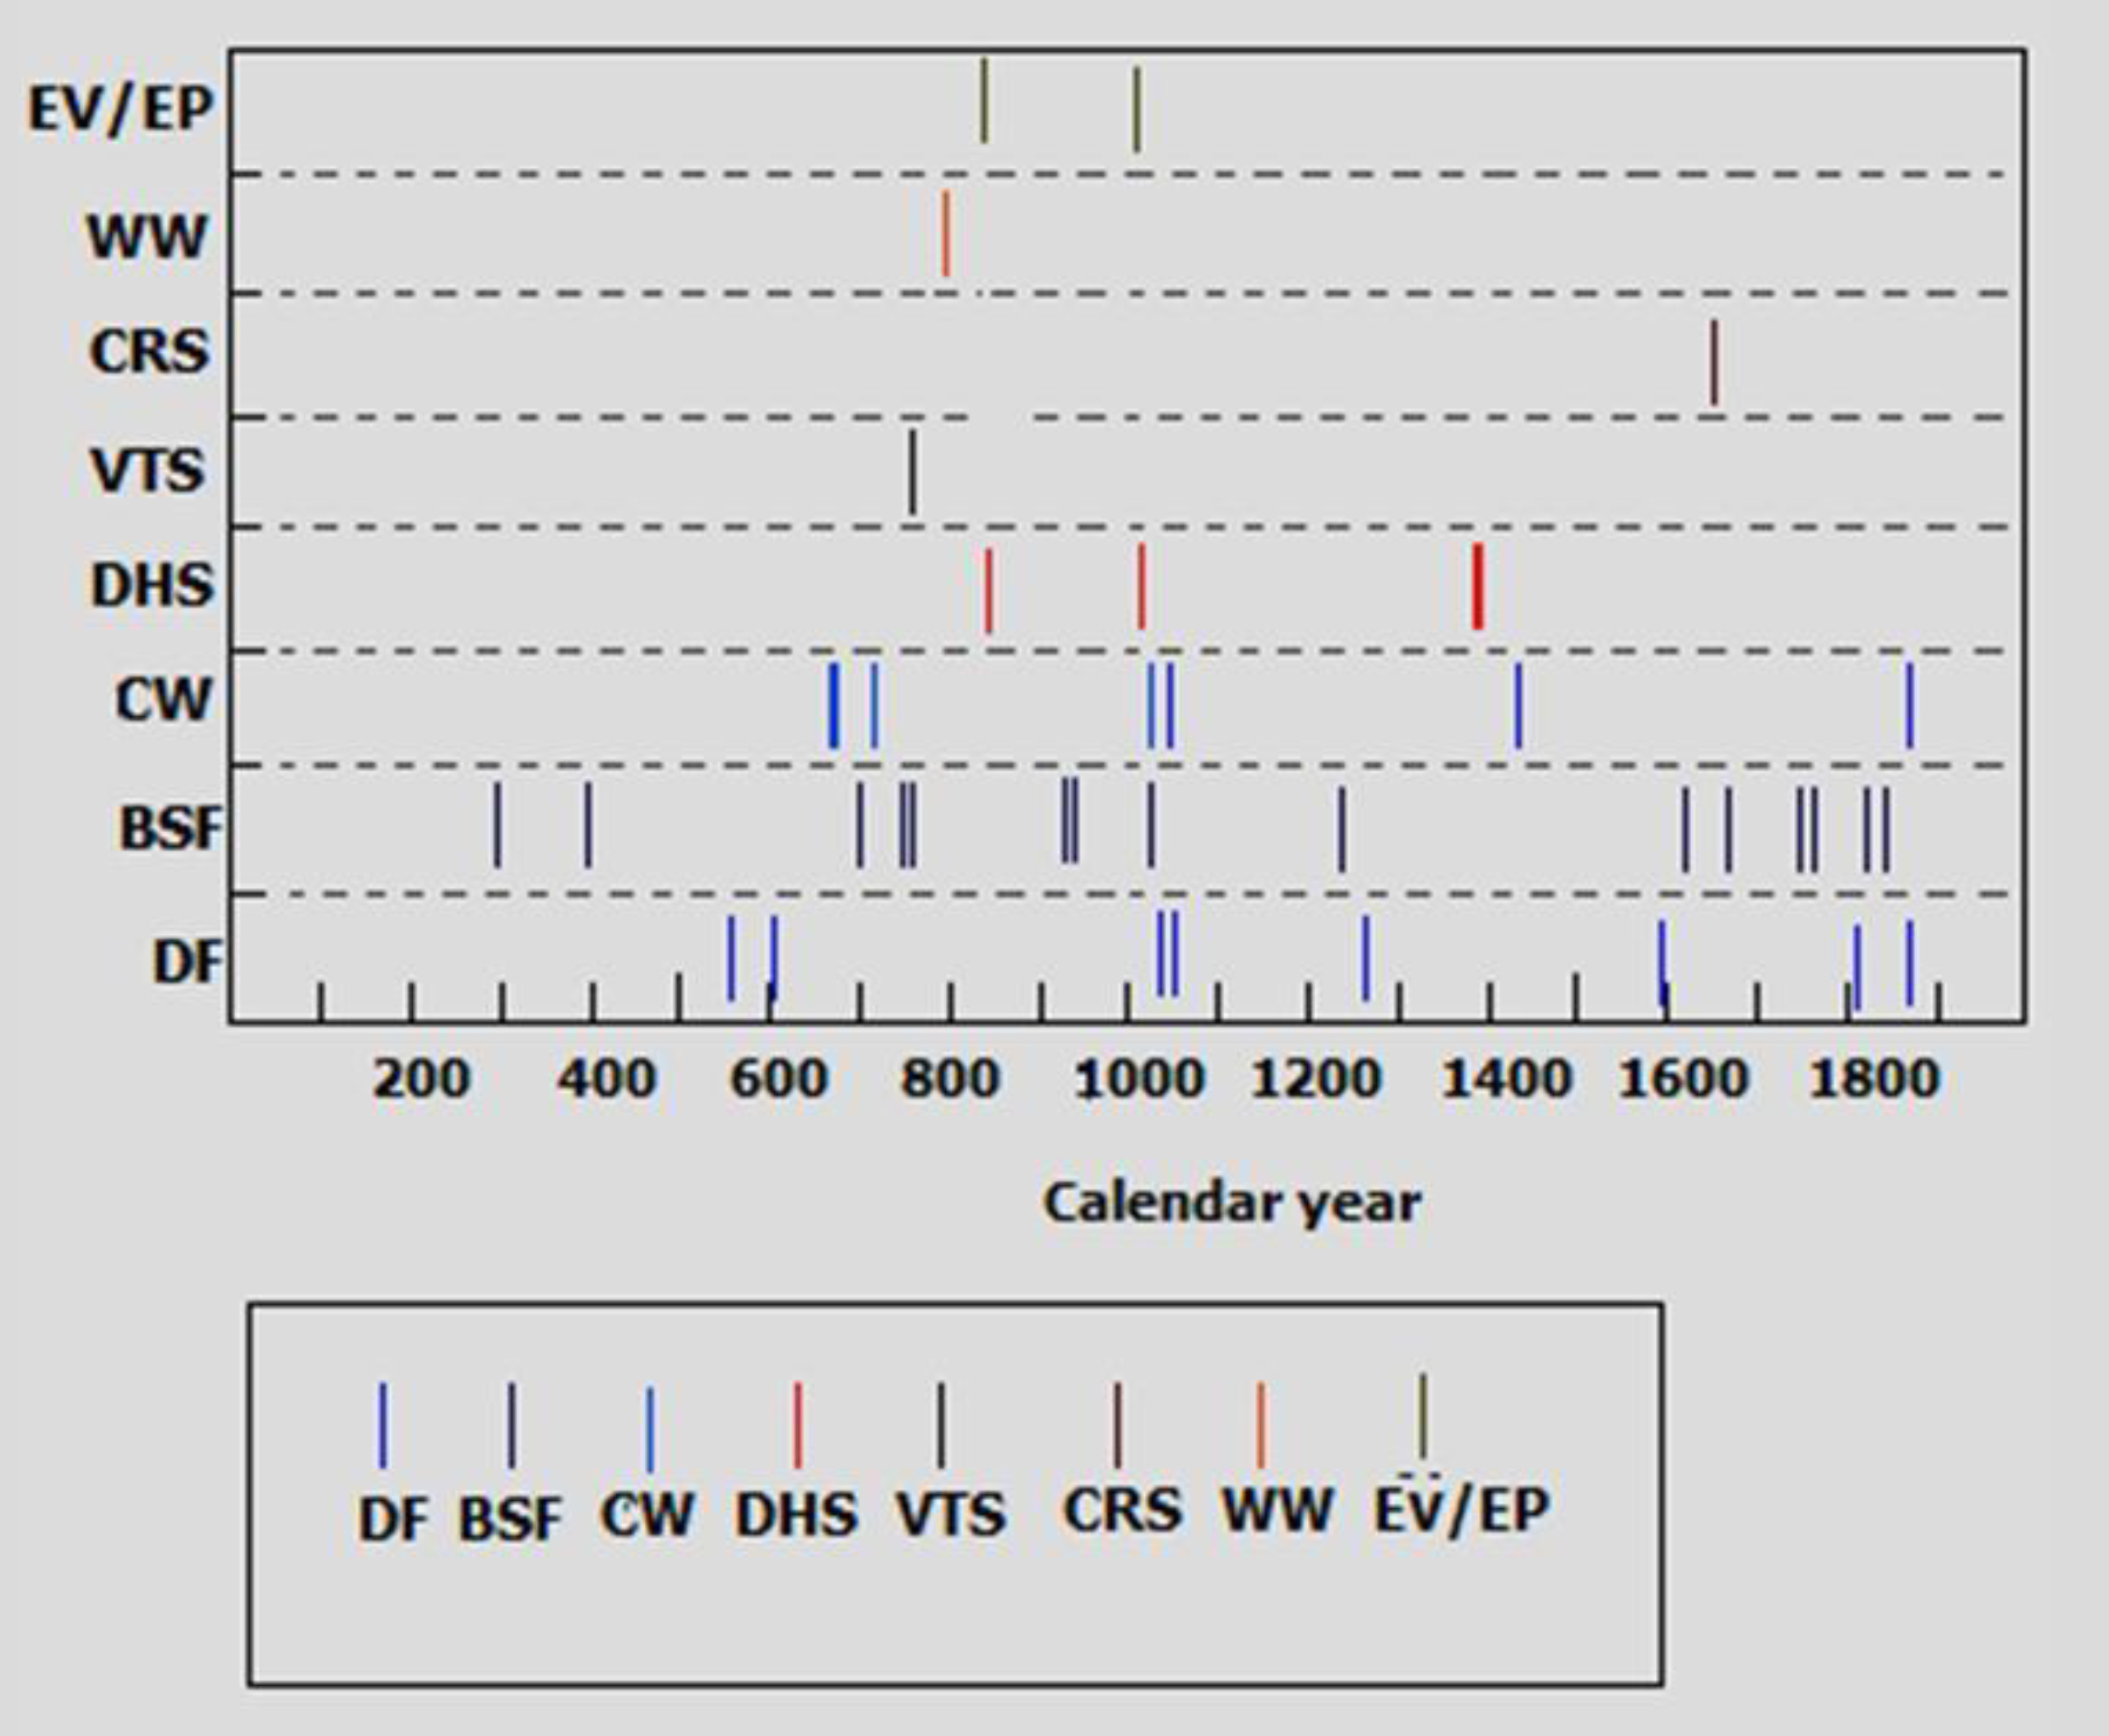
On the diagram in Figure 10, the extreme phenomena from the years before 1899 are shown. Their calendar years are on the X-axis, while the corresponding type of event (labeled by abbreviations as is described in Section 2) are placed at different levels of the Y-axis. The differences between the phenomena types are also featured by using specific colors for each of them. Possible relations with sunspot activity were analyzed on the basis of the corresponding sunspot cycles macro-parameter as they are given in the Schove series (see Table 1).
As is seen from Table 1, there were 11 phenomena during the epoch of instrumental observations after 1899 AD. All belong to extremely cool winters. Except for the winter in 1904, all others occurred near the extreme phases of the 11 yr sunspot cycles with numbers between 14 and 23 SC (the Schove series numbers (SHC) between 146 and 155). There are three extremely cold winters, which occurred near sunspot maxima in 1905, 1929, and 2002, while the remaining six (in 1902, 1932, 1942, 1954, 1963, and 1985) belong to the near-sunspot-minima phases. As was pointed out by the author, the dominating overall effect of solar activity, cold half-year (November–April) temperatures in Bulgaria between 1899 and 1979, is in a reverse relationship to sunspot activity, and cold winters occurred predominantly in sunspot activity minima [58]. Thus, a statistically reliable quasi 11 yr periodicity was formed for winter temperature series between 1899 and 1986. However, it seems that after the end of the sunspot cycle with Zurich number 21 (SC21), this reverse relationship is violated. Possible causes for this breaking of the 11 yr quasi periodic oscillations of winter semi-year temperatures will be discussed in Section 4.
Let us now consider the historical extreme climate events and their possible relation to solar activity before 1899. As is seen both in Table 1 and Figure 10, during the first three centuries, only extremely cold winters (DF, BSF, and CW events) were registered by the late Antique historians. Black Sea coast-water freezing (BSF) was observed in 299 and 400 AD, while DF events occurred in 558 and 602 AD. CW events were detected in 678 and 679 AD. The last two ones resulted in a total migration of Proto-Bulgarians from the left side of the Danube coast to the right side, i.e., the relative warmer Byzantine (East-Romanian) province Moesia, where the First Bulgarian Kingdom (Slavic-Bulgarian state) was formed in 680–681 AD.
The relationship of these events with the quasi 11 yr sunspot cycle phase tends to be reverse, as most of these phenomena occurred near the sunspot minima phases. One should consider the phenomena in 400, 602, 678, 679, and 703 AD and with some convention in 717 AD as ones of this type. An extreme winter in 558 AD (DF) was placed in the sunspot maximum phase. In my opinion, there is uncertainty in classifying the events from 299 and 400 AD in relation to 11 yr sunspot cycle extreme phases. They relate rather to moderate sunspot activity. Thus, during the calendar interval 296–720 AD, there are six extremely cold winters that coincide with or are near the 11 yr sunspot cycle minima, and one is in the 11 yr sunspot cycle maximum phase. Two of these events may be not related to sunspot cycles at all or may be related to the middle sunspot cycle phase.
We should note two important features of sunspot activity during the recent Antique and the early Middle Ages (“Dark Ages”), i.e., between 284 and 720/730 AD:
  • The sunspot activity is generally low despite the existence of short episodes of moderate and high activity. As has already been noted above, this epoch corresponds to the secondary minimum phase of the 2000–2500 yr (Hallstadt) solar cycle. Thus, the full domination of DF, BSF, and CW and absence of messages for the other phenomena should not be considered a surprise.
  • The sunspot cycle macro-parameter data in the Schove series can contain significant uncertainties, especially for calendar years of separate 11 yr sunspot cycle maxima and sunspot cycle magnitudes. This can be more seriously valid for the earlier part of the Schove series before 1000 AD due the relative lack of historical documents in comparison to the second calendar millennia. A second very probable cause could be relatively high values of the geomagnetic dipole moment M during the first calendar millennia in relation to the second one (see Section 4). In particular, in the case of the present study, the author considers as very possible that the real calendar sunspot maxima of the Schove sunspot cycles numbered as SHC1 and SHC38 (Table 1) in 302 and 714 AD should relate to 300 or 711–712 AD, respectively. This corresponds better to the statement that rising branches of 11 yr cycles are usually shorter or at least equal to falling ones in accordance with the instrumental observations and the Zurich series [2]. If this assumption for SHC1 is valid, then the cold winter in 299 AD could clearly relate to the sunspot cycle maximum. Similarly, if the real SHC38 maximum moment is taken to be in 711 or 712 AD and not in 714 (Table 1), the relation of the very cold winter in 717 AD (associated with the second Arabian siege of Constantinople) to the sunspot minimum in 719 AD can be better seen.
According to Usoskin et al. [66], during the middle and end of the 8th century, solar flare activity was excessively high. There were two extremely cold winters in 755 and 764 AD, which are very well associated with the maxima of sunspot cycles SHC43 and SHC44 in 754 and 763 AD, respectively. According to Theophanes Confessor [52], during the winters in both years, icebergs were observed in the Bosporus strait.
The very tormentuous weather season in 774 AD can be associated with the catastrophic ruin of the Byzantine battle fleet, which included 2000 ships in the Black Sea, near the Bulgarian coast. As a result, the military campaign of the Byzantine emperor Constantine V Copronymus against Bulgaria failed. This event relates to the sunspot maximum phase of SHC44. It is also interesting in relation to a possible origin of 774 AD radiocarbon event and will be discussed in Section 4.4.
There are two documented climatic events in the 9th century. The first one is an extremely rainy winter in 814 AD, which indicates warm weather. Due to the muddy ground and related problems with the transport of siege machines and baggage trains, the military campaign of the Bulgarian ruler khan Krum against the Byzantine capital Constantinople was seriously delayed and occurred after Krum’s death (stroke?) on April, 13, 814 AD. A rainy (warm) winter in 814 AD coincides with the 11 yr sunspot minimum phase between SHC47 and SHC48, which occurred in 815 AD.
The second extreme climatic event in the 9th century was a catastrophic summer drought (DHS) in 863 AD. This phenomenon coincided with a series of strong earthquakes in the Balkans region, which continued for about 40 days. It significantly affected economic and political problems in Bulgaria. As a result, the current next Bulgarian–Byzantine war stopped. According to one of the conditions of the peace treaty, Bulgaria should receive Christianity from Constantinople, which happened in 863–865 AD. The DHS and EQ-events in 863 AD relate to the sunspot cycle SHC52 maximum, which was in 865 AD. An interesting and important fact regarding the SHC52 sunspot cycle is that it belongs to the relative shallow 200 yr grand solar minimum (856–921 AD), which is labeled by some authors as “Mayan”. The last one is in association with the fall of Mayan civilization during the same epoch. According to some authors [39], the latter was caused by an extreme drought in Central America and relates to the 200 yr solar activity grand minimum in the 9th century.
As is shown in Table 1 and Figure 10, there were two extremely cold winters (BSF) in the 10th century. They occurred in 928 and 934 AD. The second one corresponds to the sunspot SHC59 minimum, while the first one (most probably) corresponds to the previously SHC58 maximum. However, the author did not find any significant enough historical facts in Bulgaria or in adjacent territories that could be closely related to these climatic events.
Near 1000 AD, the solar 2000–2500 yr cycle reached its main maximum phase, in which it remained until ~1200–1210 AD. However, it was temporarily broken due to the continuous Oort 200 yr cycle grand solar minimum. It can be said that its start was near 1010 AD with the SHC66 minima and that it ended in 1091–1092 AD simultaneously with the finale of sunspot cycle SHC72. The Oort minimum was significantly deeper compared to the previous sunspot grand minima in the 9th century. That is why it could be considered as a first indicator of the approached Hallstadt downward phase.
In the environmental aspect, Oort’s minimum relates to a lot of extreme events in South-Eastern Europe and some of them could be labeled as “catastrophic”. They caused serious economic and political confusions in the Byzantine Empire very close after the fall of the First Bulgarian Kingdom in 1018 AD. The first of these extreme events was a deep drought in 1028 AD, which caused provision problems in Balkans. It coincided with the sunspot SHC67 maximum. The next extreme phenomenon occurred in 1034–35 AD. It was a very cold winter, with the Danube freezing (DF). The Pecheneg tribes living on the left river coast used this situation to hit Moesia. This DF event corresponds to the sunspot SHC68 minimum.
The calendar years 1037 and 1038 could be labeled as “catastrophic” for the Balkan Peninsula. A series of earthquakes during the whole very rainy winter, which was followed by rainy summer, including also intensive hail, occurred. Many houses were destroyed by large-size hailstones. A scarlet fever epidemic in many regions was detected. One could not relate the 1037–38 events to any extreme of the 11 yr sunspot cycle, because it is placed almost in the middle between the sunspot cycle SHC68 minimum and maximum (see Table 1).
The last extreme climate phenomenon, which belongs to Oort’s minimum epoch, was the winter in 1048–49 AD. The water of the Danube froze to a depth of up to 15 elbows (6–7 m!?). An enormous number of Pechenegs attacked the right (south) coast again. Many Pechenegs (in the order of ~80,000) penetrated Moesia despite the Byzantine army’s victory, but converted to Christianity. The DF event in 1048–49 AD corresponds to the sunspot cycle SHC69 minimum phase.
In summary, it can be said that the 20-year calendar interval between 1028 and 1048 AD seems to be, in the environmental aspect, the most tormentuous epoch in the Balkans during the last ~1700 years.
The next extreme climate event listed in Table 1 is the Danube freezing in 1268 AD during the Asen dynasty of the Second Bulgarian Kingdom. The Tatars invaded the North Bulgarian territory (Moesia) through the Danube ice. This DF phenomenon corresponds to the transition solar minimum phase between the 11 yr cycles SHC88 and SCH89 and in the plane of long-term solar activity variations, it belongs to Wolf’s grand solar minimum. According to the Schove series data, the last one is placed between 1212 and 1340 AD and includes the sunspot quasi 11 yr cycles since SHC84 up to SCH96.
There was a relatively short epoch of high solar activity, which started with the 11 yr sunspot cycle SHC97 minimum in 1358 and peaked with the extremely powerful SHC98. The mean annual Wolf’s number maximum in 1371 (in SILSO_v1 standard) was 160 or higher. A strong violation of the amplitude Gnenvishev–Ohl–Kopecky rule [67,68] for the pair 11 yr sunspot cycles SHC98-SHC99 marks the decline of a high-level solar activity episode and the beginning of the next grand and excessively long solar Spoerer minimum. According to the Schove series data, one should consider the start of the last one in 1386 as coinciding with the SHC100 minimum and the end in 1514 or 1524 (SHC111 or SHC112 minimum). As the previous grand solar minima (“Mayan”, Oort and Wolf), it was caused mainly by the Suess bi-century cycle minimum; however, it was deeper than the others. It relates to the approach of the 2000–2500 yr cycle Maunder-type minimum.
In 1443, the king of Poland, Hungary, and Croatia and the Grand Duchy of Lithuania Wladislaw III Jagello, together with the Hungarian general John Hunyadi, began a crusade against the Ottoman Empire. Their army reached West Bulgarian territories, but then the military expedition was stopped east of Sofia due to a very cold winter. This extremely cold winter coincides with the minimum of sunspot cycle SCH105.
There are messages for three extreme climate events from the 17th century near and during the Maunder minimum, which are included in Table 1. The first one concerns Black Sea coast water freezing (BSF) in 1620 AD. It relates to the sunspot cycle SHC121 minimum during the same year. The second BSF event occurred in 1669. It is not related to any sunspot cycle extreme phase, which may be due to the fact that the corresponding solar cycle SHC125 was the third weakest one not only during the Maunder minimum, but also during the last 1700 years in total. The third extreme climatic phenomenon was a very cold and rainy summer of 1668. This caused the complete destruction of the harvest in many regions of the Balkans and especially in the Rhodope Mountains.
In Table 1, two Black Sea freezes during the 18th century are listed: in 1755 and 1774. Both were in coincidence with the minima of the 11 yr sunspot cycles SHC133(SC01) and SHC13(SC03).
A very strange climatic situation occurred in 1810. An early very hard cold began as early as September in combination with intensive snowfall. Cold weather continued during the next three months, until Christmas and New Year. The near-surface Danube water was frozen (DF). All rural economic activity, including grape collection, stopped. The weather surprised again near New Year. Sunny weather was established and many citizens of the town Svishtov, which worked in Walachia, crossed the Danube. They collected grapes from their gardens on the right river’s coast. Due to the snow and cold, the grapes were in a safe and fresh state. This DF event coincided with the 11 yr minimum phase of the Schove cycle SCH138, i.e., Zurich series cycle No 6. This 11 yr solar cycle belongs to the Dalton grand solar minimum (1793/1798–1834), which relates to the 200 yr Suess cycle.
In Table 1, there are two BSF events in 1823 and 1850, which correspond to the 11 yr cycle sunspot minimum (SHC139 (SC7), or Zurich series number 7) and the sunspot maximum (SHC141 (SC9), i.e., Zurich series number 9). There are no associations with any featured economic or political events. A Danube freezing (DF) has been occurs in 1876. It could relates to the deep and very continuous SCH143 (SC11) sunspot minimum phase between 1876–1879.
The last extreme climate event before the instrumental measurement era, listed in Table 1, is a cold winter in 1877–1878 during the the sunspot minimum epoch 1876–1879. It is associated with the Russian army and Bulgarian Volunteer Corps crossing the Balkan Mountain Range in extremely hard winter conditions.
The most reliable fact, which was established by using a χ2-test, is a strong inclination of extremely cold winter seasons to 11 yr sunspot cycle minima. For this aim, all 34 events in Table 1 were separated into two groups. The first one contains DF, BSF, and/or CW events that occurred near the 11 yr sunspot cycle minima. The second one contains all other extreme winter events near the 11 yr sunspot cycle maxima or intermediate phases. The calculated χ2 for calendar interval 296–1899 AD is 9.26. The minimal critical level of χ2 for 99% validity is 6.64. This result confirms the validity for dominant cold winter grouping near the minima of 11 yr (Schwabe–Wolf) cycles, which was mentioned above in the text.
However, some BSF, DF, and CW-events between 296 and 1899 occurred near the 11 yr sunspot maxima (in 299, 558, 755, 765, 934 and 1850 AD). As has already been pointed out, there have been few extremely cold winters during the epoch of instrumental observations in Bulgaria since 1899. This indicates that the coldest winters in Bulgaria, as well as in the Balkans, are triggered by two types of space climate phenomena. The first ones are most effective during 11 yr sunspot cycle minima and are the dominant case, while the other ones occur during sunspot maxima. As it will be pointed out in Section 4, the basic physical nature of forcing on climate by both types of space processes could be similar.
All four extremely hot and dry summer seasons (DHS events) in 863, 1028, 1388, and 1391 AD shown in Table 1 were placed on the rising or near-maximum phase of even-numbered 11 yr sunspot cycles. This is in very good agreement with both the author’s earlier results in the 1980s [58] on the basis of instrumental observations and the more recent, which are based on dendrochronological data [46,69,70], that the hottest and driest summer seasons in Bulgaria tend to the rising or near-maxima phases of even-numbered Schwabe–Wolf sunspot cycles. It is interesting in the present case that all four DHS events are placed in relation to the 200 yr Suess cycle grand solar minima.

4. Discussion

4.1. The “Cosmogenic” 14C and Heliospheric Modulation Potential during the Recent Wurm and Holocene

The “cosmogenic” 14C tree ring series is perhaps the most used historical solar activity proxy for the last 10,000–15,000 years (the recent Wurm and Holocene epochs) since the 1970s [20]. Unfortunately, these data are far from “ideal” and they are affected by few significant factors. Such factors are: 1. the geomagnetic dipole field strength; 2. CO2 adsorption/weathering carbon rock processes; 3. green plant mass variations; 4. ocean –atmosphere –solid surface” CO2 interchange processes; 3. tectonic activity (volcanism and earthquakes) and related CO2 emissions from volcanic hearths and tectonic faults; 5. the anthropogenic CO2 contribution in the atmosphere, caused by using coal and hydrocarbon fuels, which is significant for the balance of CO2 and 14C/12C ratio in the terrestrial environment during the last ~100–150 years (“Suess effect”).
That is why there are a number of studies since the 1970s, but mainly during the last two decades, that attempt to solve the problem by accounting for and removing the above-mentioned factors’ influence and extracting the pure solar activity contribution in the Δ14C% (or 10Be) series [48,71,72]. This depends on the geomagnetic dipole moment M, whose variations during the Wurm and Holocene epochs are taken as well known on the basis of paleomagnetic and archeological data [73,74,75].
On the other hand, data for primary protons and α-particles in local interstellar GCR spectra Ji(E) for the i-th type (outside heliosphere; E is the energy per nucleon) and normalized kinetic energy per nucleon Yi(E) are also used. The aim is to extract ϕ(t), a parameter that presents the solar modulation potential for the moment t, i.e., the solar activity effect on particles from the i-th type. The mean planetary production rate Q(t) for two types of particles (protons and α-particles) is calculated by formula [48]:
Q ( t ) = i = 1 2 0 Y i ( E ) . J i ( E , ϕ ( t ) ) ( 1 f ( t ) ) d E
The function f(t) describes the influence of the Earth magnetic dipole moment M(t) in the current calendar moment t. The detailed procedure for calculating Q(t) is described in [48].
On the other hand, Q(t) needs to stick with the observed values of Δ14C in the corresponding terrestrial final reservoir (tree ring widths in our case), where the real contents of 14C are measured. The last one needs to use numeric physical models for the carbon cycle in the Earth’s environment, in which the 14C isotope also participates. The so-called five-box models are considered as most often used. The corresponding model describes the physical/chemical and transport processes of 14C after its origin in the stratosphere, capture in CO2 molecules, and consequent transfer between the above mentioned 5 reservoirs up to their capturing in tree rings or other final ground reservoirs.
Thus, by the combined use of both models (the 5-box carbon cycle model and that for 14C production rate (Formula (3)), one can extract Q(t) and the corresponding ϕ(t) values. The latter is directly related to the Sun’s open magnetic flux and sunspot number due to corresponding models [48].
There are also similar models for the reconstruction of ϕ(t) based on 10Be deposits in polar continental glaciers [72]. Because of the specific process of capture, placing the final reservoirs (the continental glaciers), capture in aerosols, and short “resident time” for ground 10Be atom deposition (~1–2 years), the process strongly depends on location. Unlike 10Be, the 14C atoms are well mixed in the Earth’s atmosphere due to much longer resident time (up to a few decades for transport from the stratosphere to the ground-placed final reservoirs). Thus, there could be a relationship to calendar moment t with mean planetary production rate Q(t) (see (3)).
Kovaltsov et al. [48] considered a model reconstruction of ϕ(t) both on the basis of the Holocene tree ring 14C (INTCAL09) and 10Be from the Greenland Ice Project [76]. Two kinds of geomagnetic pole moment models were used.
A good agreement for derived sunspot number series based on both “cosmogenic” isotopes data for the last 9000 years was found. The most essential result for our study is that the 2400 yr cycle both in 14C and 10Be series was found. The Hallstadt cycle is not only well visible in both “cosmogenic” isotope series, but there is also a good phase coincidence between them. It was also concluded by the authors of this study that the observed ~2400 yr cycle is related most probably to solar activity, because a statistically reliable oscillation of the same length in any geomagnetic data series was not detected [48]. This is an interesting circumstance that could help explain some features of the Schove series during the first calendar millennia (see below in Section 4.2).
A series of demodulation procedures over the primary INTCAL13 series (Section 3.1) was carried out. According to the present general point of view, the general trend and both cyclic components (Figure 1, Figure 2 and Figure 3) relate to the geomagnetic dipole moment M and “pure” (non-related to solar activity) climate changes. The latter should be very important during the Wurm–Holocene transient epoch (~9000–6000 BC) Thus, the three-step detrending/demodulation procedure removes, or at least leads to a very strong decrease in non-solar signal contribution in residual INTCAL13 series.
The comparison between this residual Δ14C%(3) series (Section 3.1; Figure 4) and the model Hallstadt series [48] shows a very similar picture regarding the moments of the Hallstadt cycle extremes since ~7000–7500 BC. The relative amplitudes of this cycle in the different parts are also too similar. There is a prolonged fading of 2400 yr cycle wave in Δ14C%(3) in our study around 4500–2000 BC (Figure 3 and Figure 7). It corresponds well to a prolonged high solar activity epoch in [49] during the same time, where the “model” 2400 yr cycle is also seriously damaged.
One should remember that the used methods for detecting and analysis of the 2400 yr cycle in both studies are quite different. It is a pure time series analysis (the TRPA algorithm), which includes demodulation procedures in this study. On the other hand, there are physical models for the production, transport, and deposit of 14C and 10Be and time series analysis in the next stage in [48]. The final results, especially regarding Hallstadt, are similar.
One should consider the physical models, which are based on the determination of ϕ(t) and, as the next step, the sunspot activity, as more improved. At the very least, such models help in better understanding the physical processes regarding the complex relationship “solar activity and geomagnetic field–cosmogenic isotopes–climate”.

4.2. The Suess Cycle and Hallstadt–Suess Cycle Amplitude Modulation in INTCAL13 and the Schove Series. Relation to Long-Term Variations of Solar Activity and Climate

As is shown on the T-R correlogram in Figure 4, the Suess cycle with a mean duration of ~200 years is a very stable feature in the residual radiocarbon series, where it is contained about 60 times. On this time scale, it seems too weak in relation to the other much more powerful and longer tendencies. On the other hand, its mean corresponding correlation coefficient R remains slightly higher than the red-noise level in the residual Δ14C%(3). The last one corresponds to R/SR ≈ 3.5.
It has already been noted in Section 1.1 that it was evidenced by Damon and Sonett more than 30 years ago that the solar ~2300 yr Hallstadt cycle modulates the amplitude of the 210 yr ones during the Holocene. This result was recently tested and confirmed by Komitov et al. [29] and Bonev et al. [30], and the present study confirms the results of the earlier ones, but on the basis of newer INTCAL13 series.
A doublet with almost equal magnitude peaks at periods of T = 192 and 216 yrs was detected by Komitov and Kaftan in the 10Be Greenland “Dye-3” series for the 1423–1985 AD calendar interval after the use of the two-step demodulation procedure [36]. In the unpublished time series analysis (TRPA) test provided by the author (B. Komitov, non-published) in 2008, a strong 215 yr cycle in the Antarctic 10Be (the South Pole) data series for the calendar interval 850–1900 AD was obtained [77]. The latter was scanned from the plot and that is why it could not be taken as strong official, but rather just as for orientation.
The fact that the Suess cycle amplitude varies with the Hallstadt periodicity during the Holocene allows for the conclusion that both cycles belong to closely interconnected solar processes.
The solar dynamo models to the present day explain well the Schwabe–Wolf (~11 yr) and the Hale (22 yr) cycles [78], but practically not the longer solar oscillations. That is why long-term solar activity changes are usually considered to be “stochastic” [79]. Thus, one could say that long-term solar activity generally is a call for the developers of solar dynamo models. There are a large number of rewards for explaining the long-term solar activity cycles as a result of additional outer tidal forcing from the Solar system planets [80,81] (mainly giants Jupiter, Saturn, Uranus, and Neptune), which are presently too debatable and need a more stable physical argument.
As has already been noted, the Schove series is a historical dataset independent from cosmogenic isotopes. Moreover, it is older than the latter, and a cycle with quasi bi-century duration was detected in this oldest solar activity data series [6,7]. We must remember that the 204 yr cycle that was detected in the Schove series (296–1996 AD) by the author in 1997 was confirmed by him for 14C in the same study [27]. The delay of 14C in the Schove series is about two Schvabe–Wolf sunspot cycles (~22 yr) [27]. The last value corresponds well to the “resident time” for the deposit of 14C on the Earth’s surface after its production in the stratosphere. Thus, if we consider the tree ring radiocarbon data as a good proxy for the past, it should also be allowable for the Schove series.
The conclusion for the compatibility between the Schove series and the tree ring 14C data is also verified by the identical behavior of S200 power index for both types of the series in their overlaying calendar part since 296 AD. The analogous behavior between S200 in the Schove series and the tree ring radiocarbon data was established first in our previous work in 2004 when for 14C, INTCAL98 [14] with a time step of 10 years was used [29] and again in the present study with INTCAL13 [47] (see Figure 5). Analogous results also have been obtained if INTCAL04 series [63] is used (non-published).
It is important to note that although the Schove series is based on messages about varied more or less connected to solar activity phenomena, their basic content relates to aurora observations in the Antique and the Middle Ages. Occurrence of the latter, as well as their visibility, should strongly depend on geomagnetic dipole moment M variations. According to [73,74,75], the geomagnetic dipole moment M reached temporary maxima during the first half of the first calendar millennia and generally decreased after 500 AD and up to the present day. That is why the general real level of the Schove series during the first millennia should be slightly higher as it is taken. This did not significantly affect morphological structure, moreso relative magnitudes between adjacent 11 yr sunspot cycles. However, it could make the Hallstadt cycle better expressed in this dataset.
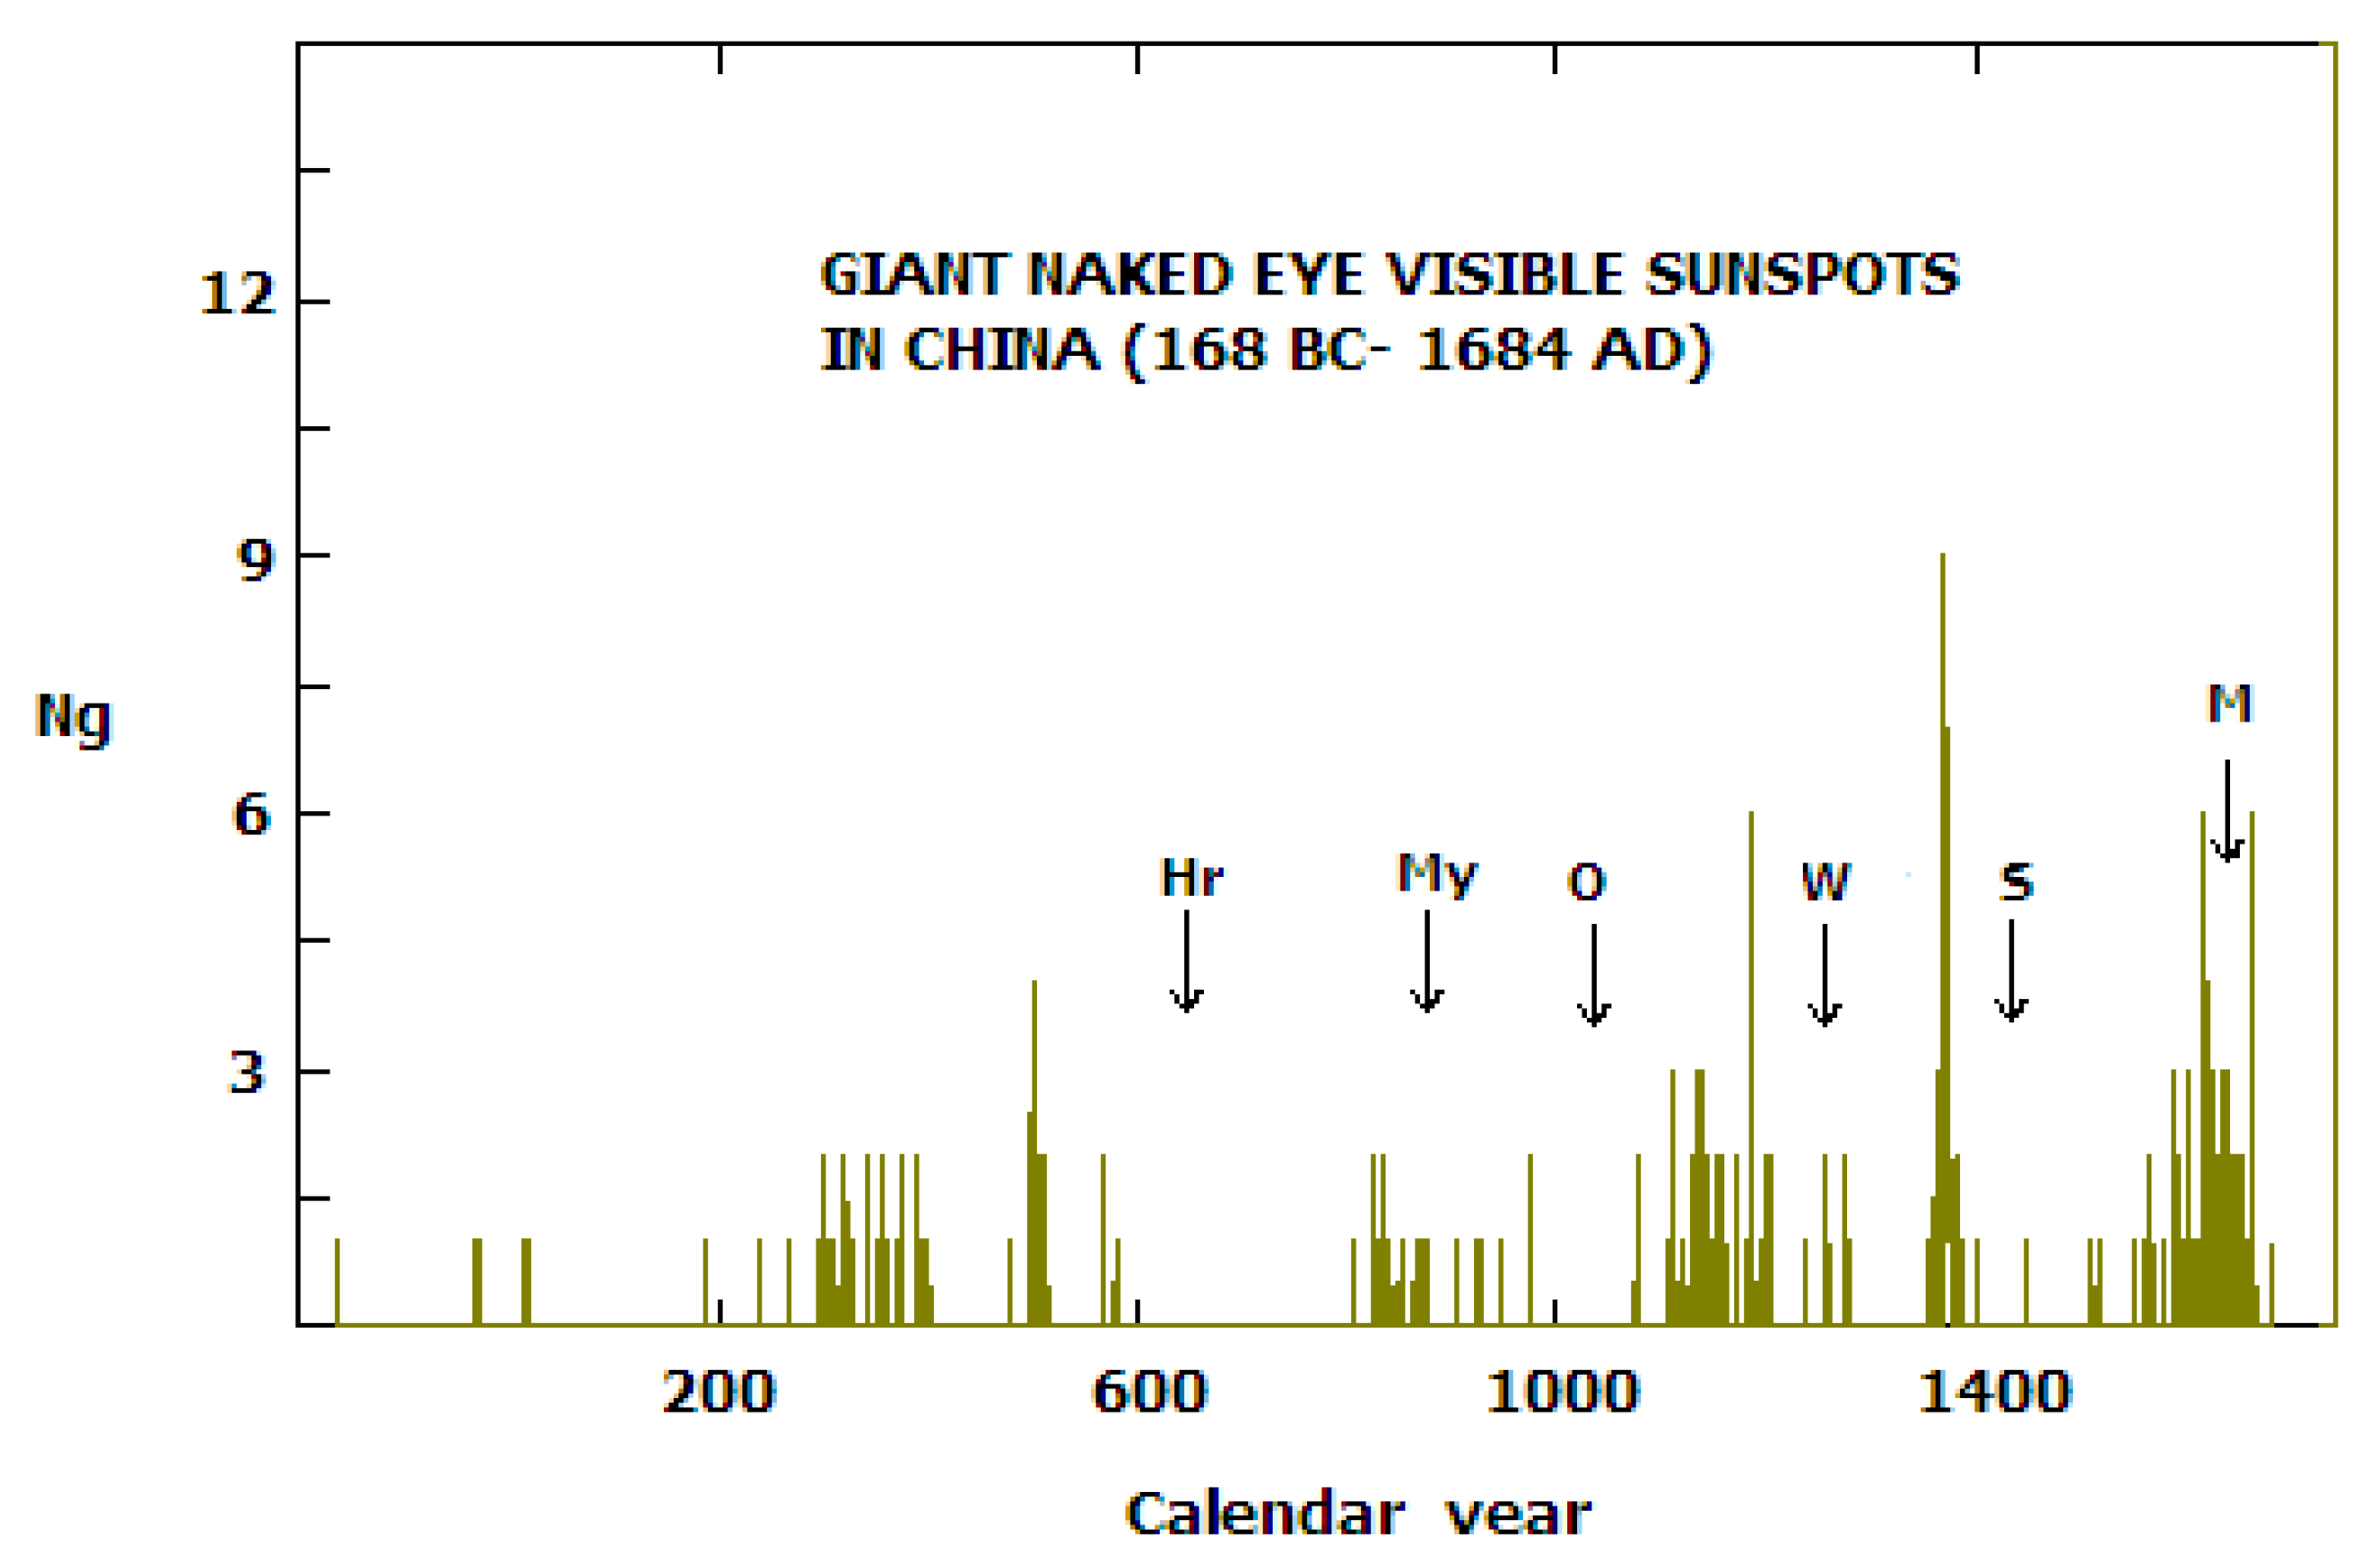
The Chinese catalogue of giant naked eye visible sunspots (GNEVSs) contains information about 1849 observations of such objects on the Sun disk between 165 BC and 1684 AD [49]. Most probably, keeping in mind that they were registered during the pre-instrumental observation epoch, the catalogue concerns predominantly large sunspot groups. This relates to the fact that very often it is impossible to resolve the separate spots in the groups by naked eye. The corresponding annual numbers (Ng) are shown in Figure 11. It is clearly visible at first glance that a strong general trend exists in these data. This is not caused by real solar activity long-term effects, but rather reflects increasing interest in China through time in these observations. However, some conclusions regarding long-term solar activity variations can be made.
Early in 1997, a 250 yr cycle in the GNEVSs series by Vaquero et al. [82] was obtained. According to Figure 11, there are few clearly visible series of calendar episodes empty from sunspots through intervals of ~200–250 years.
The T-R spectrum of Ng indicates that the main quasi-periodic oscillations over the red noise are of durations of 266 and 220 years, in which the first one is stronger. The existence of a 220 yr component in the T-R spectrum confirms that there is a significant trace of a Suess-type cycle. However, the existence of a 266 yr cycle indicates that there is also the influence of additional quasi-periodic factor(s) with similar but a little longer duration. That is why Figure 11 reflects, in the author’s opinion, the Suess cycle influence, but only for particulars. As is shown, there are clearly visible deep grand minima in the 7th, 11th (Oort), 13–14th (Wolf), and 15–16th (Spoerer) centuries. They correspond well to both the Schove series and all tree ring radiocarbon data series since the 1970s. However, there is almost total discordance between both these series and GNEVSs for the middle and end of the 17th century.
According to Schove [6,7], the Maunder minimum is the epoch of non-zero, but the lowest level of sunspot activity for the last two millennia. Moreover, Eddy [31] and Hoyt and Schatten [15,83], basing on instrumental observations, even consider it as the epoch of almost total absence of spots on the Sun disk. Very low sunspot activity during the middle and end of the 17th century is considered also in the models, based on the new instrumental version of the international sunspot number series of the Belgium Royal Observatory [84]. Unlike all these mentioned data sources, there are shockingly and excessively many observed sunspots in the GNEVS series, as if the Maunder minimum did not exist.
However, the GNEVS series is only one of the historical solar activity data sources. Unlike the GNEVS series, the Schove series is based on many types of phenomena, despite the dominant participation of aurora there. Moreover, as has already been noted, it is in good agreement with the radiocarbon data [28]. That is why one could consider the Schove series as a much better solar activity reconstruction of large-time-scale solar activity variations compared to GNEVSs. Extended international research based on different types of instrumental and historical data leads to the conclusion that the Maunder minimum is really a grand solar minimum [85].
One should also consider another serious contradiction between the Schove series and the tree ring 14C data from one side and GNEVSs from the other one during the middle of the 8th century. According to GNEVSs, no sunspots visible to the naked eye were observed during this time, while the Schove series and the radiocarbon data indicate high or even very high activity during this time. Additional indirect (climatic) evidence for high solar activity during the middle of the 8th century will be discussed in Section 4.4.
Based on all mentioned above, one can conclude that:
  • The historical data for sunspots visible to the naked eye in the GNEVS series cannot be used as an independent proxy of activity level in the past. It should be used in combination with and in addition to other historical sunspot activity sources for building more complex sets.
  • A high number of messages for GNEVSs in separate epochs cannot fully guarantee that the overall sunspot activity is also uniquely high. A contra-example is the Maunder minimum. To the contrary, a high overall sunspot activity could be high despite the full absence of GNEVSs on the solar disk. (The overall sunspot activity is described by indexes like Wolf or Group sunspot numbers and the existence of sunspot groups visible to the naked eye is not without fault). However, the dominant general tendency is that GNEVSs are observed more often during the high overall levels of sunspot activity.
  • A trace of the Suess-type bi-century cycle (~220 yr) was confirmed by using TRPA in the Chinese GNEVS series. The nature of a competing 260 yr cycle is unclear at this stage. It is possible that the latter oscillation is a real feature of the giant sunspot groups. The alternate hypothesis that the 266 yr cycle is a subjective observation effect seems to be non-realistic.
According to Dergachev and Chityakov [32] and Bonev et al. [30], as well as some of our previous studies [33,34], the current Hallstadt cycle ends its initial active phase during the first half of the 21st century. According to these studies, the solar activity should enter the next relatively quiet Hallstadt cycle phase, the “plateau”. It is expected to continue for ~700 years according to [32] or for ~500–600 if the existence of the quasi-millennial secondary Hallstadt cycle minimum [33,34] is taken into account. The nearest analogue of this “plateau” corresponds to the calendar epoch between 250 BC and 350/370 AD, which some researchers call, in the climate aspect, the “Roman optimum”, the epoch of predominantly moderate and moderate-high sunspot cycles and a relatively warm climate with small long-term variations [86,87].
The latter is considered to be a result of activity changes caused by solar cycles with sub-century and quasi-century periods. There could also be quasi 200 yr Suess cycle participation. However, taking into account the Hallstadt amplitude modulation, the Suess cycle should be weakened in relation to the previous 800–1000 years. Thus, such deep grand solar minima as those of Oort, Wolf, Spoerer, and Maunder should not be expected.
Taking into account all the above mentioned, as well as our model extrapolations of the Schove series and international sunspot number series (SILSO_v1) [33,34], we should expect a continuous, but relatively shallow grand solar minimum during the 21st century. It can be placed approximately in the calendar interval 2010–2080 [33,34]. According to the two types of kinematic models by Komitov and Kaftan, based on the recent part of the Schove series (1000–2000 AD), the deepest phase should occur near to 2060–2070 AD. It is shown in [33] that the new grand solar minimum epoch should be mainly a superposition effect of the downward phases of bi-century (210 yr) and 350 yr cycles. According to our kinematic models, their minima should occur in ~2060 and 2120 AD, respectively. The quasi-century (100 yr) cycle should reach its minimum around 2010 AD and next maximum around 2060 AD. The quasi 210 yr cycle was the main long-term solar oscillation after 1000 AD, while the 100 yr and 350 yr ones were essentially weaker.
The fourth long-term oscillation in the Schove series after 1000 AD is a trend-hyper-cycle of duration of 1150 years. According to both kinematic models in [33], the last minimum of this low frequency component was in the 15th century and the next maximum should be reached in the 21st century. It is necessary to note that this ~1100–1200 yr cycle is a second resonance of the Hallstadt and its present near-maximum phase corresponds to an incoming 2400 yr cycle “plateau” phase.
One of the precursors of the approaching grand solar minima related to the Suess cycle is a violation of the amplitude Gnevishev–Ohl (G-O) rule. As was found by the author in 1997, if the near-maximum annual sunspot number value of an even-numbered sunspot Schwabe–Wolf cycle in the Schove series (number 2n in the Zurich series) exceeds ~125, then the next odd-numbered (2n + 1) one should be weaker. Thus, the amplitude G-O rule violation was predicted for the pair SC22–SC23 [28]. This prediction was found to be valid and the SC23 magnitude in 2000 was 120 against 158 for SC22 in 1989.
Recently, in 2001, it was evidenced by the author and Bonev that the amplitude G-O rule violations for the even-odd pairs with strong solar even-numbered quasi 11 yr cycles (Sn(max) > 125) are predictors for the upcoming Suess cycle minima and related grand solar minima of the Oort–Dalton type [88]. A qualitative prediction for the long and shallow Dalton-type during the 21st century was made, namely taking into account the current phase of the Hallstadt, which excludes a Maunder-type grand minimum in the 21st, as well as the next nearest centuries.
This conclusion is confirmed by our next studies [33,34], as well as by the really observed sunspot activity changes since 2000 AD. There are a number of indications of a new grand solar minimum epoch. The most prominent of them are as follows:
  • A deep and prolonged sunspot minimum between SC23 and SC24 (2007–2010).
  • A low magnitude of SC24 (2009–2020 AD). The mean annual sunspot number in 2014 is Sn = 82 in the old version of international sunspot (113 in the new SILSO_v2 system). It places SC24 between SC12 and SC14 from one side and SC16 from the other side, but closer to the first and second ones. Thus, SC24 is essentially weaker in amplitude than the previous few Schwabe–Wolf cycles. It corresponds to the even-numbered cycles close before and during the Gleissberg grand solar minimum. The author’s first preliminary estimations show that SC25 will not exceed SC23 in amplitude and most probably it will be similar to SC15 (1913–1923 AD) [89].
  • A clear downward tendency for monthly numbers of moderate and strong X-ray flares (classes M and X) since 1976 AD. The fall of flare activity was significantly increased after the SC22 maximum in 1990–1991. Thus, SC24 is the weakest since the beginning of regular solar X-ray flux observations by the GOES satellite series and very probably since the start of regular X-ray flux observations at all in 1968 [90].
  • Decreasing radio-burst activity in the whole observed range since 1965. During the last ~60 years (SC20 to SC24) has been observed [90]. This statement despite some very tormentuous episodes like those in June 1991, October 2003 [91], etc. was valid,
  • A general downward tendency in geomagnetic activity since the end of the 1950s and up to the SC24 maximum was also established [92].
There are many studies during the last 25–30 years where an upcoming grand solar minimum during the present century is predicted [40,93]. Some of them consider this event to be an effect of the approaching 200 yr Suess cycle minimum. In some of these studies, predictions of a Maunder-type minimum and, as a result, of a “little ice epoch” are given [93]. However, the actual Hallstadt cycle phase in the present epoch is taken into account in almost none of these studies.

4.3. Space Weather, Tectonic Activity, and Climate

Tectonic activity is considered to be an important natural factor for the Earth’s climate forcing. This concerns mainly volcanic activity. Volcanic eruptions are powerful sources of acid gases (HCl, SO2, H2SO4, etc.) in the atmosphere. Thus, they participate in aerosol nuclei generation and, consequently, in aerosol and cloud generation processes and climate.
The first ideas of the existence of relationships between solar and volcanic activity appeared in the beginning of the 20th century. The first established indirect evidence based on data analysis was given by Andre-Louis Danjon in 1921 AD [94]. On the basis of data for total lunar eclipse (TLE) observations between 1821 and 1921, he found that there is a strong tendency for the grouping of so-called “dark” TLEs with brightness magnitudes of 0 or 1 near minima of the 11 yr sunspot cycle (about 1 year after them). As the Moon’s color during TLEs depends on the Earth’s atmosphere transparency, the above-mentioned facts can be considered as evidence that increasing abundances of light-absorbed/scattered components occur during the sunspot minima. Such natural components can be volcanic dust particles, aerosols or/and clouds. That is why it should be concluded that during sunspot minima there are forcing factors for volcanic activity or for aerosol and cloud production (or possibly both together).
GCR flux penetrating into the Earth’s atmosphere reaches its maximal phase near quasi 11 yr sunspot minima phases or close (1–1.5 years) to them. According to the theory suggested by Svensmark [95,96,97], higher GCR flux in a sunspot minimum phase forces ionization processes in the lower atmosphere, which, in turn, forces aerosol production, stimulates cloud origin, and leads to a general climate cooling tendency. So, GCR flux could also be a primary factor for “dark” TLEs during sunspot minima.
Svensmark’s theory is a subject of hot debates and controversial points of view. Some improvements of Svensmark’s initial suggestion have been given recently. According to the model by Yu [98], a potential existence of acid gases in the atmosphere simultaneously with increases in dust particles and ion–electron pairs leads to a strong increase in aerosol production.
The next important moment relates the existence of relationships between space weather phenomena and volcanic activity. In the present discussion, I will focus on the results and analysis that was obtained by the author and Kaftan during the last few years. A detailed description of the corresponding studies and results is given in [99,100,101]. The whole database, which was published on the Global Volcanism Program of Smithsonian Museum for Natural History website (https:/volcano.si.edu, accessed on 15 January 2022) for the calendar interval 1550–2020, was used. It contains information about the name, geographic coordinates, dates of eruption, and volcanic eruptive index VEI for each phenomenon. There are 6215 events in total for the above-mentioned period. The main conclusions, which are important for the present study, are:
  • Statistically significant cycles with durations of 11, 20–22, 61–62, ~90, and ~250 years were established. The first four cycles have analogues in sunspot activity and/or others belong to space climate components.
  • After the demodulation procedure over the 250 yr cycle, a weak but statistically significant 178 yr cycle in the T-R spectrum is shown. The latter corresponds very well to the Solar system bari-center oscillation cycle, the so-called Jose cycle [102]. (This result is new and is published here for the first time). The above-mentioned 250 yr cycle is shown in the entire time series, but it was not detected in the time series selection of the powerful volcanic eruptions, whose volcanic eruptive index VEI is ≥4 [99]. On the other hand, in the selected series (VEI ≥ 4), the solar-modulated cycles of durations ≤90 years are even better expressed than for the whole dataset (VEI ≥ 0) [99,100].
  • By using histograms, a tendency for grouping of the strongest volcanic eruptions (VEI ≥ 5) near both sunspot Schwabe–Wolf cycle extremes was found [100]. Moreover, all the volcanic eruptions with VEI ≥ 6 (in total, eight since 1550 AD) occurred near extremes of the quasi 11 yr solar cycle phases, without any exclusion [100].
  • As it follows from the two-peaked histogram distribution, there are two basic types of space climate events that force volcanic activity: the first type relates to flare activity and sunspot cycle maxima, while the second one relates to GCR flux and sunspot minima [100].
  • Space weather forcing of volcanic (and seismic) activity is of a trigger type. Space weather phenomena affect only those volcanic hearths and faults where the physical parameters determined by inner lithosphere processes are near to their critical levels. This occurs where gas and magma pressure exceeds hydrostatic pressure plus adhesion of the upper placed rocks and lithosphere block friction. (Note: The critical level for each triggered volcanic event or earthquake is strongly specific. No general critical trigger energy level exists. That is why the latter depends mainly on the tectonic history, i.e., the magnitude of previous volcanic eruptions and earthquakes and time intervals between them, as well as the geological structure of the region, where the volcanic hearth or lithosphere fault is placed. These circumstances, as well as many other additional ones like strong man-made explosions or tsunamis in the Pacific or Indian Ocean coast regions could accumulate energy in the tectonic activity and reduce the above-mentioned critical level).
  • The primary solar phenomena forcing volcanic activity during sunspot maxima are X-ray flares of moderate and strong magnitudes (M and X classes) and the closely related to them solar proton events (SPEs). They affect the Earth’s environment due to sudden ionosphere disturbances (SIDs) and solar high energy proton penetrations in the atmosphere (radiation storms). Indeed, these phenomena are much more effective triggers of tectonic events as geomagnetic storms.
The low ionosphere D-layer plays a very important role for the structure and parameters of the electric poles in the troposphere and stratosphere. As it is mainly a product of solar X-ray solar radiation, its parameters strongly depend on solar activity level and the Schwabe–Wolf cycle phase. The D-layer is generally the best developed and powerful during the epochs of sunspot activity maxima, while it is too weak or almost absent during sunspot minima. SID events generated by solar X-flares, as well as energetic solar protons (E ≥ 10 MeV) generated by the SPEs, are stress events for electric current systems in the stratosphere–troposphere region of the Earth’s atmosphere.
On the other hand, the lithosphere magma generally and volcanic hearths in particular are also relatively rich in free charged particles. This is visible from the thunderbird activity near many volcanoes in their eruptive phases [103]. Thus, lithosphere magma can also be considered an important source of terrestrial electrical poles.
Lithosphere and ionosphere electric pole interactions are a subject of studies by many authors. In their modeling of the ionosphere–lithosphere electric pole system, Kuo et al. [104] considered the lithosphere magma as a source of the “lithosphere dynamo”, while the ionosphere (I will focus especially on the D-layer) is considered a source of the “ionosphere dynamo”. Both electric poles interact between themselves. Finally, the authors in [104] included a third source of electric fields in their model—the “aerosol dynamo”. It is formed by the charged aerosol nuclei, i.e., in the atmosphere.
Taking into account our above-commented results regarding “Sun-volcanic activity” [99,100,101] (see points 1–6), the following picture of “Sun-tectonics-climate” seems to be valid during sunspot maxima epochs:
Generally, high solar X-radiation increases the Earth’s low ionosphere D-layer. On this active ionosphere “background”, solar middle and strong (M and X class) flares generate SID events in the D-layer. This leads to the instability of the electrical current system between the ionosphere and the terrestrial surface/upper lithosphere. As a result, a triggering of tectonic events in instable fault regions, where physical parameters are near critical levels due to inner terrestrial processes, occurs.
These trigger effects are very probably stimulated additionally by means of reverse piezoelectric effects (RPEs) under the forcing of variable local terrestrial electric fields RPEs should lead at least to an increase in the mechanical stress on/around the lithosphere block boundaries or even to direct trigger switching of a tectonic event.
The piezoelectric effect triggering is possible if the corresponding tectonic instable lithosphere region is relative rich in SO2 (Martichelli et al. [105]). Piezoelectric phenomena are typical for SO2 crystals, where they were first discovered in the 1880s by Jacques and Pierre Curie. Other natural minerals with piezoelectric properties, for example, are ZnO and AlPO4. However, SO2 (quartz) is the second most wide-spread mineral in the Earth’s lithosphere, especially in the continental upper layers. It is a basic mineral component for many magmatic rocks like granite and to a lesser degree but still important in gneiss and other metamorphic rocks, as well as in sediment rocks.
The above trigger mechanism during the sunspot maxima epochs leads to corresponding solar forcing of volcanic emissions, not only dust particles, but also the volcanic acid gases (SO2, HCl), whose injection into the atmosphere should thus be considered as indirectly forced by solar flare activity. Ionization processes in the stratosphere and upper troposphere due to solar energetic particles (SEPs) with energy E ≥ 50 MeV could be considered as an additional solar forcing amplifier of aerosol nuclei generation.
As has already been mentioned above, the aerosol nuclei participate in the generation and structure of terrestrial electric current systems. Simultaneously, due to their electrical charges, the horizontal and vertical transport and distribution of aerosol nuclei depends on the lithosphere and the low ionosphere dynamos. As the state of the ionosphere strongly depends on active processes on the Sun, there is an overall amplifier effect on the “ionosphere–lithosphere–aerosol” system.
That is why, due to the overall solar X-ray background flux changes plus X and M class flares and SPEs, instability of the terrestrial electrical current system occurs. This affects the lithosphere stresses and triggers tectonic activity processes. This, from its side, causes additional instability of currents between the lithosphere and ionosphere and simultaneously affects increasing volcanic acid gas emissions. GCR and SEP flux ionization processes on the molecules of these gases force the generation of aerosol nuclei. In turn, this forces the generation of aerosols and clouds. Finally, the whole system of the mentioned processes influences climate (Figure 12).
During sunspot minima, the ionosphere generally is too weak due to a low “background” solar XEUV flux and almost full absence of solar X-flares and SPE events. The ionosphere dynamo is much weaker than in sunspot maximum epochs. However, the GCR flux level increases. The role of the ionosphere D-layer is taken by the so-called (by some authors) “C-layer” [106] at heights of about 35–40 km. It corresponds to the maximal GCR flux absorption. The ionosphere dynamo function is intercepted by this layer, which stays more significant. This occurs not only due to the increase in GCR flux, but also to the weakening of the whole “common” ionosphere (D + E + F1 + F2 layers) overall and mainly of the D-layer. A new structure of electric poles stays more closely captured to the Earth’s surface. Ion–electron pair production by GCR increases, which leads to a parallel aerosol nuclei production increase.
On the other hand, the absence of active solar events makes shock events for the electrical current structure less probable. However, very continuous and fluent changes in GCR near sunspot minima attest to the existence of continuous and relatively high atmosphere electrical conductivity between the lithosphere and the C-layer, as well as to higher electrical pole intensity between both of them. As a result, the energetic threshold for all possible triggered tectonic events decreases. Consequently, one should expect a second maximum in probability of tectonic activity, which occurs near the sunspot minima epochs.
Due to the triggering nature of solar forcing of tectonic activity, a quantitative statistical relationship of the correlation-regression type is too difficult to obtain, as there is a lack or full absence of data for internal processes in volcanic hearths and tectonic faults. That is why the critical energy threshold for each separate tectonic event remains unknown at this stage of knowledge.
Thus, the presented above “Sun–climate” relationship hypothesis could consider the “Sun–ionosphere–lithosphere” and “Sun–climate” relationships as an interactive and very complex phenomenon (Figure 12).
It seems that Svensmark’s hypothesis about GCR, aerosols, clouds, and climate, which was mentioned above, includes very important processes in the whole scheme. However, it needs tectonic activity and terrestrial electric currents to be added as very important elements.
It is also possible that the above-described mechanism is the main one for the ”Sun-climate” relationship. There are some advances in relation to the mechanism based on TSI-variations.
First, in the suggested picture, the “start key” is not in the almost constant TSI-index. Its relative variations for the precise satellite observation epoch since 1978 AD and up to 2009 AD are on the average 0.06 ± 0.02% between the extremes of sunspot Schwabe–Wolf cycles [107]. Most probably, TSI is too small a variable even in the last 300–320 years since the Maunder minimum. According to [108], the TSI increase between 1700 AD and 2009 AD is ~1.2 W·m−2. It is comparable with TSI variations between 11 yr sunspot cycle extremes during the last decades. Unlike TSI, the solar XEUV flux is strongly variable. During the sunspot cycle, it varies by a factor of~2–3 for EUV and Lα and more than 100 for the X-range [106]. The existence and parameters of the ionosphere D-layer, which is the most important for the present theme, are critically dependent on the solar X-ray flux level and, consequently, on the sunspot cycle phase.
Second, due to the triggering nature of solar forcing of volcanic activity, the X-ray flare magnitude is not of critical importance in the general case.
In some cases, a trigger effect occurs after strong X-class flares, while in others a moderate M-class flare is enough for this effect. The largest de facto potential energy of volcanic magma could be released by the trigger of a relatively small amount of energy of the X-ray solar flare flux incoming from the Sun. The VEI-index of volcanic eruptions and corresponding climate effect depend on volcanic magma potential energy by the eruption moment and the following climate effect also depends on the volcanic VEI-index, but not without a fall of the magnitude of a triggering solar flare. If TSI changes are taken as a dominant factor for solar forcing of climate, the absolute value of solar agent energy (TSI) variation is critically important. However, as has already been commented, TSI variations are too small. Similar is the situation during sunspot minima, when the GCR flux decreases the mean critical threshold for all trigger event types.
Third, for the occurrence of some environmental phenomena, one can observe two preferred sunspot cycle phases, usually near the sunspot cycle extremes. The two groups of cold winters in Bulgaria obtained in this study on the basis of historical data are a good example for this one (see also Section 4.4).
Finally, it is very probable that solar-modulated cyclic fluctuations in volcanic activity should also relate to the simultaneous increasing of volcanic CO2 emissions in the atmosphere. However, due to the geological origin of this emitted CO2, its relative 14C content is close to zero. Thus, the volcanic CO2 could produce a relative depleting of 14C in the atmosphere similar to the “Suess effect”. Unlike the standard “Suess-effect”, which is caused by coal burning and significant only during the last 100–150 years, the geological “Suess-effect” probably permanently exists during the Earth’s entire geological history. As a result, if the above-mentioned phenomena are significant, it could damage the real solar modulation of stratospheric 14C production to some extent. Its real amplitudes could be higher than that the reconstructed via tree ring 14C or other data.

4.4. The Solar Activity Traces in Climate of Bulgaria in the Last Two Millennia: Some Circumstances about “Year without Summer in 1816 AD” Phenomenon

As was noted in one of our recent studies [46], the Balkan Peninsula is located on the periphery of Atlantic cyclone meteorological and climate influence. This makes the climate of this region rather sensitive to atmospheric circulation changes related to North Atlantic Oscillation (NAO) variability. This relates to Iceland baric minimum activity, as well as the type of dominant atmospheric circulation. It has already been shown in our previous studies [46,69,70] that the relative remoteness of Bulgaria and adjacent territories from the Iceland baric minimum causes significant quasi-periodic basic oscillations with durations of 3.75, 5.5, 10–11, and 20–22 years. These cycles have solar analogues. Evidence that they are really caused by solar forcing on climate is given in our previous works even as early as the middle of the 1980s [58]. Recently, the existence of modulated 60–65 yr and 88 yr oscillations was shown by an analysis of the time series of European beech (Fagus sylvatica) tree ring widths.
The existence of 3.5 and 20–22 yr oscillations in the Bulgarian climate was not a surprise for us. Quasi-periodic 20–22 yr oscillations in Iceland baric minimum activity, which are forced by a solar magnetic 20–22 yr cycle, were found and described by some authors since the beginning of the 1950s [35]. Recently, during the 1960s and 1970s, shorter oscillations related to solar energetic proton events were also found in Iceland minimum variability [109].
A very-well-expressed trace of modulation by the grand solar Dalton minimum (1794/98–1833) is also shown in the time series from the 5 to 7 oldest beech samples (age ≥ 200 years) [46,69,70]. The latter is shown as a relatively long calendar interval of duration of about 35–36 years between 1793 and 1830/33 with extremely narrow tree ring widths of the samples in Central Bulgaria (Central Stara planina, Balkan Mountain Range). It was proved that the above-mentioned epoch of narrow tree ring widths correspond to a dry and hot beech vegetable period (April/May-October) [46,69,70]. However, there are also weak and short local maximum traces around 1815–1816 near the maximum of the sunspot cycle with Zurich number 6 (SC6). By our opinion, this is evidence for a very weak influence of the so-called “Year without summer” in 1816 in Central Bulgaria. As it is well known, this label is assigned to the extremely cold and humid spring-summer season in North America and Western and Central Europe, including also the northwestern part of the Balkan Peninsula. During the same season in Eastern Europe, it was generally dry and hot [110].
Unlike the samples from Central Bulgaria, in the western region near the present border with Serbia the situation was opposite. According to the data from two old beech samples, an absolute peak of tree ring widths for the entire series is observed, namely around 1815–1816 AD. Moreover, the data from both samples indicate a generally wet and cold beech vegetable season in the corresponding region during the whole Dalton minimum.
The “Year without summer” is usually associated with an extremely strong Tambora (VEI = 7) volcanic eruption. However, it needs to be boldly noted that it also corresponds to the near-maximum phase of SC6 in 1816. The absolute monthly maximum sunspot maximum during February 1816 occurred. By the author’s opinion, there is a coherence effect between a solar-triggered volcanic eruption in September 1815 on the one hand and high solar flare activity leading to SPEs, SIDs, and terrestrial current system instability plus intense aerosol nuclei and cloud production on the other hand. The time interval between Tambora eruptions in April 1815 and February 1816 is optimal for volcanic material transport over a large part of the Earth’s surface and a maximal multiplicative climate cooling effect.
Dry climatic tendencies during the Dalton and Maunder minima were also established for other regions in the world with a similar climate type. For example, in the Western valleys in the USA, continuous periods of weak tree ring annual growth, corresponding to the dry climate during the grand solar minima of Maunder and Dalton, were also detected [111]. A generally low sunspot activity level leads to low flare activity and weak amplitude of the solar 20–22 yr magnetic cycle. It is followed by generally lower meridian air transport to the south periphery of the temperate climate band.
On the basis of analysis of beech tree ring widths, it was also established that the amplitude of the 20–22 yr climatic cycle in Bulgaria is modulated by 60–65 yr cycles [46,69,70]. On the other hand, a strong 62 yr cycle aurora activity between 1700 and 1900 AD was also found [112]. For this aim, the published data for middle-latitude aurora observed between 1100 and 1900 AD over Central Europe in the catalogue by Krivsky and Pejml [113] were used.
The kinematic model built for one of the oldest beech samples of age 209 years, whose trunk was logged in 1983, was extrapolated from 1982 up to 2012. On the basis of this extrapolation, the approach of a continuous dry and hot epoch was predicted. According to the model, the latter already started in 1980–1982, i.e., after the SC21 maximum. A near-dry-minimum phase should be reached near 2009–2010. This prediction was confirmed quite well by analysis of the tree ring width time series for 44 new samples whose trunks were logged in 2012–2013. It was also well confirmed on the basis of instrumental meteorological data.
A new kinematic model of beech sample tree rings with similar characteristics as those of logged in 1983 was built. The model indicates that the deepest phase of a dry epoch was already reached near 2008–2009, i.e., during the transition phase between SC23 and SC24. A dry and hot spring-summer-early autumn season epoch, according to extrapolation by a new model, should end near 2030 AD, i.e., around the end of the present Schwabe–Wolf sunspot cycle and the start of SC26. A detailed description of this three-ring data research is given in [46].
The interval between both continuous epochs of the driest and hottest climate in Bulgaria is ~200 years. As has already been pointed out, the first epoch coincides with the grand solar Dalton minimum, while the second (current) one coincides with a new grand solar minimum, which is also of a Dalton type. Thus, the solar Suess-type cycle forcing of climate in Bulgaria is supported by the dendrochronological tree ring data analysis for the last ~250 years since the fourth quarter of the 18th century to the present.
As was described in Section 3.3, there are medieval messages about very deep and continuous dry and hot summer seasons in the 9th, 11th, and the end of the 14th centuries in Bulgaria. They all coincide with the initial phases of the “Mayan”, Oort, and Spoerer grand solar minima of a Suess type. Thus, the historical manuscript sources confirm the conclusions from our previous dendrochronological studies regarding the influence of the 200 yr solar cycle on climate.
It has already been noted that the middle of the 8th century seems to be an interesting epoch regarding sunspot activity, the general space climate, and Sun–climate relationships. Both very cold winters in 755 and 765 AD are in coincidence with two adjacent Schwabe–Wolf sunspot cycle maxima. According to the hypothesis considered in the previous Section 4.3, they can occur if solar flare and SEP activity as well as corresponding ionosphere SID activity are high. The same is also valid for the very tormentuous summer weather in 774 AD, which could also relate to high solar activity. That is why it is very probable that the relatively high 14C abundances in tree ring widths observed around 770th correspond more to high solar flare activity than to a supernova explosion. A similar explanation of 775 AD was considered earlier in [66].

5. Summaries

The main conclusions from this study can be summarized as follows:
  • A time series analysis and related procedures of tree ring Δ14C% abundance data for the last 13,900 years is provided. The aim of the latter was theresearch of solar activity variations. This study focuses on long-term solar cycles and, especially, those with periods of ~200 years (the Suess cycle) and 2000–2500 years (the Hallstadt cycle). Both cycles are interesting due to their relative stability and well-expressed climate forcing properties during the recent Wurm and Holocene geological epochs. The international radiocarbon series INTCAL13 was used as a primary information source. An analogous analysis of the continuous recent part of the Schove series was also provided for verification.
  • The obtained present results were compared with the older ones, where the international radiocarbon series INTCAL98 is a primary data source. The time series step in INTCAL98 is 10 years, while in INTCAL13 it is 5 years. It was found that in their overlap (the last 10,000 years), there are no significant differences. The main cyclic feature in the tree ring “residual” Δ14C%(3) series after removing all trends and “hyper-cyclic” tendencies (with T > 5000 years) remains the solar-modulated Hallstadt cycle (~2400 yr).
  • The Hallstadt is traced in the tree ring radiocarbon data in ~80% of the Holocene, first of all after ~8000 BC. It is also traced in the studied part of the recent Wurm epoch (11,900–9500 BC). However, it is temporarily damaged in the transition epoch between the Wurm and Holocene, which may be due to the fast climate warming. The Sun’s forcing on this process is possible, but the corresponding participation level is difficult to estimate at this stage.
  • A temporary, but not so deep damage of the Hallstadt between 4000 and 2200 BC was detected. Despite this, the quasi bi-millennial cycle remains well detected. After 1000–1200 BC (closely before the solar Maunder-type Homer minimum) and up to the modern epoch, the Hallstadt cycle amplitude reaches the highest levels for the persistent Holocene after 6000 BC.
  • The Hallstadt cycle extreme calendar moments, obtained in this study by using the T-R periodogram algorithm, was compared with those calculated using the physical model for heliosphere modulation potential φ(t). A very good coincidence of the extreme phase moments of the Hallstadt obtained by both principally different methods was established.
  • The solar quasi 200 yr (Suess) cycle amplitude is modulated by the Hallstadt in the Δ14C%(3) time series. It is less expressed during the higher solar activity phases of the quasi bi-millennial cycle (relatively low Δ14C%(3)) and, on the contrary, the ~200 yr cycle variations are stronger during the downward Hallstadt sunspot cycle phases, when Δ14C%(3) increases and the sunspot Hallstadt cycle is in the downward transition phase to its main or secondary minimum.
  • The regularities marked in the six Suess cycles were verified on the basis of the continuous part of the Schove series (296–2020 AD). The conclusions from our previous studies [33,34] regarding the Schove series structure were confirmed again. The studied interval 296–2020 AD includes the recent part of the previous Hallstadt “plateau” plus its secondary minimum, the main maximum, and final main downward phase up to the main 2400 yr (Maunder) minimum in the 17th century. The next ~320–340 years since 1670–1700 AD belong to the initial active phase of the present Hallstadt. A deep grand solar minimum in the 7th century corresponds to the secondary minimum of the previous bi-millennial cycle. The grand minima at the end of the 4th–5th, 9th, 11th (Oort), 13th –14th (first half), 15th–16th, and 19th centuries were in coincidence with the Suess cycle downward phases. In addition, at least one of the downward phases of other long-term solar oscillations of 80–90 yr or longer also participated. The grand solar Gleissberg minimum is not related to any of these types. It is connected mainly to the 80–90 yr cycle minimum and shorter sub-century oscillations as the “background”.
  • Now, the sunspot activity is near the start of a new Hallstadt cycle “plateau” phase. The expected calendar interval for this event is between 1986/1991 and 2050 AD (i.e., SC22–SC27). Indeed, a new continuous and shallow grand solar minimum, related to the downward phase of the Suess cycle, already started in 2008–2009 AD. Its end can be expected in about 2080–2090 AD, according to the extrapolated Schove series models [33,34].
  • An analysis of historical manuscript sources for extreme climatic events in Bulgaria and adjacent territories during the calendar interval 293–1899 AD was made. The analysis of these data shows that the all the coldest winters (BSF, DF, and CW events) occurred near the ~11 yr Schwabe–Wolf sunspot cycle extrema. The cases when extremely cold winters occurred near sunspot minima strongly dominate during the pre-instrumental epoch. Their number is 11. However, there are six cases when the extremes occurred near sunspot maxima. These facts correspond to two possible groups of primary solar or related-to-the-Sun phenomena of similar physical nature, which forced the above-mentioned events. The first one (GCR flux) dominates in Sun–climate relationships near sunspot minima, while the second one (solar X-ray flare and background flux plus SPE activity) dominates near sunspot maxima.
  • It is possible that the sunspot cycle magnitude in the middle of the 8th century is underestimated in the Schove series. Both consequent extremely cold winters in 755 and 765 AD plus the tormentuous summer season in 774 occurred near the 11 yr sunspot cycle maximum phases. These facts also assume high solar flare activity. Due to this, it is also possible that the local peak of 14C production near 770 is related to the continuous period of a high level of flare and solar energetic proton activity. A similar explanation of the “774 AD” phenomenon was suggested earlier in [66].
  • The combined analysis of (instrumental) meteorological, dendrochronological, and historical manuscript data indicates that the epochs of continuous dry and hot spring-summer-autumn seasons in Bulgaria relate to the grand sunspot minima of the Oort–Dalton type and the downward phases of the 200 yr cycle. In light of this, the present dry period, which started after 1980 AD, is not really excluded and, most probably, it is a natural phenomenon.
  • The obtained and summarized results and their analysis regarding large-scale solar activity variations, as well as the corresponding effects observed on the climate, need a new qualitative model for the physical mechanisms of Sun–climate relationships. The observed facts show that climatic cycles modulated by the Sun exist, but their magnitudes are too large to be explained by TSI variations. On the other hand, it is not possible to explain climatic events, which occur strongly near opposite phases of the sunspot cycle, by the TSI-variation mechanism. That is why a new physical mechanism of the solar–climate relationship is suggested. It is based on our new studies of solar–tectonic (mainly solar–volcanic) and terrestrial electric current system variation relationships.

Funding

This research did not receive external financial support.

Institutional Review Board Statement

Not applicable.

Informed Consent Statement

Not applicable.

Data Availability Statement

The data presented in this study are available on request from the corresponding author due to privacy reasons.

Acknowledgments

The author is thankful to the INTCAL13 team [47] and Global Volcanism Program team (volcano.si.edu, accessed 15 January 2022).

Conflicts of Interest

The author declares that there are no conflicts of interest.

References

  1. Wolf, R. Astron. Mitt. 1862–1893 All issues.
  2. Waldmeier, M. The Sunpot Activity in Year 1610–1960; Zurich Schultes Co.: Zurich, Swizerland, 1961. [Google Scholar]
  3. Hoyt, D.V.; Schatten, K.H. Group Sunspot Numbers: A New Solar Activity Reconstruction. Sol. Phys. 1998, 179, 189–219. [Google Scholar] [CrossRef]
  4. Dergachev, V.A. Manifestation of long term solar activity in climate archives over 10 millenia. In Proceedings of the International Astronomical Union, St. Petersburg, Russia, 14–16 June 2004; Volume 223, pp. 699–704. [Google Scholar]
  5. Nagovitsyn, Y.A. Solar and Geomagnetic Activity on a Long Time Scale: Reconstructions and Possibilities for Forecasts. Astron. Lett. 2006, 32, 344–352. [Google Scholar] [CrossRef]
  6. Schove, D.J. The Sunspot Cycle649 BC to AD 2000. J. Geophys. Res. 1955, 60, 127. [Google Scholar] [CrossRef]
  7. Schove, D.J. Sunspot Cycles; Hutchinson Ross: Stroudsburg, PA, USA, 1983. [Google Scholar]
  8. Forbush, S.E. Three Unusual Cosmic-Ray Increases Possibly Due to Charged Particles from the Sun. Phys. Rev. 1946, 70, 771–772. [Google Scholar] [CrossRef]
  9. Forbush, S.E. World-Wide Cosmic-Ray Variations. J. Geophys. Res. 1954, 59, 525–542. [Google Scholar] [CrossRef]
  10. Forbush, S.E. Cosmic-Ray Intensity Variations during Two Solar Cycles. J. Geophys. Res. 1958, 63, 651–669. [Google Scholar] [CrossRef]
  11. de Vries, H. Konikl. Ned. Acad. Wetenshop. V861. 1958; pp. 94–102.
  12. Suess, H. The radiocarbon record in tree rings of the last 8000 years. Radiocarbon 1980, 22, 200–209. [Google Scholar] [CrossRef]
  13. Stuiver, M.; Reimer, P.J. Extended 14C data base and revised CALIB 0 14C age calibration program. Radiocarbon 1993, 35, 215–230. [Google Scholar] [CrossRef]
  14. Stuiver, M.; Reimer, P.J.; Bard, E.; Beck, J.W.; Burr, G.S.; Hughen, K.A.; Kromer, B.; McCormac, G.; Van Der Plicht, J.; Spurk, M. INTCAL98 Radiocarbon Age Calibration, 24,000-cal BP. Radiocarbon 1998, 40, 1041–1083. [Google Scholar] [CrossRef]
  15. Damon, P.E.; Sonett, C.P. The Sun in Time; Sonett, C.P., Giampapa, M.S., Eds.; Univ. of Arizona Press: Tucson, AZ, USA, 1991. [Google Scholar]
  16. Stuiver, M.; Quay, P.D. Changes in Atmospheric Carbon-14 Attributed to a Variable Sun. Science 1980, 207, 26. [Google Scholar] [CrossRef]
  17. Beer, J.; Blinov, B.; Bonani, G.; Finkel, R.C.; Hofmann, H.; Lelmann, B.; Oeschger, H.; Sigg, A.; Schwander, J.; Staffelbath, T.; et al. Use of “‘Be in polar ice to trace the 1l-year cycle of solar activity. Nature 1990, 347, 164–166. [Google Scholar] [CrossRef]
  18. Bard, E.; Raisbeck, G.; Yiou, F.; Jouzel, J. Solar modulation of cosmogenic nuclide production over the last millennium: Comparison between 14C and 10Be records, Earth and Planet. Sci. Lett. 1997, 150, 453–462. [Google Scholar] [CrossRef]
  19. Usoskin, I.G. A History of Solar Activity over Millennia. Living Rev. Sol. Phys. 2017, 14, 3. [Google Scholar] [CrossRef]
  20. Sonett, C.P.; Finney, S.A.; Berger, A. The Spectrum of Radiocarbon. Philos. Trans. R. Soc. London. Ser. A Math. Phys. Sci. 1990, 330, 413–426. [Google Scholar]
  21. Traversi, R.; Usoskin, I.G.; Solanki, S.K.; Becagli, S.; Frezzotti, M.; Severi, M.; Stenni, B.; Udisti, R. Nitrate in Polar Ice: A New Tracer of Solar Variability. Solar Phys. 2012, 280, 237–254. [Google Scholar] [CrossRef]
  22. Shea, M.; Smarth, D. THE use of geophysical data in studies of the historical solar-terrestrial environment. Sol. Phys. 2004, 224, 483–493. [Google Scholar] [CrossRef]
  23. Gleissberg, W. A table of secular variations of the solar cycle. Terr. Magn. Atm. Electr. 1944, 49, 243–244. [Google Scholar] [CrossRef]
  24. Anderson, P.N. Notes on the sunspot cycle. J. Geophys. Res. 1954, 59, 455. [Google Scholar] [CrossRef]
  25. Bonov, A. Bulletin Soln. Dannie 1957, No 3. (In Russian)
  26. Komitov, B.P.; Kaftan, V.I. The Sunspot Activity in the Last Two Millenia on te Base of Indirect and Instrumental Indexes. Time Serieses Models and Their Extrapolations for the 21st Century. In Proceedings of the IAUS 223 Multi-Wavelength Investigations of the Solar Activity, Saint Petersburg, Russia, 14–19 June 2004; Stepanov, A.V., Benevolenskaya, E.E., Kosovichev, A.G., Eds.; Cambridge University Press: Cambridge, UK, 2004; pp. 115–116. [Google Scholar]
  27. Houtermans, J.C. Geophysical Interpretation of Bristlecone Pine Radiocarbon Measurements Using a Method of Fourier Analysis for Unequally Spaced Data. Ph.D. Dissertation, University of Bern, Bern, Switzerland, 1971. [Google Scholar]
  28. Komitov, B. The Schove’s series. Centural and Supercentural variations of the solar activity. Relationships between adjacent 11-year cycles. Bulg. Geoph. J. 1997, 23, 74–82. [Google Scholar]
  29. Komitov, B.; Bonev, B.; Penev, K.; Sello, S. The Solar Activity During the Holocene: Amplitude Variations of Quasy-Century and Quasy-Two-Century Solar Cycles. In Proceedings of the IAUS 223 Multi-Wavelength Investigations of the Solar Activity, Saint Petersburg, Russia, 14–19 June 2004; Stepanov, A.V., Benevolenskaya, E.E., Kosovichev, A.G., Eds.; Cambridge University Press: Cambridge, UK, 2004; pp. 705–706. [Google Scholar]
  30. Bonev, B.; Penev, K.; Sello, S. Long-term solar variability and the solar cycle in the XXI century. Astrophys. J. Lett. 2004, 605, 81–84. [Google Scholar] [CrossRef]
  31. Eddy, J.A. The Maunder Minimum. Science 1976, 192, 1189–1202. [Google Scholar] [CrossRef] [PubMed]
  32. Dergachev, V.A.; Chistyakov, V.F. 210 and 2400yr solar cycles and climate variations. Izvestiya FTI 1993, 112. (In Russian) [Google Scholar]
  33. Komitov, B.; Kaftan, V. Solar Activity Variations for the Last Millenia. Will the Next Long-Period Solar Minimum be Formed? Int. J. Geomagn. Aeron. 2003, 43, 553–561. [Google Scholar]
  34. Komitov, B.P.; Kaftan, V. The sunspot cycle no. 24 in relation to long term solar activity variation. J. Adv. Res. 2013, 4, 279–282. [Google Scholar] [CrossRef] [PubMed]
  35. Rubashev, B. Problemi Solnechnoi Aktivnosti, Problems about Solar Activity; Nauka: Moscow, Russia, 1964. (In Russian) [Google Scholar]
  36. Dermendjiev, V.; (Department of Astronomy to Bulgarian Academy of Sciences). Personal communication, 1982.
  37. Dergachev, V.A. Radiouglerodnii Chronometer/Radiocarbon Chronometer. Priroda 1994, 1, 1. (In Russian) [Google Scholar]
  38. Wang, Y.; Cheng, H.; Edwards, R.L.; He, Y.; Kong, X.; An, Z.; Wu, J.; Kelly, M.J.; Dykoski, C.A.; Li, X. The Holocene Asian monsoon: Links to solar changes and North Atlantic climate. Science 2005, 308, 854–857. [Google Scholar] [CrossRef] [PubMed]
  39. Hodell, D.A.; Brenner, M.; Curtis, J.H.; Guilderson, T. Solar Forcing of Drought Frequency in the Mayan Lowlands. Science 2004, 292, 136–1390. [Google Scholar]
  40. Abdussamatov, H.I. About the long term coordinated variations of the activity, radius, total irradiance of the Sun and the Earth’s climate. In Proceedings of the International Astronomical Union Symposium, Vienna, Austria, 12–16 July 2004. [Google Scholar]
  41. Raspopov, O.; Dergachev, V.; Kozyreva, O.; Kolström, T. Climate response to the deVries solar cycles: Evidence of Juniperusturkestanica tree rings in Central Asia. Mem. Della Soc. Astron. Ital. 2005, 76, 760. [Google Scholar]
  42. Imbree, J.; Imbree, K. The Secrets of Ice Epoch; Russian Edition; Mir: Moscow, Russia, 1988. [Google Scholar]
  43. Eddy, J.A. The Solar Output and Its Variation; White, O., Ed.; Colorado Associated University Press: Boulder, CO, USA, 1977. [Google Scholar]
  44. Denton, G.H.; Karlen, W. Holocene climatic changes, their pattern and possible cause. Quat. Res. 1973, 3, 155–205. [Google Scholar] [CrossRef]
  45. Komitov, B. Environment and Human History/Okolnata Sreda i Choveshkata Istoriya; Alfamarket, St.: Zagora, Bulgaria, 2010. (In Bulgarian) [Google Scholar]
  46. Komitov, B. The European beech annual tree ring widths time series, solar–climatic relationships and solar dynamo regime changes. Atmosphere 2021, 12, 829. [Google Scholar] [CrossRef]
  47. Reimer, P.J.; Bard, E.; Bayliss, A.; Beck, W.; Blackwell, P.; Ramsey, C.; Buck, C.; Cheng, H.; Edwards, L.; Friedrich, M.; et al. INTCAL13 and MARINE13 radiocarbon AGEt calibration curves 0–50,000 years CAL BP. Radiocarbon 2013, 55, 1869–1887. [Google Scholar] [CrossRef]
  48. Kovaltsov, G.A.; Mishev, A.; Usoskin, I.G. A new model of cosmogenic production of radiocarbon 14C in the atmosphere. Earth Planet. Sci. Lett. 2012, 337, 114. [Google Scholar] [CrossRef]
  49. Wittman, A.D.; Xu, Z.D. A catalogue of sunspot observations from 165 BC toAD 1684. Astron. Astrophys. Supl. Ser. 1987, 70, 83–94. [Google Scholar]
  50. Clette, F.; Lefèvre, L. The New Sunspot Number: Assembling all corrections. Sol. Phys. 2016, 291, 2629–2651. [Google Scholar]
  51. Zlatarski, V. Istoria na Balgarskata Darjava Prez Srednite Vekove/The Bulgarian State History during the Middle Ages, v.1–3, 2nd ed.; Nauka i izkustvo: Sofia, Bulgaria, 1972. (In Bulgarian) [Google Scholar]
  52. Theophanes Confessor, Chronicle/The Chronicle of Theophanus Confessor’ Byzantine and Near Eastern History AD 284-813; Translated by Mango Cyrril and Scott Rogger; Clarendon Press: Oxford, UK, 1997.
  53. History of Bulgaria; Bulgarian Academy of Sciences: Sofia, Bulgaria, 1962; Volume 1.
  54. Chelebi, E. Sejahatname/Book of Travel; Wikipedia: Istanbul, Türkiye, 1928. (In Turkish) [Google Scholar]
  55. Manchev, V. Memories, Notes, Letters/Spomeni, Dopiski, Pisma; Otechestven Front Edition: Sofia, Bulgaria, 1982. (In Bulgarian) [Google Scholar]
  56. Kanchev, M.P. Vidritsa; Balgarski Pisatel: Sofia, Bulgaria, 1983. (In Bulgarian) [Google Scholar]
  57. Stoyanov, Z. Memories of the Bulgarian Uprisings/Zahari Stoyanov, Zapiski po Balgarskite Vastaniya; Balgarski Pisatel: Sofia, Bulgaria, 1977. (In Bulgarian) [Google Scholar]
  58. Komitov, B. Possible Influence of Solar Activity on the Climate in Bulgaria/Vozmozhnom Vliyanii Solnechnoi Aktivnosti na klimat v Bolgarii. Bul. Soln. Dannie 1986, 1986, 73–78. (In Russian) [Google Scholar]
  59. Torrence, C.; Compo, G.P. A Practical Guide to Wavelet Analysis. Bul. Am. Meteor. Soc. 1998, 79, 61–78. [Google Scholar] [CrossRef]
  60. Kopecky, Y.; (Astronomical Institute of CSSR Academy of Science). Draft Preprint (Personal Communication), 1984.
  61. Bond, G.; Showers, W.; Maziet, C.; Lotti, R.; Almasi, P.; de Mendocal, P.; Piore, P.; Cullen, H.; Hajdas, I.; Bonani, G. A pervasive Millenial Scale Cycle in North Atlantic Holocene and Glacial Climates. Science 1997, 278, 1357–1365. [Google Scholar] [CrossRef]
  62. Vitinskii, Y.; Ohl, A.; Sazonov, B. Solnce i Atmosfera Zemli/The Sun and Earth Atmosphere; Gidrometeoizda: Leningrad, Russia, 1976. (In Russian) [Google Scholar]
  63. Reimer, P.J.; Ballie, M.G.L.; Bard, E.; Bayliss, A.; Beck, W.; Bertrand, C.J.H.; Blackwell, P.; Buck, C.E.; Burr, G.E.; Cutler, K.E.; et al. Intcal04 Terrestrial Radiocarbon Age Calibration, 0–26 Cal Kyr BP. Radiocarbon 2004, 46, 1029–1058. [Google Scholar] [CrossRef]
  64. Milankovitch, M. Mathematische Klimalehre und Astronomische Theorie der Klimaschwankungen, Handbuch der Klimalogie Band 1; Teil, A., Ed.; Borntrager: Berlin, Germany, 1930. [Google Scholar]
  65. Kertez, R. Mezolithic Hunter-Gatherers in the Nort-Western Part of the Great Hungarian Plain. Praehistoria 2002, 3, 281–304. [Google Scholar]
  66. Usoskin, I.G.; Kromer, B.; Ludlow, E.; Beer, J.; Friedrich, M.; Kovaltsov, G.A.; Solanki, S.K.; Wacker, L. The AD775 cosmic event revisited: The Sun is to blame. Astron. Astrophys. 2013, 552, L3. [Google Scholar] [CrossRef]
  67. Gnevishev, M.; Ohl, A. 22 yr cycle in solar activity. Astron. J. 1948, 38, 18. (In Russian) [Google Scholar]
  68. Kopecky, M. Cycle de 22 ans de l’activit’e solaire. B. Astron. Inst. Czechoslov. 1950, 2, 14. [Google Scholar]
  69. Komitov, B.; Duchlev, P.; Bjandov, G.; Kirilova, D. Trees annual rings and “Sun-Climate” connection. Bulg. Astron. J. 2013, 19, 72–93. [Google Scholar]
  70. Komitov, B.; Kaftan, V. Annual Beech (Fagus sylvatica) Growth Rings and Solar-Related Climate Variations in the Central and Western Balkans in the 18th–21st Centuries. Geomagn. Aeron. 2019, 59, 926–934. [Google Scholar] [CrossRef]
  71. Usoskin, I.G.; Alanko-Huotari, K.; Kovaltsov, G.A.; Mursula, K. Heliospheric modulation of cosmic rays: Monthly reconstruction for 1951–2004. J. Geophys. Res. 2005, 110, A12108. [Google Scholar] [CrossRef]
  72. Kovaltsov, G.A.; Usoskin, I.G. A new 3D numerical model of cosmogenic nuclide 10Be production in the atmosphere. Earth Planet. Sci. Lett. 2010, 291, 182–188. [Google Scholar] [CrossRef]
  73. Yang, S.; Odah, H.; Shaw, J. Variations in the geomagnetic dipole moment over the last 12000 years. Geophys. J. Int. 2000, 140, 158–162. [Google Scholar] [CrossRef]
  74. Hongre, L.; Hulot, G.; Khokhlov, A. An analysis of the geomagnetic field over the past 2000 years. Phys. Earth Planet. Inter. 1998, 106, 311–335. [Google Scholar] [CrossRef]
  75. Korte, M.; Constable, C.G. The geomagnetic dipole moment over the last 7000 years—New results from a global model. Earth Planet. Sci. Lett. 2005, 236, 348–358. [Google Scholar] [CrossRef]
  76. Yiou, F.; Raisbeck, G.M.; Baumgartner, S.; Beer, J.; Hammer, C.; Johnsen, S.; Jouzel, J.; Kubik, P.W.; Lestringuez, J.; Stivenard, M.; et al. Yiou Beryllium 10 in the Greenland Ice Core Project ice core at Summit, Greenland. J. Geophys. Res. 1997, 102, 26783–26794. [Google Scholar] [CrossRef]
  77. Komitov, B. The Solar Activity Forcing over Climate in Past and Modern Epoch: Relations to Bulgaria (Vliyanie na Slanchevata Activnost Varhu Klimata v Minaloto i Savremennostta. Sledstviya za Bulgaria/in Bulgarian; Alfamarket: Stara Zagora, Bulgaria, 2008. [Google Scholar]
  78. Choudhuri, A. An Elementary Introduction to Solar Dynamo Theory. In AIP Conference Proceedings; American Institute of Physics: College Park, MA, USA, 2007; Available online: http://www.physics.iisc.ernet.in/~arnab/lectures.pdf (accessed on 1 December 2022).
  79. Kitchatinov, L.L.; Olemskoy, S.V. Model of intermittency of grand minimums and maximums in the solar dynamo. Geomagn. Aeron. 2010, 50, 927–932. [Google Scholar] [CrossRef]
  80. Charvátová, I.; Hejda, P. Responses of the basic cycle of 7 years and 2402 years in solar-terrestrial phenomena during Holocene. Pattern Recogn. Phys. 2014, 2014, 21–26. [Google Scholar] [CrossRef]
  81. Scafetta, N. Empirical evidence for a celestial origin of the climate oscillations and its implications. J. Atmos. Sol. Terr. Phys. 2010, 72, 951–970. [Google Scholar] [CrossRef]
  82. Vaquero, J.; Galego, M.; Garcia, J. A 250-year cycle in naked-eye observations of sunspots. J. Geophys. Res. Lett. 1997, 29, 58. [Google Scholar] [CrossRef]
  83. Hoyt, D.V.; Schatten, K.H. Group Sunspots Number: A New Solar Activity Reconstruction. Sol. Phys. 1998, 181, 491–512. [Google Scholar] [CrossRef]
  84. Vaquero, J.M.; Svalgaard, L.; Carrasco, V.M.S.; Clette, F.; Lefèvre, L.; Gallego, M.C.; Arlt, R.; Aparicio, A.J.P.; Richard, J.-G.; Howe, R. A Revised Collection of Sunspot Group Numbers. arXiv 2016, arXiv:1609.04882. [Google Scholar]
  85. Usoskin, I.G.; Arlt, R.; Asvestari, E.; Hawkins, E.; Käpylä, M.; Kovaltsov, G.; Krivova, N.; Lockwood, M.; Mursula, K.; O’Reilly, J.; et al. The Maunder minimum (1645–1715) was indeed a grand minimum: A reassessment of multiple datasets. Astron. Astrophys. 2015, 581, A95. [Google Scholar] [CrossRef]
  86. Cambell, I.D.; Campbell, C.; Apps, M.J.; Rutter, N.W.; Bush Andrew, B. Late Holocene similar to 1500yr climatic periodicities and their implications. Geology 1998, 26, 471–473. [Google Scholar]
  87. Ting, W.; Donna, S.; Karen, J.W. Seasonal climate change across the Roman Warm Period/Vandal Minimum transition using isotope sclerochronology in archaeological shells and otoliths, southwest Florida, USA. Quat. Int. 2013, 308–309, 230–241. [Google Scholar]
  88. Komitov, B.; Bonev, B. Amplitude Variations of the 11-year Solat Cycle and the Current Maximum 23. Astrophys. J. Lett. 2001, 554, L119. [Google Scholar] [CrossRef]
  89. Komitov, B. Predictions for SC25, 26 and SC27 Magnitudes in Relation to the Long-Term Solar Activity Changes. In Proceedings of the Thirteenth Workshop “Solar Influences on the Magnetosphere, Ionosphere and Atmosphere”, Primorsko, Bulgaria, 13–17 September 2021; pp. 40–44. [Google Scholar]
  90. Komitov, B.; Duchlev, P.; Penev, K. Evidence for general downward trend of the SXR solar flare activity in the last decades. Bulg. Astron. J. 2015, 23, 45–74. [Google Scholar]
  91. Hady, A. Analytical study of solar activity sudden increases and Halloeen storms of 2003. J. Atm. Sol-Terr. Phys. 2007, 9, 00076, (spec. issue “The Time Variyng Sun”)/preliminary manuscript2007. [Google Scholar]
  92. Gvishiani, A.D.; Starostenko, V.I.; Sumaruk, Y.U.P.; Soloviev, A.A.; Legostaeva, O.V. A decrease in solar and geomagnetic activity from cycle 19 to cycle 24. Geomagn. Aeron. Engl. Transl. 2015, 55, 299–306. [Google Scholar] [CrossRef]
  93. Zharkova, V.V.; Sheperd, S.J.; Popova, E.; Zharkov, S.I. Heartbeat of the Sun from Principal Component Analysis and prediction of solar activity on a millennium timescale. Nat. Sci. Rep. 2015, 5, 15689. [Google Scholar]
  94. Danjon, A.A. Relation Entre l’Eclairement de la Lune Eclipsee et l’Activite Solaire. L’Astronomie 1921, 35, 261–265. [Google Scholar]
  95. Svensmark, H.; Friis-Christensen, E. Variation of cosmic ray flux and global cloud coverage—A missing link in solar-climate relationships. J. Atmos. Sol. Terr. Phys. 1997, 59, 1225–1232. [Google Scholar] [CrossRef]
  96. Svensmark, H.; Enghoff, M.B.; Pedersen, E.O. Response of Cloud Condensation Nuclei (>50 nm) to changes in ion-nucleation. arXiv 2012, arXiv:120215.5156v. [Google Scholar]
  97. Svensmark, H.; Svensmark, J.; Enghoff, M.D.; Shaviv, N.J. Atmospheric ionization and cloud radiative forcing. Sci. Rep. 2021, 11, 19668. [Google Scholar] [CrossRef] [PubMed]
  98. Yu, F. Altitude variations of cosmic ray induced production of aerosols: Implications for global cloudiness and climate. Geophys. Res. Lett. 2002, 107, A7. [Google Scholar] [CrossRef]
  99. Komitov, B.P.; Kaftan, V.I. “Danjon Effect”, Solar Activity, and Volcanism. Geomagn. Aeron. 2022, 62, 1117–1122. [Google Scholar] [CrossRef]
  100. Komitov, B.; Kaftan, V. “Danjon effect”, solar–triggered volcanic activity and relation to climate change. Russ. J. Earth Sci. 2022, 22, 1117–1122. [Google Scholar]
  101. Komitov, B.P.; Kaftan, V.I. The Lower Ionosphere and Tectonic Processes on Earth. Geomagn. Aeron. 2023, 63, 176–184. [Google Scholar]
  102. Jose, P.D. Sun’s motion and sunspots. Astron. J. 1965, 70, 193–200. [Google Scholar] [CrossRef]
  103. Smith, C.; Gaudin, D.; Van Eaton, A.; Behnke, S.A.; Reader, S.; Thomas, R.J.; Cimarelli, C. Impulsive volcanic plumes generate volcanic lightning and vent discharges: A statistical analysis of Sakurajima volcano in 2015. Geophys. Res. Lett. 2020, 48, e2020GL092323. [Google Scholar]
  104. Kuo, C.L.; Lee, L.C.; Huba, J.D. An improved coupling model for the lithosphere–atmosphere–ionosphere system. J. Geophys. Res. Space Phys. 2014, 119, 3189–3205. [Google Scholar] [CrossRef]
  105. Marchitelli, V.; Harabaglia, V.P.; Troise, C.; De Natale, G. On the correlation between solar activity and large earthquakes worldwide. Nat. Sci. Rep. 2020, 10, 11495. [Google Scholar]
  106. Bauer, S. Physics of Planetary Ionospheres; Springer: Berlin/Heidelberg, Germany, 1973; ISBN 978-3-642-65555-5. [Google Scholar]
  107. Kopp, G.; Krivova, N.; Wu, C.J.; Lean, J. The Impact of the Revised Sunspot Record on Solar Irradiance Reconstructions. Sol. Phys. 2016, 291, 9–10. [Google Scholar]
  108. Dasi-Espuig, M.; Jiang, M.; Krivova, N.; Solanki, S.K.; Unruh, Y.C.; Yeo, K.L. Reconstruction of spectral solar irradiance since1700 from simulated magnetograms. Astron. Astrophys. 2016, 590, A63. [Google Scholar] [CrossRef]
  109. Schuurmans, C.J.; Oort, A.H. A Statistical Study of Pressure Changes in the Troposphere and Lower Stratosphere after Strong Solar Flares. Pure Appl. Geophys. 1969, 75, 233–246. [Google Scholar] [CrossRef]
  110. Luterbacher, J.; Dietrich, D.; Xoplaki, E.; Grosjean, M.; Wanner, H. European seasonal and annual temperature variability, trends and extremes since 1500. Science 2004, 303, 1499–1503. [Google Scholar] [CrossRef] [PubMed]
  111. Mitchell, J.M., Jr.; Stockton, C.W.; Meko, D.M. Evidence of a 22-year rhythm of drought in the western United related to the Hale solar cycle since the 17th century. In Solar-Terrestrial Influences on Weather and Climate; McCormac, B.M., Seliga, T.A., Eds.; Springer: Berlin/Heidelberg, Germany, 1979; pp. 125–143. [Google Scholar]
  112. Komitov, B. The “Sun–climate” relationship. II. The “cosmogenic” beryllium and the middle latitude aurora. Bulg. Astron. J. 2009, 12, 75–90. [Google Scholar]
  113. Krivsky, L.; Pejml, K. Solar activity, aurorae and climate in Central Europe in the last 1000 years. Bullet. Astron. Inst. Chechosl. Acad. Sci. 1988, 75. [Google Scholar]
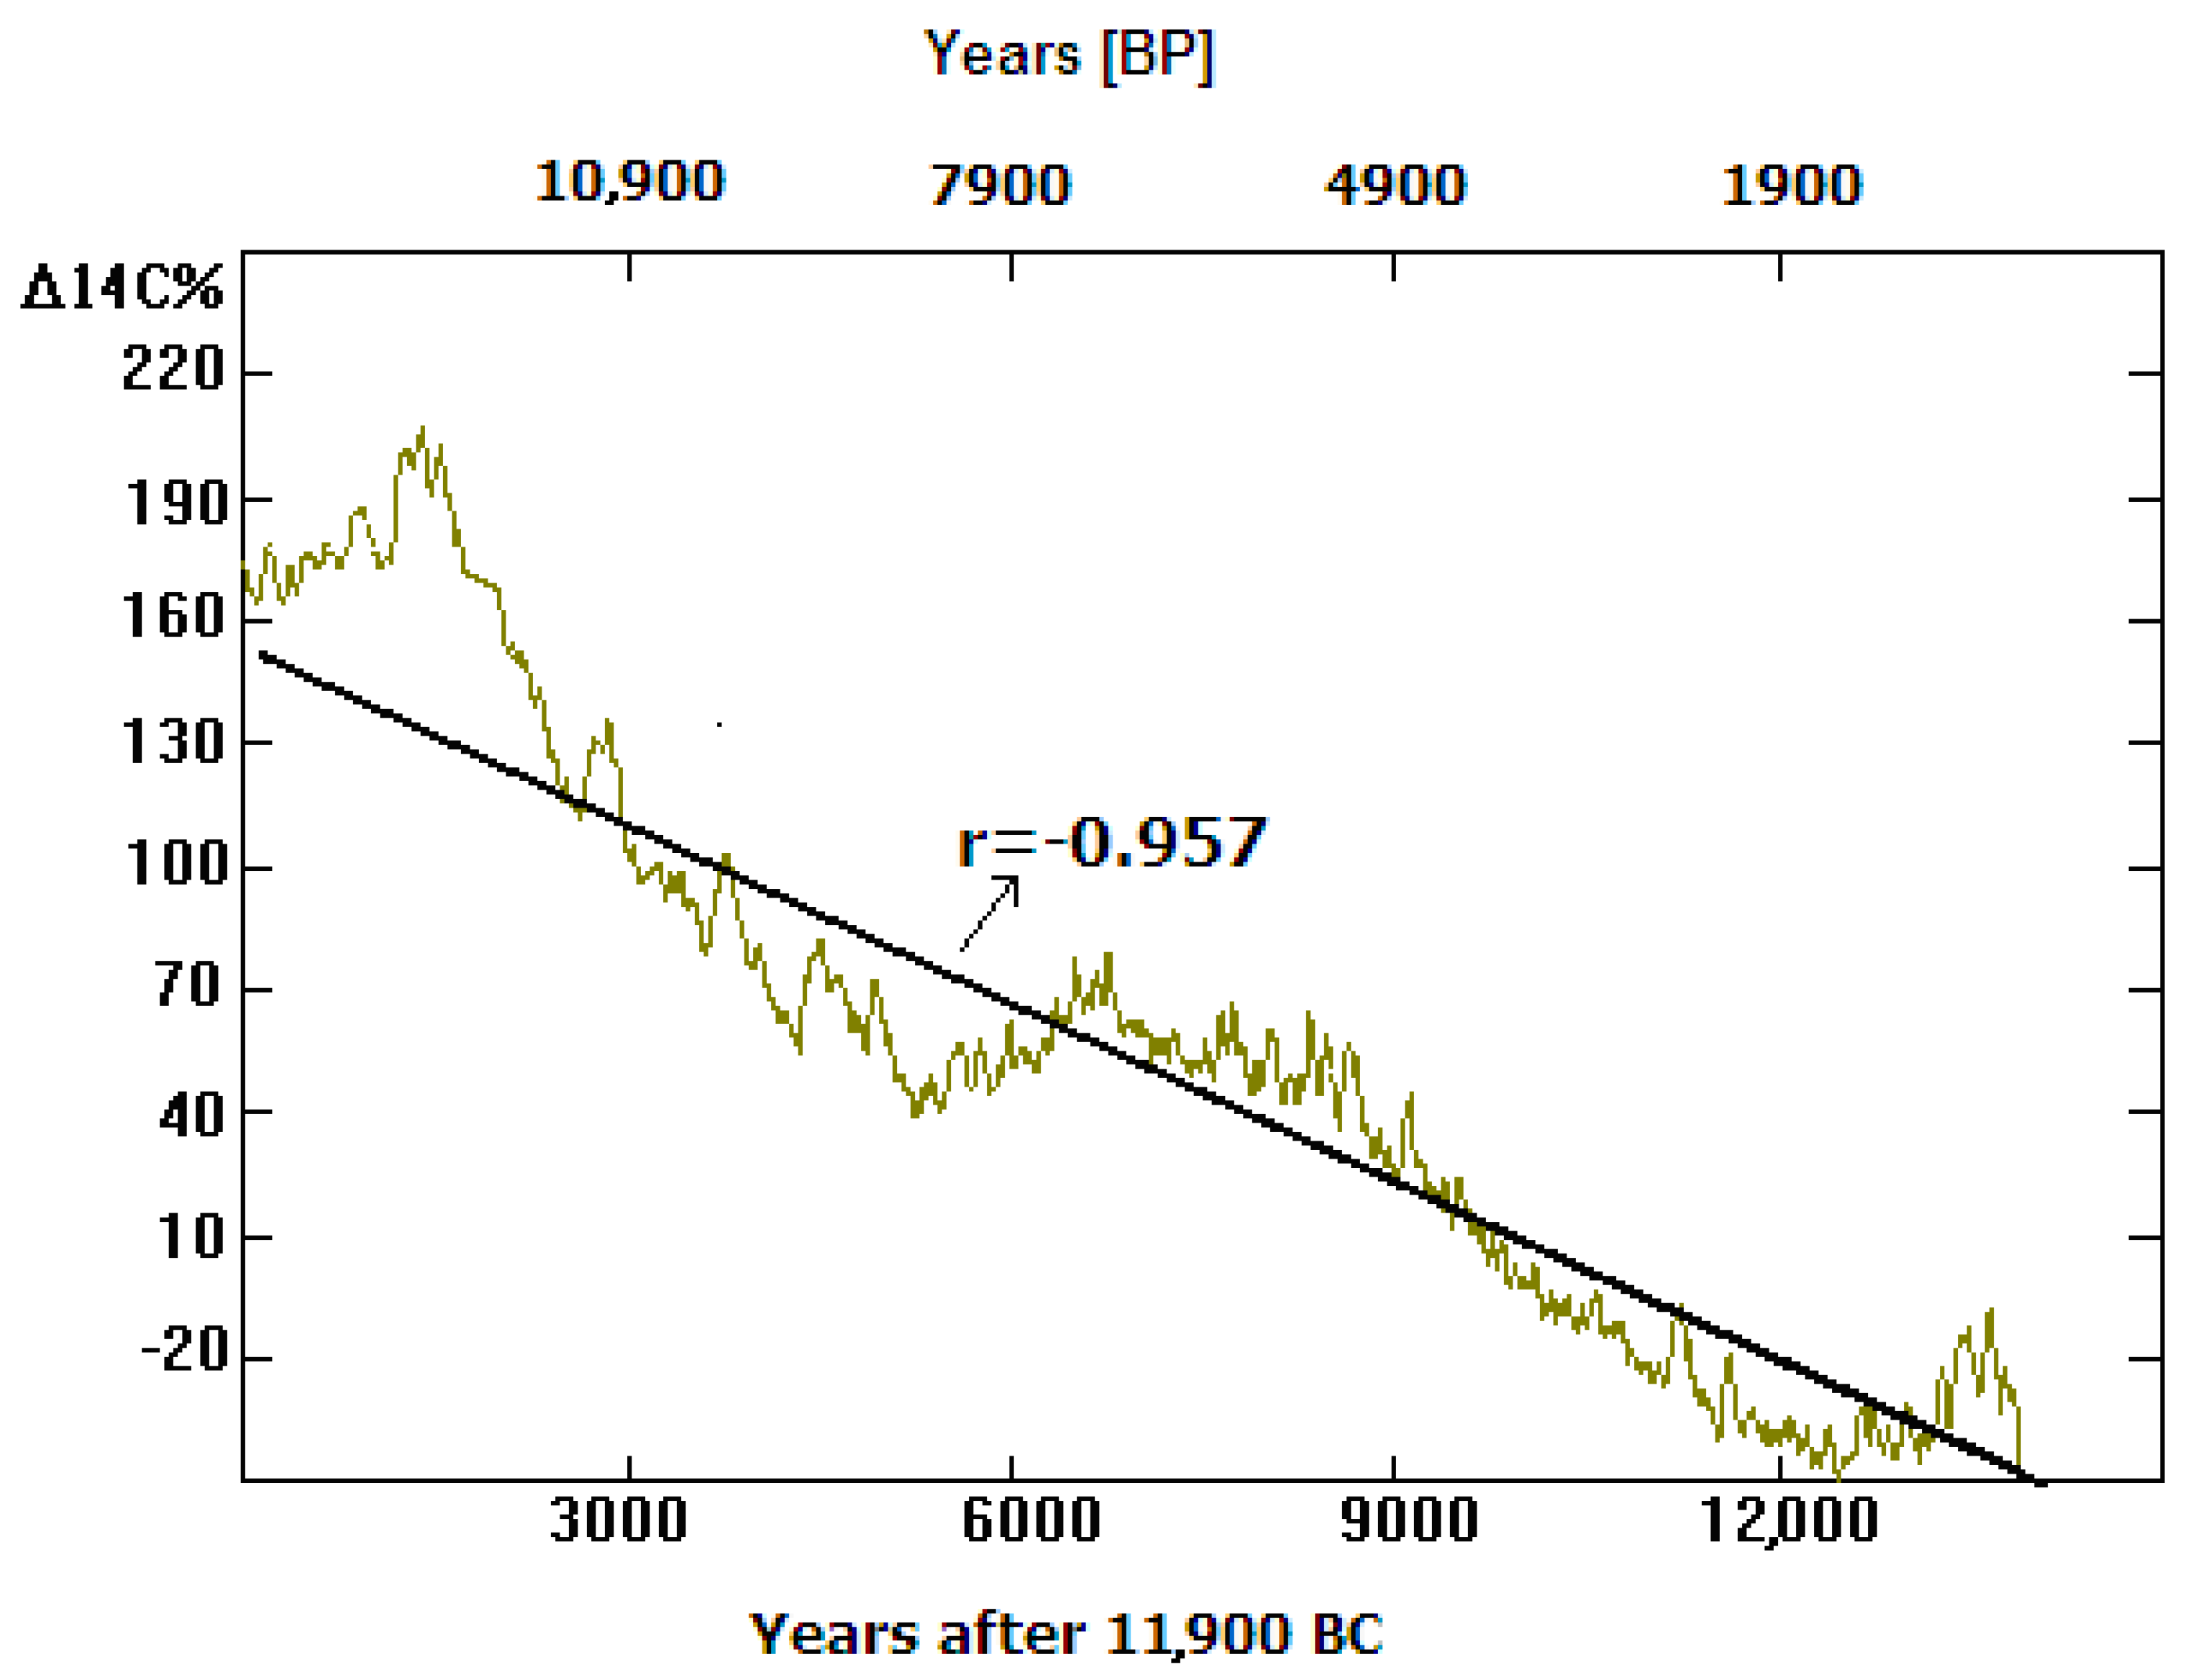
Figure 1. The primary INTCAL13 (last 13,900 years) radiocarbon data series and the general linear downward trend.
Atmosphere 15 00612 g001
Figure 2. (a) The primary residual series Δ14C%(1) after removing the general linear trend; (b) the secondary residual series Δ14C%(2) after the demodulation of the 6370 yr cycle from the primary residual Δ14C%(1) series.
Atmosphere 15 00612 g002
Figure 3. The third (final) residual series Δ14C%(3) after demodulation of the 13,500 yr “hyper-cycle” from the secondary residual Δ14C%(2) series. The 2400 yr cycle is a dominant oscillation in Δ14C%(3) time series (see also Figure 4). By letters “E”, “H” and “M” the last three Hallstadt solar cycles minima (14C maxima) (Egyptian, Homer and Maunder) are signed.
Atmosphere 15 00612 g003
Figure 4. The T-R spectrum of the third-generation residual Δ14C%(3) series.
Atmosphere 15 00612 g004
Figure 5. The integral power index S200 of the Suess cycle (INTCAL13, residual 14ΔC%(3) series).
Atmosphere 15 00612 g005
Figure 6. The T-R spectrum of the S200 series.
Atmosphere 15 00612 g006
Figure 7. The R/SR scalogram of the INTCAL13 residual 14ΔC%(3) series (2 ≤ T ≤ 6000 yr).
Atmosphere 15 00612 g007
Figure 8. The R/SR scalogram of the INTCAL13 residual 14C(3) series (2 ≤ T ≤ 300 yr).
Atmosphere 15 00612 g008
Figure 10. The extreme climatic phenomena in Bulgarian and adjacent territories (296–1899 AD).
Atmosphere 15 00612 g010
Figure 11. The annual number Ng of giant naked eye visible sunspots (168 BC–1684 AD). By “Hr”, “Hr”, “My” “O”, “W”, “W” and“M” the solar 200yr cycle minima (“Hearclean”, “Mayan”, Oort, Wolf, Spoerer and Maunder respectively) are signed.
Atmosphere 15 00612 g011
Figure 12. Principal scheme of the “Sun–ionosphere/GCR–volcanism–aerosols–clouds” relationship. In the bottom right corner, an indirect solar/GCR forcing over atmosphere transparence and total lunar eclipse (TLE) brightness as a result (“Danjon effect” [99,100]) is shown.
Atmosphere 15 00612 g012
Table 1. Extreme climatic phenomena in Bulgarian and adjacent territories since 296 AD.
YearType of EventSHCYear of Sunspot Cycle
Minimum (m)
Year of Sunspot Cycle
Maximum (M)
L [yr]Δm [yr]ΔM [yr]Wmax
299BSF129630111+3−2145
400BSF1039139613+9+485
558DF2455155611+7+285
602DF29602607110−560
678CW3567167313+7+5120
679CW3567167313+8+6120
703BSF3769369914+10+460
717VCW3870771412+10+3120
755BSF4274975412+5+185
765BSF437617639+4+2145
774VTS4477077712+4−3100
814WW4780480611+10+8120
863DHS + EQ5285686112+6+2100
928BSF5892192513+7+3145
934BSF59934937110−3100
1028BSF + C W6710221028126085
1035DF6810341041130−760
1037WW + E Q + EP + CRS681034104113+3−460
1048DF + C W691047105413+1−650
1242BSF861233123911+9+385
1268DF881256126113+12+785
1388DHS1001386139110+2−385
1391DHS1001386139110+5085
1443CW10514431450110−770
1620BSF12116201625130−5115
1668CRS1251666167313+2−535
1669BSF1251666167313+3−435
1755BSF13317551761110−686.5
1774BSF134176617699+8+5115.8
1810DF13818101816130−648.7
1823BSF13918231829100−671.7
1850BSF1411843184813+7+2131.6
1876DF1431867187012+9+6140.5
1878CW1431867187012+11+8140.5
1902DF1461901190712+1−564.2
1904BSF1461901190712+3−364.2
1905DF1461901190712+4−264.2
1929DF + BS F1481923192810+6+178.1
1932CW1481923192810+10+478.1
1942DF1491933193711+9+5119.2
1949DF1501944194710+5+2151.8
1954DF + BS F15119541957100−3201.3
1963DF + BS F1511954195710+9+6201.3
1985DF1531976197910+9+6184.5
2002DF1551996200012+6+2120.8
Disclaimer/Publisher’s Note: The statements, opinions and data contained in all publications are solely those of the individual author(s) and contributor(s) and not of MDPI and/or the editor(s). MDPI and/or the editor(s) disclaim responsibility for any injury to people or property resulting from any ideas, methods, instructions or products referred to in the content.