Article

Spatio-Temporal Changes of Vegetation Net Primary Productivity and Its Driving Factors on the Tibetan Plateau from 1979 to 2018

1
College of Water Resources & Civil Engineering, Qinghai University, Xining 810016, China
2
State Key Laboratory of Plateau Ecology and Agriculture, Qinghai University, Xining 810016, China
*
Author to whom correspondence should be addressed.
Atmosphere 2024, 15(5), 579; https://doi.org/10.3390/atmos15050579
Submission received: 27 March 2024 / Revised: 30 April 2024 / Accepted: 3 May 2024 / Published: 9 May 2024

Abstract

:
The Net Primary Productivity (NPP) of the Tibetan Plateau (TP) has undergone significant changes since the 1980s. The investigation of the spatiotemporal changes of NPP and its driving factors is of significant importance. Here, we analyze the spatial and temporal trends of Net Primary Production (NPP) and the effects of meteorological factors on the NPP change on the Tibetan Plateau (TP) using version 5.0 of the Community Land Model. The results showed that the average NPP was 256 (g C·m2·yr−1) over the past 40 years, with a continuously increasing trend of 2.38 (g C·m2·yr−1). Precipitation was the main factor affecting NPP changes, temperature had no significant effect on NPP changes, while radiation showed a negative trend. Changes in precipitation, temperature and radiation account for approximately 91%, 5.3%, and 3.8% of NPP variation, respectively. Based on grass coverage, we categorized alpine grasslands into three types: high, medium, and low coverage. Our findings indicate the NPP change of the high-coverage grasslands was mainly affected by precipitation, and then the temperature and radiation. Comparatively, the precipitation change is the driving factor of the increased NPP of low-coverage grasslands, but the temperature increase is the negative factor. Our studies have implications for assessing and predicting vegetation responses to future climate change.

1. Introduction

The Tibetan Plateau (TP) is the highest plateau in the world with an average altitude of about 4000 m and is known as the “Roof of the World” [1]. In recent decades, temperature increased significantly on the TP, and TP warming is occurring twice as fast as global warming [2]. The unique high and cold ecosystem of the TP has a simple ecological structure and is very vulnerable to climate change [3]. Net Primary Productivity (NPP) of vegetation is a key ecological indicator for detecting C fluxes, and it refers to the amount of organic carbon produced by plant communities in an ecosystem per unit of time and area [4]. NPP is the remaining portion of the total amount of organic matter fixed by photosynthesis minus the amount consumed by its own respiration. It is an important indicator of ecosystem health and ecological balance [5], as well as global carbon balance [6].
Many models have been conducted to calculate and analyze the change of NPP and its influencing factors. The field measurement is the direct method to investigate the NPP. Given the harsh environmental conditions of the TP, field measurement data have limited spatial coverage; hence it is often used as the verification data. Statistical models mainly include traditional climate correlation models and remote sensing data-driven models [7]. Statistical models were simple in structure [8,9,10], but these models lack the theoretical foundation of plant ecophysiology as well as the ability to illustrate how the meteorological environment interacts with the ecosystem [11]. The potential of the machine learning method has been widely acknowledged in the field of ecological science in recent years [12,13]. The machine learning approaches (e.g., Random Forest, RF; Support Vector Machines, SVM; k-Nearest Neighbor, KNN) have been successfully used to derive carbon fluxes using the fluxnet measurements and satellite-derived variables [14,15,16,17]. In addition, machine learning algorithms such as gradient boosting (GB) [18], extreme gradient boosting (XGB) [19], and light gradient boosting machine (LGBM) [20], have achieved good performance in carbon flux retrieval. These algorithms are under the gradient boosting framework and can provide parallel tree boosting to derive carbon fluxes in a fast and accurate way.
The process-based models combined with the physiological characteristics of plant growth and development were able to simulate the functional processes within the ecosystem and construct the interaction process between the plant interior and external meteorological conditions. Process-based models are represented by the CLM model [21,22], Biome-BGC model [23], and TEM model [24], etc. The Community Land Model (CLM) is the most developed and widely used land surface model in the world and has been called the largest terrestrial biosphere model [25,26], also suitable for the Tibetan Plateau. Lin et al. [27] used the CLM4.5 model to simulate the spatial and temporal variations of water use efficiency (WUE) in the Tibetan Plateau, and its response to environmental factors found that WUE showed an increasing trend and its main influencing factors were the CO2 concentration and temperature; Hao et al. [28] used the CLM model assessed NPP and a variety of water-related ecosystem services in the Qinghai Plateau region from 2000 to 2018, revealing that vegetation dominated the relative locations of NPP thresholds.
Precipitation, temperature, nitrogen deposition, carbon dioxide concentration, and many other factors can affect the NPP of vegetation [29]. Tu et al. [30] used correlation analysis combined with the Thornthwaite Memorial model to analyze the changes in the spatial distribution pattern of NPP in China from 2000 to 2017. They suggested that NPP is mainly affected by temperature in the eastern Tibetan Plateau. Zha et al. [31] used the CASA model and biased correlation analysis to analyze the NPP change and the influence factors on the Tibetan Plateau. They concluded that the controlling factor of NPP change shifted from the temperature during 2000–2009 to the precipitation during 2010–2019. Zheng et al. [32] used the CASA model and correlation analysis to analyze the NPP change on the Tibetan Plateau from 2001 to 2015, and suggested that the effect of the solar radiation was greater than the temperature and precipitation to the NPP change of the TP. Qiu et al. [33] used CESM 1.0.4 to explore the impact of the different concentrations of CO2 and climate change on the vegetation on the TP. They suggested that the increasing CO2 concentration increased the values of GPP, NPP and other parameters, but climate change had a negative impact on the vegetation structure and productivity in the TP.
Previous research analyzed the response of NPP to the meteorological factor, but it can be seen that obvious contradictions and controversies existed in these researches. As one of the most powerful models with the strongest simulation capability for land surface, CLM is well suited for the simulation of NPP. In particular, the latest generation of the CLM 5.0 model improves the accuracy of soil hydrothermal simulation in the permafrost zone, which makes it more suitable for the Tibetan Plateau. The objective of this study is twofold: (1) to investigate the spatial and temporal trends of NPP and quantify the effects of meteorological factors on the NPP in the Tibetan Plateau and (2) to indicate differences in NPP changes and driving factors over the grasslands with different vegetation cover. This paper is organized as follows. The methods and data are introduced in Section 2. The main results are presented in Section 3. Discussion and conclusions are presented in Section 4 and Section 5.

2. Materials and Methods

2.1. Study Area

The Tibetan Plateau (73–105° E, 25–40° N) is located in the western region of China, covering a total area of approximately 2.5 × 10⁶ km2, with an average elevation of 4500 m (Figure 1). Grassland covers over 60% of the plateau, while forests and trees only occur in small areas in the south TP. The Tibetan Plateau is in the arid and semi-arid climate zone, with an average annual temperature below 0 °C and an average annual precipitation of approximately 500 mm. The regional ecology is fragile, with obvious geographical differences and distinct wet and dry seasons.

2.2. Model Description and Data Sources

The Community Land Model (CLM), developed by the National Center for Atmospheric Research (NCAR) in the United States, is capable of simulating biogeophysical and biogeochemical processes, including radiative transfer, the vegetation–soil–hydrological cycle, the soil carbon–nitrogen cycle, and vegetation photosynthesis [34]. The Community Earth System Model (CESM) has been coupled with CLM models since version 4.0 and runs under the framework of CESM [35]. CLM uses a multi-layer nested subgrid hierarchy to represent the spatial heterogeneity of the land surface. Each grid cell consists of three sub-grids: land units, snow/soil columns, and plant functional types (PFTs). The number of land units can vary within each grid cell, with each land unit potentially containing a different number of snow/soil columns, and each column having multiple PFTs.
CLM 5.0 has made significant improvements compared to CLM 4.5 in various aspects including soil and plant hydrology, snow density, river modeling, crop modeling, carbon and nitrogen cycling, and coupling processes. In terms of hydrology, CLM 5.0 now features increased soil vertical resolution (20 soil layers + 5 bedrock layers) and spatially variable soil depth (ranging from 0.4 to 8.5 m), as well as the removal of unconfined aquifer and no flux lower boundary condition. In terms of vegetation dynamics, CLM 5.0 has enhanced the plant hydraulic stress model for water transport through vegetation by replacing empirical soil moisture stress formulation and introducing hydraulic redistribution. Furthermore, in terms of carbon and nitrogen cycling processes, CLM 5.0 replaces dynamic NPP-based allocation schemes with flexible plant C:N ratios to eliminate instantaneous down-regulation of photosynthesis based on mineral N availability [36]. Most importantly, CLM 5.0 improves the permafrost physical processes compared to other process-based models [37]. Thus, it can be seen that CLM 5.0 includes carbon feedback and improves the accuracy of soil water-heating process simulation, especially in the permafrost zone. Therefore, CLM 5.0 is widely used for simulating carbon, water, and energy exchange between the global and regional scale land and atmosphere [38,39,40,41], and it is well suited for simulating carbon, water and other variables in the Tibetan Plateau region [42,43].
In CLM 5.0, the NPP is simulated with the biogeochemistry (BGC) model. The NPP can be calculated by subtracting plant respiration from gross primary productivity (GPP). The detailed process and formula are explained in Lawrence et al. [36]. The NPPcoh is the cohort-specific Net Primary Productivity, which is calculated as follows:
  N P P c o h = G P P c o h R p l a n t , c o h
GPP is calculated as follows:
G P P coh = 12 × 1 0 9 z = 1 n z ( c o n ) g p p C l , f t , z A c r o w n , c o h e l a i C l , f t , z
where the GPPcoh is cohort-specific gross primary productivity, gppCl,ft,z is the rate of gross photosynthesis, Acrown,coh is the Crown area, and elaiCl,ft,z is the sum of exposed leaf area index. Plant respiration is calculated as follows:
R p l a n t = R g , c o h + R m , c o h
where the Rplant is the plant respiration, and Rg,coh and Rm,coh is the growth and maintenance respiration.
The simulation performance of land surface models can be influenced by several slow-changing parameters. The spin-up process is typically used to provide initial conditions for the model [44]. Spin-up makes the continuous adjustment of various model parameters, such as soil temperature and humidity, latent heat, and sensible heat, until the model reaches an equilibrium state [45]. This study uses the China Meteorological Forcing Dataset (CMFD) to complete the spin-up process for 400 years in order to ensure equilibrium.
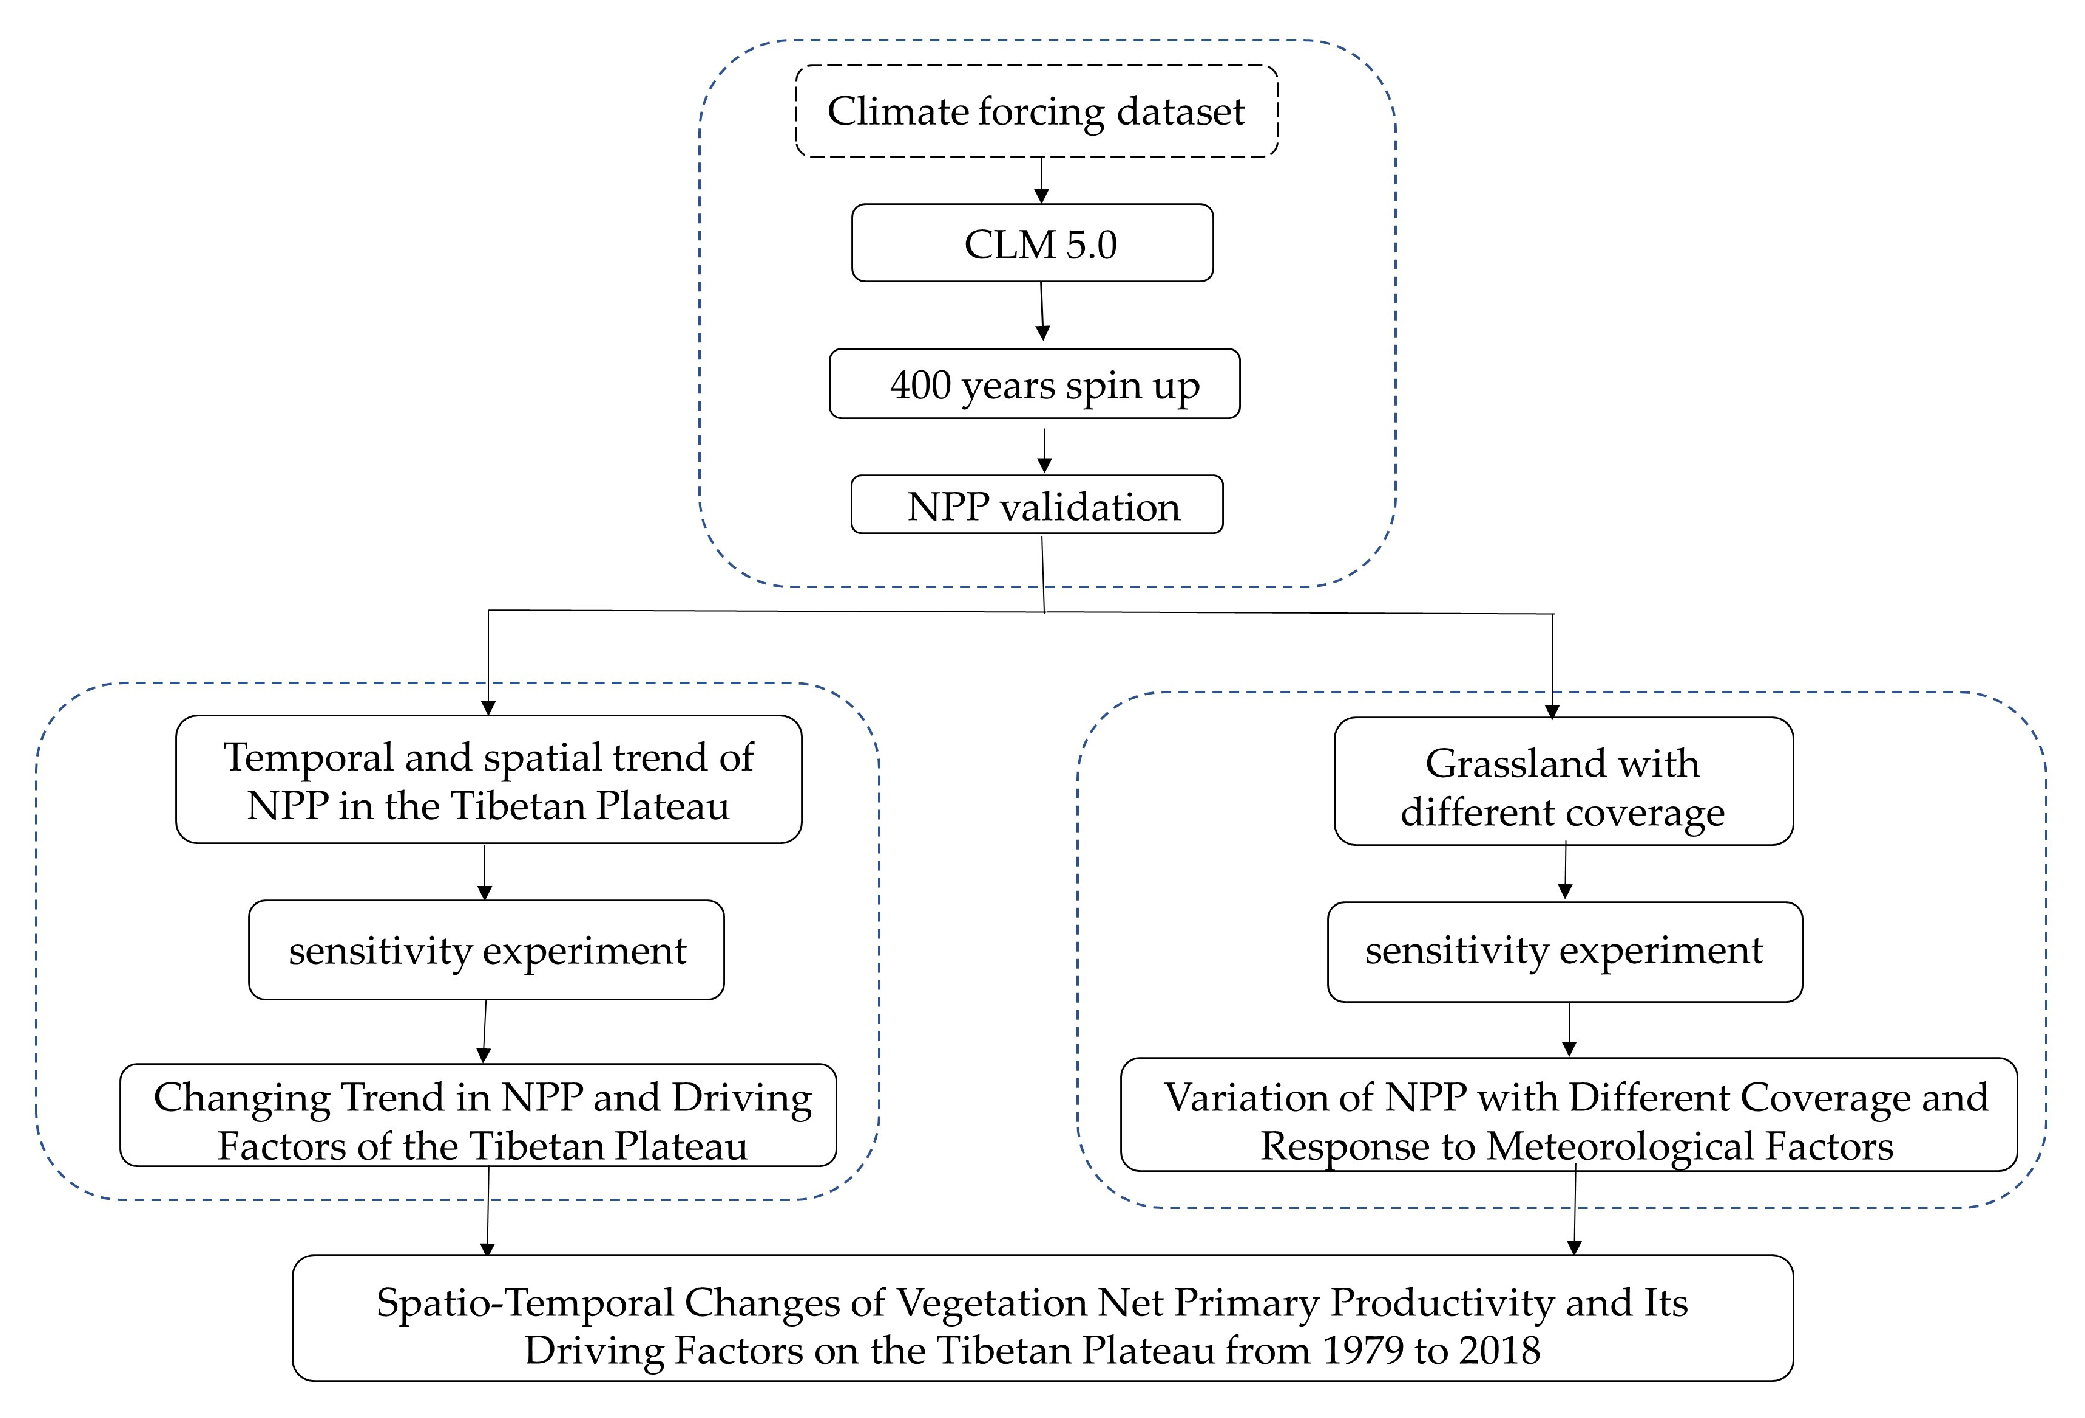
The climate-forcing dataset used in this study is the CMFD. CMFD comprises seven near-surface meteorological variables: 2 m air temperature, surface pressure, near-surface specific humidity, 10 m wind speed, downward shortwave radiation, downward longwave radiation, and precipitation rate [46]. The dataset integrates meteorological observations and remote sensing/reanalysis data. The temporal and spatial resolution of the dataset is 3 h and 0.1°. These remote sensing/reanalysis data include Princeton reanalysis data, GLDAS data, GEWEX-SRB radiation data, and TRMM precipitation data [47,48]. CMFD is more accurate than other meteorological forcing datasets [49]. Land use data from 2020 were used in the study and were provided by the Data Center for Resources and Environmental Sciences, Chinese Academy of Sciences (RESDC) [50]. The workflow of this paper is shown in Figure 2 and detailed data information is shown in Table A1.
The measured NPP data collected from the published research are used as ground-truthing data to validate the NPP simulated by CLM 5.0 [51]. In addition, the spatial patterns of NPP simulation from the CLM5.0 were also validated using the NPP calculated from the Carnegie-Ames-Stanford Approach (CASA) model. The CASA model is known for its computational simplicity, operational feasibility, and parameter sharing options. It has greatly facilitated NPP simulations at both global and regional scales [52]. Currently, the CASA model has become one of the most effective methods to study and calculate large-scale NPP [53], it also suits the NPP simulation in the Tibetan Plateau region [54,55]. Given that the CASA model relies on MODIS NDVI data which starts from the year 2000, this study used the CASA model simulated NPP from the years 2000 to 2018 as validation data.

2.3. Experimental Design and Analytical Methods

This study conducted a series of control experiments and sensitivity experiments to investigate the influence of climate factors (temperature, precipitation, radiation) on the NPP (Table 1). Scenario one served as the control experiment, while scenarios two to four were sensitivity experiments. In scenario one, the CLM 5.0 model was driven by CMFD from 1979 to 2018 to simulate the NPP. In scenarios two to four, the CLM model was driven by different atmospheric forcing data. In scenario two, temperature was held constant and set by the average values from 1979 to 2018, while precipitation and radiation remained consistent with the control experiment. In scenario three, precipitation was held constant and set by the 1979–2018 average, while temperature and radiation remained consistent with the control experiment. In scenario four, radiation was held constant and set by the 1979–2018 average, while temperature and precipitation remained consistent with the control experiment. These scenarios were designed to investigate the impact of individual meteorological forcing factors on the NPP. By comparing the control experiment and sensitivity experiments, we can quantify the extent of the meteorological forcing factors to the NPP change on the plateau.

3. Results

3.1. Model Validation

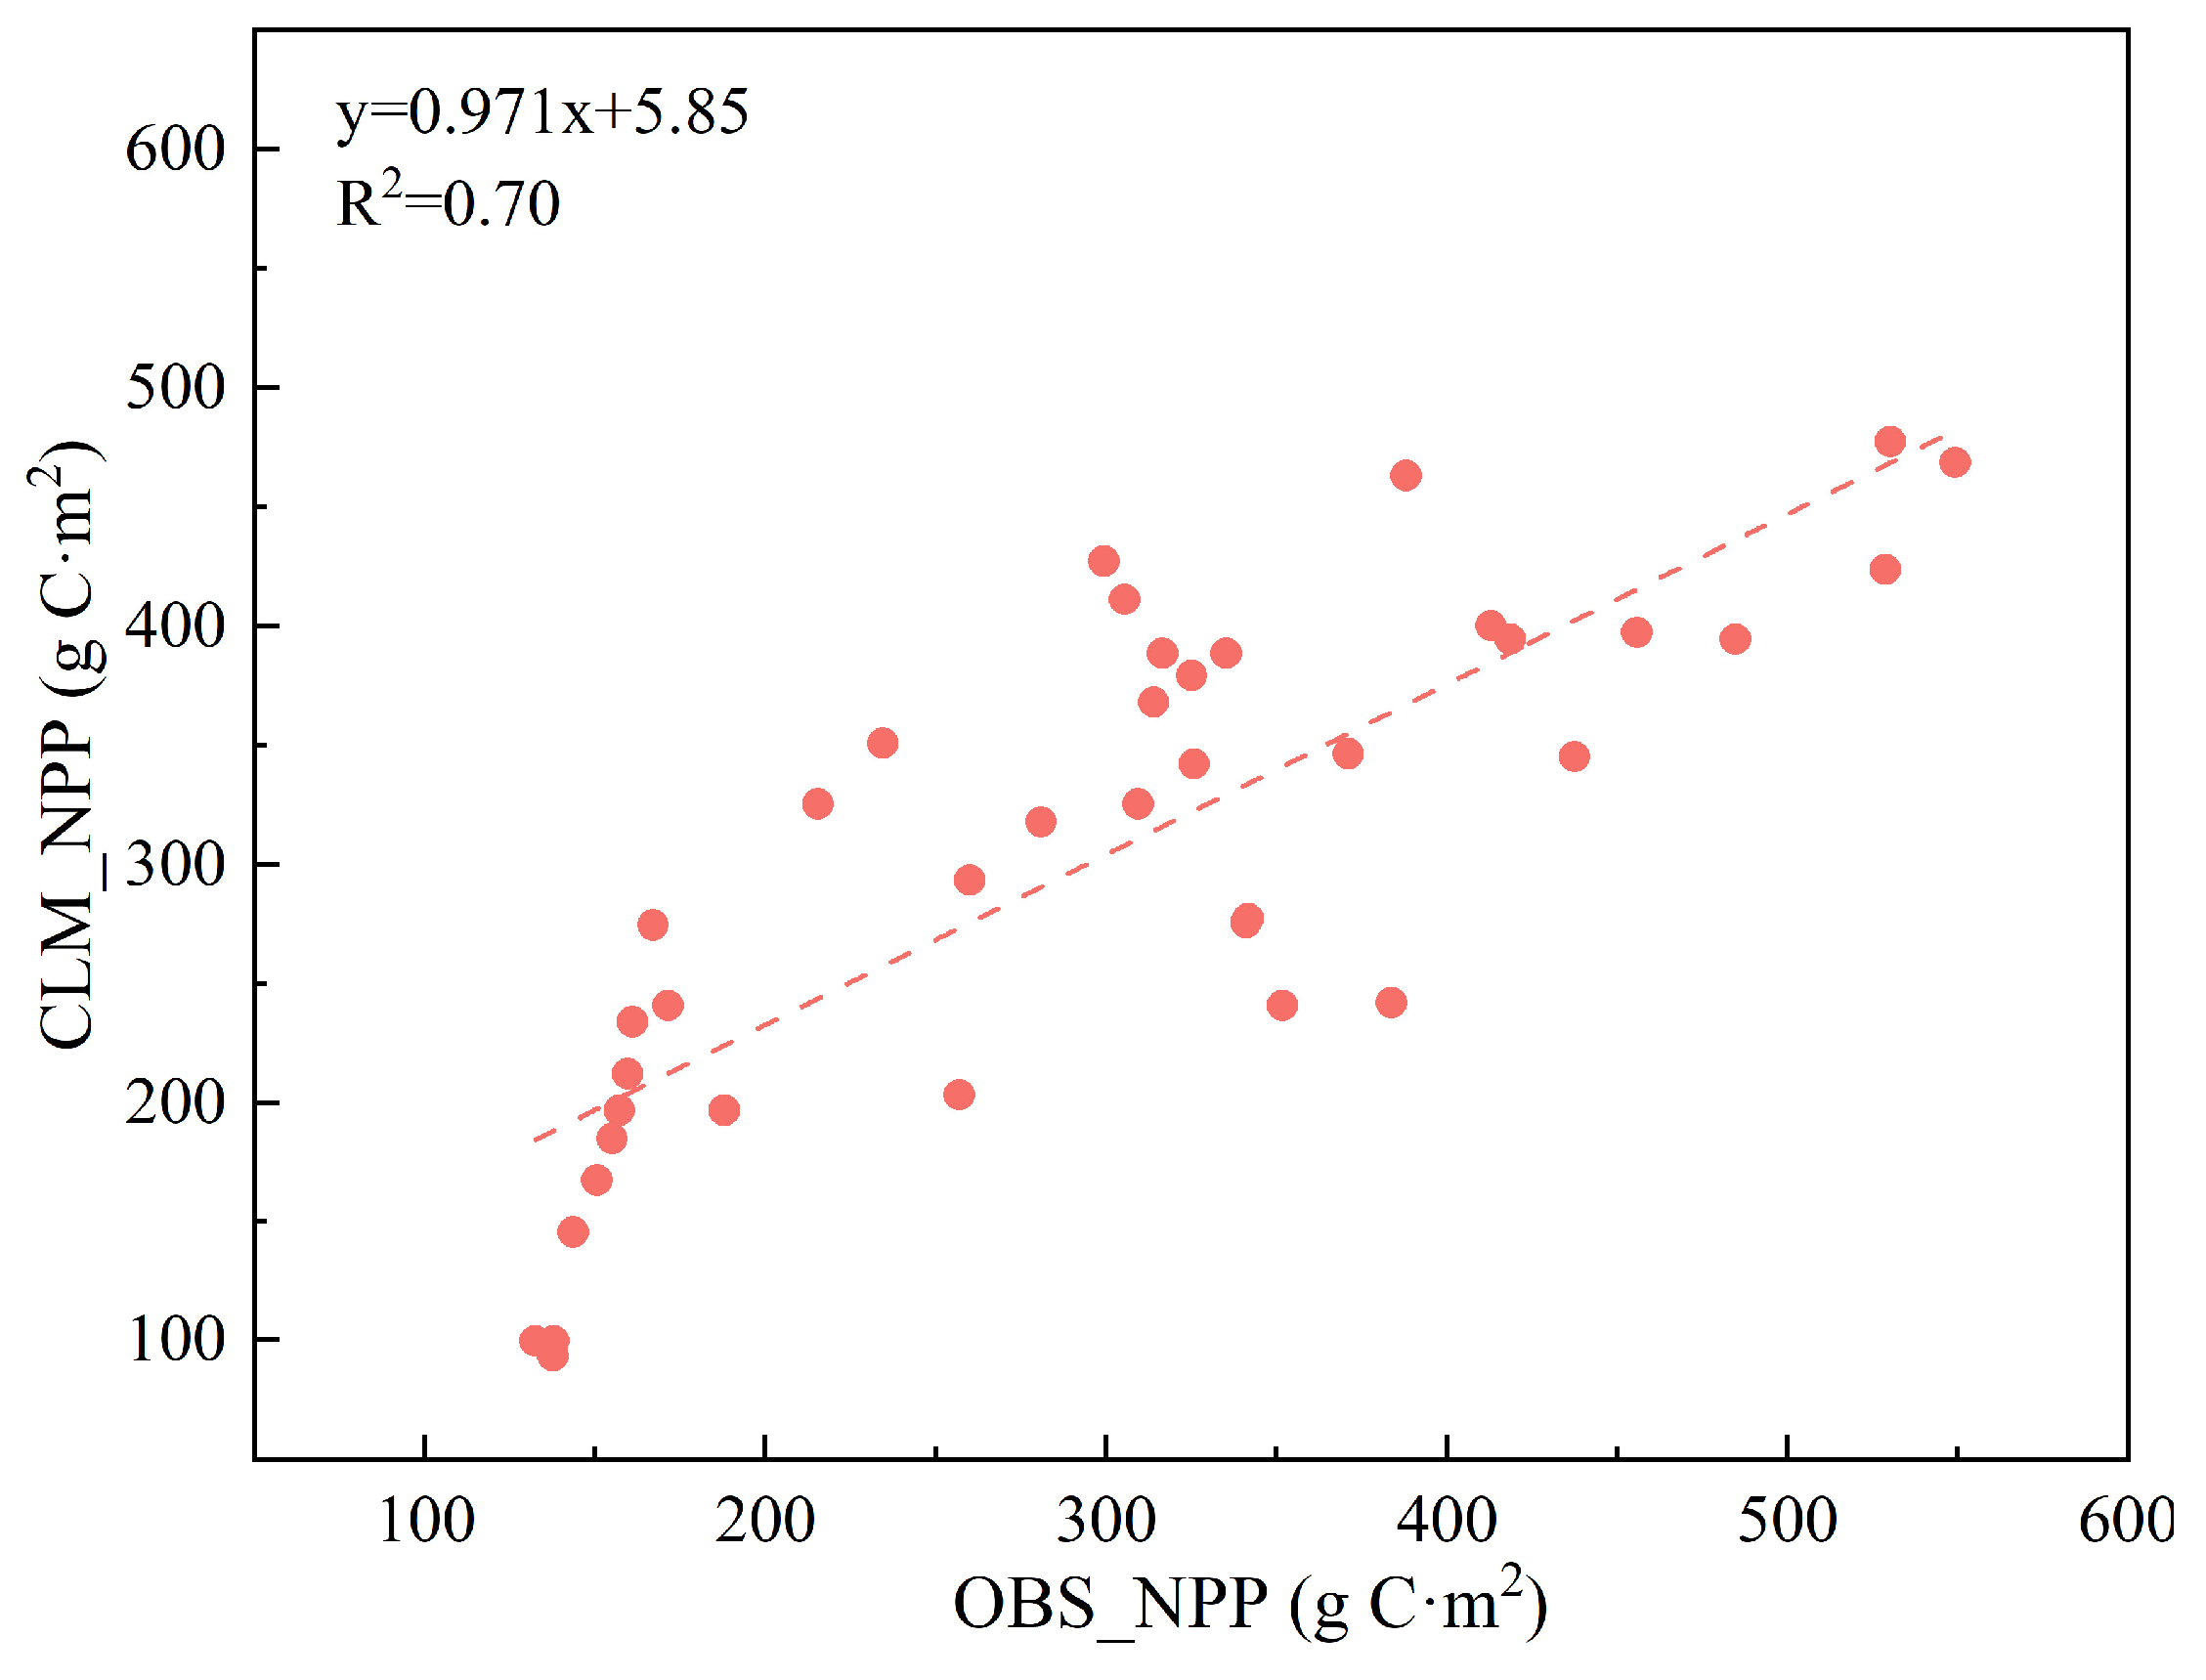
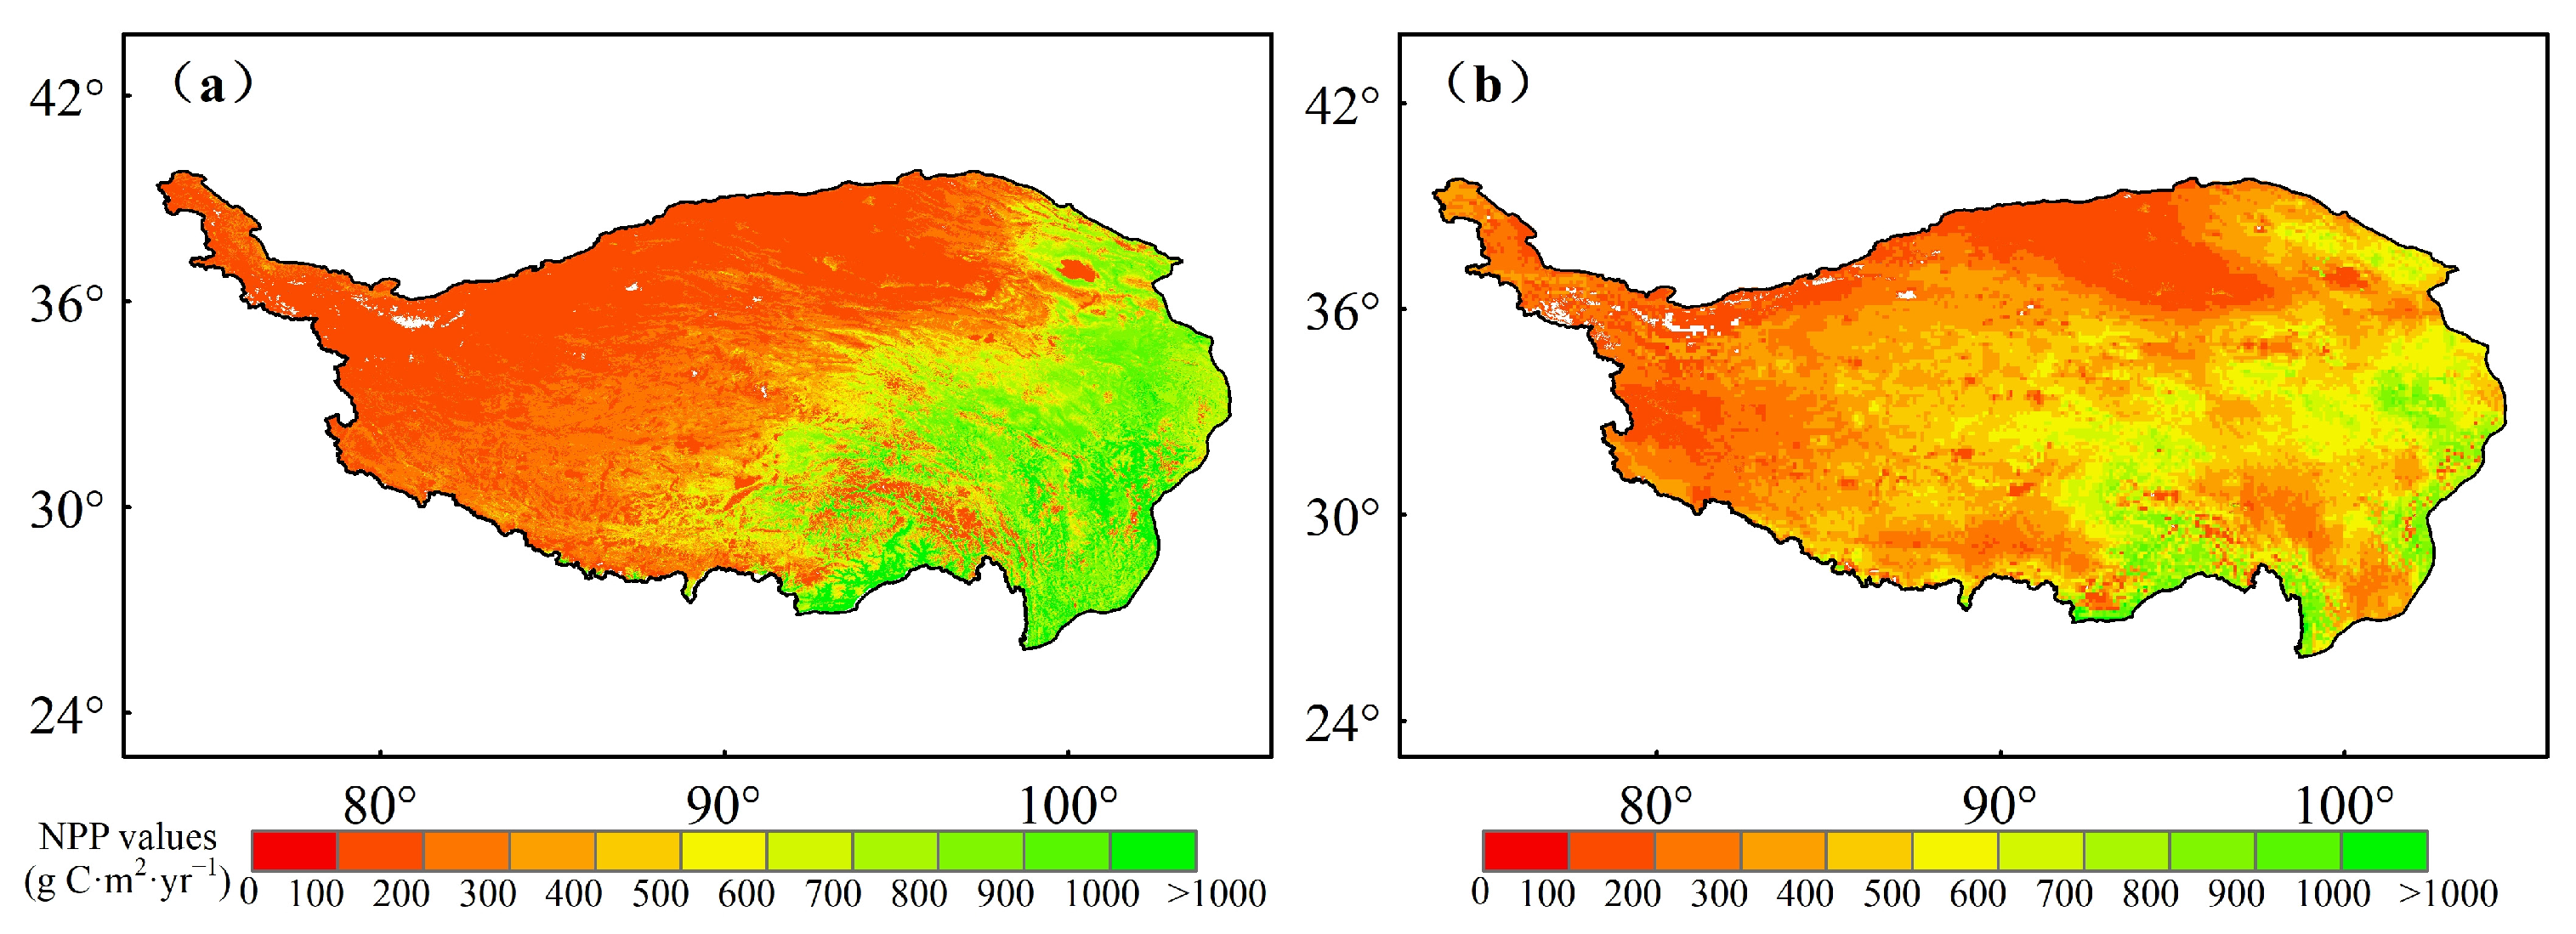
The observed NPP and the NPP simulated by the CASA model were used to evaluate the performance of the NPP simulated by the CLM model. The comparison of the measured NPP and the corresponding NPP simulated by CLM 5.0 is shown in Figure 3. The coefficient correlation R2 is 0.70, which has passed the 95% level with the F test. Figure 4 shows the spatial patterns of the NPP simulated by the CASA model and by CLM 5.0. It has been found that the NPP simulated by CLM 5.0 agrees with the NPP simulated by the CASA model in most areas of the Tibetan Plateau. Compared to the CASA model, CLM 5.0 simulated the spatial patterns of NPP in detail (Figure 4), although there are some regional differences. The NPP of the TP decreases from southeast to northwest, and the highest NPP areas are located on the southern flank of the Eastern Himalayas and in the high mountains of Sichuan and Tibet. Low-NPP areas are in the highland deserts, including the desert areas of the Qaidam Basin, the desert areas of the Kunlun Mountains, and the desert areas of the Ngari Prefecture.

3.2. Changing Trend in NPP and Driving Factors of the Tibetan Plateau

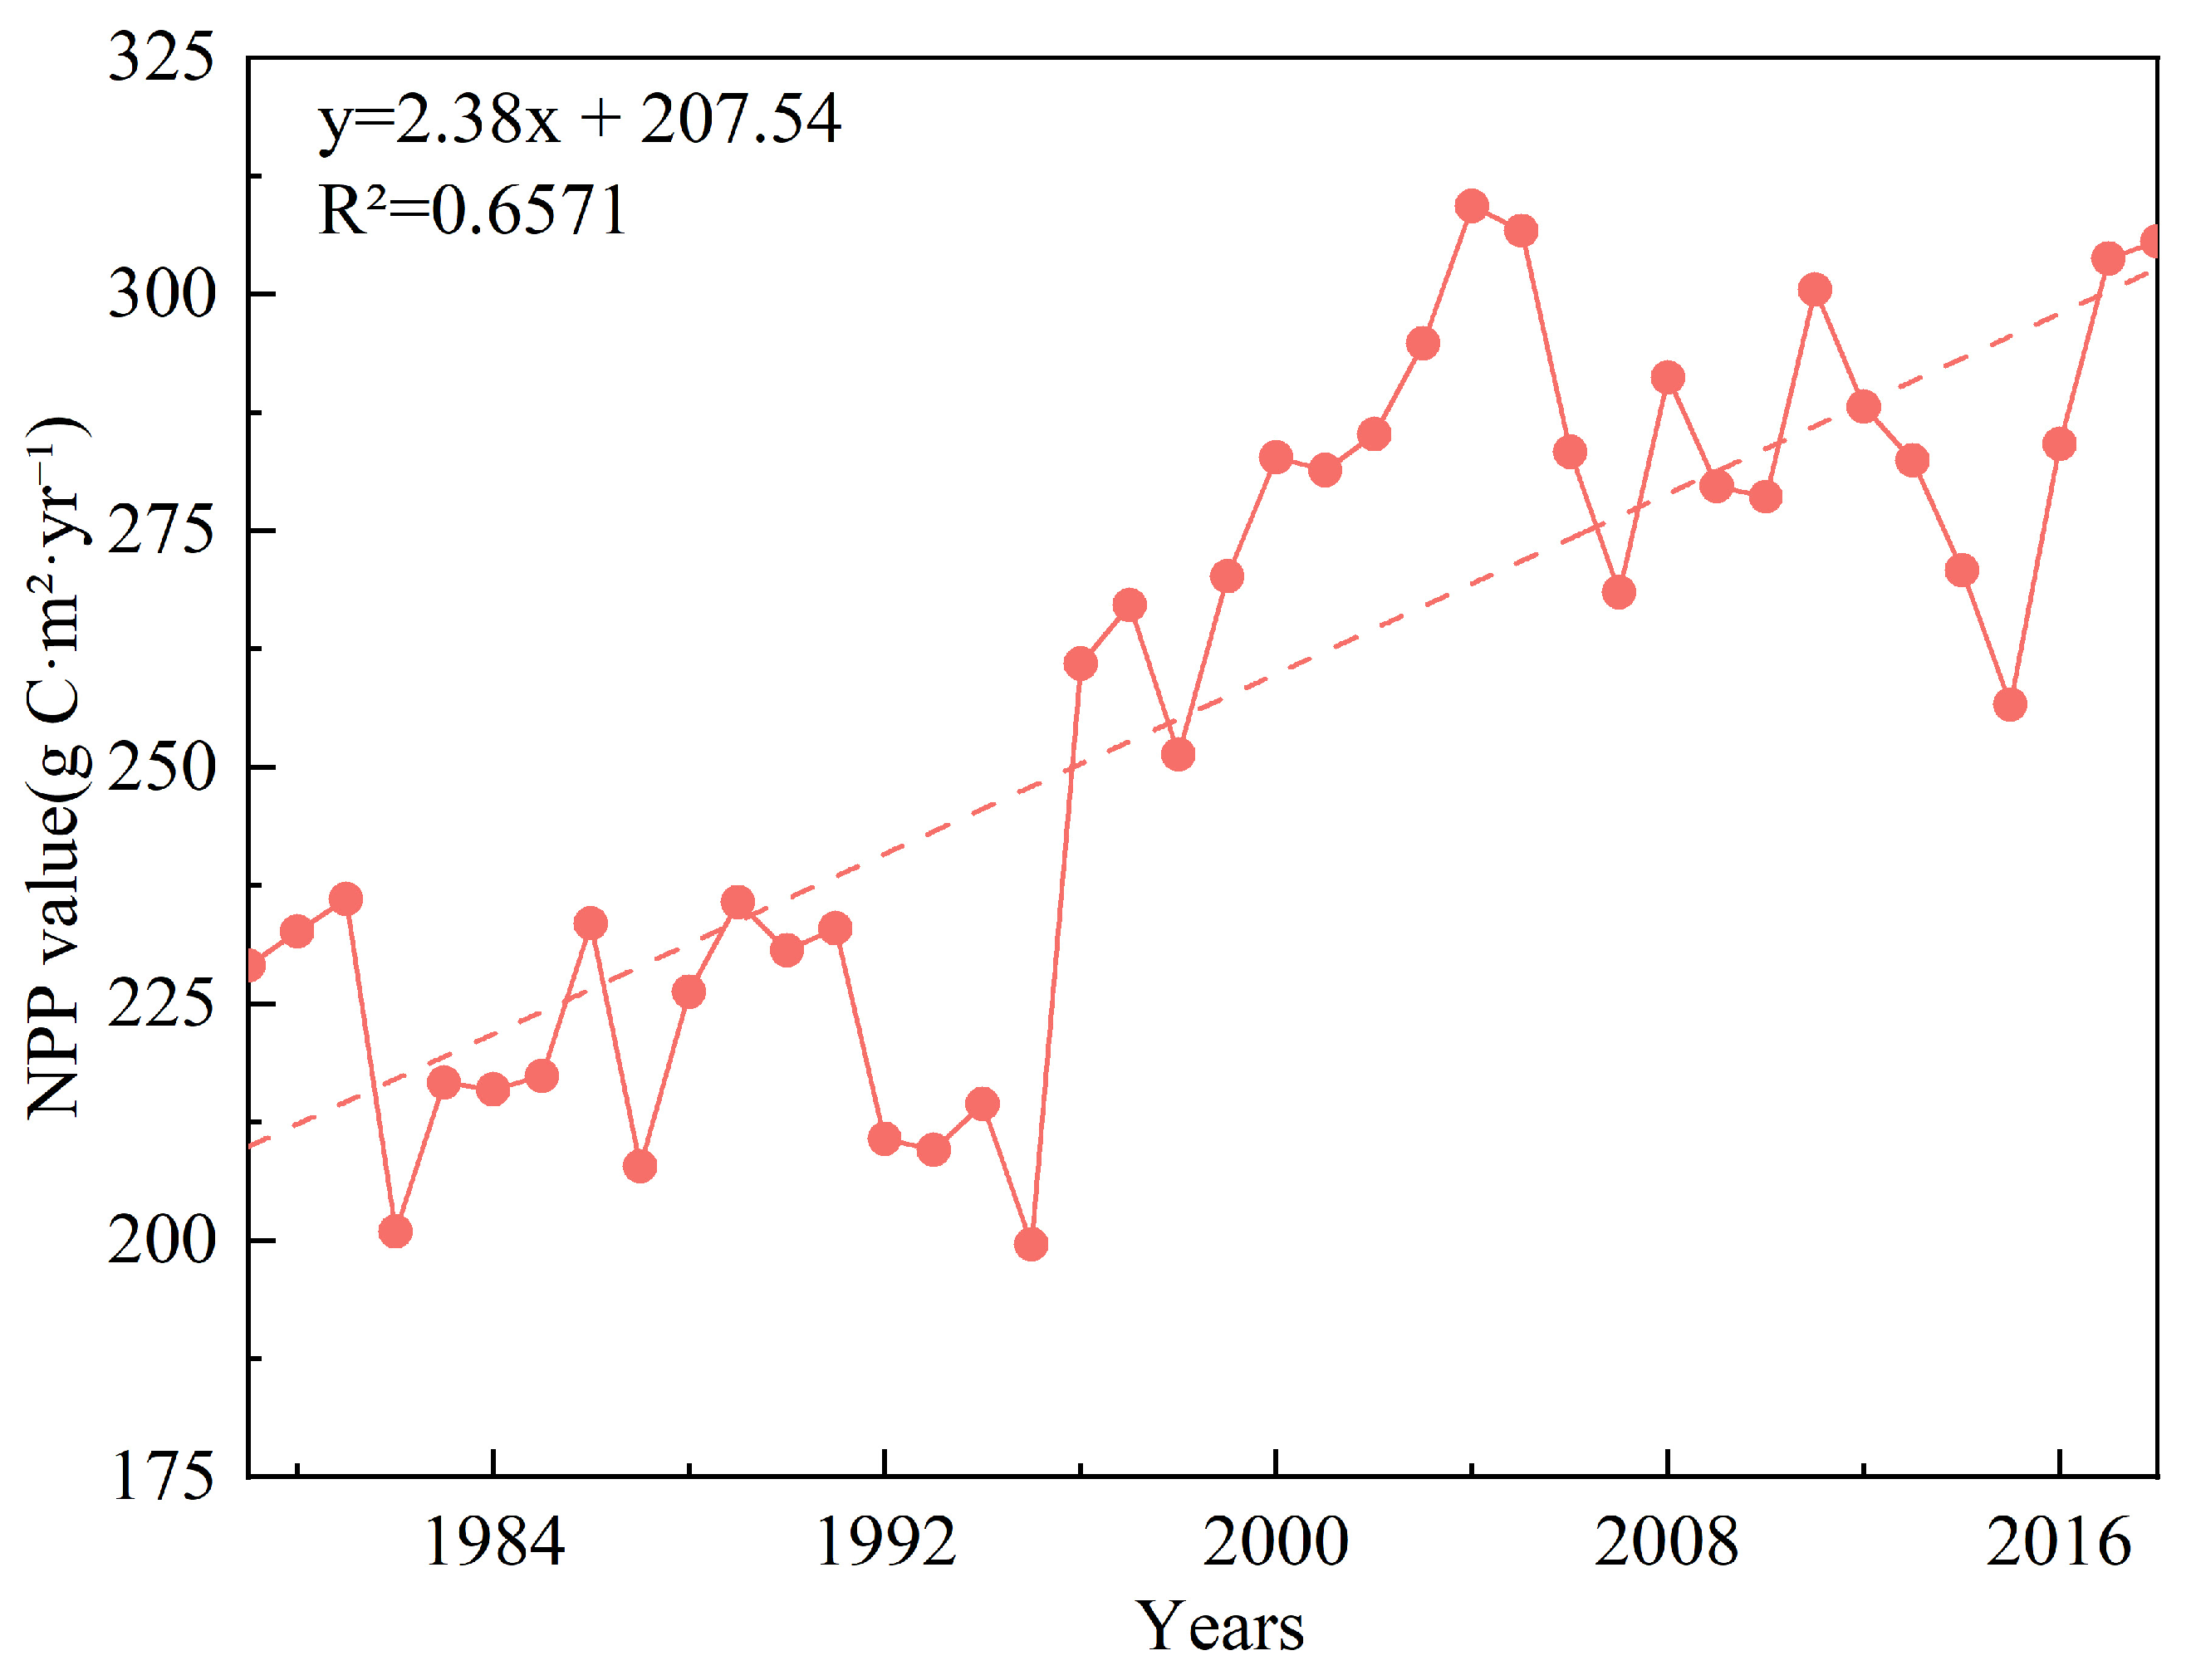
The NPP simulated by the CLM5.0 model is shown in Figure 5. The multi-year average of NPP simulated by the CLM model for the period 1979–2018 is 256 (g C·m2·yr−1). The NPP shows an increasing trend over 40 years with an average value of 2.38 (g C·m2·yr−1).
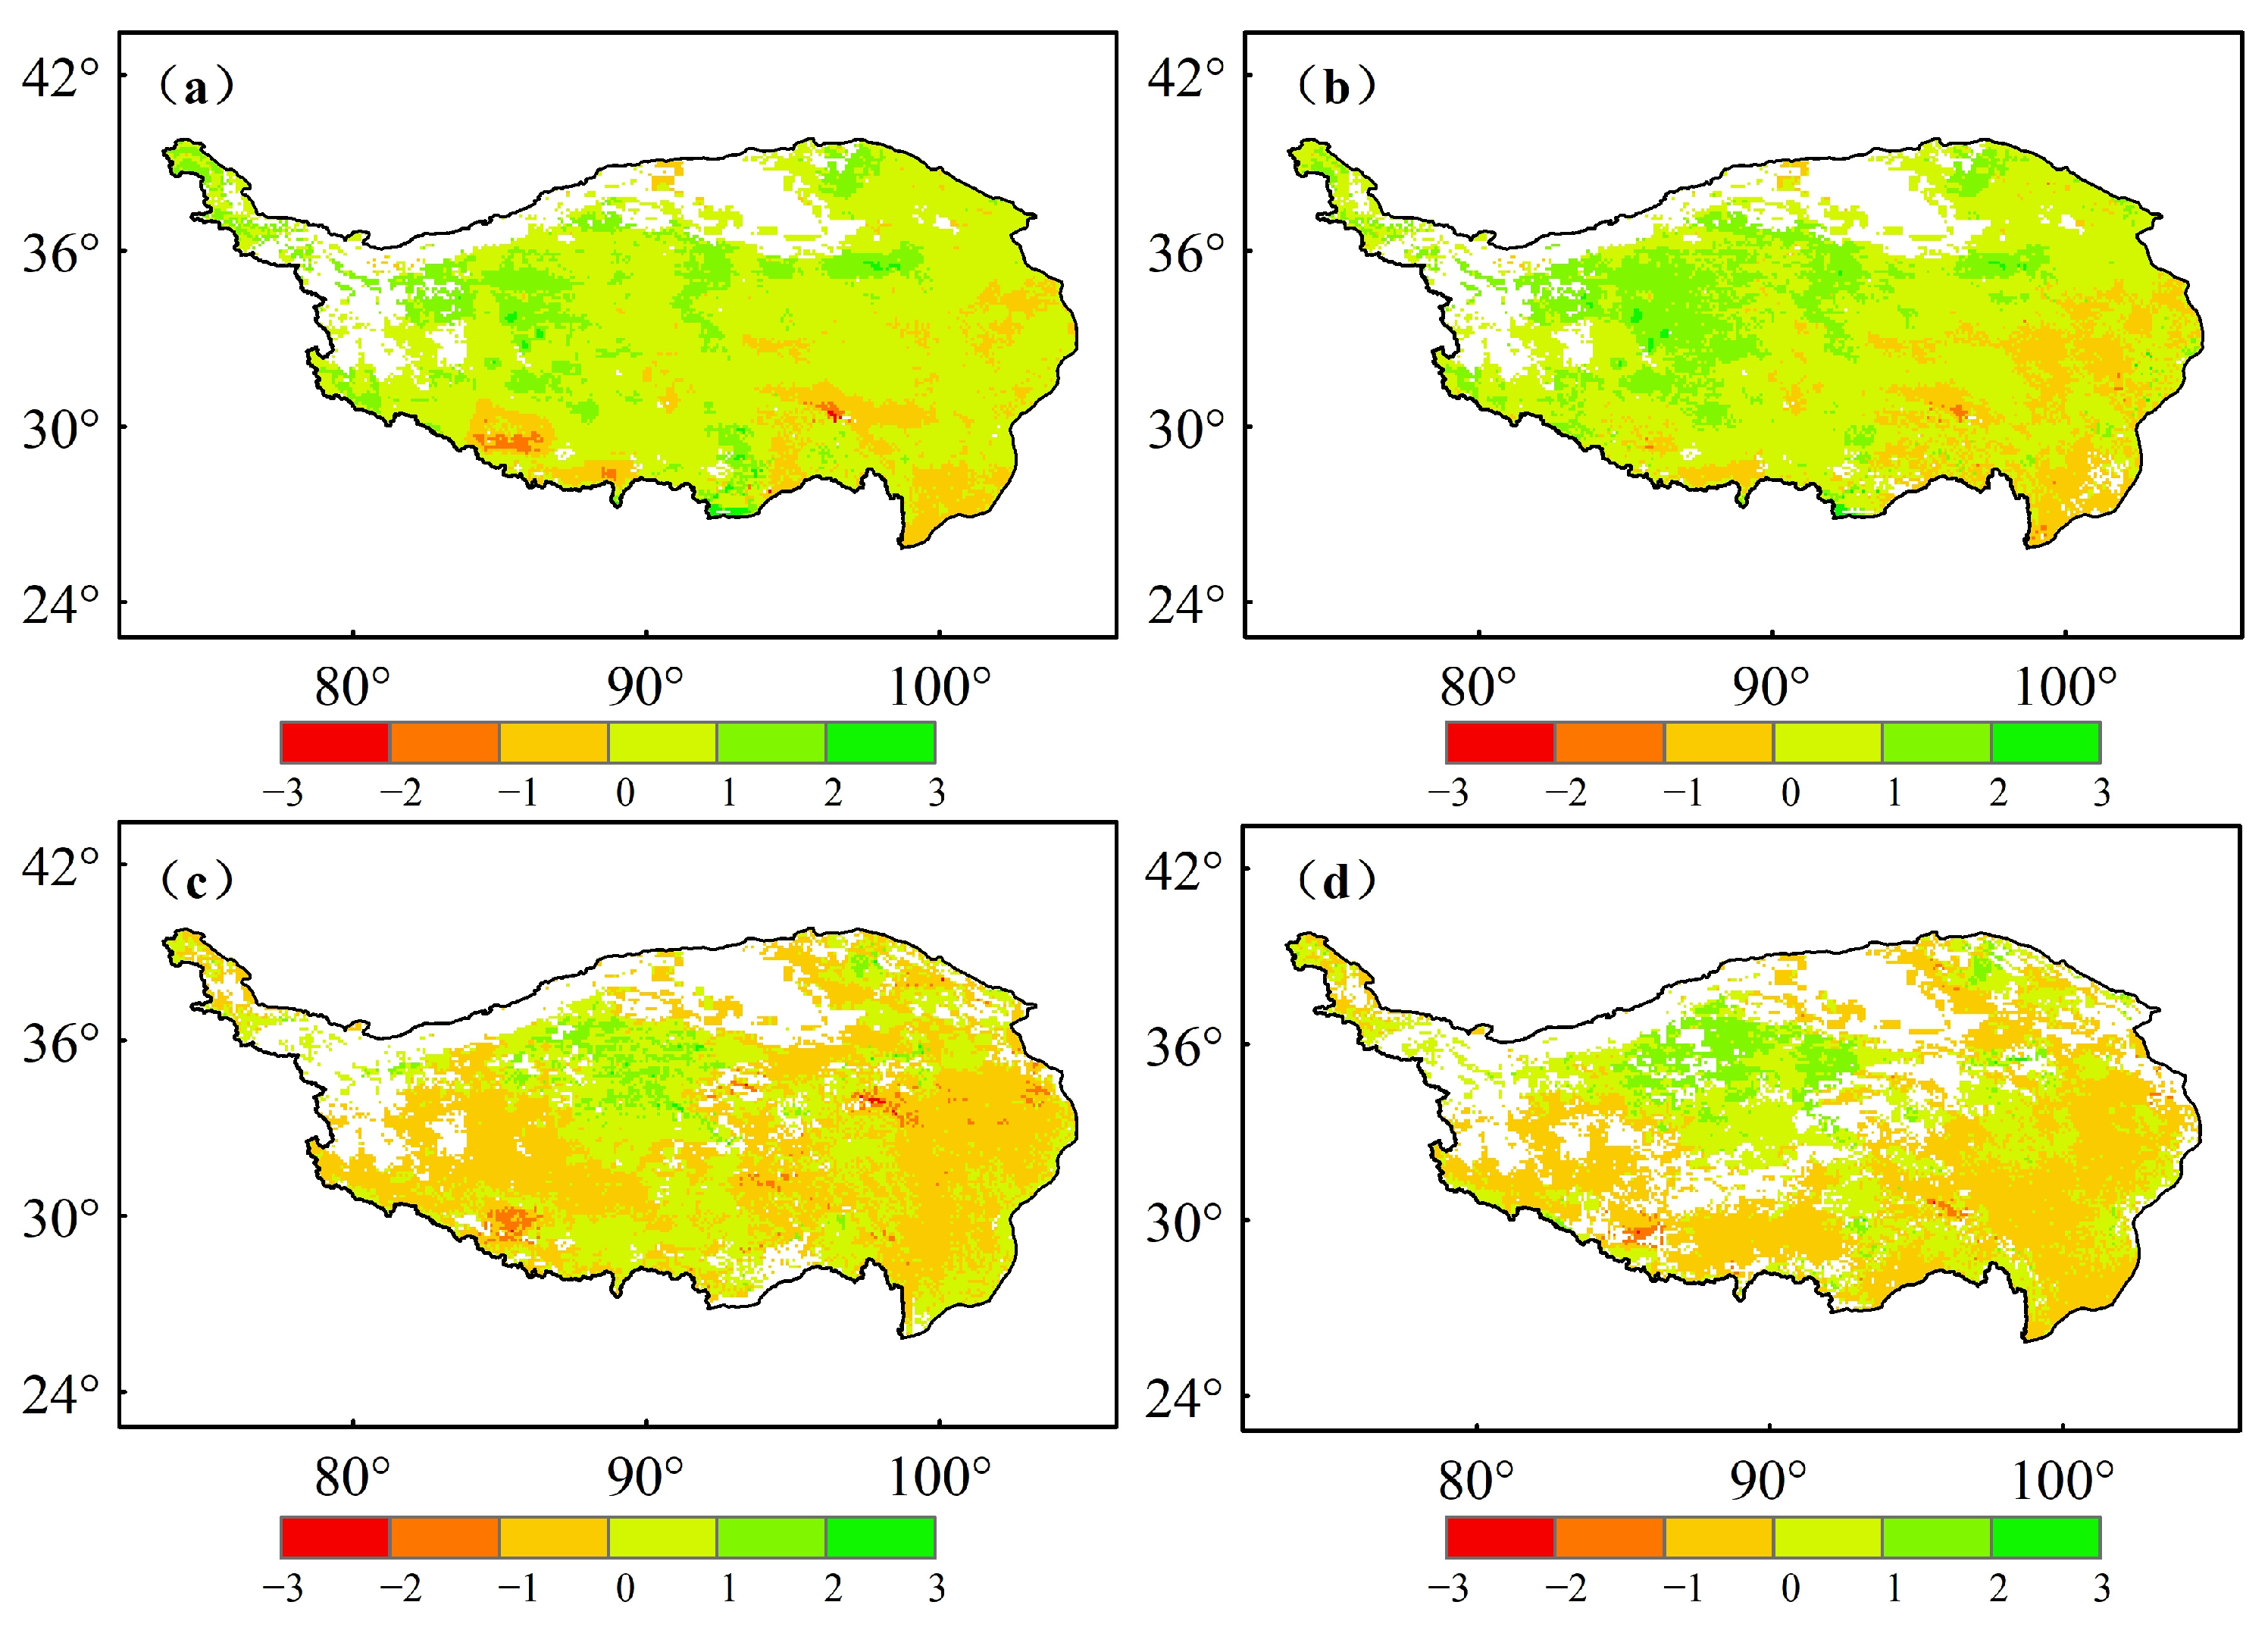
NPP is affected by different meteorological factors; thus, the NPP in the Tibetan Plateau showed large variations over four decades. Generally, the NPP trend that considers all meteorological factors has increased in most areas of the Tibetan Plateau (Figure 6a). Precipitation led to an increasing trend of the NPP in the central and west–central regions, while the decreasing trend occurred in the central–eastern and southeast regions (Figure 6b). Radiation change led to an increasing trend in the central region (Figure 6c). Temperature change led to an increasing trend in the central and east–central regions of the TP, while the decreasing trend in the western and southern regions of the TP (Figure 6d).
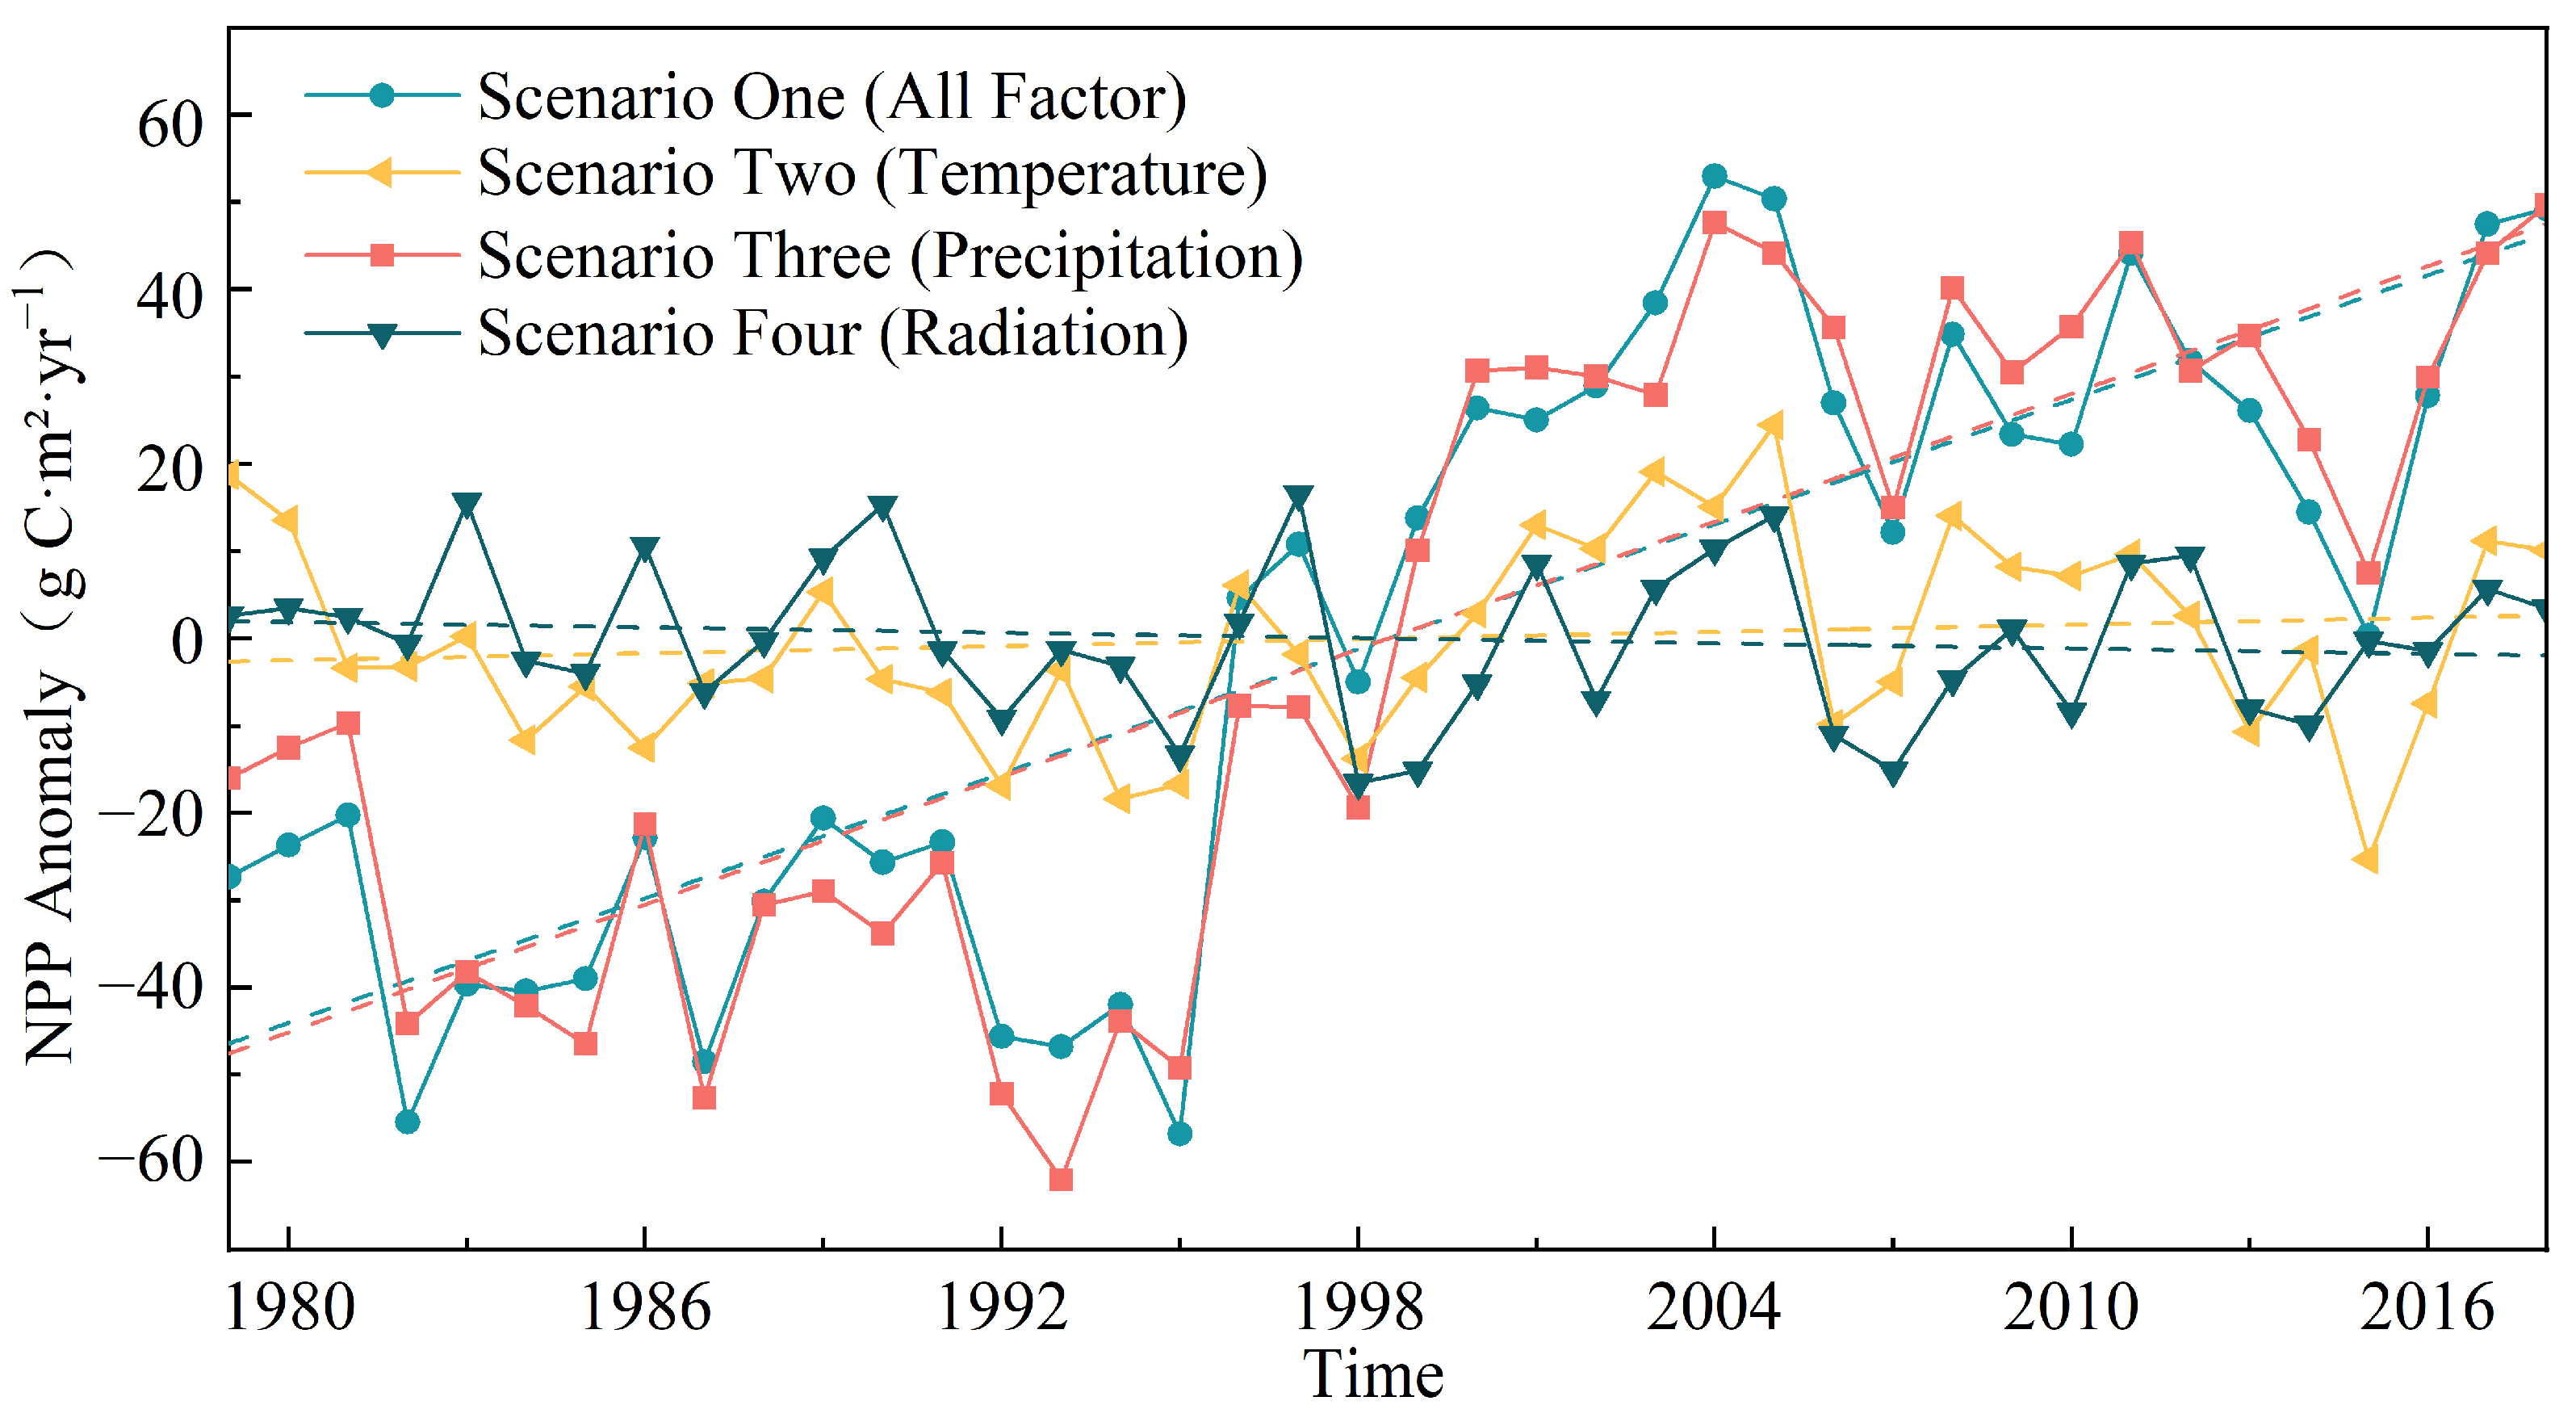
The interannual change of NPP under consideration of different meteorological factors is shown in Figure 7. As shown in Figure 7, NPP exhibited a noteworthy increase under the influence of precipitation, with a rate of 2.4 (g C·m2·yr−1) (p < 0.05). During the period 1979–2018, the interannual variations of NPP under precipitation matched closely with the control experiment, which indicated that precipitation was the main contributor to the interannual variation of NPP. The precipitation accounts for approximately 91% of the NPP variation (Figure 7). Under the influence of temperature, NPP changed at a rate of 0.14 (g C·m2·yr−1), indicating a slight upward trend, accounting for 5.3% of the interannual variation of NPP. Conversely, the radiation factor led to a decrease in NPP by −0.1 (g C·m2·yr−1), suggesting a weak declining trend and accounting for 3.8% of the NPP change. However, it is noteworthy that NPP was not significantly affected by temperature and radiation factors.

3.3. Interannual Variation of NPP in Grasslands with Different Coverage and Response to Meteorological Factors

The grasslands are the main land use type in the Tibetan Plateau region. The difference in NPP changes across different grasslands in the TP and their driving meteorological factors were analyzed. The alpine grassland in the TP was divided into high-coverage grasslands, medium-coverage grasslands, and low-coverage grasslands. Although grasslands of all three types are widely distributed over the plateau, their distribution patterns vary significantly (Figure 8a). There is a relatively small area of high-coverage grasslands on the plateau, primarily found in the eastern and southern parts of the plateau, while the plateau’s central portion is dominated by grasslands with medium cover. Grasslands with low cover have the greatest distribution range, and they are widely distributed throughout the TP. As shown in Figure 8b, the high-coverage grasslands, the medium-coverage grasslands and the low-coverage grasslands have an average annual NPP of 306, 259 and 243 (g C·m2·yr−1), respectively. The NPP in low-coverage grasslands, medium-coverage grasslands, and high-coverage grasslands increases significantly by 2.61, 2.39 and 1.97 (g C·m2·yr−1), respectively.
Compared with temperature and radiation, precipitation is the key factor that affects the NPP of all three types grassland (Figure 9). Under the influence of precipitation, the increase rates of high-, medium-, and low-coverage grasslands NPP were 2.0, 2.45, and 2.8 (g C·m2·yr−1), respectively. Low-coverage grassland had the highest rate of increase (Figure 9a). Under the influence of radiation factors, grasslands with high covers increased at the fastest rate of 0.45 (g C·m2·yr−1) (Figure 9b). In contrast, medium-coverage and low-coverage grasslands have a lower increase rate of 0.09 and 0.02 (g C·m2·yr−1), respectively. Under the influence of temperature factors, high-coverage grasses show an increasing trend of 0.36 (g C·m2·yr−1), but the medium- and low-coverage grasses showed a decreasing trend of −0.15 and −0.33 (g C·m2·yr−1), respectively.

4. Discussion

4.1. Impact of Meteorological Factors on NPP Changes

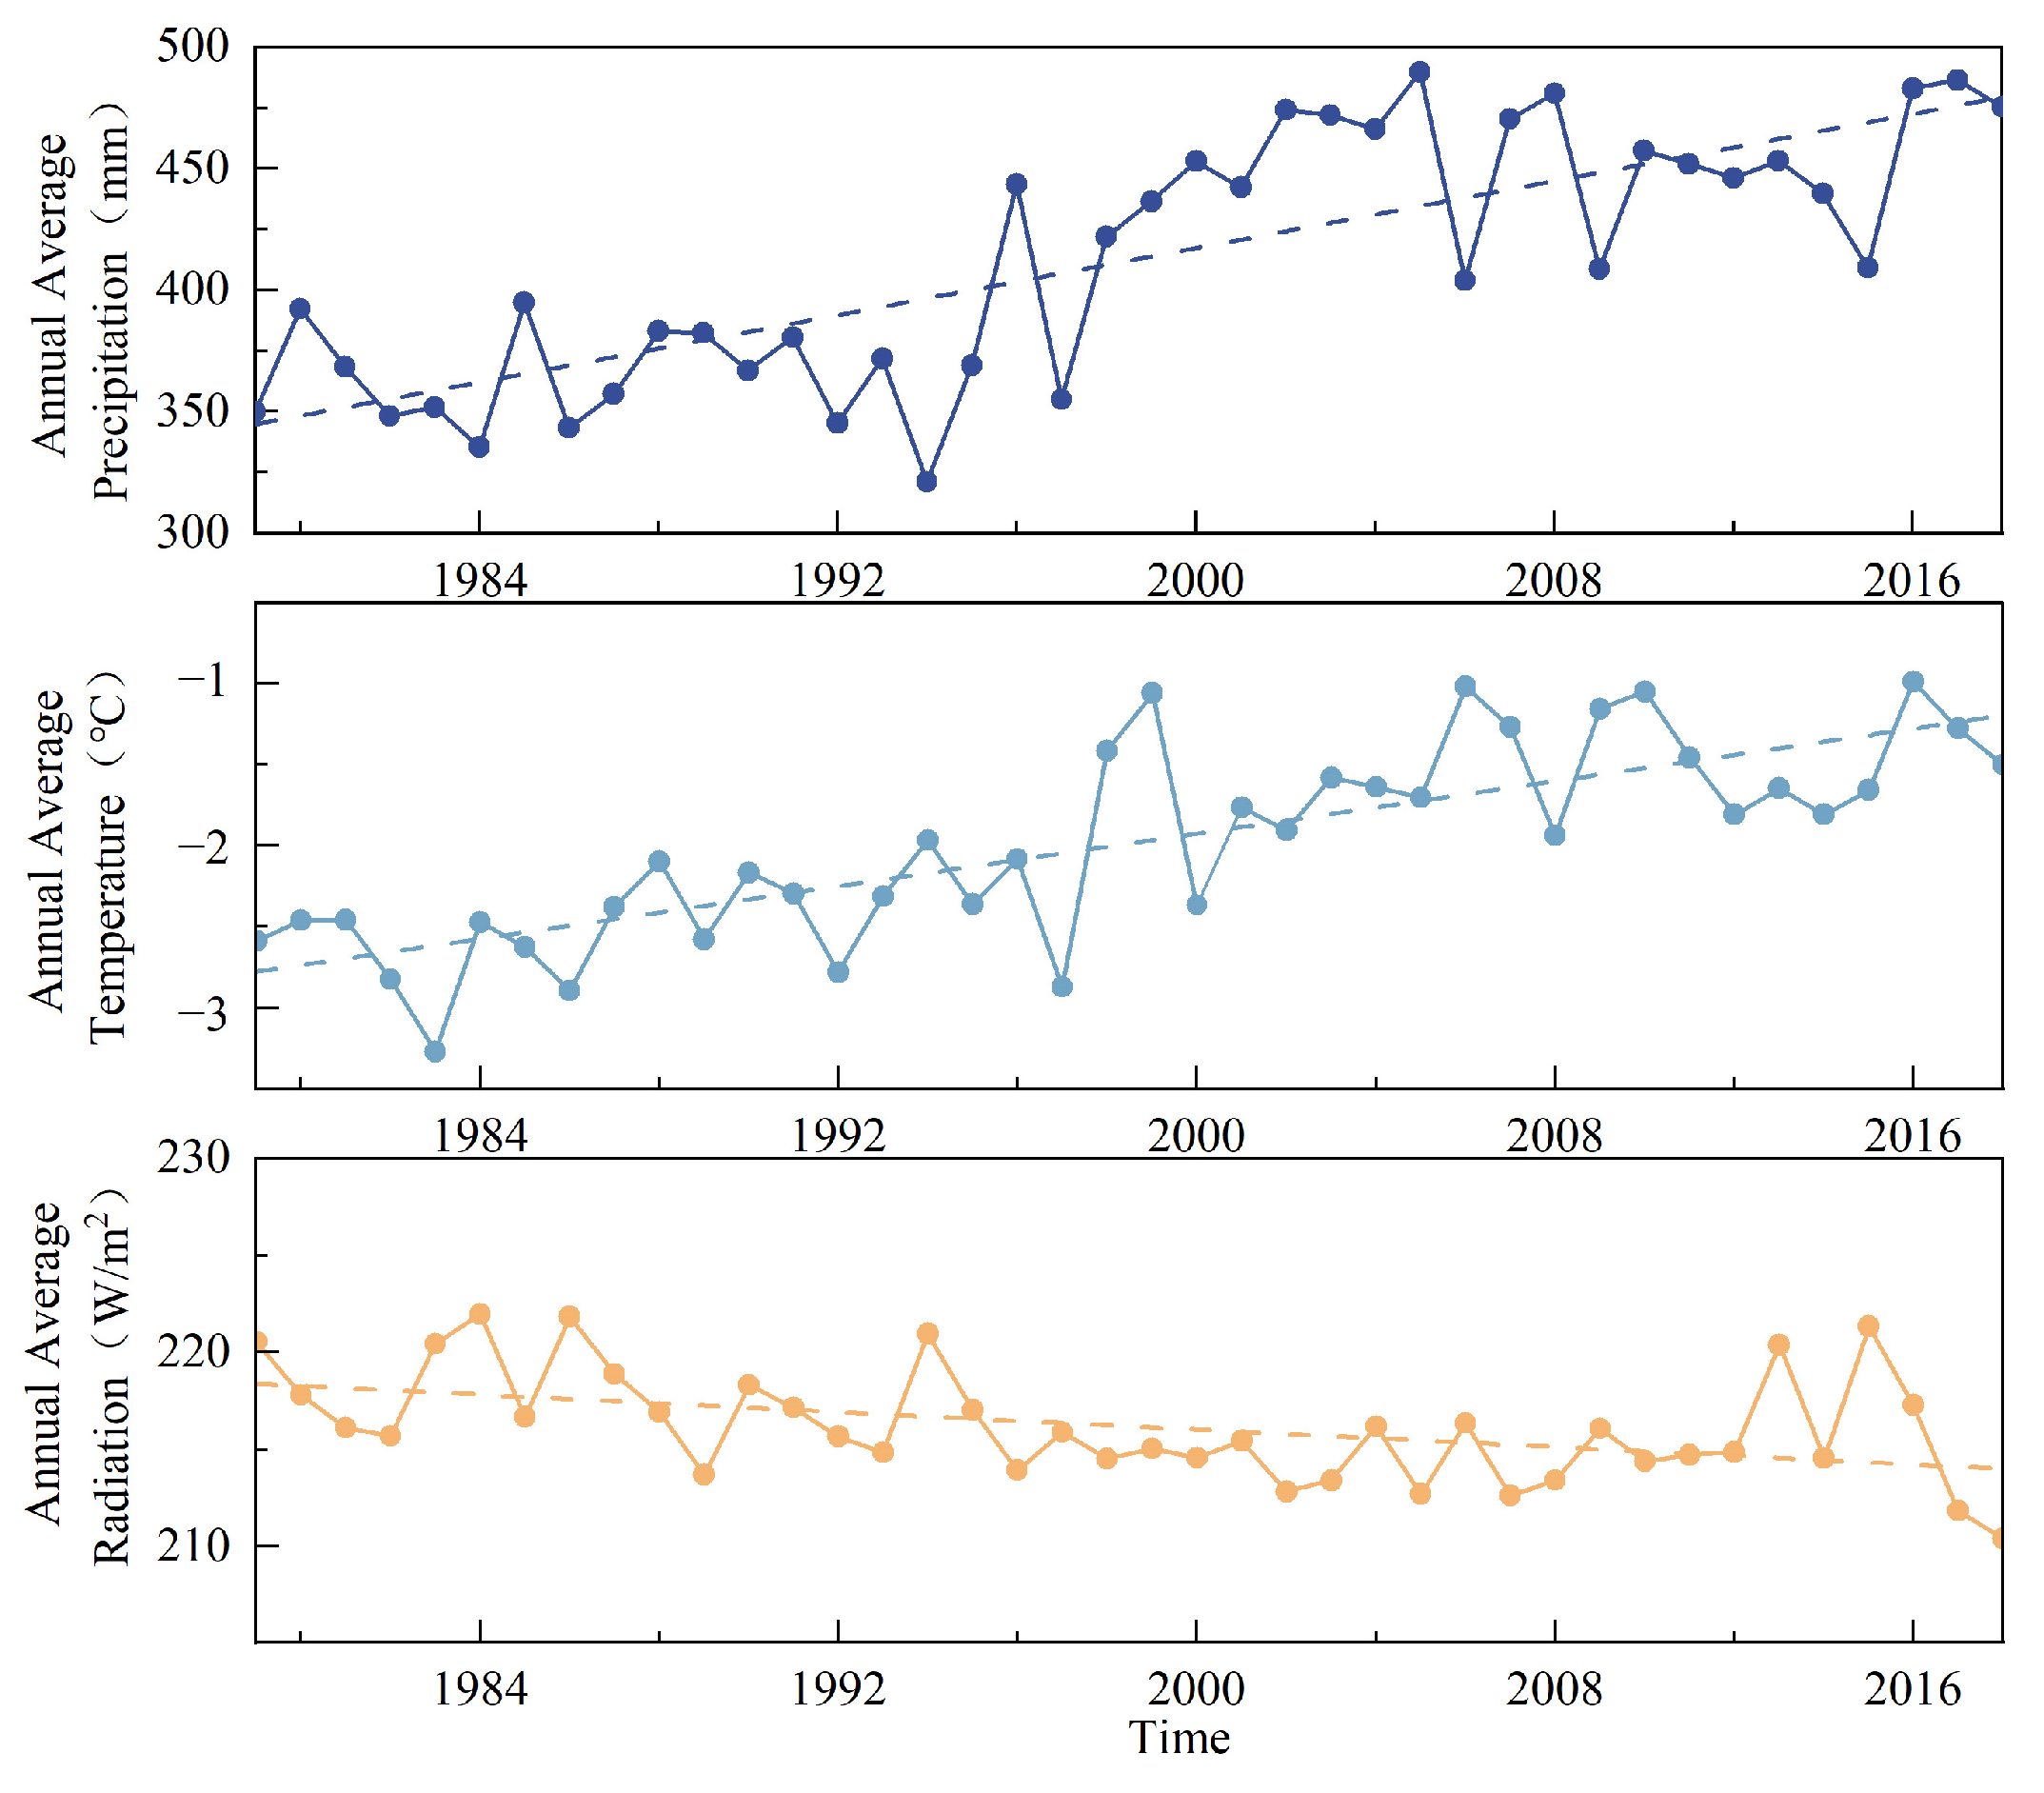
The Tibetan Plateau has undergone significant warming and humidification over the past four decades [56]. Mean annual precipitation and mean annual temperature increased at a rate of 3.45 mm/yr and 0.04 °C/yr, respectively (Figure 10). In contrast, solar radiation displayed a decreasing trend, with a rate of −0.11 W·m2·yr−1. Global warming has an impact on vegetation productivity, ecological processes and biodiversity dynamics. The length of the growing season (LOS) grassland becomes longer [57], and the normalized difference vegetation index (NDVI) and mean species abundance (MSA) show increasing trends [58,59].
NPP increased in most areas of the TP except in the eastern and southeastern of the Hengduan Mountains. We found that the precipitation was the main factor leading to the increase in vegetation productivity with the rate of 2.4 (g C·m2·yr−1) (Figure 6 and Figure 7). This conclusion is consistent with the research from Zeng et al. and Li et al. [60,61]. The vegetation growth is influenced by water and heat conditions [62]. Soil moisture content is directly influenced by precipitation and plays a crucial role in determining plant available water capacity and photosynthetic processes [63]. At the same time, adequate soil moisture ensures nutrient transport and accelerates the mineralization of organic matter in the soil [64,65].
The temporal and spatial trends of NPP on the TP were found to be significantly correlated with precipitation but not significantly correlated with temperature. This result is consistent with previous investigations [66]. The temperature increased significantly on the TP, and higher temperatures can promote enzymatic activities in photosynthesis, thus enhancing the intensity of plant photosynthesis and increasing the absorption of organic matter by plants [67]. However, our study has revealed that the temperature increase did not have a significant impact on the NPP change. Previous studies have discovered that temperature impacts both the rates of photosynthesis and autotrophic respiration (AR). The rising temperatures have a greater impact on the AR than the GPP [68], especially on the TP [69], which explains the slight downward trend of the NPP.
Solar radiation, as the sole energy source for plant photosynthesis, can directly affect vegetation photosynthesis trends. In our study, the slight decreasing trend in solar radiation over the 40-year period resulted in a negligible effect on the NPP, with a rate of −0.10 (g C·m2·yr−1), suggesting no significant impact (Figure 7).

4.2. Response of NPP to Meteorological Factors in Different Grasslands Cover Types

Grasslands with different cover types displayed different variation characteristics. High-coverage grasslands had a low increase rate, but low-coverage grasslands had a high increase rate. The NPP variation of medium-coverage grasslands and their responses to climate factors fall between high-coverage and low-coverage grasslands. Meteorological factors play a crucial role in shaping these trends (Figure 8b). Our research provides insights into how climate change interacts with all three types of grasslands of the TP.
Precipitation is the most significant factor affecting NPP in low-coverage grasslands, and radiation has no effect, while temperature has a negative effect (Figure 9). This is due to the geographic distribution of low-coverage grasslands in the TP. On the one hand, precipitation increases in low-coverage grasslands, mitigating the impact of soil water deficits. It has been demonstrated that wetter and warmer climatic conditions will alleviate low-temperature constraints and promote the growth of alpine vegetation [70,71]. In regions with lower precipitation, NPP shows a rapid increase with precipitation until it reaches a threshold [72]. On the other hand, low-coverage grassland is predominantly situated in the permafrost region of the west-central plateau, and more permafrost water is released into the soil under the impact of global warming. However, higher temperatures may enhance soil evapotranspiration, exacerbating soil moisture deficits at higher elevations and leading to a declining trend in the effect of temperature on NPP. Previous studies have indicated that climate warming may impede vegetation growth on the TP by increasing soil moisture deficits, which is consistent with the findings of this study [73,74]. Precipitation is the dominant factor of NPP change in high-coverage grassland, followed by radiation and temperature factors. However, the NPP change of high-coverage grassland in the eastern and southern regions of the TP is influenced most by temperature and radiation. That is because seasonally frozen soil maintains relatively high soil moisture content during the growing season and it promotes the impact of radiation and temperature.
At the same time, it is important to consider the influence of non-meteorological factors. China has implemented ecological restoration projects, which have helped reduce grassland degradation caused by grazing. Li et al. [75] found that grazing intensity (14.5%) had a lower impact on controlling Above-ground Net Primary Production (ANPP) grassland dynamics compared to precipitation (29.0%). However, precipitation variability was identified as the key factor for increasing alpine grassland ANPP across the plateau. Meanwhile, under different precipitation patterns, summer precipitation can provide a more effective water supply to the vegetation than meltwater from snowfall or glaciers [69]. The NPP of grasslands on the Tibetan Plateau is expected to increase due to the combined effects of meteorological and non-meteorological factors. In terms of stability, precipitation and temperature variability have a greater impact on the stability of alpine meadows, while temperature variability does not significantly affect grassland stability [76]. It is predicted that the vulnerability of alpine meadows to climate change in the west-central Tibetan Plateau will decrease in the future [77].

5. Conclusions

The study investigates the spatial and temporal trends of NPP and the effects of meteorological factors on the NPP change on the Tibetan Plateau. The annual average NPP is 256 (g C·m2·yr−1) in the TP. NPP increased at the rate of 2.38 (g C·m2·yr−1) on the Tibetan Plateau during the period 1979–2018. The variation of the NPP primarily results from precipitation increase, followed by temperature increase and the radiation decrease. Changes in precipitation, temperature and radiation account for approximately 91%, 5.3%, and 3.8% of NPP variation, respectively.
Moreover, our study demonstrates the meteorological drivers of NPP change in the grasslands with different vegetation covers. The annual average NPP of high-coverage grasslands and low-coverage grasslands were 306 and 243 (g C·m2·yr−1), respectively, and they increased at the rate of 1.97 and 2.61 (g C·m2·yr−1), respectively. The NPP change of the high-coverage grasslands was mainly affected by precipitation increase (2.0 g C·m2·yr−1), and then the temperature increase (0.36 g C·m2·yr−1) and radiation decrease (0.45 g C·m2·yr−1). Comparatively, the precipitation increase is the driving factor of the increased NPP of low-coverage grasslands (2.82 g C·m2·yr−1), but the temperature increase is the negative factor (−0.33 g C·m2·yr−1).

Author Contributions

M.L.: conceptualization, analysis, methodology, data resources and curation, visualization, and writing—original draft. Q.L.: funding acquisition, project administration, supervision, and writing—review and editing. M.X.: software and validation. All authors have read and agreed to the published version of the manuscript.

Funding

This research was funded by Qinghai Provincial Science and Technology Department Major Scientific And Technological Specialties (2021-SF-A6).

Institutional Review Board Statement

Not applicable.

Informed Consent Statement

Not applicable.

Data Availability Statement

The data presented in this study are available on request from the corresponding author. The data are not publicly available due to privacy.

Conflicts of Interest

The authors declare no conflicts of interest.

Appendix A

Table A1. Model data sources.
Data NameVariablesData Sources
Data required for the modelSlope, Aspect, Elevation, PFT, etc.NCAR. (https://svn-ccsm-inputdata.cgd.ucar.edu/trunk/inputdata/) Accessed on 10 December 2023.
Climate forcing datasetTemperature (K)National Tibetan Plateau/Third Pole Environment Data Center. (http://data.tpdc.ac.cn/en/data/8028b944-daaa-4511-8769-965612652c49/) Accessed on 10 December 2023.
Pressure (Pa)
Specific humidity (Kg/Kg)
Wind speed (M/s)
Downward shortwave radiation(W/m2)
Downward longwave radiation (W/m2)
Precipitation rate (mm/s)
Land use dataHigh-coverage grasslandsData Center for Resources and Environmental Sciences (RESDC). (http://www.resdc.cn) Accessed on 20 December 2023.
Medium-coverage grasslands
Low-coverage grasslands

References

  1. Jiang, Y.; Wang, P.; Xu, X.; Zhang, J. Dynamics of carbon fluxes with responses to vegetation, meteorological and terrain factors in the south-eastern Tibetan Plateau. Environ. Earth Sci. 2014, 72, 4551–4565. [Google Scholar] [CrossRef]
  2. Chen, H.; Zhu, Q.; Peng, C.; Wu, N.; Wang, Y.; Fang, X.; Gao, Y.; Zhu, D.; Yang, G.; Tian, J.; et al. The impacts of climate change and human activities on biogeochemical cycles on the Qinghai-Tibetan Plateau. Glob. Chang. Biol. 2013, 19, 2940–2955. [Google Scholar] [CrossRef] [PubMed]
  3. Chen, S.; Huang, Y.; Gao, S.; Wang, G. Impact of physiological and phenological change on carbon uptake on the Tibetan Plateau revealed through GPP estimation based on spaceborne solar-induced fluorescence. Sci. Total Environ. 2019, 663, 45–59. [Google Scholar] [CrossRef] [PubMed]
  4. Field, C.B.; Behrenfeld, M.J.; Randerson, J.T.; Falkowski, P. Primary Production of the Biosphere: Integrating Terrestrial and Oceanic Components. Science 1998, 281, 237–240. [Google Scholar] [CrossRef] [PubMed]
  5. Luo, Z.; Wu, W.; Yu, X.; Song, Q.; Yang, J.; Wu, J.; Zhang, H. Variation of Net Primary Production and Its Correlation with Climate Change and Anthropogenic Activities over the Tibetan Plateau. Remote Sens. 2018, 10, 1352. [Google Scholar] [CrossRef]
  6. Liu, C.; Dong, X.; Liu, Y. Changes of NPP and their relationship to climate factors based on the transformation of different scales in Gansu, China. Catena 2015, 125, 190–199. [Google Scholar] [CrossRef]
  7. Shi, Z.; Wang, Y.; Zhao, Q.; Zhang, L.; Zhu, C. The spatiotemporal changes of NPP and its driving mechanisms in China from 2001 to 2020. Ecol. Environ. Sci. 2022, 31, 2111–2123. [Google Scholar]
  8. Yang, H.; Zhong, X.; Deng, S.; Xu, H. Assessment of the impact of LUCC on NPP and its influencing factors in the Yangtze River basin, China. Catena 2021, 206, 105542. [Google Scholar] [CrossRef]
  9. Zhang, M.; Lal, R.; Zhao, Y.; Jiang, W.; Chen, Q. Estimating net primary production of natural grassland and its spatio-temporal distribution in China. Sci. Total Environ. 2016, 553, 184–195. [Google Scholar] [CrossRef]
  10. Yu, R. An improved estimation of net primary productivity of grassland in the Qinghai-Tibet region using light use efficiency with vegetation photosynthesis model. Ecol. Model. 2020, 431, 109121. [Google Scholar] [CrossRef]
  11. Zhou, B.; Liao, Z.; Chen, S.; Jia, H.; Zhu, J.; Fei, X. Net Primary Productivity of Forest Ecosystems in the Southwest Karst Region from the Perspective of Carbon Neutralization. Forests 2022, 13, 1367. [Google Scholar] [CrossRef]
  12. Bayat, M.; Bettinger, P.; Heidari, S.; Hamidi, S.K.; Jaafari, A. A Combination of Biotic and Abiotic Factors and Diversity Determine Productivity in Natural Deciduous Forests. Forests 2021, 12, 1450. [Google Scholar] [CrossRef]
  13. Bayat, M.; Burkhart, H.; Namiranian, M.; Hamidi, S.K.; Heidari, S.; Hassani, M. Assessing Biotic and Abiotic Effects on Biodiversity Index Using Machine Learning. Forests 2021, 12, 461. [Google Scholar] [CrossRef]
  14. Prăvălie, R.; Niculiță, M.; Roșca, B.; Marin, G.; Dumitrașcu, M.; Patriche, C.; Birsan, M.; Nita, I.; Tișcovschi, A.; Sîrodoev, I.; et al. Machine learning-based prediction and assessment of recent dynamics of forest net primary productivity in Romania. J. Environ. Manag. 2023, 334, 117513. [Google Scholar] [CrossRef] [PubMed]
  15. Bulut, S.; Günlü, A.; Şatır, O. Estimating net primary productivity of semi-arid Crimean pine stands using biogeochemical modelling, remote sensing, and machine learning. Ecol. Inform. 2023, 76, 102137. [Google Scholar] [CrossRef]
  16. Yan, H.; Ran, Q.; Hu, R.; Xue, K.; Zhang, B.; Zhou, S.; Zhang, Z.; Tang, L.; Che, R.; Pang, Z.; et al. Machine learning-based prediction for grassland degradation using geographic, meteorological, plant and microbial data. Ecol. Indic. 2022, 137, 108738. [Google Scholar] [CrossRef]
  17. Lou, P.; Wu, T.; Yang, S.; Wu, X.; Chen, J.; Zhu, X.; Chen, J.; Lin, X.; Li, R.; Shang, C.; et al. Deep learning reveals rapid vegetation greening in changing climate from 1988 to 2018 on the Qinghai-Tibet Plateau. Ecol. Indic. 2023, 148, 110020. [Google Scholar] [CrossRef]
  18. Friedman, J. Greedy Function Approximation: A Gradient Boosting Machine. Ann. Stat. 2000, 29, 1189–1232. [Google Scholar] [CrossRef]
  19. Chen, T.; Guestrin, C. Xgboost: A scalable tree boosting system. In Proceedings of the 22nd Acm Sigkdd International Conference on Knowledge Discovery and Data Mining, San Francisco, CA, USA, 13–17 August 2016; pp. 785–794. [Google Scholar]
  20. Ke, G.; Meng, Q.; Finley, T.; Wang, T.; Chen, W.; Ma, W.; Ye, Q.; Liu, T. LightGBM: A Highly Efficient Gradient Boosting Decision Tree. Adv. Neural Inf. Process. Syst. 2017, 30, 3149–3157. [Google Scholar]
  21. Wang, T.; Lin, X.; Liu, Y.; Dantec-Nédélec, S.; Ottle, C. Causes of uncertainty in China’s net primary production over the 21st century projected by the CMIP5 Earth system models. Int. J. Climatol. 2016, 36, 2323–2334. [Google Scholar] [CrossRef]
  22. Zhang, X.; Peng, S.; Ciais, P.; Wang, Y.; Silver, J.D.; Piao, S.; Rayner, P.J. Greenhouse Gas Concentration and Volcanic Eruptions Controlled the Variability of Terrestrial Carbon Uptake Over the Last Millennium. J. Adv. Model. Earth Syst. 2019, 11, 1715–1734. [Google Scholar] [CrossRef] [PubMed]
  23. Ren, H.; Zhang, L.; Yan, M.; Tian, X.; Zheng, X. Sensitivity analysis of Biome-BGCMuSo for gross and net primary productivity of typical forests in China. For. Ecosyst. 2022, 9, 100011. [Google Scholar] [CrossRef]
  24. Lu, Y.; Huang, Y.; Zhuang, Q.; Sun, W.; Chen, S.; Lu, J. China’s Terrestrial Ecosystem Carbon Balance During the 20th Century: An Analysis with a Process-Based Biogeochemistry Model. Carbon Balanc. Manag. 2022, 17, 16. [Google Scholar] [CrossRef] [PubMed]
  25. Bonan, G.; Lombardozzi, D.; Wieder, W.; Oleson, K.; Lawrence, D.; Hoffman, F.; Collier, N. Model Structure and Climate Data Uncertainty in Historical Simulations of the Terrestrial Carbon Cycle (1850–2014). Glob. Biogeochem. Cycle 2019, 33, 1310–1326. [Google Scholar] [CrossRef]
  26. Ferro Duarte, H.; Raczka, B.; Ricciuto, D.; Lin, J.; Koven, C.; Thornton, P.; Bowling, D.; Lai, C.; Bible, K.; Ehleringer, J. Evaluating the Community Land Model (CLM4.5) at a coniferous forest site in northwestern United States using flux and carbon-isotope measurements. Biogeosciences 2017, 14, 4315–4340. [Google Scholar] [CrossRef]
  27. Lin, S.; Wang, G.; Hu, Z.; Huang, K.; Sun, J.; Sun, X. Spatiotemporal Variability and Driving Factors of Tibetan Plateau Water Use Efficiency. J. Geophys. Res. Atmos. 2020, 125, e2020JD032642. [Google Scholar] [CrossRef]
  28. Hao, R.; Yu, D.; Huang, T.; Li, S.; Qiao, J. NPP plays a constraining role on water-related ecosystem services in an alpine ecosystem of Qinghai, China. Ecol. Indic. 2022, 138, 108846. [Google Scholar] [CrossRef]
  29. Reich, P.B.; Hobbie, S.E.; Lee, T.D.; Rich, R.; Pastore, M.A.; Worm, K. Synergistic effects of four climate change drivers on terrestrial carbon cycling. Nat. Geosci. 2020, 13, 787–793. [Google Scholar] [CrossRef]
  30. Tu, H.; Jiapaer, G.; Yu, T.; Li, X.; Chen, B. Analysis of spatio-temporal variation characteristics and influencing factors of net primary productivity in terrestrial ecosystems of China. Acta Ecol. Sin. 2023, 43, 1219–1233. [Google Scholar]
  31. Zha, X.; Niu, B.; Li, M.; Duan, C. Increasing Impact of Precipitation on Alpine-Grassland Productivity over Last Two Decades on the Tibetan Plateau. Remote Sens. 2022, 14, 3430. [Google Scholar] [CrossRef]
  32. Zheng, Z.; Zhu, W.; Zhang, Y. Seasonally and spatially varied controls of climatic factors on net primary productivity in alpine grasslands on the Tibetan Plateau. Glob. Ecol. Conserv. 2020, 21, e00814. [Google Scholar] [CrossRef]
  33. Qiu, L.; Liu, X. Sensitivity analysis of modelled responses of vegetation dynamics on the Tibetan Plateau to doubled CO2 and associated climate change. Theor. Appl. Climatol. 2016, 124, 229–239. [Google Scholar] [CrossRef]
  34. Lu, Y.; Yang, X. Using the anomaly forcing Community Land Model (CLM 4.5) for crop yield projections. Geosci. Model Dev. 2021, 14, 1253–1265. [Google Scholar] [CrossRef]
  35. Hurrell, J.; Holland, M.; Gent, P.; Ghan, S.; Kay, J.; Kushner, P.; Lamarque, J.; Large, W.; Lawrence, D.; Marshall, S.; et al. The community earth system model: A framework for collaborative research. Bull. Am. Meteorol. Soc. 2013, 94, 1339–1360. [Google Scholar] [CrossRef]
  36. Lawrence, D.M.; Fisher, R.A.; Koven, C.D.; Oleson, K.W.; Swenson, S.C.; Bonan, G.; Collier, N.; Ghimire, B.; van Kampenhout, L.; Kennedy, D.; et al. The Community Land Model Version 5: Description of New Features, Benchmarking, and Impact of Forcing Uncertainty. J. Adv. Model. Earth Syst. 2019, 11, 4245–4287. [Google Scholar] [CrossRef]
  37. Schädel, C.; Rogers, B.M.; Lawrence, D.M.; Koven, C.D.; Brovkin, V.; Burke, E.J.; Genet, H.; Huntzinger, D.N.; Jafarov, E.; McGuire, A.D.; et al. Earth system models must include permafrost carbon processes. Nat. Clim. Chang. 2024, 14, 114–116. [Google Scholar] [CrossRef]
  38. Raczka, B.; Hoar, T.J.; Duarte, H.F.; Fox, A.M.; Anderson, J.L.; Bowling, D.R.; Lin, J.C. Improving CLM5.0 Biomass and Carbon Exchange Across the Western United States Using a Data Assimilation System. J. Adv. Model. Earth Syst. 2021, 13, e2020MS002421. [Google Scholar] [CrossRef] [PubMed]
  39. Zhang, L.; Ning, F.; Bai, X.; Zeng, X.; He, C. Performance evaluation of CLM5.0 in simulating liquid soil water in high mountainous area, Northwest China. J. Mt. Sci. 2023, 20, 1865–1883. [Google Scholar] [CrossRef]
  40. Luo, Q.; Wen, J.; Hu, Z.; Lu, Y.; Yang, X. Parameter Sensitivities of the Community Land Model at Two Alpine Sites in the Three-River Source Region. J. Meteorol. Res. 2020, 34, 851–864. [Google Scholar] [CrossRef]
  41. Yang, Q.; Zhu, X.; Ou, G.; Ma, L. Estimation of CLM5.0 Parameters for Improving Grassland Productivity Simulation in Hulunburi, Inner Mongolia. In Proceedings of the IGARSS 2023—2023 IEEE International Geoscience and Remote Sensing Symposium, Pasadena, CA, USA, 16–21 July 2023; pp. 3307–3310. [Google Scholar]
  42. Ma, X.; Wang, A. Systematic Evaluation of a High-Resolution CLM5 Simulation over Continental China for 1979–2018. J. Hydrometeorol. 2022, 23, 1879–1897. [Google Scholar] [CrossRef]
  43. Yang, S.; Li, R.; Zhao, L.; Wu, T.; Wu, X.; Zhang, Y.; Shi, J.; Qiao, Y. Evaluation of the Performance of CLM5.0 in Soil Hydrothermal Dynamics in Permafrost Regions on the Qinghai–Tibet Plateau. Remote Sens. 2022, 14, 6228. [Google Scholar] [CrossRef]
  44. Fang, Y.; Liu, C.; Leung, L.R. Accelerating the spin-up of the coupled carbon and nitrogen cycle model in CLM4. Geosci. Model Dev. 2015, 8, 781–789. [Google Scholar] [CrossRef]
  45. Li, F.; Zeng, X.; Song, X.; Tian, D.; Shao, P.; Zhang, D. Impact of spin-up forcing on vegetation states simulated by a dynamic global vegetation model coupled with a land surface model. Adv. Atmos. Sci. 2011, 28, 775–788. [Google Scholar] [CrossRef]
  46. He, J.; Yang, K.; Tang, W.; Lu, H.; Qin, J.; Chen, Y.; Li, X. The first high-resolution meteorological forcing dataset for land process studies over China. Sci. Data 2020, 7, 25. [Google Scholar] [CrossRef] [PubMed]
  47. Rienecker, M.M.; Suarez, M.J.; Gelaro, R.; Todling, R.; Bacmeister, J.; Liu, E.; Bosilovich, M.G.; Schubert, S.D.; Takacs, L.; Kim, G.; et al. MERRA: NASA’s Modern-Era Retrospective Analysis for Research and Applications. J. Clim. 2011, 24, 3624–3648. [Google Scholar] [CrossRef]
  48. Pinker, R.T.; Tarpley, J.D.; Laszlo, I.; Mitchell, K.E.; Houser, P.R.; Wood, E.F.; Schaake, J.C.; Robock, A.; Lohmann, D.; Cosgrove, B.A.; et al. Surface radiation budgets in support of the GEWEX Continental-Scale International Project (GCIP) and the GEWEX Americas Prediction Project (GAPP), including the North American Land Data Assimilation System (NLDAS) project. J. Geophys. Res. Atmos. 2003, 108, D22. [Google Scholar] [CrossRef]
  49. Yang, F.; Lu, H.; Yang, K.; He, J.; Wang, W.; Wright, J.S.; Li, C.; Han, M.; Li, Y. Evaluation of multiple forcing data sets for precipitation and shortwave radiation over major land areas of China. Hydrol. Earth Syst. Sci. 2017, 21, 5805–5821. [Google Scholar] [CrossRef]
  50. Xu, X.; Liu, J.; Zhang, S.; Li, R.; Yan, C.; Wu, S. China Multi-Period Land Use and Land Cover Remote Sensing Monitoring Dataset (CNLUCC); Data Registration and Publishing System of Resource and Environmental Science Data Center, Chinese Academy of Sciences: Beijing, China, 2018. [Google Scholar]
  51. Zeng, J.; Zhou, T.; Xu, Y.; Lin, Q.; Tan, E.; Zhang, Y.; Wu, X.; Zhang, J.; Liu, X. The fusion of multiple scale data indicates that the carbon sink function of the Qinghai-Tibet Plateau is substantial. Carbon Balanc. Manag. 2023, 18, 19. [Google Scholar] [CrossRef]
  52. Liu, Y.; Zhou, R.; Ren, H.; Zhang, W.; Zhang, Z.; Zhang, Z.; Wen, Z. Evaluating the dynamics of grassland net primary productivity in response to climate change in China. Glob. Ecol. Conserv. 2021, 28, e01574. [Google Scholar] [CrossRef]
  53. Xu, H.; Wang, X.; Zhang, X. Alpine grasslands response to climatic factors and anthropogenic activities on the Tibetan Plateau from 2000 to 2012. Ecol. Eng. 2016, 92, 251–259. [Google Scholar] [CrossRef]
  54. Wang, S.; Zhang, B.; Yang, Q.; Chen, G.; Yang, B.; Lu, L.; Shen, M.; Peng, Y. Responses of net primary productivity to phenological dynamics in the Tibetan Plateau, China. Agric. For. Meteorol. 2017, 232, 235–246. [Google Scholar] [CrossRef]
  55. Zhou, W.; Wang, T.; Xiao, J.; Wang, K.; Yu, W.; Du, Z.; Huang, L.; Yue, T. Grassland productivity increase was dominated by climate in Qinghai-Tibet Plateau from 1982 to 2020. J. Clean Prod. 2024, 434, 140144. [Google Scholar] [CrossRef]
  56. Li, L.; Li, H.; Shen, H.; Liu, C.; Ma, Y.; Zhao, Y. The truth and inter-annual oscillation causes for climate change in the Qinghai-Tibet Plateau. J. Glaciol. Geocryol. 2018, 40, 1079–1089. [Google Scholar]
  57. Zhong, R.; Yan, K.; Gao, S.; Yang, K.; Zhao, S.; Ma, X.; Zhu, P.; Fan, L.; Yin, G. Response of grassland growing season length to extreme climatic events on the Qinghai-Tibetan Plateau. Sci. Total Environ. 2024, 909, 168488. [Google Scholar] [CrossRef]
  58. Pang, G.; Wang, X.; Yang, M. Using the NDVI to identify variations in, and responses of, vegetation to climate change on the Tibetan Plateau from 1982 to 2012. Quat. Int. 2017, 444, 87–96. [Google Scholar] [CrossRef]
  59. Liu, H.; Liu, S.; Wang, F.; Liu, Y.; Han, Z.; Wang, Q.; Yu, L.; Dong, Y.; Sun, J. Multilevel driving factors affecting ecosystem services and biodiversity dynamics on the Qinghai-Tibet Plateau. J. Clean. Prod. 2023, 396, 136448. [Google Scholar] [CrossRef]
  60. Zeng, N.; Ren, X.; He, H.; Zhang, L.; Niu, Z. Precipitation Conditions Constrain the Sensitivity of Aboveground Net Primary Productivity in Tibetan Plateau Grasslands to Climate Change. Remote Sens. 2023, 15, 2591. [Google Scholar] [CrossRef]
  61. Li, H.; Wu, Y.; Liu, S.; Xiao, J. Regional contributions to interannual variability of net primary production and climatic attributions. Agric. For. Meteorol. 2021, 303, 108384. [Google Scholar] [CrossRef]
  62. Ye, C.; Sun, J.; Liu, M.; Xiong, J.; Zong, N.; Hu, J.; Huang, Y.; Duan, X.; Tsunekawa, A. Concurrent and Lagged Effects of Extreme Drought Induce Net Reduction in Vegetation Carbon Uptake on Tibetan Plateau. Remote Sens. 2020, 12, 2347. [Google Scholar] [CrossRef]
  63. Gang, C.; Zhou, W.; Chen, Y.; Zhaoqi, W.; Sun, Z.; Li, J.; Qi, J.; Odeh, I. Quantitative assessment of the contributions of climate change and human activities on global grassland degradation. Environ. Earth Sci. 2014, 72, 4273–4282. [Google Scholar] [CrossRef]
  64. Wang, J.; Sun, H.; Xiong, J.; He, D.; Cheng, W.; Ye, C.; Yong, Z.; Huang, X. Dynamics and Drivers of Vegetation Phenology in Three-River Headwaters Region Based on the Google Earth Engine. Remote Sens. 2021, 13, 2528. [Google Scholar] [CrossRef]
  65. Yang, X.; Wu, J.; Chen, X.; Ciais, P.; Maignan, F.; Yuan, W.; Piao, S.; Yang, S.; Gong, F.; Su, Y.; et al. A comprehensive framework for seasonal controls of leaf abscission and productivity in evergreen broadleaved tropical and subtropical forests. Innovation 2021, 2, 100154. [Google Scholar] [CrossRef] [PubMed]
  66. Liu, J.; Ji, Y.; Zhou, G.; Zhou, L.; Lv, X.; Zhou, M. Temporal and spatial variations of net primary productivity (NPP) and its climate driving effect in the Qinghai-Tibet Plateau, China from 2000 to 2020. Chin. J. Appl. Ecol. 2022, 33, 1533–1538. [Google Scholar]
  67. Davidson, E.A.; Janssens, I.A. Temperature sensitivity of soil carbon decomposition and feedbacks to climate change. Nature 2006, 440, 165–173. [Google Scholar] [CrossRef] [PubMed]
  68. He, Y.; Piao, S.; Li, X.; Chen, A.; Qin, D. Global patterns of vegetation carbon use efficiency and their climate drivers deduced from MODIS satellite data and process-based models. Agric. For. Meteorol. 2018, 256–257, 150–158. [Google Scholar] [CrossRef]
  69. Lin, S.; Wang, G.; Feng, J.; Dan, L.; Sun, X.; Hu, Z.; Chen, X.; Xiao, X. A carbon flux assessment driven by environmental factors over the Tibetan Plateau and various permafrost regions. J. Geophys. Res. Biogeosci. 2019, 124, 1132–1147. [Google Scholar] [CrossRef]
  70. Zhang, G.; Zhang, Y.; Dong, J.; Xiao, X. Green-up dates in the Tibetan Plateau have continuously advanced from 1982 to 2011. Proc. Natl. Acad. Sci. USA 2013, 110, 4309–4314. [Google Scholar] [CrossRef]
  71. Shen, M.; Wang, S.; Jiang, N.; Sun, J.; Cao, R.; Ling, X.; Fang, B.; Zhang, L.; Zhang, L.; Xu, X.; et al. Publisher Correction: Plant phenology changes and drivers on the Qinghai–Tibetan Plateau. Nat. Rev. Earth Environ. 2022, 3, 717. [Google Scholar] [CrossRef]
  72. Sun, J.; Du, W. Effects of precipitation and temperature on net primary productivity and precipitation use efficiency across China’s grasslands. GIScience Remote. Sens. 2017, 54, 881–897. [Google Scholar] [CrossRef]
  73. Wang, Y.; Liu, X.; Lv, M.; Zhang, Z. Mechanisms and influencing factors of hydrothermal processes in active layer soils on the Qinghai-Tibet Plateau under freeze–thaw action. Catena 2023, 220, 106694. [Google Scholar] [CrossRef]
  74. Jin, H.; He, R.; Cheng, G.; Wu, Q.; Wang, S.; Lü, L.; Chang, X. Changes in frozen ground in the Source Area of the Yellow River on the Qinghai–Tibet Plateau, China, and their eco-environmental impacts. Environ. Res. Lett. 2009, 4, 45206. [Google Scholar] [CrossRef]
  75. Meng, L.; Wu, J.; Feng, Y.; Niu, B.; He, Y.; Zhang, X. Climate Variability Rather Than Livestock Grazing Dominates Changes in Alpine Grassland Productivity Across Tibet. Front. Ecol. Evol. 2021, 9, 631024. [Google Scholar]
  76. Ren, L.; Huo, J.; Xiang, X.; Pan, Y.; Li, Y.; Wang, Y.; Meng, D.; Yu, C.; Chen, Y.; Xu, Z.; et al. Environmental conditions are the dominant factor influencing stability of terrestrial ecosystems on the Tibetan plateau. Commun. Earth Environ. 2023, 4, 196. [Google Scholar] [CrossRef]
  77. Yuan, Q.; Wu, S.; Dai, E.; Zhao, D.; Ren, P.; Zhang, X. NPP vulnerability of the potential vegetation of China to climate change in the past and future. J. Geogr. Sci. 2017, 27, 131–142. [Google Scholar] [CrossRef]
Figure 1. Geographic location map of the Tibetan Plateau.
Atmosphere 15 00579 g001
Figure 2. Workflow chart.
Atmosphere 15 00579 g002
Figure 3. Comparison of the measured NPP and the NPP simulated by CLM 5.0.
Atmosphere 15 00579 g003
Figure 4. Spatial patterns of NPP simulated by (a) CASA model and (b) CLM 5.0 from 2000 to 2018.
Atmosphere 15 00579 g004
Figure 5. Trends in the simulated NPP by CLM 5.0 from 1979 to 2018.
Atmosphere 15 00579 g005
Figure 6. Spatial trends in NPP in the Tibetan Plateau region for the period 1979–2018 under different environmental factors, white areas indicate invalid values. (a) All factors. (b) Precipitation. (c) Radiation. (d) Temperature.
Atmosphere 15 00579 g006
Figure 7. Spatial trends in NPP in the Tibetan Plateau region for the period 1979–2018 under different environmental factors, the dashed lines represents a linear trend.
Atmosphere 15 00579 g007
Figure 8. (a) Distribution of grasslands with different coverage types in the Tibetan Plateau. (b) Temporal Trends in NPP for grasslands with different coverage types, the dashed lines represents a linear trend.
Atmosphere 15 00579 g008
Figure 9. Trends in NPP for high, medium, and low coverage grasslands under different meteorological factors for the period 1979–2018, the dashed lines represents a linear trend. (a) Precipitation factor. (b) Radiation factor. (c) Temperature factor.
Atmosphere 15 00579 g009
Figure 10. Temporal trends of meteorological factors (precipitation, radiation, temperature) from 1979 to 2018, the dashed lines represents a linear trend.
Atmosphere 15 00579 g010
Table 1. Experimental design.
ExperimentalClimate Factors
TemperaturePrecipitationRadiation
Scenario OneTTT
Scenario TwoCTT
Scenario ThreeTCT
Scenario FourTTC
Note: T represents parameters that change over time, while C represents parameters that are calculated as multi-year averages.
Disclaimer/Publisher’s Note: The statements, opinions and data contained in all publications are solely those of the individual author(s) and contributor(s) and not of MDPI and/or the editor(s). MDPI and/or the editor(s) disclaim responsibility for any injury to people or property resulting from any ideas, methods, instructions or products referred to in the content.