Abstract
This study investigates the influences of air temperature (T), relative humidity (RH), wind speed (WS), clearance index (KT), particulate matter (PM) concentrations (PM10 and PM2.5), and aerosol optical depth (AOD) on ultraviolet (UV) radiation during clear skies in Riyadh, central Saudi Arabia. The observational dataset utilized in this study comprises global solar radiation (G), UVA radiation, AOD measurements, and PM concentrations. The data were collected from 2014 to 2015 at the King Abdulaziz City for Science and Technology (KACST) campus in Riyadh. Regression analyses were conducted to investigate the relationships between UV radiation and the considered variables. The methodology is based on the least square method and associated statistical tests. The findings of this study provide valuable insights into the impacts of meteorological variables and aerosols on UV radiation, contributing to the understanding of environmental and industrial applications in the Arabian Peninsula. The analyses showed that the strengths and magnitudes differed from one variable to another. No significant correlations between UVA radiation (315–400 nm) and hourly and daily values of PM2.5 were found. Moreover, no significant correlations were seen between daily values of the UVA radiation and RH and between the UVB (280–315 nm) and PM10. The rest of the correlations (between UV radiation and the PM10 and meteorological variables) were found to be significant. While WS, the ratio of the PM concentrations (PM2.5/PM10), KT, and T exhibited positive correlations with UV radiation, the rest of the variables had anti-correlations with UV radiation. The influences of T, WS, and RH on ambient PM concentrations during the considered period were taken into account, and it was found that the PM concentrations correlate, with different magnitudes and strengths, positively with T and negatively with RH and WS.
1. Introduction
Solar ultraviolet (UV) radiation (between 200 and 400 nm) represents less than 10% of the total solar radiation reaching the Earth’s surface by traveling through the atmosphere [1]. This small spectral band is divided into UVA (315–400 nm), UVB (280–315 nm), and UVC (100–280 nm). While UVC and most of UVB are absorbed by stratospheric ozone, UVA and part of UVB reach the surface. The UVA band accounts for more than 90% of the total UV global irradiance, which is shorter than 0.400 m, while the remainder is UVB [1,2].
UV radiation involves different chemical and biological processes in the lower atmosphere and at the Earth’s surface and plays important roles in several environmental and industrial applications related to its effects on human health and plant life, as well as a wide range of technological and scientific applications such as tropospheric chemistry, agriculture, and oceanography. Moreover, UV radiation also impacts the global energy balance and climate change; hence, understanding the variations and factors that affect UV radiation is of great importance [3,4,5,6,7].
UV radiation is affected by the path length of the direct solar beams through the Earth’s atmosphere (solar zenith angle), clouds, ozone, clearance index (KT), day of the year, aerosols, and surface albedo. Several statistical models related to clear-sky UV radiation with the above-mentioned variables have been proposed in the literature [8,9,10,11,12,13,14].
Under cloudless sky conditions, it has been found that UV radiation is strongly affected by the solar zenith angle and/or the KT, as well as atmospheric aerosols [15]. Atmospheric aerosols (gases and particles) affect UV radiation through the scattering and absorption processes and, thus, modulate the amount of clear-sky UV radiation. The study by Hu et al. [15] offers a comprehensive and insightful analysis of the impact of aerosols on broadband solar radiation in North China. The findings of this research have significant implications for the development of effective strategies to address air pollution and promote solar energy in the region. Notably, the study found that aerosol particles have a significant impact on reducing the amount of sunlight that reaches the Earth’s surface in North China. The authors observed a clear seasonal trend in the impact of aerosol on solar radiation, with the most significant reduction occurring during the summer months.
Furthermore, in other countries, several studies have been conducted to investigate the relationship between UV radiation and factors such as solar elevation, total ozone column, and sky conditions, e.g., refs. [2,16,17,18,19,20,21,22,23]. These studies have contributed to our understanding of UV radiation patterns. For instance, research by Liu et al. [24], Hu et al. [25], and Hu et al. [26] consistently suggests higher levels of UV radiation in certain parts of Asia, particularly the Tibetan Plateau and other arid or semi-arid regions of China. Additionally, investigations have explored the correlation between UV radiation and solar elevation, ozone column, and sky conditions. Assessments of aerosols, ozone levels, and solar ultraviolet irradiance in the troposphere have been conducted [27], and enhancements to algorithms for calculating ultraviolet irradiance at different altitudes have been proposed [28]. Moreover, research has revealed the presence of 1/f noise in UV irradiance, indicating persistent long-range power-law behavior in solar spectral irradiance fluctuations [29]. Investigations into the impacts of eclipses on surface ozone concentration and UV radiation have demonstrated reductions in these levels during eclipse occurrences [30]. Furthermore, studies have indicated that reductions in ozone levels lead to an increase in erythemally active UV-B irradiance [31].
Despite the significance of these studies, a notable research gap remains regarding the effect of atmospheric aerosols on UV components (UVA and UVB) in the Arabian Peninsula. While several experimental studies have been conducted in other regions, the impact of aerosols on UV radiation in the Arabian Peninsula, particularly under clear-non-dusty conditions, has not been thoroughly examined. Therefore, conducting additional experimental studies in arid regions such as central Saudi Arabia is imperative to enhance our understanding of the magnitude of this effect. These studies will contribute to filling the existing knowledge gap and provide new insights into the factors that influence UV radiation in regions characterized by distinct climatic and environmental conditions.
The present study aims to characterize the variations in UV radiation using four years of observations under non-dusty clear-sky conditions. It investigates the impact of parameters such as air temperature (T), relative humidity (RH), clearance index (KT), fine aerosols (PM2.5) and coarse aerosols (PM10), and aerosol optical depth (AOD) on UV radiation. By providing new insights into the factors that affect UV radiation in arid regions, particularly in the Arabian Peninsula, this research addresses the lack of quantitative evaluation of the effect of atmospheric aerosols in this region. Consequently, this study contributes to improving the existing knowledge and understanding of the magnitude of the effect of aerosols on UV radiation in arid conditions, which have not been extensively studied in the literature.
2. Data and Methodology
2.1. Site Description
Riyadh (24.35 N, 46.42 E, 620 m) is the capital, largest, and most populated city in Saudi Arabia. It is located in the center of the Arabian Peninsula and has a hot, arid, desert climate. In summer, usually, a very low humidity climate is recorded, and the mean daytime temperature is between 43 °C and 46° C, with some days even exceeding 51 °C. During winter, the climate is warm, with cool, windy nights. The mean temperature at night is within the range of 10–14 °C. Zero temperatures are rare for Riyadh. The large temperature variations between the seasons are caused by the arid conditions and the prevalence of continentality. Riyadh is also characterized by high-frequency dust storm events and occurrences of moderate rainfall, particularly during the pre-monsoon season [32,33,34,35,36,37].
2.2. Ultraviolet Radiation
The observational dataset analyzed here comprises global solar radiation (G) and ultraviolet radiation (UVA). The measurements were taken by a radiometric station installed in January 2014 on the rooftop of the radiation detector laboratory building in the King Abdulaziz City for Science and Technology (KACST) campus, Riyadh. Global radiation was measured with a Skye Pyranometer model SKS 1110 sensor with a spectral response between 400 and 1100 nm and a 180° field of view. SKU 421 radiometers were used to measure UVA and UVB (Skye instruments, 2014). The three sensors measure the radiation of the entire hemisphere after the cosine effect is corrected. The incident radiation perpendicular to the sensor is fully measured, and the radiation incident at an angle greater than 87° is rejected [36]. Detailed explanations of this topic are included in the instrument handbook provided by the manufacturer (Skye instruments, 2015, London, UK).
2.3. Aerosol Optical Depth (AOD)
AOD measurements were taken using a CIMEL sunphotometer (CE-318) installed in 1999 at the AERONET site, Solar Village, Riyadh (24.91° N, 46.41° E, 764 m asl), Saudi Arabia. The station stopped operation in 2015. The instrument is an automatic tracking radiometer that makes direct solar measurements with a 1.2° full-field-of view every 15 min at nine wavelengths. A detailed description of the instrument, the data acquisition, the retrieval algorithms, and the calibration procedure can be found elsewhere (e.g., refs. [30,32]). In this study, the hourly averaged Level 1.5 products of the AOD at 500 nm were used [36,38]. The UV radiation for the period between 2014 and 2015 and the corresponding AOD measurements were used.
2.4. Particulate Matter
The concentrations of PM10 and PM2.5 were measured using beta attenuation monitors (BAM 1020, Met One Instruments, Grants Pass, OR, USA) based on the principle of the beta ray attenuation method. In this study, two monitors were used, each one featuring a size-selective inlet, a beta radiation source and detector, and a filter tape. The PM10 and PM2.5 were sampled through the respective size-selective inlet installed in each monitor and deposited on a single point of filter tape. The masses of deposited PM10 and PM2.5 were determined by calculating the difference between the beta radiation transmitted through the filter tape before and after acquiring the PM10 and PM2.5 samples.
2.5. Data Quality Control and Methodology
The UV data were limited to those with solar elevation angles greater than 10° in order to avoid problems associated with deviations of the measurement instrument from the ideal cosine law, and observations for which horizontal solar global irradiance was less than 20 W/m2 were rejected.
The UV radiation data whose values were greater than the corresponding extraterrestrial radiations (UV0) at the site of observation were then excluded; the rest were included in the database (e.g., refs. [12,14]). The sky conditions were selected according to the clearness index (KT). The KT is the ratio of G to extraterrestrial irradiance on a horizontal surface (KT = G/G0). The extraterrestrial radiations of global and UV radiation were obtained from the two following equations, respectively (e.g., refs. [1,36,39]):
Here, S0 is the solar constant for the global radiation ~1361 Wm−2, and UVsc is the solar constant for the ultraviolet wavelength ~80.3 Wm−2 [39,40]. L0 represents the correction factor of the Earth’s orbit; δ is solar declination; γ is the sunrise-hour angle; ϕ is the geographic latitude.
Several KT values have been adopted by several investigators to characterize the clear-sky conditions. These values range between 0.5 and 0.7. In this study, clear-sky conditions were considered if the KT value was greater than 0.5. Moreover, clear-sky times were selected based on the cloud information provided by the Saudi Presidency of the Environment (SPE). The cloud coverage was required to be less than two oktas while taking measurements.
Dusty periods were determined using the synoptic information provided by the SPE and excluded. Additionally, this exclusion was also conducted using the procedures developed by Alharbi [28].
Using the above-mentioned quality control procedures, a total of 16,022 h of clear-sky measurements during the study period were selected.
Meteorological data such as atmospheric pressure, RH, wind speed and directions, and T were measured using the Skye MiniMet Station [41], which had different meteorological sensors and was installed at the same place as the UV sensors.
The least square method and associated statistical tests were used in this study to investigate the relationship between UV radiation and the considered variables.
3. Results
3.1. General Properties of the UV Radiation and the Considered Variables
Figure 1 shows the frequency distributions for the hourly values of the considered variables.
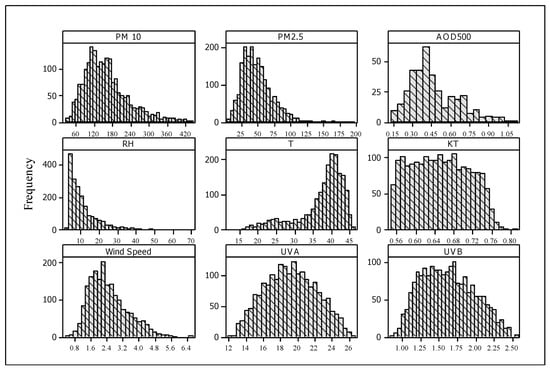
Figure 1.
The frequency distribution of the clear-sky hourly values for the considered variables during 2015–2019. UVA and UVB are in (W/m2), PM10 and PM 2.5 are in (μg/m3), T in (°C), RH in (%), and wind speed in (m/s).
The UVA under clear-sky conditions has an almost normal distribution with a mean of 19.17 ± 2.98 W/m2. The UVB values range between 0.8 W/m2 and 2.55 W/m2 with a mean of 1.6 ± 0.35 W/m2, and the UVB curve is almost the same shape as the UVA curve.
The coarse aerosol (PM10) curve is slightly skewed to the right (skewness is 1.03) and kurtosis (tailed) by 1.08. It has a mean value of 156.26 ± 73 μg/m3 with a maximum of 438 μg/m3 and a minimum of 26 μg/m3. On the other hand, the fine aerosol (PM2.5) has a distribution with a mean of 48.68 ± 23.46 μg/m3, ranging between 5.0 and 214.57 μg/m3. The distribution is similar to that of the PM10 curve, with a skewness of 1.16 and a higher kurtosis of 3.1. The distribution curve of AOD has a skewness of 0.85 and a kurtosis of 0.32. The maximum, mean, and minimum values of the AOD were 1.08, 0.46 ± 0.19, and 0.13, respectively. The wide variation in the PM concentrations and AOD values over these ranges reveals the presence of different types of particles, either from local background conditions, which reflect the effect of anthropogenic activities in Riyadh or from natural sources around the region.
The T and KT are 37.26 ± 6.40 °C and 0.64 ± 0.06, respectively. The temperature distribution is highly skewed to the left, and it ranges between 12.03 and 46.22 °C. KT has a small skewness of 0.10 and ranges between 0.55 and 0.81. Relative humidity, on the other hand, ranges between 1.82 and 69.33% with a mean value of 10.80 ± 8.10% and with a skewness of 1.89.
3.2. Relationship between UV Radiation and the Considered Variables
UV radiation levels are influenced by a range of meteorological factors, including cloud cover, temperature, relative humidity, air pressure, and altitude. These factors can significantly impact the strength and magnitude of the correlations between UV radiation and other variables, such as atmospheric pollutants and particulate matter (PM). In this study, we investigated the relationship between UV radiation and PM concentrations, along with other meteorological variables such as KT, T, RH, WS, and AOD at 500 nm (AOD500), using regression analyses between the hourly and daily mean values of these variables. Our results reveal that both hourly and daily UVA and UVB values exhibit significant anti-correlations with PM10 concentrations, with hourly UVA values decreasing by 4 × 10⁻³ W/m2 and hourly UVB values decreasing by 2.7 × 10⁻⁴ W/m2 for every 1μg/m3 increase in PM10. Similarly, daily UVA values decrease by 9 × 10⁻³ W/m2, and daily UVB values decrease by 11 × 10−4 W/m2 for every 1 μg/m3 increase in PM10. The regression analyses between the hourly and daily mean values of the UV radiation (UVA and UVB) and the PM concentrations (PM10, PM2.5), KT, T, RH, WS, and AOD at 500 nm (AOD500) were carried out, and their results are presented in Table 1. The strength and magnitude of these correlations are different for each variable and each time scale (hourly and/or daily).

Table 1.
The regression equations, root mean square errors (RMSEs), and correlation coefficients between the hourly and daily UVA and UVB and the considered variables.
Figure 2 is a scatter plot that shows the relationship between the hourly data of the UV radiation (A and B) and the considered variables. From the figure, it is evident that there are wide spreads in the data for certain values of the considered variables. For instance, at T of 40 °C, UVA radiation ranges between 12 W/m2 and 26 W/m2. Similarly, at PM10, the value of 100 µg/m3 UVB ranges between 0.8 and 2.5 W/m2. This gap can be explained in several ways, including the dependence of the UV radiation on one or more other factors than only the considered variable. The RH and T data are mainly concentrated within the ranges of below 20% and above 38 °C, respectively.
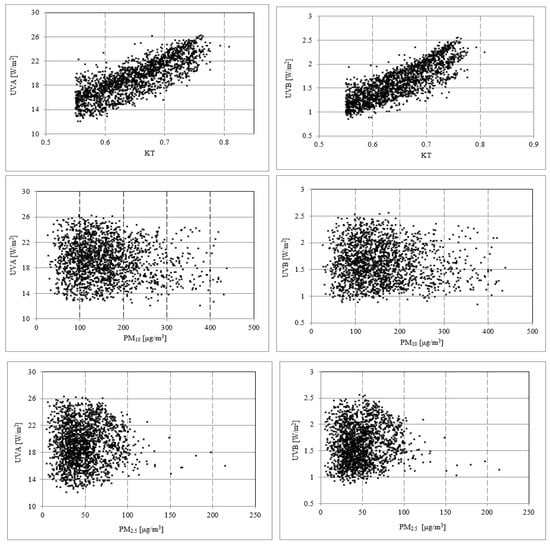
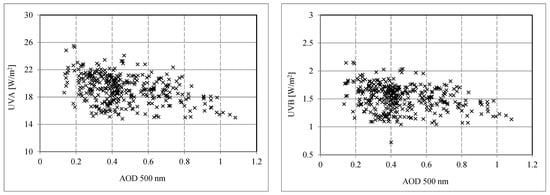
Figure 2.
The relationship between the hourly values of the clear-sky UV radiation (UVA and UVB) and the considered variables.
3.2.1. Correlations between UV Radiation and PM Concentrations
Our results reveal that both hourly and daily UVA and UVB values exhibit significant anti-correlations with PM10 concentrations, with hourly UVA values decreasing by 4 × 10⁻³ W/m2 and hourly UVB values decreasing by 2.7 × 10⁻⁴ W/m2 for every 1 μg/m3 increase in PM10. Similarly, daily UVA values decrease by 9 × 10⁻³ W/m2, and daily UVB values decrease by 11 × 10−4 W/m2 for every 1 μg/m3 increase in PM10. No significant correlations were observed between UVA radiation and hourly or daily values of PM2.5, while the ratio of the PM concentrations (PM2.5/PM10) exhibited positive correlations with UV radiation. The daily and hourly UVA radiation increases significantly by 2.05 W/m2 and 6.05 W/m2, respectively, with the ratio of PM2.5/PM10. Hourly UVB radiation, on the other hand, increases by 0.29 W/m2 for every 0.1 increase in this ratio and by 1.24 W/m2 when the daily mean values are considered. These correlations provide important insights into the impact of PM concentrations on UV radiation. The relationships between PM2.5/PM10 and UVA and UVB are presented in Figure 3. It can be seen that coarse particles were predominant in Riyadh, with a PM2.5/PM10 mass ratio of less than 0.50 for the majority of the measurements. However, the figure implies that a ratio of 0.5 or above (when the PM10 distribution was dominated by smaller particles) is somewhat suggestive of some dependence of UV levels on the relative abundance of PM2.5 compared to PM10.
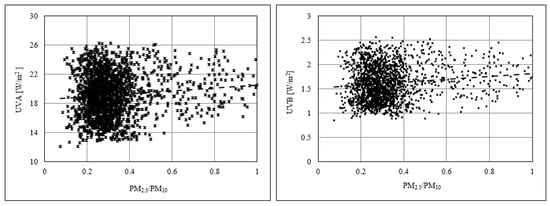
Figure 3.
The relationship between the hourly values of the clear-sky UV radiation (UVA and UVB) and the PM2.5/PM10 ratio.
To investigate this, the correlation between PM10 and PM2.5 is examined in Figure 4, which shows a moderate correlation (R2 = 0.37). However, improved and stronger correlations were obtained when the correlation between PM10 and PM2.5 was reexamined by considering two levels of PM2.5/PM10 ratios (less than 0.5 and 0.5 and above).
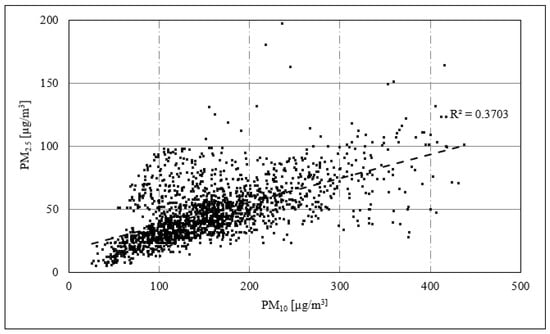
Figure 4.
Scatter plot showing the correlation between PM10 and PM2.5.
Based on these two levels of ratios, the correlations between PM10 and PM2.5 improved to 0.62 and 0.64 for ratio levels less than 0.5 and 0.5 and above, respectively (Figure 5). The higher ratio of PM2.5/PM10 (≥0.5) could be a result of the relative abundance of primary fine particles (PM2.5) emitted from combustion processes or secondary particles formed in the atmosphere, such as sulfate and nitrate particles. On the other hand, the lower ratio of PM2.5/PM10 (˂0.5) could be a result of the relative abundance of coarse particles that are naturally found in the regional arid environment or anthropogenically generated by mechanical means such as stone-crushing activities and construction activities. Therefore, based on these two levels of ratios and the selected PM10 pollution indicative value greater than 100 µg/m3, the correlations between UV levels and PM2.5/PM10 were reexamined (Figure 6a,b). These figures show that the hourly values of both UVA and UVB correlated positively with the lower PM2.5/PM10 (˂0.5) ratio when the PM10 concentration is greater than 100 µg/m3, but they correlated negatively with the higher ratio of PM2.5/PM10 (≥0.5). This suggests that the UV levels decrease when the PM10 distribution is dominated by PM2.5, while the UV levels increase when the PM10 distribution is dominated by coarse particles.
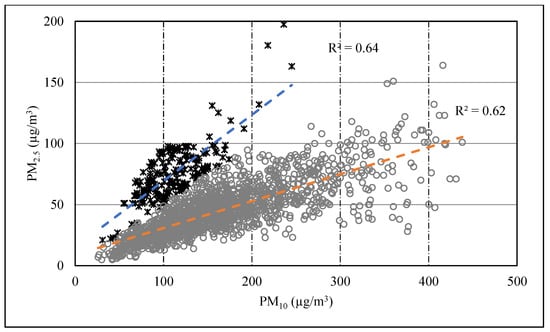
Figure 5.
Improved and stronger correlations between PM10 and PM2.5 considering two levels of PM2.5/PM10 ratios (less than 0.5 or 0.5 and above).
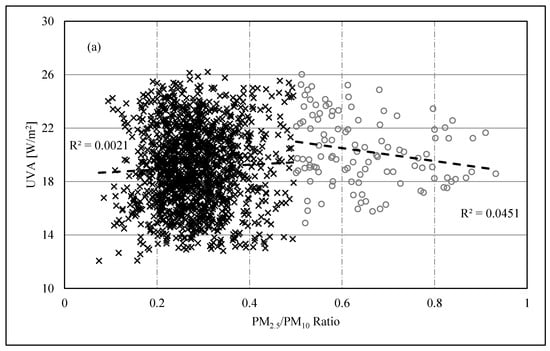
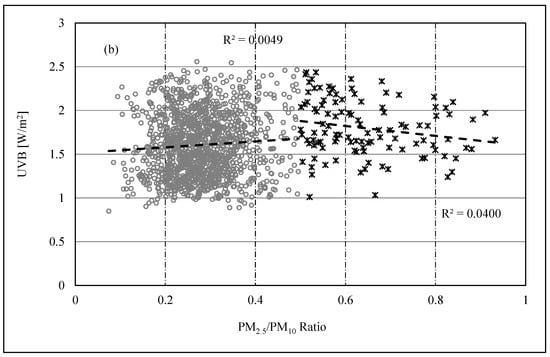
Figure 6.
The correlations between the hourly values of (a) UVA and PM2.5/PM10 and (b) UVB and PM2.5/PM10.
3.2.2. Correlations between UV Radiation and Meteorological Variables
We observed various correlations between UV radiation and meteorological variables such as KT, T, RH, and WS. For instance, while WS, KT, and T exhibited positive correlations with UV radiation, we found that RH had anti-correlations with UV radiation. These correlations indicated the influence of meteorological conditions on UV radiation.
Correlation coefficients with values less than 0.3 were found when the UV radiation (UVA and UVB) were correlated with RH and T. While the daily values of the UVA display no significant relationship with RH, the hourly values of the UVA and UVB and the daily values of the UVB exhibit low and significant correlations with RH and T. In the ranges of the RH values found in Riyadh, the hourly values of the UVA and UVB radiation decrease by 6.6 × 10⁻² W/m2 and 1.1 × 10⁻² W/m2, respectively, with a 1% increase in RH. On the other hand, the hourly and daily values of the UVA increase by 10 × 10−2 W/m2 and 51 × 10−3 W/m2, respectively, with a 1 °C increase for T. Hourly values of the UVB radiation increase by 1 × 10⁻² W/m2 and daily values by 9.2 ×10⁻² W/m2 when T increases by 1 °C.
For the WS, most of the data are concentrated within the range of 1.5–2.5 m/s. Daily correlations of the UV radiation with WS exhibited a better correlation than the hourly values. The correlation coefficients are in the range of 0.36 in the case of the daily values compared with the 0.2 values found by the hourly data. For the UVA radiation, by increasing WS by 1 m/s, the hourly and daily values of the UVA radiation rise by 46 × 10−2 W/m2 and 1.46 W/m2, respectively. This increase in the WS corresponds to an increase in the hourly UVB radiation by 5 × 10⁻² W/m2 and the daily mean values by 17 × 10−2 W/m2.
The strongest correlation is among the hourly values of the UVA and UVB radiation and the KT, with correlation coefficients of 0.8 and 0.82, respectively. When the daily mean values were used, these coefficients decreased to 0.56 and 0.66, respectively.
Hourly and daily UVA radiation increases by 40.2 W/m2 and 31.4 W/m2, respectively, as the KT increases by 0.1. The same increase in the KT results in the hourly and daily UVB values increasing by about 3–5 W/m2.
3.2.3. Influence of Aerosol Optical Depth (AOD) on UV Radiation
The relationship between AOD and UV radiation was also analyzed, showing moderate anti-correlations with UV radiation. The daily and hourly values of the AOD exhibit moderate anti-correlations (0.26 < R < 0.52) with UV radiation. These correlations, while there are spreads in the data, are stronger than those with the PM concentrations. This was partially due to the fact that the AOD represents the total aerosol content, while PM concentrations represent the amount of the aerosol present at the ground level of a specific size (2.5 and/or 10 microns).
With correlation coefficients of 0.36 and 0.52, respectively, the hourly and daily UVA radiation correlated with the AOD with a decrease of about 3–4 W/m2 in the hourly and daily values of the UVA for every 1 increase in the AOD. For about 0.3 W/m2, the hourly and daily mean values of the UVB decrease for a 1 increase in the AOD.
The spread in the relationship between AOD and UV radiation may be caused by several factors. These include the amount of aerosol, its chemical composition, its physical characteristics, and the prevailing atmospheric conditions. Moreover, the dependence of UV radiation on other atmospheric and meteorological factors may be additional factors that cause these spreads in these relationships (e.g., refs. [36,38,42,43,44,45]).
3.2.4. Effects of Atmospheric Aerosols on UV Radiation Using Theoretical Simulations
The effect of atmospheric aerosols on UV radiation was further investigated theoretically using the Simple Model of Atmospheric Radiative Transfer of Sunshine (SMARTS) code [40]. First, the UV radiation values were calculated at four different atmospheric models, including rural, urban, maritime, and continental. For AM = 1.5, AOD = 0.4, and all the other parameters left for the mid-latitude atmosphere, the results of the simulation show that the UVA and UVB were reduced by 19% and 23% when the urban aerosol was used as compared to the use of the rural aerosol type. These reductions increased by 23% for the UVA and 29% for the UVB when the urban aerosol was used as compared to the maritime aerosol type.
The effect of a load of atmospheric aerosols on the UV radiation was investigated using the standard mid-latitude atmosphere at three air masses (AM = 1, 1.5, and 2). The AOD varied between 0.1 and 4 with 0.1 increments, and the results are presented in Figure 7. It is clear that for AOD values greater than 3, the effect of AM on the UV radiation disappeared. For all the AM values, the UV radiation decreased linearly from AOD = 0.1 to 1.2, which then decreased exponentially from AOD =1.4 to 4. For instance, we found that the UVA radiation decreased by about 5% with an increase in the atmospheric turbidity from 0.1 to 4. It can be seen that there is an agreement between the experimental results and those found in the theoretical investigations in the literature.
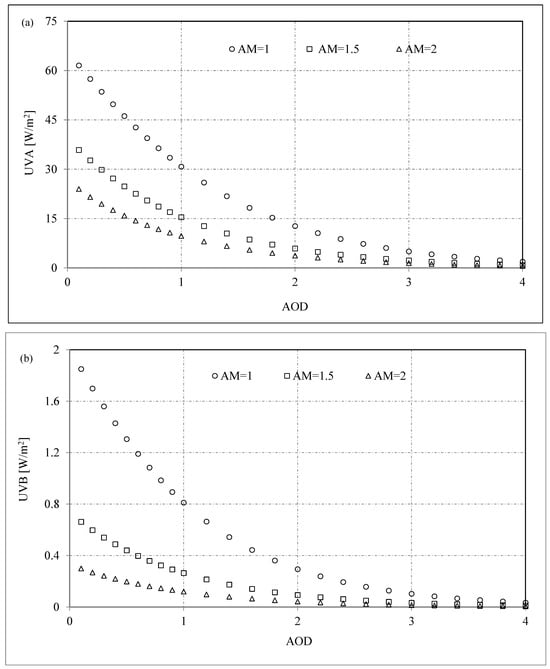
Figure 7.
The relationship between the AOD and the (a) UVA and (b) UVB radiation for AM = 1, AM = 1.5, and AM = 2 was determined through SMART simulations.
3.3. Discussions
The spread in the data in the relationship between the UV radiation and the meteorological variables (RH, T, and WS) may have been caused by a number of reasons. These include the dependence of UV radiation on other variables such as ozone concentration, solar zenith angle variations, and atmospheric conditions. Moreover, the spread in the relationship between UV radiation and the PM concentrations is attributed to the nature of the PM concentrations, which are mixtures of several compounds whose behavior depends on the diffusion conditions, transport, and formation that contribute to the total PM concentrations in different ways. This contribution is also affected by several factors, such as variations in the local sources, atmospheric conditions, and natural sources found around the study region (e.g., dust storms from these sources). Meteorological conditions that affect PM, such as temperature, precipitation, atmospheric stabilities, wind speed and direction, and RH, can significantly influence the variations in PM levels. However, all these factors do not have the same impact during the same period of time [9,45,46,47,48,49,50,51,52,53].
Here, the effect of RH, T, and WS on the PM concentrations will be investigated.
Figure 8 is an example that shows the relationship between the daily mean values of the PM concentrations and the metrological variables of T, RH, and WS. The results of the correlation analyses between the PM concentrations and each variable, as well as all the combined variables, are presented in Table 2.
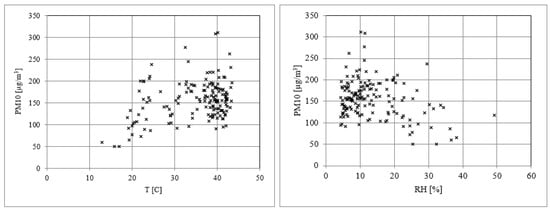
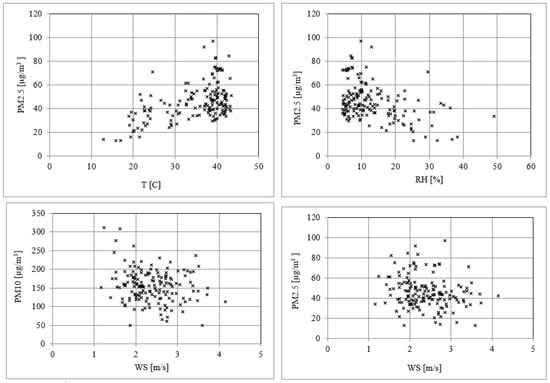
Figure 8.
The relationship between the daily mean values of the clear-sky PM concentrations (PM10 and PM2.5) and the considered variables during the study period.

Table 2.
The regression equations, RMSE, and correlation coefficients between the hourly values of PM10 and PM2.5 and the considered variables.
While there are some spreads in the data, it is evident that the PM concentrations correlated positively with T and negatively with RH and WS. However, the magnitudes and strengths of these relationships are different for each variable.
While the correlation coefficients range between low and moderate (0.2 < R < 0.52), all the correlations were statistically significant with p < 0.05. The RMSE for the correlations between PM10 and PM2.5 and the considered variables are between 41 and 40 μg/m3 and between 13 and 16 μg/m3, respectively. The multivariable regressions (all the variables) do not show much improvement in RMSE values in comparison to the single-variable models. The correlations between PM2.5 and T and RH correspond to the highest correlation coefficients, 0.52 and 0.41, respectively. The correlations between PM10 and both the variables show almost the same RMSE and correlation coefficients. The WS, when correlated with PM10, has an RMSE of 43.02 μg/m3 and 15.20 μg/m3 with PM2.5, with almost the same correlation coefficients. Under unstable atmospheric conditions, an increase in T could increase the gusts and winds, which leads to a rise in the diffusion of particulate matter. Moreover, variations in T can affect the formation of particles; thus, a high temperature can promote the photochemical reaction between precursors.
The relationship between the RH and PMs may have been caused by the particles accumulating due to moisture that leads to the dry deposition of the particles on the ground. The negative correlation between PM2.5 and WS can be explained by the fact that when the WS is high enough, it can transport large quantities of pollutants from far away.
However, these relationships may also be affected by the season, day and night variations, and the time of the year.
The data in the discussion above indicate that meteorological conditions can affect the concentration of particulate matter. This, in turn, affects the relationship between this particulate matter and UV radiation [17,54,55,56,57,58,59,60].
4. Conclusions
The relationship between UV radiation (UVA and UVB), T, RH, WS, KT, particulate concentrations (PM10 and PM2.5), and the AOD were investigated under cloudless (clear sky), non-dusty conditions using four years of measurements. To the best of our knowledge, this is the first work that has studied the effect of atmospheric aerosols, particularly particulate matter, on UV radiation in an arid site in the Arabian Peninsula. Several conclusions can be drawn from this study. They are listed as follows:
- The degree of association and the magnitude between UV radiation and the considered variables were found to be different from one variable to another.
- No significant correlation was found between UVA and PM2.5.
- T, WS, KT, and PM2.5/PM10 ratios correlate positively with UV radiation, whereas RH, PM10, and AOD are anti-correlated with UV radiation.
- The effect of atmospheric aerosols on UV radiation was investigated theoretically using the SMART code, exhibiting agreement with the experimental results.
- Apart from KT, which exhibited less scatter with the UV radiation, the spreads were rather wide between the UV radiation and the rest of the considered variables. There are several reasons for these scatters, including the large-scale atmospheric factors and the effect of meteorological conditions, specifically on the particulate matter concentrations.
- The last hypothesis was investigated by evaluating the effect of T, RH, and WS on the particulate matter using regression analysis.
- It was found that the PM concentrations correlated positively with T and negatively with RH and WS.
- The obtained results were in agreement with those obtained previously by several other investigators.
Based on these conclusions, future research should focus on the following areas to expand the understanding of UV radiation and its interactions with atmospheric variables and particulate matter:
- -
- Further investigation into the specific mechanisms driving the observed correlations between UV radiation, T, RH, WS, KT, and particulate matter concentrations to gain deeper insights into the complex relationships.
- -
- Enhanced study of the impact of aerosols on UV radiation in different geographical locations to assess regional variations and broaden the understanding of the factors influencing UV radiation under various climatic conditions.
- -
- Continued exploration of the theoretical models and simulations that incorporate a wide range of aerosol and atmospheric factors to provide a more comprehensive understanding of UV radiation interactions.
Author Contributions
All authors contributed to the study’s conception and design. Material preparation, data collection, and analysis were performed by A.M., B.A. and A.A. The first draft of the manuscript was written by A.M., and all authors commented on it for its improvement. All authors have read and agreed to the published version of the manuscript.
Funding
This research received no external funding.
Institutional Review Board Statement
Not applicable.
Informed Consent Statement
Not applicable.
Data Availability Statement
The datasets analyzed during the current study are not publicly available due to the organization’s (KACST) policies but are available from the corresponding author upon reasonable request.
Acknowledgments
The authors would like to thank King Abdulaziz City for Science and Technology (KACST) for supporting this work.
Conflicts of Interest
The authors declare no conflict of interest.
References
- Iqbal, M. An Introduction to Solar Radiation; Academic Press: New York, NY, USA, 1983. [Google Scholar]
- Zerefos, C.S.; Bais, A.F. Solar Ultraviolet Radiation, Modeling, Measurements and Effects; Springer: New York, NY, USA, 1997. [Google Scholar]
- Diffey, B. Solar ultraviolet effects on biological systems. Phys. Med. Biol. 1991, 36, 299–328. [Google Scholar] [CrossRef]
- Casale, G.R.; Meloni, D.; Miano, S.; Palmieri, S.; Siani, A.M.; Cappellani, F. Solar UV-B irradiance and total ozone in Italy: Fluctuations and trends. J. Geophys. Res. 2000, 105, 4895–4901. [Google Scholar] [CrossRef]
- He, Y.; Zheng, Y.; He, D. A summary of research on the effects of enhanced ultraviolet radiation on field ecosystems. Chin. J. Agrometeorol. 2002, 1, 47–52. [Google Scholar]
- MacKie, R. Long-term health risk to the skin of ultraviolet radiation. Prog. Biophys. Mol. Biol. 2006, 92, 92–96. [Google Scholar] [CrossRef] [PubMed]
- Fioletov, V.; McArthur, L.; Mathews, T.; Marrett, L. On the relationship between erythemal and vitamin D action spectrum weighted ultraviolet radiation. J. Photochem. Photobiol. B Biol. 2009, 95, 9–16. [Google Scholar] [CrossRef]
- Van Heuklon, T.K. Estimating atmospheric ozone for solar radiation models. Sol. Energy 1979, 22, 63. [Google Scholar] [CrossRef]
- Easter, R.C.; Peters, L.K. Binary homogeneous nucleation: Temperature and relative humidity fluctuations, nonlinearity, and aspects of new particle production in the atmosphere. J. Appl. Meteorol. 1994, 33, 775–784. [Google Scholar] [CrossRef][Green Version]
- McKenzie, R.L.; Kotkamp, M.; Ireland, W. Upwelling UV spectral irradiances and surface albedo measurements at Lauder, New Zealand. Geophys. Res. Lett. 1996, 23, 1757–1760. [Google Scholar] [CrossRef]
- Wuttke, S.; Seckmeyer, G.; König-Langlo, G. Measurements of spectral snow albedo at Neumayer, Antarctica. Ann. Geophys. 2006, 24, 7–21. [Google Scholar] [CrossRef]
- Foyo-Moreno, I.; Alados, I.; Olmo, F.; Alados-Arboledas, L. The influence of cloudiness on UV global irradiance (295–385 nm). Agric. For. Meteorol. 2003, 120, 101–111. [Google Scholar] [CrossRef]
- Kaskaoutis, D.; Kambezidis, H.; Jacovides, C. Steven Modification of solar radiation components under different atmospheric conditions in the Greater Athens Area, Greece. J. Atmos. Sol. -Terr. Phys. 2006, 68, 1043–1052. [Google Scholar] [CrossRef]
- Martinez-Lozano, J.; Tena, F.; Utrillas, M. Ratio of UV to global broad band irradiation in Valencia, Spain. Int. J. Clim. 1999, 19, 903–911. [Google Scholar] [CrossRef]
- Hu, B.; Zhao, X.; Liu, H.; Liu, Z.; Song, T.; Wang, Y.; Tang, L.; Xia, X.; Tang, G.; Ji, D.; et al. Quantification of the impact of aerosol on broadband solar radiation in North China. Sci. Rep. 2017, 7, srep44851. [Google Scholar] [CrossRef]
- Al-Aruri, S. The empirical relationship between global radiation and global ultraviolet (0.290–0.385) mm solar radiation components. Sol. Energy 1990, 45, 61–64. [Google Scholar] [CrossRef]
- Pashiardis, S.; Kalogirou, S.; Pelengaris, A. Statistical Analysis and InterComparison of Solar UV and Global Radiation for Athalassa and Larnaca, Cyprus. SM J. Biom. Biostat. 2017, 2, 1012. [Google Scholar]
- Cañada, J.; Pedrós, G.; López, A.; Boscá, J.V. Influence of the clearness index for the whole spectrum and of the relative optical air mass on UV solar irradiance for two locations in the Mediterranean area, Valencia and Córdoba. J. Geophys. Res. 2000, 110, 4759–4766. [Google Scholar] [CrossRef]
- Robaa, S. A study of ultraviolet solar radiation at Cairo urban area, Egypt. Sol. Energy 2004, 77, 251–259. [Google Scholar] [CrossRef]
- Kudish, A.I.; Lyubansky, V.; Evseev, E.G.; Ianetz, A. Statistical analysis and inter-comparison of the solar UVB, UVA and global radiation for Beer Sheva and Neve Zohar (Dead Sea), Israel. Theor. Appl. Climatol. 2005, 80, 1–15. [Google Scholar] [CrossRef]
- Jacovides, C.; Tymvios, F.; Asimakopoulos, D.; Kaltsounides, N.; Theoharatos, G.; Tsitouri, M. Solar global UVB (280–315nm) and UVA (315–380nm) radiant fluxes and their relationships with broadband global radiant flux at an eastern Mediterranean site. Agric. For. Meteorol. 2009, 149, 1188–1200. [Google Scholar] [CrossRef]
- Basheer, F.S.; Hameed, A.A.; Kokaz, A.A. Variability of Solar UV Radiation and Its Relationship to Pollutants in Baghdad City. Al-Mustansiriyah J. Sci. 2021, 32, 90. [Google Scholar] [CrossRef]
- Du Preez, D.; Bencherif, H.; Portafaix, T.; Lamy, K.; Wright, C.Y. Solar Ultraviolet Radiation in Pretoria and Its Relations to Aerosols and Tropospheric Ozone during the Biomass Burning Season. Atmosphere 2021, 12, 132. [Google Scholar] [CrossRef]
- Liu, C.M.; Ou, S.S. Effects of tropospheric aerosols on the solar radiative heating in a clear atmosphere. Theor. Appl. Climatol. 1990, 41, 97–106. [Google Scholar] [CrossRef]
- Hu, B.; Wang, Y.; Liu, G. Ultraviolet radiation spatio-temporal characteristics derived from the ground-based measurements taken in China. Atmos. Environ. 2007, 41, 5707–5718. [Google Scholar] [CrossRef]
- Hu, B.; Wang, Y.S.; Liu, G.R. The characteristics of ultraviolet radiation in arid and semi-arid regions of China. J. Atmos. Chem. 2010, 67, 141–155. [Google Scholar] [CrossRef]
- Varotsos, C. Airborne measurements of aerosol, ozone, and solar ultraviolet irradiance in the troposphere. J. Geophys. Res. Atmos. 2005, 110. [Google Scholar] [CrossRef]
- Varotsos, C.; Melnikova, I.; Efstathiou, M.N.; Tzanis, C. 1/f noise in the UV solar spectral irradiance. Theor. Appl. Climatol. 2013, 111, 641–648. [Google Scholar] [CrossRef]
- Varotsos, C.; Alexandris, D.; Chronopoulos, G.; Tzanis, C. Aircraft observations of the solar ultraviolet irradiance throughout the troposphere. J. Geophys. Res. Atmos. 2001, 106, 14843–14854. [Google Scholar] [CrossRef]
- Tzanis, C.; Varotsos, C.; Viras, L. Impacts of the solar eclipse of 29 March 2006 on the surface ozone concentration, the solar ultraviolet radiation and the meteorological parameters at Athens, Greece. Atmos. Chem. Phys. 2008, 8, 425–430. [Google Scholar] [CrossRef]
- Varotsos, C. Solar ultraviolet radiation and total ozone, as derived from satellite and ground-based instrumentation. Geophys. Res. Lett. 1994, 19, 3301–3305. [Google Scholar] [CrossRef]
- Alharbi, B. Airborne Dust in Saudi Arabia: Source Areas, Entrainment, Simulation and Composition. Ph.D. Dissertation, Monash University, Melbourne, Australia, 2009. 313p. [Google Scholar]
- Alharbi, B. Transport of North African Dust to Big Bend, Texas, during the 1999 Big Bend Regional Aerosol and Visibility Observational Study. Master’s Thesis, Colorado State University, Fort Collins, CO, USA, 2003. [Google Scholar]
- Maghrabi, A.; Alharbi, B.; Tapper, N. Impact of the March 2009 dust event in Saudi Arabia on aerosol optical properties, meteorological parameters, sky temperature and emissivity. Atmos. Environ. 2011, 45, 2164–2173. [Google Scholar] [CrossRef]
- Maghrabi, A.; Alotaib, R. Long-term variations of AOD from an AERONET station in the central Arabian Peninsula. Theor. Appl. Climatol. 2017, 134, 1015–1026. [Google Scholar] [CrossRef]
- Maghrabi, A.; Aldosari, A.; Altilasi, M. Characterization of ultraviolet radiation (UVA) in the desert climate of the Central Arabian Peninsula. Theor. Appl. Climatol. 2021, 146, 631–644. [Google Scholar] [CrossRef]
- Holben, B.N.; Tanré, D.; Smirnov, A.; Eck, T.F.; Slutsker, I.; Abuhassan, N.; Newcomb, W.W.; Schafer, J.S.; Chatenet, B.; Lavenu, F.; et al. An emerging ground-based aerosol climatology: Aerosol optical depth from AERONET. J. Geophys. Res. 2001, 106, 12067–12097. [Google Scholar] [CrossRef]
- Smirnov, A.; Holben, B.N.; Dubovik, O.; O’Neill, N.T.; Eck, T.F.; Westphal, D.L.; Goroch, A.K.; Pietras, C.; Slutsker, I. Atmospheric aerosol optical properties in the Persian Gulf. Atmos. Sci. 2002, 59, 620–634. [Google Scholar] [CrossRef]
- Ogunjobi, K.; Kim, Y. Ultraviolet (0.280–0.400) and broadband solar hourly radiation at Kwangju, South Korea: Analysis of their correlation with aerosol optical depth and clearness index. Atmos. Res. 2004, 71, 193–214. [Google Scholar] [CrossRef]
- Gueymard, C. The sun’s total and spectral irradiance for solar energy applications and solar radiation models. Sol. Energy 2004, 76, 423–453. [Google Scholar] [CrossRef]
- Skyeinstrument. Available online: http://www.skyeinstruments.info/index_htm_files/UVA%20SENSOR%20v3.pdf (accessed on 20 December 2022).
- Li, X.; Chen, X.; Yuan, X.; Zeng, G.; León, T.; Liang, J.; Chen, G.; Yuan, X. Characteristics of particulate pollution (PM2.5 and PM10) and their space scale dependent relationships with meteorological elements in china. Sustainability 2017, 9, 2330. [Google Scholar] [CrossRef]
- Haywood, J.; Boucher, O. Estimates of the direct and indirect radiative forcing due to tropospheric aerosols: A review. Rev. Geophys. 2000, 38, 513–543. [Google Scholar] [CrossRef]
- Krzyscin, J.; Puchalsky, S. Aerosol impact on the surface UV radiation from the groundbased measurements taken at Belsk, Poland. J. Geophys. Res. 1998, 103, 16175–16181. [Google Scholar] [CrossRef]
- Dominick, D.; Latif, M.; Juahir, H.; Aris, A.Z.; Zain, S.M. An assessment of influence of meteorological factors on pm and 10 and no2 at selected stations in malasia. Sustain. Environ. Res. 2012, 22, 305–315. [Google Scholar]
- Maghrabi, A.; Al-Dosari, A. Effects on surface meteorological parameters and radiation levels of a heavy dust storm occurred in Central Arabian Peninsula. Atmos. Res. 2016, 182, 30–35. [Google Scholar] [CrossRef]
- Barkan, J.; Kutiel, H.; Alpert, P. Climatology of Dust Sources in North Africa and the Arabian Peninsula, Based on TOMS Data. Indoor Built Environ. 2004, 13, 407–419. [Google Scholar] [CrossRef]
- Begum, B.A.; Biswas, S.K.; Pandit, G.G.; Saradhi, I.V.; Waheed, S.; Siddique, N.; Seneviratne, M.S.; Cohen, D.D.; Markwitz, A.; Hopke, P.K. Long–range transport of soil dust and smoke pollution in the South Asian region. Atmos. Pollut. Res. 2011, 2, 151–157. [Google Scholar] [CrossRef]
- Chen, X.; Li, X.; Yuan, X.; Zeng, G.; Liang, J.; Li, X.; Xu, W.; Luo, Y.; Chen, G. Effects of human activities and climate change on the reduction of visibility in Beijing over the past 36 years. Environ. Int. 2018, 116, 92–100. [Google Scholar] [CrossRef] [PubMed]
- Harrison, R.M.; Jones, A.M.; Lawrence, R.G. Major component composition of PM10 and PM2.5 from roadside and urban background sites. Atmos. Environ. 2004, 38, 4531–4538. [Google Scholar] [CrossRef]
- Hueglin, C.; Gehrig, R.; Baltensperger, U.; Gysel, M.; Monn, C.; Vonmont, H. Chemical characterisation of PM2.5, PM10 and coarse particles at urban, near-city and rural sites in Switzerland. Atmos. Environ. 2005, 39, 637–651. [Google Scholar] [CrossRef]
- di Sarra, A.; Cacciani, M.; Chamard, P.; Cornwall, C.; DeLuisi, J.J.; Di Iorio, T.; Disterhoft, P.; Fiocco, G.; Fuá, D.; Monteleone, F. Effects of desert dust and ozone on the ultraviolet irradiance at the Mediterranean island of Lampedusa during PAUR II. J. Geophys. Res. 2018, 107, PAU 2-1–PAU 2-14. [Google Scholar] [CrossRef]
- Querol, X.; Alastuey, A.; Rodriguez, S.; Plana, F.; Ruiz, C.R.; Cots, N.; Massagué, G.; Puig, O. PM10 and PM2.5 source apportionment in the Barcelona Metropolitan area, Catalonia, Spain. Atmos. Environ. 2001, 35, 6407–6419. [Google Scholar] [CrossRef]
- Jayamurugan, R.; Kumaravel, B.; Palanivelraja, S.; Chockalingam, M.P. Influence of temperature, relative humidity and seasonal variability on ambient air quality in a coastal urban area. Int. J. Atmos. Sci. 2013, 2013, 264046. [Google Scholar] [CrossRef]
- Wang, J.; Ogawa, S. Effects of meteorological conditions on PM2.5 concentrations in Nagasaki, Japan. Int. J. Environ. Res. Public Health 2015, 12, 9089–9101. [Google Scholar] [CrossRef] [PubMed]
- Tian, G.; Qiao, Z.; Xu, X. Characteristics of particulate matter (PM10) and its relationship with meteorological factors during 2001–2012 in beijing. Environ. Pollut. 2014, 192, 266–274. [Google Scholar] [CrossRef]
- Vardoulakis, S.; Kassomenos, P. Sources and factors affecting PM10 levels in two European cities: Implications for local air quality management. Atmos. Environ. 2008, 42, 3949–3963. [Google Scholar] [CrossRef]
- Akyüz, M.; Cabuk, H. Meteorological variations of PM2.5/PM10 concentrations and particle-associated polycyclic aromatic hydrocarbons in the atmospheric environment of Zonguldak, Turkey. J. Hazard. Mater. 2009, 170, 13–21. [Google Scholar] [CrossRef] [PubMed]
- Phairuang, W.; Hata, M.; Furuuchi, M. Influence of agricultural activities, forest fires and agro-industries on air quality in Thailand. J. Environ. Sci. 2017, 52, 85–97. [Google Scholar] [CrossRef] [PubMed]
- Hu, B.; Liu, H.; Liu, Z. Spatiotemporal characteristics of ultraviolet solar radiation in China. Atmos. Ocean. Sci. Lett. 2019, 12, 302–304. [Google Scholar] [CrossRef]
Disclaimer/Publisher’s Note: The statements, opinions and data contained in all publications are solely those of the individual author(s) and contributor(s) and not of MDPI and/or the editor(s). MDPI and/or the editor(s) disclaim responsibility for any injury to people or property resulting from any ideas, methods, instructions or products referred to in the content. |
© 2024 by the authors. Licensee MDPI, Basel, Switzerland. This article is an open access article distributed under the terms and conditions of the Creative Commons Attribution (CC BY) license (https://creativecommons.org/licenses/by/4.0/).