Article

Resolving the Loss of Intermediate-Size Speech Aerosols in Funnel-Guided Particle Counting Measurements

Laboratory of Chemical Physics, National Institute of Diabetes and Digestive and Kidney Diseases, National Institutes of Health, Bethesda, MD 20892, USA
*
Author to whom correspondence should be addressed.
Atmosphere 2024, 15(5), 570; https://doi.org/10.3390/atmos15050570
Submission received: 1 April 2024 / Revised: 1 May 2024 / Accepted: 3 May 2024 / Published: 7 May 2024
(This article belongs to the Special Issue Atmospheric Bioaerosols: Detection, Characterization and Modelling)

Abstract

:
Modeling of airborne virus transmission and protection against it requires knowledge of the amount of biofluid emitted into the atmosphere and its viral load. Whereas viral concentrations in biofluids are readily measured by quantitative PCR, the total volume of fluids aerosolized during speaking, as measured by different researchers using various technologies, differs by several orders of magnitude. We compared collection methods in which the aerosols first enter into a low-humidity chamber either by direct injection or via commonly used funnel and tubing arrangements, followed by standard optical particle sizer measurement. This “collect first, measure later” approach sacrifices the recording of the temporal correlation between aerosol generation and sound types such as plosives and vowels. However, the direct-injection mode prevents inertia deposition associated with the funnel arrangements and reveals far more intermediate-size (5–20 μm in diameter) particles that can dominate the total mass of ejected respiratory aerosol. The larger aerosol mass observed with our method partially reconciles the large discrepancy between the SARS-CoV-2 infectious dose estimated from superspreader event analyses and that from human challenge data. Our results also impact measures to combat airborne virus transmission because they indicate that aerosols that settle faster than good room ventilation rates can dominate this process.

1. Introduction

Sources of respiratory aerosol that have been implicated in virus transmission include breathing, coughing, sneezing, and other sound-producing activities such as talking, singing, and laughing [1,2,3]. Whereas disease transmission associated with symptomatic coughing and sneezing activities had long been widely recognized [4], symptomless transmission involving breath and speech aerosols has proved far more insidious and has been regarded as the primary challenge in containing COVID-19 [5,6]. Breath aerosols consist of deep lung airway lining fluid, aerosolized during the opening of transiently closed small airways [7]. Because such particles are generated in the distal airways, they will only carry viruses if their epithelium is infected, which is typically associated with symptoms [8]. By default, vocal activity therefore remains as the prime culprit behind asymptomatic transmission.
Numerous studies at different levels of sophistication have modeled airborne virus transmission, with important implications for disease prevention [9,10,11,12,13,14,15,16]. Key parameters in such analyses include the total mass of respiratory aerosol generated by the infected person, the concentration of virions inside such aerosols, and N0, the infectious dose, which is the number of virions that, if inhaled, results in a 63% probability of generating an infection. Using the Wells–Riley model of infection, the probability of infection upon inhalation of N virions is given by
P ( N ) = 1 e N / N 0
N0 is often referred to as a ‘quantum’, which allows the modeling of transmission without assigning a numerical value to N0 [17,18]. From the observed infection probability among attendees at superspreader events and their known air intake, an estimate of the number of quanta emitted by the infected person can be generated, provided parameters such as total room volume, room ventilation rate, and sedimentation rates of the virus-containing aerosols are available [10,11,14].
The aerosolized respiratory emissions for various activities have been extensively measured using aerosol detection equipment, most commonly by aerodynamic particle sizers (APSs). The total dried mass per second ranged from a median of 5.6 pg/s for breathing adults, to a “top whisker” of 1.3 ng/s for singing children [19]. Under the widely used assumption that virus concentration in the emitted fluid droplets equals that of the respiratory fluids from which these particles derive, the concentration of virions encapsulated in the aerosols is estimated from quantitative polymerase chain reaction (PCR) measurements of bulk respiratory fluid. Since the modeling-derived number of quanta produced by the infected person corresponds to their total number of aerosolized virions, i.e., the aerosol mass times its viral concentration, N0 can be estimated from these values.
Analysis of multiple well-documented COVID-19 superspreader events yielded N0 values of 10–100 virions [9,11]. However, such a low infectious dose is incompatible with cell culture work [20], with what is known for other viruses [21], and most importantly, with the human challenge data of Killingley et al. [22], which all point to N0 values that are at least three orders of magnitude higher. In other words, these modeling results appear inconsistent with virus transmission through air.
Prentiss et al. [14] and Mikszewski et al. [15] recognized this large infectious dose inconsistency and used the ca. 1000-fold larger but rather approximate ejected particle mass derived from light scattering aerosol counts and particle sedimentation velocities [23], rather than the precise and carefully documented APS aerosol mass measured by multiple groups [19,24,25,26,27,28]. Another study used both APS and light scattering video observations of the respiratory aerosol, finding particle counts consistent with prior APS measurements but also observing impressive clouds of particles that appeared to contain numerous aerosols much larger than observed by their APS [29]. However, precise measurements of the sizes and trajectories of ejected particles from high-speed video are limited by their often rather narrow field of view and remain restricted to technologically highly advanced laboratories [30,31,32,33,34].
In our own work, we adopted a “collect first, measure later” method, where droplets were first injected through a large opening into a dehydration chamber, followed by conventional analysis of the chamber contents by an optical particle sizer (OPS) [35]. In contrast to the prevailing literature based on particle sizer (APS and OPS) measurements, we found that the mass of ejected aerosols for speaking was dominated by particles with diameters larger than 5 μm, but small enough to remain airborne for many minutes [35]. However, for breathing and vowel vocalization, the aerosol numbers and total mass were similar to those reported by others [35]. While both our “collect first, measure later” and recent measurements in the literature were based on particle sizers, the methods differ in how the particles are guided to the instrument. In our measurements, particles generated by a brief burst (10–15 s) of vocal or other respiratory activity are first collected with near 100% efficiency into a reservoir of clean, dry air, from which the OPS withdraws air at a fixed rate.
Our method differs from most measurements in the literature which employed a funnel to guide respiratory emissions, via tubing, directly to the particle sizer. This latter, more direct approach has the advantage of providing a temporal correlation between respiratory activity and observed particles, simplifying the study of specific sounds [26]. On the other hand, this more direct approach suffers from a mismatch between the constant air intake by the particle sizer and the highly fluctuating airflow generated by respiratory activities such as coughing and speaking. In particular, both plosive sounds and coughing are associated with the emission of brief bursts of air. When emitted into the funnel, such bursts of high-speed respiratory air will greatly perturb the laminar flow pattern of air drawn into the funnel, thereby causing mixing with room air and generating particle losses.
A second concern relates to the respiratory air becoming super-saturated upon cooling to room temperature, potentially resulting in rapid particle growth due to nucleated condensation [36]. Even if these particles, enhanced in size by nucleated condensation, do not sediment during their travel through tubing to the particle sizer, their precise hydration status remains unknown and highly hydrated medium-sized (5–20 μm) particles are strongly undercounted by APS instrumentation [37,38].
A third concern relates to the impaction of emitted particles on the funnel surface. High-speed video analysis of speech particles showed that, in particular, larger speech particles retained high velocities for distances that greatly exceed the diameter of typically used funnels [29]. A quantitative analysis of speech particles at ~17 mm in front of the lips yielded an average velocity of 3.4 m/s, with a maximum of 29 m/s, with dehydration at 80% RH requiring more than 100 ms for the vast majority of droplets [34]. With the distance of the lips to the funnel surface in many experimental setups being only a few centimeters, the Stokes number for many of the larger hydrated droplets will be greater than one. Such a high Stokes number, in particular for the larger particles, implies a high probability of impaction on the funnel surface. Although numerical calculations on such a chaotic system are very challenging, experimental measurements of particle losses between entering and exiting the funnel are straightforward and are the focus of the current study.
Our experimental setup compares the aerosol volume emitted into the atmosphere by several respiratory activities with the quantity measured when using the common funnel-and-tubing arrangement for guiding aerosols to a particle sizer. By passing the particles through a low-humidity chamber, ambiguity regarding the hydration status of detected aerosols is effectively removed. Our measurements are minimally affected by impaction or by sedimentation of hydrated particles, resulting in a substantially larger total mass of detected aerosols, in particular for speech activity with strongly modulated airflows.

2. Materials and Methods

2.1. Human Subject

The National Institutes of Health, USA, Institutional Review Board provided an exemption of clinical research for comparing aerosol collection methods for a single volunteer and allowed for replicates to evaluate the reproducibility of the detection method (IRB Exemption Number 000276; iRIS Reference Number 551429).

2.2. Experimental Setup

A factory-calibrated TSI-3330 OPS was used for quantitative aerosol analysis. This instrument drew air at 1 L/min from a 7 L cylindrical dehydration chamber, prefilled with ultraclean dry (<1% RH) air. Air was cycled from the chamber through the OPS and returned to the chamber after HEPA filtering. Prior to the respiratory activity, the chamber particle background registered < 1 L−1. The cylinder’s inner surfaces were coated with static-shielding polyethylene (McMASTER-CARR, part number 4663T9). The OPS counts particles in 16 bins, sized from 0.3–10 μm, with an “oversize bin” for particles > 10 μm. We used an average diameter of 10.3 μm for oversize-bin particles, based on the fit of the experimental correlation between sedimentation velocity and particle size for diameters < 10 μm (vide infra).
Our entire setup (Figure 1; Supplementary Material Figure S1) was located in a large (80 m2) pulsed laser facility regulated at 21.0 ± 0.3 °C, relative humidity (RH) in the 19–23% range, and a background < 900 particles/L in the main area. Within this area, sections surrounding optical tables are surrounded by plastic curtains, with air supplied from above through two large 60 cm × 120 cm HEPA filters suspended from the ceiling, each supplying the enclosed area with 50 m3 of air for ca. 10 air changes per hour. With the volunteer present, donned in polyethylene/polypropylene protective clothing, the background in the enclosed area was <20 particles/L. The background decreased to <5 particles/L in the absence of the volunteer.
Respiratory aerosol was entered through a 10 cm diameter plastic funnel, connected by either 7.5 of 12.7 mm inner diameter (ID) tubing, or 100 cm conductive tubing (TSI Inc., Shoreview, MN, USA; product number 3001788), ID 5 mm, to the top of the dehydration chamber. The cylinder orientation was switched from a 35° orientation during the respiratory activity to vertical (90°) during actual OPS measurements. The funnel geometry and its 7.5 cm tubing mimic the setup of Asadi et al. [25]; longer tubing was used by others [19,27]. The funnel and tubing were coated by electric heating elements and externally covered by thermal insulation. This arrangement enabled switching of the funnel and tubing temperature from room temperature to ≥40 °C. To evaluate whether supersaturation of exhaled air leads to condensation on the tubing walls and to particle growth caused by nucleated condensation during transit to the chamber, data were acquired with and without heating.
A second mode of aerosol entry into the dehydration chamber, referred to as “direct injection”, was through a 4.5 cm inner diameter (ID) tube of 3.3 cm length, with the lips of the volunteer positioned inside the tube during the respiratory activity.
During the respiratory activity, a vacuum line near the chamber’s center draws air into the chamber through the breathing port at a flow rate of 5 L/min for 12 s, starting just prior to the vocalization. This flow rate matches that of the TSI 3312A and 3321 APS instruments used in the widely cited literature [19,24,25,26,27,29], but is well below our average respiratory exhalation flow of 12 ± 2 L/min following a deep inhalation and a 1 s breath-hold. For respiratory activity ≥ 5 L/min, the excess exhaled air simply did not enter the dehydration chamber when using the funnel. For “direct injection”, excess air escaped from the chamber through the inlet port, causing a greater fraction of expired air to enter the chamber than when using the funnel arrangement. The actual amount of exhaled air entered into the dehydration chamber was determined from the increase in chamber humidity, assuming an absolute humidity of 33 mg/L for the exhaled breath [24].

2.3. Expiratory Activities

Measurements were carried out for breathing and three vocal activities, an extended ‘aah’ vowel, counting 1–12, and six repeats of the word ‘popeye’, with each of these four activities applied during the 12 s interval that air was drawn into the dehydration chamber. Sounds were at a high loudness level that proved easiest to reproduce quantitatively (87 ± 1.5 dBA at 50 cm). The word ‘popeye’ was used because it contains two/p/plosives that generate numerous droplets from fluid covering the lips [39], while the ‘eye’ generates the puff of air carrying these droplets forward. “Popeye” is phonetically similar to ‘papa’, a word evaluated by Asadi et al. [26], who found that it yielded minimal aerosols. The large contrast between Asadi’s funnel-APS collection method and the videos of Abkarian [39], as well as our prior measurements [35], made this a good case for exploring the source of these large differences. To evaluate whether the large differences we observed in particle distributions between direct and funnel-guided injection were unique to plosive-rich words, we also carried out measurements for breathing, for loud vowel vocalization (‘aah’), and for loud counting from 1 to 12, each during a single 12 s exhalation that followed deep inhalation.

2.4. Uncertainty in Aerosol Counts

Variations in respiratory aerosol counts for the five repeats of each measurement often were outside the statistical uncertainty of ±√N, for N counts in any given bin, and therefore are dominated by the variation in aerosols produced by the volunteer upon repeating the same respiratory activity. Reported values are the geometric means with errors corresponding to the standard deviation from the geometric mean, and do not include uncertainties in the amount of breath captured or statistical uncertainties that were small relative to the variation in separate measurements.

2.5. Aerosol Detection Methods

Because our study focuses on a comparison of the aerosol detection methods, not on a statistical survey of bioaerosol emission expected for the wider population, all measurements were carried out for the same volunteer but repeated five times to validate that differences observed between the collection protocols were reproducible. Measurements were carried out with each of five methods: (1) direct injection; (2) heated funnel and short tubing; (3) heated funnel and long tubing; (4) room temperature funnel and short tubing; (5) room temperature funnel and long tubing. This series of measurements was carried out in an interleaved manner, i.e., once with each of these collection methods per series, with this entire series repeated five times. This protocol minimizes the time lapse between different aerosol collection methods, thereby minimizing the effect of variations in the number of particles ejected per activity that occur on a time scale of hours or days.

2.6. Aerosol Sedimentation Velocity

The loss in the particle number concentration, CN,D(t), of diameter D as a function of time, t, was obtained from non-linear least squares fitting of the particle counts, measured over a duration of six minutes. The experimental input data and Python analysis code can be accessed at https://zenodo.org/records/11094850 (accessed on 5 May 2024).

3. Results

3.1. Condensation during Transport

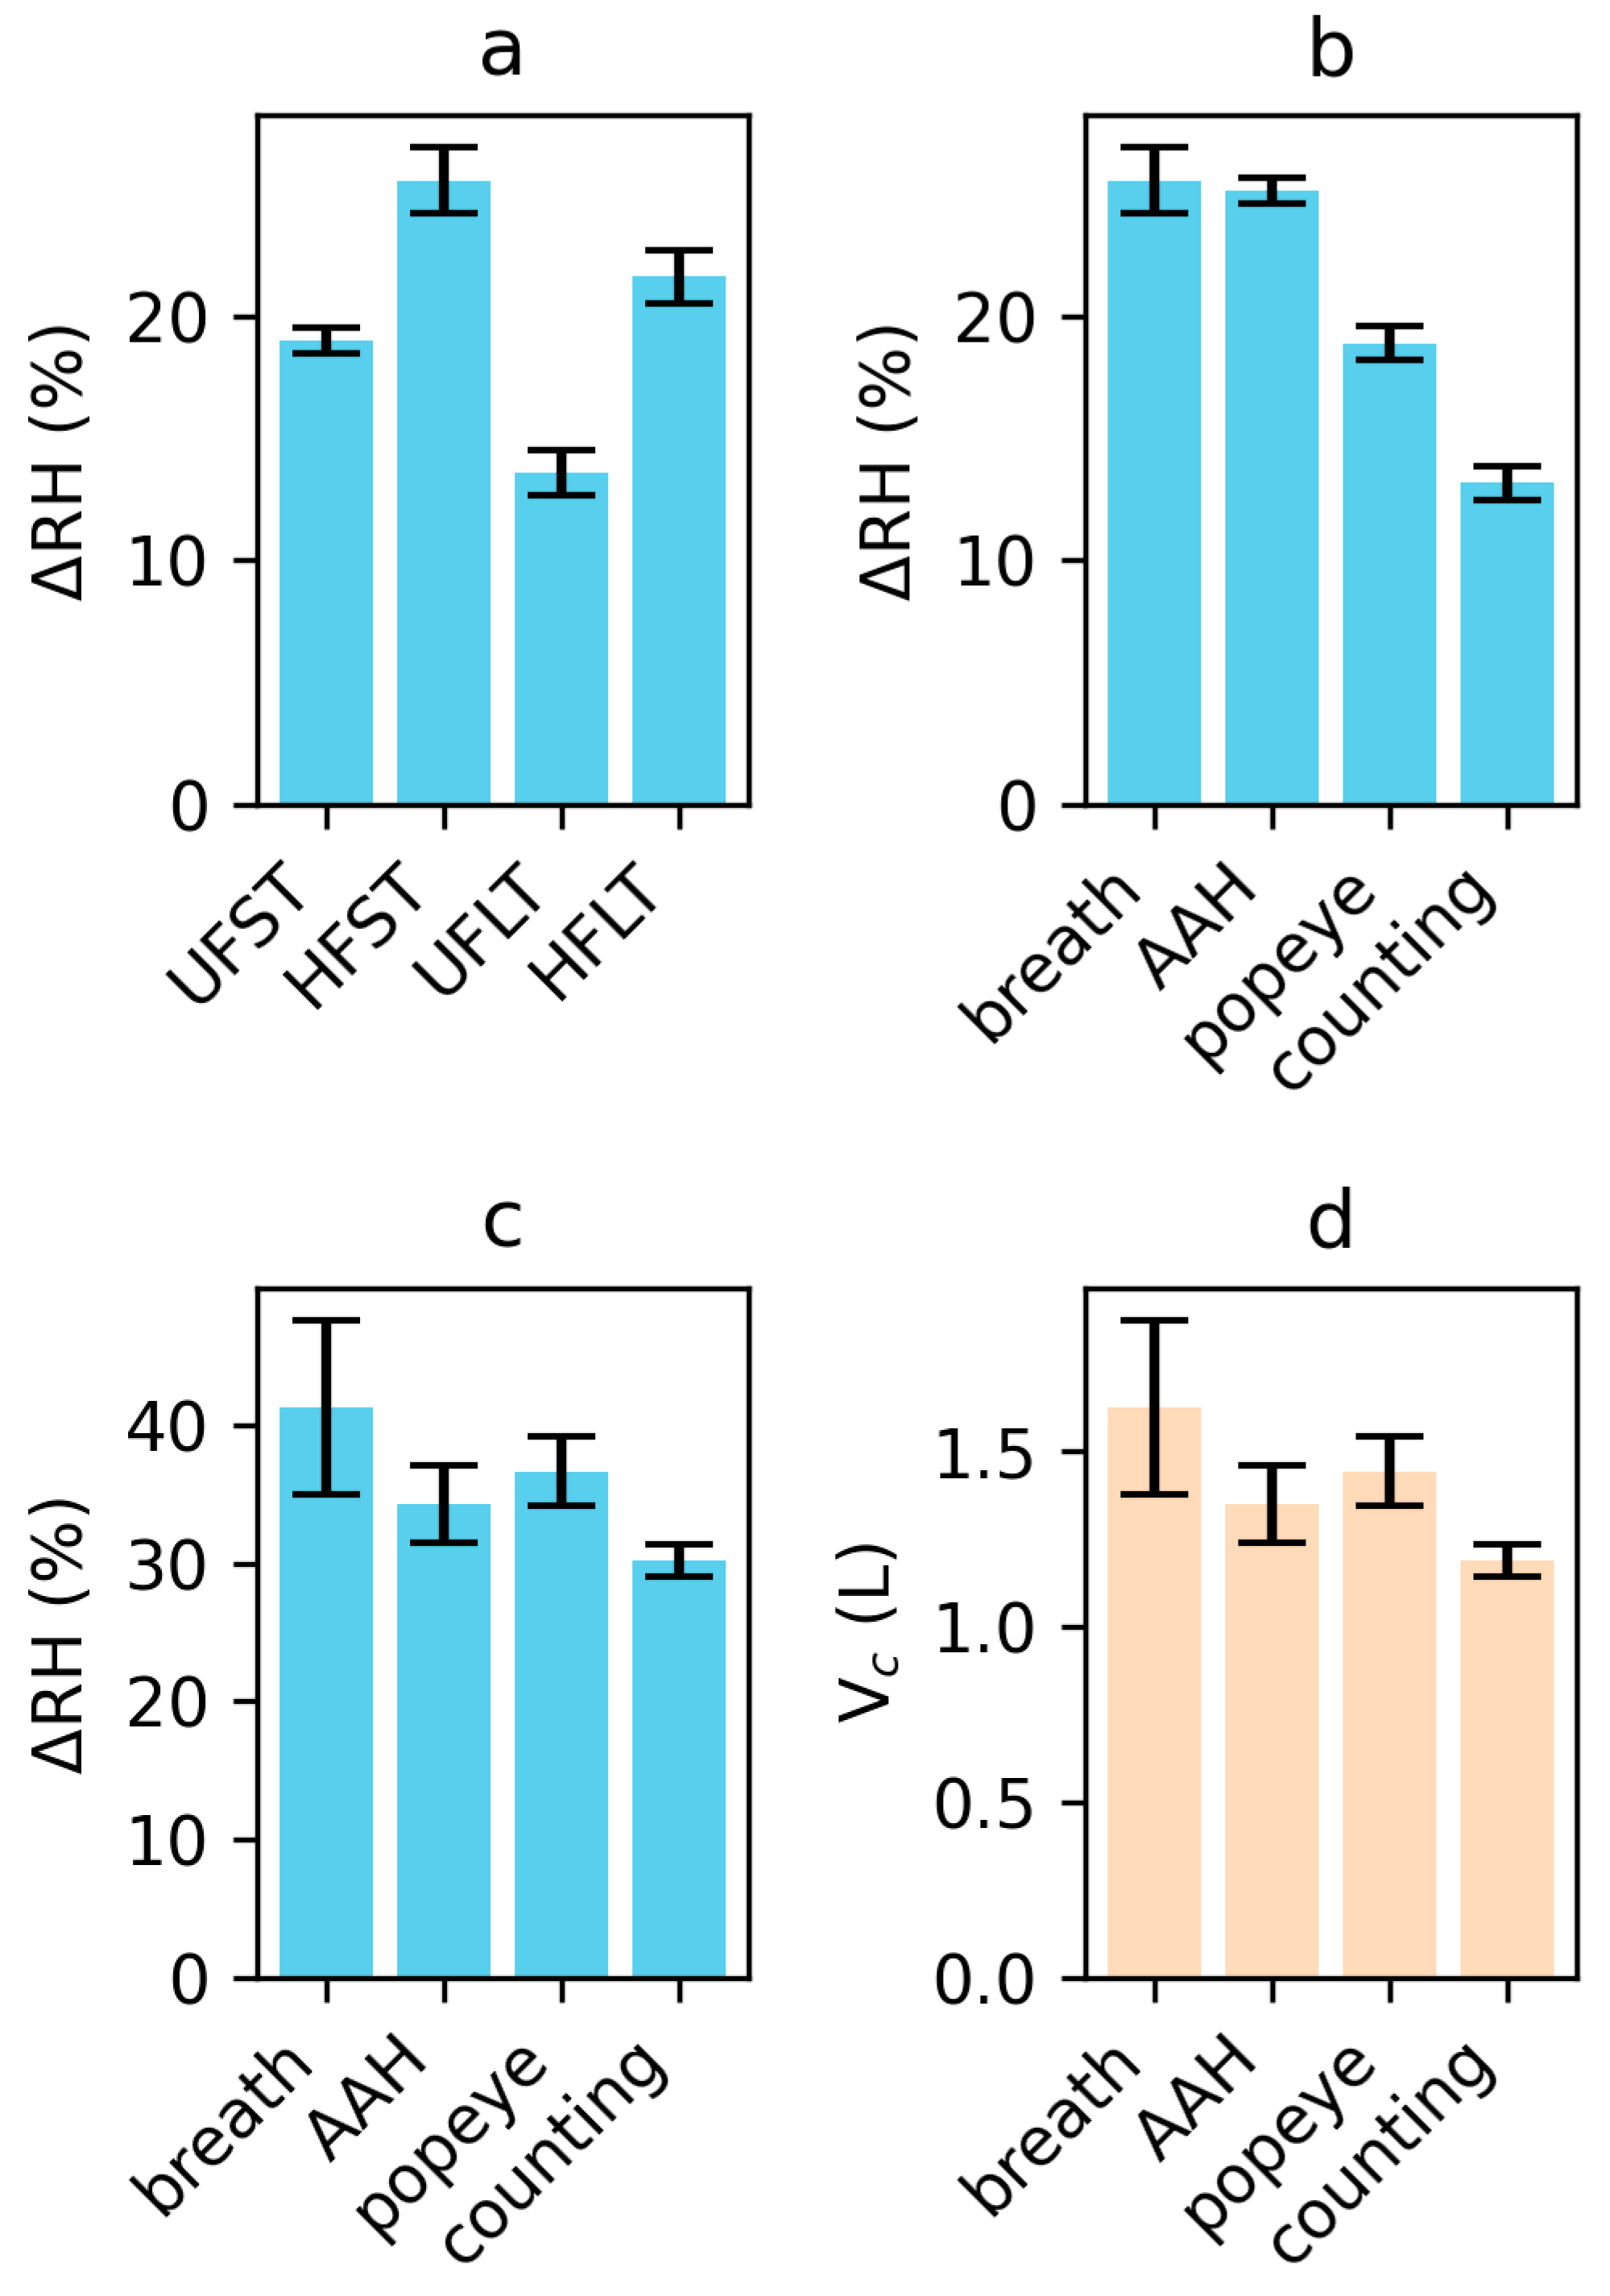
For the arrangement involving the heated funnel and tubing, which have surface temperatures above body temperature, no vapor condensation takes place during the transport of exhaled breath into the cylinder. Indeed, the observed increase in RH for the heated setup with short tubing is consistent with the value expected in the absence of vapor losses for the transport of one liter of exhaled breath into the chamber (Figure 2a). This result indicates that during continuous exhalation at a rate that is more than double that of the airstream pulled into the cylinder, the air pulled into the chamber only consists of exhaled breath. A slightly lower increase in humidity is observed when using the 1 m length heated tubing (Figure 2a). We attribute this small loss of water vapor during transport to absorption on the highly dehydrated inner surface of the tubing after it had been flushed with 0% humidity air for several minutes. By contrast, a considerably smaller increase in relative humidity is observed when exhaling in the absence of heating through the short tubing arrangement, indicative of condensation on the funnel surface and tubing wall, pointing to the super-saturation of air that is drawn into the chamber. As expected, the condensation losses further increase when the long tubing is used in the absence of heating (Figure 2a).
For vocalization of the ‘aah’ sound, the increase in chamber humidity closely mirrors that of continuous breathing because this loud ‘aah’ also corresponds to a steady airstream that still exceeds the intake by the funnel, albeit at a slightly lower flow rate of ca. 10 L/min (Figure 2b). On the other hand, for the vocalization of ‘popeye’, the humidity increases in the chamber are ca. 25% below the increases seen for the ‘aah’ sound, even while the total quantity of exhaled air (ca. 2.4 L) greatly exceeds the amount of air pulled from the funnel into the chamber. Because air is drawn into the chamber at a constant rate of 5 L/min, we attribute this incomplete entry of exhaled air into the chamber to its mixing with low-humidity (RH ca. 21%) room air inside the cone section of the funnel during the bursts of exhaled breath associated with plosive sounds. An even smaller RH increase is seen upon loud counting, which points to even more extensive mixing of the exhaled air bursts with room air, prior to being drawn into the chamber, with less than 60% of the air pulled through the funnel corresponding to exhaled breath (Figure 2b).
For all respiratory activities, direct entry of exhaled air into the chamber resulted in RH increases that exceeded the expected increase for the 1 L of breath being pulled into the chamber (Figure 2c). This result therefore indicates that more breath enters the chamber than is actively pulled into it by its vacuum port. Here, the greatest increase in RH is observed for the breathing exhalation, presumably because the total volume of exhaled air was the largest. A substantially elevated RH increase is also obtained for the ‘popeye’ activity, where the plosive bursts of air may penetrate the chamber more deeply (Figure 2c). These results indicate that dry air must have exited the chamber through the entry port when exhaling or speaking into it without making a seal.
The actual amount of air entering into the chamber by direct injection is derived from the RH increase under the simplifying assumption of instantaneous complete mixing and no condensation. Under these assumptions, the AH in the chamber (AHc) upon entering a breath volume, Vb, increases as:
AHc(Vb) = AHb [1 − exp(Vb/Vc)]
where Vc is the volume of the dehydration chamber and AHb is the absolute humidity of exhaled breath (33 mg/L). The actual volumes of breath, entered by the direct injection activities, all exceeded 1 L and are largest for the breathing and ‘popeye’ activities (Figure 2d).

3.2. Sedimentation during Measurement

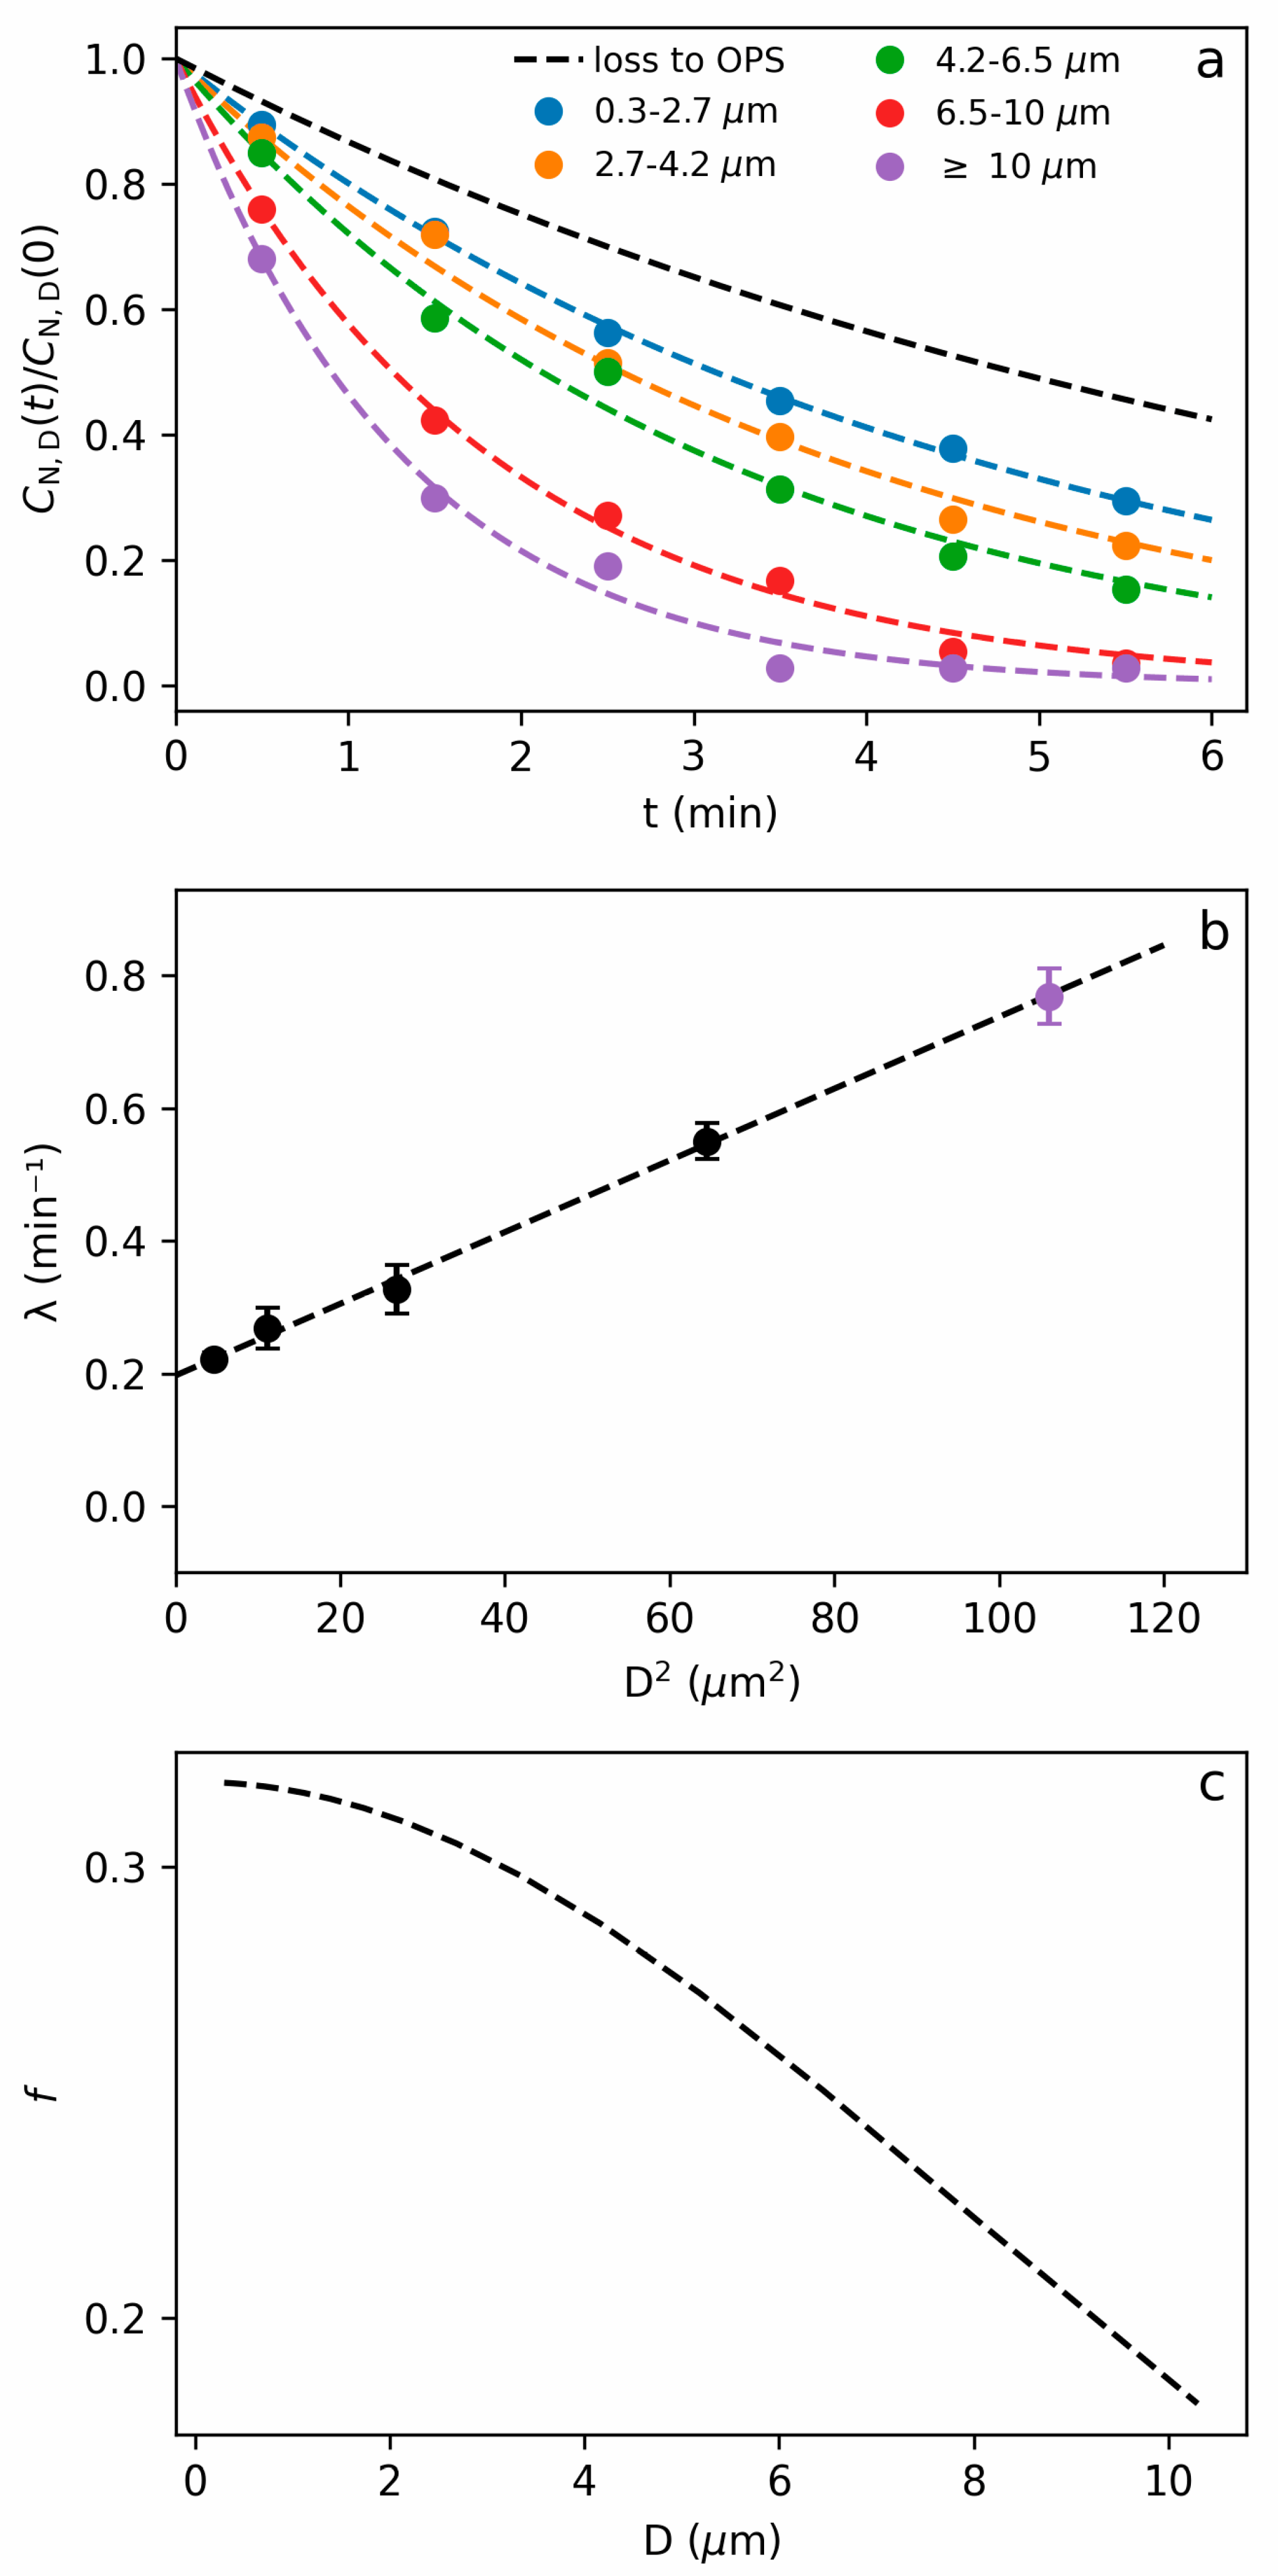
The OPS draws air from the 7 L chamber at a flow rate of 1 L/min and returns it to the chamber after HEPA filtering. Under the assumption of homogenous mixing inside the chamber, aided by convection, the particle density in the chamber decreases exponentially with a rate constant, λ, given by
λ = αOPS + αwall + v/H
where αOPS is the sum of the chamber ventilation rate (1/7 min−1), αwall represents particle losses due to deposition on the chamber wall and ceiling, and v/H is the gravitational sedimentation rate. Here, H is the chamber height (30.5 cm) and v is the gravitational sedimentation velocity in air, which scales with the square of particle diameter. For a spherical particle of diameter D (μm) and density ρ (g/cm3) in room air, v ≈ 2.7 ρ D2 ×10−3 cm/s.
For particles with diameters ≤ 3 μm, αOPS and αwall dominate the decrease in particle concentration observed during sampling by the OPS, but v/H dominates for particles in the 6.5–10 μm bin (Figure 3a). For the oversize bin, for which the OPS is unable to estimate size, λ equals 0.77 ± 0.1 min−1 (Figure 3a). Using a linear fit of the observed λ values against D2 (Figure 3b), the λ value for the oversize bin corresponds to a particle diameter of 10.3 ± 0.6 μm. The fitted slope of Figure 3b corresponds to a particle density ρ = 1.07 g/cm3, somewhat lower than expected for a fully dehydrated particle consisting of solid organic matter. This slightly lower-than-expected sedimentation velocity is tentatively attributed to the deviation from spherical shape for fully dehydrated particles, observed experimentally [40,41], which increases air resistance relative to a spherical particle of the same volume. Extrapolation of the linear regression to D = 0 yields λ = 0.2 min−1, which is faster than the expected chamber ventilation rate of 0.14 min−1 for the withdrawal of air from the chamber by the OPS. This difference corresponds to αwall = 0.06 min−1 and is known to be elevated in stirred aerosols [42]. In our chamber, the stirring is induced by the return air from the OPS that enters the chamber at a speed of 0.85 m/s.
The total fraction of chamber aerosol sampled by the OPS, f, corresponds to the integral of αOPS×exp(−λt) for the duration, T, that air is sampled from the chamber:
f = (αOPS/λ) [1 − exp(–λT)].
The total quantity of aerosols present in the chamber at the start of sampling is then obtained by dividing the OPS particle counts by f (Figure 3c). For the T = 3 min sampling durations used in our aerosol measurements, the applied correction factor ranges from f = 0.33 for particles ≤ 3 μm to f = 0.16 for the oversize bin of particles with diameters ≥10 μm (Figure 3b).

3.3. Breathing

Breath aerosol was collected following a single large volume (ca. 2.5 L) exhalation of 12 s duration, preceded by deep inhalation but not the deep exhalation maneuver that causes a large increase in breath droplets [43].
As discussed above, for both breathing and ‘aah’ vocalization guided through a heated funnel with short tubing, the chamber RH increase was consistent with 1 L of exhaled breath entering the chamber, and this volume was therefore used for analysis of both heated and unheated funnel-guided measurements. For ‘direct injection’, the total amount of breath that entered the chamber was derived from the RH increase and exceeded, by 1.3- to 1.6-fold, the volume pulled into the chamber at the 5 L/min rate.
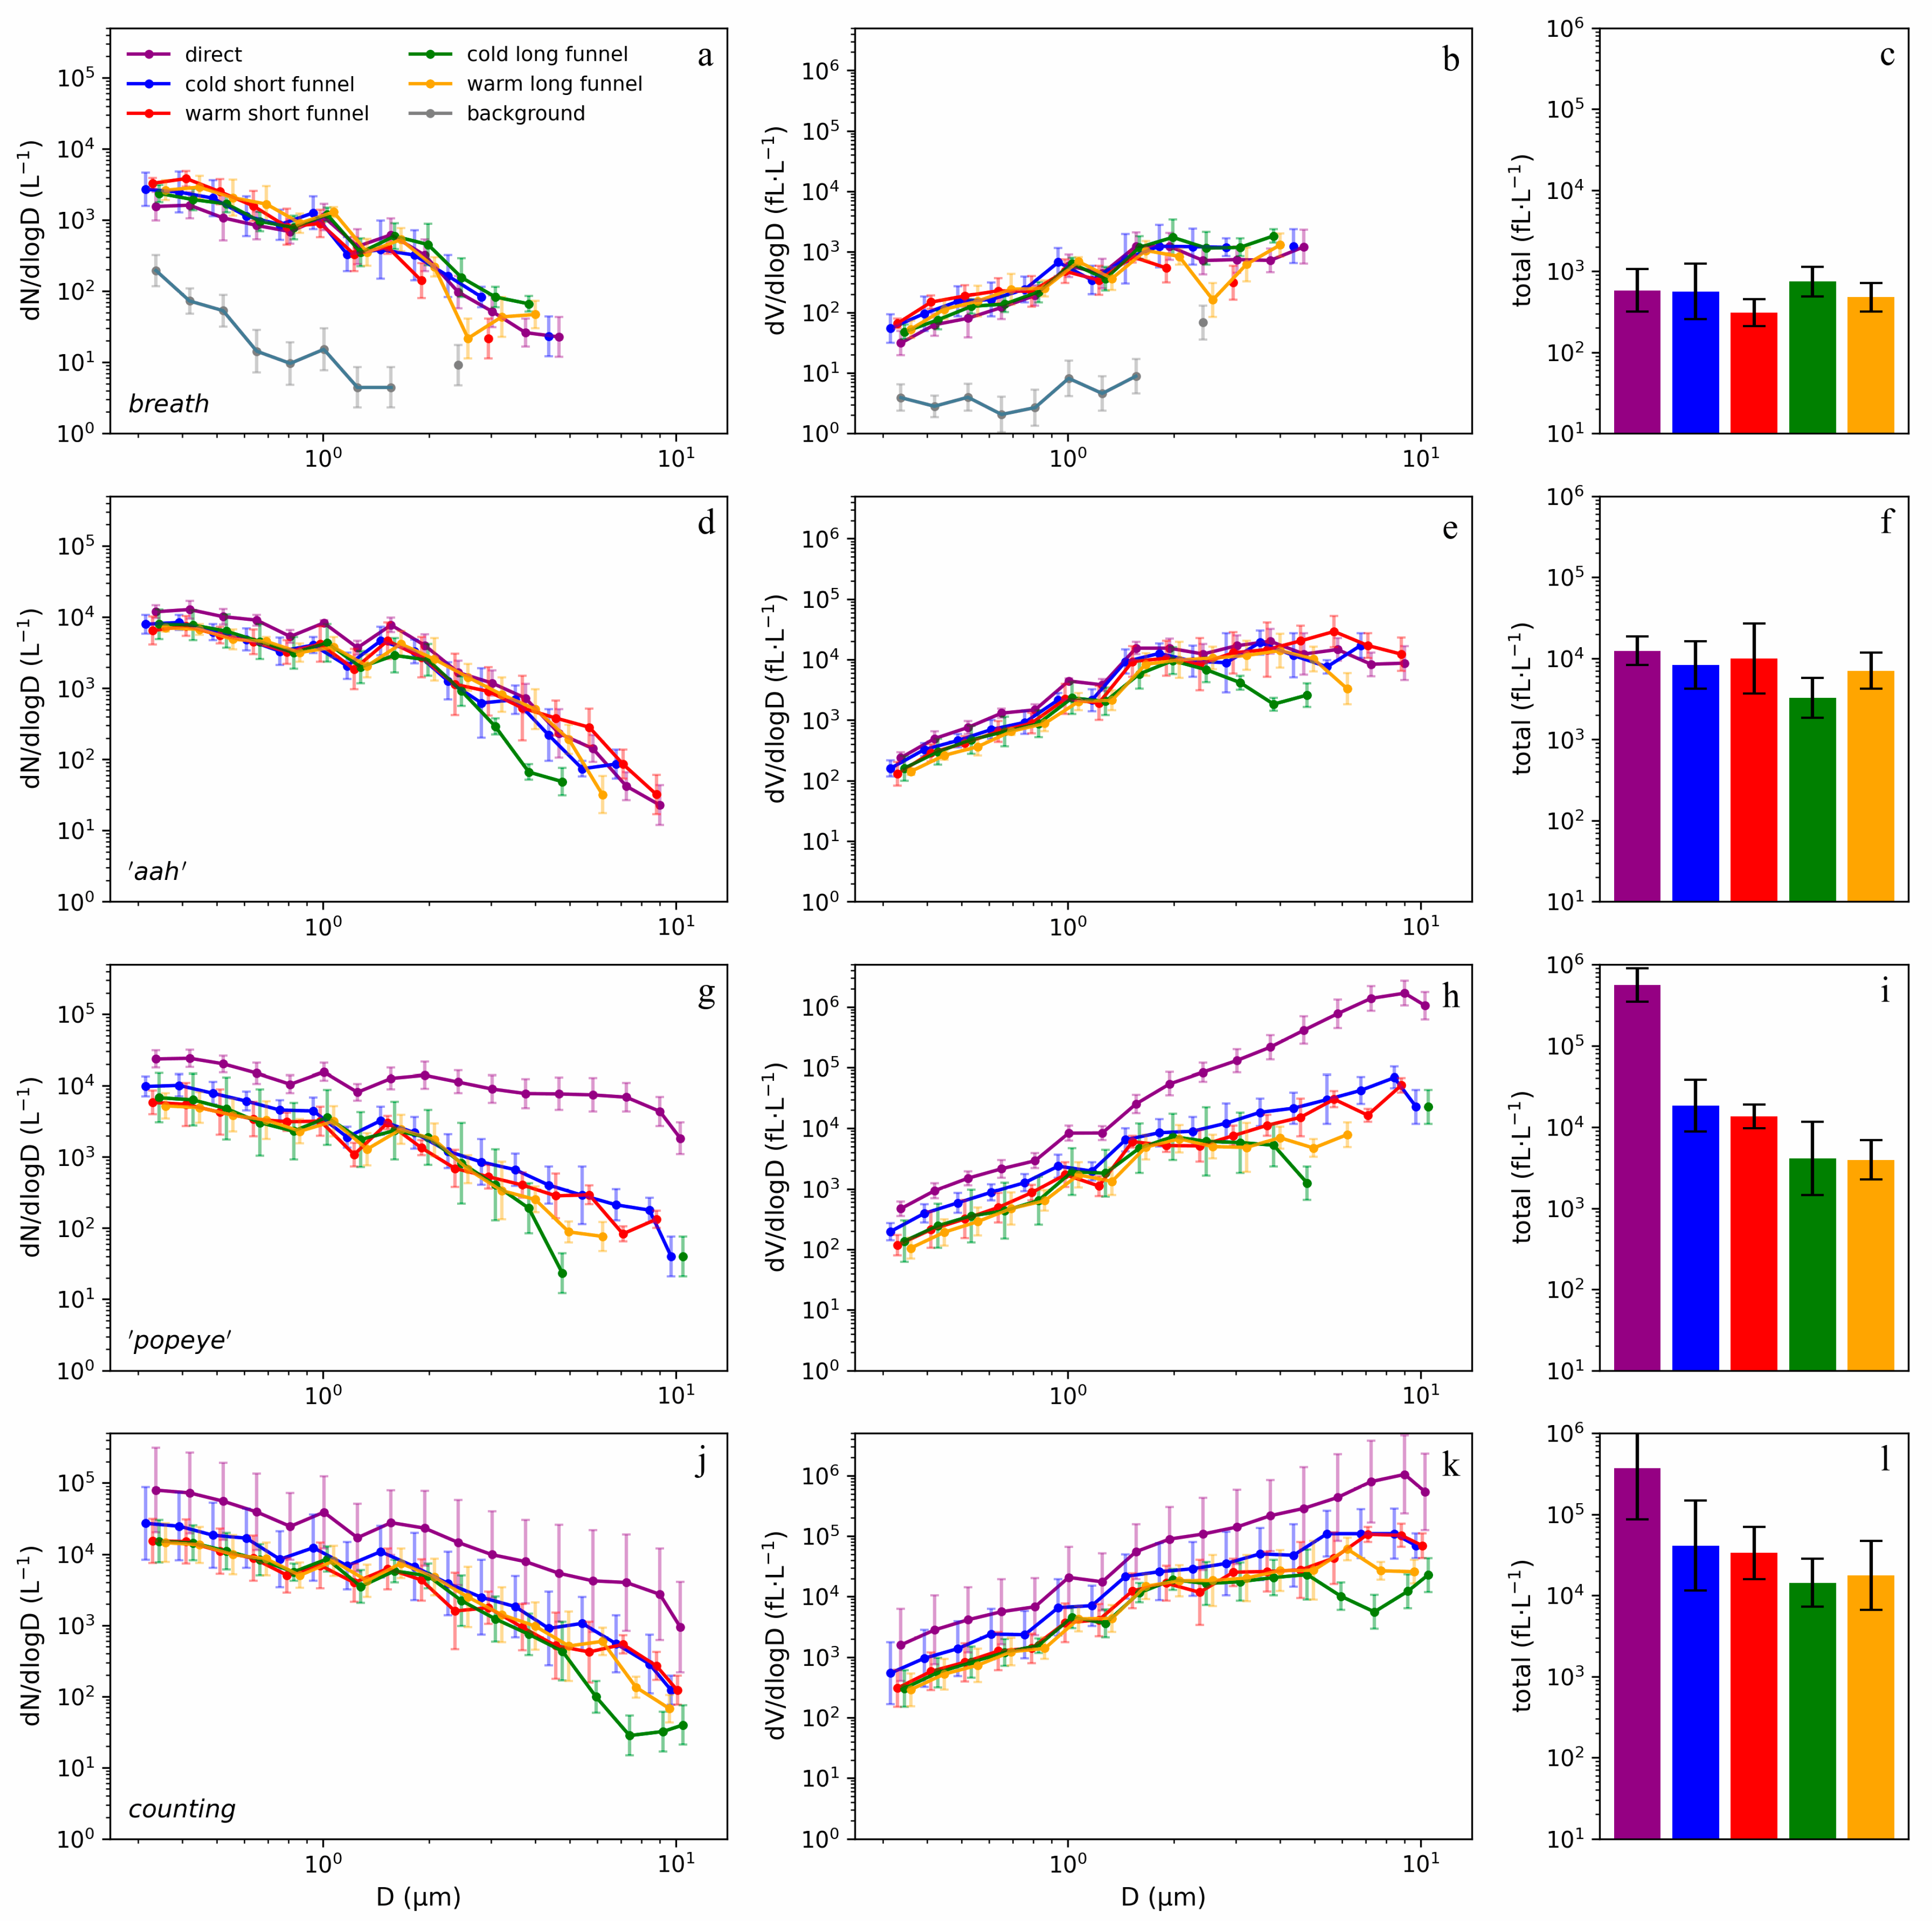
After making these adjustments for the actual volume of breath entering the chamber, the distribution of both the number and volume of breath particles observed with the direct and funnel injection methods were found to be very similar, and more than 300-fold above the background (1.9 ± 1 fL/L) measured in the presence of the volunteer carrying out identical movements but holding their breath rather than exhaling or vocalizing (Figure 4a). The total volumes of all breath particles, derived from the summed values of particles of known diameter collected in each bin, show that the five different modes of collecting breath particles yield values that are very similar (Figure 4c). This result indicates that the quantitative measurement of the total breath particle volume is not significantly affected by losses from particle impaction on the funnel surface, nor from gravitational sedimentation associated with nucleated condensation of supersaturated air during transport to the dehydration chamber.

3.4. Vowel ‘aah’

Loud vowel sounds are often considered representative of singing and were shown to produce large numbers of small aerosols [24,25,26], thus providing another useful test for comparing the different detection methods. As was observed in previous measurements [24,25,35], particle sizes are small with very few counts for diameters ≥ 5 μm (Figure 4d). A ca. three-fold decrease in particle counts for diameters larger than ca. 3 μm is seen for funnel collection with 100 cm tubing in the absence of heating, indicative of some sedimentation for these droplets that increased in size due to nucleated condensation during transport. This caused a modest reduction in dried aerosol volume per liter of exhaled air (Figure 4d,e). With heating, direct and funnel/tubing collection resulted in similar efficiencies, with the long tubing only marginally lowering the counts relative to short tubing. The total particle volumes collected (Figure 4f) per liter of exhaled breath are ca. 15-fold higher than for the breathing activity (Figure 4c), with the exception of collection through the unheated funnel with 1 m tubing, which showed a lower, ca. five-fold, increase due to the loss of particles with diameters greater than ~3 μm (Figure 4d,e).

3.5. Plosives

As discussed above, some mixing of room air with exhaled breath occurs during ‘popeye’ and counting activities due to the bursts of air entering the front face of the funnel, diluting the number of aerosols entering the chamber compared to direct injection. For direct injection, the volume of breath entering the chamber exceeded 1 L, but results were normalized to 1 L of breath using Equation (2).
As seen in Figure 4g, the size distribution of aerosol particles observed for the plosive-rich ‘popeye’ depends strongly on the injection method. Slightly lower values seen for diameters ≤ 2 μm for the funnel-guided arrangements reflect the above-noted mixing with room air. Aerosol counts for these small particles are comparable to those seen for ‘aah’ vocalization (Figure 4d). In contrast to direct injection, for larger diameters, the funnel-guided collection methods yielded a rapidly decreasing number of particles with increasing size. Indeed, the total aerosol volume obtained via direct injection is larger by ca. 30-fold compared to the funnel collections with the 7.5 cm tubing, and by about 100-fold compared to the long tubing (Figure 4i). This result suggests that inertia impaction on the funnel surface of these droplets that exit the mouth at considerable speeds [34,39] dominates their fate and thereby curbs their entry into the chamber.

3.6. Counting

Counting the numbers 1–12 is more representative of regular speech than repeats of the plosive-rich ‘popeye’. As was observed for ‘popeye’, the humidity increase of the chamber after counting exceeded 1 L but results were adjusted for that. As was the case for ‘popeye’, some mixing with room air took place upon counting, somewhat lowering the counts observed for the funnel/tubing collection of the small aerosols compared to direct injection (Figure 4j). Similar to ‘popeye’, the size distribution for larger aerosols strongly diverges between the direct injection and funnel-guided methods, albeit to a lesser extent than seen for ‘popeye’. This result indicates that inertia impaction again causes substantial losses in the number of particles that reach the aerosol detector. As was the case for ‘popeye’, the total volume of emitted particles for counting is dominated by coarse aerosol, i.e., particles ≥ 5 μm (Figure 4h,k).

4. Discussion

In prior analyses, funnels were widely used to guide exhaled aerosols into the narrow inlet port of the detector [19,25,26,27,29]. Such an arrangement works well for counting small particles exiting the mouth at a low velocity, such as generated by breathing or by vowel sounds that then follow the airflow. Indeed, our funnel-guided and direct injection measurements yield very similar profiles for these activities and agree fairly well with the prior literature [37,44]. However, this funnel-guided mode fails for larger speech droplets generated at the front of the oral cavity (lips and teeth) [45] that exit the mouth at speeds as high as 30 m/s [32], while having a mass that exceeds their dehydrated mass by up to two orders of magnitude [37]. With the lips less than ~7 cm from the funnel surface, the Stokes number for such droplets is greater than one, making them subject to impaction or “splatter”. Indeed, for the ‘popeye’ and counting measurements, the particle size distributions remain nearly flat up to diameters of ~10 μm, covered by our OPS instrument (Figure 4g,j), whereas a strong drop-off at D ≥ 4 μm is observed for the funnel-guided measurements. While the difference relative to the funnel-guided measurements may not appear dramatic at first sight, its actual impact can be seen when considering the total aerosol volumes per liter of exhaled breath that are one to two orders of magnitude smaller for the funnel-guided measurements than for direct injection.
While our measurements relied on an OPS, which counts particles ranging in size from 0.3–10 μm with an “oversize bin” for particles > 10 μm, most studies in the literature involved an APS with a 20 μm upper limit cutoff. Such APS instruments have decreased detection efficiency at larger sizes [37], in particular for ‘sticky’ particles that have not completely dehydrated [38], as may be the case after traveling under saturated humidity through the tubing. This lowered APS detection efficiency will further magnify the difference between our direct-injection OPS observations and funnel-guided APS values in the literature.
For a typical respiration rate of 10 L/min, consisting of half inspiration and half expiration, the average expiration rate of 20 L/min, with a peak that is higher than that, can substantially exceed the constant intake of air through the funnel drawn by the particle sizer. While in several such measurements, the air intake by the funnel was increased above that of the 5 L/min intake by a single APS instrument [27,29], and corrections can be made if the difference between exhalation and funnel intake rates is known, there remains considerable uncertainty in the actual amount of exhaled breath entering the detector due to mixing with room air in the funnel cone. In our measurements, the humidity data (Figure 3) indicated that this effect was largest for the ‘popeye’ and counting activities, which involved a strongly modulated exhalation airflow.

4.1. Impact on Disease Transmission

While it may be argued that aerosols greater than ~5 μm have shorter airborne lifetimes due to their faster gravitational deposition, the sedimentation velocity is only ca. 0.3 cm/s even for a 10 μm particle. This corresponds to an exponential decay constant of ~1000 s, or more than 15 min, for the concentration of such particles in a well-mixed room with a 3 m ceiling height.
Particles ≤ 5 μm are often considered most relevant to disease transmission because this size represents the cutoff for entering the deep lung, where infection causes pneumonia, which is associated with severe disease [46,47]. However, the now almost universally present Omicron variants of SARS-CoV-2 promote infection of the upper respiratory tract, from where they can enter the lungs through micro-aspiration [48] or, speculatively, snoring-generated aerosols of upper respiratory tract fluids [49]. Therefore, the deposition of the larger particles in the upper respiratory tract, including the trachea and the bronchi, can represent an effective infection mechanism.
The need to avoid nucleated condensation for accurate sizing of respiratory particles has long been recognized. The effect can be mitigated by conducting measurements in a climate chamber regulated above body temperature [50]. Others prevented condensation by heating all measurement equipment and tubing to above 40 °C [51,52]. Unless complete dehydration of the respiratory particles is achieved, it can be challenging to estimate the actual amount of respiratory fluids from which the particles originated. The time needed for full dehydration is a function of size, shape, and relative humidity, and can also be impacted by the surface composition of the droplet. Therefore, unless special precautions are taken, the hydration state of particles, guided to an aerosol detector by a funnel and tubing, can be difficult to define. The use of a low-humidity collection chamber in our setup ensured full dehydration of the particles prior to measurement. Considering that dehydration reduces the volume of respiratory aerosols by 30- to 100-fold, measuring them in a fully dehydrated state removes a high degree of uncertainty regarding the actual amount of respiratory fluids that the aerosols represent. We note that several advanced modeling studies used the aerosol volumes reported by Morawska et al. [24] as a direct measure for respiratory fluid, without accounting for the unknown degree of dehydration [10,53]. This approach then required the assumption of extremely high viral loads of the respiratory fluid to obtain consistency with observed infection rates at superspreader events.
Indeed, prior modeling of airborne virus transmission partially compensated for the low literature values of respiratory aerosol mass by assuming extreme viral loads, as high as 1011 RNA copies/mL, to reach an infectious dose of N0 = 1000 virions [10], or a less extreme value of 109 copies/mL to find N0 = 10 virions [11]. The latter is about four to five orders of magnitude lower than found in a human challenge study [22], and therefore unrealistic. Two factors dominate this large discrepancy in infectious dose: (1) as shown above, the amount of respiratory aerosol resulting from speaking is about one to two orders of magnitude larger than previously measured by funnel-guided aerosol detectors; (2) patient viral loads reported in the medical literature refer to copies per mL of fluid but, with some exceptions [16], have been used without correction as input for the viral load in the partially or fully dehydrated aerosols. Virus concentrations in dehydrated particles can be up to two orders of magnitude higher than in the respiratory fluid because the volume of the ejected droplets shrinks by that much after entering the atmosphere [37].

4.2. Impact on Ventilation Requirements

Our ‘collect first, measure later’ method [23,35] indicates that, while particles larger than ~5 μm represent the dominant volume fraction of aerosols, the vast majority of them do not get counted when using the common funnel-and-tubing arrangement to guide aerosols to the detector. Our finding that the airborne mass is dominated by these larger particles, which settle on the time scale of minutes, not hours, has important implications for methods employed to curb virus transmission. High ventilation will substantially mitigate transmission only if the air turnover rate is much higher than the sedimentation rate, which may be difficult to achieve for these larger aerosols. For example, in the Marin County superspreading event, an unmasked teacher infected more than 75% of students near the front of a highly ventilated classroom, but far fewer in the back [35,54]. Fortunately, emission of these larger aerosols is easily blocked by facemasks [13], with mask leakage [55] less of a concern for the corresponding, even larger, hydrated droplets as these will mostly inertia-deposit on the mask rather than follow the airflow that escapes around the mask’s edges.

4.3. Limitations

Limited by an IRB exemption that permitted the study of respiratory aerosol detection methods for only a single person, our measured aerosol volumes may not be representative of the general population. However, we note that for breathing and the ‘aah’ vowel sound, they are comparable to values reported by Morawska et al. [24]. After correction for dehydration, our values are also comparable to those reported based on laser light scattering [23] and involving a different speaker. We also note that both our present and earlier reports involved speaking at a very loud level, 85–88 dB, which is known to increase the emission of speech aerosols [19,25,29]. However, such a loud level of speaking is not uncommon in crowded places such as cocktail receptions, bars, and restaurants, which have been implicated in numerous superspreader events [2,56]. It is possible that the loudness of our voicing activities increased the degree of impaction and thereby losses in the funnel-guided measurements. On the other hand, we note that the average particle velocities measured by Roth et al. at the mouth opening showed only a modest increase between speaking at 85 dB and shouting at 107 dB [34].
With a total volume of only 7 L, the linear dimensions of our dehydration chamber are fairly small. Despite the rapid dehydration in the low-humidity air of the chamber compared to the high-humidity air inside a funnel cone, impaction of the larger and faster speech particles may have occurred in our direct injection measurements. It therefore is plausible that the onset of a rapid decrease in speech aerosol counts at diameters above 10 μm (Figure 4g,j) is caused by such impaction. Indeed, neither light scattering measurements that covered particles up to diameters of 100 μm [35] nor the classic measurements by Loudon and Roberts [57] showed evidence for such an abrupt decline. The use of a dehydration chamber larger than that employed in our study and a particle detector that extends accurate sizing to diameters larger than 10 μm therefore seems desirable.

5. Concluding Remarks

Our measurements showed that guiding small respiratory aerosols through a funnel and tubing towards a dehydration chamber provides very similar results compared to directly entering this respiratory aerosol into the chamber. The use of a funnel and tubing to guide particles to a detector therefore is an adequate method for evaluating particles generated by breathing and by ‘aah’ vowel sounds that both involve small particles and an exhaled airstream that is not strongly modulated. By contrast, far fewer large particles are detected when using the funnel and tubing for collecting aerosols generated by regular speaking than by directly injecting this speech air into the chamber. This finding is consistent with the dearth of particles larger than ca. five microns in funnel-guided speech aerosol measurements, which contrasts with the classic measurements of Duguid [4], Loudon and Roberts [57], historic photographic observations [58], and numerous recent video recordings [23,29,30,39,59]. Despite the faster sedimentation rates of aerosols larger than 5 μm, they can dominate the total airborne mass and thereby the disease transmission probability. These larger particles cannot directly enter the deep lung and the pathogens they contain will primarily cause infections of the upper respiratory tract. However, subsequent transfer of upper respiratory tract fluids, which then are enriched in these pathogens, into the lung can cause pneumonia.

Supplementary Materials

The following supporting information can be downloaded at: https://www.mdpi.com/article/10.3390/atmos15050570/s1, Figure S1: Photographs of the experimental setup.

Author Contributions

Conceptualization, A.B. and T.K.; methodology, T.K. and A.B.; Experimental setup, T.K.; formal analysis, T.K.; data curation, T.K.; writing, A.B. and T.K. All authors have read and agreed to the published version of the manuscript.

Funding

This research was funded by the National Institute of Diabetes and Digestive and Kidney Diseases (NIDDK; grant# DK075154).

Institutional Review Board Statement

Not applicable.

Informed Consent Statement

Not applicable.

Data Availability Statement

All TSI data files and code for analyzing the data are available at https://zenodo.org/records/11094850 (accessed 5 May 2024).

Acknowledgments

This work was supported by the Intramural Research Programs of the National Institute of Diabetes and Digestive and Kidney Diseases. We thank Nancy Alexander for assistance in obtaining an exemption from the NIH Institutional Review Board, Philip Anfinrud, William A. Eaton, Ingrid Pufahl and Dennis A. Torchia for helpful discussions, and Philip Anfinrud for making available clean-air laboratory space.

Conflicts of Interest

The authors declare no conflicts of interest.

Abbreviations

AH absolute humidity
AHb absolute humidity of exhaled breath
AHc absolute humidity of air in chamber
αOPS chamber ventilation rate by the OPS
αwall rate of particle losses due to non-gravitational deposition chamber walls
APS aerodynamic particle sizer
CN,D(t) particle number concentration at time t
Dparticle diameter
IDinner diameter
ΔRH increase in chamber relative humidity
ffraction of chamber aerosol sampled
fLfemtoliter
Hchamber height
HEPAhigh efficiency particulate air [filter]
λtotal rate of particle depletion in chamber
Nnumber of virions
N0infectious dose number of virions
OPS optical particle sizer
P(N)probability of infection upon inhaling N virions
PCR polymerase chain reaction
ρparticle mass density
RH relative humidity
RHc relative humidity in detection chamber
RNA ribonucleic acid
s second
tTime
Tduration of chamber sampling by OPS
vparticle gravitational velocity
Vbexhaled breath volume
Vcchamber volume

References

  1. Wang Chia, C.; Prather Kimberly, A.; Sznitman, J.; Jimenez Jose, L.; Lakdawala Seema, S.; Tufekci, Z.; Marr Linsey, C. Airborne transmission of respiratory viruses. Science 2021, 373, eabd9149. [Google Scholar] [CrossRef] [PubMed]
  2. Stadnytskyi, V.; Anfinrud, P.; Bax, A. Breathing, speaking, coughing or sneezing: What drives transmission of SARS-CoV-2? J. Intern. Med. 2021, 290, 1010–1027. [Google Scholar] [CrossRef] [PubMed]
  3. Zhang, R.; Li, Y.; Zhang, A.L.; Wang, Y.; Molina, M.J. Identifying airborne transmission as the dominant route for the spread of COVID-19. Proc. Natl. Acad. Sci. USA 2020, 117, 14857. [Google Scholar] [CrossRef]
  4. Duguid, J.P. The size and the duration of air-carriage of respiratory droplets and droplet-nuclei. J. Hyg. 1946, 44, 471–479. [Google Scholar] [CrossRef] [PubMed]
  5. Oran, D.P.; Topol, E.J. Prevalence of Asymptomatic SARS-CoV-2 Infection. Ann. Intern. Med. 2020, 173, 362–367. [Google Scholar] [CrossRef]
  6. Gandhi, M.; Yokoe, D.S.; Havlir, D.V. Asymptomatic Transmission, the Achilles’ Heel of Current Strategies to Control COVID-19. N. Engl. J. Med. 2020, 382, 2158–2160. [Google Scholar] [CrossRef] [PubMed]
  7. Johnson, G.R.; Morawska, L. The Mechanism of Breath Aerosol Formation. J. Aerosol Med. Pulm. Drug Deliv. 2009, 22, 229–237. [Google Scholar] [CrossRef] [PubMed]
  8. Piralla, A.; Pariani, E.; Rovida, F.; Campanini, G.; Muzzi, A.; Emmi, V.; Iotti, G.A.; Pesenti, A.; Conaldi, P.G.; Zanetti, A.; et al. Segregation of Virulent Influenza A(H1N1) Variants in the Lower Respiratory Tract of Critically Ill Patients during the 2010–2011 Seasonal Epidemic. PLoS ONE 2011, 6, e28332. [Google Scholar] [CrossRef] [PubMed]
  9. Buonanno, G.; Morawska, L.; Stabile, L. Quantitative assessment of the risk of airborne transmission of SARS-CoV-2 infection: Prospective and retrospective applications. Environ. Int. 2020, 145, 10. [Google Scholar] [CrossRef]
  10. Miller, S.L.; Nazaroff, W.W.; Jimenez, J.L.; Boerstra, A.; Buonanno, G.; Dancer, S.J.; Kurnitski, J.; Marr, L.C.; Morawska, L.; Noakes, C. Transmission of SARS-CoV-2 by inhalation of respiratory aerosol in the Skagit Valley Chorale superspreading event. Indoor Air 2021, 31, 314–323. [Google Scholar] [CrossRef]
  11. Bazant, M.Z.; Bush, J.W.M. A guideline to limit indoor airborne transmission of COVID-19. Proc. Natl. Acad. Sci. USA 2021, 118, e2018995118. [Google Scholar] [CrossRef] [PubMed]
  12. Pourfattah, F.; Wang, L.P.; Deng, W.; Ma, Y.F.; Hu, L.; Yang, B. Challenges in simulating and modeling the airborne virus transmission: A state-of-the-art review. Phys. Fluids 2021, 33, 101302. [Google Scholar] [CrossRef] [PubMed]
  13. Bagheri, G.; Thiede, B.; Hejazi, B.; Schlenczek, O.; Bodenschatz, E. An upper bound on one-to-one exposure to infectious human respiratory particles. Proc. Natl. Acad. Sci. USA 2021, 118, e2110117118. [Google Scholar] [CrossRef] [PubMed]
  14. Prentiss, M.; Chu, A.; Berggren, K.K. Finding the infectious dose for COVID-19 by applying an airborne-transmission model to superspreader events. PLoS ONE 2022, 17, e0265816. [Google Scholar] [CrossRef]
  15. Mikszewski, A.; Stabile, L.; Buonanno, G.; Morawska, L. The airborne contagiousness of respiratory viruses: A comparative analysis and implications for mitigation. Geosci. Front. 2022, 13, 101285. [Google Scholar] [CrossRef]
  16. Chaudhuri, S.; Kasibhatla, P.; Mukherjee, A.; Pan, W.L.; Morrison, G.; Mishra, S.; Murty, V.K. Analysis of overdispersion in airborne transmission of COVID-19. Phys. Fluids 2022, 34, 051914. [Google Scholar] [CrossRef]
  17. Wells, W.F. Airborne Contagion and Air Hygiene; Harvard University Press: Cambridge, UK, 1955. [Google Scholar]
  18. To, G.N.S.; Chao, C.Y.H. Review and comparison between the Wells-Riley and dose-response approaches to risk assessment of infectious respiratory diseases. Indoor Air 2010, 20, 2–16. [Google Scholar]
  19. Archer, J.; McCarthy, L.P.; Symons, H.E.; Watson, N.A.; Orton, C.M.; Browne, W.J.; Harrison, J.; Moseley, B.; Philip, K.E.J.; Calder, J.D.; et al. Comparing aerosol number and mass exhalation rates from children and adults during breathing, speaking and singing. Interface Focus 2022, 12, 20210078. [Google Scholar] [CrossRef] [PubMed]
  20. Sender, R.; Bar-On, Y.M.; Gleizer, S.; Bernshtein, B.; Flamholz, A.; Phillips, R.; Milo, R. The total number and mass of SARS-CoV-2 virions. Proc. Natl. Acad. Sci. USA 2021, 118, e2024815118. [Google Scholar] [CrossRef]
  21. Karimzadeh, S.; Bhopal, R.; Nguyen Tien, H. Review of infective dose, routes of transmission and outcome of COVID-19 caused by the SARS-COV-2: Comparison with other respiratory viruses. Epidemiol. Infect. 2021, 149, e96. [Google Scholar] [CrossRef]
  22. Killingley, B.; Mann, A.J.; Kalinova, M.; Boyers, A.; Goonawardane, N.; Zhou, J.; Lindsell, K.; Hare, S.S.; Brown, J.; Frise, R.; et al. Safety, tolerability and viral kinetics during SARS-CoV-2 human challenge in young adults. Nat. Med. 2022, 28, 1031–1041. [Google Scholar] [CrossRef]
  23. Stadnytskyi, V.; Bax, C.E.; Bax, A.; Anfinrud, P. The airborne lifetime of small speech droplets and their potential importance in SARS-CoV-2 transmission. Proc. Natl. Acad. Sci. USA 2020, 117, 11875–11877. [Google Scholar] [CrossRef]
  24. Morawska, L.; Johnson, G.R.; Ristovski, Z.D.; Hargreaves, M.; Mengersen, K.; Corbett, S.; Chao, C.Y.H.; Li, Y.; Katoshevski, D. Size distribution and sites of origin of droplets expelled from the human respiratory tract during expiratory activities. J. Aerosol Sci. 2009, 40, 256–269. [Google Scholar] [CrossRef]
  25. Asadi, S.; Wexler, A.S.; Cappa, C.D.; Barreda, S.; Bouvier, N.M.; Ristenpart, W.D. Aerosol emission and superemission during human speech increase with voice loudness. Sci. Rep. 2019, 9, 2348. [Google Scholar] [CrossRef] [PubMed]
  26. Asadi, S.; Wexler, A.S.; Cappa, C.D.; Barreda, S.; Bouvier, N.M.; Ristenpart, W.D. Effect of voicing and articulation manner on aerosol particle emission during human speech. PLoS ONE 2020, 15, e0227699. [Google Scholar] [CrossRef] [PubMed]
  27. Gregson, F.K.A.; Watson, N.A.; Orton, C.M.; Haddrell, A.E.; McCarthy, L.P.; Finnie, T.J.R.; Gent, N.; Donaldson, G.C.; Shah, P.L.; Calder, J.D.; et al. Comparing aerosol concentrations and particle size distributions generated by singing, speaking and breathing. Aerosol Sci. Technol. 2021, 55, 681–691. [Google Scholar] [CrossRef]
  28. Caracci, E.; Stabile, L.; Ferro, A.R.; Morawska, L.; Buonanno, G. Respiratory particle emission rates from children during speaking. Sci. Rep. 2023, 13, 18294. [Google Scholar] [CrossRef]
  29. Alsved, M.; Matamis, A.; Bohlin, R.; Richter, M.; Bengtsson, P.E.; Fraenkel, C.J.; Medstrand, P.; Londahl, J. Exhaled respiratory particles during singing and talking. Aerosol Sci. Technol. 2020, 54, 1245–1248. [Google Scholar] [CrossRef]
  30. Bahl, P.; de Silva, C.; Bhattacharjee, S.; Stone, H.; Doolan, C.; Chughtai, A.A.; MacIntyre, C.R. Droplets and Aerosols generated by singing and the risk of COVID-19 for choirs. Clin. Infect. Dis. 2020, 72, e639–e641. [Google Scholar] [CrossRef]
  31. Schlenczek, O.; Thiede, B.; Turco, L.; Stieger, K.; Kosub, J.M.; Muller, R.; Scheithauer, S.; Bodenschatz, E.; Bagheri, G. Experimental measurement of respiratory particles dispersed by wind instruments and analysis of the associated risk of infection transmission. J. Aerosol Sci. 2023, 167, 106070. [Google Scholar] [CrossRef]
  32. Roth, A.; Frantz, D.; Stiti, M.; Berrocal, E. High-speed scattered-light imaging for sizing respiratory droplets. J. Aerosol Sci. 2023, 174, 106257. [Google Scholar] [CrossRef]
  33. Hu, N.; Yuan, F.; Gram, A.; Yao, R.; Sadrizadeh, S. Review of experimental measurements on particle size distribution and airflow behaviors during human respiration. Build. Environ. 2024, 247, 110994. [Google Scholar] [CrossRef]
  34. Roth, A.; Stiti, M.; Frantz, D.; Corber, A.; Berrocal, E. Exhaled aerosols and saliva droplets measured in time and 3D space: Quantification of pathogens flow rate applied to SARS-CoV-2. Nat Sci. 2023, 3, e20230007. [Google Scholar] [CrossRef]
  35. Shen, Y.; Courtney, J.M.; Anfinrud, P.; Bax, A. Hybrid measurement of respiratory aerosol reveals a dominant coarse fraction resulting from speech that remains airborne for minutes. Proc. Natl. Acad. Sci. USA 2022, 119, e2203086119. [Google Scholar] [CrossRef]
  36. Netz, R. Mechanisms of airborne infection via evaporating and sedimenting droplets produced by speaking. J. Phys. Chem. B 2020, 124, 7093–7101. [Google Scholar] [CrossRef]
  37. Bagheri, G.; Schlenczek, O.; Turco, L.; Thiede, B.; Stieger, K.; Kosub, J.M.; Clauberg, S.; Pohlker, M.L.; Pohlker, C.; Molacek, J.; et al. Size, concentration, and origin of human exhaled particles and their dependence on human factors with implications on infection transmission. J. Aerosol Sci. 2023, 168, 106102. [Google Scholar] [CrossRef]
  38. Volckens, J.; Peters, T.M. Counting and particle transmission efficiency of the aerodynamic particle sizer. J. Aerosol Sci. 2005, 36, 1400–1408. [Google Scholar] [CrossRef]
  39. Abkarian, M.; Stone, H.A. Stretching and break-up of saliva filaments during speech: A route for pathogen aerosolization and its potential mitigation. Phys. Rev. Fluids 2020, 5, 102301. [Google Scholar] [CrossRef]
  40. Oswin, H.P.; Haddrell, A.E.; Otero-Fernandez, M.; Mann, J.F.S.; Cogan, T.A.; Hilditch, T.G.; Tian, J.; Hardy, D.A.; Hill, D.J.; Finn, A.; et al. The dynamics of SARS-CoV-2 infectivity with changes in aerosol microenvironment. Proc. Natl. Acad. Sci. USA 2022, 119, e2200109119. [Google Scholar] [CrossRef]
  41. Vejerano, E.P.; Marr, L.C. Physico-chemical characteristics of evaporating respiratory fluid droplets. J. R. Soc. Interface 2018, 15, 20170939. [Google Scholar] [CrossRef]
  42. Corner, J.; Pendlebury, E.D. The coagulation and deposition of a stirred aerosol. Proc. Phys. Soc. Lond. B 1951, 64, 645–654. [Google Scholar] [CrossRef]
  43. Bake, B.; Larsson, P.; Ljungkvist, G.; Ljungstrom, E.; Olin, A.C. Exhaled particles and small airways. Respir. Res. 2019, 20, 8. [Google Scholar] [CrossRef]
  44. Pöhlker, M.L.; Pöhlker, C.; Krüger, O.O.; Förster, J.D.; Berkemeier, T.; Elbert, W.; Fröhlich-Nowoisky, J.; Pöschl, U.; Bagheri, G.; Bodenschatz, E.; et al. Respiratory aerosols and droplets in the transmission of infectious diseases. Rev. Mod. Phys. 2023, 95, 045001. [Google Scholar] [CrossRef]
  45. Morawska, L.; Buonanno, G.; Mikszewski, A.; Stabile, L. The physics of respiratory particle generation, fate in the air, and inhalation. Nat. Rev. Phys. 2022, 4, 723–734. [Google Scholar] [CrossRef] [PubMed]
  46. Gralton, J.; Tovey, E.; McLaws, M.L.; Rawlinson, W.D. The role of particle size in aerosolised pathogen transmission: A review. J. Infect. 2011, 62, 1–13. [Google Scholar] [CrossRef]
  47. Tellier, R.; Li, Y.; Cowling, B.J.; Tang, J.W. Recognition of aerosol transmission of infectious agents: A commentary. BMC Infect. Dis. 2019, 19, 101. [Google Scholar] [CrossRef] [PubMed]
  48. Hou, Y.X.J.; Okuda, K.; Edwards, C.E.; Martinez, D.R.; Asakura, T.; Dinnon, K.H.; Kato, T.; Lee, R.E.; Yount, B.L.; Mascenik, T.M.; et al. SARS-CoV-2 Reverse Genetics Reveals a Variable Infection Gradient in the Respiratory Tract. Cell 2020, 182, 429–442. [Google Scholar] [CrossRef]
  49. Bax, A.; Shen, Y.; Kakeshpour, T.; Fennelly, K.P. Snoring may transmit infectious aerosols from the upper to the lower respiratory tract. Med. Hypotheses 2022, 168, 110966. [Google Scholar] [CrossRef]
  50. Holmgren, H.; Bake, B.; Olin, A.-C.; Ljungström, E. Relation Between Humidity and Size of Exhaled Particles. J. Aerosol Med. Pulm. Drug Deliv. 2011, 24, 253–260. [Google Scholar] [CrossRef] [PubMed]
  51. Schumm, B.; Heiber, M.; Grätz, F.; Stabile, L.; Buonanno, G.; Schönfelder, M.; Hain, R.; Kähler, C.J.; Wackerhage, H. Respiratory aerosol particle emission and simulated infection risk is greater during indoor endurance than resistance exercise. Proc. Natl. Acad. Sci. USA 2023, 120, e2220882120. [Google Scholar] [CrossRef]
  52. Mutsch, B.; Heiber, M.; Grätz, F.; Hain, R.; Schönfelder, M.; Kaps, S.; Schranner, D.; Kähler, C.J.; Wackerhage, H. Aerosol particle emission increases exponentially above moderate exercise intensity resulting in superemission during maximal exercise. Proc. Natl. Acad. Sci. USA 2022, 119, e2202521119. [Google Scholar] [CrossRef] [PubMed]
  53. Peng, Z.; Rojas, A.L.P.; Kropff, E.; Bahnfleth, W.; Buonanno, G.; Dancer, S.J.; Kurnitski, J.; Li, Y.; Loomans, M.G.L.C.; Marr, L.C.; et al. Practical Indicators for Risk of Airborne Transmission in Shared Indoor Environments and Their Application to COVID-19 Outbreaks. Environ. Sci. Technol. 2022, 56, 1125–1137. [Google Scholar] [CrossRef] [PubMed]
  54. Lam-Hine, T.; McCurdy, S.A.; Santora, L.; Duncan, L.; Corbett-Detig, R.; Kapusinszky, B.; Willis, M. Outbreak Associated with SARS-CoV-2 B.1.617.2 (Delta) Variant in an Elementary School—Marin County, California, May–June 2021. Morb. Mortal. Wkly. Rep. 2021, 70, 1214–1219. [Google Scholar] [CrossRef] [PubMed]
  55. Schmitt, J.; Wang, J. Quantitative modeling of the impact of facemasks and associated leakage on the airborne transmission of SARS-CoV-2. Sci. Rep. 2021, 11, 19403. [Google Scholar] [CrossRef] [PubMed]
  56. Majra, D.; Benson, J.; Pitts, J.; Stebbing, J. SARS-CoV-2 (COVID-19) superspreader events. J. Infect. 2021, 82, 36–40. [Google Scholar] [CrossRef] [PubMed]
  57. Loudon, R.G.; Roberts, R.M. Droplet expulsion from respiratory tract. Am. Rev. Resp. Dis. 1967, 95, 435–442. [Google Scholar] [PubMed]
  58. Wells, W.F.; Wells, M.W.; Mudd, S. Infection of Air Bacteriologic and Epidemiologic Factors. Am. J. Public Health 1939, 29, 863–880. [Google Scholar] [CrossRef]
  59. Anfinrud, P.; Stadnytskyi, V.; Bax, C.E.; Bax, A. Visualizing Speech-Generated Oral Fluid Droplets with Laser Light Scattering. N. Engl. J. Med. 2020, 382, 2061–2063. [Google Scholar] [CrossRef]
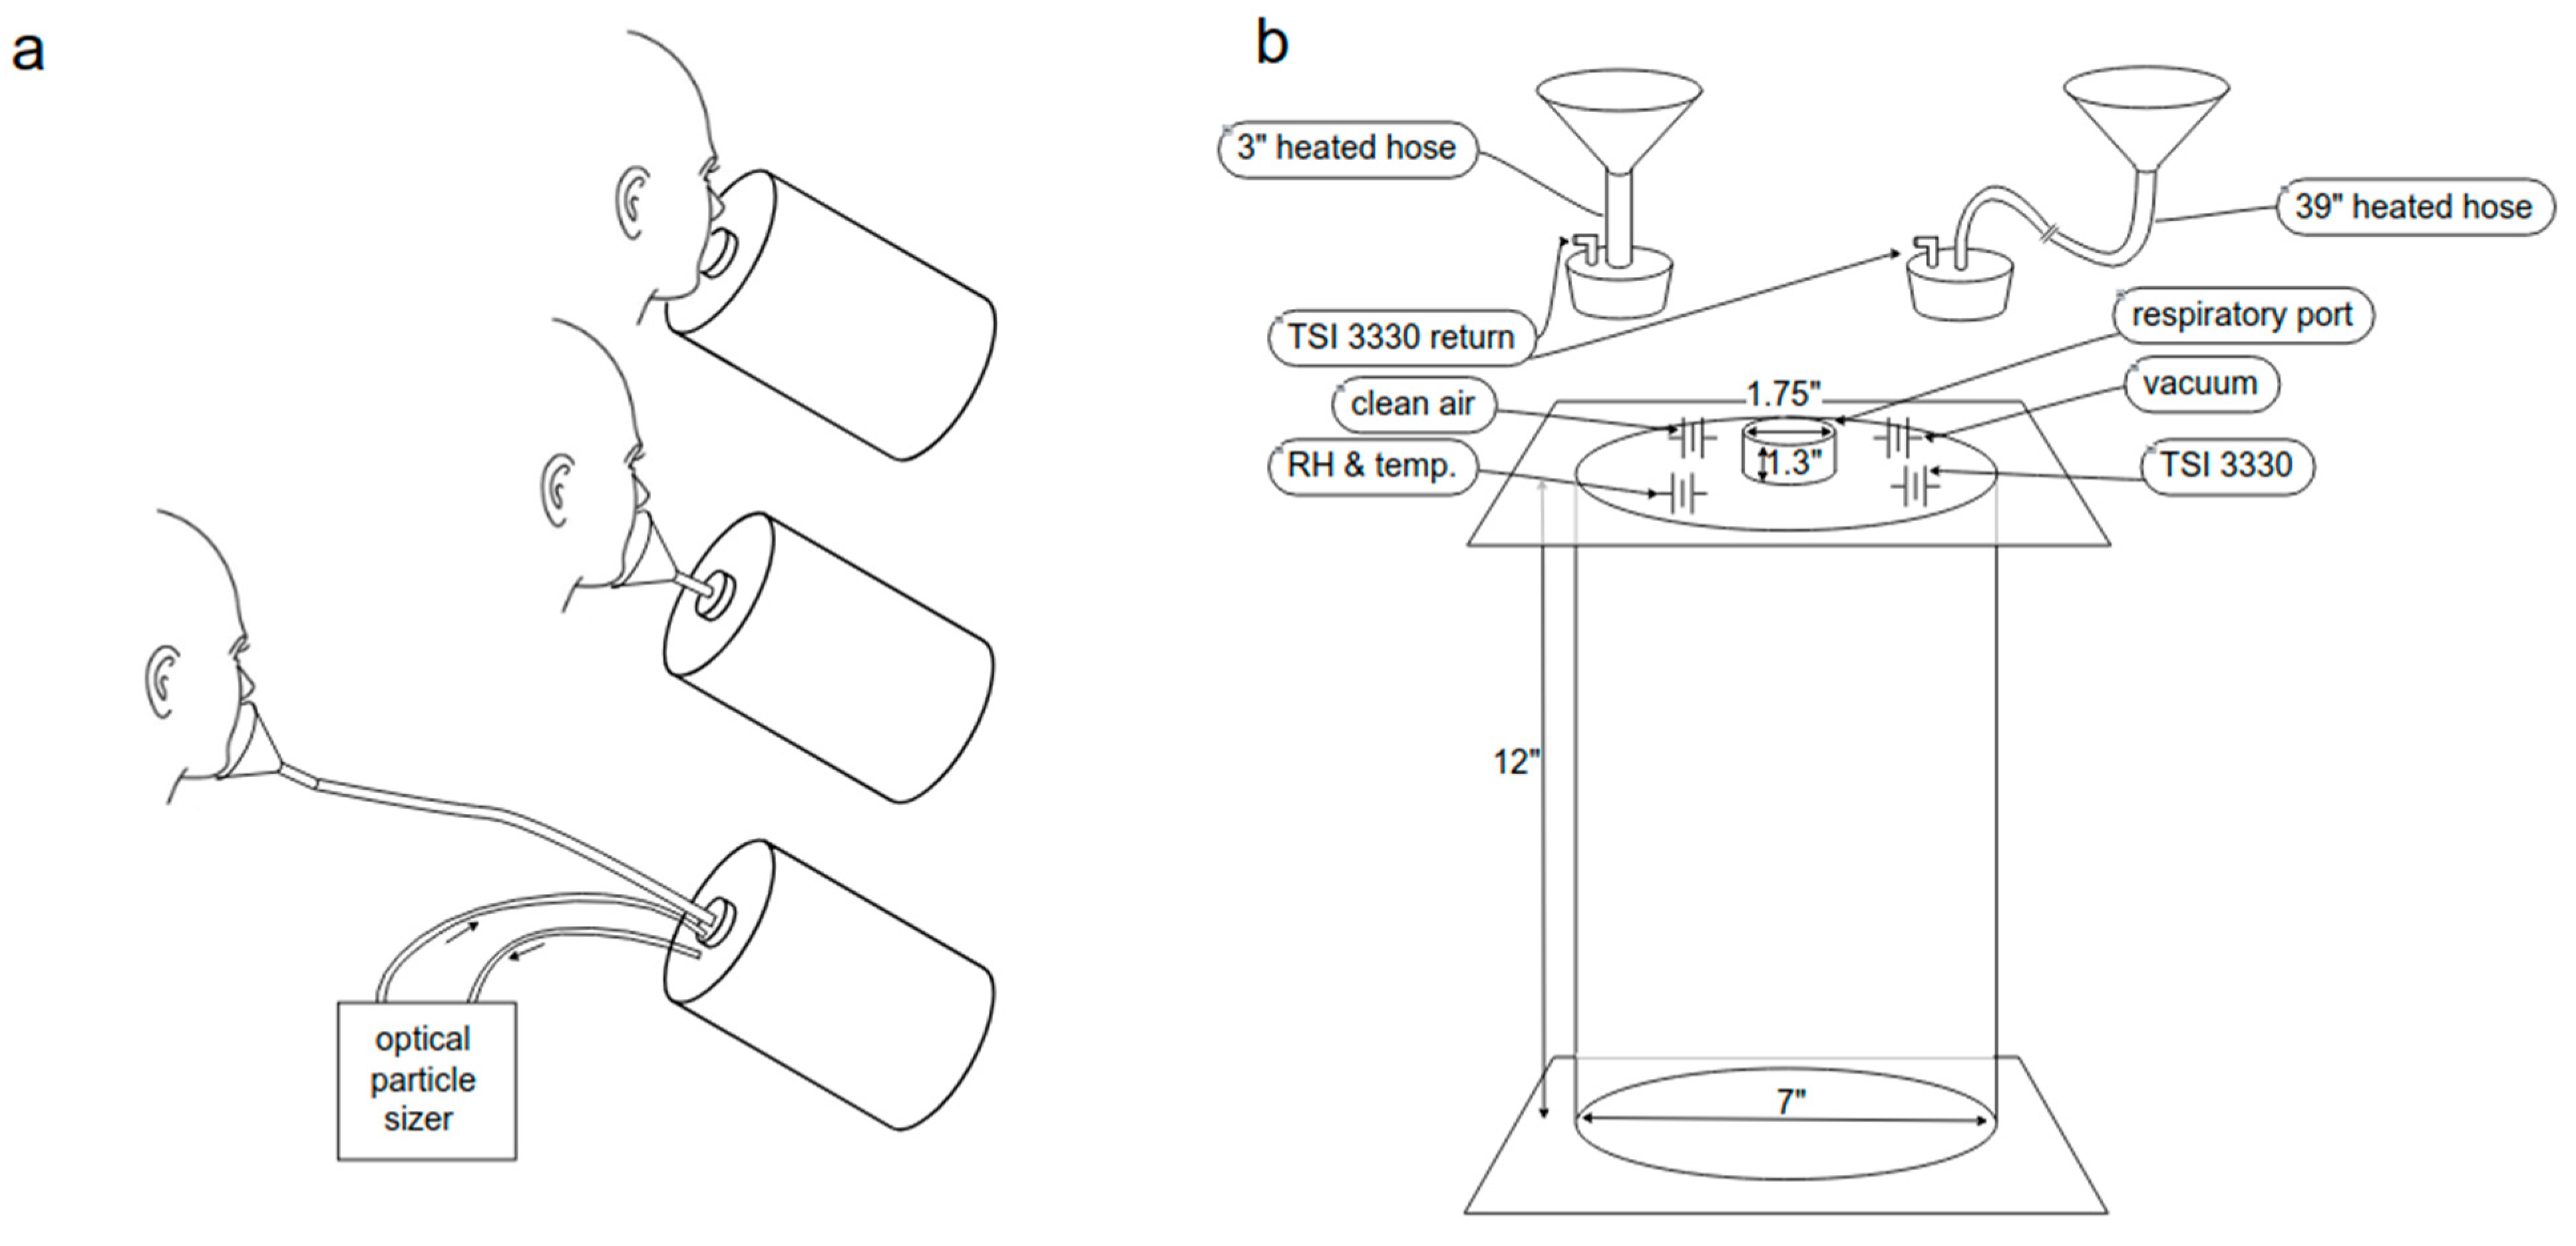
Figure 1. Experimental setup for aerosol measurements. (a) Analysis of respiratory aerosols by an OPS after direct injection into a dehydration chamber (top), via a funnel and 7.5 cm of tubing (center), or via a funnel connected by 1 m of conductive tubing (bottom). The funnel and tubing are coated by heating elements that can raise their temperatures to 40 °C. (b) Details of the dehydration chamber. A vacuum line draws air at 5 L/min into the chamber for the 12 s duration of the respiratory activity. For direct injection, the actual amount of air entering the chamber is derived from the RH increase, measured with a rapid response Honeywell HIH-5030 humidity sensor and a thermocouple sensor. The OPS withdraws air from the 7 L chamber at 1 L/min for three minutes after terminating the respiratory activity, with this air returned into the chamber after HEPA filtering. For photographs of the experimental setup, see Supplementary Materials.
Atmosphere 15 00570 g001
Figure 2. Increase in relative humidity, ΔRH, inside the dehydration chamber resulting from respiratory activity. RH ≤ 1% prior to each activity. (a) For continuous slow exhalation at a rate of ca. 0.2 L/s into the unheated funnel and short tubing (UFST); the heated funnel and short tubing (HFST); the unheated funnel and 1 m length tubing (UFLT); and the heated funnel and long tubing (HFLT). (b) Comparison of ΔRH for different respiratory activities (silent exhalation, ‘aah’, ‘popeye’, and counting 1–12), all using the heated funnel with short tubing setup. (c) ΔRH by direct injection for four respiratory activities: silent exhalation, ‘aah’, ‘popeye’, and counting 1–12. (d) Volumes, Vc, of exhaled air entering into the chamber derived from these direct-inject ΔRH values. Error bars correspond to standard deviations over the five repeats, and for (d), do not include the up to 20% variation in the reported humidity of exhaled air [24].
Atmosphere 15 00570 g002
Figure 3. Sedimentation of speech particles. (a) Curves represent the best-fitted mono-exponential decay of the normalized concentration, CN,D(t)/CN,D(0), of speech particles of diameter D in the dehydration chamber at time t after the start of the measurement, ca. 10 s after the end of the respiratory activity. The black dashed line represents the exp(−0.14t) loss in particle concentration due to the OPS recycling air (after HEPA filtering) back into the chamber at a rate of 1 L/min. (b) Best-fitted exponential decay rates, λ, as a function of D2. Error bars represent the residual standard errors obtained from non-linear least-squares fits in panel (a). The dashed line represents the best linear fit to the decay rates of particles for which the size was known (black circles). The rate measured for the oversize bin (purple circle) then corresponds to D = 10.3 ± 0.6 μm. (c) Fraction, f, of aerosols collected from the dehydration chamber by three minutes of OPS sampling.
Atmosphere 15 00570 g003
Figure 4. Analyses of aerosols per liter of exhaled breath measured after four respiratory activities (breath, ‘aah’, ‘popeye’, counting) and five collection modes: direct injection (purple); a room temperature funnel with short tubing (blue); the same but both funnel and tubing heated to 40 °C (red); a funnel followed by 100 cm tubing, both at room temperature (green); the same at 40 °C (orange). Respiratory activities: (ac) Breath; (df) a 12 s continuous loud (87 ± 1.5 dBA) ‘aah’ sound; (gi) six repeats of the word ‘popeye’ (87.5 ± 1.5 dBA) spoken over a duration of ca. 11 s after one deep inhalation; (jl) counting 1–12 in a single breath (87 ± 2 dBA). The grey line represents ambient background contamination when the volunteer goes through the same motions as used for breathing but without exhaling. Symbols represent geometric averages, with bin counts of zero replaced by the linear average over all five measurements to permit calculation of a geometric average for bins in which at least one of the five measurements had non-zero counts. (a,d,g) Particle size distributions versus particle diameter, D, derived from the 17 bin counts of the TSI-OPS. Counts are corrected for the quantity of exhaled breath actually entering the chamber and for the fraction (35%) of chamber air sampled, and for size-dependent particle sedimentation in the chamber during the 3 min OPS sampling (c.f. Equation (4)). The rightmost bin contains particles too large for accurate sizing by the OPS, but whose size is estimated at 10.3 ± 0.6 μm from their gravitational sedimentation rate (Figure 3b). (b,e,h,k) Corresponding dehydrated volumes versus particle diameter. (c,f,i,l) Total dehydrated particle volumes per liter of exhaled breath, measured by the five collection modes.
Atmosphere 15 00570 g004
Disclaimer/Publisher’s Note: The statements, opinions and data contained in all publications are solely those of the individual author(s) and contributor(s) and not of MDPI and/or the editor(s). MDPI and/or the editor(s) disclaim responsibility for any injury to people or property resulting from any ideas, methods, instructions or products referred to in the content.