Article

FY-4A Measurement of Cloud-Seeding Effect and Validation of a Catalyst T&D Algorithm

1
School of Electronic Engineering, Chengdu University of Information Technology, Chengdu 610225, China
2
China Meteorological Administration Artificial Weather Centre, Beijing 100081, China
3
School of Atmospheric Physics, Nanjing University of Information Science & Technology, Nanjing 210044, China
4
Weather Modification Center of Henan Province, Zhengzhou 450000, China
5
Beijing ChenJing Technology Co., Ltd., Beijing 100081, China
*
Author to whom correspondence should be addressed.
Atmosphere 2024, 15(5), 556; https://doi.org/10.3390/atmos15050556
Submission received: 10 March 2024 / Revised: 10 April 2024 / Accepted: 23 April 2024 / Published: 30 April 2024
(This article belongs to the Section Atmospheric Techniques, Instruments, and Modeling)

Abstract

:
The transport and dispersion (T&D) of catalyst particles seeded by weather modification aircraft is crucial for assessing their weather modification effects. This study investigates the capabilities of the Chinese geostationary weather satellite FY-4A for identifying the physical response of cloud seeding with AgI-based catalysts and continuously monitoring its evolution for a weather event that occurred on 15 December 2019 in Henan Province, China. Satellite measurements are also used to verify an operational catalyst T&D algorithm. The results show that FY-4A exhibits a remarkable capability of identifying the cloud-seeding tracks and continuously tracing their evolution for a period of over 3 h. About 60 min after the cloud seeding, the cloud crystallization track became clear in the FY-4A tri-channel composite cloud image and lasted for about 218 min. During this time period, the cloud track moved with the cloud system about 153 km downstream (northeast of the operation area). An operational catalyst T&D model was run to simulate the cloud track, and the outputs were extensively compared with the satellite observations. It was found that the forecast cloud track closely agreed with the satellite observations in terms of the track widths, morphology, and movement. Finally, the FY-4A measurements show that there were significant differences in the microphysical properties across the cloud track. The effective cloud radius inside the cloud track was up to 15 μm larger than that of the surrounding clouds; the cloud optical thickness was about 30 μm smaller; and the cloud-top heights inside the cloud track were up to 1 km lower. These features indicate that the cloud-seeding catalysts led to the development of ice-phase processes within the supercooled cloud, with the formation of large ice particles and some precipitation sedimentation.

1. Introduction

Artificial weather modification is an intervention in regional and local cloud physical processes under certain appropriate weather conditions to achieve the purpose of artificial precipitation (and snow) enhancement, hail, rain, fog, and so on [1,2]. In recent years, with the continuous development of society and the economy and frequent droughts induced by climate change, artificial precipitation enhancement operations around the world have continued to grow, especially in China, with artificial catalytic operational activities using aircraft, rockets, and anti-aircraft guns. However, there is still very limited understanding about the transport and dispersion (T&D) and nucleation processes of catalysts seeded into clouds, as well as about the physical response of clouds to cloud seeding.
Several studies have been carried out to study the dispersion of catalysts in clouds. Shen et al. [3] used a turbulent gradient transport calculation method based on the free-atmosphere dispersion equation to study the dispersion pattern of single-point and multi-point line sources. They also investigated the effect of wind speed changes with altitude on the dispersion of catalysts. However, the study mainly investigated the transient state and is not applicable to aircraft cloud seeding with continuously moving catalyst releases. Yu et al. [4] established a new type of catalyst T&D model based on the coupled modeling of a cloud model and a T&D model. The model’s accuracy is closely related to the prediction accuracy of the cloud model, and its computation is slow, which has great limitations for operational applications. Zhou et al. [5] developed a simple but practically effective T&D model for aircraft cloud seeding that computes the moving platform catalyst release using an approximation of an analytical T&D estimation of continuous instantaneous point sources at different locations and times [5]. This model has been used operationally for weather modification operations in China.
To assess the physical response of cloud seeding, Woodley and Rosenfeld et al. [6] studied two cases of cloud seeding in Texas and found that ice particles grew in the seeded area through the AVHRR (Advanced Very-High-Resolution Radiometer), a probe instrument carried by NOAA satellites, and that the cloud top temperature of the seeded area was higher than the surrounding area. Rosenfeld et al. [7,8] analyzed an aircraft artificial precipitation enhancement operation on 14 March 2000 in Shaanxi, China, and found that cloud seeding caused the formation of a cloud track from the NOAA satellite cloud-top observation maps. Analysis of an aircraft artificial precipitation enhancement operation in Shanxi on 15 December 2017 by Wang et al. [9] also identified cloud tracks formed at cloud top portions after cloud seeding from the FY-3C polar-orbiting and TERRA satellites. Until now, all the “cloud tracks” discovered have been based on polar-orbiting satellites, which are not capable of monitoring the temporal evolution of the cloud tracks caused by cloud seeding.
Contemporary geostationary satellites provide minute-level, high-resolution cloud observations and present the capability of obtaining the evolution of detailed cloud structures, including cloud-seeding cloud tracks. FY-4A is a geostationary meteorological satellite that was successfully launched on 11 December 2016. It carries the Advanced Geostationary Radiation Imager (AGRI) with 14 channels, capable of achieving regional 5 min and global 15 min cloud maps for continuous observation of cloud evolutions [10]. Since 2017, the National Satellite Meteorological Centre has been operationally releasing cloud products with high temporal and spatial resolution (5 min interval) from the FY-4A satellite, including the cloud-top height, cloud-top temperature, cloud effective particle radius, and cloud optical thickness [11]. The quality of the data is comparable to the accuracy of similar cloud products from Himawari-8 [12]. These FY-4A products have been used to study the microphysical evolution of clouds [13,14,15,16].
The FY-3D polar-orbiting satellite was launched on 14 November 2017. It carries the MERSI-II Visible and Infrared Spectral Imaging Instrument (MERSI-II VISI from the China Satellite Meteorological Centre, Beijing, China), with a swath width of ~2800 km and 25 imaging channels centered on wavelengths ranging from 0.412 to 12.0 μm. Among them, six channels have a spatial resolution of 250 m, and the others have a spatial resolution of 1000 m [17]. Its accuracy is comparable to that of the MODIS (Moderate Resolution Imaging Spectroradiometer) [18,19]. FY-3D provides finer imaging products to study cloud properties [20].
We analyzed the cloud track produced by the aircraft artificial precipitation enhancement operation carried out in Henan Province for the weather case. This paper is organized as follows: In Section 2, an overview of the field operations, the aircraft flight information used, and data processing are introduced. In Section 3, the FY-4A geostationary satellite is used to identify the cloud track lines caused by this seeded cloud and to study its dynamic evolution characteristics. A comparison with high-resolution FY-3D MERSI-II observations is also conducted. In Section 4, the catalyst distribution of the aircraft cloud seeding is computed with the T&D model proposed by Zhou et al. [5], and the results are carefully compared with the cloud track observations of FY-4A. In Section 5, the microphysical characteristics of clouds on and around the cloud track are analyzed, and finally, conclusions are provided in Section 6.

2. Overview of the Cloud-Seeding Operation and Data Processing

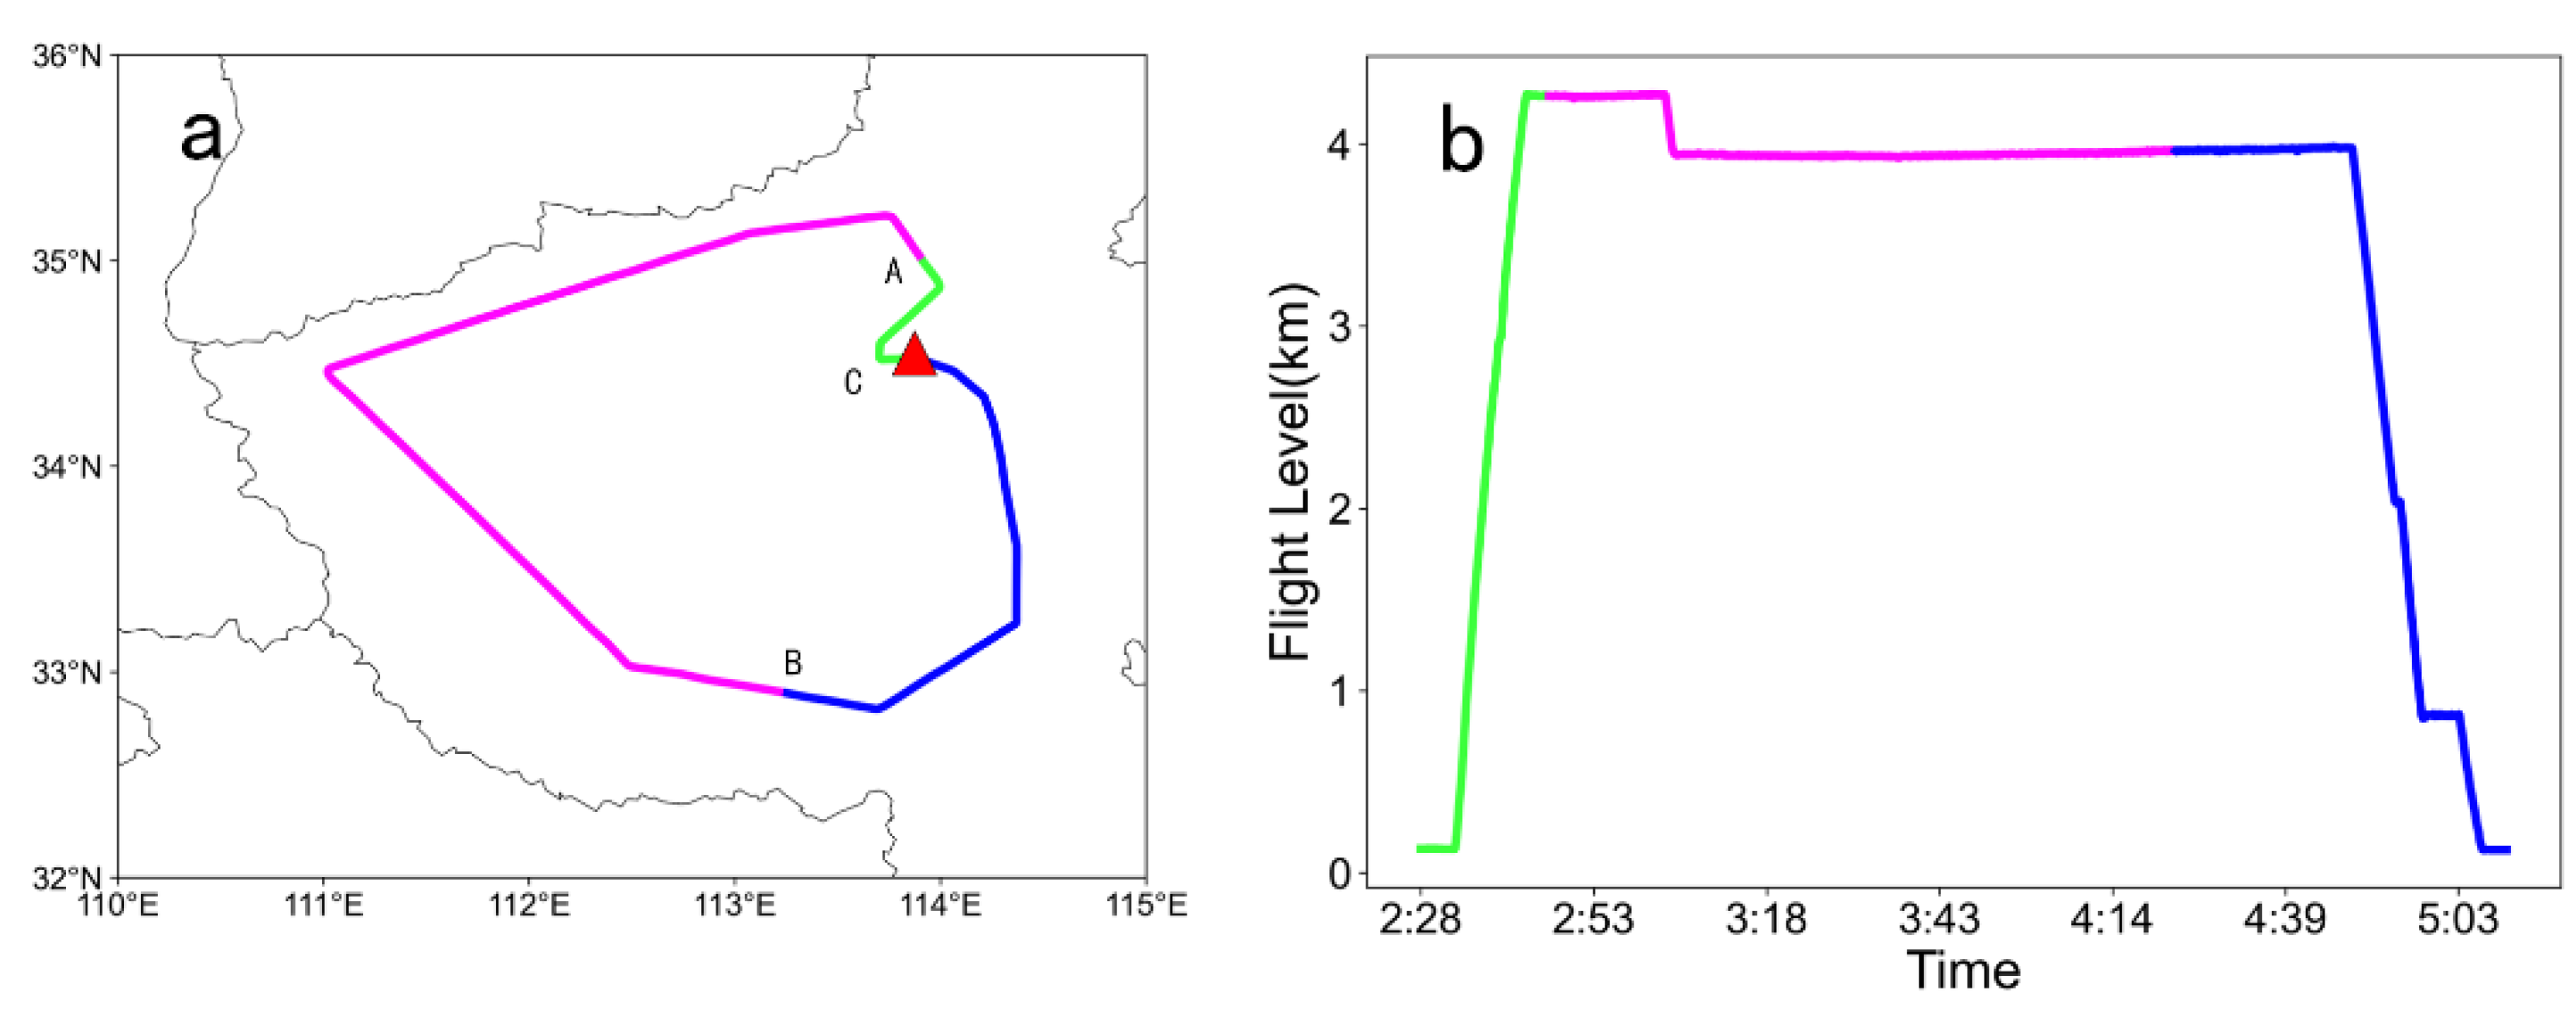
2.1. Flight Operations

At 01:00 on 15 September 2019 (assuming GMT unless otherwise noted), Henan province was covered by a broad cloud system. It moved from the southwest to the northeast at a speed of about 40–50 km/h. The south-central part of Henan featured a single-layer medium-low cloud, and the cloud-top height from FY-4A was below 5 km. The northern part of the system was a multilayer cloud, and the cloud-top height of the lowest layer was also less than 5 km. The satellite cloud-top temperature was around −15 °C. The cloud characteristics of this weather system present cold-cloud-seeding operating conditions.
An aircraft cloud-seeding operation was carried out in Henan Province for the cloud. The aircraft took off from Zhengzhou Xinzheng Airport at 02:30 (point C in Figure 1a, the red triangle) and returned to the airport at 05:07. The catalyst seeding time period was 96 min, from 02:47 to 04:23 (points A–B in Figure 1a). The seeding height was 3930 m–4263 m, the temperature was about −8 °C to −10 °C, and the height of the 0 °C layer was about 845 m. The flight path of the aircraft is shown in Figure 1.

2.2. Satellite Data, Products, and Processing

The cloud observations of FY-4A have been increasingly used to support artificial weather modification operations in China [21]. The data used included L1-level channel radiance and L2-level cloud products released by the Satellite Center Operations. The L1 channel data used are mainly the cloud-sensitive 0.47, 0.83, and 0.65 μm channels, available at a resolution of 1 km. A 0.47 μm radiance is used for validation of the catalyst T&D model, and the other channels are used for data fusion processing. The L2-level cloud products include the cloud-top height, cloud-top temperature, cloud particle effective radius, and cloud optical thickness at a spatial resolution of 4 km. The time resolution of the channel data and cloud products is 5 to 15 min.
The satellite data were processed using the Cloud Precipitation Real-Time Fine Processing and Analysis System (CPAS), a tool developed for the real-time processing of satellite-/aircraft-/ground-based cloud physics observations and generating cloud information to support cloud-seeding condition forecasting and decision-making for weather modification operations in China [22].
In this study, the 0.83 μm (R (red)), 0.65 μm (G (green)), and 0.47 μm (B (blue)) channels of the FY-4A AGRI data were synthesized into a tri-channel color fusion image using the CPAS system with RGB fusion technology. The physical significance of the colors varies depending on the channel used to fuse the images [23,24]. The fused image responds to the depth of the clouds, with the color shifting from dark green to bright yellow, representing a shift from thin to deep clouds. The temporal resolution of the fused images is consistent with satellite channel observations, and their spatial resolution is 1 km. Similarly, the 10.8 μm, 1.64 μm, 0.65 μm, and 0.47 μm channels of the FY-3D satellite MERSI-II (available at 05:40) were also composited into RGB images using CPAS. The produced tri-channel fusion cloud image has a spatial resolution of 1 km, where yellow represents supercooled clouds with small droplets, orange represents supercooled clouds with medium droplets, and red represents ice clouds [25].

3. Satellite Identification of the Cloud Track and Its Evolutionary Characteristics

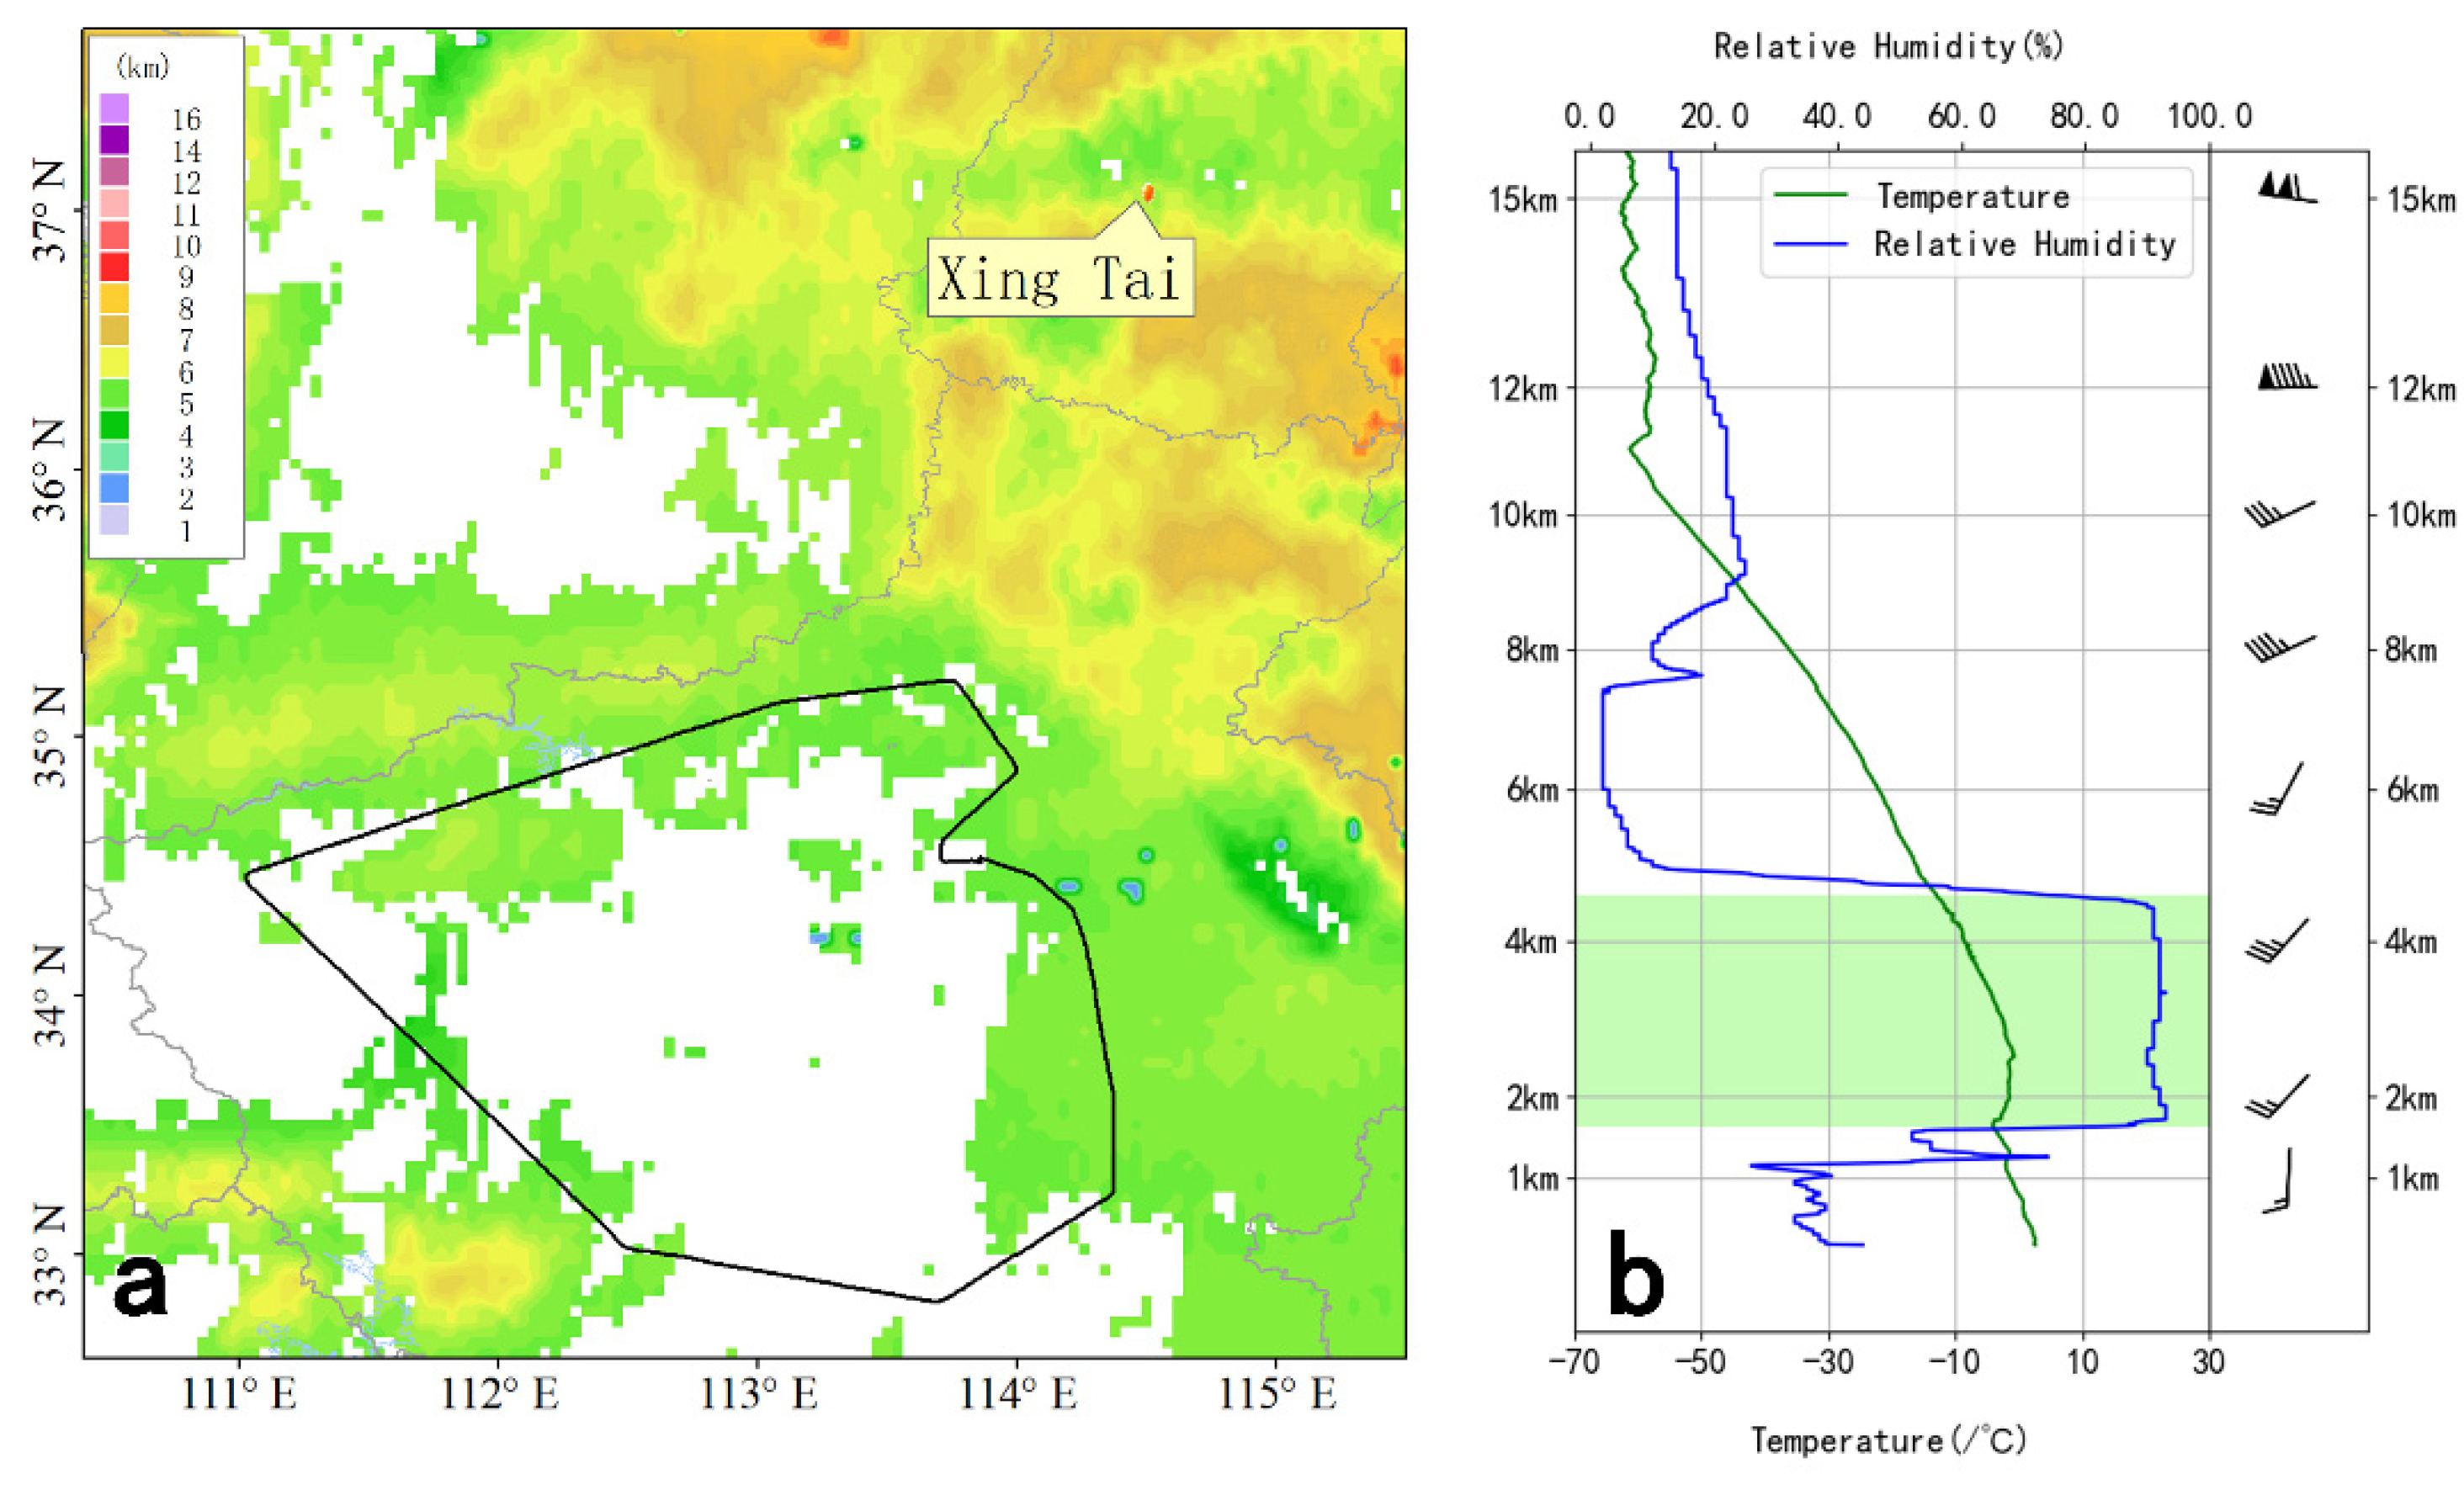
3.1. Structure of the Cloud System

Figure 2a shows the map of the satellite cloud-top height at 00:00 on 15 December 2019, with the nearest sounding station downstream of the aircraft operation area (Xingtai station). Figure 2b shows the Xingtai L-band radiosonde sounding at 00:00 on 15 December 2019. The height of the aircraft seeding layer was about 4260 m, the average wind speed was about 13 m/s, and the wind direction was about 223°. The green shadow in Figure 2b shows the cloud layer at 00:00, i.e., a single-layer cloud below 5 km. The depth of the cloud base was about 1700 m, and the cloud-top height was about 4600 m. The aircraft flew at the upper part of the cloud near the cloud top, and the atmospheric temperature was about −10 °C.
Figure 3 presents the cloud-top height observed by FY-4A at several subsequent times during the cloud-seeding operation. The flight trajectories are superimposed up to the corresponding selected time. Figure 3 shows that the overall cloud features in the aircraft flight area are relatively uniform, but different parts still show some obvious non-uniformity. Before 03:15, the clouds were relatively uniform during the flight phase, but there were unevenly distributed high clouds in the northern part of the flight path. By 03:49, these uneven high clouds had moved northeasterly to the northern part of the flight path, and the clouds had become more uniform during the flight phase. After 03:49, the aircraft moved into an uneven cloud area.
Based on the analysis above, the cloud-seeding period (02:47~04:23) can be divided into three phases: 02:47~03:15 (the first segment), 03:15~03:49 (the middle segment), and 03:49~04:23 (the last segment). According to the ice accumulation state recorded by the aircraft, there was obvious ice accumulation between 03:15 and 03:49 in the second segment (marked in red), proving the existence of supercooled water during this period. Thus, we focused on this segment in this study, marked by the red line in Figure 3.

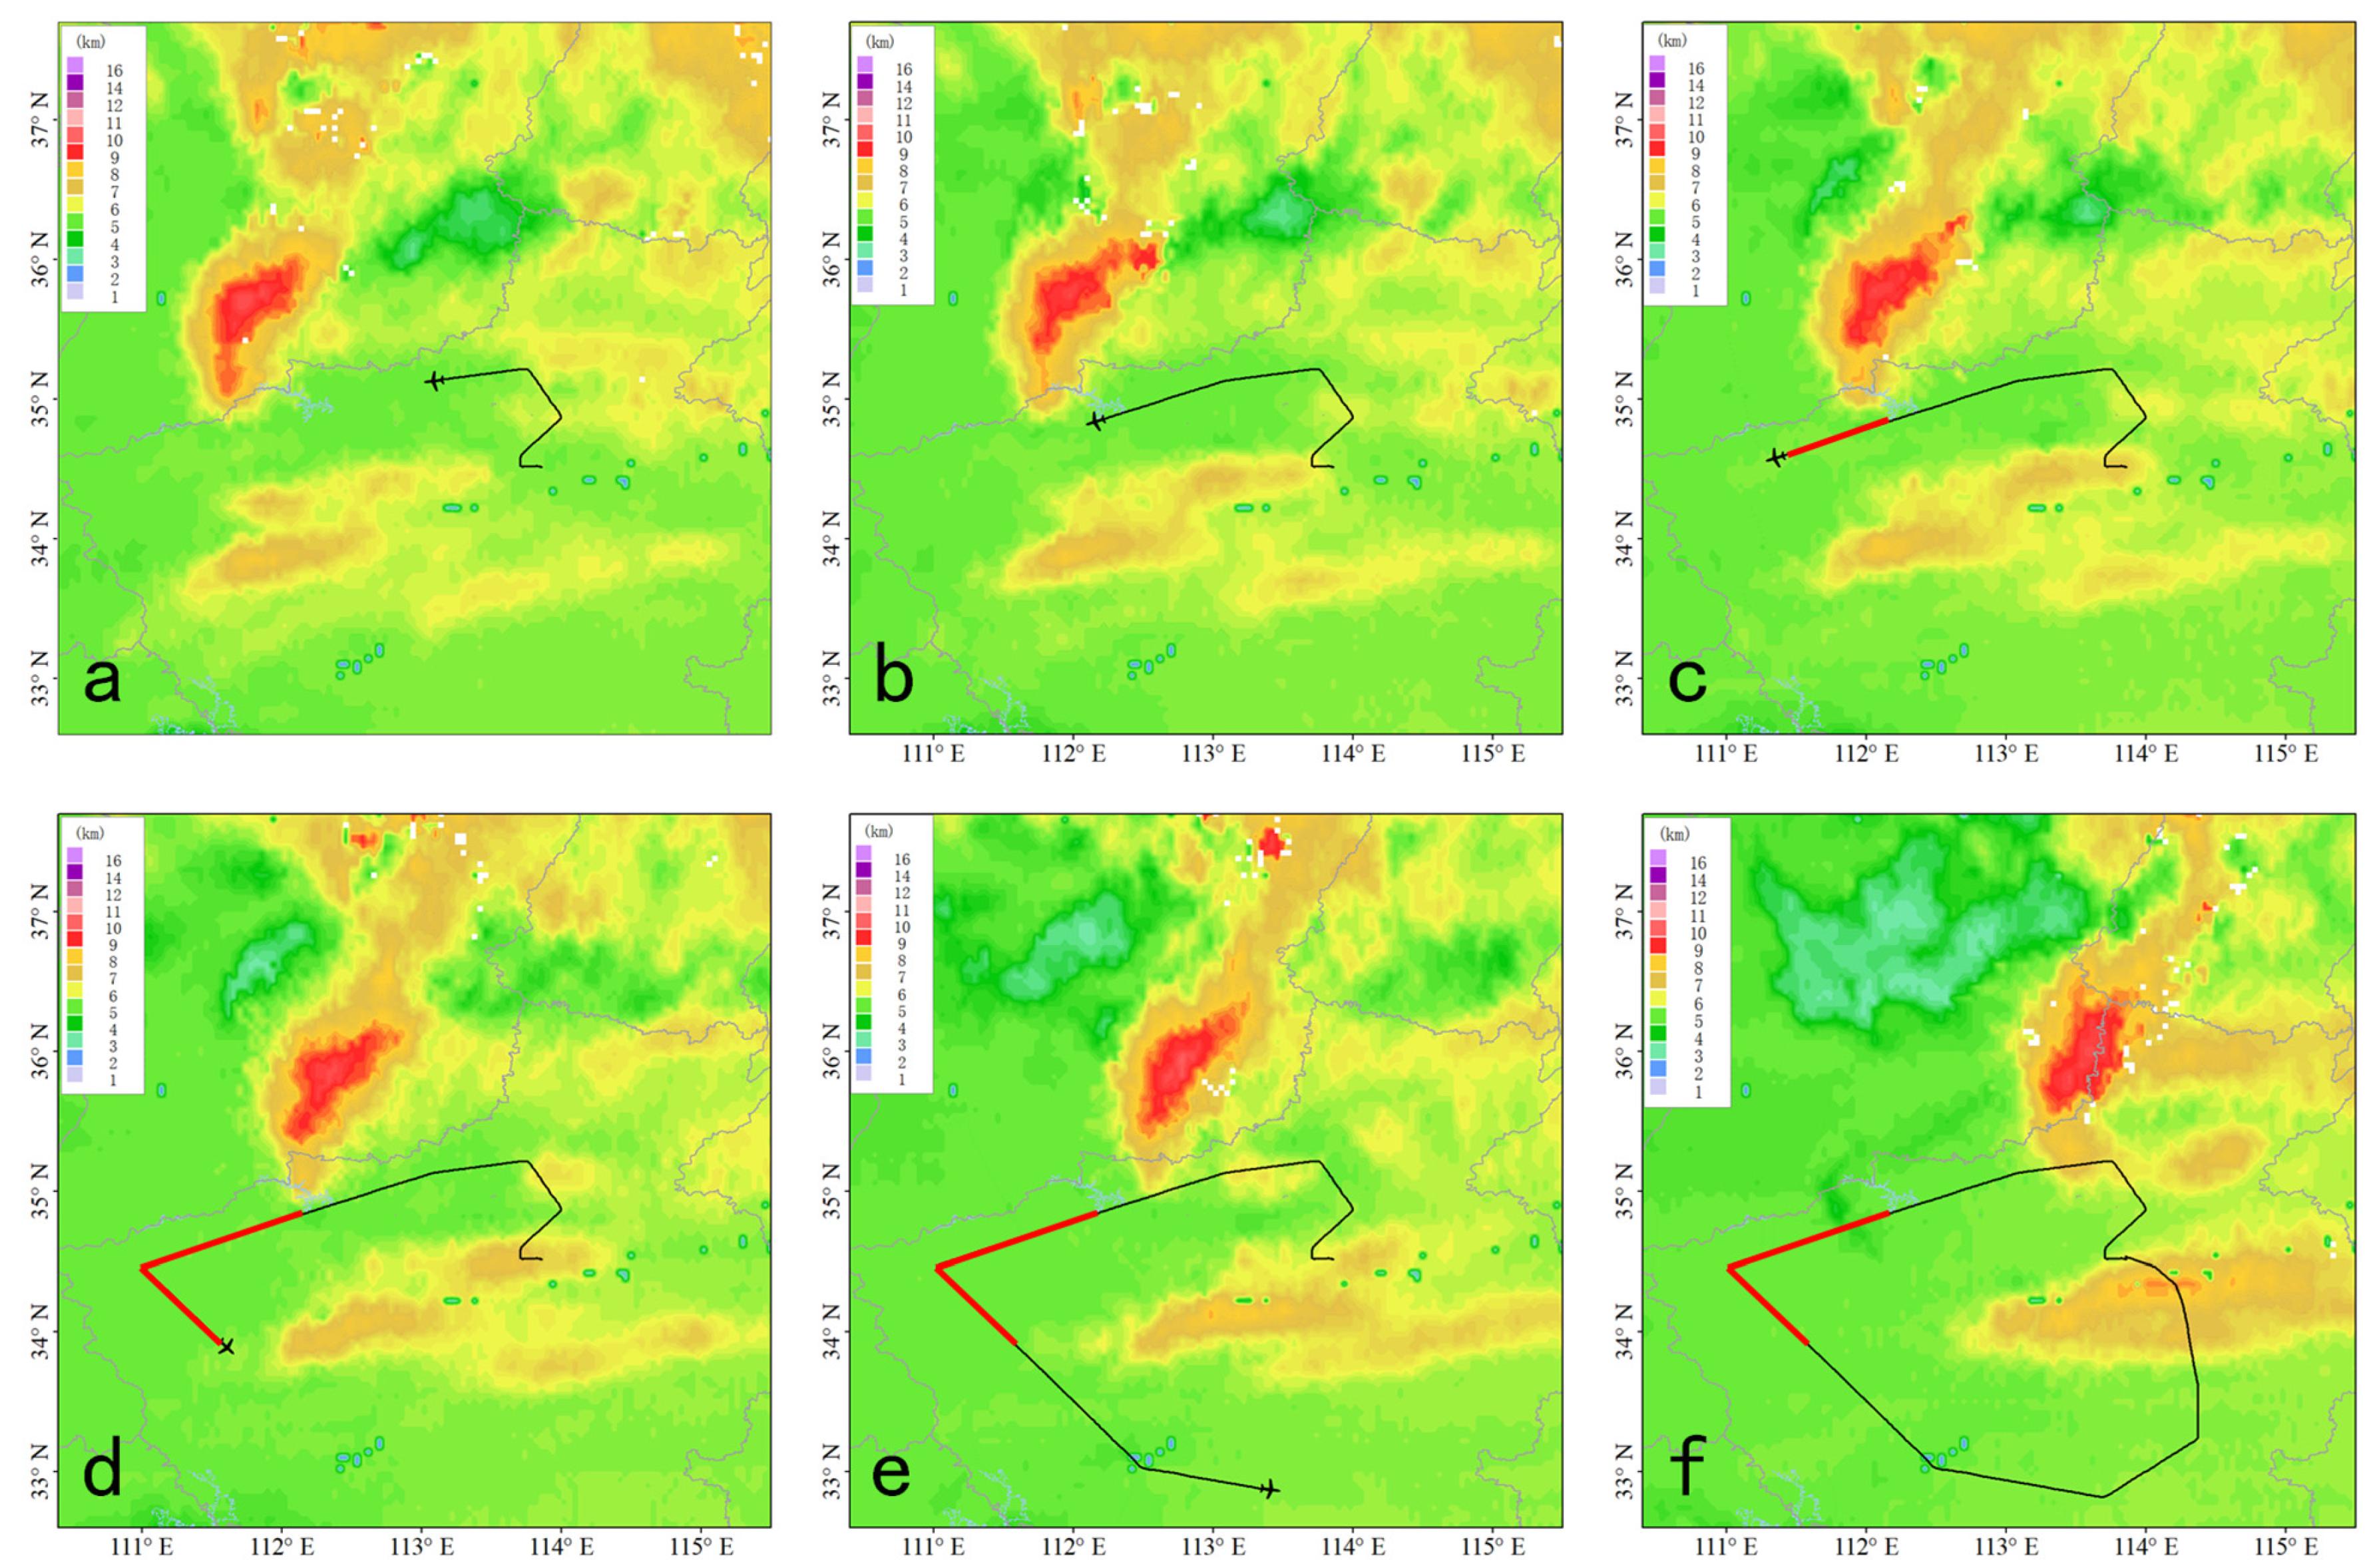
3.2. Evolution of the Seeding Cloud Track

After the aircraft cloud-seeding operation from 02:47 to 04:23, FY-4A observed a cloud track several times. According to the FY-4A five-minute tri-channel fusion images, the cloud-seeding cloud track first appeared at 03:34. Due to the influence of upper clouds, the satellite could not observe the cloud evolution in the operation area after the first half (02:47~03:15) and the second half of the operation (03:49~04:23). During the intermediate cloud-seeding phase from 03:15 (03:15~03:49), the clouds were relatively uniform, and there was ice accumulation. FY-4A continuously monitored the cloud track due to cloud seeding and its evolution. Herein, we focus on studying the cloud track at this stage. The catalytic influence zone was computed based on the aircraft catalytic particle T&D model and verified against the satellite observation of cloud track characteristics. We also analyze the microphysical characteristics of the catalyst-induced cloud track.
Figure 4 shows the FY-4A tri-channel-fused cloud images at 04:15 (a), 04:45 (b), 05:15 (c), 05:45 (d), 06:15 (e), 06:45 (f), 07:15 (g), and 07:53 (h). It can be seen that at 04:15, which was ~60 min after the cloud seeding (following the seeding period of 03:15~03:49), the influence of the cloud-seeding operation, i.e., the cloud track, was first observed, and crystallization began at this time. By 04:45 (90 min after the cloud seeding), a cloud track very similar to the trajectory of the aircraft cloud seeding appeared on the cloud image.
The cloud track monitored by FY-4A was blocked for a short time by some upper-level clouds. After the upper-level clouds moved out, the cloud track observed by FY-4A became more and more clear. At 05:45 (150 min after the cloud seeding, Figure 4d), the average width of the cloud track was about 16 km, and the length was about 200 km. By 07:53 (278 min after seeding), the cloud track had collapsed and dissipated. Thus, the cloud-seeding cloud track lasted for 190 min, from 04:15 to 07:53, and it moved about 153 km to the northeast of the operation area.

3.3. Comparison of the Cloud Track Observations of FY-4A and FY-3G

The FY-3D polar orbit satellite flew over the cloud-seeding area at 05:40. It also observed the effect of the cloud-seeding operation. Figure 5 compares the FY-3D tri-channel fusion cloud image at 05:40 (i.e., 145 min after the cloud seeding) with that of the 4A tri-channel fusion cloud image at 05:38. The FY-3D cloud images have higher spatial resolution and show sharper structures of the cloud track than those of FY-4A. Four cross-sections were intercepted arbitrarily along the red lines over the cloud track in Figure 5, and the widths of the cloud tracks observed by FY-3D and FY-4A on the sections were compared. The widths of the cloud tracks observed by the stationary satellites and polar-orbiting satellites were roughly the same, about 14~16 km.
The positions and widths of the cloud tracks presented by FY-4A and FY-3D in Figure 4 are very consistent. Geostationary satellites have the advantage of a high temporal resolution, which is conducive to our subsequent analysis of the development and evolution of the cloud tracks, so the FY-4A geostationary satellites were used.

4. Calculation and Verification of Aircraft Catalyst Cloud-Seeding Particle Dispersion Transport

4.1. Aircraft Catalytic Dispersion Calculation Model

The numerical scheme of the particle T&D model for aircraft catalytic operations is based on the analytical solution of point-source release [5]. It is used to calculate the dispersion range and concentration of the catalyst in clouds after the aircraft performs cloud seeding.
The particle T&D equation in a free atmosphere is as follows:
q t + u q x + v q y + w q z = k H 2 q x 2 + k H 2 q y 2 + k v 2 q z 2
where q is the concentration of particle substance; u ,   v , and w represent the wind components in the x ,   y , and z directions, respectively; k H and k v are the turbulence mixing coefficients (m2/s) in the horizontal and vertical directions, respectively; t is the time. Because the study’s scope was small and the time was short, the atmospheric environment was considered to be uniform, and the vertical velocity of the atmosphere was ignored.
The duration of aircraft seeding is long and continuous, so in the diffusion calculation of aircraft seeding, we can regard the aircraft seeding as a moving point source. In this paper, the aircraft operation period is divided into n parts by t , and t is taken as 1   s , which is equivalent to the aircraft flight   Δ s 100   m, which is used as a point source, and then this point source is t n ,   x n ,   y n ,   z n , and the catalytic concentration caused by each point x , y , z , t on the whole field is q n , as shown in Equation (2):
q n x , y , z , t = Q n 8 π 3 k H 2 k v t t n + t 3 × e x x n u t t n 2 4 k H t t n + t e y y n v t t n 2 4 k H t t n + t e z z n ω t t n 2 4 k v t t n + t
x n ,   y n ,   z n is the positional spatial location of the aircraft at t n , and the dispersion coefficient is generally taken as k H = 140 m2/s, k v = 70 m2/s for stratiform clouds by Zhou et al. [5]. Considering that each section of aircraft broadcasting is not a point source but has a certain initial width and length, it will be closer to the actual situation to simulate it by giving an initial time t * in the calculation, and here we take 10 s for t * . While Q n in Equation (2) can be viewed as the point source concentration at the t n , x n ,   y n ,   z n for the interval t time period, where R is the seeding rate (number/s), as shown in Equation (3):
Q n = R t
The total concentration q of broadcast by the aircraft is the sum of the dispersion concentrations qn from multiple point sources, as shown in Equation (4):
q q x , y , z , t = n = 1 N q n x , y , z , t
The interval of the aircraft seeding points ( x n ,   y n ,   z n ,   t n ) was set to one second, and the distance was V a 1 s. V a is the aircraft speed (unit: m/s). For example, for the one-hour cloud seeding, N = 3600 s. If the aircraft speed is 100 m/s, the source point spacing is 100 m, and the total length is 360 km.
In this case, the cloud seeding period was from 02:47 to 04:23, during which 4250 g of silver iodide was released. According to Figure 2b, the wind direction of the seeding layer (about 4260 m) was 223° and the wind speed was 13 m/s. By inputting the above parameters into Formula (2), the catalyst T&D influence zone can be calculated. Figure 6 illustrates the computed catalytic dispersion influence zone at 05:15 for the entire seeding period (02:47~04:23). The yellow line segment in Figure 6 represents the validated results at 05:15 for the second cloud-seeding segment calculated via the aircraft catalyst T&D model, corresponding to the cloud seeding during 03:15~03:49.

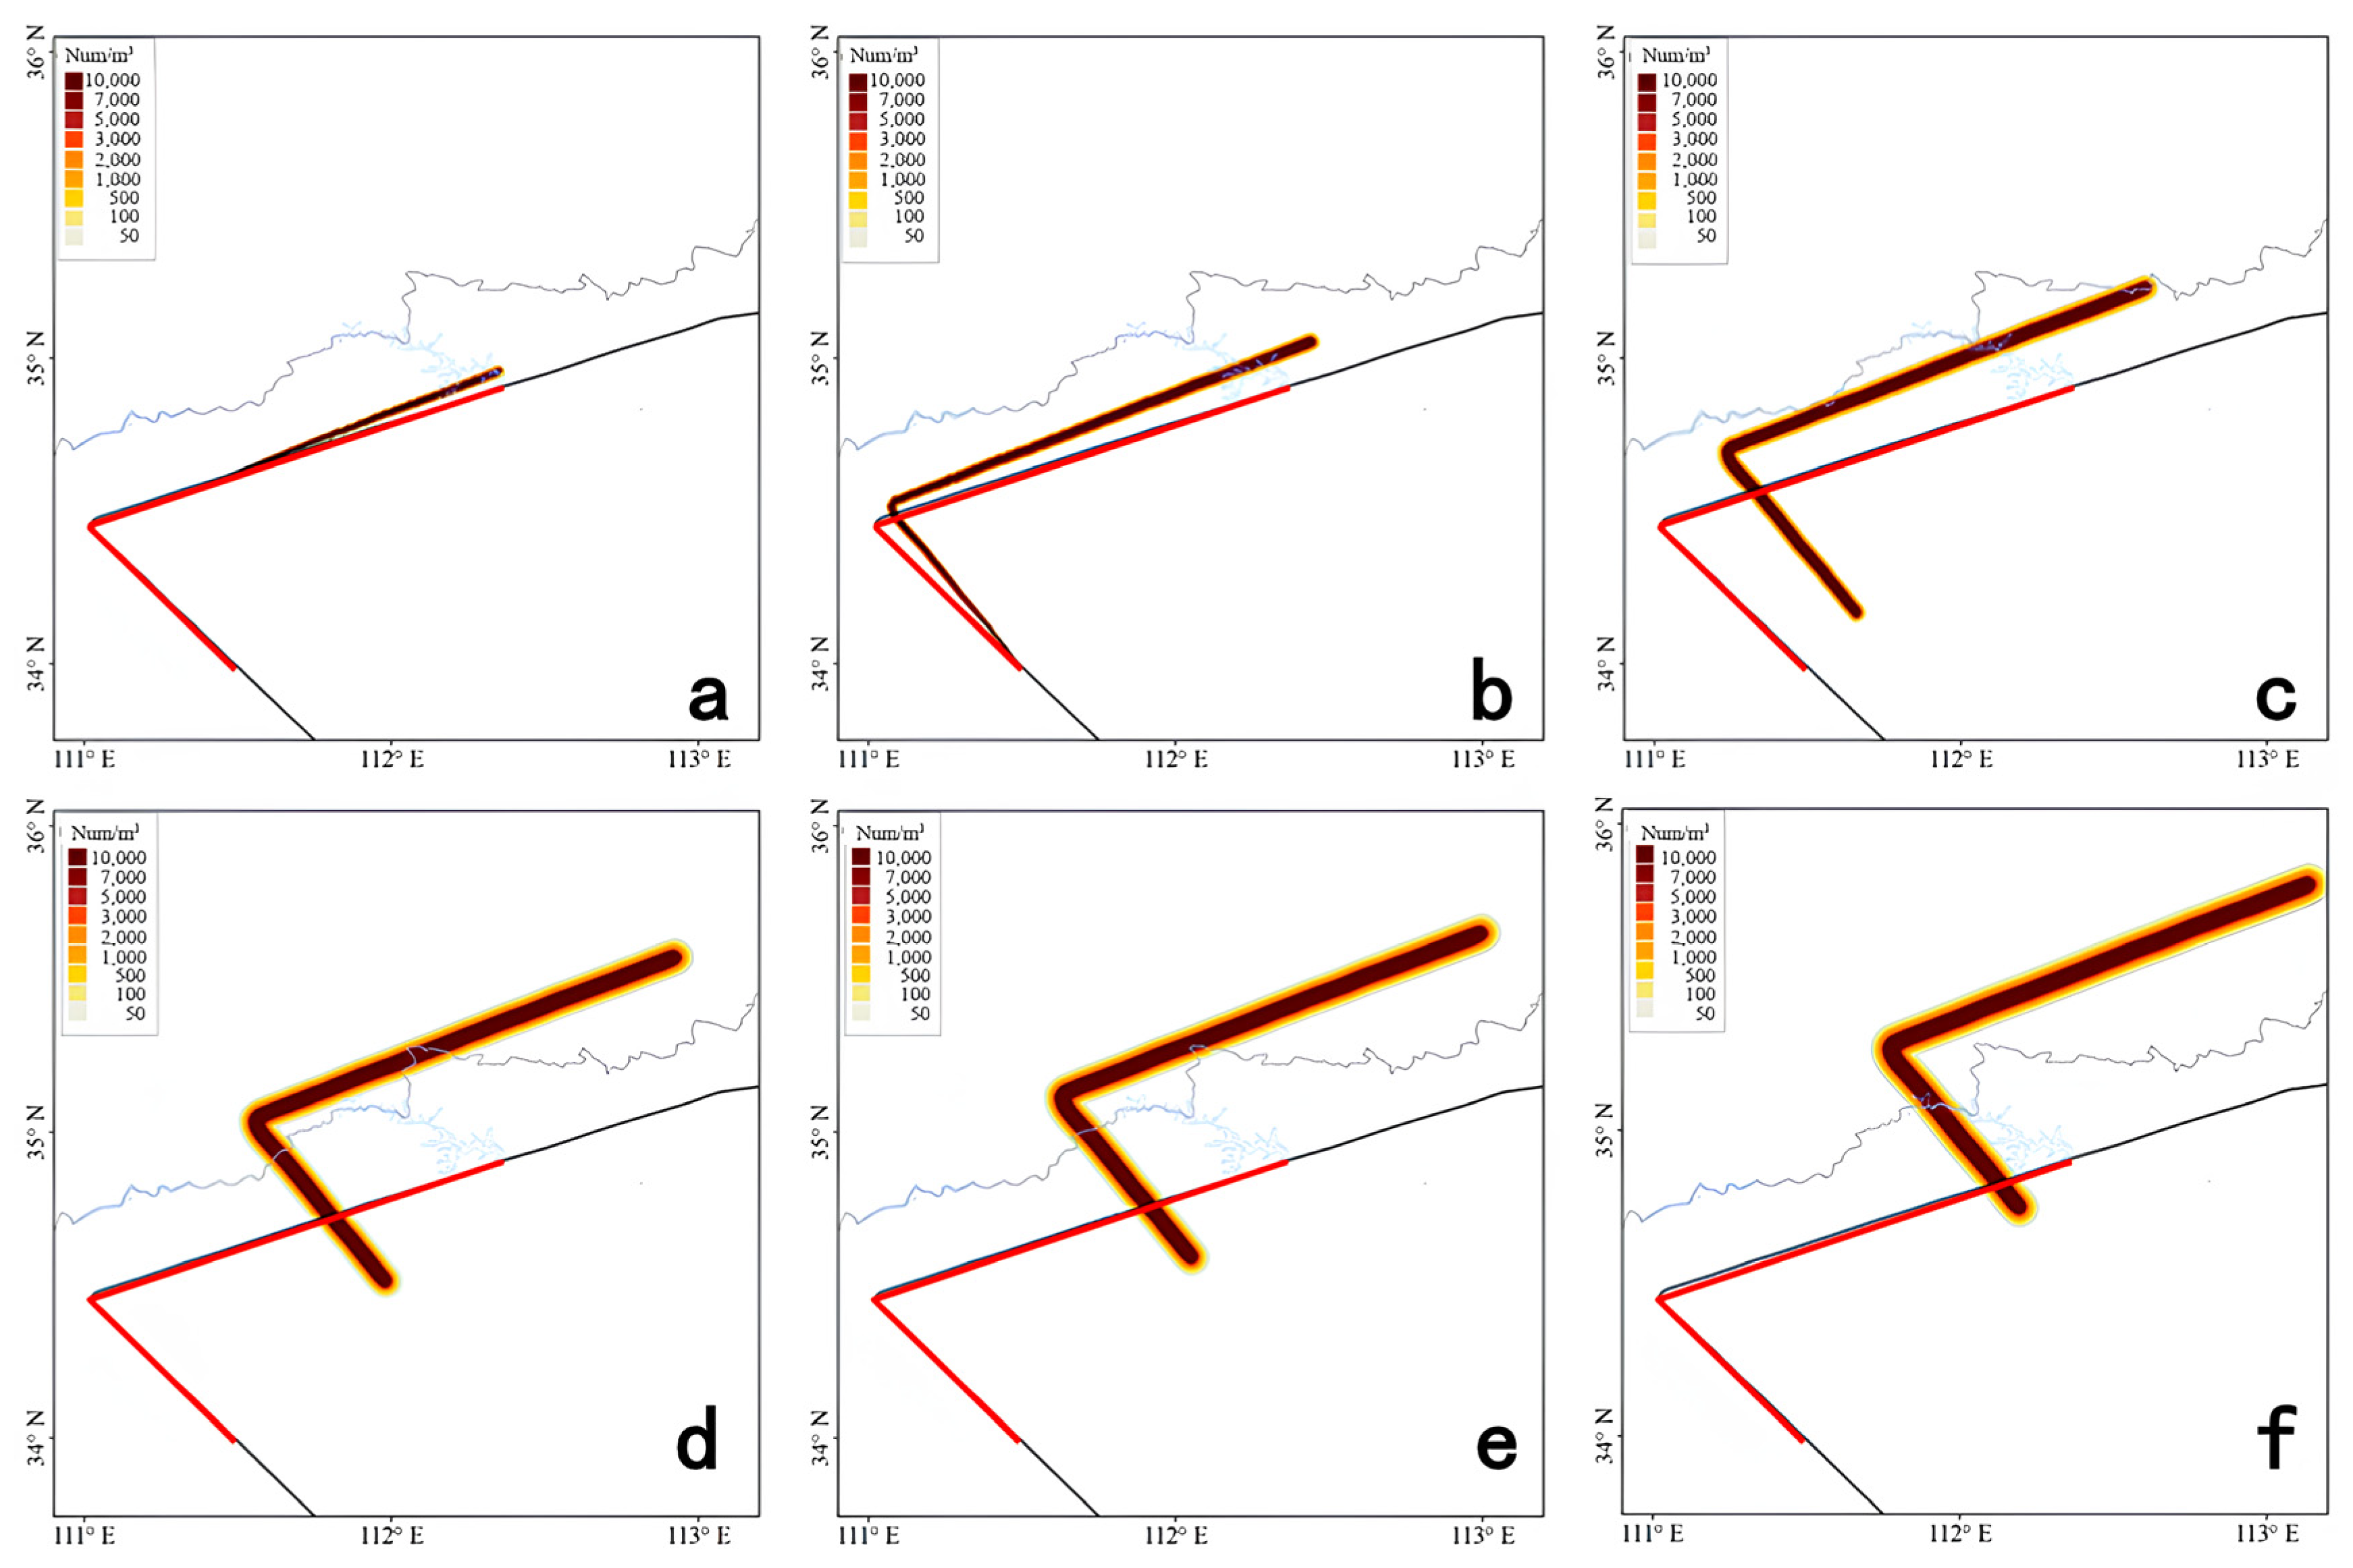
4.2. Verification of Catalyst Dispersion and Transmission Model

Figure 6 presents in its entirety the zone of influence of dispersion transport calculated by the T&D model from 03:30 to 06:15. From Figure 6, we can clearly see the dispersion influence area with time. The area of dispersion influence is larger at the moment of first seeding, and at the later seeding moment, the dispersion influence area is smaller. And over time, the dispersion impact area moves in response to wind speed and direction (wind speed and direction obtained from sounding data).
The continuous cloud track monitoring by FY-4A supports the data well and verifies the catalyst T&D model. In this study, the T&D calculation of the second cloud-seeding phase (03:15~03:49) cloud track was carried out, and a comparison was made with the FY-4A cloud track observation. From 03:15 to 03:49, 1506 g of AgI was released by the aircraft, and the dispersion coefficients and wind fields were kept the same during the whole T&D calculation period.
In order to validate the T&D model with a better comparison, we selected a few times when the cloud track was more obvious. The catalytic dispersion calculation result and the cloud track observed by the FY-4A 0.47 μm channel are presented in Figure 7. The contoured range zone is the affected zone calculated via the T&D model and determined by the 0 Num/m3 AgI concentration boundaries.
Figure 7 shows that after 60 min of catalyst seeding (valid at 04:15, Figure 7a), the simulated catalyst seeding area was consistent with the position of the cloud track observed by the FY-4A satellite through the 0.47 μm channel. After 90 min of catalyst seeding (04:45, Figure 7b), the dispersion results were completely consistent with the position of the cloud track for the segment before the corner, but there was a deviation between the dispersion position and the position of the cloud track after the corner. There was a deviation of about 1.6 km between the computed dispersion midline and the middle part of the FY-4A cloud track.

4.3. Quantitative Verification of Catalyst Dispersion Transmission width Calculation

In order to verify the particle dispersion width calculated via the aircraft catalyst T&D model at different times using the FY-4A observations, we selected a fixed geographical location over which the computed catalyst dispersion track passed and compared the FY-4A observed cloud track widths and the calculated dispersion regions at different FY-4A observation times. As shown in Figure 8, starting at 04:30, the cloud track width was taken every 15 min and compared with the calculated particle dispersion zone. The results of the width comparison are shown in Table 1. In the early stage (at 12:30), the computed catalyst dispersion width was three times wider than the FY-4A cloud track. The widths of the two were almost the same 15 min later (04:45). As time continued, the width of the FY-4A cloud track basically remained stable and consistent, at ~12–15 km at 05:15 and 05:30. After 05:30, the cloud track moved out of the target area.
Furthermore, in considering the FY-3D high-resolution cloud track observations, the data were also used to verify the aircraft catalyst T&D model computing results. Figure 5a shows the comparison results, and as shown in Table 2, the calculated catalyst dispersion widths shown in Sections 1, 2, and 3 are very similar to the FY-4A cloud track widths, with a maximum difference of only 0.36 km.
However, there was a big difference between the calculated dispersion width at the fourth cross-section, where the model-computed width and the FY-4A-observed width differed by about 9.05 km.
In general, the width of the cloud-seeding influence zone calculated via the aircraft catalyst T&D model is in very good agreement with the FY-4A cloud track observations. The widths of the two became more consistent as time progressed. The calculated width during the first 90 min overestimated the actual cloud track width.

5. Analysis of Microphysical Characteristics Inside and Outside the Cloud Track

The microphysical characteristics of the target cloud areas with the cloud-seeding cloud track were observed by the satellite. The effective particle radius, optical thickness, cloud-top height, and cloud-top temperature of the FY-4A products plotted for the four segments across the cloud track (shown in Figure 9) are presented in Figure 10. All show a significant increase in the effective particle radius inside the cloud track. For segment 1, the effective particle radius inside the cloud track was about 21 μm, and in the surrounding area it was about 10 μm. For segments 2 to 4, the effective particle radius inside the cloud track was about 15 μm, about 50% larger than on the outside. The increase in the effective particle radius inside the cloud track indicates that ice crystallization occurred inside the cloud track after the cloud-seeding operation, and a large amount of supercooled water was converted into ice-phase particles [10].
The cloud optical thickness inside the cloud track was obviously smaller. In segment 1, the cloud optical thickness inside the cloud track was about 32, and in the surrounding area, it was about 66. For segment 2, the cloud optical thickness inside the cloud track was 40, or about 33% of that on the outside. For segments 3 to 4, the cloud optical thickness inside the cloud track was about 30, about 87% less than that on the outside. The decrease in the cloud optical thickness indicates that there was less liquid water in the cloud track or that the clouds were thinner.
Figure 10 shows that the cloud-top height inside the cloud track decreased, corresponding to an increase in the cloud-top temperature. For segment 1, the cloud-top height inside the cloud track was about 4.7 km, and in the surrounding area, it was about 5.1 km, an increase of 0.4 km. Correspondingly, the cloud-top temperature inside the cloud track was warmer than the outside (−10.3 °C vs. −12.5 °C). For segment 2, the cloud-top height inside the cloud track was about 4.6 km, a decrease of about 0.3 km compared to the outside. Similar results were obtained for the other two segments.
In general, after the cloud-seeding operation, the cloud effective radius inside the cloud track increased, the cloud optical thickness decreased, and the cloud-top height decreased slightly (corresponding to a slight increase in the cloud-top temperature). These changes in the cloud properties are consistent with the physical hypothesis of cold-cloud seeding and with previously reported results.

6. Conclusions

In this study, multi-channel cloud observations from the FY-4A geostationary satellite and the FY-3D polar-orbiting satellite during an aircraft cold-cloud-seeding operation on 15 December 2019 in Henan Province, China, were analyzed to identify the cloud track caused by cloud-seeding catalysis and to study its macro- and microphysical characteristics. The cloud track observed by FY-4A closely agrees with that observed by the high-resolution FY-3D. The aircraft catalyst T&D model proposed by Zhou et al. [5] was used to calculate the seeding catalyst T&D processes for the event. The calculated catalyst dispersion features and evolution were very close to those of the cloud track observed by FY-4A. Furthermore, the change in the microphysical characteristics of the clouds across the cloud track was analyzed. The main conclusions are as follows:
(1)
The FY-4A’s and FY-3D’s 0.47 um and tri-channel-fusion cloud images show a cloud track produced by the aircraft catalyst seeding into cold clouds on 15 December 2019. This was the first time that a cloud-seeding cloud track was continuously (every 5–15 min) monitored by a geostationary satellite. The cloud track observed by FY-4A obtained a cloud track with a similar morphology and width to that of the high-resolution FY-3D measurements, although FY-3D can observe a finer cloud track structure.
(2)
Analysis of the continuous observation from the FY-4A cloud images showed that after 60 min of cloud seeding, the cold cloud precipitation process developed and consumed the supercooled cloud water, resulting in an obvious cloud track feature. The cloud track lasted for about 218 min, during which the cloud track moved in a northeastern direction for about 153 km, accompanied by the cloud system.
(3)
The aircraft catalyst T&D model developed by Zhou et al. [5] simulated the dispersion process of the aircraft cloud-seeding catalyst remarkably accurately as compared with the FY-4A cloud track observation. It was found that the position and width of the calculated AgI particle dispersion zone were consistent with the observed cloud track.
(4)
The FY-4A L2 cloud products exposed the microphysical characteristics of the cloud track. Inside the cloud track, the effective particle radius was significantly larger than that in the surrounding cloud region, and the maximum difference was about 15 μm. The cloud optical thickness of the cloud inside the cloud track was smaller than that in the surrounding cloud region, with a difference of about 30. The cloud-top height in the cloud track was about 0.3–1 km lower than that in the surrounding cloud region, and the corresponding cloud-top temperature was about 4.7 °C higher than that of the surrounding cloud. These results show that ice-phase particles were well developed in the cloud track due to the catalyst seeded by the aircraft, and some precipitation sedimentation occurred.

Author Contributions

Conceptualization, Y.Z.; investigation, Y.Z., L.Y. and Y.W.; methodology, L.Y. and Y.Z.; software, L.Y. and S.L.; data curation, L.Y., M.C., C.P. and C.S.; writing—original manuscript, L.Y., Y.Z., Y.W. and M.C.; writing—review and editing, Y.L.; obtaining funding, Y.Z. All authors have read and agreed to the published version of the manuscript.

Funding

This work was supported by the Fengyun Satellite Application Pioneer Project (FY-APP-2021.010), the Fengyun Satellite Application Pioneer Project (FY-APP-2022.0111), and the National Key Research and Development Program of China (2016YFA0601701).

Institutional Review Board Statement

The study did not require ethical approval.

Informed Consent Statement

The study did not involve humans.

Data Availability Statement

The FY-4A and FY-3D data can be obtained from the National Meteorological Satellite Centre of China, and the sounding data and aircraft trajectory data can be obtained from the Artificial Weather Influence Centre of the China Meteorological Administration (http://www.nsmc.org.cn/nsmc/cn/home/index.html, accessed on 10 March 2024).

Acknowledgments

The authors would like to thank the National Meteorological Satellite Centre of China and the Artificial Weather Centre of the China Meteorological Administration for providing data and computational support.

Conflicts of Interest

As author Shuoyin Liu was employed by the company Beijing ChenJing Technology Co., Ltd. The remaining authors declare that the research was conducted in the absence of any commercial or financial relationships that could be construed as a potential conflict of interest.

References

  1. Denni, A.S. Weather Modification by Cloud Seeding; Academic Press: New York, NY, USA, 1980; pp. 1–670. Available online: https://digitalcommons.usu.edu/water_rep/670/ (accessed on 18 February 1980).
  2. Dong, X.; Zhao, C.; Yang, Y.; Wang, Y.; Sun, Y.; Fan, R. Distinct change of supercooled liquid cloud properties by aerosols from an aircraft-based seeding experiment. Earth Space Sci. 2020, 7, e2020EA001196. [Google Scholar] [CrossRef]
  3. Shen, Y.; Chen, J. Stacking effect of catalysts sown by aircraft. J. Nanjing Meteorol. Inst. 1983, 2, 239–246. Available online: http://dqkxxb.ijournals.cn/dqkxxb/article/abstract/19830212?st=article_issue (accessed on 12 February 1983).
  4. Yu, X.; Fan, P.; Wang, X.; Dai, J.; Li, Z. Numerical simulation of catalyst dispersion from nonvertical multiple spreading line sources in stratiform clouds. J. Meteorol. 1998, 6, 69–84. Available online: https://qxxb.cmsjournal.net/cn/article/doi/10.11676/qxxb1998.065 (accessed on 7 March 1998).
  5. Zhou, Y.; Zhu, B. A study of catalytic dispersion patterns and operational design of artillery, rockets and aircraft. Meteorology 2014, 40, 965–980. Available online: http://qxqk.nmc.cn/html/2014/8/20140807.html (accessed on 7 August 2014).
  6. Woodley, W.; Rosenfeld, D.; Strautins, A. Identification of a seeding signature in Texas using multi spectral satellite imagery. J. Weather. Modif. 2000, 32, 37–52. [Google Scholar] [CrossRef]
  7. Yu, X.; Dai, J.; Rosenfeld, D.; Lei, H.; Xu, X.; Fan, P.; Chen, Z. Comparison of Model-Predicted Transport and Dispersion of Seeding Material with NOAA Satellite-Observed Seeding Track in Supercooled Layer Clouds. J. Appl. Meteorol. 2005, 44, 749–759. [Google Scholar] [CrossRef]
  8. Rosenfeld, D.; Yu, X.; Dai, J. Satellite-Retrieved Microstructure of AgI Seeding Tracks in Supercooled Layer Clouds. J. Appl. Meteorol. 2005, 44, 760–767. [Google Scholar] [CrossRef]
  9. Wang, J.; Yue, Z.; Rosenfeld, D.; Zhang, L.; Zhu, Y.; Dai, J.; Yu, X.; Liu, J. The evolution of an AgI cloud-seeding track in central China as seen by a combination of radar, satellite, and disdrometer observations. J. Geophys. Res. Atmos. 2021, 126, e2020JD033914. [Google Scholar] [CrossRef]
  10. Wang, T.; Luo, J.; Liang, J.; Wang, B.; Tian, W.; Chen, X. Comparisons of AGRI/ FY-4A cloud fraction and cloud top pressure with MODIS/ Terra measurements over East Asia. J. Meteorol. Res. 2019, 33, 705–719. [Google Scholar] [CrossRef]
  11. Yang, J.; Zhang, Z.; Wei, C.; Lu, F.; Guo, Q. Introducing the New Generation of Chinese Geostationary Weather Satellites, Fengyun-4. Bull. Am. Meteorol. Soc. 2017, 98, 1637–1658. [Google Scholar] [CrossRef]
  12. Chen, Y.; Chen, G.; Cui, C.; Zhang, A.; Wan, R.; Zhou, S.; Wang, D. Retrieval of the vertical evolution of the cloud effective radius from the Chinese FY-4 (Feng Yun 4) next-generation geostationary satellites. Atmos. Chem. Phys. 2020, 20, 1131–1145. [Google Scholar] [CrossRef]
  13. Chen, Y.; Li, W.; Chen, S.; Chen, S.; Zhang, A.; Fu, Y. Linkage between the vertical evolution of clouds and droplet growth modes as seen from FY-4A AGRI and GPM DPR. Geophys. Res. Lett. 2020, 47, e2020GL088312. [Google Scholar] [CrossRef]
  14. Yang, Z.; Zhang, P.; Gu, S.; Hu, X.; Tang, S.; Yang, L.; Xu, N.; Zhen, Z.; Wang, L.; Wu, Q.; et al. Capability of Fengyun-3D Satellite in Earth System Observation. J. Meteorol. Res. 2019, 33, 1113–1130. [Google Scholar] [CrossRef]
  15. Li, Q.; Sun, X.; Wang, X. Reliability Evaluation of the Joint Observation of Cloud Top Height by FY-4A and HIMAWARI-8. Remote Sens. 2021, 13, 3851. [Google Scholar] [CrossRef]
  16. Xu, W.; Lyu, D. Evaluation of Cloud Mask and Cloud Top Height from Fengyun-4A with MODIS Cloud Retrievals over the Tibetan Plateau. Remote Sens. 2021, 13, 1418. [Google Scholar] [CrossRef]
  17. Xu, N.; Niu, X.; Hu, X.; Wang, X.; Wu, R.; Chen, S.; Chen, L.; Sun, L.; Ding, L.; Yang, Z.; et al. Prelaunch Calibration and Radiometric Performance of the Advanced MERSI II on FengYun-3D. IEEE Trans. Geosci. Remote Sens. 2018, 56, 4866–4875. [Google Scholar] [CrossRef]
  18. Xu, J.; Liu, Z. Water vapour products from ERA5, MERSI-II/FY-3D, OLCI/Sentinel-3A, OLCI/Sentinel-3B, MODIS/Aqua and MODIS/Terra in Australia: A comparison against in situ GPS water vapour data. Q. J. R. Meteorol. Soc. 2023, 149, 1435–1458. [Google Scholar] [CrossRef]
  19. Wang, Y.; Li, G. Global Land Cover Mapping Using Annual Clear-sky Composites from FY3D/MERSI-II. Int. J. Remote Sens. 2022, 43, 510–531. [Google Scholar] [CrossRef]
  20. Zhang, Y.; Chen, Y.; Wang, M.; He, M.; Tan, J. FY-3D/MERSI-II Meteorological Satellite Image Fusion Method and its Application. In Proceedings of the IEEE 3rd International Conference on Information Systems and Computer Aided Education (ICISCAE), Dalian, China, 27–29 September 2020. [Google Scholar] [CrossRef]
  21. Xu, X.; Zeng, Y.; Yu, X.; Liu, G.; Yue, Z.; Dai, J.; Feng, Q.; Liu, P.; Wang, J.; Zhu, Y. Identification of Supercooled Cloud Water by FY-4A Satellite and Validation by CALIPSO and Airborne Detection. Remote Sens. 2023, 15, 126. [Google Scholar] [CrossRef]
  22. Zhou, Y.; Liu, S.; Cai, M.; Long, J.; Wang, J. Operational plan, effect verification, and key technical settings for a stadium-scale artificial rain reduction experiment. J. Meteorol. Res. 2023, 37, 643–665. [Google Scholar] [CrossRef]
  23. Sieglaff, J.M.; Cronce, L.M.; Feltz, F.W.; Bedka, K.M.; Pavolonis, M.J.; Heidinger, A.K. Nowcasting Convective Storm Initiation Using Satellite-Based Box-Averaged Cloud-Top Cooling and Cloud-Type Trends. J. Appl. Meteorol. Climatol. 2011, 50, 110–126. [Google Scholar] [CrossRef]
  24. Liu, G.; Yu, X.; Jia, L.; Dai, J. Satellite Retrieval of a Strong Hailstorm Process. Atmos. Ocean. Sci. Lett. 2009, 2, 103–107. [Google Scholar] [CrossRef]
  25. Rosenfeld, D.; Lensky, I.M. Satellite-based insights into precipitation formation processes in continental and maritime convective clouds. Bull. Am. Meteorol. Soc. 1998, 79, 2457–2476. [Google Scholar] [CrossRef]
Figure 1. (a) The aircraft flight trajectory on 15 December 2019; (b) the flight altitudes. The take-off and climbing phases are in green (C–A), the cloud-seeding phase is in purple (A–B), and the aircraft returning phase is in blue (B–C); The red triangle is Zhengzhou Xinzheng Airport.
Atmosphere 15 00556 g001
Figure 2. (a) FY-4A cloud top height and a portion of the flight path (black line) at 00:00 on 15 December 2019; (b) L-band radiosonde plot at Xingtai at 0800 h. The green line is the temperature, the blue line is the relative humidity curve, and the black lines are wind barbs. Green shades mark the cloud cover.
Atmosphere 15 00556 g002
Figure 3. The FY-4A cloud-top height and the aircraft flight track at different times during the cloud-seeding operation on 15 December 2019: (a) 03:00; (b) 03:15; (c) 03:30; (d) 03:49; (e) 04:23; (f) 05:30. The red line is for the period with supercooled water reported.
Atmosphere 15 00556 g003
Figure 4. FY4A tri-channel fusion cloud image on 15 December 2019: (a) 04:15; (b) 04:45; (c) 05:15; (d) 05:45; (e) 06:15; (f) 06:45; (g) 07:15; (h) 07:53. The black line shows the flight path of the aircraft.
Atmosphere 15 00556 g004
Figure 5. (a) Tri-channel fusion cloud image of the FY-3D polar-orbiting satellite at 05:40 on 15 December 2019; (b) that of the FY-4A satellite at 05:38. The black line marks the flight path of the aircraft, and the red lines represent the four cross-sections examined (see the red lines).
Atmosphere 15 00556 g005
Figure 6. The AgI particle number concentration calculated by the aircraft cloud-seeding T&D model ((a): 03:30, (b): 03:49, (c): 04:23, (d): 05:30, (e): 05:45, (f): 06:15), the red line is for the second segment (cloud seeding between 03:15 and 03:49).
Atmosphere 15 00556 g006
Figure 7. The calculated catalyst dispersion region (red contours), overlapped on the FY-4A 0.47 channel cloud track: (a) 04:15; (b) 04:45; (c) 05:15; (d) 05:30; (e) 05:45; (f) 06:15. The blue line is the flight trajectory, and the yellow line marks the calculated dispersion area of the catalyst.
Atmosphere 15 00556 g007
Figure 8. FY-4A tri-channel fused cloud images at different times on 15 December 2019: (a) 04:35; (b) 04:45; (c) 05:15; (d) 05:30. The red line is for the fixed space position selected. The black line marks the aircraft’s flight path.
Atmosphere 15 00556 g008
Figure 9. Cloud effective particle radius at 163 min (05:30), and the locations of the four selected segments (red lines) across the cloud-seeding-induced cloud track.
Atmosphere 15 00556 g009
Figure 10. Microphysical properties across the cloud track for the 4 cross-sections shown in Figure 9 correspond to (ad) of Figure 10. The cloud effective radius is in blue; the cloud optical thickness is in purple; the cloud-top height is in orange; and the cloud-top temperature is in green.
Atmosphere 15 00556 g010
Table 1. Comparison of the widths of the catalyst dispersion areas with the FY-4A cloud track widths at the same location at different times.
Time04:3004:4505:1505:30
Width of the FY-4A cloud track (km)3.366.9612.5314.93
Width of the aircraft catalyst T&R model (km)10.199.6012.8114.20
Table 2. Cloud tracks and dispersion widths of four profiles at the same time.
Profile1234
Width of the cloud track identified by the satellite (km)14.1013.5013.9916.31
Width of the aircraft catalyst T&D model result 14.4614.2514.0112.40
Disclaimer/Publisher’s Note: The statements, opinions and data contained in all publications are solely those of the individual author(s) and contributor(s) and not of MDPI and/or the editor(s). MDPI and/or the editor(s) disclaim responsibility for any injury to people or property resulting from any ideas, methods, instructions or products referred to in the content.

