Article

The Heterogeneous Effects of Microscale-Built Environments on Land Surface Temperature Based on Machine Learning and Street View Images

1
School of Architecture, Tianjin University, Tianjin 300073, China
2
Huaxi Construction Co., Ltd., CCCC Second Highway Engineering Co., Ltd., Chengdu 610000, China
3
School of Civil Engineering, Tianjin University, Tianjin 300073, China
*
Authors to whom correspondence should be addressed.
Atmosphere 2024, 15(5), 549; https://doi.org/10.3390/atmos15050549
Submission received: 2 April 2024 / Revised: 21 April 2024 / Accepted: 23 April 2024 / Published: 29 April 2024

Abstract

:
Global climate change has exacerbated alterations in urban thermal environments, significantly impacting the daily lives and health of city residents. Measuring and understanding urban land surface temperatures (LST) and their influencing factors is important in addressing global climate change and enhancing the well-being of residents. However, due to limitations in data precision and analytical methods, existing studies often overlook the microscale examination closely related to residents’ daily lives, and lack a deep exploration of the spatial heterogeneity of the influencing factors. This leads to these results being ineffective in guiding the planning and construction of cities. Taking Shenzhen as a case study, our study investigates the effects of various microscale build environment characteristics of LST using street view images and machine learning. A convolutional neural network model adopting the SegNet architecture is used to perform semantic segmentation on street view images, extracting features of the microscale urban-built environment. The LST is inverted through the Google Earth Engine (GEE) platform. By using Multiscale Geographically Weighted Regression (MGWR) models, our study reveals the comprehensive impact of the urban-built environment on LST and its significant spatial heterogeneity. The findings indicate that the proportions of sky, roads, and buildings are positively correlated with LST, while trees have a significant cooling effect. Although earth and water can reduce LST, their overall contribution is minimal due to limitations in their area and distribution patterns. This study not only reveals the key factors affecting urban LST at the microscale but also emphasizes the necessity of considering the spatial heterogeneity of these factors’ impacts. This suggests the need for targeted strategies for different areas to effectively improve the urban thermal environment and achieve sustainable urban development.

1. Introduction

Global climate change has profound effects on human society [1,2]. Cities, as the main venues for human production and living [3], are more vulnerable to global climate change due to their dense populations and artificial environments [4,5]. In recent years, rapid urbanization has accelerated changes in urban land use [6,7], with natural environments being extensively replaced by artificial ones [8,9]. The rapid expansion of cities and frequent human activities have damaged the ecological environment, while also exacerbating the urban heat island (UHI) effect [10]. This is primarily due to the increased thermal capacity from more buildings and impermeable surfaces, thereby trapping more energy and radiation [11,12]. Against the backdrop of climate change, the problem of the UHI effect is set to worsen [13,14]. Research has demonstrated that the intensification of UHI not only reduces the thermal comfort of urban residents but may also has negative impacts on human health, including heatstroke or other heat-related health issues [15,16]. Furthermore, the decline in the quality of the urban thermal environment significantly impacts the energy use, leading to a higher demand for cooling appliances like air conditioners, which in turn amplifies the UHI effect, forming a vicious cycle [17].
Monitoring of Land Surface Temperature (LST) has become key to understanding and measuring the UHI effect and is crucial in the context of global climate change [18]. LST can indicate the present condition and direction of the urban thermal environment, offering an essential foundation for devising relevant urban planning policies [19]. Early monitoring of LST relied on weather stations or mobile observations. Although these methods were accurate for recording climate conditions at specific locations, they faced challenges in capturing the broad spatial distribution of the thermal environment. As remote sensing technology advances, LST-based research offers a new perspective on observing the UHI effect and assessing its impact on human health [20,21]. This enables the observation of variations in the urban thermal environment on a more extensive scale, identifying high-heat risk areas. Increasingly, researchers use remote sensing data to deduce the spatial and temporal changes in LST and its relationship with influencing factors, proposing strategies to mitigate the UHI [13,22]. Due to the practical application, timeliness, and free availability of sensors, we can conduct analyses on a regional or even global scale, providing more effective aid in reducing the UHI effect [23,24].
Analyzing the influencing factors and mechanisms of the urban thermal environment is important to mitigating high thermal conditions in cities, crucial for urban planners and managers [14]. Previous research has demonstrated a strong correlation between LST and air temperature [25]. Urban morphology (such as building density or layout patterns) [26], land use patterns [27], landscape patterns [28], and human activity intensity [29] all impact the urban thermal environment. Researchers have studied the LST and UHI effect at different scales, including continents [30,31], countries [32], urban agglomerations [33], and cities [27]. As urbanization accelerates, the influence of the urban-built environment on LST has become increasingly significant [34]. The microscale urban-built environment is closely related to residents’ daily lives and is a crucial component of urban construction and renewal [35]. Optimizing the built environment at the microscale is a rapid and effective method to improve the urban microclimate under the current urban development model. However, research on the impact of microscale-built environment factors on surface temperature remains severely limited. This not only underestimates the critical role that the microscale-built environment plays in the daily lives of residents, but also overlooks the spatial differentiation of this impact. As a result, many studies produce outcomes that lack practicality in specific contexts of urban construction and environmental improvement.
Street view images support the observation of the urban-built environment from a microscale perspective [36,37]. With recent developments, street view images have become a geographical analysis tool equivalent to remote sensing data, offering finer-grained data to support small-scale research [38]. Street view images now cover most cities globally and are gradually expanding to scenic areas and rural settings, further increasing their data capacity and application potential [39]. Street view images offer new methods and perspectives for urban research, widely applied in fields such as urban environmental change [40], property valuation [41], and subjective perception assessment [42]. The integration of street view images with machine learning enables precise measurement of built environment features, providing a more detailed and comprehensive three-dimensional perspective. This allows researchers to understand and analyze urban space layout and features at the street scale more deeply [35,43]. Long and Liu [44] argue that street view images can measure the urban physical environment from a human perspective and are more economical and effective than traditional assessments and field observations. Gong et al. [45] mapped sky, tree, and building view factors in street canyons using street view images, demonstrating their higher accuracy compared to 3D-GIS. Li et al. [46] utilized the proportions of grass, shrubs, and trees extracted from street view images to reveal the different cooling effects of various vegetation types on the urban thermal environment.
Shenzhen is a typical high-density city, and its high level of construction has caused it to be troubled by the UHI effect. Based on this, this study employs a joint analysis method combining street view big data, deep learning, and spatial regression models to help urban planners and managers understand the factors affecting urban LST more targeted. This study aims to address the following research questions: (1) What is the impact of the microscale-built environment on LST? (2) Does this impact exhibit spatial heterogeneity? (3) Can Multiscale Geographically Weighted Regression (MGWR) accurately explain the influence of the microscale-built environment on LST?

2. Methodology

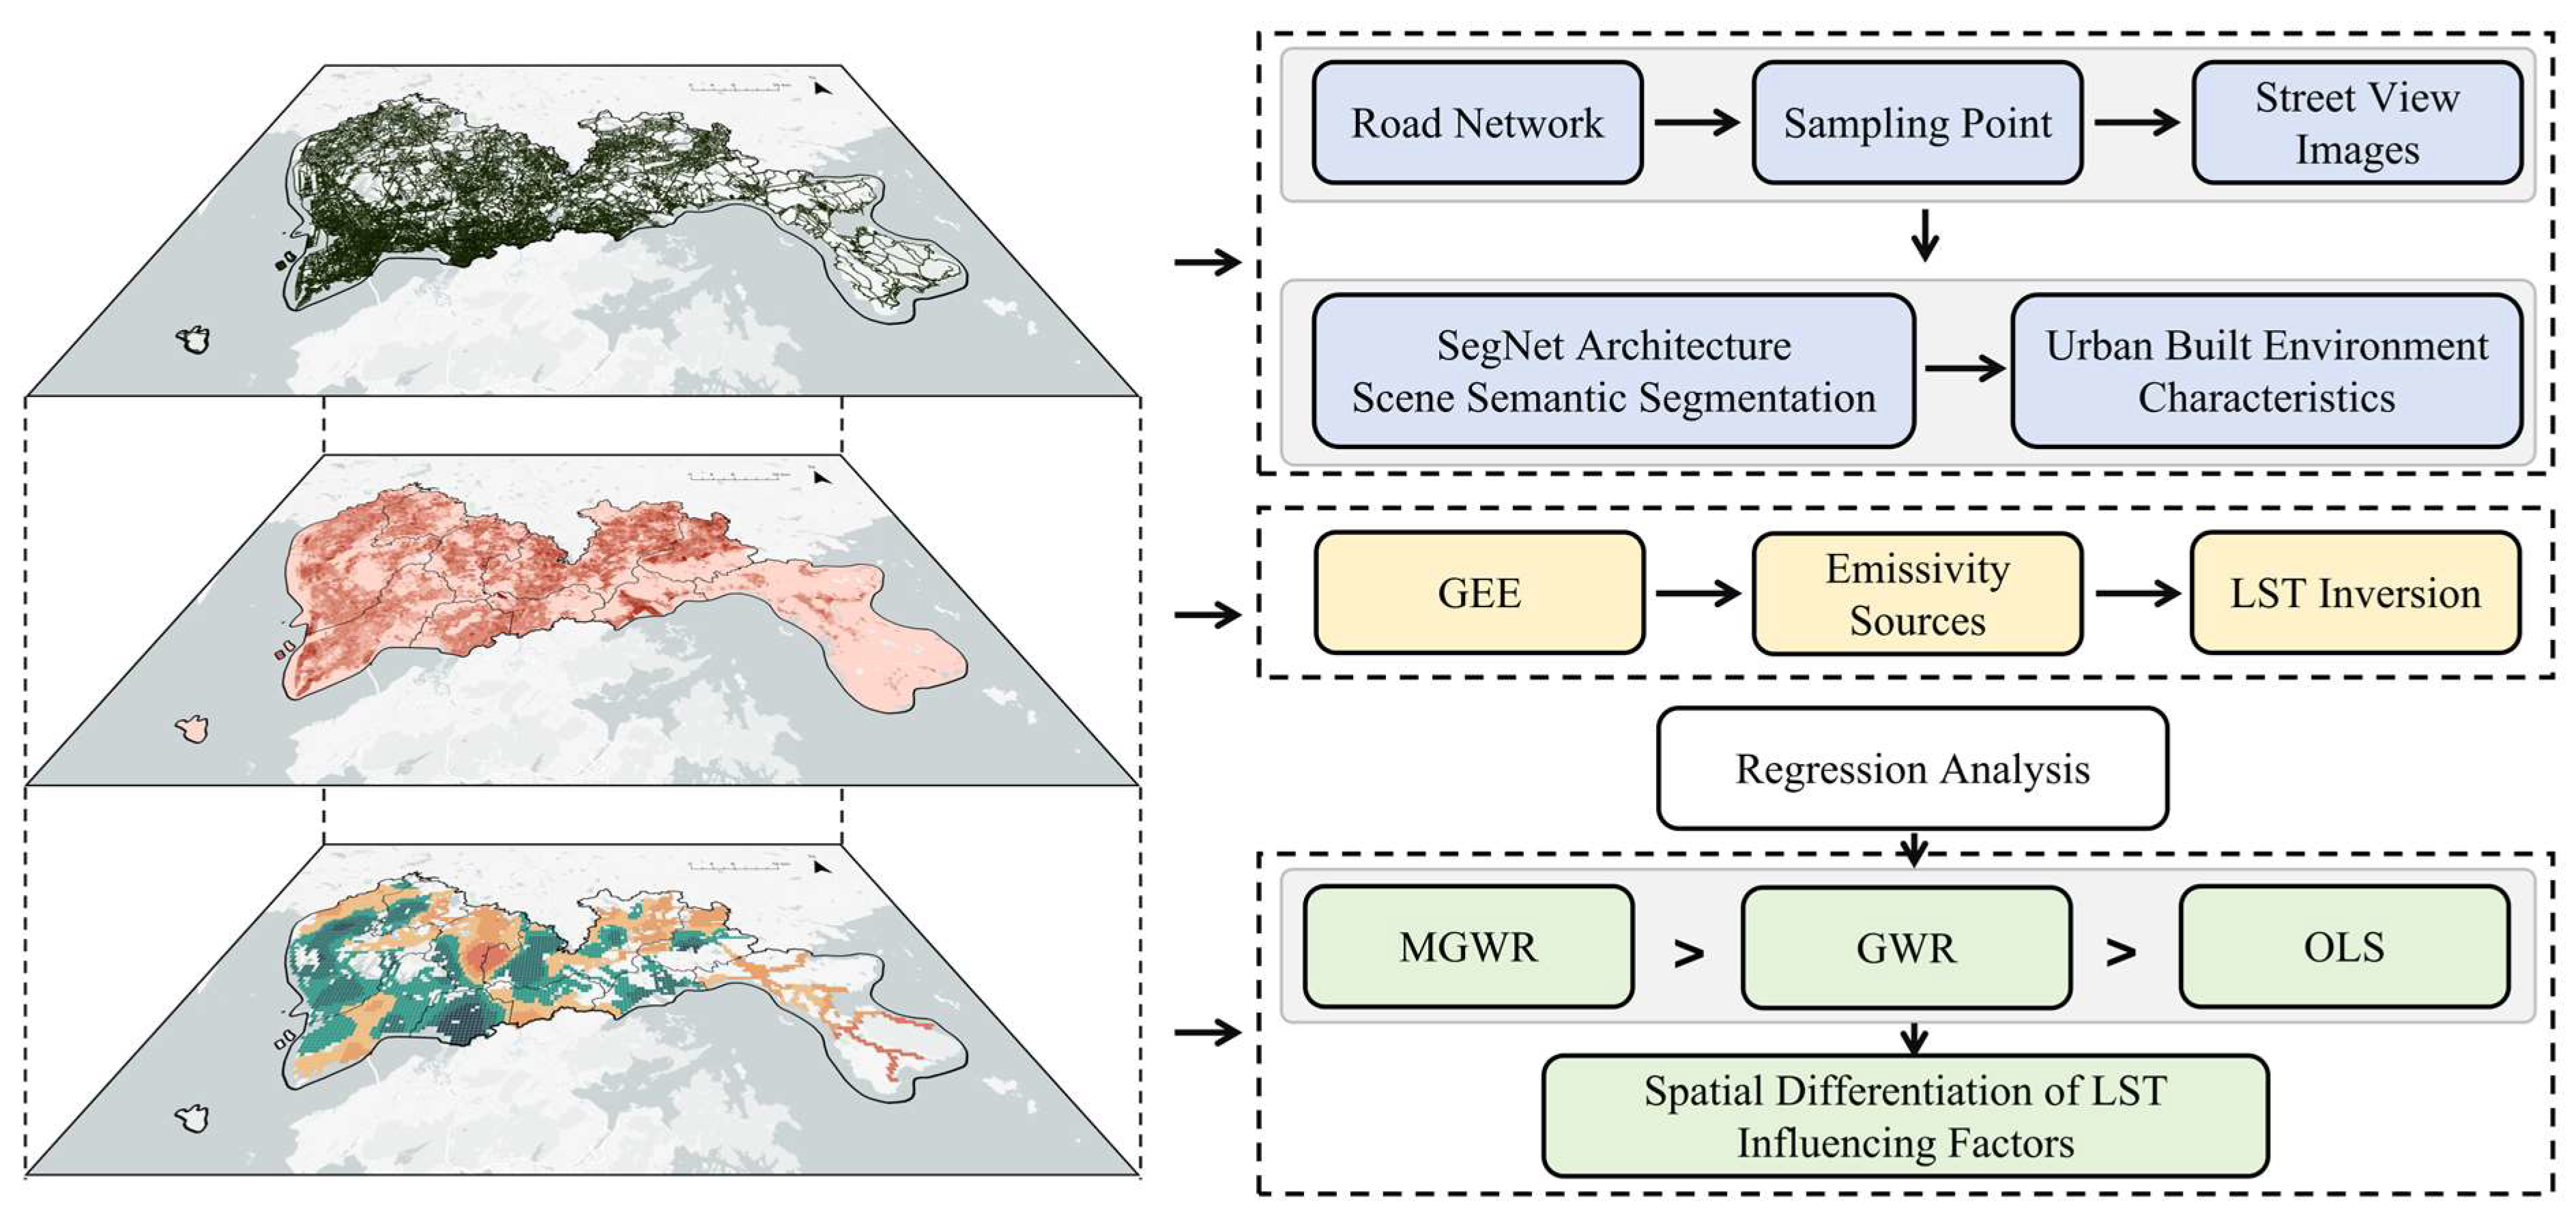
2.1. Research Framework
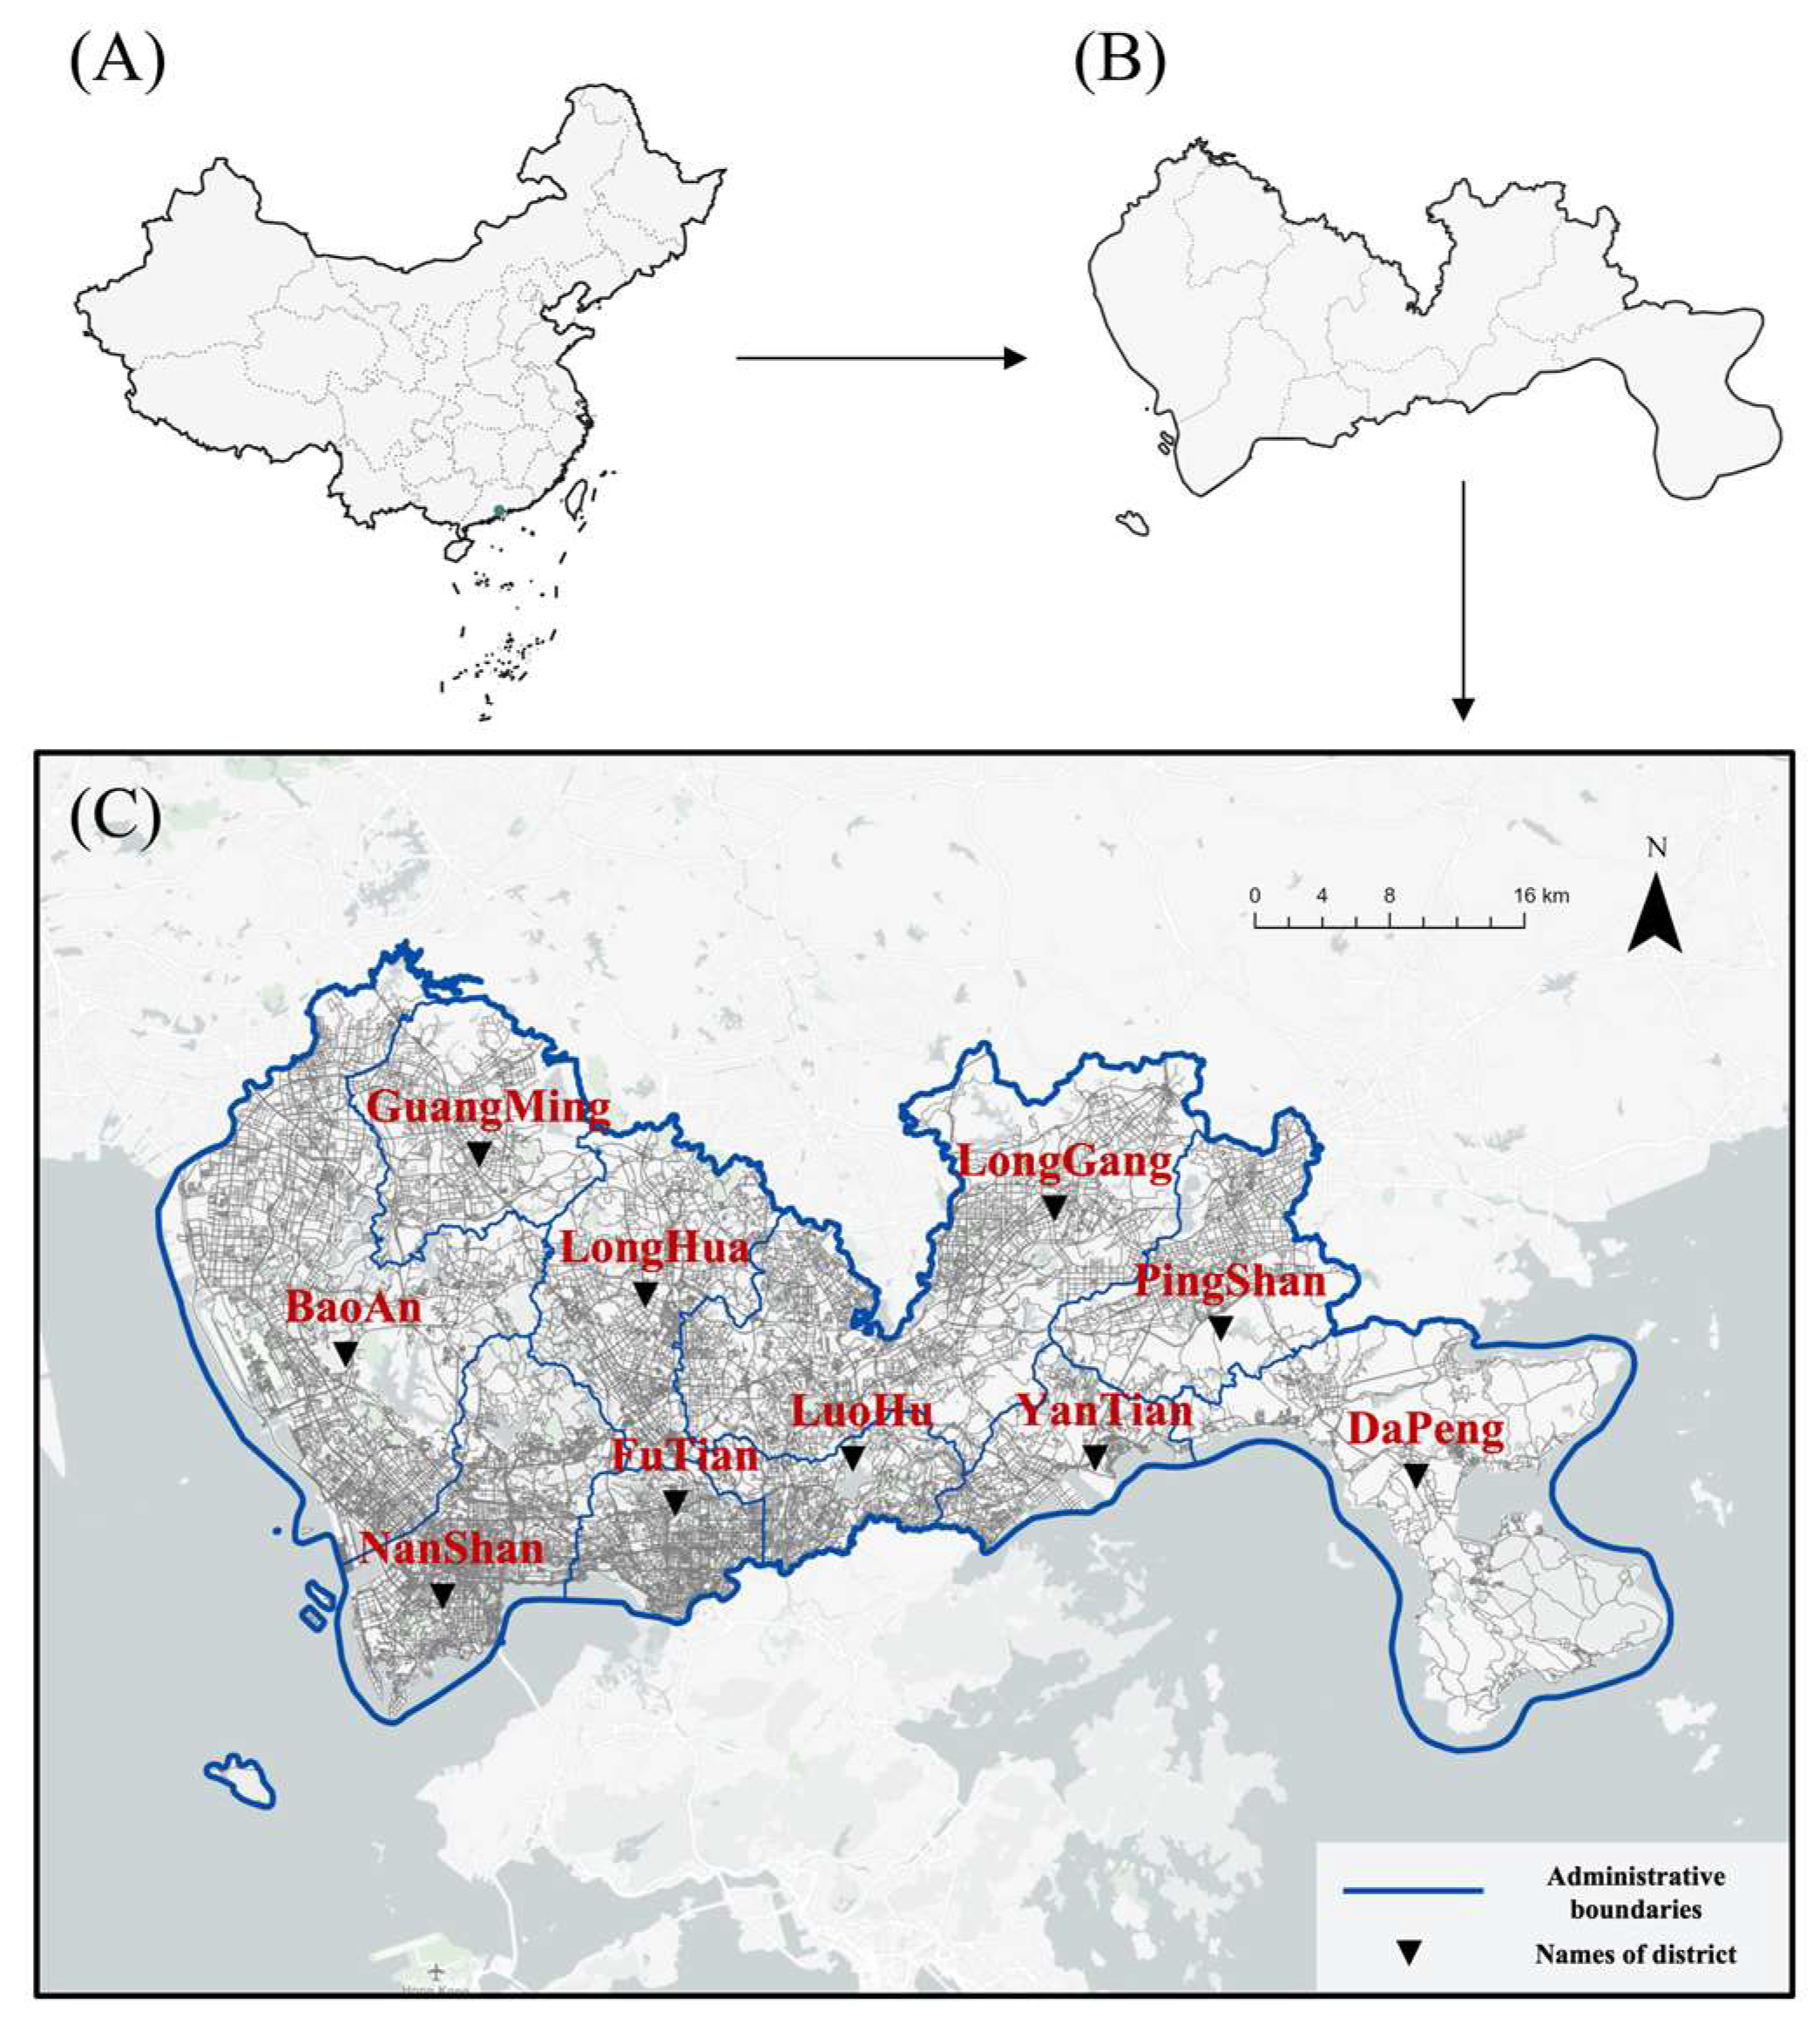
This study is conducted from three main aspects: (1) Utilize a convolutional neural network framework inspired by the SegNet design to scrutinize and decode the microscale urban-built environment features of Shenzhen through analysis of street view images; (2) Invert Shenzhen’s LST using three different emissivity’s on the Google Earth Engine (GEE) platform; (3) Examine the influence of Shenzhen’s urban architecture on LST by employing a variety of spatial analysis models, including Ordinary Least Squares (OLS), Geographically Weighted Regression (GWR), and MGWR. This approach is intended to determine the most effective model for elucidation and to delve into the spatial diversity of how each component of the built environment affects the LST. The framework of this study is shown in Figure 1.

2.2. Study Area

Shenzhen is located in the southern part of China, specifically between longitude 113°46′–114°37′ E, and latitude 22°27′–22°52′ N (Figure 2). As a typical megacity and high-density urban area, Shenzhen serves as an economic hub, innovation base, and transportation nexus in southern China and is one of the core engine cities of the Guangdong-Hong Kong-Macao Greater Bay Area. The city experiences a subtropical monsoon climate with abundant rainfall. It encompasses nine districts, covering a total area of 1997.47 square kilometers, with a permanent population of 17.6618 million people. Despite its relatively recent establishment, Shenzhen has undergone rapid development with dense economic and social activities, leading to a high degree of urbanization. In the last four decades, Shenzhen’s developed regions have expanded six times over, profoundly altering the city’s thermal landscape and increasing its susceptibility to urban heat island phenomena [47]. The microscale urban-built environment is directly linked to the daily lives of residents. Therefore, measuring the impact of Shenzhen’s urban-built environment on LST from a microscale perspective is very important for solving the city’s UHI problem and improving planning and construction quality. Additionally, the region has an abundance of Baidu street view image data resources, which ensures the accuracy of the research findings [48].

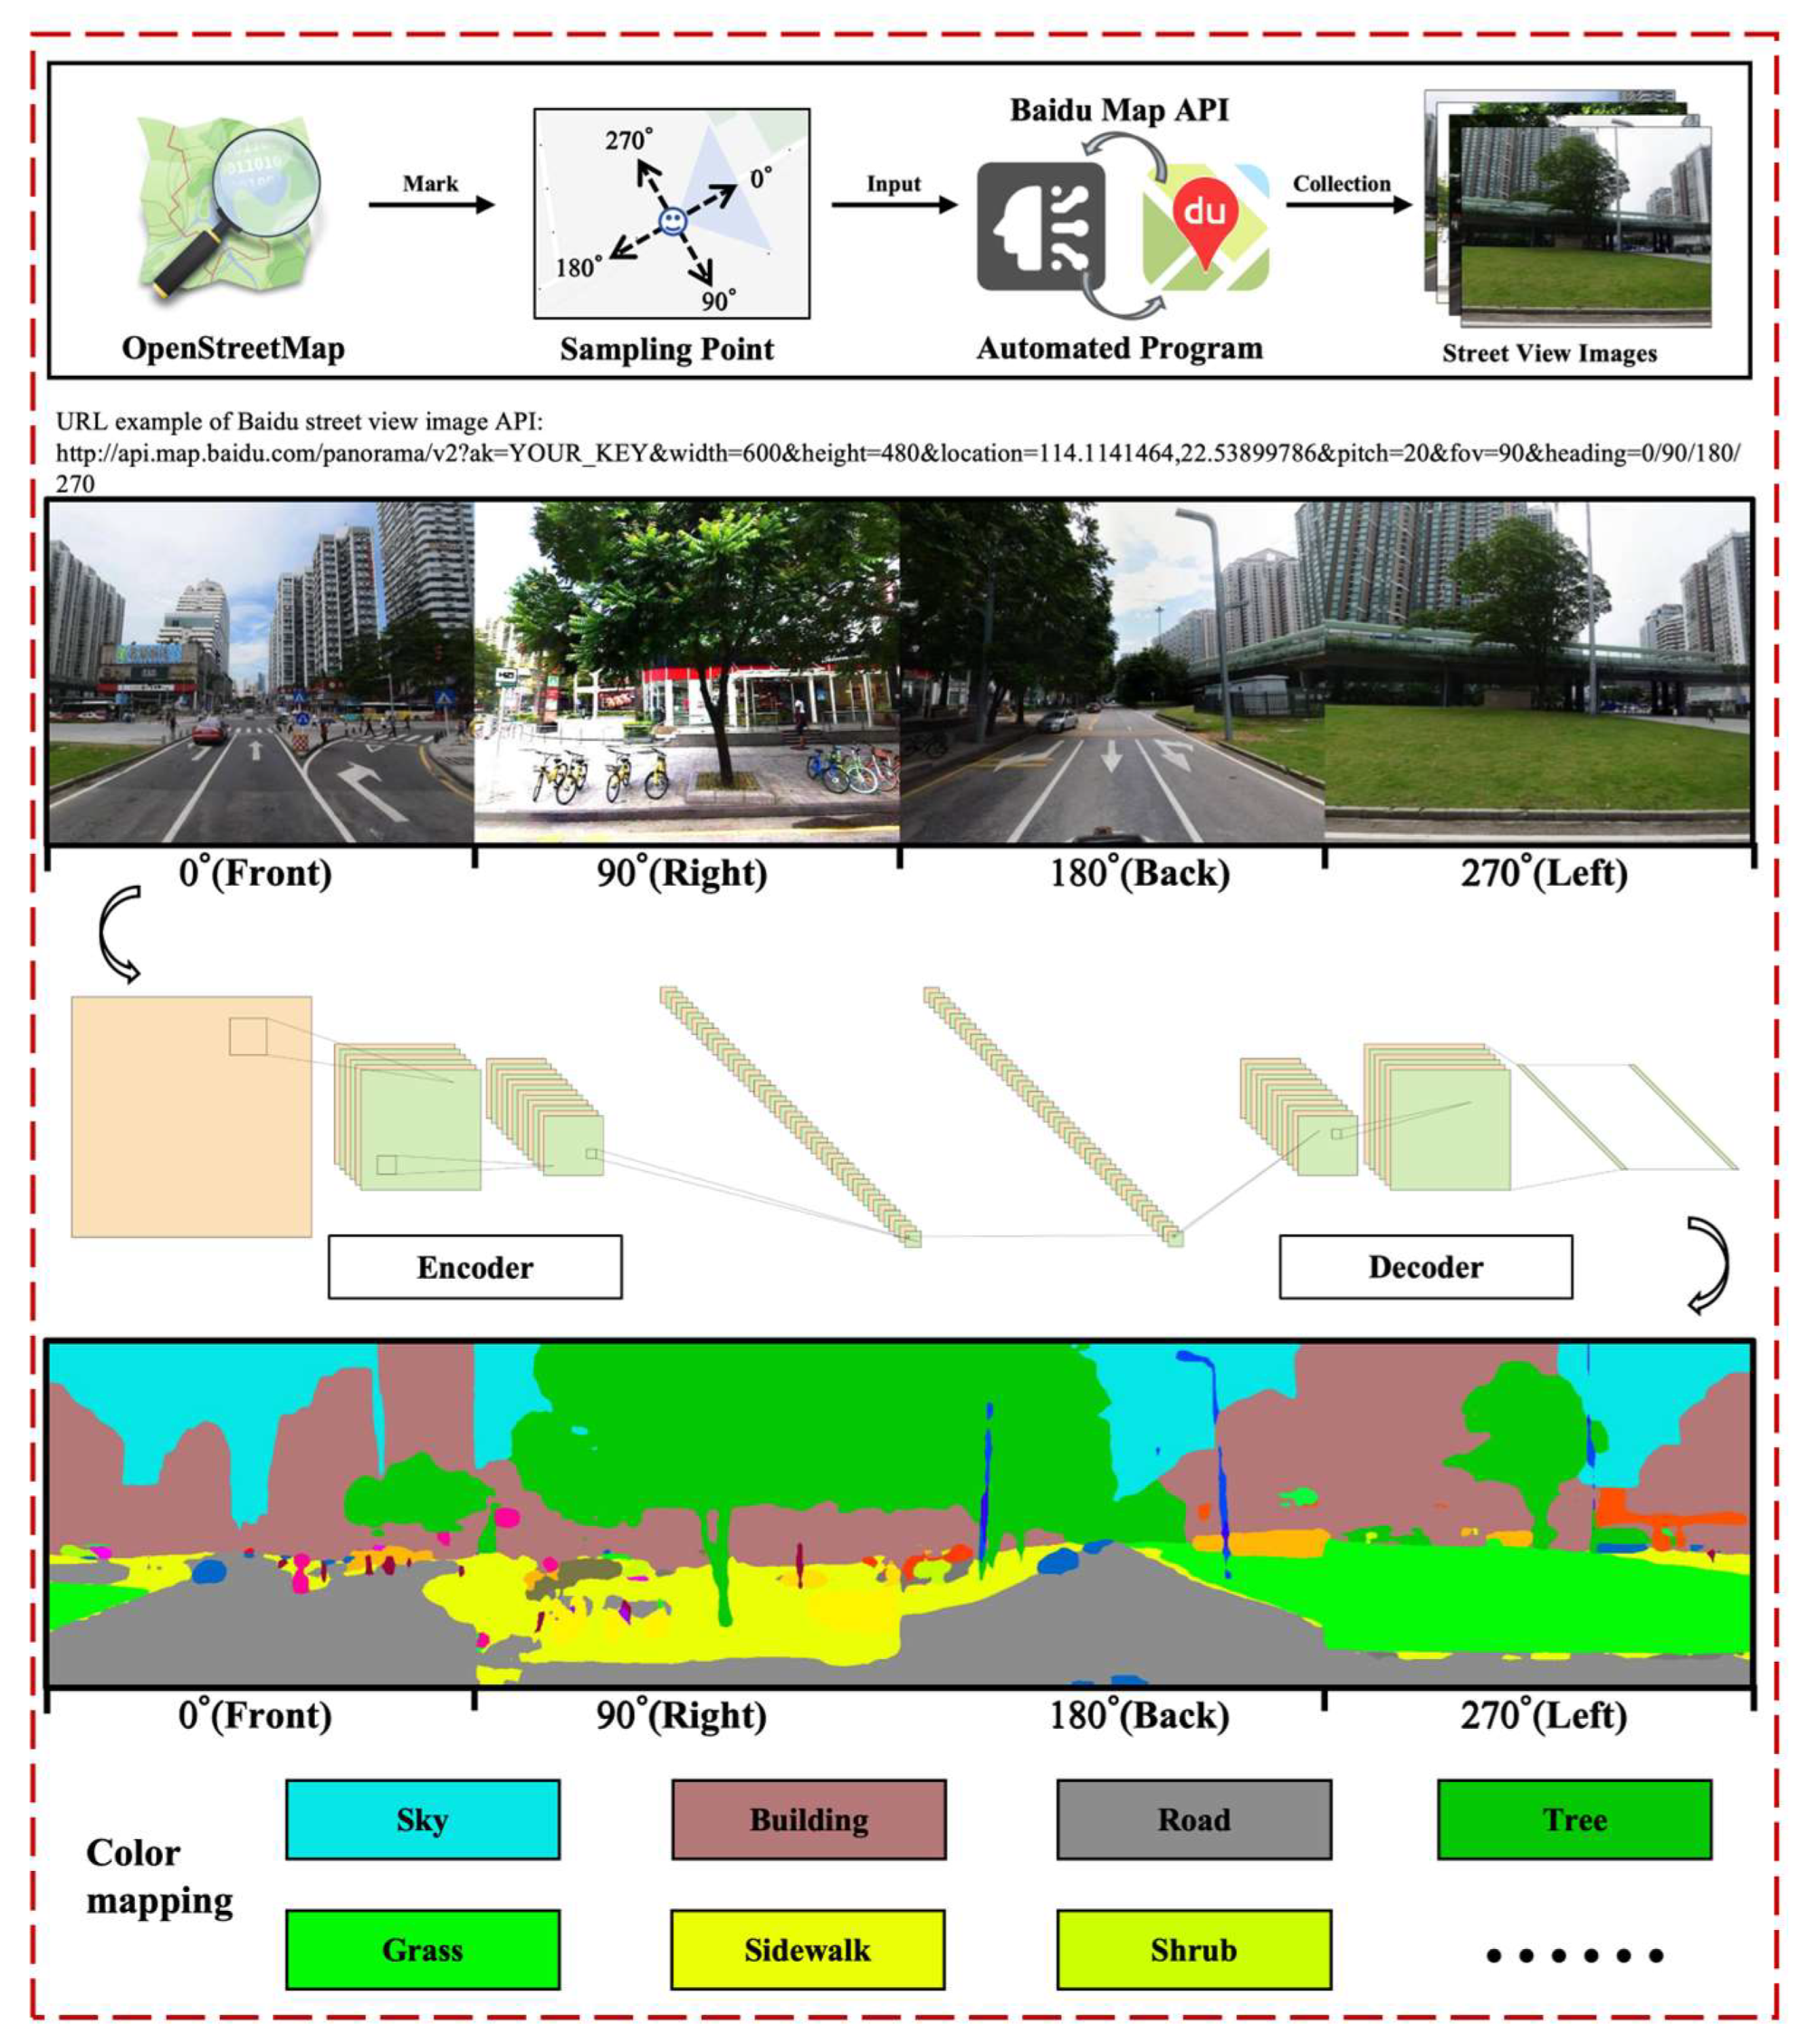
2.3. Street View Data Collection

Street view images enable measurement and characterization of the urban environment from a more precise and three-dimensional perspective, and are widely used in the analysis and evaluation of urban environments. Due to the absence of Google Street View in mainland China, Baidu Street View serves as an important tool for studying urban environments in Chinese mainland cities, offering accuracy comparable to Google Street View and being broadly applied in related research [36,49]. The street view images for this study were collected from Baidu Maps (https://api.map.baidu.com/panorama/v2?ak=YOURKEY, accessed on 16 February 2024), which we found to provide excellent coverage of Shenzhen, China. Based on previous research and the line of sight distance of pedestrians [37,48], collection points for Baidu Street View images were established and created at intervals of 50 meters throughout the road network using Geographic Information Systems (GIS). This approach is advantageous for collecting built environment data at a microscale in as much detail as possible, thereby ensuring the precision of the research. The road network used in this study was sourced from the Open Street Map (OSM) platform. To precisely depict a comprehensive view of street-level images from all four cardinal directions, we further calculated the viewing direction angles in GIS to ensure that all street view image collection points were parallel to the spatial forward direction of the road. This process helps improve the accuracy of measurements. Figure 3 shows a schematic diagram of the Baidu street view image sampling points. By calling the Baidu Street View map API, street view panoramas from four directions were obtained for each sample point, with image resolution set to 600 × 480 pixels. To avoid interference with the overall urban environment evaluation, data cleaning was performed to remove inaccessible and duplicate street view images, check the quality of street view photos, and eliminate low-quality images with issues such as blurriness, overexposure, or underexposure. The study generated a total of 354,586 collection points, collecting 1,045,524 valid street view images, which were stitched together to form 261,381 street view panoramas of the sample points.

2.4. Microscale-Built Environment Features Measurement Based on Image Segmentation

Scene semantic parsing, an essential technology for understanding scene perception, aims to segment and identify object instances in street view images [45,50]. This study employed image semantic segmentation technology for scene semantic parsing to measure urban-built environment features at a fine-grained level. The ADE_20K dataset, which includes elements from 150 daily life scenes such as the sky, roads, cars, plants, etc., has been proven to have high accuracy and has been widely applied in the semantic segmentation of street view images [51]. The dataset contains a total of 25,210 images, of which 20,210 are in the training set, 2000 in the validation set, and 3000 in the test set. Using this pre-trained dataset, we trained a convolutional neural network model with a SegNet architecture to achieve the precise classification of the collected street view images at the pixel level [52]. The network comprises two main parts: the encoder and the decoder. The encoder compresses and extracts information about objects, while the decoder restores the semantic information to the size of the input image, representing each pixel by the color corresponding to its object information. The outcomes of the training demonstrated an accuracy of 92.36% within the training dataset and 86.20% in the validation dataset, indicating that the model’s accuracy meets the research requirements. Following previous studies [37,53], we extracted the top 10 urban-built environment features with the highest image proportions for subsequent research. Figure 3 also illustrates the working process of this model.

2.5. Urban LST Inversion Based on GEE

The process of estimating LST based on satellite remote sensing data relies on the availability of thermal infrared sensors [54]. We used Landsat-8 OLI TIRS data as a basis, and collected LST data on the GEE platform. Subsequently, this study utilized the single-channel algorithm developed by Parastatidis et al. [55]. for LST inversion. This algorithm corrects LST using three different sources of emissivity: (1) the global emissivity released by ASTER (Advanced Spaceborne Thermal Emission and Reflection Radiometer) with a resolution of 100 m; (2) daily emissivity from MODIS (Moderate Resolution Imaging Spectroradiometer); (3) emissivity calculated based on NDVI (Normalized Difference Vegetation Index). In the GEE environment, we calculated and extracted the median LST for summer (1 June to 31 August 2023) based on the vector boundaries of Shenzhen. Compared to annual data, summer LST is more representative of the UHI effect, as it is the period when this phenomenon is most prevalent.

2.6. Explaining the Relationship between the Microscale Urban-Built Environment and LST

To better unveil the complex impacts of the urban-built environment on LST, we employed three different regression models: OLS, GWR, and MGWR. The field of urban environment studies widely uses OLS linear regression to explore the relationship between the dependent variable and independent variables [37]. OLS linear regression is a comprehensive model that calculates the coefficients of the explanatory variables in a linear equation. It achieves this by minimizing the total of the squared discrepancies between the forecasted and actual values within the dataset [56]. The formula for OLS is as follows (Equation (1)):
Y = X β + ϵ
Here, Y is the dependent variable, X is the matrix of explanatory variables, β is the vector of coefficients, and ϵ is the vector of random error terms.
OLS assumes that data are spatially stationary across their distribution. However, variables in actual studies are often spatially non-stationary. For spatially non-stationary data, a spatial regression model like GWR becomes necessary. GWR allows regression coefficients to vary across different spatial locations, enabling analysis of how variables related to the urban-built environment impact urban LST through spatially varying regression coefficients [57]. GWR defines neighborhoods using a single bandwidth and optimizes parameters through golden section search optimization and the corrected Akaike Information Criterion corrected (AICc). The model is evaluated using a bisquare distance weighting function. The formula for GWR is as follows (Equation (2)):
Y i = α 0 u i , v i + k = 1 m a k u i , v i X k u i , v i + ε i
Here, Yi is the LST and its coordinates (ui,vi), α0(ui,vi) is the intercept of the model, ak(ui,vi) is the regression coefficient of the kth independent variable data at (ui,vi), Xk(ui,vi) is to the kth attribute at position i, and εi is the random error of the model.
MGWR is an extension of GWR, providing individual bandwidths for each variable to more accurately reflect the influence of spatial scales [58]. Unlike GWR, MGWR employs adaptive kernel bandwidths, specifying the minimum number of data points that must be included in each local regression model. This approach can significantly address edge effects and non-uniform spatial distributions. For parameter optimization, we use the golden section search optimization procedure, with the AICc as the criterion for model fit. The formula for MGWR is as follows (Equation (3)):
Y i = α 0 u i , v i + k = 1 m a b w k u i , v i X k u i , v i + ε i
Here, abwk is the kth explanatory variable with an added bandwidth term bw, and each explanatory variable has a separate spatial scale.

3. Results

3.1. Microscale-Built Environment Features

The semantic segmentation results of the street view images in our study area were aggregated, and the top 10 most prevalent microscale-built environment elements were extracted for further analysis. The descriptive statistics of the built environment features are presented in Table 1. The results indicate significant variations in the distribution of each microscale-built environment element. The sky, representing the openness of space, is the most dominant feature with an average value of 0.239, but it varies greatly across the entire area. The proportion of roads, ranking second after the sky (0.208), exhibits less variability than the sky. Roads signify the urbanization level, and the results suggest a high degree of artificialization in Shenzhen. Trees, as the main contributors to urban greening and key elements providing ecological benefits, have an average value of 0.194 but fluctuate significantly, reaching up to 0.666 in some areas. This reflects the uneven spatial distribution of greenery in Shenzhen. Buildings, one of the dominant factors affecting the urban thermal environment, are crucial components of urban structure. Measurements from street view images allow for a comprehensive assessment of the density, area, and form of buildings. The average coverage is 0.141, with a maximum of 0.600, indicating excessive building density in some urban areas. These elements significantly outnumber other elements, highlighting their dominant role in the urban-built environment. Grass and water have the lowest average values, at 0.013 and 0.001 respectively, indicating their relative scarcity in Shenzhen’s urban structure. Notably, the maximum coverage of water is only 0.026, which may suggest that water features are limited or marginalized in street-level photography.

3.2. Spatial Distribution of Urban LST

This study used the GEE platform to invert the spatial distribution map of Shenzhen’s LST for the summer of 2023. As can be seen from Figure 4A, LST in Shenzhen varied between 29 °C and 69 °C. The temperature distribution shows that the LST values in the urban center and industrial concentration areas are relatively high, displaying the typical UHI effect. In contrast, the suburban and vegetation-covered areas have lower LST values, indicating that green spaces play a significant role in mitigating the UHI effect. Through spatial autocorrelation analysis (Figure 4B), this study further revealed the clustering characteristics of LST distribution. High–high cluster areas are mainly concentrated in the city center, industrial zones, and along major transportation arteries, where high LST values show significant spatial clustering. Low–low clusters are primarily located in suburban areas, large parks, and near water, indicating that these areas are conducive to cooling temperatures. Notably, high–low and low–high cluster areas are relatively few, suggesting a trend of spatial separation in the extremes of LST, i.e., the temperature distribution within areas of high or low temperature is relatively uniform. Overall, these results highlight the spatial unevenness of Shenzhen’s LST in summer, as well as the role of vegetation and urban structure in forming and regulating the UHI effect.

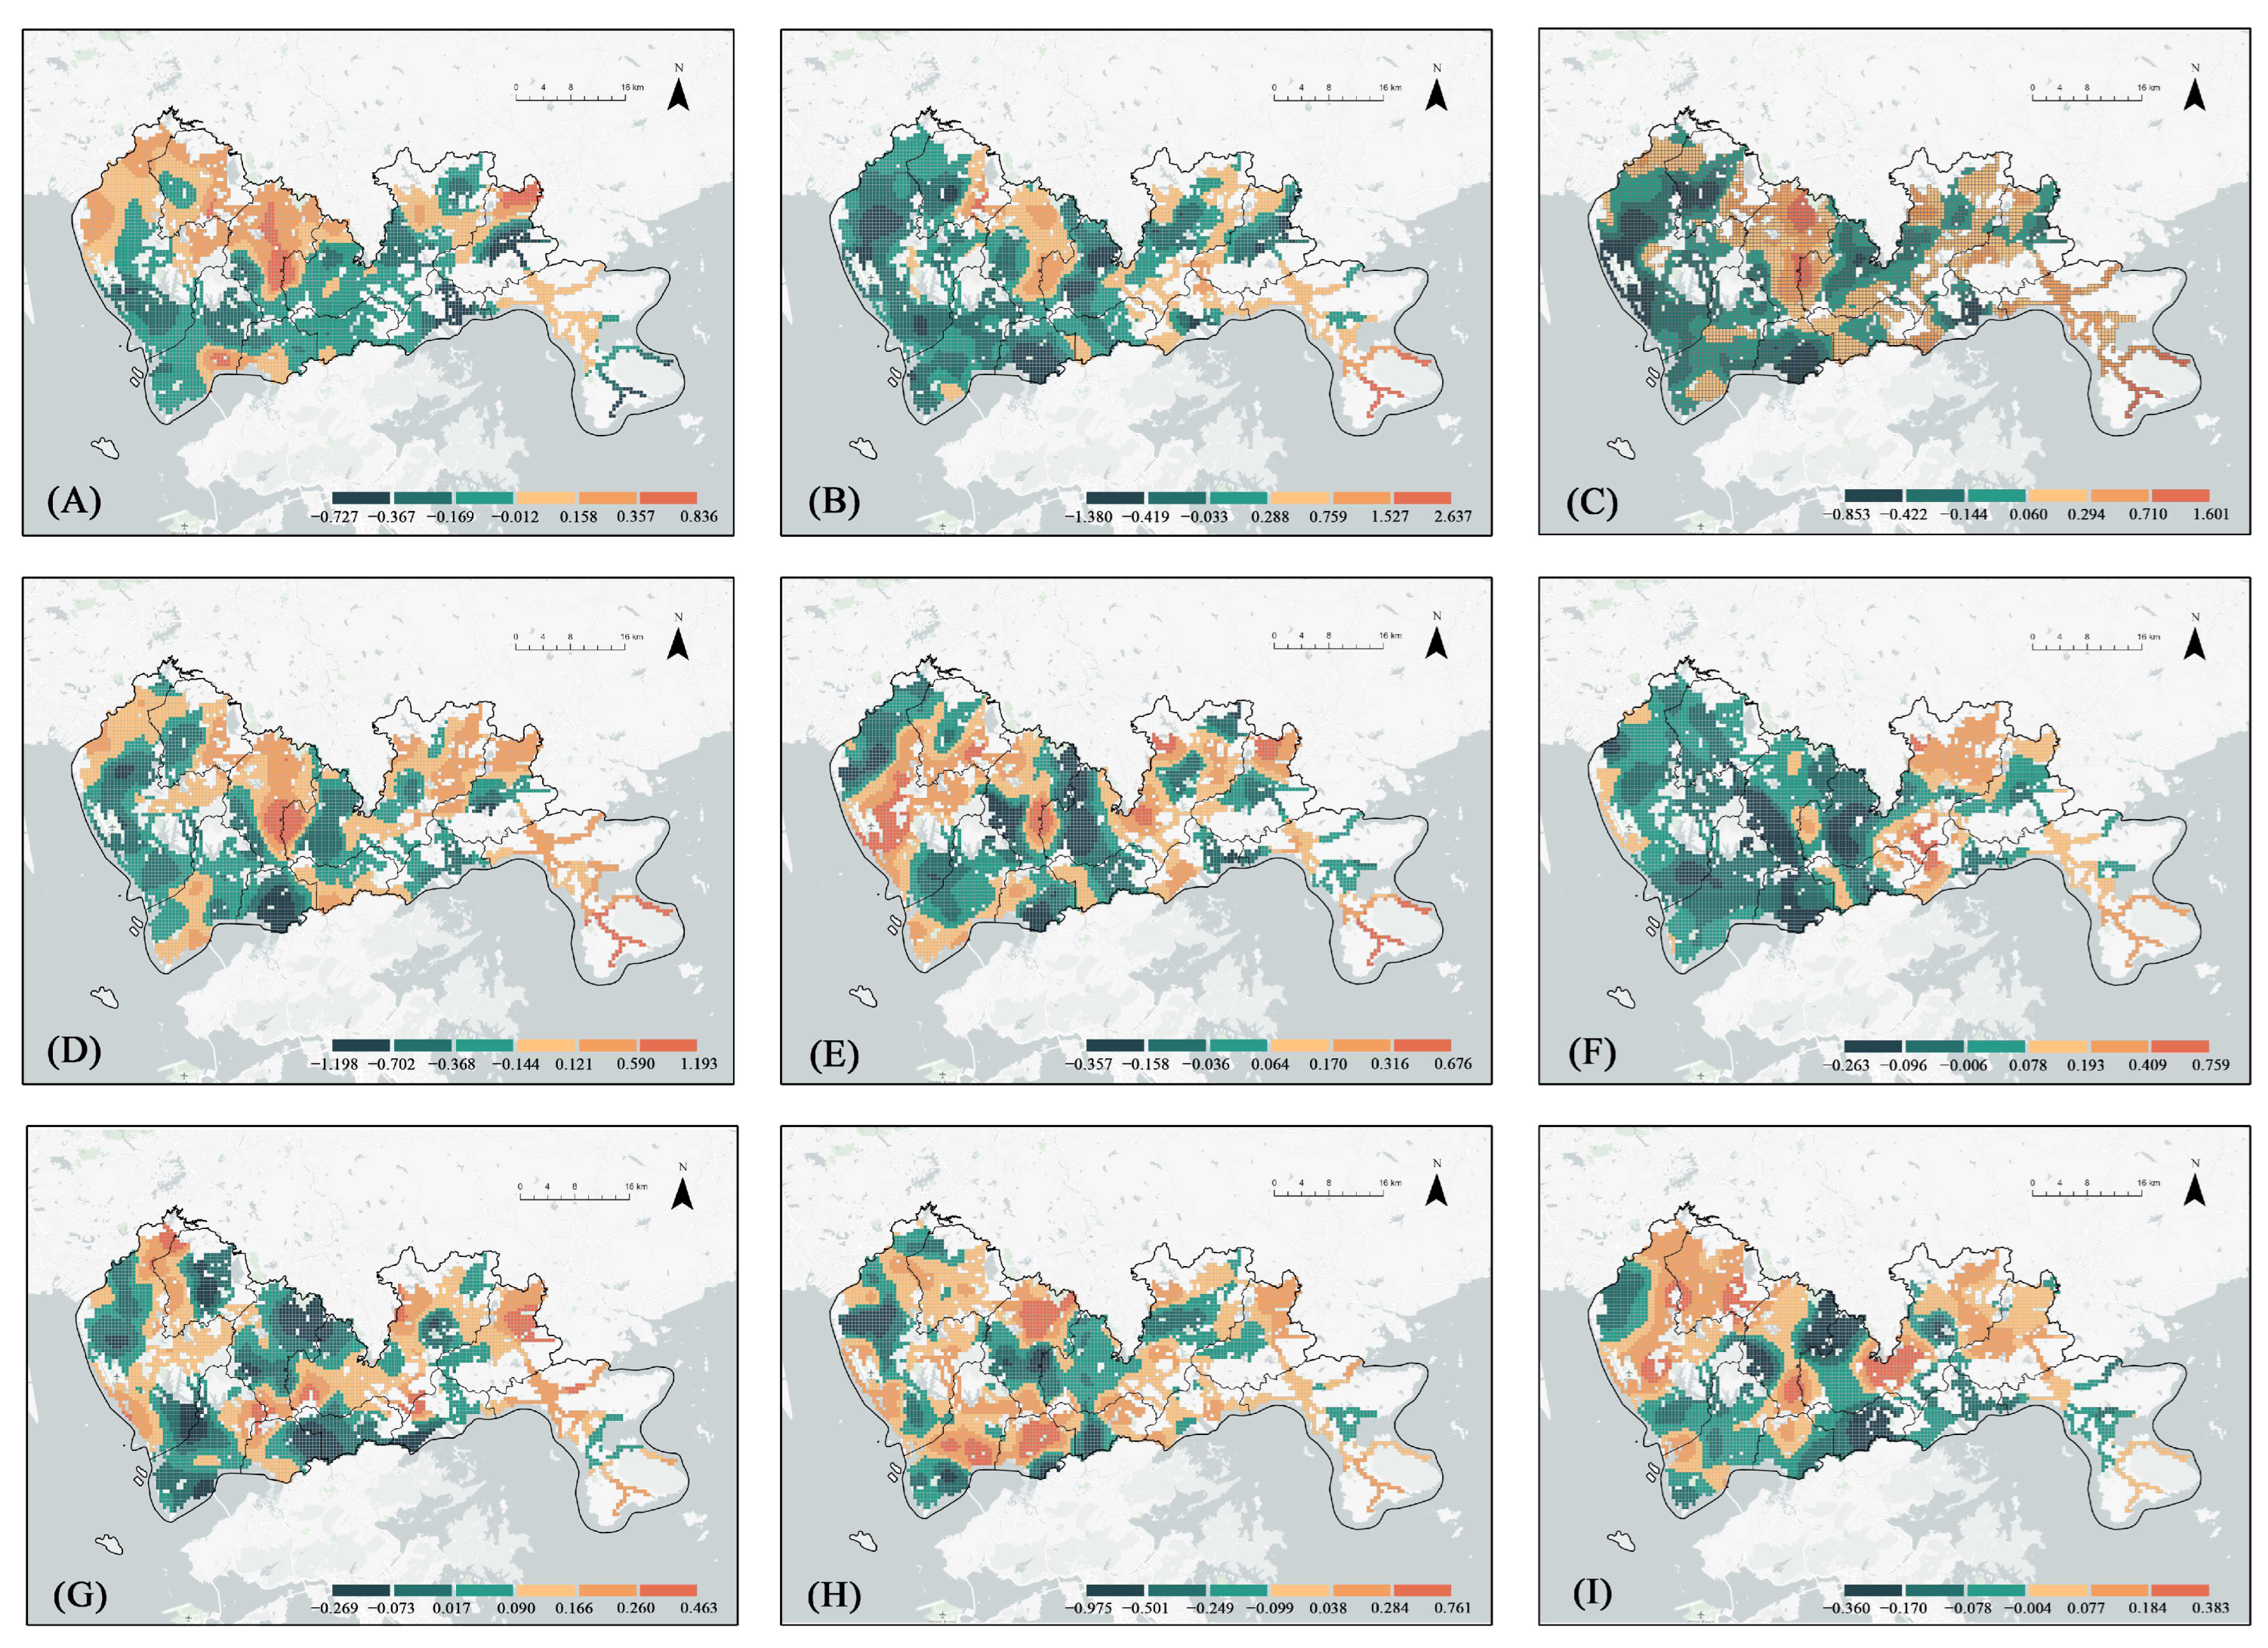
3.3. Regression Results

To dissect the elements influencing LST, our study undertook experiments employing three distinct models: OLS, GWR, and MGWR. These experiments aimed to scrutinize the link between characteristics of the urban-built environment and LST. Preliminary OLS analysis correlating features of the urban-built environment with urban LST revealed that the Variance Inflation Factors (VIFs) for all urban-built environment variables were below 4, indicating an absence of collinearity concerns. In our quest to identify the most fitting regression model to elucidate the relationship between urban-built environment traits and LST, we evaluated the efficacy of the OLS, GWR, and MGWR models, as depicted in Table 2. The MGWR model outperformed its counterparts in both R2 values and AICc metrics, leading to a focused examination of the MGWR model’s regression outcomes. The findings from the MGWR model, which highlighted the significance of geographic discrepancies, underscored the importance of adopting a spatially oriented regression model. This approach is invaluable for capturing the diverse effects that various urban attributes exert on LST across different locales. Specifically, the average coefficient for the sky in the MGWR model was positive (average coefficient = 0.021; range = −0.853 to 1.601), implying that theoretically, an increase in sky visibility could be related to an increase in LST. The spatial heterogeneity of sky impact was significant. In some areas, greater sky visibility correlated positively with higher LST, possibly reflecting less shading and vegetation, leading to more solar radiation reaching the ground. Roads and buildings were overall positively related to an increase in LST, possibly due to the heat-absorbing physical properties of impervious surfaces. Trees had a significant cooling effect on LST, but this effect was spatially uneven (average coefficient = −0.116; range = −1.198 to 1.194), which could relate to the density, type of trees, and their surrounding environment. For example, dense canopies can more effectively reduce temperatures, while the transpiration capacity and shading area of different tree species also influence their cooling effects. Furthermore, if there are buildings or other man-made structures around the trees, this may impact their temperature regulation effects. For Earth (average coefficient = −0.075; range = −0.975 to 0.761), the negative average coefficient might indicate that unpaved surfaces help lower temperatures, possibly due to the natural cooling effect of the land. The coefficient for sidewalk, although on average positive (average coefficient = 0.073), varied significantly across different areas (range = −0.268 to 0.078), possibly reflecting differences in surrounding vegetation and ground materials. Water had a coefficient very close to zero in the MGWR model, suggesting the limited waterside spaces in Shenzhen city contributed minimally to mitigating the UHI effect.
We further visualized the regression coefficients on a map to better integrate the actual urban situation and explore the impact of different built environment characteristics (Figure 5). It should be noted that since the impact of water on LST was not significant, we did not plot its results. The results show significant heterogeneity in the effects of urban microscale environment characteristics on LST across different city districts. The wall feature demonstrated a stronger cooling effect in industrial and commercial areas, possibly due to the wind tunnel effect created between tall buildings. In densely populated areas, the positive effects of walls on temperature were more pronounced due to dense buildings reducing ventilation. The building feature showed a strong positive correlation in the center and commercial areas of Shenzhen, reflecting the contribution of high building density and the concrete jungle effect to the UHI phenomenon. The impact of the sky feature on LST varied greatly across different areas in city centers, where the visibility of the sky was often limited by tall buildings. In contrast, in the outskirts, open skies might increase exposure to solar radiation. Trees exhibited a significant cooling effect in the suburbs and urban green spaces of Shenzhen, but in the city center, due to limited space and lower green coverage, their cooling effect was diminished. The road feature had a notable positive correlation with the temperature near Shenzhen’s main traffic arteries, possibly related to the high heat absorption capacity of urban impervious surfaces. Grass provided a cooling effect in parks and residential areas, but in commercial and industrial areas, this effect was suppressed by hardened ground surfaces. Sidewalks reflected different impacts on temperature in urban planning, depending on the choice of materials and design concepts, with areas using more permeable materials potentially offering better cooling effects. Earth demonstrated a negative regulatory effect on temperature in undeveloped areas and suburban farmlands. Shrub generally had little impact on temperature across various land uses but might help provide microclimate regulation in urban parks and residential green spaces. These results reflect the enormous spatial differences in regional characteristics and urban morphology of Shenzhen, a rapidly developing metropolis, significantly altering the impact capabilities of different built environment factors.

4. Discussion

4.1. Exploring the Effects of Microscale Built Environment on LST

Urban issues, epitomized by the UHI effect, significantly impact human well-being [59]. As the main spaces of daily activity for urban residents, street environments are closely related to residents’ living experiences and physical and mental health. Examining the urban thermal environment from the microscale perspective of streets is crucial for mitigating the UHI [60]. In megacities like Shenzhen, where population density is high and urbanization levels are significant, street environments pose a greater potential threat to residents’ quality of life and public health. Therefore, in its urban planning and street design, Shenzhen should consider urban surface temperatures from a street perspective to reveal specific block contributions to the UHI, enabling urban planners and designers to take targeted cooling measures.
In this study, we conducted semantic segmentation on street-level imagery from Shenzhen, utilizing machine learning techniques to quantify features of the urban-built environment. Subsequently, by applying MGWR, we investigated the connection between these urban-built environment characteristics and LST. This analysis uncovered the spatial variability inherent in this relationship, providing a more precise roadmap for enhancing urban environmental conditions. First, we found a positive impact between sky visibility and LST, indicating that open spaces in the city lead to direct solar radiation on the ground, thereby raising the surface temperature. Second, roads and buildings, as representatives of urban impervious surfaces, have a positive relationship with the increase in LST. This finding supports previous research [61] that urban impervious surfaces, such as concrete and asphalt, contribute to temperature increases due to their heat-absorbing properties. Especially in city centers and industrial areas, high building density and traffic congestion further exacerbate the UHI effect. Conversely, the presence of trees has a significant cooling effect on LST, particularly evident in suburban areas and regions with more green space. Trees reduce the temperature of the ground and surrounding air effectively by providing shade and releasing water into the atmosphere through transpiration [62,63]. This cooling effect is uneven across different areas, likely related to the type and density of vegetation, and surrounding environmental conditions. Additionally, our study found that the coverage of earth and water contributed relatively little to lowering urban LSTs, possibly related to Shenzhen’s urban structure and geographical characteristics, where available earth and water are limited. These findings point to priorities for future urban planning.
The findings of this study not only provide empirical data in the specific context of Shenzhen but also underscore the broader significance of these results for global urbanization processes and climate change adaptation strategies. By conducting research in a rapidly urbanizing metropolis like Shenzhen, we revealed the complex relationships between urban-built environment features and LST, and how optimizing these environmental features can mitigate the UHI effect. These insights significantly deepen our comprehension of the mechanisms regulating urban microclimates. Moreover, they bear critical implications for the development of pragmatic urban planning and design strategies, aiming at optimizing environmental conditions within cityscapes.

4.2. Policy Implications

As China’s rapid urbanization process matures, the traditional expansionist development model becomes unsustainable, making urban renewal and the optimization of existing resources a new direction for development. Shenzhen, one of the world’s most populous cities and a typical high-density city [64], sets an important precedent for other high-density cities by addressing its urban issues through urban renewal and stock development. Urban renewal focuses on enhancing the efficiency of existing urban spaces and resources and upgrading urban spatial structures. This requires precise and fine-grained measurement of the comprehensive benefits of the urban environment, providing scientific guidance for planning and construction [44]. In the context of urban renewal and stock development, revealing the microscale-built environment characteristics and their impact on LST from a street perspective is crucial. This helps understand the specific cooling effects of minor spatial elements and their spatial variability.
Based on our study’s results, we offer the following policy recommendations: First, strengthen urban greening policies, such as increasing the number and quality of parks and urban green belts, encouraging rooftop greening and vertical greening to enhance the city’s overall ecological benefits and residents’ quality of life. Second, optimize urban land use planning, focusing on the diversity and rationality of land use, especially in city centers and industrial areas. Through planning guidance, reduce overly dense building layouts, and increase open space and green areas.
To further enhance the environmental performance of roads and buildings, it is recommended to promote the use of high-reflectivity surface materials and exterior wall materials that reduce solar radiation absorption. Encouraging green building design and the use of sustainable materials aligns with Shenzhen’s long-term goals of building a “smart city” and “sustainable city”. Strengthen urban water body management and protection, conserve existing water, restore urban rivers, add artificial lakes or water features, and improve the city’s overall water environment quality. Third, implement spatially differentiated urban planning, adopting strategies tailored to the characteristics and needs of different areas to develop more refined planning strategies. These policy suggestions aim to promote a more sustainable and livable urban environment, enhance the scientific and forward-looking nature of urban management, and address the environmental and social challenges of rapid urbanization. These not only comply with Shenzhen’s overall planning requirements but also provide a reference for Shenzhen and other Chinese cities to address environmental and social challenges in the process of rapid urbanization.

4.3. Limitations and Future Directions

This investigation delved into the effects of the urban-built environment on LST through the analysis of street view photographs and the deployment of machine learning technologies, presenting a novel viewpoint for comprehending the UHI. However, it’s important to note the limitations of this study. First, the research relies on street view images, meaning the analysis is constrained by the coverage and update frequency of the images. While street view imagery affords a ground-level perspective of the urban landscape, its ability to accurately represent environmental features may be compromised under the coverage of tall buildings or dense foliage, potentially resulting in less precise delineation of certain elements of the built environment. Second, while this study explored the impact of urban-built environment characteristics on LST and spatial variability through MGWR, it did not examine other factors that might affect the UHI effect, such as population density, economic activities, or traffic flow. The comprehensive impact of these socio-economic factors is crucial for a full understanding of the UHI effect. Third, the interactions between different built environment elements and their relationship with LST were not considered in this study. Lastly, this study analyzed cross-sectional data, lacking consideration of the relationship between urban-built environment and LST over time and unable to determine causality. Therefore, we suggest using multi-year data in future research to assess the impact of long-term changes in the built environment on the UHI effect.

5. Conclusions

In the context of global climate change, understanding the distribution of urban LST and its driving factors is crucial for optimizing urban planning and enhancing the residents’ well-being. This study, leveraging machine learning and street view images, delved into the association between urban-built environment features and LST. Our results highlight the profound impact of the urban-built environment on the UHI effect. The semantic segmentation of street view images revealed features of the urban-built environment. High values of sky features indicate the openness of space, while the widespread distribution of buildings and roads reflects the high degree of urbanization in Shenzhen. Trees, as primary agents of urban greening, exhibit high spatial variability, pointing to the uneven distribution of green spaces. The LST results show a temperature range between 29 °C and 69 °C, with relatively higher temperatures in urban centers and industrial areas, exhibiting a typical UHI effect. Spatial autocorrelation analysis further elucidated the clustering characteristics of LST distribution, with high–high clusters concentrated in urban centers and industrial areas along major transportation routes, while low–low clusters predominantly located in suburban areas and city forests.
This study provides an in-depth exploration of the relationship between microscale-built environment elements and LST. Using three different models—OLS, GWR, and MGWR—we found that the MGWR model performs optimally in explaining the relationship between microscale-built environment characteristics and LST. The MGWR model identifies spatial variations in the impact of different urban features on LST at various locations. Specifically, the visibility of the sky and the presence of roads and buildings generally promote LST. In contrast, trees, shrubs, and grass have a significant cooling effect, although this effect shows spatial heterogeneity. Their influence is more pronounced in urban green spaces and residential areas, while it is limited in commercial and industrial zones. Earth contributes to temperature reduction, underscoring the cooling capacity of natural surfaces. The impact of sidewalks varies by area, which may reflect the influence of the materials and design of the sidewalk surfaces.
Our research underscores the importance of understanding and optimizing urban structure and functions based on insights into the microscale-built environment’s impact on LST for regulating urban thermal environments and mitigating urban heat island effects. These findings have practical implications for urban planning and management, suggesting the importance of focusing on green infrastructure, rational architectural layout, and road design to enhance urban environmental quality and resident welfare. Additionally, this study aids in a more precise understanding of urban thermal environments, guiding urban planners and policymakers to implement spatially differentiated measures, thereby promoting sustainable urban development and providing scientific references for other global cities.

Author Contributions

Conceptualization, T.Z., Y.Z. and Y.H.; data curation, Z.L.; funding acquisition, Y.Z. and Y.H.; methodology, T.Z. and Z.L.; software, L.W.; supervision, Y.Z.; visualization, T.Z. and W.Z.; writing—original draft, T.Z. and Y.H.; writing—review and editing, T.Z., Z.L., L.W., Y.Z. and Y.H. All authors have read and agreed to the published version of the manuscript.

Funding

This research was funded by Reconstructing the Architecture System based on the Coherence Mechanism of “Architecture-human-environment” in the Chinese Context, Key Project of National Natural Science Foundation of China, grant number 52038007.

Institutional Review Board Statement

Not applicable.

Informed Consent Statement

Not applicable.

Data Availability Statement

The data presented in this study are available on request from the corresponding author. In order to promote future research and the dissemination of this innovation, the source data and code for this research can be found at https://github.com/Ericzzz66/ZTLUrbanStudies/tree/main/Changlifang_SVI (accessed on 29 March 2024).

Conflicts of Interest

Author Zhao Lin is employed by the CCCC Second Highway Engineering Co., Ltd. The remaining authors declare that the research was conducted in the absence of any commercial or financial relationships that could be construed as a potential conflict of interest.

Abbreviations

AbbreviationFull term
LSTLand surface temperatures
UHIUrban heat island
GEEGoogle earth engine
OLSOrdinary Least Squares
GWRGeographically weighted regression
MGWRMultiscale geographically weighted regression
GISGeographic information systems
OSMOpen street map
AICAkaike information criterion corrected

References

  1. Samson, J.; Berteaux, D.; McGill, B.J.; Humphries, M.M. Geographic Disparities and Moral Hazards in the Predicted Impacts of Climate Change on Human Populations: Spatially Explicit Impacts of Climate Change on Human Populations. Glob. Ecol. Biogeogr. 2011, 20, 532–544. [Google Scholar] [CrossRef]
  2. Pecl, G.T.; Araújo, M.B.; Bell, J.D.; Blanchard, J.; Bonebrake, T.C.; Chen, I.-C.; Clark, T.D.; Colwell, R.K.; Danielsen, F.; Evengård, B.; et al. Biodiversity Redistribution under Climate Change: Impacts on Ecosystems and Human Well-Being. Science 2017, 355, eaai9214. [Google Scholar] [CrossRef]
  3. Dye, C. Health and Urban Living. Science 2008, 319, 766–769. [Google Scholar] [CrossRef]
  4. Wang, R.; Xue, D.; Liu, Y.; Chen, H.; Qiu, Y. The Relationship between Urbanization and Depression in China: The Mediating Role of Neighborhood Social Capital. Int. J. Equity Health 2018, 17, 105. [Google Scholar] [CrossRef]
  5. McLeman, R. Impacts of Population Change on Vulnerability and the Capacity to Adapt to Climate Change and Variability: A Typology Based on Lessons from “a Hard Country”. Popul. Environ. 2010, 31, 286–316. [Google Scholar] [CrossRef]
  6. Hamnett, C. Is Chinese Urbanisation Unique? Urban Stud. 2020, 57, 690–700. [Google Scholar] [CrossRef]
  7. Long, Y. Redefining Chinese City System with Emerging New Data. Appl. Geogr. 2016, 75, 36–48. [Google Scholar] [CrossRef]
  8. Schneider, A.; Chang, C.; Paulsen, K. The Changing Spatial Form of Cities in Western China. Landsc. Urban Plan. 2015, 135, 40–61. [Google Scholar] [CrossRef]
  9. Helbich, M. Toward Dynamic Urban Environmental Exposure Assessments in Mental Health Research. Environ. Res. 2018, 161, 129–135. [Google Scholar] [CrossRef]
  10. Kalnay, E.; Cai, M. Impact of Urbanization and Land-Use Change on Climate. Nature 2003, 423, 528–531. [Google Scholar] [CrossRef]
  11. Yu, Z.; Guo, X.; Zeng, Y.; Koga, M.; Vejre, H. Variations in Land Surface Temperature and Cooling Efficiency of Green Space in Rapid Urbanization: The Case of Fuzhou City, China. Urban For. Urban Green. 2018, 29, 113–121. [Google Scholar] [CrossRef]
  12. Masoudi, M.; Tan, P.Y. Multi-Year Comparison of the Effects of Spatial Pattern of Urban Green Spaces on Urban Land Surface Temperature. Landsc. Urban Plan. 2019, 184, 44–58. [Google Scholar] [CrossRef]
  13. Goldblatt, R.; Addas, A.; Crull, D.; Maghrabi, A.; Levin, G.G.; Rubinyi, S. Remotely Sensed Derived Land Surface Temperature (LST) as a Proxy for Air Temperature and Thermal Comfort at a Small Geographical Scale. Land 2021, 10, 410. [Google Scholar] [CrossRef]
  14. Chapman, S.; Watson, J.E.M.; Salazar, A.; Thatcher, M.; McAlpine, C.A. The Impact of Urbanization and Climate Change on Urban Temperatures: A Systematic Review. Landsc. Ecol. 2017, 32, 1921–1935. [Google Scholar] [CrossRef]
  15. Zhou, M.; Wang, H.; Zeng, X.; Yin, P.; Zhu, J.; Chen, W.; Li, X.; Wang, L.; Wang, L.; Liu, Y.; et al. Mortality, Morbidity, and Risk Factors in China and Its Provinces, 1990–2017: A Systematic Analysis for the Global Burden of Disease Study 2017. Lancet 2019, 394, 1145–1158. [Google Scholar] [CrossRef] [PubMed]
  16. Ogoh, S.; Sato, K.; Okazaki, K.; Miyamoto, T.; Hirasawa, A.; Morimoto, K.; Shibasaki, M. Blood Flow Distribution during Heat Stress: Cerebral and Systemic Blood Flow. J. Cereb. Blood Flow Metab. 2013, 33, 1915–1920. [Google Scholar] [CrossRef] [PubMed]
  17. Duan, S.; Luo, Z.; Yang, X.; Li, Y. The Impact of Building Operations on Urban Heat/Cool Islands under Urban Densification: A Comparison between Naturally-Ventilated and Air-Conditioned Buildings. Appl. Energy 2019, 235, 129–138. [Google Scholar] [CrossRef]
  18. Sobrino, J.A.; Oltra-Carrió, R.; Sòria, G.; Bianchi, R.; Paganini, M. Impact of Spatial Resolution and Satellite Overpass Time on Evaluation of the Surface Urban Heat Island Effects. Remote Sens. Environ. 2012, 117, 50–56. [Google Scholar] [CrossRef]
  19. Kayet, N.; Pathak, K.; Chakrabarty, A.; Sahoo, S. Urban Heat Island Explored by Co-Relationship between Land Surface Temperature vs Multiple Vegetation Indices. Spat. Inf. Res. 2016, 24, 515–529. [Google Scholar] [CrossRef]
  20. Bonafoni, S.; Baldinelli, G.; Verducci, P. Sustainable Strategies for Smart Cities: Analysis of the Town Development Effect on Surface Urban Heat Island through Remote Sensing Methodologies. Sustain. Cities Soc. 2017, 29, 211–218. [Google Scholar] [CrossRef]
  21. Ngie, A.; Abutaleb, K.; Ahmed, F.; Darwish, A.; Ahmed, M. Assessment of Urban Heat Island Using Satellite Remotely Sensed Imagery: A Review. S. Afr. Geogr. J. 2014, 96, 198–214. [Google Scholar] [CrossRef]
  22. Chen, Y.; Shan, B.; Yu, X. Study on the Spatial Heterogeneity of Urban Heat Islands and Influencing Factors. Build. Environ. 2022, 208, 108604. [Google Scholar] [CrossRef]
  23. Streutker, D.R. A Remote Sensing Study of the Urban Heat Island of Houston, Texas. Int. J. Remote Sens. 2002, 23, 2595–2608. [Google Scholar] [CrossRef]
  24. Zhou, D.; Xiao, J.; Bonafoni, S.; Berger, C.; Deilami, K.; Zhou, Y.; Frolking, S.; Yao, R.; Qiao, Z.; Sobrino, J. Satellite Remote Sensing of Surface Urban Heat Islands: Progress, Challenges, and Perspectives. Remote Sens. 2018, 11, 48. [Google Scholar] [CrossRef]
  25. Soltani, A.; Sharifi, E. Daily Variation of Urban Heat Island Effect and Its Correlations to Urban Greenery: A Case Study of Adelaide. Front. Archit. Res. 2017, 6, 529–538. [Google Scholar] [CrossRef]
  26. Zhou, X.; Chen, H. Impact of Urbanization-Related Land Use Land Cover Changes and Urban Morphology Changes on the Urban Heat Island Phenomenon. Sci. Total Environ. 2018, 635, 1467–1476. [Google Scholar] [CrossRef]
  27. Wang, H.; Zhang, Y.; Tsou, J.; Li, Y. Surface Urban Heat Island Analysis of Shanghai (China) Based on the Change of Land Use and Land Cover. Sustainability 2017, 9, 1538. [Google Scholar] [CrossRef]
  28. Li, W.; Cao, Q.; Lang, K.; Wu, J. Linking Potential Heat Source and Sink to Urban Heat Island: Heterogeneous Effects of Landscape Pattern on Land Surface Temperature. Sci. Total Environ. 2017, 586, 457–465. [Google Scholar] [CrossRef]
  29. Raj, S.; Paul, S.K.; Chakraborty, A.; Kuttippurath, J. Anthropogenic Forcing Exacerbating the Urban Heat Islands in India. J. Environ. Manag. 2020, 257, 110006. [Google Scholar] [CrossRef]
  30. Pinheiro, A.C.T.; Mahoney, R.; Privette, J.L.; Tucker, C.J. Development of a Daily Long Term Record of NOAA-14 AVHRR Land Surface Temperature over Africa. Remote Sens. Environ. 2006, 103, 153–164. [Google Scholar] [CrossRef]
  31. Imhoff, M.L.; Zhang, P.; Wolfe, R.E.; Bounoua, L. Remote Sensing of the Urban Heat Island Effect across Biomes in the Continental USA. Remote Sens. Environ. 2010, 114, 504–513. [Google Scholar] [CrossRef]
  32. Prakash, S.; Norouzi, H. Land Surface Temperature Variability across India: A Remote Sensing Satellite Perspective. Theor. Appl. Climatol. 2020, 139, 773–784. [Google Scholar] [CrossRef]
  33. Wang, Q.; Zhang, C.; Ren, C.; Hang, J.; Li, Y. Urban Heat Island Circulations over the Beijing-Tianjin Region under Calm and Fair Conditions. Build. Environ. 2020, 180, 107063. [Google Scholar] [CrossRef]
  34. Bounoua, L.; Zhang, P.; Mostovoy, G.; Thome, K.; Masek, J.; Imhoff, M.; Shepherd, M.; Quattrochi, D.; Santanello, J.; Silva, J.; et al. Impact of Urbanization on US Surface Climate. Environ. Res. Lett. 2015, 10, 084010. [Google Scholar] [CrossRef]
  35. Ye, Y.; Richards, D.; Lu, Y.; Song, X.; Zhuang, Y.; Zeng, W.; Zhong, T. Measuring Daily Accessed Street Greenery: A Human-Scale Approach for Informing Better Urban Planning Practices. Landsc. Urban Plan. 2019, 191, 103434. [Google Scholar] [CrossRef]
  36. Biljecki, F.; Ito, K. Street View Imagery in Urban Analytics and GIS: A Review. Landsc. Urban Plan. 2021, 215, 104217. [Google Scholar] [CrossRef]
  37. Wang, L.; Han, X.; He, J.; Jung, T. Measuring Residents’ Perceptions of City Streets to Inform Better Street Planning through Deep Learning and Space Syntax. ISPRS J. Photogramm. Remote Sens. 2022, 190, 215–230. [Google Scholar] [CrossRef]
  38. Kang, Y.; Zhang, F.; Gao, S.; Lin, H.; Liu, Y. A Review of Urban Physical Environment Sensing Using Street View Imagery in Public Health Studies. Ann. GIS 2020, 26, 261–275. [Google Scholar] [CrossRef]
  39. Goel, R.; Garcia, L.M.T.; Goodman, A.; Johnson, R.; Aldred, R.; Murugesan, M.; Brage, S.; Bhalla, K.; Woodcock, J. Estimating City-Level Travel Patterns Using Street Imagery: A Case Study of Using Google Street View in Britain. PLoS ONE 2018, 13, e0196521. [Google Scholar] [CrossRef]
  40. Biljecki, F.; Zhao, T.; Liang, X.; Hou, Y. Sensitivity of Measuring the Urban Form and Greenery Using Street-Level Imagery: A Comparative Study of Approaches and Visual Perspectives. Int. J. Appl. Earth Obs. Geoinf. 2023, 122, 103385. [Google Scholar] [CrossRef]
  41. Kang, Y.; Zhang, F.; Gao, S.; Peng, W.; Ratti, C. Human Settlement Value Assessment from a Place Perspective: Considering Human Dynamics and Perceptions in House Price Modeling. Cities 2021, 118, 103333. [Google Scholar] [CrossRef]
  42. Zhang, F. “Perception Bias”: Deciphering a Mismatch between Urban Crime and Perception of Safety. Landsc. Urban Plan. 2021, 207, 104003. [Google Scholar] [CrossRef]
  43. Zhang, Y.; Middel, A.; Turner, B.L. Evaluating the Effect of 3D Urban Form on Neighborhood Land Surface Temperature Using Google Street View and Geographically Weighted Regression. Landsc. Ecol. 2019, 34, 681–697. [Google Scholar] [CrossRef]
  44. Long, Y.; Liu, L. How Green Are the Streets? An Analysis for Central Areas of Chinese Cities Using Tencent Street View. PLoS ONE 2017, 12, e0171110. [Google Scholar] [CrossRef]
  45. Gong, F.-Y.; Zeng, Z.-C.; Zhang, F.; Li, X.; Ng, E.; Norford, L.K. Mapping Sky, Tree, and Building View Factors of Street Canyons in a High-Density Urban Environment. Build. Environ. 2018, 134, 155–167. [Google Scholar] [CrossRef]
  46. Li, B.; Xing, H.; Cao, D.; Yang, G.; Zhang, H. Exploring the Effects of Roadside Vegetation on the Urban Thermal Environment Using Street View Images. Int. J. Environ. Res. Public. Health 2022, 19, 1272. [Google Scholar] [CrossRef]
  47. Xie, M.; Wang, Y.; Fu, M.; Zhang, D. Pattern Dynamics of Thermal-Environment Effect during Urbanization: A Case Study in Shenzhen City, China. Chin. Geogr. Sci. 2013, 23, 101–112. [Google Scholar] [CrossRef]
  48. Han, X.; Wang, L.; He, J.; Jung, T. Restorative Perception of Urban Streets: Interpretation Using Deep Learning and MGWR Models. Front. Public Health 2023, 11, 1141630. [Google Scholar] [CrossRef]
  49. Han, X.; Wang, L.; Seo, S.H.; He, J.; Jung, T. Measuring Perceived Psychological Stress in Urban Built Environments Using Google Street View and Deep Learning. Front. Public Health 2022, 10, 891736. [Google Scholar] [CrossRef] [PubMed]
  50. Ma, X.; Ma, C.; Wu, C.; Xi, Y.; Yang, R.; Peng, N.; Zhang, C.; Ren, F. Measuring Human Perceptions of Streetscapes to Better Inform Urban Renewal: A Perspective of Scene Semantic Parsing. Cities 2021, 110, 103086. [Google Scholar] [CrossRef]
  51. Zhou, B.; Zhao, H.; Puig, X.; Xiao, T.; Fidler, S.; Barriuso, A.; Torralba, A. Semantic Understanding of Scenes Through the ADE20K Dataset. Int. J. Comput. Vis. 2019, 127, 302–321. [Google Scholar] [CrossRef]
  52. Badrinarayanan, V.; Kendall, A.; Cipolla, R. SegNet: A Deep Convolutional Encoder-Decoder Architecture for Image Segmentation. arXiv 2016, arXiv:1511.00561. [Google Scholar]
  53. Zhang, F.; Zhou, B.; Liu, L.; Liu, Y.; Fung, H.H.; Lin, H.; Ratti, C. Measuring Human Perceptions of a Large-Scale Urban Region Using Machine Learning. Landsc. Urban Plan. 2018, 180, 148–160. [Google Scholar] [CrossRef]
  54. Jiang, Y.; Lin, W. A Comparative Analysis of Retrieval Algorithms of Land Surface Temperature from Landsat-8 Data: A Case Study of Shanghai, China. Int. J. Environ. Res. Public. Health 2021, 18, 5659. [Google Scholar] [CrossRef]
  55. Parastatidis, D.; Mitraka, Z.; Chrysoulakis, N.; Abrams, M. Online Global Land Surface Temperature Estimation from Landsat. Remote Sens. 2017, 9, 1208. [Google Scholar] [CrossRef]
  56. Chen, L.; Lu, Y.; Ye, Y.; Xiao, Y.; Yang, L. Examining the Association between the Built Environment and Pedestrian Volume Using Street View Images. Cities 2022, 127, 103734. [Google Scholar] [CrossRef]
  57. Finley, A.O. Comparing Spatially-varying Coefficients Models for Analysis of Ecological Data with Non-stationary and Anisotropic Residual Dependence. Methods Ecol. Evol. 2011, 2, 143–154. [Google Scholar] [CrossRef]
  58. Fotheringham, A.S.; Yang, W.; Kang, W. Multiscale Geographically Weighted Regression (MGWR). Ann. Am. Assoc. Geogr. 2017, 107, 1247–1265. [Google Scholar] [CrossRef]
  59. Rizwan, A.M.; Dennis, L.Y.C.; Liu, C. A Review on the Generation, Determination and Mitigation of Urban Heat Island. J. Environ. Sci. 2008, 20, 120–128. [Google Scholar] [CrossRef]
  60. Wang, Y.; Berardi, U.; Akbari, H. Comparing the Effects of Urban Heat Island Mitigation Strategies for Toronto, Canada. Energy Build. 2016, 114, 2–19. [Google Scholar] [CrossRef]
  61. Mohajerani, A.; Bakaric, J.; Jeffrey-Bailey, T. The Urban Heat Island Effect, Its Causes, and Mitigation, with Reference to the Thermal Properties of Asphalt Concrete. J. Environ. Manag. 2017, 197, 522–538. [Google Scholar] [CrossRef]
  62. Rahman, M.A.; Moser, A.; Rötzer, T.; Pauleit, S. Comparing the Transpirational and Shading Effects of Two Contrasting Urban Tree Species. Urban Ecosyst. 2019, 22, 683–697. [Google Scholar] [CrossRef]
  63. Winbourne, J.B.; Jones, T.S.; Garvey, S.M.; Harrison, J.L.; Wang, L.; Li, D.; Templer, P.H.; Hutyra, L.R. Tree Transpiration and Urban Temperatures: Current Understanding, Implications, and Future Research Directions. BioScience 2020, 70, 576–588. [Google Scholar] [CrossRef]
  64. Bulanda-Jansen, A. Evolution of The Metropolitan Area of Shenzhen, Analysis: From Theory to Selected Examples. IOP Conf. Ser. Mater. Sci. Eng. 2019, 471, 112058. [Google Scholar] [CrossRef]
Figure 1. Research framework.
Atmosphere 15 00549 g001
Figure 2. Overview of the study area: (A) China, (B) Shenzhen, (C) Shenzhen with districts.
Atmosphere 15 00549 g002
Figure 3. Street view image collection and image semantic segmentation process.
Atmosphere 15 00549 g003
Figure 4. Spatial distribution and local spatial autocorrelation analysis of LST in Shenzhen: (A) spatial distribution of LST, (B) spatially localized autocorrelation distribution for LST.
Atmosphere 15 00549 g004
Figure 5. MGWR regression map of different built environment characteristics in Shenzhen. (A) wall, (B) building, (C) sky, (D) tree, (E) road, (F) grass, (G) sidewalk, (H) earth, (I) shrub.
Atmosphere 15 00549 g005
Table 1. Top10 Built environment elements identified following segmentation of the street view images.
NumberElementsMeanMax.Min.S.D.
1Sky0.2390.5710.0000.095
2Road0.2080.3970.0000.056
3Tree0.1940.6660.0000.109
4Building0.1410.6000.0000.110
5Sidewalk0.0380.2570.0000.027
6Shrub0.0350.3570.0000.032
7Wall0.0230.5470.0000.041
8Earth0.0170.4040.0000.028
9Grass0.0130.2600.0000.019
10Water0.0010.0260.0000.002
Note: The built environment elements in the table are sorted by mean value.
Table 2. Regression results of OLS, GWR and MGWR.
——OLS CoefficientsGWR CoefficientsMGWR Coefficients
VariablesMeanMeanMin., Max.MeanMin., Max.
Sky12.971 ***0.031(−1.698, 2.436)0.021(−0.853, 1.601)
Road17.361 ***0.083(−1.017, 1.117)0.062(−0.357, 0.676)
Tree3.230 *−0.126(−1.902, 2.173)−0.116(−1.198, 1.194)
Building17.684 ***0.128(−1.889, 2.655)0.106(−1.380, 2.637)
Sidewalk30.933 ***0.088(−0.770, 0.735)0.073(−0.268, 0.078)
Shrub5.946 **0.021(−0.805, 0.864)0.004(−0.360. 0.383)
Wall6.440 *−0.009(−1.676, 1.305)−0.009(−1.468, 0.836)
Earth5.287 *−0.077(−2.005, 3.106)−0.075(−0.975, 0.761)
Grass8.709 **0.036(−0.818, 1.933)0.032(−0.263, 0.759)
Water−5.889−0.001(−2.438, 4.998)0.011(−1.895, 1.648)
R20.2630.747
9992.3
0.830
8878.2
AICc26,999.8
Note: *** denotes significance at the 0.1% level, ** at the 1% level, and * level 5% level.
Disclaimer/Publisher’s Note: The statements, opinions and data contained in all publications are solely those of the individual author(s) and contributor(s) and not of MDPI and/or the editor(s). MDPI and/or the editor(s) disclaim responsibility for any injury to people or property resulting from any ideas, methods, instructions or products referred to in the content.

