Abstract
This study aimed to examine the spatio-temporal variations in the atmospheric boundary layer height (ABLH) over the Tarim Basin (TB). Monthly ABLH data from the ERA-Interim dataset from January 1979 to December 2018 were used. Periodicity analysis and the Mann–Kendall Abrupt Changes test were employed to identify the change cycle and abrupt change year of the boundary layer height. The Empirical Orthogonal Function (EOF) method was utilized to determine the spatial distribution of the boundary layer height, and the RF method was used to establish the relationship between the ABLH and influencing factors. The results demonstrated that the highest values of ABLH (over 1900 m) were observed in the middle parts of the study area in June, and the ABLH exhibited a significant increase over the TB throughout the study period. Abrupt changes in the ABLH were also identified in 2004, as well as in 2-, 5-, 9-, and 15-year changing cycles. The first EOF ABLH mode indicated that the middle and northeast regions are relatively high ABLH areas within the study area. Additionally, the monthly variations in ABLH show a moderately positive correlation with air temperature, while exhibiting a negative correlation with air pressure and relative humidity.
1. Introduction
Solar radiation and its daily fluctuations play a crucial role in the exchange of heat fluxes between the Earth’s surface and the atmosphere. However, these heat fluxes are primarily limited to a shallow layer near the land surface known as the atmospheric boundary layer (ABL) [1]. The ABL directly influences various factors such as water vapor, heat, and pollutants between the land surface and the free atmosphere [2,3,4,5,6], thereby impacting atmospheric and weather-scale adjustments [7,8]. Additionally, the ABL also plays a significant role in extreme climate events [9]. As the lowest part of the atmosphere, the ABL is greatly influenced by the characteristics of the land surface [10].
The thickness of the ABL, referred to as the ABLH, varies from a few meters to several kilometers [11]. It depends on factors such as atmospheric system types, surface fluxes, and land cover [12,13]. The ABLH has significant implications for air quality, as well as for various environmental issues such as heat transmission, land surface modeling, air pollution, and drought [2,3,4,9,14,15,16,17,18,19,20,21,22,23].
Previous research on ABLH has predominantly focused on calculation methods [2,4,11,24,25], influencing factors [13], and changing characteristics [26,27]. However, most studies have been limited to specific stations or short time scales. With regard to global warming, the tropopause height has shown an upward trend [28]. Therefore, it is worth investigating whether the ABLH exhibits a similar trend. In 2013, Zhang et al. [29] evaluated ABLH trends in Europe and found that daytime boundary layer heights at most stations significantly increased during all four seasons. Similarly, Zhang et al. [23] reported a significant upward trend in the average ABLH in the arid and semi-arid regions of East Asia from 1900 to 2015. Additionally, Darand et al. [30] indicated an upward trend in the ABLH over Iran.
Arid and semi-arid areas cover approximately 30% of the Earth’s surface and are highly vulnerable to the impacts of climate change. However, there is a lack of studies on the ABLH in these regions due to insufficient observational data and meteorological measurements. Therefore, the main objective of this study is to investigate the temporal and spatial variations in ABLH over the Tarim Basin, which will serve as a foundation for future studies on the impact of the ABL on climate.
2. Data
Situated in the southern region of Xinjiang in northwestern China, the Taklamakan Desert (TB) covers an area of 53 × 104 km2 [31]. As the second largest shifting desert globally, the Taklamakan Desert experiences minimal precipitation and high evapotranspiration rates. This region falls under a continental arid climate and serves as a significant source of sand–dust storms in China (Figure 1).
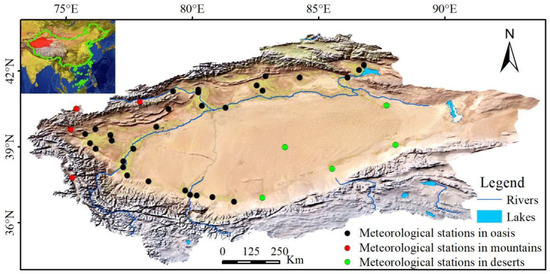
Figure 1.
The territory of the study area. Located in northwestern China, lies between Tianshan Mountain, Kunlun, and Altun Mountain. The black, green, and red circles represent stations in oases, desert, and mountainous terrain, respectively.
For this study, we utilized the ERA Interim ABLH dataset, which offers a spatial resolution of 0.125° spanning from January 1979 to December 2018. The satellite data (GLAS boundary layer height) are typically 200–400 m higher than the ERA interim over oceans, but smaller-scale and global patterns of ABL height exhibit similar characteristics [32,33]. Additionally, the ERA Interim dataset has been validated worldwide [9] when compared to observational radiosoundes. ERA Interim data have been widely applied in many academic studies and have become some of the most important data in the field of atmospheric science in the past few years. The research and validation of these data have been widely recognized, and their accuracy and reliability have been confirmed in many studies. Moreover, these data have identified that the deviation between the boundary layer height reanalysis data (ERA-interim) and the measured data is relatively small [34,35,36]. The dataset is freely available online https://www.ecmwf.int/en/forecasts/datasets/archive-datasets/reanalysis-datasets/era-interim (accessed on 5 April 2020).
To supplement our analysis, we incorporated data from 39 weather stations during the period of 1979–2018. Specifically, we utilized ground-based monthly mean air temperature (1.5 m) (Mean air TEM), maximum air temperature (Max air TEM), minimum air temperature (1.5 m ± 5 cm) (Min air EM), air pressure (1.2 m), and relative humidity (1.5 m). Figure 1 displays the locations of these weather stations. It is important to note that the meteorological data are part of the synoptic observation program and consist of two series: 8892 data points in the result part, and 59 data points in the study area part. Xinjiang Meteorological Administration provided the data, which underwent stringent quality control procedures before release.
3. Methodology
To uncover the evolutionary characteristics and influential factors of ABLH in the Tarim Basin, this study employs a range of methodologies including trend analysis, abrupt change analysis, wavelet analysis, Emperial Orthogonal Function (EOF) analysis, random forest model, and other techniques (Table 1).

Table 1.
The main research methods used in this paper.
3.1. The Linear Regression Method
Linear regression is one of the main methods used to test the changing trend and can express the changing trend of variables in a time series. The equation is as follows:
where Y is the precipitation; t is the time; a0 is the regression constant; a1 is the regression coefficient; and a1 × 10 is the changing trend rate of per decade.
3.2. Morlet Wavelet Analysis
In this study, Morlet wavelet analysis is applied to display the periodic change of ABLH; it results in a number of wavelet coefficients. The corresponding wavelet family involves sub-wavelets that are generated from the basic wavelet function ψ(t) shown as follows [37]:
where ψa,b (t) is the sub-wavelet, and parameters a and b denote the scale factor and the horizontal shift, respectively.
For any function f (t) ∈ L2 (R), its WT is expressed as:
where Wf (a,b) is wavelet coefficient. According to the wavelet coefficient, the wavelet variance is computed according to the following Equation (4).
Wavelet analysis decomposed the signal series on a time scale, and the time–frequency field change can be clearly observed and distinguished.
3.3. Mann–Kendall Test of Abrupt Changes
In this study, the time series data were assumed to be steady and independent. Variables (i.e., X = {x1, x2, …, xn}) shows no change because of the null hypothesis predicting no trends in the data. For data point xi, ni is calculated by the number of data points that exceed xi. The Mann–Kendall statistic ni is calculated as [38]:
The standard value of dk is computed by:
Given that u(d1) = 0, all u(dk) will result in a curve, UF. A retrograde u(dk) is expressed in Equation (8).
Given that u(d1) = 0, all u(dk) will establish a curve, UB. The intersection points of UF and UB are located between the confidence lines when abrupt climate change occurs.
3.4. EOF Method
The EOF method is used to calculate orthogonal functions, representing spatio-temporal components. Each component may represent a changing characteristic of the variable [39]. The EOF method provides the spatio-temporal change patterns of the variable [40].
3.5. Random Forest Model
The random forest (RF) model is capable of processing diverse data and can be effectively applied in data collection. RF selection can be utilized to identify the most significant variables for regression by selecting a reduced set of partition variables, and its output represents the average value derived from all decision-making trees. The RF model employs multivariate sorting to determine the variables and provide insights into their relative importance [41]. In this study, ABLH served as the dependent variable.
4. Results
4.1. Long-Term Mean of ABLH
In winter, the lowest ABLH was observed in January and December with a value of 100 m in the southwestern mountain area of the TB. In February, with the increase in air temperature, the ABLH increased by 200 m in comparison to January. In March, an ABLH of 1800 m was observed in the southeast and central area due to high levels of air dryness. As the air temperature gradually rose in spring, the ABLH increased, with the lowest value (400 m) observed in the north, northwest, and west part of the TB, mainly in mountain areas, indicating a major role of high latitude. The spatial distribution of ABLH in May is similar to that in April, but the value has increased. The highest value (1700 m) was observed in May in the central part of the basin, which is mainly influenced by low altitude, desert climates, low moisture, and high air temperature.
In June, the ABLH reached over 1900 m due to changes in air temperature, but it significantly decreased in September. In October, the ABLH was above 1000 m. The ABLH in the center of the desert decreased by 1400 m in comparison to its peak height of 1900 m, resulting in a decline of 500 m. This downward trend continued in November and December. In November, the decrease in ABLH was particularly rapid, with ABLH values less than 200 m in most regions except for a small area. The lowest ABLH was observed in December over the entire area, with a value of less than 100 m.
The minimum ABLH (600 m) is observed in the southwest and northwestern parts of the TB, which were influenced by high latitude and high humidity. Meanwhile, the highest ABLH value (1000 m) was observed in the center of the desert, attributed to high air temperature and the absence of vegetation. The ABLH gradually decreased from the center to the surrounding areas of the basin, influenced by terrain and temperature (Figure 2).
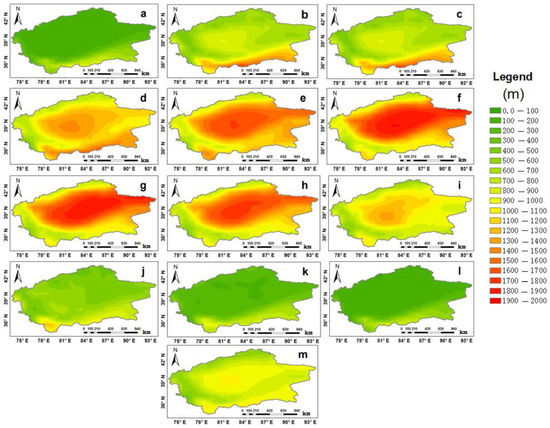
Figure 2.
The long-term annual mean of ABLH for (a) January, (b) February, (c) March, (d) April, (e) May, (f) June, (g) July, (h) August, (i) September, (j) October, (k) November, (l) December, and (m) annually.
4.2. Trends in ABLH
The trend analysis of the Atmospheric Boundary Layer Height (ABLH) data from ECMWF for the period 1979–2018 revealed both upward and downward trends, represented by the colors red, yellow, and green. Figure 3 illustrates the monthly trends of ABLH in the Tarim Basin. In January, the annual ABLH tendency rate ranged from −30 to 60 m/10 a. The lowest value of −30 m/10 a was observed in the eastern and southeastern parts of the basin, while the highest value of 60 m/10 a was observed in the eastern and southwestern parts. Most areas in the basin showed an upward trend, with a tendency rate of approximately 10 m/10 a. In February, the annual ABLH tendency rate ranged from −50 to 50 m/10 a. The lowest value of −50 m/10 a was observed in the southern part of the basin, while the highest value of 50 m/10 a was observed in the southwestern part. Similar to January, most areas showed an upward trend. In March, the annual ABLH tendency rate ranged from −110 to 70 m/10 a. The lowest value of −110 m/10 a was observed in the southern part, mainly in mountainous areas, while the highest value of 70 m/10 a was observed in the western part. Significant high-value centers were found in the south, southwest, and west, indicating an upward trend in most areas. For April, the ABLH tendency rate ranged from −10 to 130 m/10 a. The lowest value of −10 m/10 a was observed in the northern and northeastern parts of the basin, while the highest value of 130 m/10 a was observed in the southern part. Significant high-value centers were present in the west, with a low-value center in the east of the desert. Most parts of the study area showed an upward trend in ABLH. In May, the ABLH tendency rate ranged from −30 to 70 m/10 a. The lowest value of −30 m/10 a was observed in the northern, eastern, and western parts of the basin, while the highest value of 70 m/10 a was observed in the southern part. Significant low-value centers were found in the east, west, and north, with a high-value center in the south of the desert. The height of the boundary layer showed an increasing trend in most parts of the study area. In June, the ABLH tendency rate ranged from −30 to 60 m/10 a. The lowest value of −30 m/10 a was observed in the eastern and southwestern parts of the basin, while the highest value of 60 m/10 a was observed in the northeastern and southeastern parts. There was a dominant upward trend in the height of the boundary layer, while the surrounding mountains showed a downward trend. In July, the ABLH tendency rate ranged from −30 to 100 m/10 a. The lowest value of −30 m/10 a was observed in the surrounding mountains of the basin, while the highest value of 100 m/10 a was observed in the northeastern and central parts of the desert. There is an evident zonal distribution from the center of the desert to the surrounding regions.
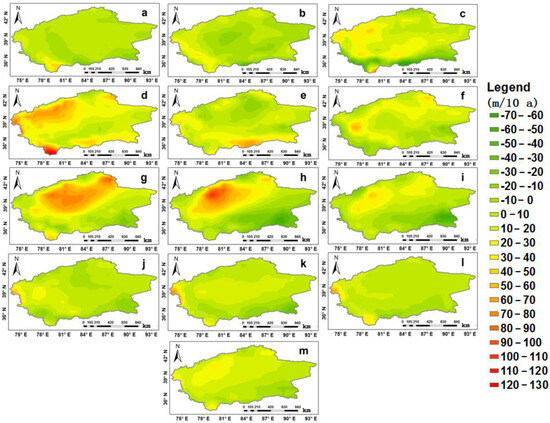
Figure 3.
The trends of ABLH for (a) January, (b) February, (c) March, (d) April, (e) May, (f) Jun, (g) July, (h) August, (i) September, (j) October, (k) November, (l) December, and (m) annually.
The plain areas were dominated by an upward trend in ABLH, whereas the surrounding mountains showed a downward trend. In August, the ABLH tendency rate ranged from −60 to 110 m/10 a; the lowest value of −60 m/10 a was observed in the eastern part of the basin, while the highest value of 110 m/10 a was observed in the western part. There is an obvious zonal distribution from the low and high-value centers to the surrounding regions. The eastern and southeastern parts of the basin demonstrated a significant downward trend, while the western and southwestern parts showed a noticeable upward trend. The zonal distribution of either an upward or downward trend is highly pronounced. In September, the ABLH tendency rate ranged from −70 to 50 m/10 a. The lowest value of −50 m/10 a was observed in the eastern part of the basin, while the highest value of 50 m/10 a was observed in the northern and western parts. There is an evident zonal distribution and two high-value centers. The north and northwest parts of the basin exhibited a significant upward trend, while the east and southeast showed a distinct downward trend. The zonal distribution of either an increasing or decreasing trend is highly apparent. In October, the ABLH tendency rate ranged from −30 to 70 m/10 a. The lowest value of −30 m/10 a was observed in the eastern, southeastern, and southern parts of the basin, while the highest value of 70 m/10 a was observed in the southwestern part. The zonal distribution is not very pronounced. Most regions in the basin were dominated by ABLH tendency rates of 10 m/10 a and 20 m/10 a, with no clear zonal distribution. In November, the ABLH tendency rate ranged from −40 to 80 m/10 a. The lowest value of −40 m/10 a was observed in the eastern part of the basin, while the highest value of 80 m/10 a was observed in the southwestern part. There was a zonal distribution, but it is not very evident. Most regions in the basin were dominated by ABLH tendency rates of 10 m/10 a and 20 m/10 a. In December, the ABLH tendency rate ranged from −20 to 70 m/10 a. The lowest value of −20 m/10 a was observed in the southern part of the basin, while the highest value of 70 m/10 a was observed in the southwestern part. Most regions in the basin were dominated by an ABLH tendency rate of 20 m/10 a.
The ABLH tendency rate (Figure 3m) ranges from −20 to 40 m/10 a. The lowest value of −20 m/10 a was observed in the eastern part of the basin, while the highest value of 40 m/10 a was observed in the western part. Most regions of the basin were dominated by ABLH tendency rates of 10 m/10 a and 20 m /10 a. The increasing trend was dominant in most regions, displaying evident zonal distribution. Figure 4 depicts the annual average time series of ABLH during the period of 1979–2018, showing an upward trend with an increase of approximately 30 m per decade.
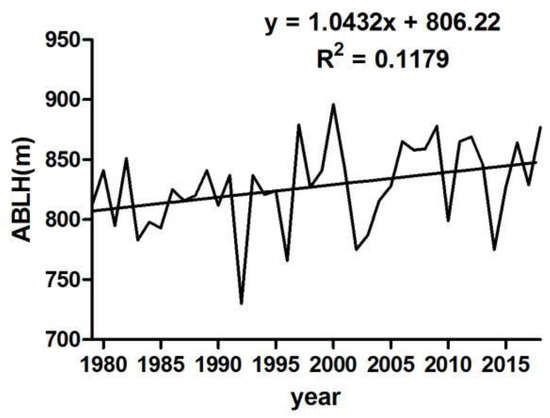
Figure 4.
Annual area-averaged time series of ABLH.
4.3. Periodicity Analysis and the Mann–Kendall Abrupt Changes Test
Wavelet analysis was employed to detect periodic changes in ABLH. Figure 5 illustrates the wavelet variances of ABLH from 1979 to 2018. In this plot, a positive real part corresponds to the annual average ABLH during a high (increasing) period, while a negative real part indicates that the annual average ABLH belongs to a low (decreasing) period. Figure 5 shows a real-line contour plot of the Morlet wavelet coefficient of the annual average ABLH in the Tarim basin. It reveals four main cycles of ABLH: 2-, 5-, 9-, and 15-year cycles. Among these cycles, the time scale of approximately 15 years corresponds to the most significant variance-extreme value, followed by 9 and 5 years. The annual changes of about 2 years are too rapid and relatively insignificant.
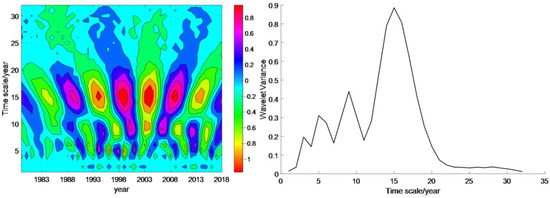
Figure 5.
Distribution of wavelet frequency and wavelet variance of ABLH.
The periodic oscillations with a characteristic time scale of 2 years have undergone alternating changes over 13 periods. These oscillations were weak during 1979–1990 and 2004–2008, while they were more pronounced from 1991 to 2003 and from 2009 to 2016. They consist of seven periods with a negative real part center (decreasing) and 6 periods with a positive real part center (increasing). On the other hand, the periodic oscillations with a characteristic time scale of 5 years have undergone alternating changes over 21 periods. These oscillations were weak during 1979–1990, but became more evident from 1990 to 2018. The study reveals the presence of 11 consecutive periods characterized by negative real part center (decreasing) and 11 consecutive periods with positive real part center (increasing). The periods showing a decreasing trend are 1981–1982, 1984–1985, 1988–1990, 1992 −1993, 2002–2003, 2006–2008, 2010–2011, and 2014–2015. Conversely, the periods exhibiting an increasing trend are 1982–1983, 1986–1987, 1990–1991, 1994–1995, 1997–1998, 2000–2001, 2004–2005, and 2012–2013. The presence of any clear cycles in the remaining periods is not apparent. The periodic oscillations, with a characteristic time scale of 9 years, have experienced alternating changes over 14 periods. The periodic oscillation was weak during 1979–1989 and it was more obvious from 1989 to 2018. The oscillation pattern observed in this study exhibits a characteristic time scale of 15 years, with alternating changes occurring over nine periods. Among these cycles, the periodic oscillation is most prominent and displays a relatively stable and intense pattern. Specifically, there are seven periods characterized by a negative real part center (decreasing), and seven periods characterized by a positive real part center (increasing). The decreasing periods span from 1979 to 1981, 1987 to 1991, 2001 to 2007, and 2011 to 2016. On the other hand, the increasing periods occur from 1981 to 1983, 1987 to 1990, 1997 to 2001, 2007 to 2011, and 2017 to 2018.
The M-K abrupt change method was utilized to demonstrate the abrupt change year in ABLH within the study area. Figure 6 illustrates the year of abrupt change as tested by the M-K method. The findings indicate that an abrupt change was observed in 2004. The factors contributing to the abrupt changes in ABLH in this specific study area remain unknown, necessitating further investigations into the interplay between land use and the spatial distribution of air temperature in order to address this unresolved issue.
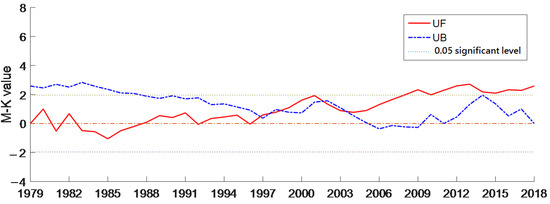
Figure 6.
Annual average BLH Mann–Kendall abrupt change test from 1979 to 2018.
4.4. EOF Analysis of ABLH
The analysis of Empirical Orthogonal Function (EOF) modes revealed that the first four modes accounted for 42.3%, 15.6%, 10.9%, and 5.7% of the total variation in the ABLH data, respectively, explaining a combined variability of 74.5% (Figure 7). The spatial pattern of the first EOF mode of ABLH was primarily observed in the northeast part of the region, indicating similar changes in the southwest and northeast areas of the basin. This distribution suggests that the ABLH is relatively low in the southwest and relatively high in the northeast, which may be influenced by air temperature and terrain.
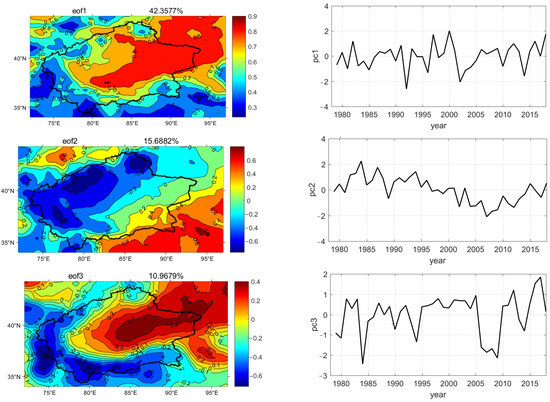

Figure 7.
Spatial patterns and temporal amplitudes of EOF modes for air temperature time series (°C).
Furthermore, the time series analysis revealed an upward trend since 2003, with intermittent positive amplitudes in several years. The most significant changes occurred during the period 1995–2000, while the weakest changes were observed in 1992. This indicates a rapid downward trend in ABLH from 2002 to 2009, with the minimum ABLH recorded in 1992.
The second EOF mode explains 15.6% of the total variance, representing another important spatial distribution of boundary layer changes. Positive loadings were primarily observed in the eastern portion of the study area, while the weakest loadings were found in the northeast and west. Prior to 2000, the loadings were mostly positive, but turned negative after 2000. Notably, the highest value was observed in 1984, whereas the lowest value was recorded in 2006.
The third mode accounted for 10.9% of the total change, with the strongest positive loadings observed in the center of the desert and negative loadings in the surrounding regions of the Taklamakan Desert. The strongest negative value was recorded in 1984, while the strongest positive value was observed in 2012.
Similarly, the fourth mode explained 5.77% of the total change, with positive loadings in the southwest and negative loadings in the northeast. The strongest negative value was seen in 1992, while the most positive value was recorded in 2002.
In summary, the modal distribution of ABLH values indicates higher values in the northeast and lower values in the southwest, with high-value centers primarily situated in the northeast of the basin and the middle of the desert. This spatial pattern corresponds to the distribution of air temperature and land surface temperature, with the northeast regions of the basin characterized by lower average air temperatures and corresponding lower boundary layer heights in mountainous areas [42].
4.5. Relation between ABLH and Meteorological Factors
The movement of air within the atmospheric boundary layer (ABL) is heavily influenced by ground friction and primarily depends on the thermal and dynamic effects of the ground surface. The variation in thickness of this layer is related to the speed of the outer airflow, its own meteorological conditions, and underlying surface conditions such as terrain, topography, buildings, and vegetation. Changes in land–atmosphere conditions can lead to changes in the ABL height (ABLH), with higher air temperatures resulting in a higher ABLH [30]. Latitude, solar radiation, topography, and underlying surface type are the major factors affecting the ABLH. We applied five indicators (i.e., mean air temperature, maximum air temperature, minimum air temperature, air pressure, relative humidity) to study the principal factors influencing changes in ABLH. The RF model was employed to quantitatively analyze the selected indicators, and the results are shown in Figure 8a.
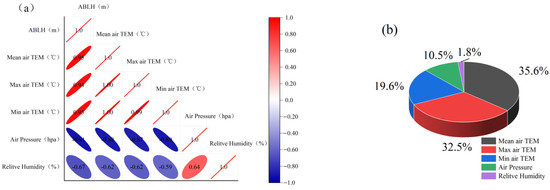
Figure 8.
(a) Random forest (RF) model simulation of ABLH and (b) correlation between FD and influencing factors in the Northern Xinjiang (NX).
Air temperature is the most fundamental and direct factor in meteorological conditions that affect the ABLH. High air temperatures increase the heat capacity of the atmosphere, leading to an increase in the ABL and subsequently increasing the ABLH. During the day, the ground is heated by solar radiation, causing an increase in ground temperature. This results in hot air rising and a strong convective motion. In this case, the boundary layer often exhibits characteristics such as decreasing temperature, increasing wind speed, and decreasing humidity. Conversely, at night, the ground releases heat, causing the temperature to gradually decrease, and the air no longer produces convective motion. As a result, the boundary layer begins to stabilize, exhibiting characteristics such as increasing temperature, decreasing wind speed, and increasing humidity. This phenomenon is commonly known as the nighttime stable layer. The correlation coefficients of mean, maximum, and minimum air temperatures were high, at 0.95, 0.94, and 0.95, respectively, with significant positive correlations.
The air pressure and atmospheric composition also have a certain impact on the structure of the boundary layer. Changes in air pressure affect the pressure gradient force, gravity, and inertia force of the air, thereby altering the flow field and temperature field. Humidity is another important factor affecting the structure of the boundary layer. Changes in humidity can affect its stability, as well as heat and water vapor exchange within the boundary layer, and chemical reaction processes in the atmosphere. Under humid conditions, water vapor enhances the condensation and precipitation processes in the atmosphere, thus affecting the vertical distribution and dynamic characteristics of the boundary layer. The correlation coefficients of air pressure and relative humidity with ABLH were 0.91 and 0.67, respectively, exhibiting a noticeable negative correlation.
Furthermore, wind speed, precipitation, and altitude also greatly affect the evolution of ABLH. Due to ground friction, wind speed near the surface gradually decreases, forming a wind speed gradient layer. This phenomenon is often observed as varied wind speeds at different heights, such as kites experiencing stronger wind speeds at higher altitudes. Within the boundary layer, the vertical gradient of wind speed is also important, with the magnitude of this gradient determining the dynamic characteristics and degree of mixing. Precipitation significantly impacts the height of the boundary layer, with increased rainfall intensity causing a decrease in boundary layer height. The development history and height of the stable boundary layer are also related to altitude. In high-altitude areas, the stable boundary layer has a longer development history and higher height compared to low-altitude areas.
There is a certain correlation between the ABLH and atmospheric pollution. Local accumulation of atmospheric pollutants under conditions of weak wind speed, low boundary layer height, and low ventilation can easily cause moderate to severe pollution. Air pollution usually has a reducing effect on the height of the boundary layer. Continuous pollution emissions can lead to an increase in the concentration of pollutants in the atmosphere, causing a decrease in the heat and water vapor released within the boundary layer, thereby making the boundary layer more stable and reducing its height. In addition, certain pollutants may affect the thermal characteristics and radiation balance of the atmosphere, leading to changes in the temperature distribution and height of the boundary layer, which usually results in a decrease in the height of the boundary layer. Therefore, atmospheric pollution usually reduces the height of the boundary layer [43].
5. Conclusions and Discussion
This study examined the spatio-temporal distribution and influencing factors of the atmospheric boundary layer height (ABLH) in the Tarim Basin from January 1979 to December 2018. The results showed that the ABLH was higher (over 1900 m) in the middle parts of the study area in June, which was associated with higher air temperatures. The ABLH demonstrated a significant increasing trend across different seasons, which was consistent with the findings of Zhang et al. [18] in Europe and those of Mohammad et al. [30] in Iran.
The analysis also revealed that the highest upward trend rates of ABLH (120–130 m/decade) occurred in August over the western part of the basin, while the surrounding mountain regions experienced a downward trend. Overall, the annual ABLH exhibited a downward trend in most parts of the region, with the highest upward trend rate being approximately 30–40 m per decade.
Furthermore, the Morlet wavelet analysis identified four main cycles of the annual ABLH: 2, 5, 9, and 15 years. Among these cycles, the time scale of approximately 15 years corresponded to the most significant variance extreme value, followed by 9 and 5 years. The annual changes of about 2 years were comparatively fast and relatively insignificant. The M-K method also detected an abrupt change in the ABLH in 2004.
The first four Empirical Orthogonal Function (EOF) modes of ABLH explained approximately 74.5% of the total variance. Specifically, the first EOF mode indicated that the middle and northeast regions of the study area were characterized by a relatively high ABLH.
This correlation analysis showed that between the ABLH and mean, maximum, and minimum air temperature in the Tarim Basin demonstrated positive correlations, with correlation coefficients of 0.95, 0.94, and 0.95, respectively. Conversely, air pressure and relative humidity exhibited negative correlations, with correlation coefficients of 0.91 and 0.67, respectively. These findings are consistent with previous studies conducted in Europe [19], China [21,24], East Asia, and North Africa, which reported the sensitivity of ABLH to air temperature [23].
Author Contributions
A.S.: Data curation, Formal analysis, Investigation, Methodology, Software, Visualization, Writing—original draft. Q.H.: Conceptualization, Project administration, Supervision. A.A.: Methodology, Software, Writing—review and editing. T.W.: Data curation, Validation, Writing—review and editing. J.Z.: Project administration, Resources, Writing—review and editing. W.J.: Project administration, Resources, Writing—review and editing. J.L.: Project administration, Resources, Writing—review and editing. All authors have read and agreed to the published version of the manuscript.
Funding
This work was supported by the National Natural Science Foundation of China (Grant no. 42230608) and Tianshan Talent Project: 2023TSYCJC0068.
Institutional Review Board Statement
Not applicable.
Informed Consent Statement
Not applicable.
Data Availability Statement
Data are contained within the article.
Acknowledgments
We would like to thank the Xinjiang Meteorological Administration (XMA) for providing the meteorological data.
Conflicts of Interest
The authors declare that they have no known competing financial interests or personal relationships that could have appeared to influence the work reported in this paper.
References
- Stull, R.B. Meteorology for Scientists and Engineers, 2nd ed.; Brooks/Cole/Thomson: Pacific Grove, CA, USA, 2000; 502p. [Google Scholar]
- Couvreux, F.; Guichard, F.; Austin, P.H.; Chen, F. Nature of the Mesoscale Boundary Layer Height and Water Vapor Variability Observed 14 June 2002 during the IHOP_2002 Campaign. Mon. Weather Rev. 2009, 137, 414–432. [Google Scholar] [CrossRef]
- Schmid, P.; Niyogi, D. A method for estimating planetary boundary layer heights and its application over the ARM Southern Great Plains Site. J. Atmos. Ocean. Technol. 2012, 29, 316–322. [Google Scholar] [CrossRef]
- Compton, J.C.; Delgado, R.; Berkoff, T.A.; Hoff, R.M. Determination of Planetary Boundary Layer Height on Short Spatial and Temporal Scales: A Demonstration of the Covariance Wavelet Transform in Ground-Based Wind Profiler and Lidar Measurements. J. Atmos. Ocean. Technol. 2013, 30, 1566–1575. [Google Scholar] [CrossRef]
- Feng, X.; Wu, B.; Yan, N. Amethod for deriving the boundary layer mixing height from MODIS atmospheric profile data. Atmosphere 2015, 6, 1346–1361. [Google Scholar] [CrossRef]
- Yang, Y.H.; Liu, C.H.; Jimy, D. Evaluation of two typical PBL parameterization schemes based on large-eddy simulation result. Plateau Meteorol. 2016, 35, 17–180. [Google Scholar] [CrossRef]
- McGrath-Spangler, E.L. The impact of a boundary layer height formulation on the GEOS-5 model climate. J. Geophys. Res. Atmos. 2016, 121, 3263–3275. [Google Scholar] [CrossRef]
- Ma, L.M.; Bao, X.W. Parametrization of planetary boundary-layer height with helicity and verification with tropical cyclone prediction. Bound.-Layer Meteorol. 2016, 160, 569–593. [Google Scholar] [CrossRef]
- Von, E.A.; Teixeira, J. A planetary boundary layer height climatology derived from ECMWF reanalysis data. J. Clim. 2013, 26, 6575–6590. [Google Scholar]
- Garratt, J. Review: The atmospheric boundary layer. Earth Sci. Rev. 1664, 37, 89–134. [Google Scholar] [CrossRef]
- Molod, A.; Salmun, H.; Dempsey, M. Estimating Planetary Boundary Layer Heights from NOAA Profiler Network Wind Profiler Data. J. Atmos. Ocean. Technol. 2015, 32, 1545–1561. [Google Scholar] [CrossRef]
- Liu, S.; Liang, X.-Z. Observed Diurnal Cycle Climatology of Planetary Boundary Layer Height. J. Clim. 2010, 23, 5790–5807. [Google Scholar] [CrossRef]
- Leventidou, E.; Zanis, P.; Balis, D.; Giannakaki, E.; Pytharoulis, I.; Amiridis, V. Factors affecting the comparisons of planetary boundary layer height retrievals from CALIP-SO, ECMWF and radiosondes over Thessaloniki, Greece. Atmos. Environ. 2013, 74, 360–366. [Google Scholar] [CrossRef]
- Marsik, F.J.; Fischer, K.W.; McDonald, T.D.; Samson, P.J. Comparison of Methods for Estimating Mixing Height Used during the 1992 Atlanta Field Intensive. J. Appl. Meteorol. 1995, 34, 1802–1814. [Google Scholar] [CrossRef]
- Basha, G.; Ratnam, M.V. Identification of atmospheric boundary layer height over a tropical station using high-resolution radiosonde refractivity profiles: Comparison with GPS radio occultation measurements. J. Geophys. Res. 2009, 114, D16101. [Google Scholar] [CrossRef]
- Wang, X.Y.; Wang, K.C. Estimation of atmospheric mixing layer height from radiosonde data. Atmos. Meas. Tech. 2014, 7, 1701–1709. [Google Scholar] [CrossRef]
- Dai, C.; Wang, Q.; Kalogiros, J.A.; Lenschow, D.H.; Gao, Z.; Zhou, M. Determining Boundary-Layer Height from Aircraft Measurements. Bound.-Layer Meteorol. 2014, 152, 277–302. [Google Scholar] [CrossRef]
- Zhang, Y.; Gao, Z.; Li, D.; Li, Y.; Zhang, N.; Zhao, X.; Chen, J. On the computation of planetary boundary-layer height using the bulk Richardson number method. Geosci. Model Dev. 2014, 7, 2599–2611. [Google Scholar] [CrossRef]
- Coen, M.C.; Praz, C.; Haefele, A.; Ruffieux, D.; Kaufmann, P.; Calpini, B. Determination and climatology of the planetary boundary layer height above the Swiss plateau by in situ and remote sensing measurements as well as by the COSMO-2 model. Atmos. Meas. Tech. 2014, 14, 13205–13221. [Google Scholar]
- Guo, J.; Miao, Y.; Zhang, Y.; Liu, H.; Li, Z.; Zhang, W.; He, J.; Lou, M.; Yan, Y.; Bian, L.; et al. The climatology of planetary boundary layer height in China derived from radiosonde and reanalysis data. Atmos. Chem. Phys. 2016, 16, 13309–13319. [Google Scholar] [CrossRef]
- Seibert, P.; Beyrich, F.; Gryning, S.-E.; Joffre, S.; Rasmussen, A.; Tercier, P. Review and intercomparison of operational methods for the determination of the mixing height. Atmos. Environ. 2000, 34, 1001–1027. [Google Scholar] [CrossRef]
- Seinfeld, J.H.; Pandis, S.N. Atmospheric Chemistry and Physics: From Air Pollution to Climate Change, 2nd ed.; Wiley Blackwell: Hoboken, NJ, USA, 2006; 1152p. [Google Scholar]
- Zang, Z.; Wang, W.; Cheng, X.; Yang, B.; Pan, X.; You, W. Effects of boundary layer height on the model of ground-level PM2.5 concentrations from AOD: Comparison of stable and convective boundary layer heights from different methods. Atmosphere 2017, 8, 104. [Google Scholar] [CrossRef]
- Seidel, D.J.; Ao, C.O.; Li, K. Estimating climatological planetary boundary layer heights from radiosonde observations: Comparison of methods and uncertainty analysis. J. Geophys. Res. Atmos. 2010, 115, D16113. [Google Scholar] [CrossRef]
- Bachour, D.; Perez-Astudillo, D. Boundary layer height measurements over Doha using Lidar. Energy Procedia 2014, 57, 1086–1091. [Google Scholar] [CrossRef][Green Version]
- Sawyer, V.; Li, Z. Detection, variations andintercomparison of the planetary boundary layer depth from radiosonde, lidar and infrared spectrometer. Atmos. Environ. 2013, 79, 518–528. [Google Scholar] [CrossRef]
- Patil, M.N.; Patil, S.D.; Waghmare, R.T. Planetary boundary layer height over the Indian subcontinent during extreme monsoon years. J. Atmos. Solar-Terr. Phys. 2013, 92, 94–99. [Google Scholar] [CrossRef]
- Randel, W.J.; Wu, F.; Gaffen, D.J. Interannual variability of the tropical tropopause derived from radiosonde data and NCEP reanalyses. J. Geophys. Res. 2000, 105, 15509–15523. [Google Scholar] [CrossRef]
- Zhang, Y.; Seidel, D.J.; Zhang, S. Trends in planetary boundary layer height over Europe. J. Clim. 2013, 26, 10071–10076. [Google Scholar] [CrossRef]
- Darand, M.; Zandkarimi, F. Identification of atmospheric boundary layer height and trends over Iran using high-resolution ECMWF reanalysis dataset. Theor. Appl. Climatol. 2019, 137, 1457–1465. [Google Scholar] [CrossRef]
- Hao, X.; Li, W. Oasis cold island effect and its influence on air temperature: A case study of Tarim Basin, Northwest China. J. Arid Land 2016, 8, 172–183. [Google Scholar] [CrossRef]
- Liu, J.; Huang, J.; Chen, B.; Zhou, T.; Yan, H.; Jin, H.; Huang, Z.; Zhang, B. Comparisons of PBL heights derived from CALIPSO and ECMWF reanalysis data over China. J. Quant. Spectrosc. Radiat. Transf. 2015, 153, 102–112. [Google Scholar] [CrossRef]
- Palm, S.P.; Benedetti, A.; Spinhirne, J. Validation of ECMWF global forecast model parameters using GLAS atmospheric channel measurements. Geophys. Res. Lett. 2005, 32, L22S09. [Google Scholar] [CrossRef]
- Dee, D.P.; Uppala, S.M.; Simmons, A.J.; Berrisford, P.; Poli, P.; Kobayashi, S.; Andrae, U.; Balmaseda, M.A.; Balsamo, G.; Bauer, P.; et al. The ERA-Interim reanalysis: Configuration and performance of the data assimilation system. Q. J. R. Meteorol. Soc. 2011, 137, 553–597. [Google Scholar] [CrossRef]
- Hersbach, H.; Bell, B.; Berrisford, P. ERA5 Monthly Averaged Data on Pressure Levels from 1979 to Present; ECMWF: Reading, UK, 2018. [Google Scholar]
- Poli, P.; Hersbach, H.; Tan, D.; Dee, D.; Thépaut, J.-N.; Simmons, A.; Peubey, C.; Laloyaux, P.; Komori, T.; Berrisford, P.; et al. The Data Assimilation System and Initial Performance Evaluation of the ECMWF Pilot Reanalysis of the 20th Century Assimilating Observations up to 2010. J. Clim. 2016, 29, 6851–6872. [Google Scholar]
- Hu, C.; Xu, Y.; Han, L.; Yang, L.; Xu, G. Long-term trends in daily precipitation over the yangtze river delta region during 1960–2012, eastern china. Theor. Appl. Climatol. 2016, 125, 131–147. [Google Scholar] [CrossRef]
- Jones, J.R.; Schwartz, J.S.; Ellis, K.N.; Hathaway, J.M.; Jawdy, C.M. Temporal variability of precipitation in the Upper Tennessee valley. J. Hydrol. 2015, 3, 125–138. [Google Scholar] [CrossRef]
- Larson, M.; Capobianco, M.; Janses, H.; Rozynski, G.; Southgate, H.N.; Stive, M.; Wijnberg, K.M.; Hulscher, S. Analysis and modeling of field data on coastal morphological evolution over yearly and decadal time scales, Part 1: Background and linear techniques. J. Coast. Res. 2003, 19, 760–775. [Google Scholar]
- Jollife, I.T. Principal Component Analysis, 2nd ed.; Springer: New York, NY, USA, 2002. [Google Scholar] [CrossRef]
- Hong, Y.; Chen, S.; Liu, Y.; Zhang, Y.; Yu, L.; Chen, Y.; Liu, Y.; Cheng, H.; Liu, Y. Combination of fractional order derivative and memory-based learning algorithm to improve the estimation accuracy of soil organic matter by visible and near-infrared spectroscopy. Catena 2019, 174, 104–116. [Google Scholar] [CrossRef]
- Abbas, A.; He, Q.; Jin, L.; Li, J.; Salam, A.; Lu, B.; Yasheng, Y. Spatio-Temporal Changes of Land Surface Temperature and the Influencing Factors in the Tarim Basin, Northwest China. Remote Sens. 2021, 13, 3792. [Google Scholar] [CrossRef]
- Jia, J.; Yang, P.Q.; Jiang, H.M. Analysis of the variation characteristics of daily maximum boundary layer height in Urumqi and its relationship with air quality. J. Meteorol. Environ. 2019, 35, 6. [Google Scholar]
Disclaimer/Publisher’s Note: The statements, opinions and data contained in all publications are solely those of the individual author(s) and contributor(s) and not of MDPI and/or the editor(s). MDPI and/or the editor(s) disclaim responsibility for any injury to people or property resulting from any ideas, methods, instructions or products referred to in the content. |
© 2024 by the authors. Licensee MDPI, Basel, Switzerland. This article is an open access article distributed under the terms and conditions of the Creative Commons Attribution (CC BY) license (https://creativecommons.org/licenses/by/4.0/).