Article

Simulation Performance of Temperature and Precipitation in the Yangtze River by Different Cumulus and Land Surface Schemes in RegCM4

1
School of Water Conservancy and Transportation, Zhengzhou University, Zhengzhou 450001, China
2
Department of the Aviation Manufacturing, Shanghai Civil Aviation College, Shanghai 200232, China
3
State Key Laboratory of Simulation and Regulation of Water Cycle in River Basin, China Institute of Water Resources and Hydropower Research, Beijing 100038, China
4
School of Civil and Hydraulic Engineering, Ningxia University, Yinchuan 750021, China
5
College of Hydrology and Water Resources, Hohai University, Nanjing 210098, China
*
Author to whom correspondence should be addressed.
Atmosphere 2024, 15(3), 334; https://doi.org/10.3390/atmos15030334
Submission received: 17 January 2024 / Revised: 17 February 2024 / Accepted: 29 February 2024 / Published: 8 March 2024
(This article belongs to the Section Climatology)

Abstract

:
To improve the simulation performance of the RegCM4 model in climate simulations over the Yangtze River Basin (YRB), it is essential to determine the optimal cumulus convection and land surface process schemes from the numerous physical parameterization options within RegCM4. In this study, we selected five cumulus convection schemes (Kuo, Grell, Emanuel, Tiedtke, and Kain–Fritsch) and three land surface process schemes (BATS, CLM3.5, and CLM4.5) to configure 72 mixed schemes. Four years of short-term simulations (1990–1993) with a horizontal resolution of 50 km were conducted using ERA-Interim as the initial and boundary conditions for the 72 schemes. The climate simulation performance of all schemes in the YRB was comprehensively evaluated using a multi-criteria scoring approach. The results indicate that among the selected cumulus convection schemes, the Kain–Fritsch scheme, applied to both ocean and land, demonstrates optimal performance in simulating precipitation over the YRB, with spatial correlation coefficients between simulated and observed annual precipitation around 0.3. Compared to the Community Land Models (CLM3.5 and CLM4.5), BATS exhibits superior capabilities in reproducing the temperature features of the region, with spatial correlation coefficients between simulated and observed values typically exceeding 0.99 and standard deviations within 1.25 °C. Under the optimal KF scheme, the simulated soil moisture in the YRB using CLMs is notably drier, ranging from −7.79 to −8.39 kg/m2, compared to that achieved with BATS. The findings provide a localized reference for the parameterization schemes of RegCM4 in the YRB.

1. Introduction

The efficacy of regional climate models (RCMs) exhibits significant variability across different study regions and seasons, posing a formidable challenge in the quest for a universally applicable physical parameterization scheme. Compounding this complexity, these parameterization schemes are often tailored to specific climate conditions and resolutions, resulting in divergent performances across simulation regions [1]. Recognizing this inherent variability, it becomes imperative to discern the most suitable parameterization schemes tailored to the unique characteristics of a given study area, thereby optimizing the overall model performance. In diverse geographical contexts such as East Asia [2], Southeast Asia [3,4], South Africa [5,6], and South America [7], a plethora of sensitivity tests have been undertaken on physical parameters to discern optimal schemes. Noteworthy research efforts in these regions have gone beyond mere identification. Enhancing the simulation performance of RCMs involves deliberately introducing or modifying parameters within the existing physical schemes [8,9].
Many research endeavors have underscored the influence of the cumulus convection parameterization scheme, surpassing the impact of alternative schemes, on the simulation performance of RegCM [10,11]. This body of evidence not only highlights the paramount importance of scrutinizing the cumulus convection parameterization scheme but also emphasizes its pivotal role in shaping the overall efficacy of RegCM’s simulation outcomes. Further exploration into the nuanced interactions and intricacies of the cumulus convection parameterization scheme is imperative to unravel the complexities of regional climate simulations. Within the Chinese monsoon area, different cumulus convection parameterization schemes exhibit diverse effects on model performance [12]. Notably, Gao et al. [13] conducted a comparative analysis of diverse cumulus convection schemes (CSs) within significant river basins in China, revealing the superior performance of the Emanuel scheme. While acknowledging the significant influence of cumulus convection schemes on precipitation, it is crucial to recognize the importance of land surface process schemes (LSPs) in shaping precipitation outcomes. In East Asia, studies by Kang et al. [14] and Li et al. [15] compared simulations utilizing the Emanuel convection scheme in RegCM with BATS [16] and CLM3 [17]. Their findings underscored that the BATS scheme exhibits a higher wet bias in summer precipitation than the CLM scheme.
Research in China has extensively examined the RegCM physical parameterization scheme, particularly in the context of case studies. However, prior investigations have predominantly centered around East Asia or the entirety of China, neglecting a more nuanced exploration of sub-regions. In particular, the Yangtze River Basin (YRB) stands out due to its pronounced variations in precipitation and temperature. These variations occur across different spatial and temporal scales and are situated within the transitional zone between subtropical and temperate climates. The region is significantly influenced by the East Asian and South Asian monsoon systems, resulting in frequent extreme weather and climate events [18,19]. The climatic challenges faced by the YRB are intricately influenced by the dynamic interplay of two monsoon systems operating across diverse time scales. This complexity is further compounded by the region’s highly varied geographical and topographical features. Accurately simulating climate phenomena in the YRB remains a formidable task, especially concerning precipitation. Despite the wealth of prior studies, a consensus on the most suitable physical parameterization scheme for the YRB has yet to be established. To attain satisfactory performance of the regional climate model RegCM4 in climate simulation studies over the YBR, selecting a set of physically parameterized schemes suitable for the local conditions is essential.
The primary purpose of this study is to identify the optimal physical combination schemes that can effectively simulate precipitation and temperature in the YRB through a comprehensive evaluation of numerous available CSs and LSPs. This study also aims to provide a preliminary analysis of the factors contributing to the performance differences among these schemes. Section 2 introduces the model and experimental design, while Section 3 and Section 4 present the comprehensive evaluation results and discussions. Section 5 concludes with important findings. The findings presented herein offer a robust foundation for selecting physical parameterization schemes when using RegCM4 to simulate regional climate in the YRB more accurately. This study also provides a scientific basis for climate change adaptation decisions in the YRB, which can better guide local water resource management, agricultural production, and other activities, promoting sustainable development.

2. Data and Methods

2.1. RegCM4 and Experimental Description

RegCM4 is a regional climate model crafted under the auspices of the Abdus Salam International Center for Theoretical Physics. Particularly prominent in its utilization, RegCM4 has been extensively applied in multi-decadal climate change simulations within the dynamic landscape of East Asia [20]. This modeling framework reflects a robust scientific foundation and underscores its versatility by providing five CSs and three LSPs for users to select. An intriguing facet of RegCM4 lies in its ability to execute different CSs across both land and ocean domains, a configuration colloquially known as ‘mixed convection.’ This feature enhances the model’s adaptability, catering to the diverse climatic conditions prevalent in various regions. For a more comprehensive understanding of the intricacies encapsulated within RegCM4, interested readers are directed to the comprehensive exposition by Giorgi et al. [21], which delves into the nuanced details of this influential modeling framework.
To explore the simulation performance of various combinations of physical parameterization schemes on the climate of the YRB, this study conducted simulations at a 50 km resolution. The experiments employed a horizontal grid spacing of 50 km (200 × 130), 18 vertical layers, and a 1 hPa layer at the top of the atmospheric column. The planetary boundary, sea surface flux, and radiation schemes adopted the Holtslag scheme [22], Zeng scheme [23], and NCAR CCM3, respectively, widely applied in regional simulations in China. The simulation domain covered the coordinated regional climate downscaling experiment East Asia phase II domain, including the YRB of interest in this study (Figure 1). The continuous simulation period spanned from October 1989 to December 1993, with a spin-up period preceding January 1990. Among the 72 sets of physical parameterization schemes configured in this study, Nos. 1–24, 25–48, and 49–72 employed the land surface process schemes BATS, CLM3.5, and CLM4.5, respectively. The land cumulus convection schemes (LCS) and ocean cumulus convection schemes (OCS) were selected from Kuo, Grell, Emanuel, Tiedtke, and Kain–Fritsch. Additional details on experimental schemes can be found in Table 1.

2.2. Data

ERA-Interim data were incorporated to establish initial and lateral boundary conditions for the RegCM4 simulations [24]. The ERA-Interim forcing data can be obtained from the International Center for Theoretical Physics at http://clima-dods.ictp.it/Data/RegCM_Data/ (accessed on 1 March 2023). In evaluating the simulation accuracy of precipitation within the model, this investigation employed the CN05 precipitation observation dataset, meticulously crafted by the China Meteorological Administration, for a rigorous validation process [25]. The CN05 data can be downloaded from the following link: https://ccrc.iap.ac.cn/resource/detail?id=228 (accessed on 1 March 2023). This comprehensive dataset amalgamates daily precipitation observations from a network of 2416 meteorological stations across China, employing an advanced interpolation method to produce a gridded dataset with a refined resolution of 0.5° × 0.5°. Distinguished for its reliability, the CN05 dataset has become a staple in scrutinizing the proficiency of regional climate models in capturing the intricacies of China’s climate dynamics [26]. To facilitate a meticulous comparative analysis, the output results generated by RegCM4 underwent interpolation to align with the grid centers, mirroring the resolution parameters of the CN05 dataset.

2.3. Methodology

In this investigation, a comprehensive multi-standard scoring methodology takes center stage to assess the efficacy of diverse physical parameterization schemes implemented within RegCM4. The evaluative criteria encompass a spectrum of metrics, including mean annual values, standard deviation, relative error (RE), normalized root mean square error (NRMSE), spatial distribution, empirical orthogonal function (EOF), annual climate cycles, and probability density function (PDF). The intricate details of these criteria and their corresponding weights are meticulously outlined in Table 2, providing a structured framework for a thorough evaluation. A rank score (RS) system, ranging from 0 to 9, is meticulously employed to appraise each assessment criterion. This approach ensures a comprehensive and detailed analysis, allowing for a more nuanced understanding of the performance nuances exhibited by various physical parameterization schemes within the RegCM4 framework.
R S i = x i x m i n x m a x x m i n × 9
where xi signifies the RE or other pertinent statistical measures between the observations and the outcomes derived from the ith RegCM simulation. In the context of RE, a higher xi value corresponds to an elevated RS in the assessment criterion for the ith RegCM outcome. The overall performance score for each sensitivity test materializes through a judiciously weighted summation of RS across all assessment criteria. Additionally, we employ the Normalized Root Mean Squared Error (NRMSE) as a metric to scrutinize RegCM4’s proficiency in reproducing climate variables.
N R M S E = 1 n i = 1 n X G i X o i 2 1 n 1 i = 1 n X o i X ¯ o 2
where XGi and XOi denote the values attributed to the simulated and observed climate variables within the model during the ith simulation period. The parameter n signifies the duration of the simulation period within RegCM4, while X ¯ o signifies the average value of the observed data throughout the entire observation period.
The assessment of the annual cycle and spatial distribution of climate variables simulated by the model entails a meticulous examination utilizing correlation coefficients. In-depth qualitative and quantitative analyses of the spatial field characteristics of these variables are conducted through the application of the empirical orthogonal function (EOF) methodology, a well-established approach for such investigations [27]. This study employs EOF to scrutinize the temporal and spatial dynamics of climate variables simulated by RegCM4, comparing them with observational data on a monthly scale [28].
To gauge the reliability of the RegCM4 simulation results at a monthly scale, we leverage two key indicators: Brier score (BS) and Significance score (Sscore). The BS, representing the mean square error of the probability prediction, offers a quantitative measure of the simulation’s accuracy in predicting the probability density distribution of climate variables. In parallel, the Sscore indicates the smallest cumulative probability within each equal sequence of values in both observed and simulated distributions.
B S = 1 n i = 1 n P m i P o i 2
S score = i = 1 n M i n i m u m P m i , P o i
where Pmi and Poi denote the probabilities associated with the presence of climate variables simulated by RegCM4 and observed counterparts within the ith data segment, respectively. The sequence length, n, is systematically divided by the original sequence values of the climate variables. The efficacy of RegCM4 in replicating the probability density distribution within the region can be gauged through the BS and Sscore. A lower BS or a higher Sscore signifies an enhanced simulation capability, suggesting a more accurate alignment with the probability density distribution of the observed climate variables in the specified region.

3. Results

3.1. Comprehensive Evaluation of the Physical Parameterization Scheme

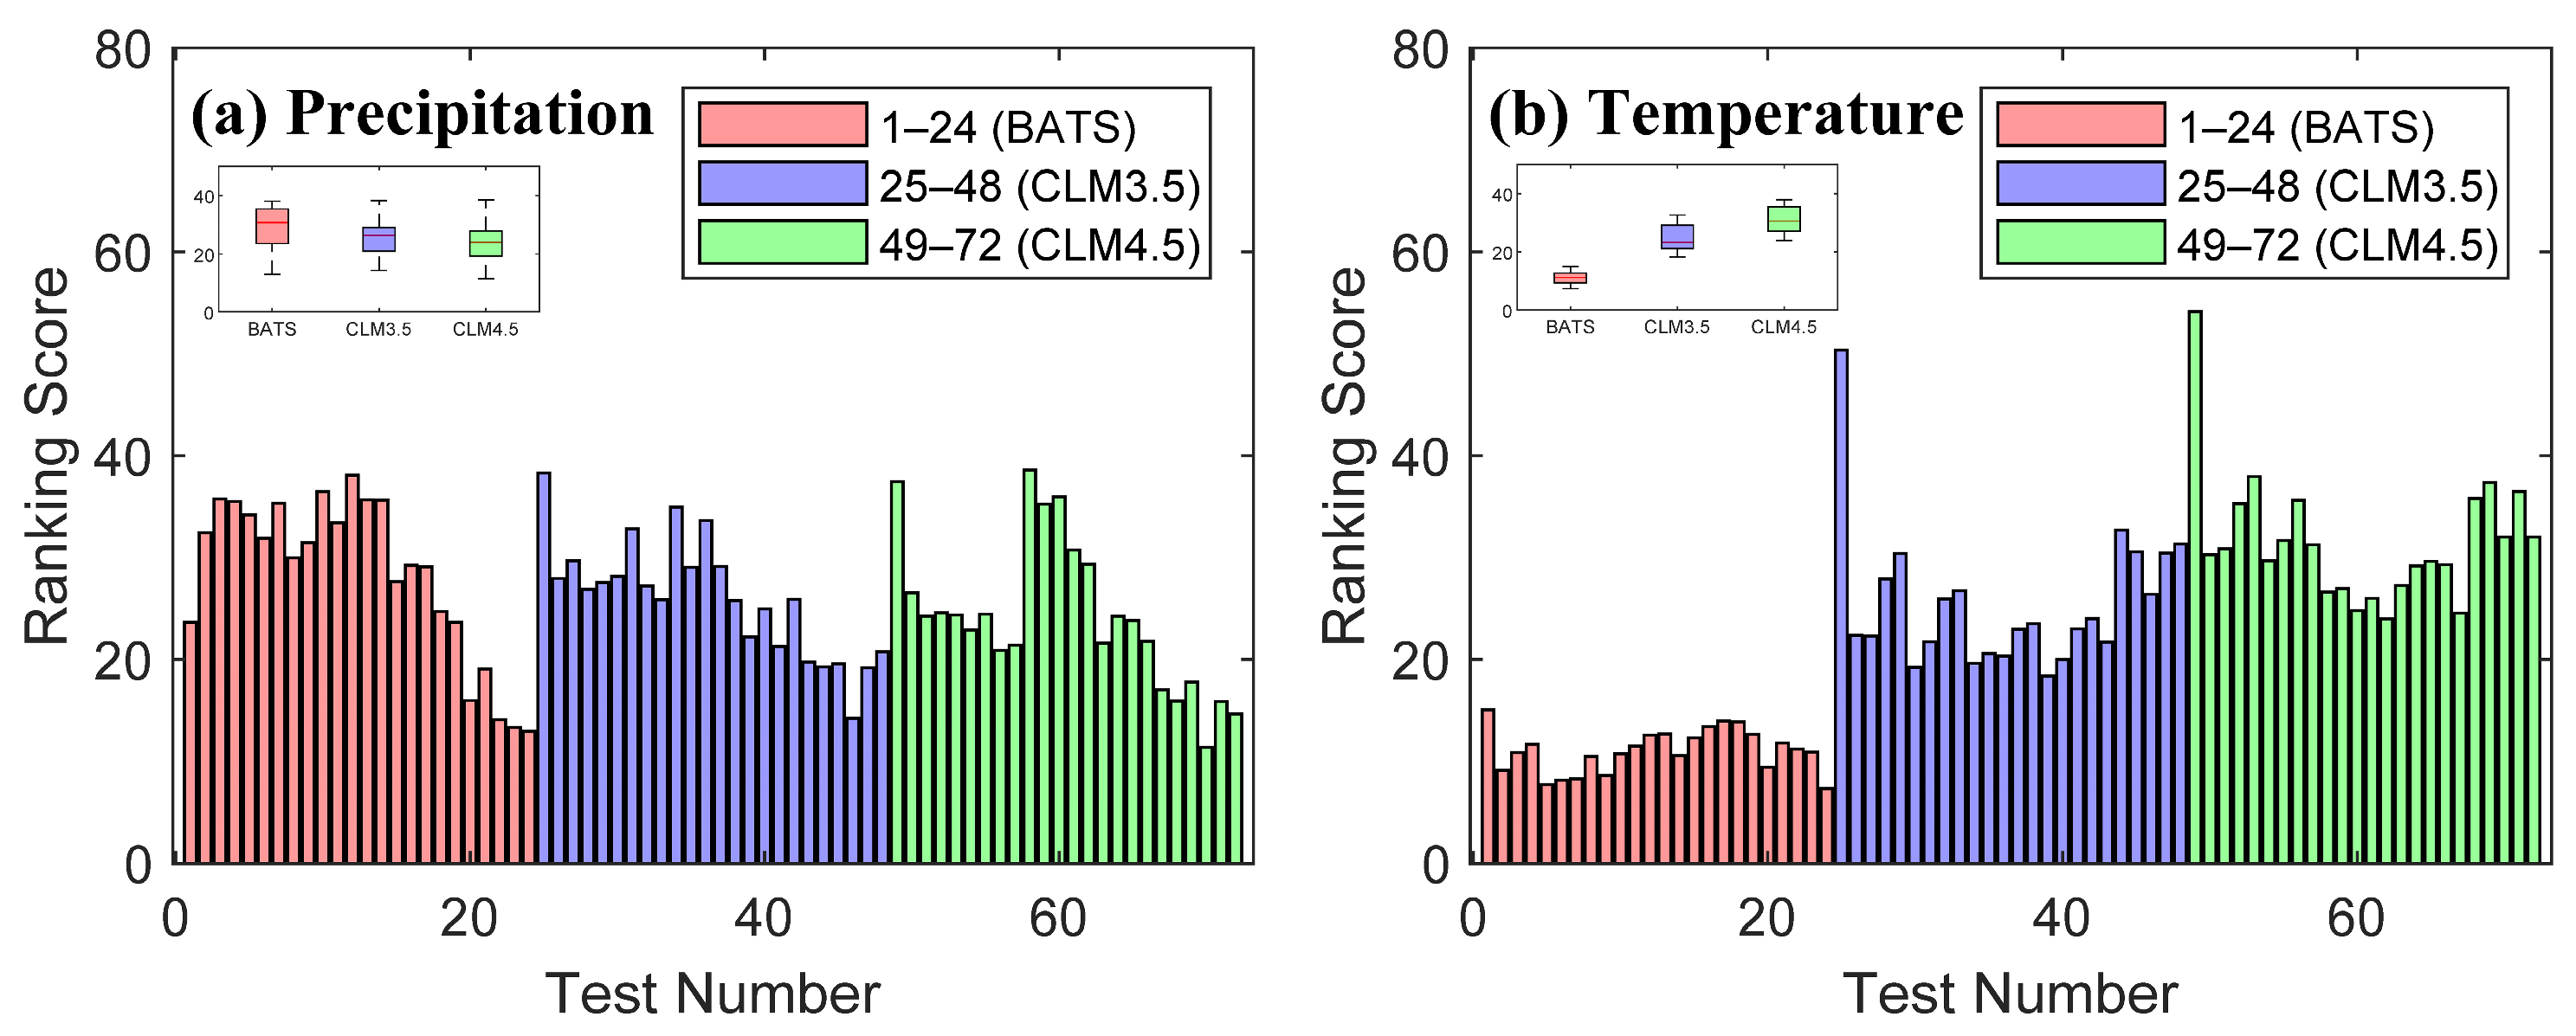
Figure 2 delineates the evaluation outcomes of simulated temperature and precipitation across 72 distinct sets of parameterization schemes within the YRB. As illustrated in Figure 2a, precipitation shows higher sensitivity to changes in CSs, while being less responsive to variations in land surface process schemes. The box plots indicate that the CLM schemes exhibit a slightly superior overall simulation performance for precipitation compared to the BATS scheme. Regarding temperature, the BATS group, encompassing experiments 1 through 24 (Nos. 1–24), emerges as the top performer (Figure 2b). The closely trailing counterpart is the CLM3.5 group, comprising experiments numbered 25 through 48 (Nos. 25–48). Conversely, compared with the other two groups, the CLM4.5 group, consisting of experiments numbered 49 through 72 (Nos. 49–72), exhibits the least favorable performance regarding temperature. The temperature variable displays heightened sensitivity to variations in land surface process schemes, with the BATS group showcasing the most favorable outcomes. This analysis underlines the intricate interplay between parameterization schemes and their differential impacts on simulated temperature and precipitation patterns within the YRB.
Utilizing the minimum RS as the benchmark for temperature and precipitation evaluations, the cumulus convection scheme employing KF demonstrated optimal performance among the 72 distinct schemes (Figure 2). This superiority was particularly evident when the land and ocean cumulus schemes incorporated the KF scheme. Consequently, we delve deeper into the nuanced performance distinctions among nine selected schemes, organized into three groups, shedding light on the interplay between different CSs and LSPs within the YRB. The first group comprises simulations where the land and ocean cumulus schemes adopt the E scheme, identified as experiments numbered 12, 36, and 60. The second group comprises simulations in which the land and ocean cumulus schemes adopt the KF and T schemes, respectively, identified as experiments numbered 19, 43, and 67. The third group features simulations where the land and ocean cumulus schemes adopt the KF scheme, identified as experiments numbered 24, 48, and 72. Within each group of three simulations, the land surface process schemes applied to the members are BATS (Nos. 12, 19, and 24), CLM3.5 (Nos. 36, 43, and 48), and CLM4.5 (Nos. 60, 67, and 72).

3.2. Assessment of Climatological Performance

As shown in Figure 3, the selected schemes exhibit better simulation performance for winter precipitation compared to summer. The spatial correlation coefficients between observed and simulated values for annual and summer precipitation in the YRB are generally below 0.3, with standard deviations reaching 2–4. In contrast, the spatial correlations between observed and simulated winter precipitation for the nine selected schemes range from 0.5 to 0.6, with standard deviations within 1, indicating superior performance during the cold season. Regarding precipitation spatial patterns, the simulated summer precipitation shows a significant wet bias in the central part of the Yangtze River Basin, especially around the mountainous areas surrounding the Sichuan Basin (Figure 4). On the other hand, the simulated winter precipitation exhibits a considerable wet bias in the southern part of the middle reaches of the Yangtze River (Figure S1). Due to intrinsic parameterization settings, the E scheme simulates higher wet biases in both summer and winter precipitation in the Yangtze River region compared to other CSs [29]. Although the selected schemes overestimate precipitation in the upper reaches of the Yangtze River ovrall, they tend to underestimate precipitation in the middle and lower reaches, which is related to the RegCM model’s lack of accurate representation of mesoscale weather activities, such as the activity of summer tropical cyclones. In regions influenced by monsoons, precipitation has complex connections with mesoscale systems embedded with the Meiyu front. Incomplete cumulus parameterization may lead to dry biases in simulating monsoon region precipitation, especially when tropical cyclones or other mesoscale systems are influenced.
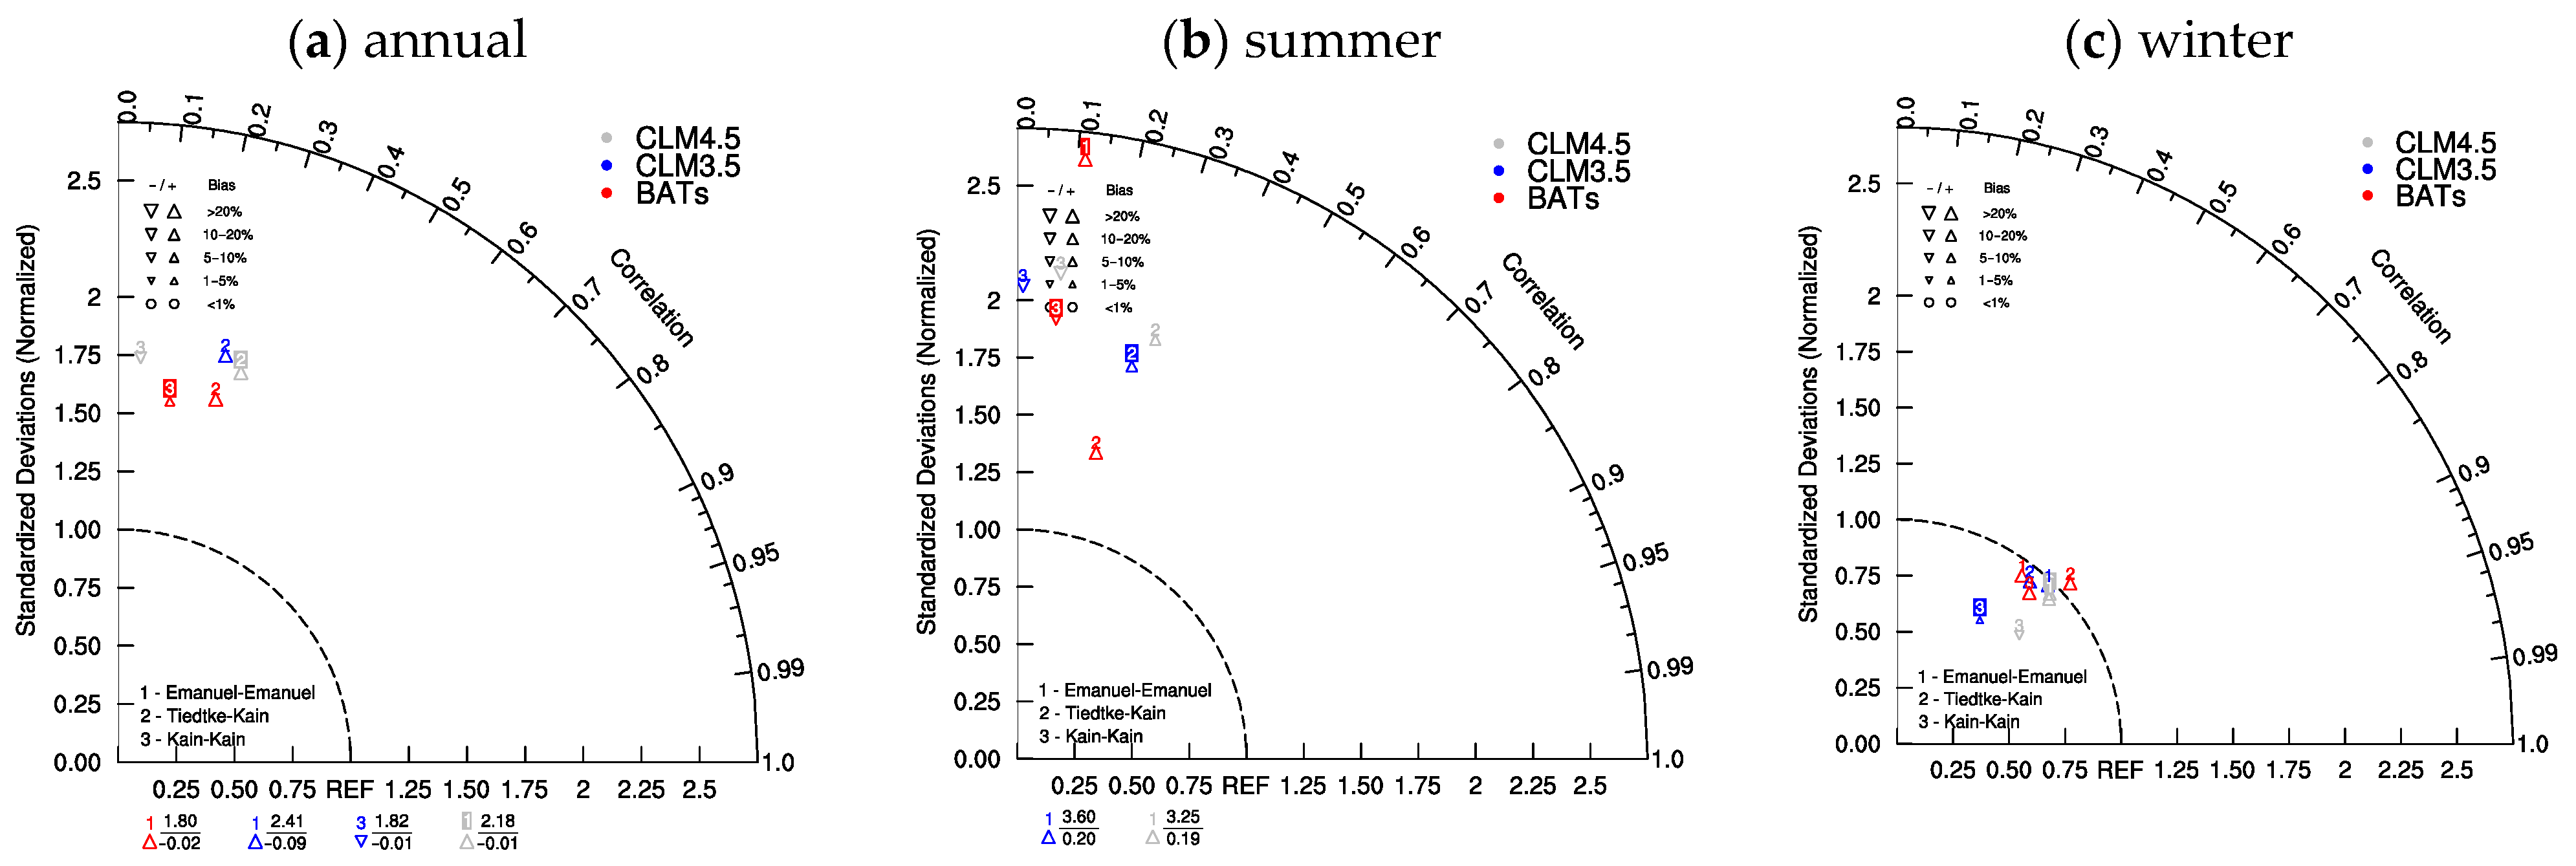
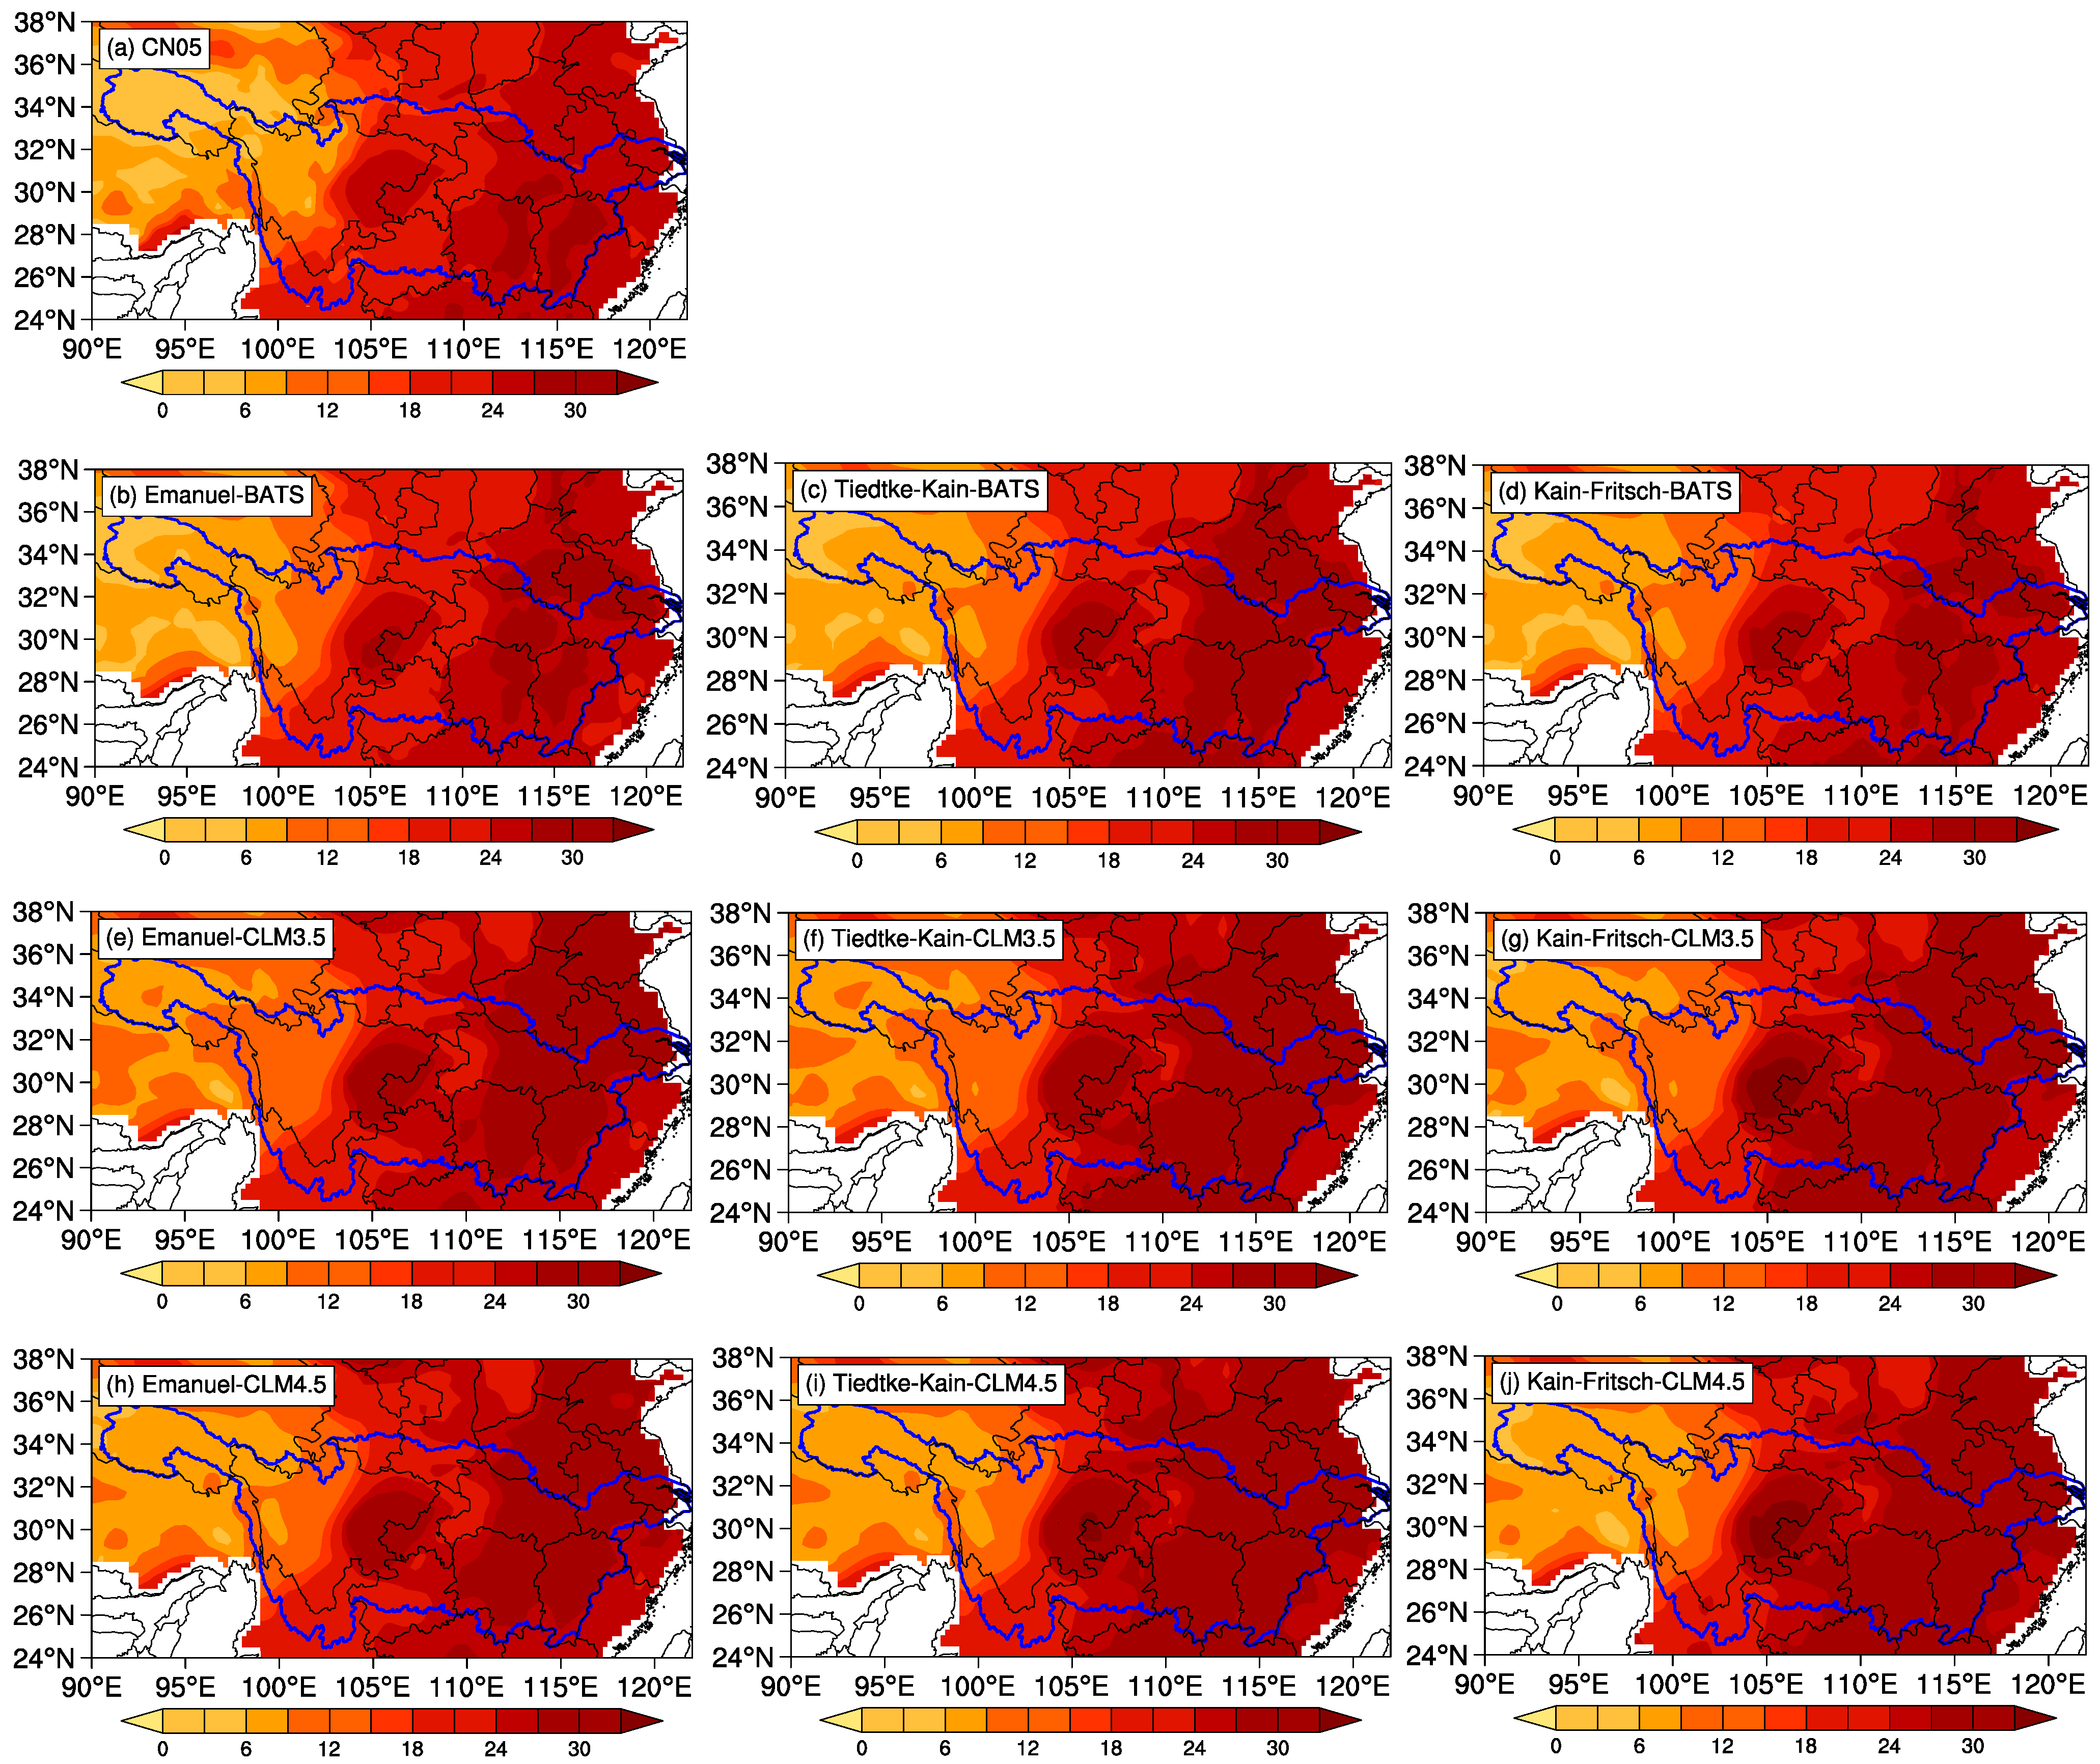
As depicted in Figure 5, RegCM4 exhibits a robust capability to simulate temperatures in the YRB, with slightly better performance in simulating summer temperatures than winter. The spatial correlation coefficients between observed and simulated values for annual and summer precipitation in the YRB typically exceed 0.99, with standard deviations within 1.25. In contrast, the spatial correlations between observed and simulated winter temperatures for the nine selected schemes are around 0.95, with standard deviations ranging from 1.25 to 1.5 (Figure 5). Furthermore, using the CLM4.5 scheme results in higher standard deviations for annual, summer, and winter temperatures than other land surface process schemes. RegCM4 aptly reproduces the well-defined temperature gradient, gradually warming from northwest to southeast, in the YRB during winter and summer. The temperature spatial patterns simulated by the nine selected combinations closely match the observed data (Figure 6 and Figure S2). However, RegCM4 tends to exhibit a warm bias in summer temperatures in the downstream region of the YRB, while a cold bias is observed in the high mountainous areas of the middle and upper reaches of the YRB during the same season.

3.3. Performance Evaluation for Annual Cycle and Probability Density

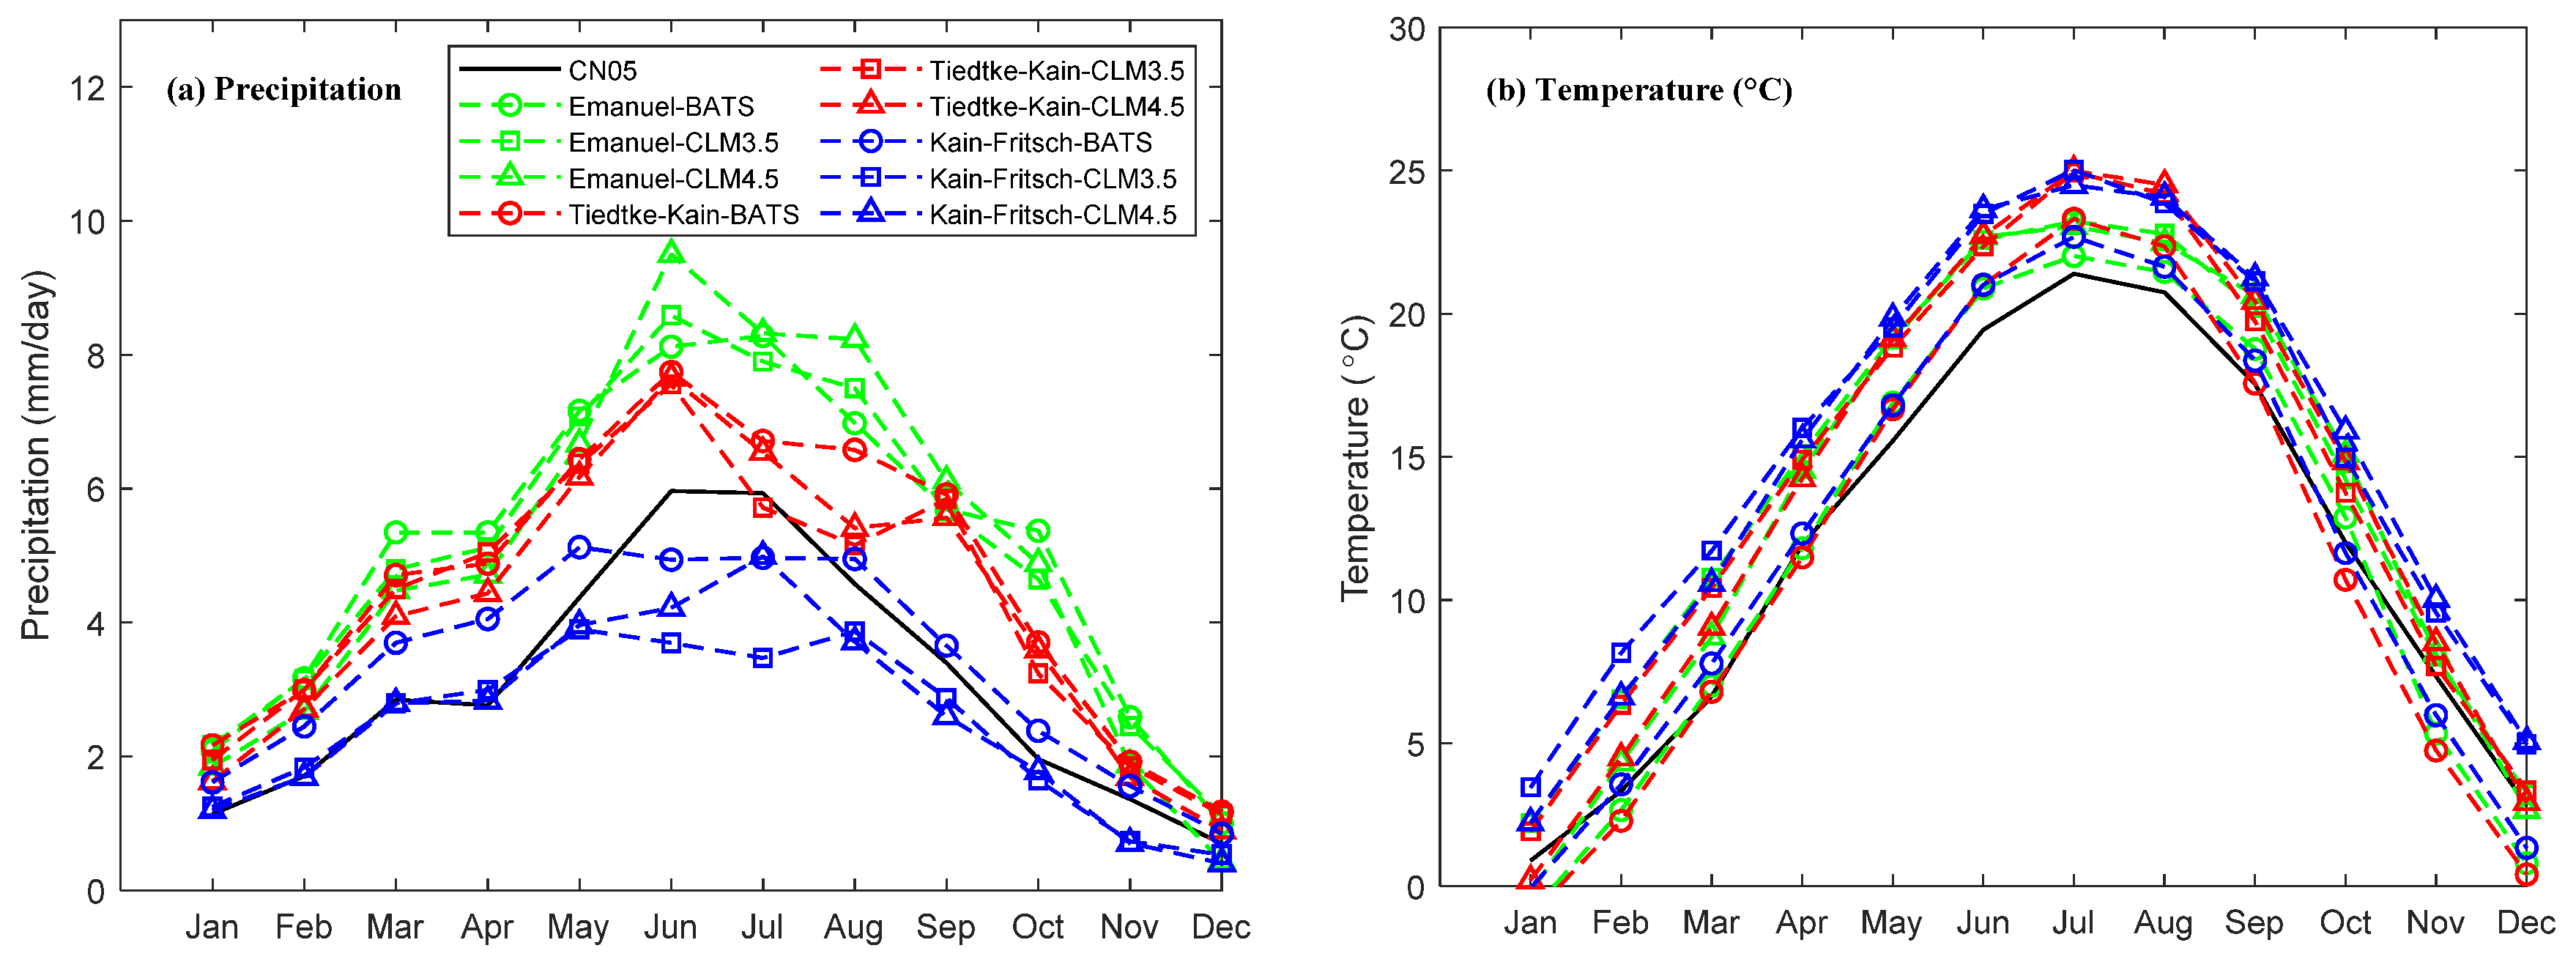
As depicted in Figure 7a, a comparative analysis reveals that the E scheme exhibits a more pronounced overestimation of annual precipitation, particularly during summer, when juxtaposed with the T-K and KF schemes. Intriguingly, the KF scheme demonstrates congruence with observational data across the annual precipitation cycle, irrespective of the land surface process schemes utilized (BATS, CLM3.5, and CLM4.5). Turning our focus to air temperature, Figure 7b portrays that the E, T-KF, and KF schemes effectively capture the annual temperature cycle. In an overarching assessment of the annual temperature cycle, the BATS scheme, integrating the three cumulus convection schemes, showcases marginally superior simulation results compared to the CLM3.5 and CLM4.5 schemes.
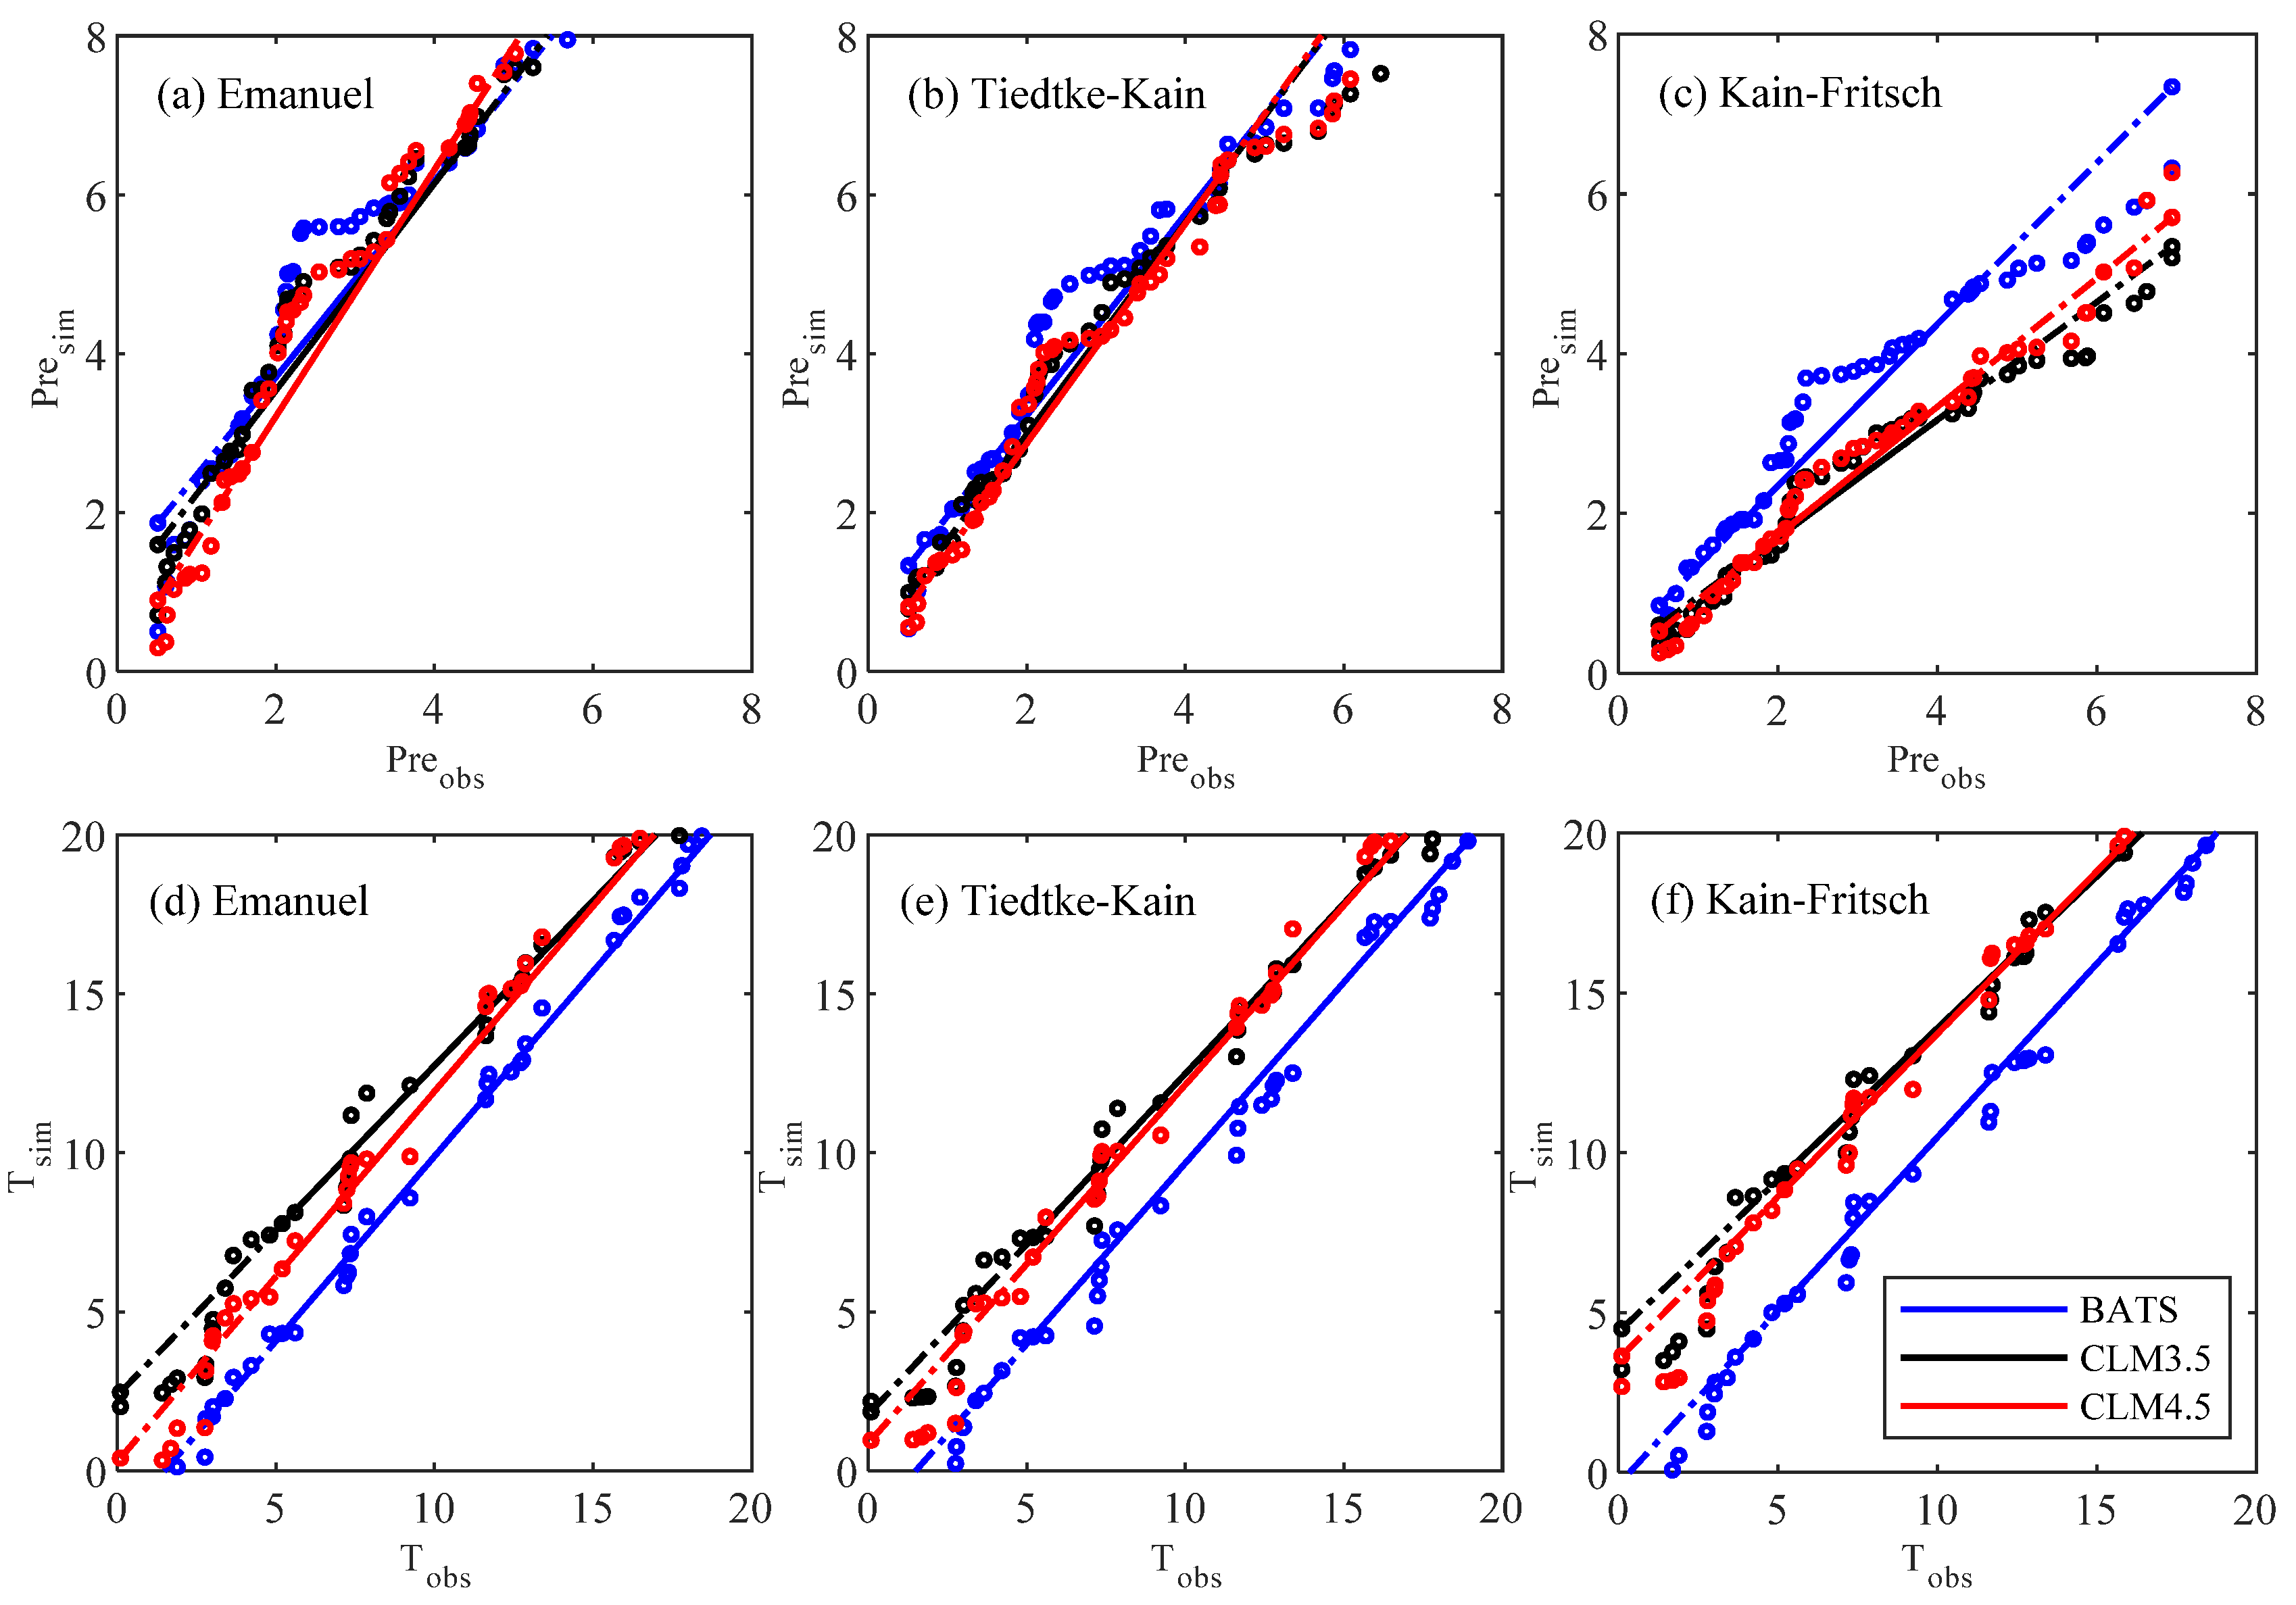
Comparatively, within the RegCM4 framework, the combination of the CLM land surface process scheme and the KF mixed convection parameterization scheme demonstrates superior simulation performance. As illustrated in Figure 8a–c, the precipitation intensity simulated by the E and T-KF schemes consistently exceeds observed values. The precipitation intensity simulated with the KF mixed convection scheme is closer to observed values among the selected cumulus convection schemes. The variations in the BATS, CLM3.5, and CLM4.5 land surface process schemes have minimal effects on precipitation simulated with the E (Figure 8a) and T (Figure 8b) mixed convection parameterization schemes, while they exhibit a more significant impact on simulated precipitation with the KF mixed convection scheme (Figure 8c). Concerning air temperature, changes in the E, T-KF, and KF mixed convection parameterization schemes show minimal impact on the Q–Q plots of simulated and observed values (Figure 8d–f). Among the three land surface schemes (BATS, CLM3.5, and CLM4.5), the Q–Q plot for BATS is closest to the observed data (blue line), with the distribution of various quantiles resembling the line y = x.

4. Discussion

The comprehensive analysis described above underscores the distinct simulation performances of various CSs and LSPs on precipitation and temperature. Remarkably, a scheme exhibiting superior temperature simulation may demonstrate less effective performance in precipitation simulation, and vice versa. This intricacy emphasizes the critical need for judicious scheme selection aligned with specific research objectives in practical applications. In this study, we specifically zero in on the KF scheme, paired with three land surface process schemes, to delve deeper into the nuanced impact of different land surface process schemes on the simulation outcomes for precipitation and temperature. The statistical disparities in climatic factors during different months between CLMs—encompassing CLM3.5 and CLM4.5—and BATS are systematically presented in Table 3. The tabulated results reveal notable distinctions in total precipitation, evaporation, and surface soil moisture (SM) between CLMs and BATS. Specifically, CLMs simulate lower total precipitation and evaporation, while the SM simulated by CLMs portrays significant dryness compared to BATS. The domain-averaged differences in precipitation and evaporation over the YRB between CLMs and BATS range from −0.37 to −0.44 mm/day and −1.01 to −1.06 mm/day, respectively. Furthermore, CLM3.5 exhibits a soil moisture deficit of 7.79 kg/m2, and CLM4.5 amplifies this to 8.39 kg/m2, aligning with previous research findings [30].
In contrast, the BATS scheme generates higher soil moisture, leading to elevated moist static energy [31]. This, in turn, promotes convective activity and may result in more intense convective precipitation events [32,33,34]. The substantial overestimation of soil moisture in the selected region by the BATS land surface process scheme is primarily attributed to the uncertainty in soil properties stipulated by the BATS scheme, such as soil color and texture. Compared to the BATS scheme, the multi-year average sensible heat flux (SH) simulated by the CLM3.5 and CLM4.5 schemes in the RegCM4 model is higher by 8.28 W/m2 and 4.37 W/m2, respectively. The disparities in land surface process flux simulation results due to different land surface process schemes indicate that soil moisture plays a crucial role in regulating surface energy balance by influencing the spatial and temporal distribution of latent and sensible heat fluxes.
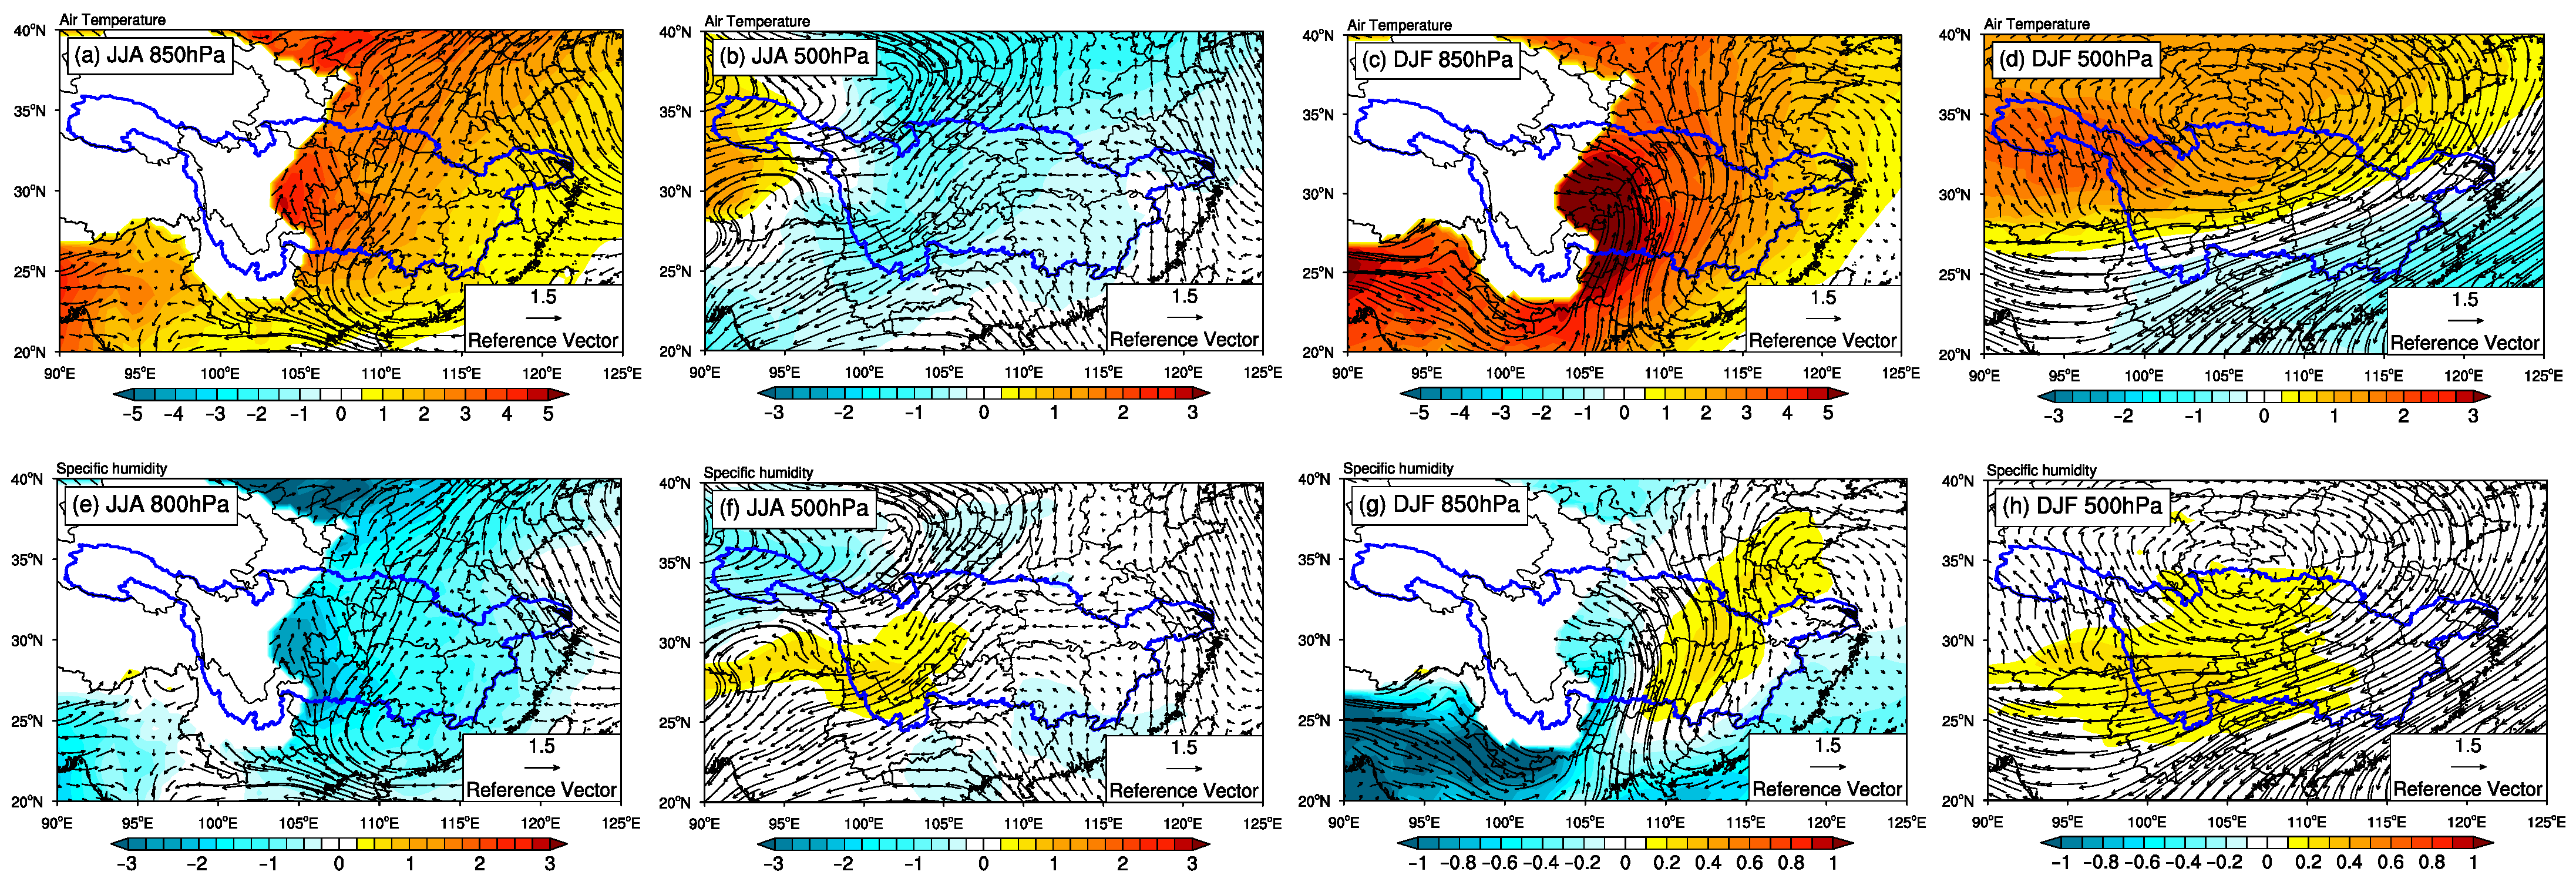
The noticeable warm–dry contrast between the BATS scheme and Community Land Models significantly impacts the region’s water vapor transport and atmospheric circulation, subsequently influencing simulated precipitation patterns. This effect is depicted in Figure 9 and Figure S3, where the temperature difference between CLMs (CLM3.5 and CLM4.5) and the BATS scheme gradually decreases with increasing altitude, highlighting the predominant influence of land surface process schemes on surface fluxes. Specifically, as shown in Figure 9c, winter temperatures at 850 hPa in the lower and middle reaches of the YRB, simulated by CLM3.5, exhibit an excess of 3–5 °C compared to those simulated by BATS. However, with an ascent to altitudes up to 500 hPa, this warm bias displayed by CLMs converges to a more nuanced range of −1 to 1 °C.
Similarly, significant differences emerge in the wind patterns between CLMs and BATS. The simulated summer wind field by CLMs shows a notable attenuation compared to its BATS counterpart (Figure 9 and Figure S3). The prevailing wind difference at 850 hPa over the YRB predominantly manifests as easterly, potentially hindering low-level water vapor transport from the Bay of Bengal to the basin. The differences in the winter wind field between CLMs and BATS exceed those in the summer, with a southerly component observed at 850 hPa. This suggests a weakening of the dry cold air from the north simulated by CLMs. Additionally, CLMs simulate generally lower specific humidity in the YRB during summer, especially at 850 hPa. This inherent dry bias in CLMs results in reduced summer precipitable water compared to BATS, thereby influencing a dampened output of summer precipitation. Consequently, the interplay of distinctions in water vapor flux and atmospheric circulation collectively contributes to the nuanced precipitation patterns observed in the YRB simulations conducted by different land surface process schemes.

5. Conclusions

Utilizing ERA-Interim reanalysis data as the initial and lateral boundary conditions, this study conducted four-year simulations employing 72 parameterization schemes within the RegCM4 framework. The evaluation of scheme performance for the YRB utilized a multi-standard scoring method. The ensuing analysis delved into the impact of diverse CSs and LSPs on precipitation and temperature simulations over the YRB.
Among the tested CSs, the KF scheme within RegCM4 demonstrated the most robust and comprehensive simulation performance for precipitation in the YRB, with spatial correlation coefficients between simulated and observed annual precipitation around 0.3. Examination of land surface process schemes revealed that the BATS group exhibited superior comprehensive simulation performance for temperature in the YRB, with spatial correlation coefficients between simulated and observed values typically exceeding 0.99 and standard deviations within 1.25 °C. Under the optimal KF scheme, the simulated soil moisture in the YRB using CLMs was notably drier, ranging from −7.79 to −8.39 kg/m2, compared to that achieved with BATS. The study underscores the need for further research across multiple regional climate model systems to comprehensively unravel the intricate impact of physical parameterization schemes on climate simulations within the YRB.

Supplementary Materials

The following supporting information can be downloaded at: https://www.mdpi.com/article/10.3390/atmos15030334/s1, Figure S1: Spatial distribution of observed and simulated multi-year average winter total precipitation for the current climate (1991–1993) over the YRB; Figure S2: Spatial distribution of observed and simulated multi-year average winter average temperature for the current climate (1991–1993) over the YRB; Figure S3: Difference in the wind field, temperature, and specific humidity between CLM4.5 and BATS.

Author Contributions

S.Y. completed the data curation; resources; formal analysis and writing—review and editing. B.L. completed the original draft. L.D. completed validation. D.W. revised the original draft. Y.H. provided some software, methodology, and funding acquisition for the study. All authors have read and agreed to the published version of the manuscript.

Funding

This study was jointly funded by the Natural Science Foundation of Jiangsu Province (BK20230957), the Open Research Fund of State Key Laboratory of Simulation and Regulation of Water Cycle in River Basin, China Institute of Water Resources and Hydropower Research (IWHR-SKL-KF202204), and the Jiangsu Funding Program for Excellent Postdoctoral Talent (2022ZB147).

Institutional Review Board Statement

Not applicable.

Informed Consent Statement

Not applicable.

Data Availability Statement

All the data are freely available. The ERA-Interim forcing data from the International Center for Theoretical Physics (http://clima-dods.ictp.it/Data/RegCM_Data/ (accessed on 1 March 2023). The CN05 observation data from Climate Change Research Center, Chinese Academy of Sciences (https://ccrc.iap.ac.cn/resource/detail?id=228 (accessed on 1 March 2023)).

Acknowledgments

The authors greatly appreciate the data availability and service provided by China Meteorological Administration and the RegCM4 science team.

Conflicts of Interest

The authors declare no conflicts of interest.

References

  1. Giorgi, F.; Marinucci, M.-R. A Investigation of the Sensitivity of Simulated Precipitation to Model Resolution and Its Implications for Climate Studies. Mon. Weather Rev. 1996, 1, 148–166. [Google Scholar] [CrossRef]
  2. Bao, Y. Simulations of summer monsoon climate over East Asia with a Regional Climate Model (RegCM) using Tiedtke convective parameterization scheme (CPS). Atmos. Res. 2013, 134, 35–44. [Google Scholar] [CrossRef]
  3. Juneng, L.; Tangang, F.; Chung, J.-X.; Ngai, S.-T.; Tay, T.-W.; Narisma, G.; Cruz, F.; Phan-Van, T.; Ngo-Duc, T.; Santisirisomboon, J.; et al. Sensitivity of Southeast Asia rainfall simulations to cumulus and air-sea flux parameterizations in RegCM4. Clim. Res. 2016, 1, 59–77. [Google Scholar] [CrossRef]
  4. Ngo-Duc, T.; Tangang, F.-T.; Santisirisomboon, J.; Cruz, F.; Trinh-Tuan, L.; Nguyen-Xuan, T.; Phan-Van, T.; Juneng, L.; Narisma, G.; Singhruck, P.; et al. Performance evaluation of RegCM4 in simulating extreme rainfall and temperature indices over the CORDEX-Southeast Asia region. Int. J. Climatol. 2017, 3, 1634–1647. [Google Scholar] [CrossRef]
  5. Kalognomou, E.-A.; Lennard, C.; Shongwe, M.; Pinto, I.; Favre, A.; Kent, M.; Hewitson, B.; Dosio, A.; Nikulin, G.; Panitz, H. A Diagnostic Evaluation of Precipitation in CORDEX Models over Southern Africa. J. Clim. 2013, 23, 9477–9506. [Google Scholar] [CrossRef]
  6. Llopart, M.; Da Rocha, R.-P.; Reboita, M.; Cuadra, S. Sensitivity of simulated South America climate to the land surface schemes in RegCM4. Clim. Dyn. 2017, 11, 3975–3987. [Google Scholar] [CrossRef]
  7. Reboita, M.; Fernandez, J.; Pereira Llopart, M.; Porfirio, D.-R.-R.; Albertani Pampuch, L.; Cruz, F. Assessment of RegCM4.3 over the CORDEX South America domain: Sensitivity analysis for physical parameterization schemes. Clim. Res. 2014, 3, 215–234. [Google Scholar] [CrossRef]
  8. Zou, L.-W.; Qian, Y.; Zhou, T.-J.; Yang, B. Parameter Tuning and Calibration of RegCM3 with MIT–Emanuel Cumulus Parameterization Scheme over CORDEX East Asia Domain. J. Clim. 2014, 20, 7687–7701. [Google Scholar] [CrossRef]
  9. Gianotti, R.-L.; Eltahir, E.-A.-B. Regional Climate Modeling over the Maritime Continent. Part II: New Parameterization for Autoconversion of Convective Rainfall. J. Clim. 2014, 4, 1504–1523. [Google Scholar] [CrossRef]
  10. Cao, J.; Zhang, X.-N.; You, Y.-L.; Yang, R.-W. Applicability of cumulus convective parameter schemes in RegCM3 to the rainfall over the Longitudinal Range-Gorge Region. Chin. Sci. Bull. 2007, 2, 115–121. [Google Scholar] [CrossRef]
  11. Zou, L.-W.; Zhou, T.-J. Sensitivity of a regional ocean-atmosphere coupled model to convection parameterization over western North Pacific. J. Geophys. Res. Atmos. 2011, 116. [Google Scholar] [CrossRef]
  12. Jinsong, P.; Guoqing, Z.; Kun, G. Comparisons of three convection parameterization schemes in regional climate simulations. Chin. J. Atmos. Sci. 2002, 2, 220–228. (In Chinese) [Google Scholar]
  13. Gao, X.-J.; Giorgi, F. Use of the RegCM system over East Asia: Review and perspectives. Engineering 2017, 5, 766–772. [Google Scholar] [CrossRef]
  14. Kang, S.; Im, E.-S.; Ahn, J.-B. The impact of two land-surface schemes on the characteristics of summer precipitation over East Asia from the RegCM4 simulations. Int. J. Climatol. 2014, 15, 3986–3997. [Google Scholar] [CrossRef]
  15. Li, Y.-B.; Tam, C.-Y.; Huang, W.-R.; Cheung, K.-K.-W.; Gao, Z.-Q. Evaluating the impacts of cumulus, land surface and ocean surface schemes on summertime rainfall simulations over East-to-southeast Asia and the western north Pacific by RegCM4. Clim. Dyn. 2016, 46, 2487–2505. [Google Scholar] [CrossRef]
  16. Dickinson, R.-E.; Henderson-Sellers, A.; Kennedy, J. Biosphere Atmosphere Transfer Scheme (BATS) Version 1e as Coupled to the NCAR Community Climate Model; NCAR Technical Note NCAR/TN-387+STR; National Center for Atmospheric Research: Boulder, CO, USA, 1993. [Google Scholar]
  17. Oleson, K.; Dai, Y.; Bonan, G.; Mike, B.; Dickinson, R.; Dirmeyer, P.; Hoffman, F.; Houser, P.; Levis, S.; Niu, G.; et al. Technical Description of the Community Land Model (CLM); NCAR Technical Note NCAR/TN-461+STR; National Center for Atmospheric Research: Boulder, CO, USA, 2004. [Google Scholar] [CrossRef]
  18. Shen, X.; Liu, B.; Lu, X.; Fan, G. Spatial and temporal changes in daily temperature extremes in China during 1960–2011. Theor. Appl. Climatol. 2017, 130, 933–943. [Google Scholar] [CrossRef]
  19. Liu, W.; Sun, W.; Huang, J.; Wen, H.; Huang, R. Excessive Rainfall Is the Key Meteorological Limiting Factor for Winter Wheat Yield in the Middle and Lower Reaches of the Yangtze River. Agronomy 2022, 1, 50. [Google Scholar] [CrossRef]
  20. Gao, X.-J.; Shi, Y.; Song, R.; Giorgi, F.; Wang, Y.; Zhang, D.-F. Reduction of future monsoon precipitation over China: Comparison between a high resolution RCM simulation and the driving GCM. Meteorol. Atmos. Phys. 2008, 100, 73–86. [Google Scholar] [CrossRef]
  21. Giorgi, F.; Coppola, E.; Solmon, F.; Mariotti, L.; Sylla, M.-B.; Bi, X.; Elguindi, N.; Diro, G.-T.; Nair, V.; Giuliani, G.; et al. RegCM4: Model description and preliminary tests over multiple CORDEX domains. Clim. Res. 2012, 52, 7–29. [Google Scholar] [CrossRef]
  22. Holtslag, A.-A.-M.; De Bruijn, E.-I.-F.; Pan, H. A High Resolution Air Mass Transformation Model for Short-Range Weather Forecasting. Mon. Weather Rev. 1990, 8, 1561–1575. [Google Scholar] [CrossRef]
  23. Zeng, X.-B.; Zhao, M.; Dickinson, R.-E. Intercomparison of Bulk Aerodynamic Algorithms for the Computation of Sea Surface Fluxes Using TOGA COARE and TAO Data. J. Clim. 1998, 10, 2628–2644. [Google Scholar] [CrossRef]
  24. Uppala, S.-M.; Dee, D.; Kobayashi, S.; Berrisford, P.; Simmons, A. Towards a climate data assimilation system: Status update of ERA-Interim. In ECMWF Newsletter, No.115; ECMWF: Reading, UK, 2008. [Google Scholar]
  25. Wu, J.; Gao, X.-J. A gridded daily observation dataset over China region and comparison with the other datasets. Chin. J. Geophys. 2013, 4, 1102–1111. (In Chinese) [Google Scholar]
  26. Shi, Y.; Wang, G.-L.; Gao, X.-J. Role of resolution in regional climate change projections over China. Clim. Dyn. 2018, 51, 2375–2396. [Google Scholar] [CrossRef]
  27. Mu, Q.; Jackson, C.-S.; Stoffa, P.-L. A multivariate empirical-orthogonal-function-based measure of climate model performance. J. Geophys. Res. Atmos. 2004, 109. [Google Scholar] [CrossRef]
  28. Harvey, L.; Wigley, T. Characterizing and comparing control-run variability of eight coupled AOGCMs and of observations. Part 1: Temperature. Clim. Dyn. 2003, 7, 619–646. [Google Scholar] [CrossRef]
  29. Im, E.-S.; Gutowski, W.-J., Jr.; Giorgi, F. Consistent changes in twenty-first century daily precipitation from regional climate simulations for Korea using two convection parameterizations. Geophys. Res. Lett. 2008, 35. [Google Scholar] [CrossRef]
  30. Diro, G.-T.; Rauscher, S.-A.; Giorgi, F.; Tompkins, A.-M. Sensitivity of seasonal climate and diurnal precipitation over Central America to land and sea surface schemes in RegCM4. Clim. Res. 2012, 52, 31–48. [Google Scholar] [CrossRef]
  31. Im, E.; Marcella, M.-P.; Eltahir, E.-A.-B. Impact of Potential Large-Scale Irrigation on the West African Monsoon and Its Dependence on Location of Irrigated Area. J. Clim. 2014, 3, 994–1009. [Google Scholar] [CrossRef]
  32. Alfieri, L.; Claps, P.; D’Odorico, P.; Laio, F.; Over, T.-M. An Analysis of the Soil Moisture Feedback on Convective and Stratiform Precipitation. J. Hydrometeorol. 2006, 2, 280–291. [Google Scholar] [CrossRef]
  33. Myoung, B.; Nielsen-Gammon, J.-W. The Convective Instability Pathway to Warm Season Drought in Texas. Part I: The Role of Convective Inhibition and Its Modulation by Soil Moisture. J. Clim. 2010, 17, 4461–4473. [Google Scholar] [CrossRef]
  34. Hauck, C.; Barthlott, C.; Krauss, L.; Kalthoff, N. Soil moisture variability and its influence on convective precipitation over complex terrain. Q. J. R. Meteorol. Soc. 2011, 137, 42–56. [Google Scholar] [CrossRef]
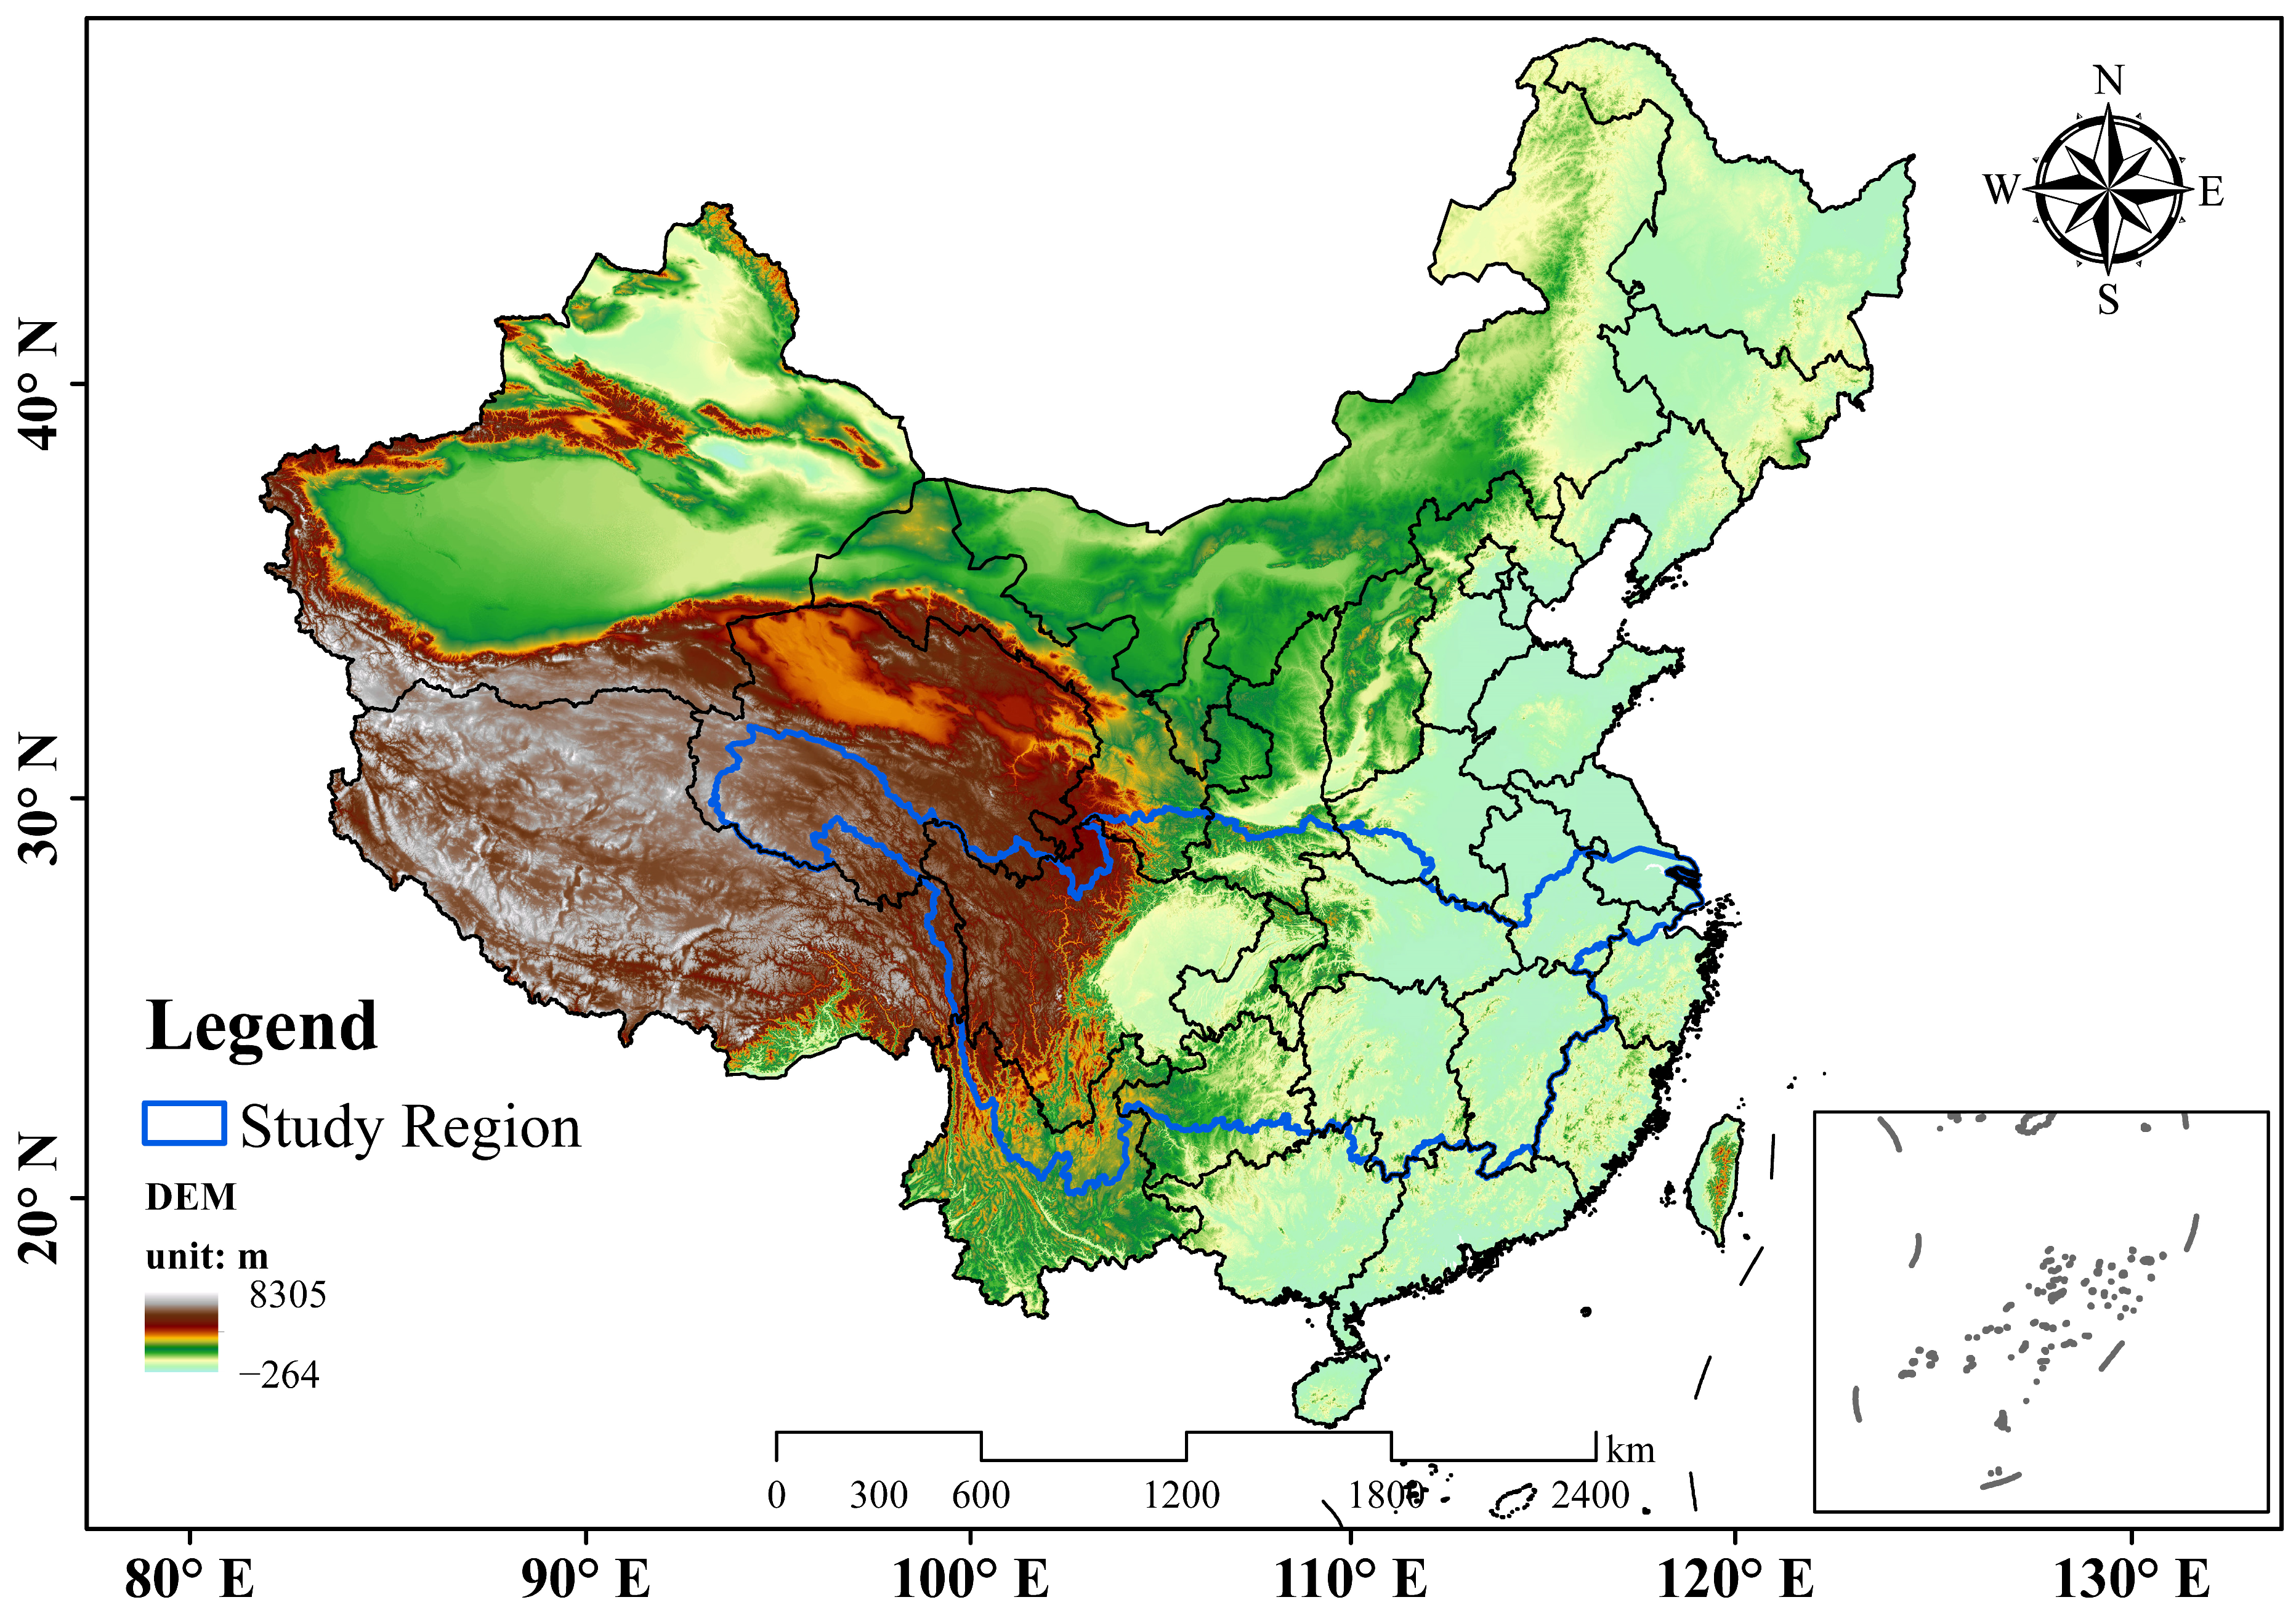
Figure 1. Domain of computation and topographic landscape (unit: meters) in the regcm4 model.
Atmosphere 15 00334 g001
Figure 2. Distribution analysis of ranking scores for precipitation (a) and temperature (b) among 72 physical parameterization scheme configurations.
Atmosphere 15 00334 g002
Figure 3. Comparative analysis of annual (a), summer (b), and winter (c) precipitation using Taylor diagrams in the YRB with different schemes.
Atmosphere 15 00334 g003
Figure 4. Spatial patterns of multi-year average summer precipitation (Unit: mm) during the present climate period (1991–1993) across the YRB. [(a) Observed precipitation distribution based on the CN05 dataset, (b) simulated precipitation distribution utilizing the combined scheme of E and BATs, (c) simulated precipitation employing the combined scheme of T-KF and BATS, (d) simulation incorporating the combined scheme of KF and BATS, (eg) analogous simulations as (bd) but with CLM3.5, and (hj) parallel simulations as (bd) but with CLM4.5.].
Atmosphere 15 00334 g004
Figure 5. Comparative analysis of annual (a), summer (b), and winter (c) temperatures using Taylor diagrams in the YRB with different schemes.
Atmosphere 15 00334 g005
Figure 6. Spatial patterns of multi-year summer average temperature (Unit: °C) during the present climate period (1991–1993) across the YRB. [(a) Observed temperature distribution based on the CN05 dataset, (b) simulated temperature distribution using the combined scheme of E and BATS, (c) simulated temperature distribution employing the combined scheme of T-KF and BATS, (d) simulated temperature distribution incorporating the combined scheme of KF and BATS, (eg) analogous simulations as (bd) but with CLM3.5, and (hj) parallel simulations as (bd) but with CLM4.5.].
Atmosphere 15 00334 g006
Figure 7. Comparative analysis of annual cycles: observed and simulated precipitation (mm/day) (a) and temperature (°C) (b) in the YRB.
Atmosphere 15 00334 g007
Figure 8. Quantile–Quantile analysis of precipitation (ac) and temperature (df) in the YRB: Comparative assessment between simulation and observation. [(a) Precipitation simulated using the E scheme, (b) precipitation simulated using the T-KF scheme, (c) precipitation simulated using the KF scheme, and (df) analogous comparisons as (ac) but for temperature].
Atmosphere 15 00334 g008
Figure 9. Disparities in wind (m/s), temperature ((ad), °C), and specific humidity ((ef), g/kg) between CLM3.5 and BATS (designated as CLM3.5-BATS). [(a) Variations in summertime temperature at 850 hPa, (b) contrasts in summertime temperature at 500 hPa, (c) discrepancies in wintertime temperature at 850 hPa, (d) disparities in wintertime temperature at 500 hPa; (eh) mirroring (ad) but for specific humidity.].
Atmosphere 15 00334 g009
Table 1. Physical parameterization schemes used in the study.
No.LCSOCSLSPNo.LCSOCSLSPNo.LCSOCSLSP
1KKBATS25KKCLM3.549KKCLM4.5
2G-ASG-ASBATS26G-ASG-ASCLM3.550G-ASG-ASCLM4.5
3G-ASEBATS27G-ASECLM3.551G-ASECLM4.5
4G-ASTBATS28G-ASTCLM3.552G-ASTCLM4.5
5G-ASKFBATS29G-ASKFCLM3.553G-ASKFCLM4.5
6G-FCG-FCBATS30G-FCG-FCCLM3.554G-FCG-FCCLM4.5
7G-FCEBATS31G-FCECLM3.555G-FCECLM4.5
8G-FCTBATS32G-FCTCLM3.556G-FCTCLM4.5
9G-FCKFBATS33G-FCKFCLM3.557G-FCKFCLM4.5
10EG-ASBATS34EG-ASCLM3.558EG-ASCLM4.5
11EG-FCBATS35EG-FCCLM3.559EG-FCCLM4.5
12EEBATS36EECLM3.560EECLM4.5
13ETBATS37ETCLM3.561ETCLM4.5
14EKFBATS38EKFCLM3.562EKFCLM4.5
15TG-ASBATS39TG-ASCLM3.563TG-ASCLM4.5
16TG-FCBATS40TG-FCCLM3.564TG-FCCLM4.5
17TEBATS41TECLM3.565TECLM4.5
18TTBATS42TTCLM3.566TTCLM4.5
19TKFBATS43TKFCLM3.567TKFCLM4.5
20KFG-ASBATS44KFG-ASCLM3.568KFG-ASCLM4.5
21KFG-FCBATS45KFG-FCCLM3.569KFG-FCCLM4.5
22KFEBATS46KFECLM3.570KFECLM4.5
23KFTBATS47KFTCLM3.571KFTCLM4.5
24KFKFBATS48KFKFCLM3.572KFKFCLM4.5
Notes: The abbreviations for convection schemes are as follows: Kuo (K), Grell (G), Emanuel (E), Tiedtke (T), and Kain–Fritsch (KF). The Grell scheme has two distinct cumulus closure schemes: the Arakawa–Schubert Cumulus Closure Scheme (AS) and the Fritsch–Chappell Cumulus Closure Scheme (FC).
Table 2. Statistical indices and corresponding weight allocations in the study.
Characteristics of Climate VariablesStatistical IndicesWeights
Mean valueRE (%)1.0
Standard deviationRE (%)1.0
Temporal changeNRMSE1.0
Monthly distributionCorrelation coefficient (R2)1.0
Spatial distributionCorrelation coefficient (R2)1.0
Spatiotemporal variabilityEOF1 (first vector)0.5
EOF2 (second vector)0.5
Probability density functionsBS0.5
Sscore0.5
Table 3. Disparities in hydrometeorological elements within the YRB among the CLMs (CLM3.5 and CLM4.5) and BATS schemes.
MonthPrecipitation (mm/Day)Evaporation (mm/Day)SM (kg/m2)SH (W/m2)
CLM3.5CLM4.5CLM3.5CLM4.5CLM3.5CLM4.5CLM3.5CLM4.5
1−0.37−0.44−0.47−0.43−10.29−8.772.35−3.49
2−0.65−0.79−0.62−0.66−10.24−9.915.481.81
3−0.96−0.96−0.92−0.87−8.48−9.5313.288.58
4−1.06−1.26−1.18−1.11−8.72−10.4314.4912.35
5−1.25−1.30−1.27−1.09−8.46−10.6913.758.01
6−1.25−0.76−1.42−1.25−5.81−7.927.20−0.57
7−1.520.05−1.45−1.05−5.92−6.928.30−0.68
8−1.09−1.21−1.30−1.16−5.68−7.496.284.12
9−0.78−1.07−1.25−1.35−5.76−7.268.3011.45
10−0.77−0.67−1.17−1.27−6.10−6.889.9111.55
11−0.87−0.91−0.98−1.07−8.55−7.587.415.82
12−0.30−0.45−0.68−0.76−9.51−7.292.58−0.49
Mean−0.37−0.44−1.06−1.01−7.79−8.398.284.87
Disclaimer/Publisher’s Note: The statements, opinions and data contained in all publications are solely those of the individual author(s) and contributor(s) and not of MDPI and/or the editor(s). MDPI and/or the editor(s) disclaim responsibility for any injury to people or property resulting from any ideas, methods, instructions or products referred to in the content.