
Investigation of Icelandic Dust Presence in the Aerosols Collected at Hornsund (Svalbard, Norwegian Arctic) in Spring 2019

 ,
,  , and
, and 
Abstract
1. Introduction
2. Background, Samples, and Methods
2.1. The Potential Dust Sources
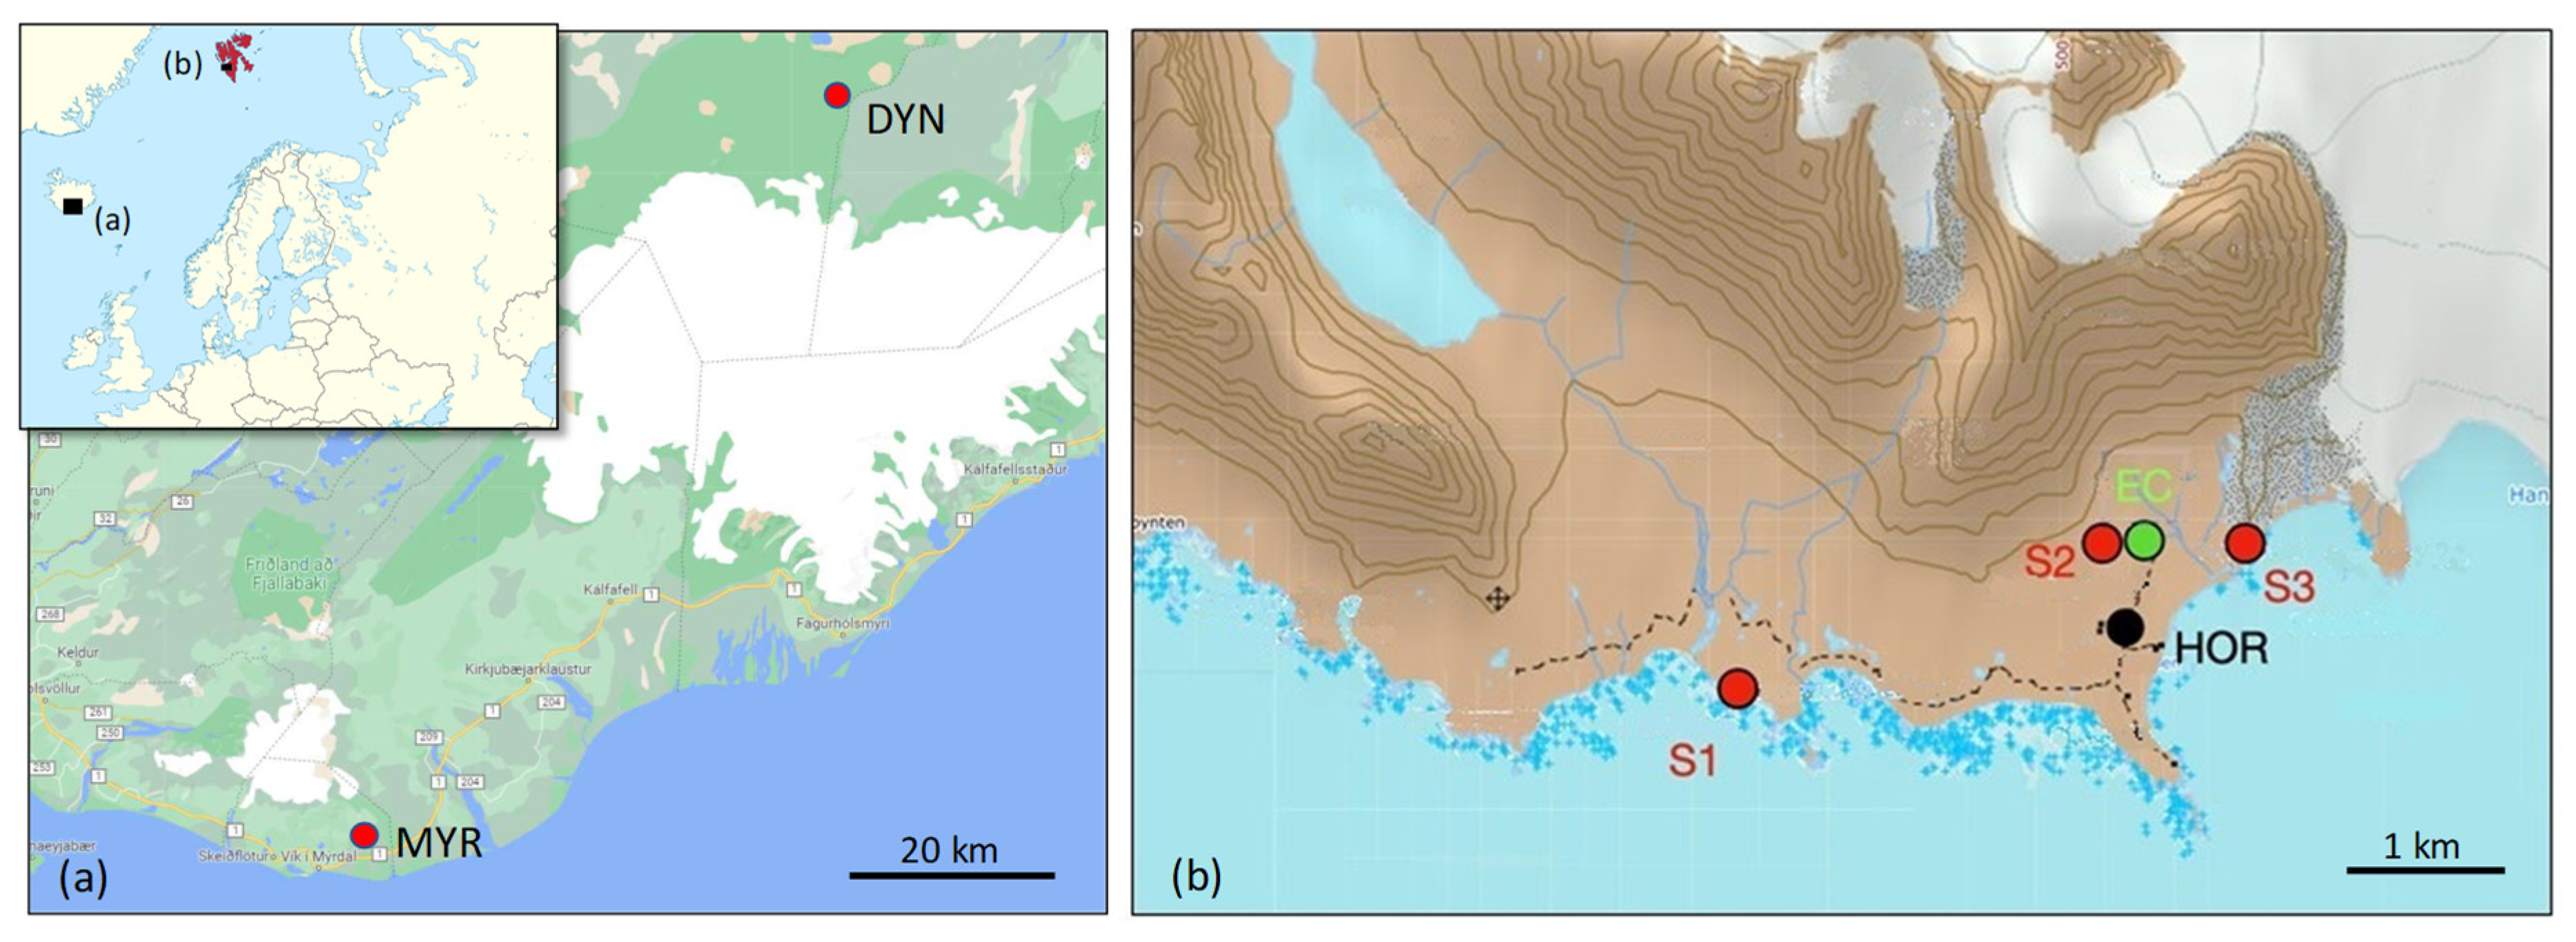
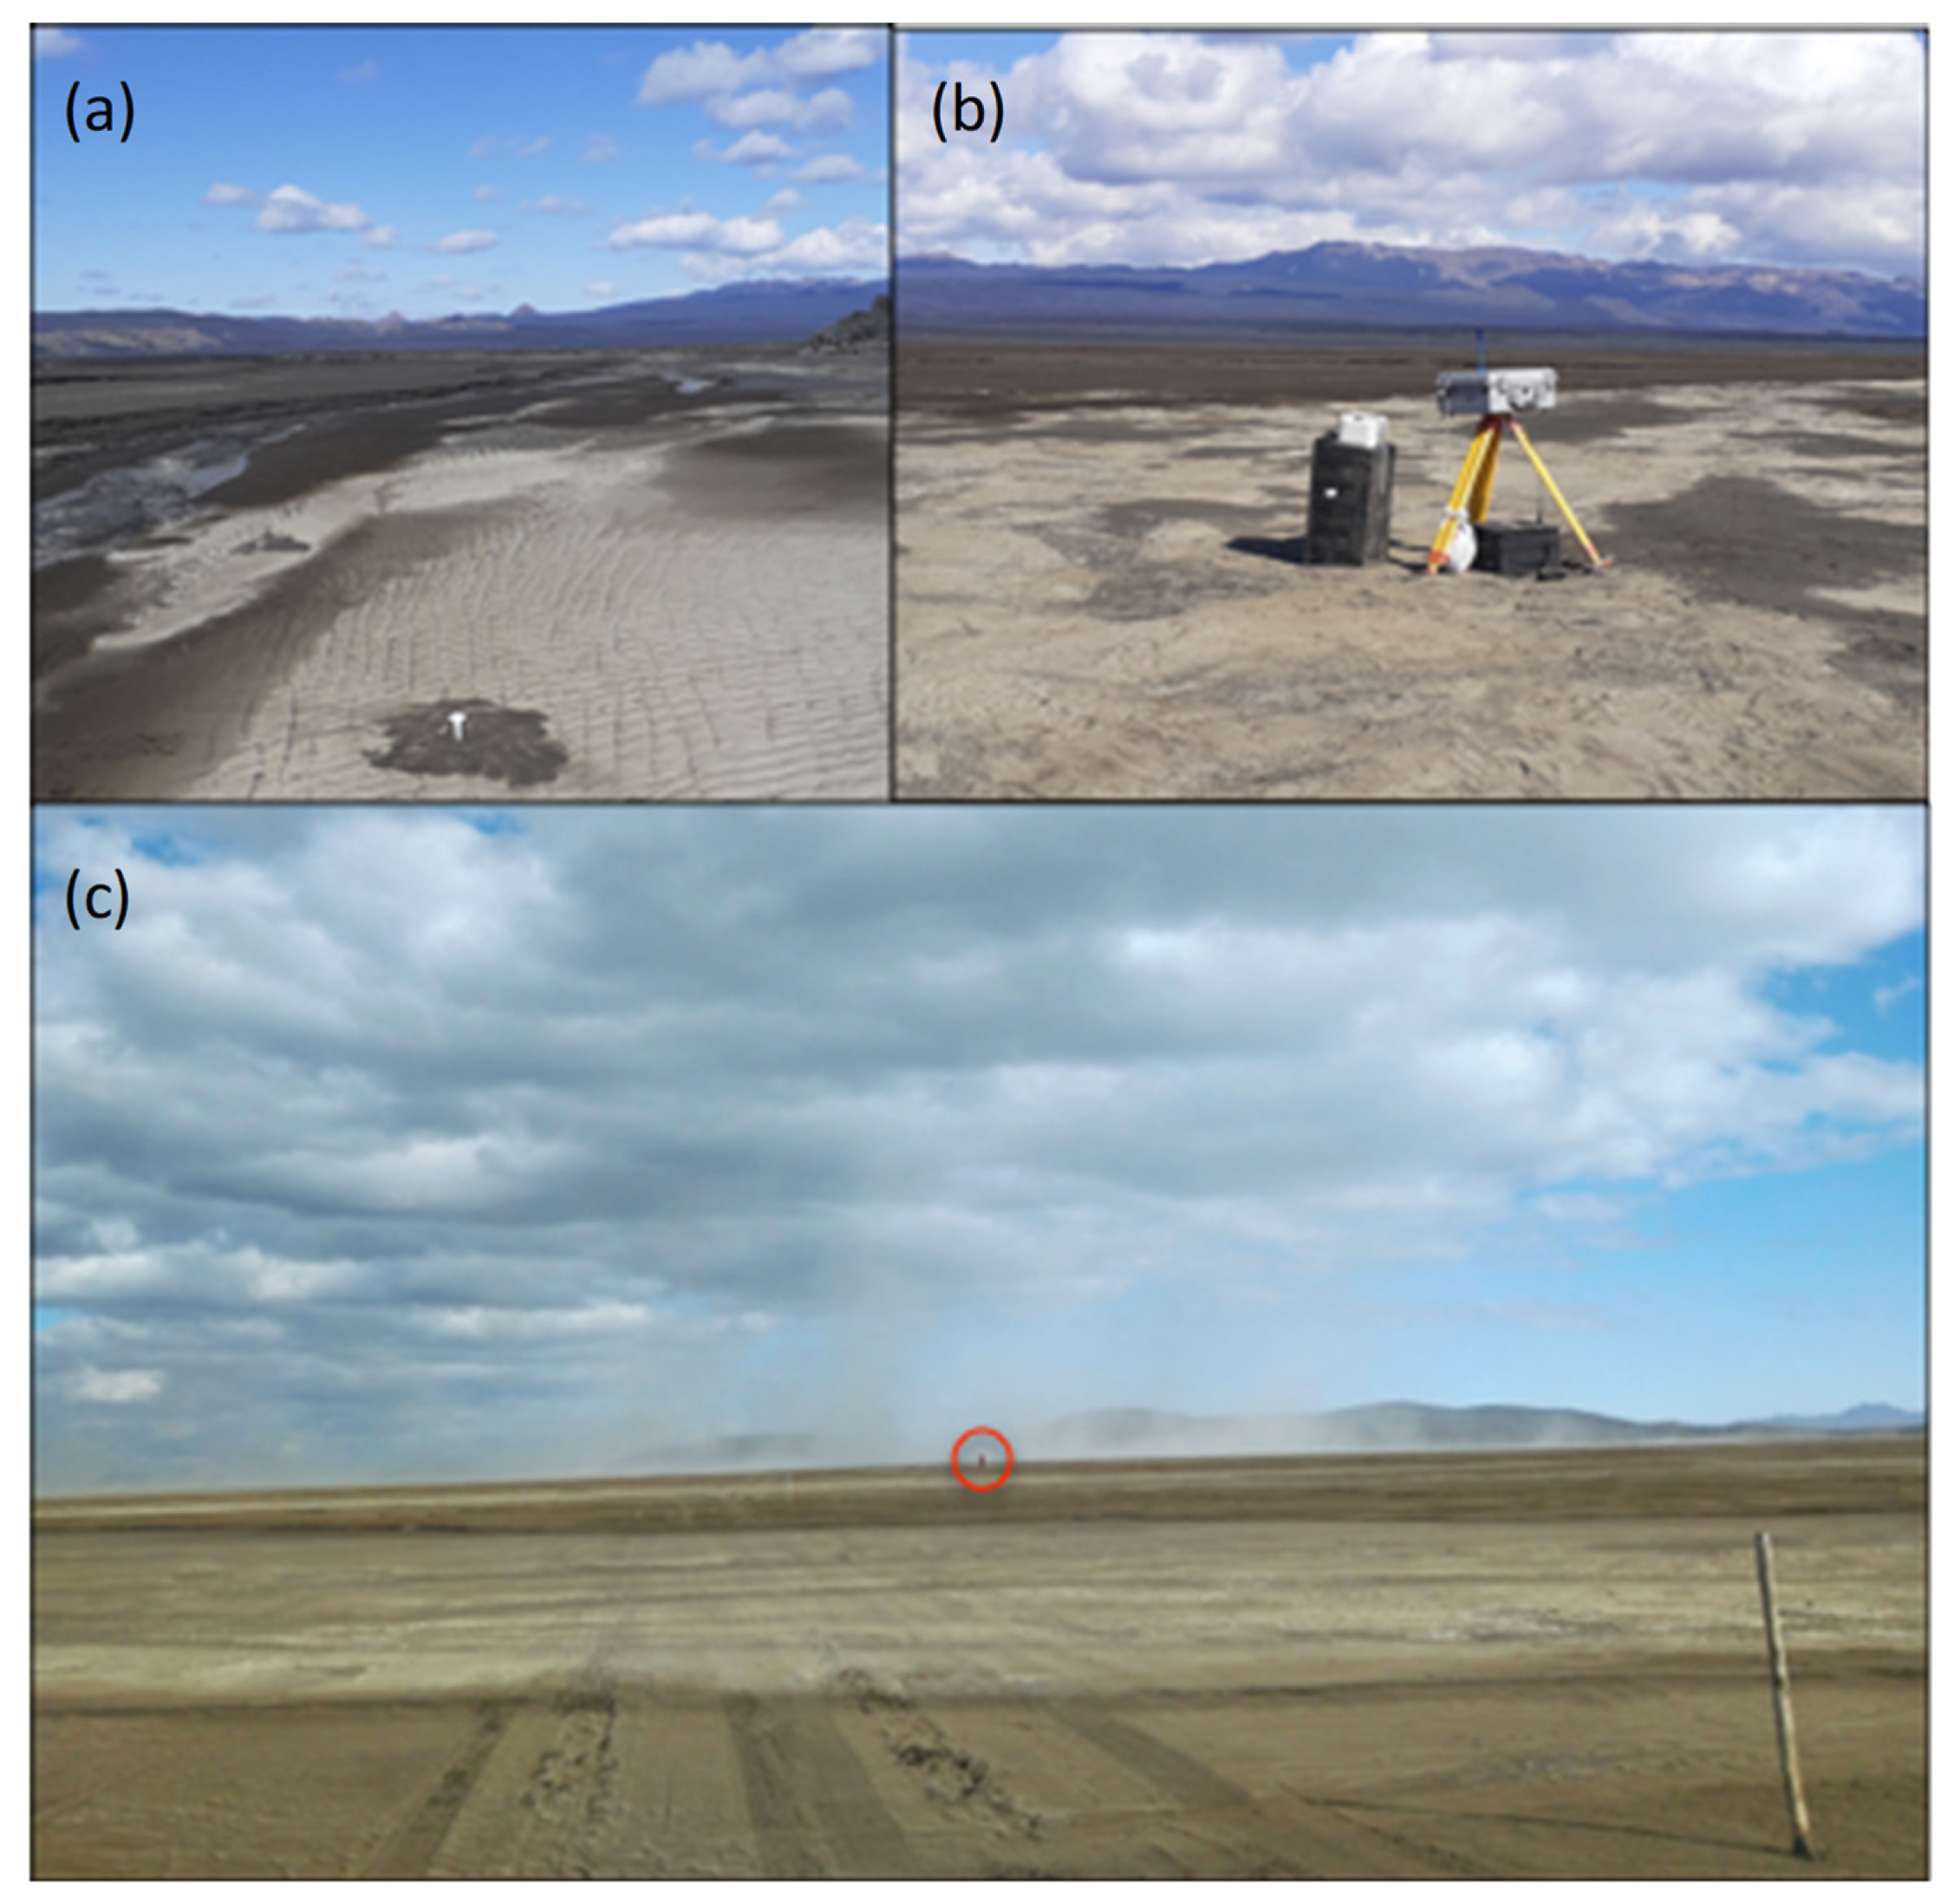
2.1.1. Dust Sources in Iceland
2.1.2. Dust Sources in the Hornsund Area
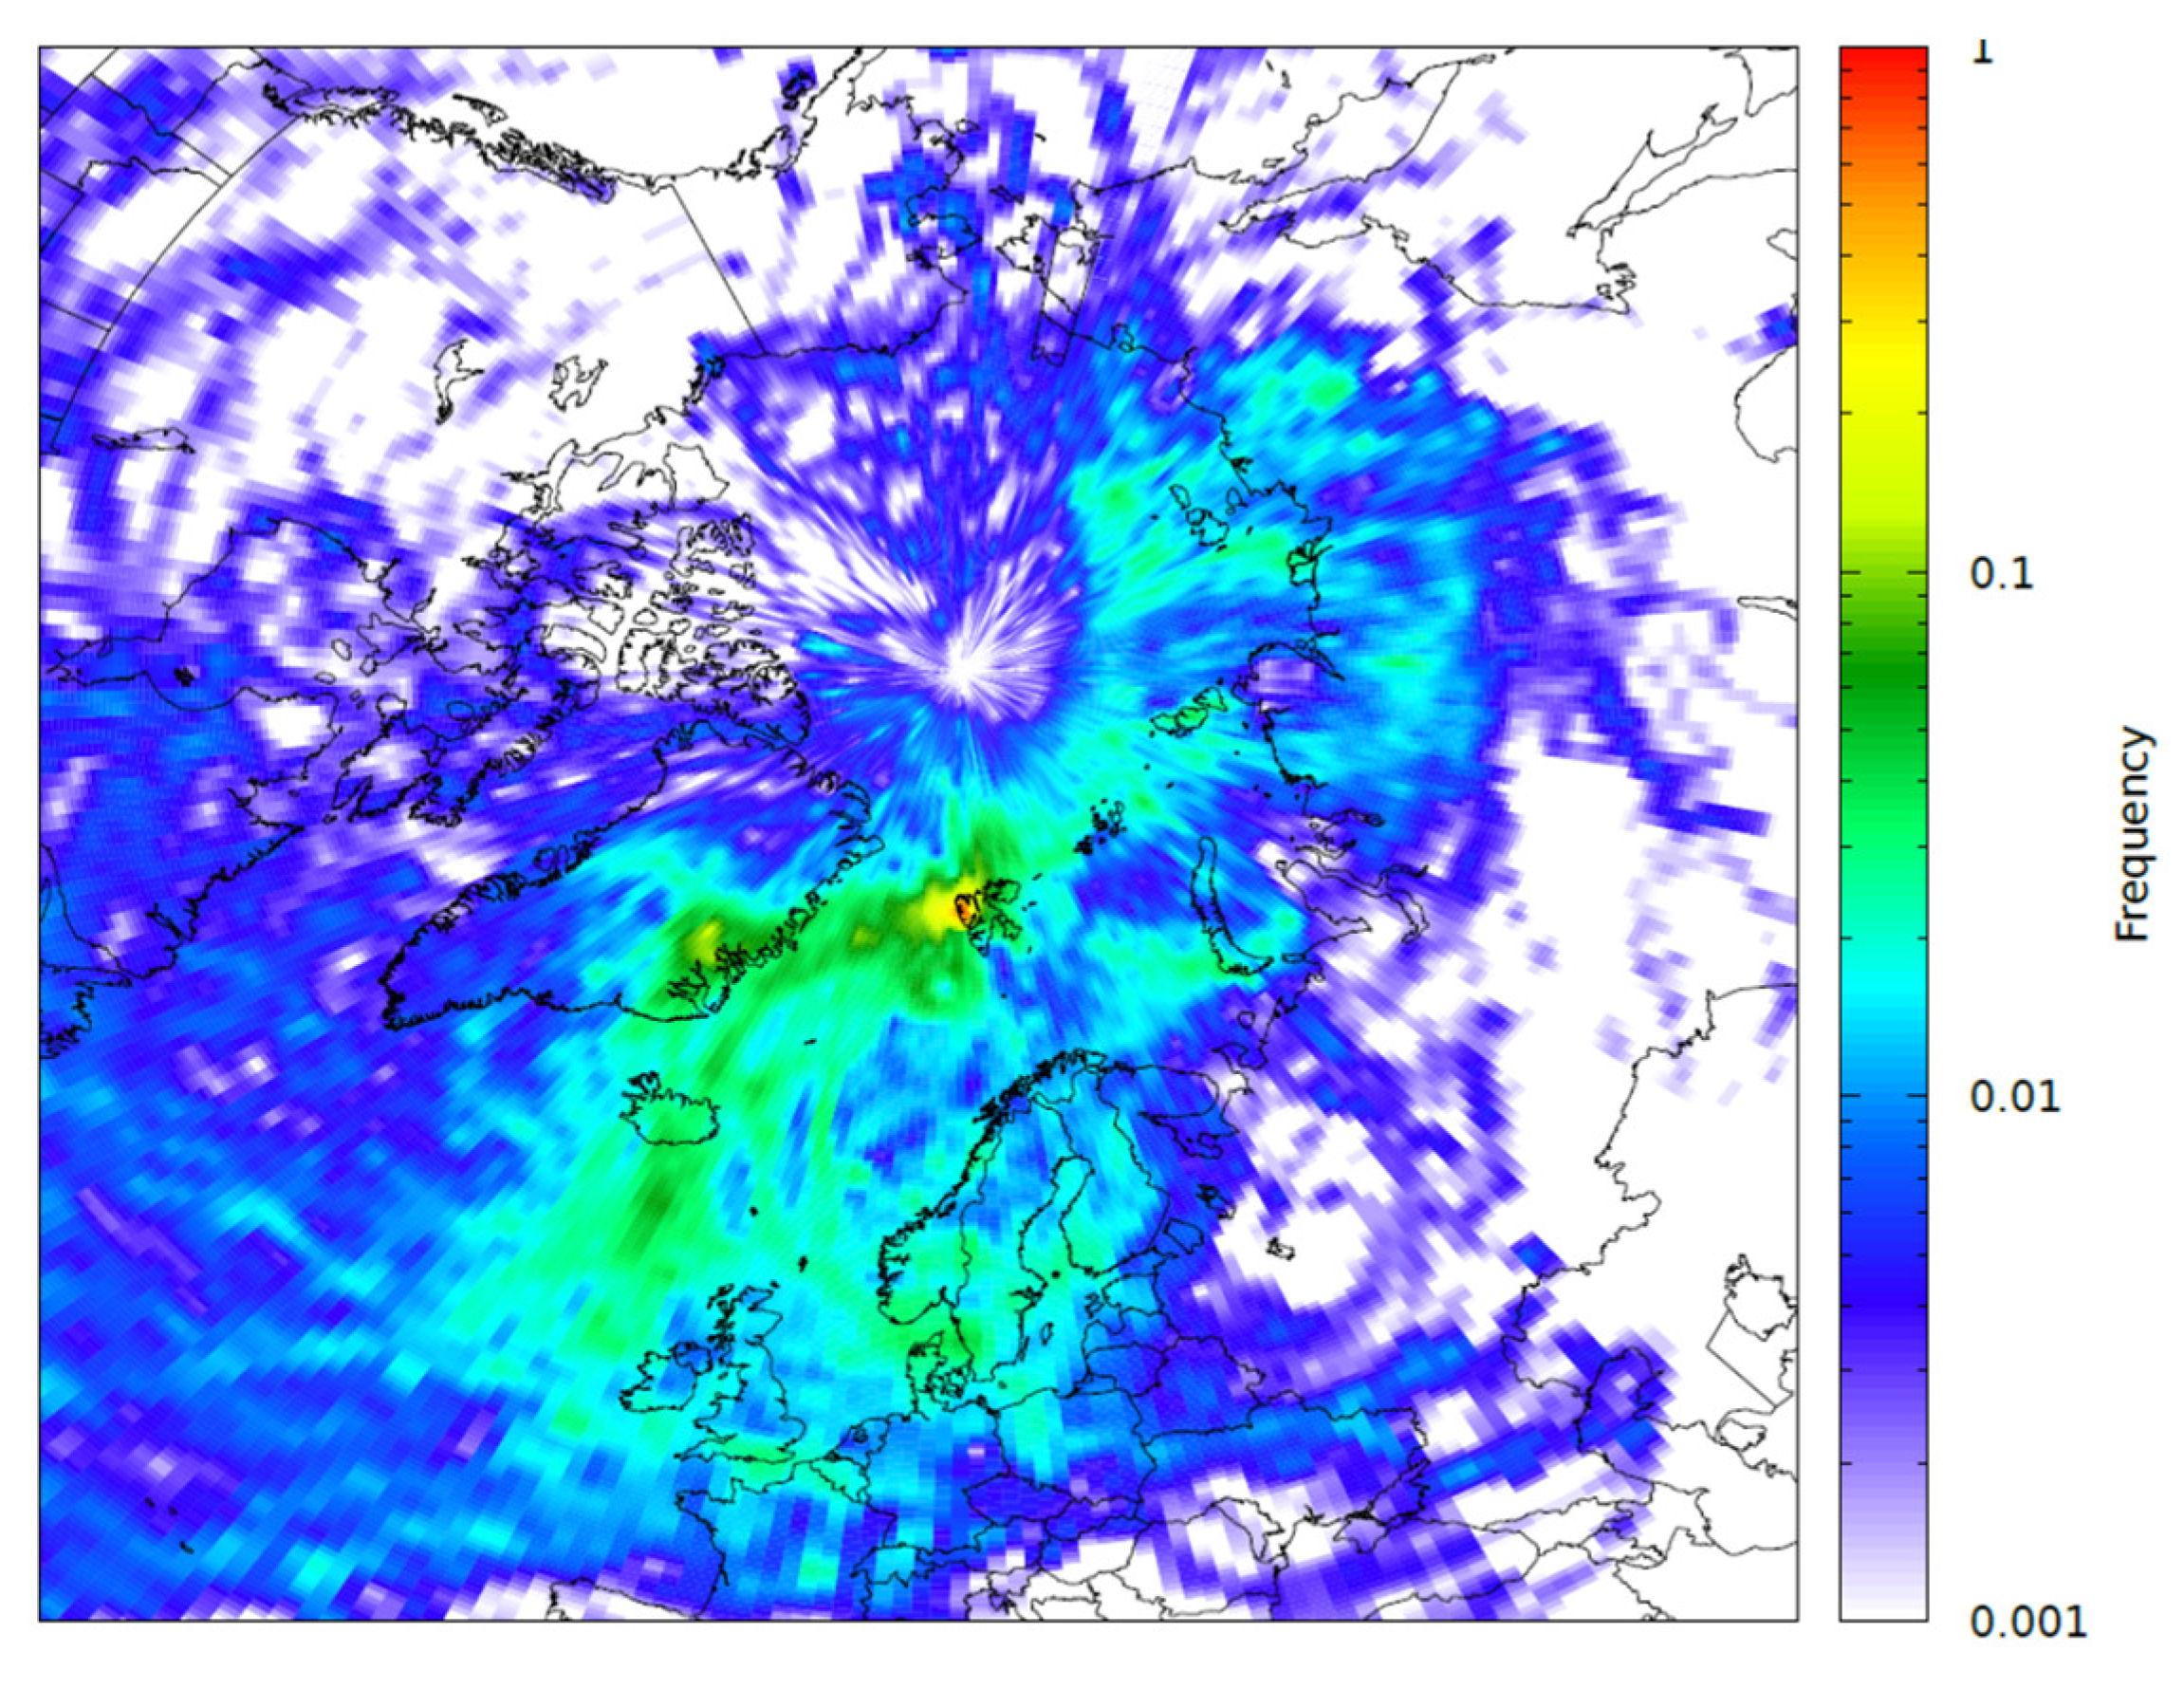
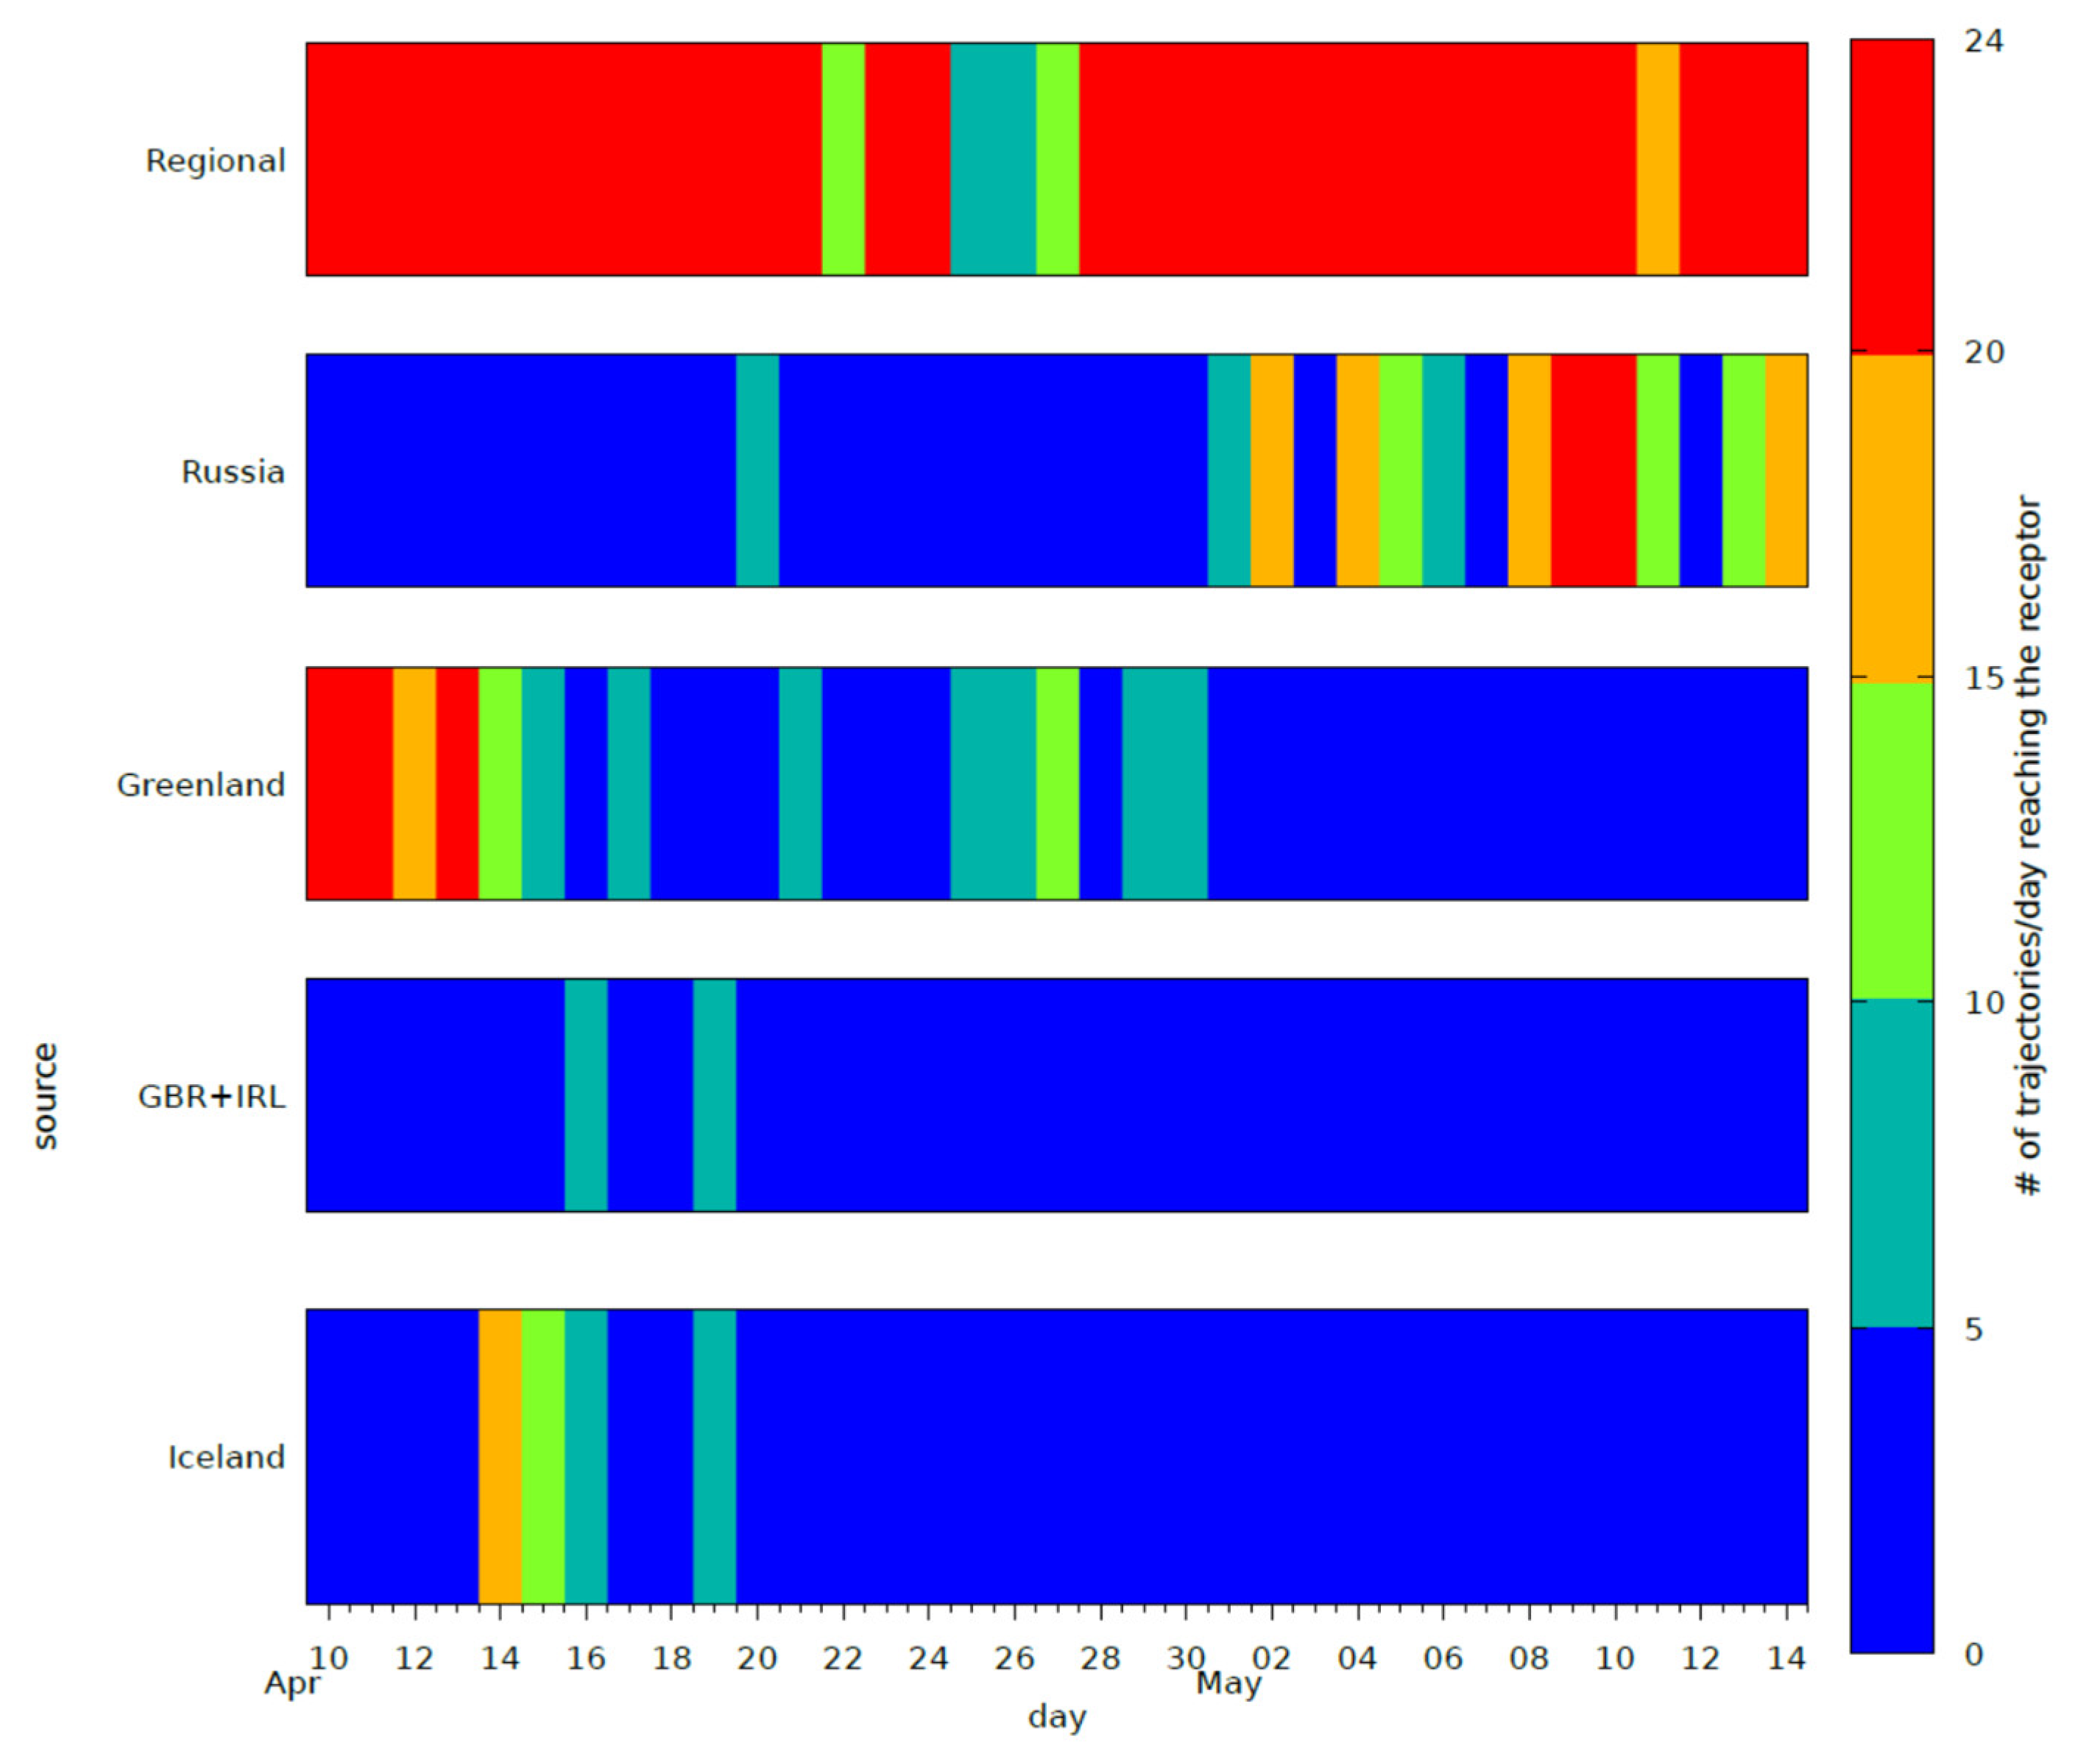
2.2. Air Mass Transport Modeling with Applications
2.3. Sampling
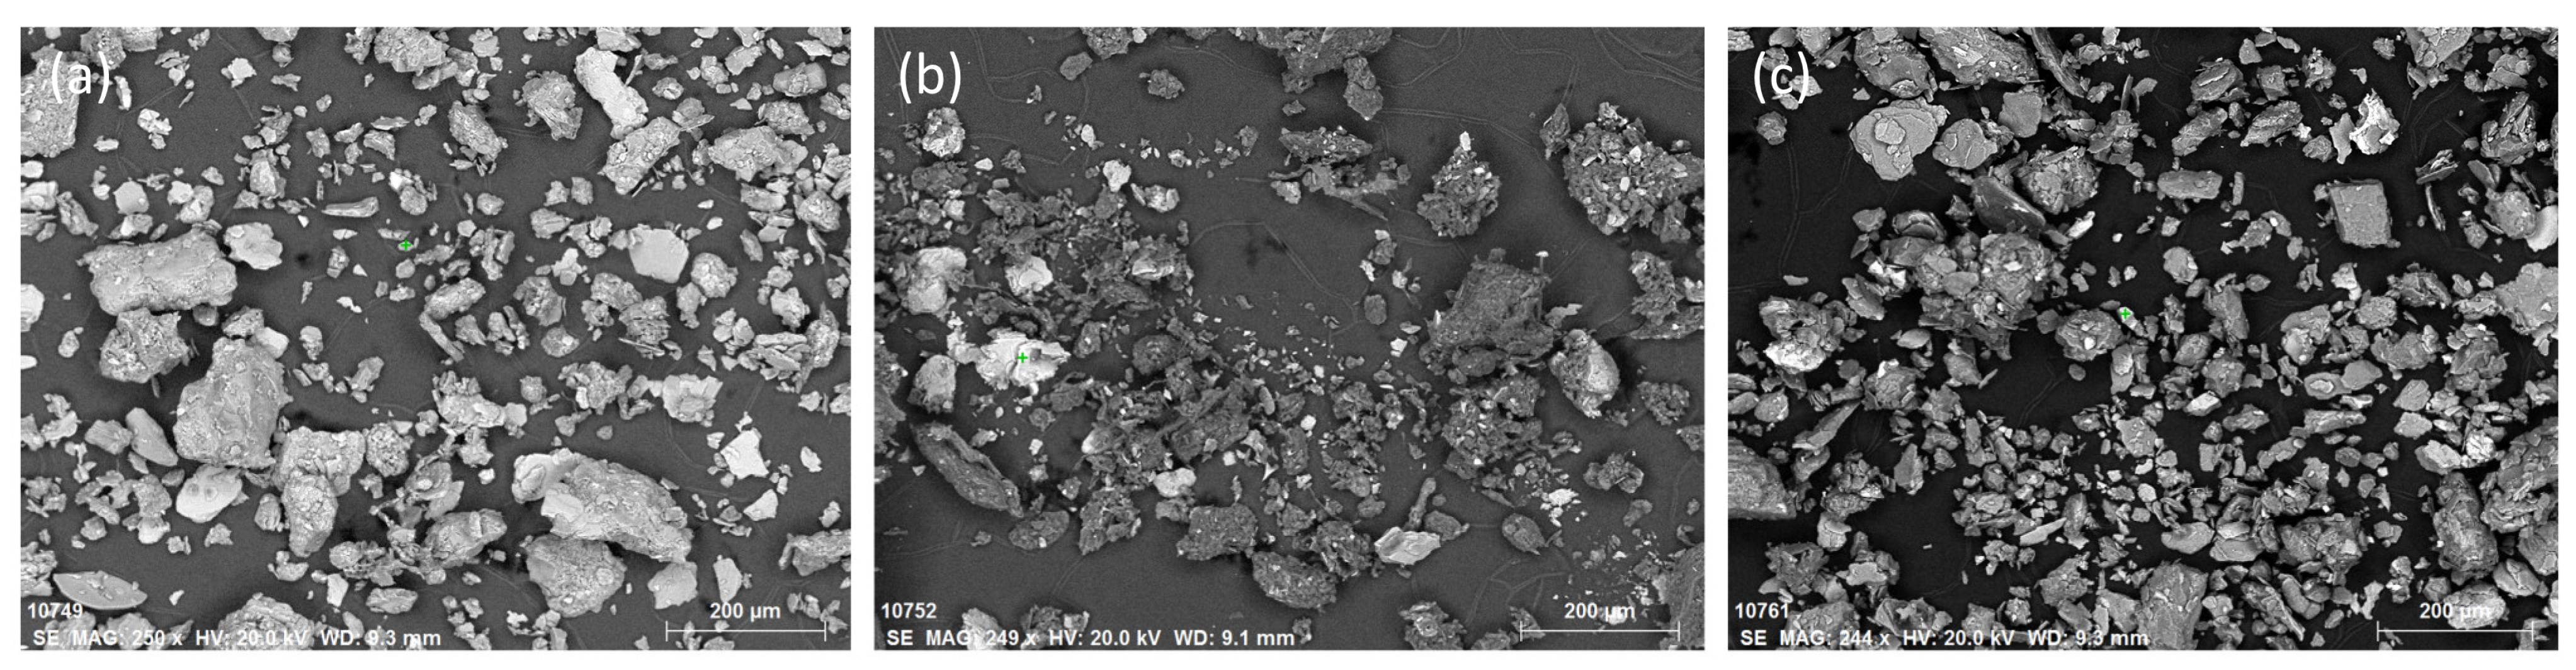
2.4. Scanning Electron Microscopy
3. Results and Discussion
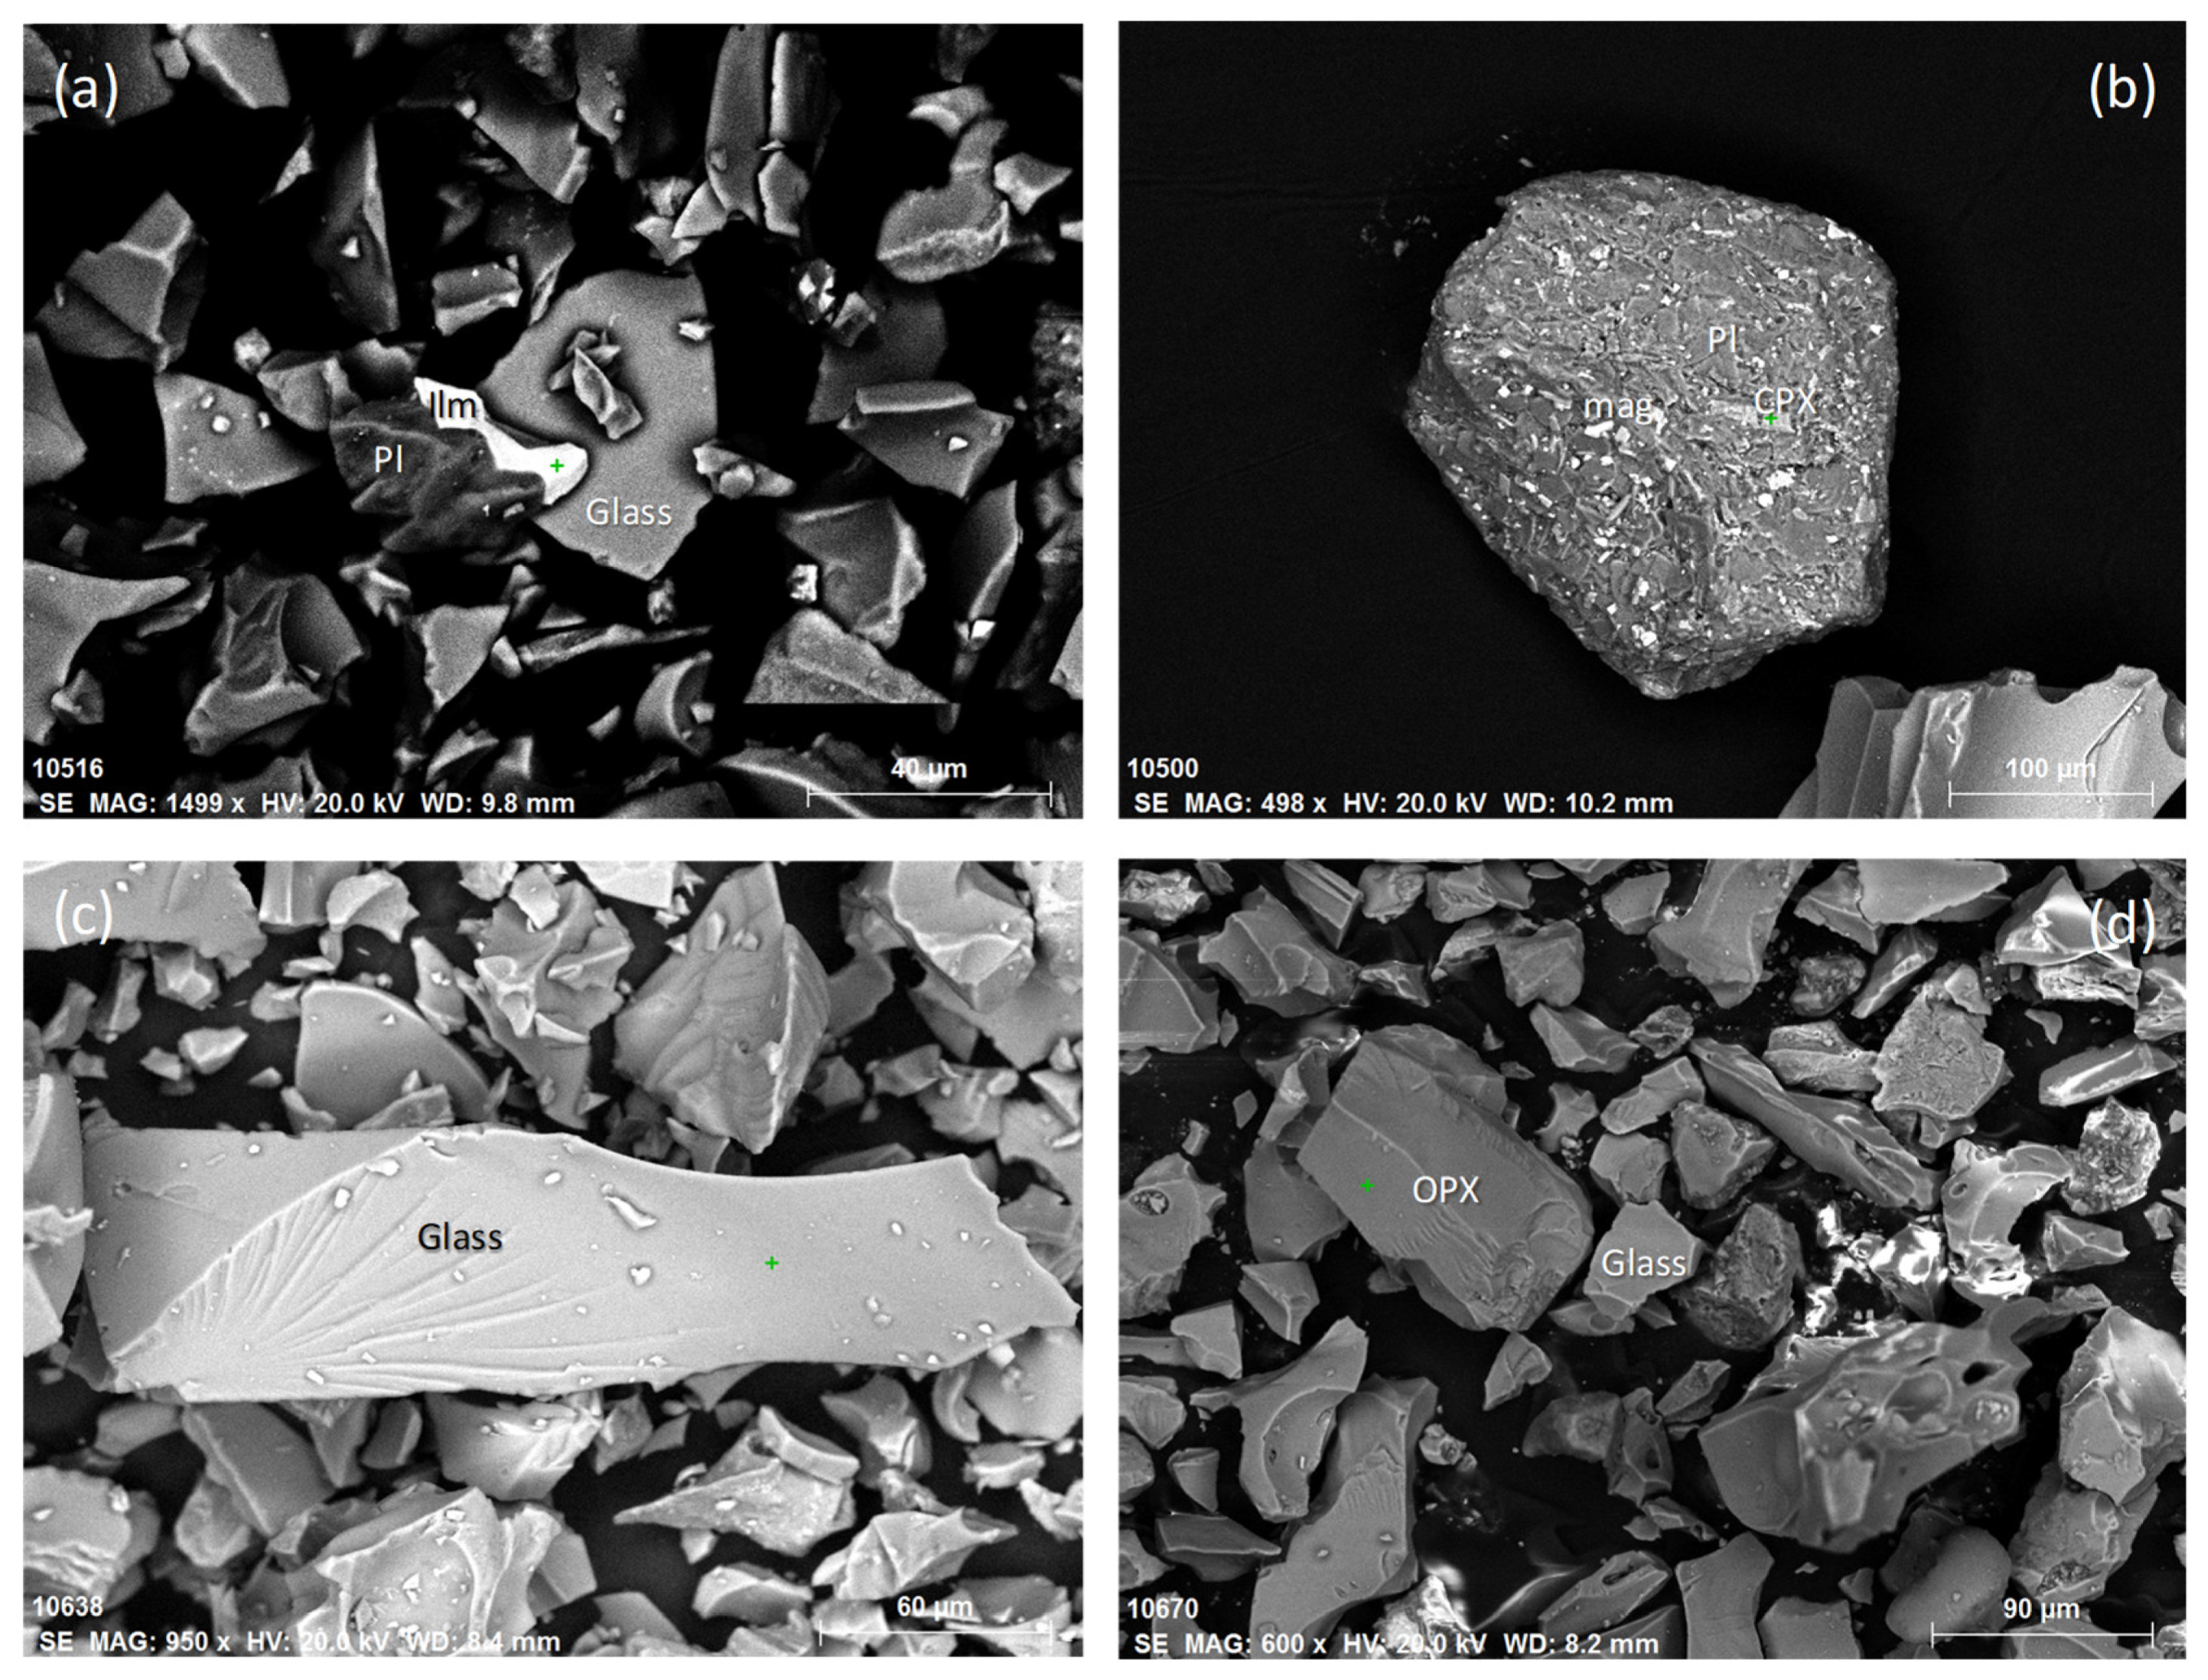
3.1. Characteristics of Sediment, Dust, and Aerosol Samples
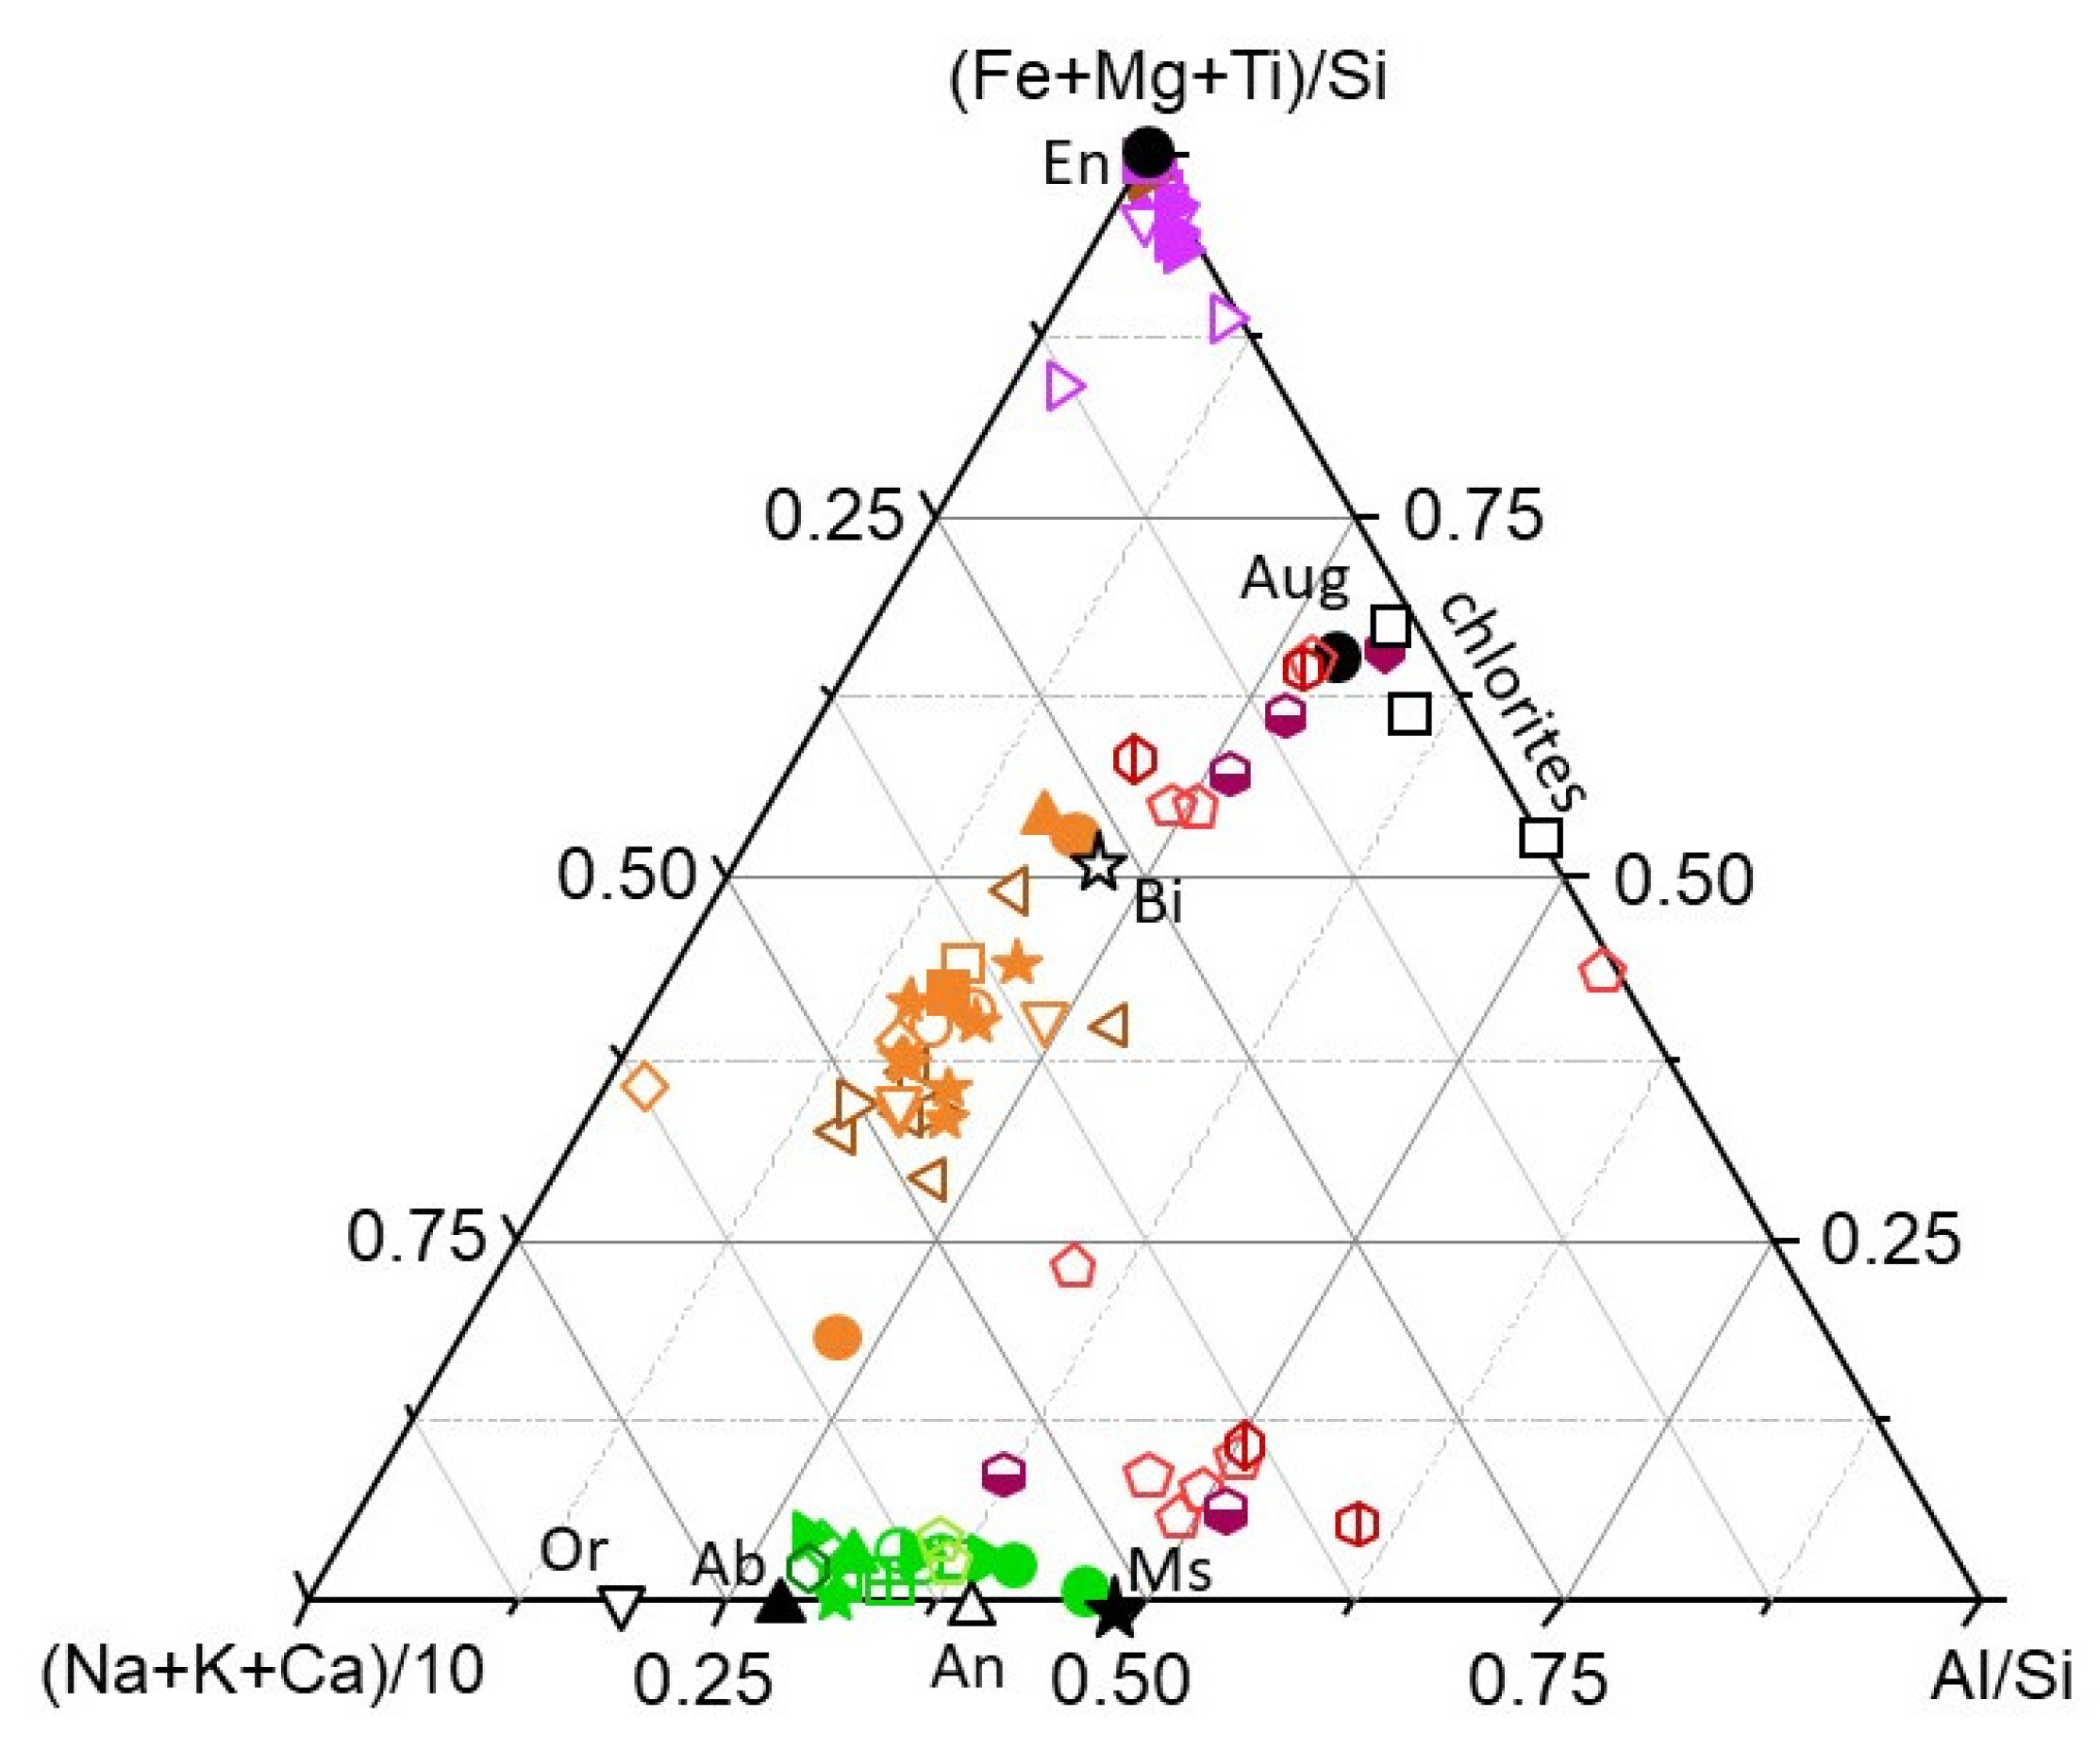
3.2. Comparing Aerosol Particles with Sediment Samples as Potential Source Material
3.3. Air Mass Transport to Hornsund and Dust Events in Iceland
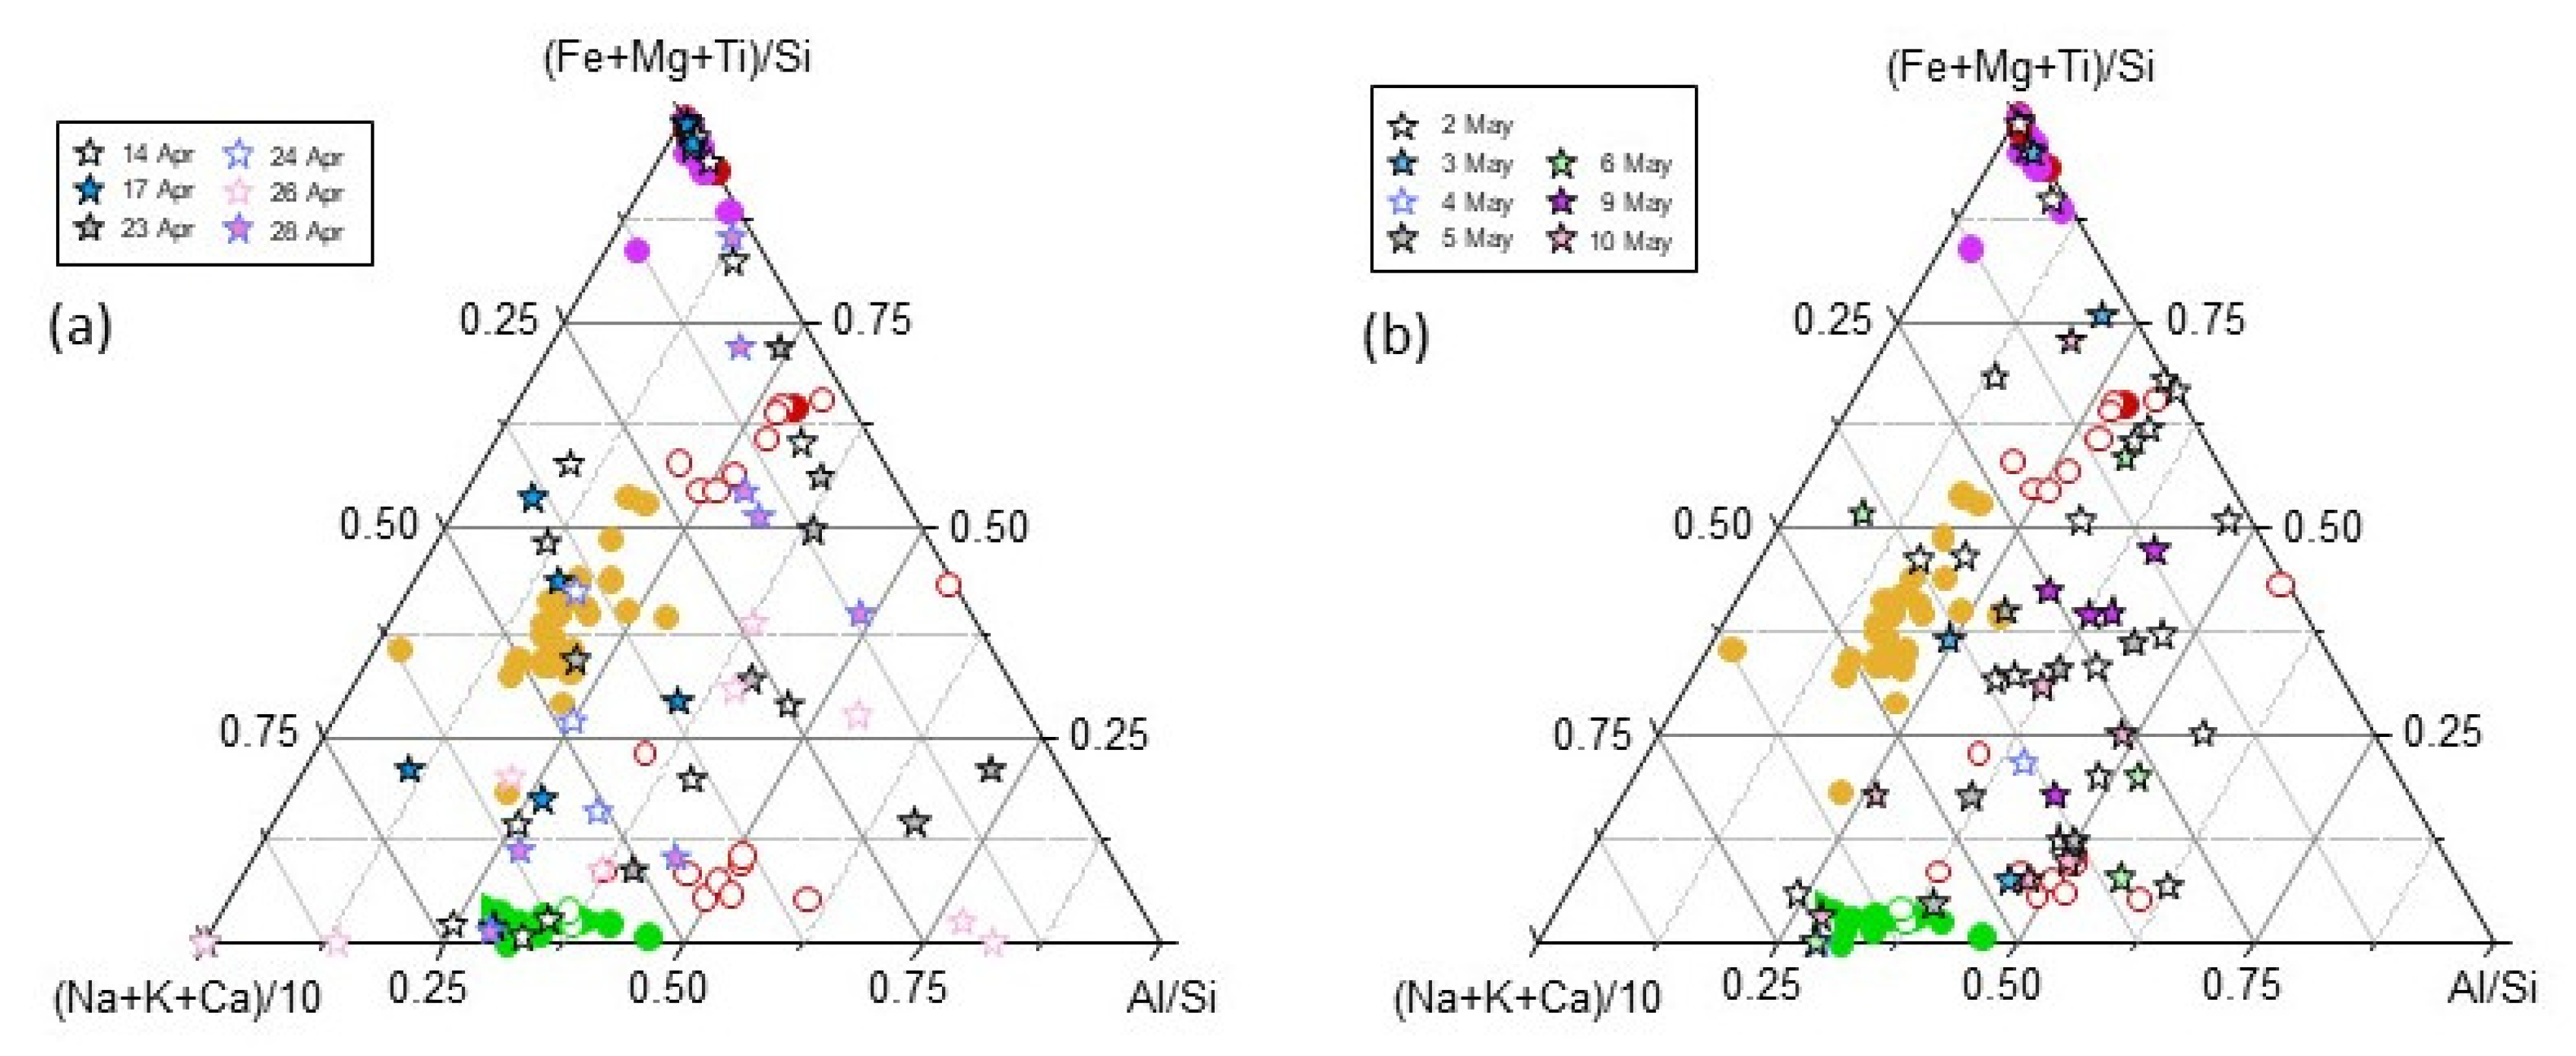
3.4. Markers of Icelandic Dust Arriving at Hornsund
4. Conclusions
Author Contributions
Funding
Institutional Review Board Statement
Informed Consent Statement
Data Availability Statement
Acknowledgments
Conflicts of Interest
References
- Meinander, O.; Dagsson-Waldhauserova, P.; Amosov, P.; Aseyeva, E.; Atkins, C. Newly identified climatically and environmentally significant high-latitude dust sources. Atmos. Chem. Phys. 2022, 22, 11889–11930. [Google Scholar] [CrossRef]
- Groot Zwaaftink, C.D.; Arnalds, O.; Dagsson-Waldhauserova, P.; Eckhardt, S.; Prospero, J.M.; Stohl, A. Temporal and spatial variability of Icelandic dust emission and atmospheric transport. Atmos. Chem. Phys. 2017, 17, 10865–10878. [Google Scholar] [CrossRef]
- Groot Zwaaftink, C.D.; Grythe, H.; Skov, H.; Stohl, A. Substantial contribution of northern high-latitude sources to mineral dust in the Arctic. J. Geophys. Res. Atmos. 2016, 121, 13678–13697. [Google Scholar] [CrossRef] [PubMed]
- Moroni, B.; Arnalds, O.; Dagsson-Waldhauserova, P.; Crocchianti, S.; Vivani, R.; Cappelletti, D. Mineralogical and chemical records of Icelandic dust sources upon Ny-Ålesund (Svalbard Islands). Front. Earth Sci. 2018, 6, 187. [Google Scholar] [CrossRef]
- IPCC. IPCC Special Report on the Ocean and Cryosphere in a Changing Climate; Pörtner, H.-O., Roberts, D.C., Masson-Delmotte, V., Zhai, P., Tignor, M., Poloczanska, E., Mintenbeck, K., Alegría, A., Nicolai, M., Okem, A., et al., Eds.; Cambridge University Press: Cambridge, UK; New York, NY, USA, 2019; 755p. [Google Scholar]
- Crocchianti, S.; Moroni, B.; Waldhauserová, P.D.; Becagli, S.; Severi, M.; Traversi, R.; Cappelletti, D. Potential source contribution function analysis of high latitude dust sources over the Arctic: Preliminary results and prospects. Atmosphere 2021, 12, 347. [Google Scholar] [CrossRef]
- Varga, G.; Dagsson-Waldhauserová, P.; Gresina, F.; Helgadottir, A. Saharan dust and giant quartz particle transport towards Iceland. Sci. Rep. 2021, 11, 11891. [Google Scholar] [CrossRef]
- Kylling, A.; Groot Zwaaftink, C.D.; Stohl, A. Mineral dust instantaneous radiative forcing in the Arctic. Geophys. Res. Lett. 2018, 45, 4290–4298. [Google Scholar] [CrossRef]
- Baldo, C.; Formenti, P.; Nowak, S.; Chevaillier, S.; Cazaunau, M.; Pangui, E.; Di Biagio, C.; Doussin, J.-F.; Ignatyev, K.; Dagsson-Waldhauserova, P.; et al. Distinct chemical and mineralogical composition of Icelandic dust compared to northern African and Asian dust. Atmos. Chem. Phys. 2020, 20, 13521–13539. [Google Scholar] [CrossRef]
- Boy, M.; Thomson, E.S.; Acosta Navarro, J.-C.; Arnalds, O.; Batchvarova, E.; Bäck, J.; Berninger, F.; Bilde, M.; Brasseur, Z.; Dagsson-Waldhauserova, P.; et al. Interactions between the atmosphere, cryosphere, and ecosystems at northern high latitudes. Atmos. Chem. Phys. 2019, 19, 2015–2061. [Google Scholar] [CrossRef]
- Kavan, J.; Stuchlík, R.; Hanáček, M.; Stringer, C.D.; Roman, M.; Holuša, J.; Dagsson-Waldhauserová, P.; Láska, K.; Nývlt, D.; Carrivick, J.L. Proglacial lake evolution coincident with glacier dynamics in the frontal zone of Kvíárjökull, south-east Iceland. Earth Surf. Process. Landf. 2024; accepted. [Google Scholar] [CrossRef]
- Arnalds, O.; Dagsson-Waldhauserová, P.; Olafsson, H. The Icelandic volcanic aeolian environment: Processes and impacts—A review. Aeolian Res. 2016, 20, 176–195. [Google Scholar] [CrossRef]
- Butwin, M.K.; von Löwis, S.; Pfeffer, M.; Thorsteinsson, T. The Effects of Volcanic Eruptions on the Frequency of Particulate Matter Suspension Events in Iceland. J. Aerosol Sci. 2019, 128, 99–113. [Google Scholar] [CrossRef]
- Dagsson-Waldhauserova, P.; Arnalds, O.; Olafsson, H. Long-term variability of dust events in Iceland. Atmos. Chem. Phys. 2014, 14, 13411–13422. [Google Scholar] [CrossRef]
- Nakashima, M.; Dagsson-Waldhauserová, P. A 60 year examination of dust day activity and its contributing factors from ten Icelandic weather stations from 1950 to 2009. Front. Earth Sci. 2019, 6, 245–252. [Google Scholar] [CrossRef]
- Dagsson-Waldhauserova, P.; Arnalds, O.; Olafsson, H.; Skrabalova, L.; Sigurdardottir, G.M.; Branis, M.; Hladil, J.; Skala, R.; Navratil, T.; Chadimova, L.; et al. Physical properties of suspended dust during moist and low-wind conditions in Iceland. Icel. Agric. Sci. 2014, 27, 25–39. [Google Scholar]
- Bullard, J.E. The distribution and biogeochemical importance of high-latitude dust in the Arctic and Southern Ocean-Antarctic regions. J. Geophys. Res. Atmos. 2016, 122, 3098–3103. [Google Scholar] [CrossRef]
- Baddock, M.C.; Mockford, T.; Bullard, J.E.; Thorsteinsson, T. Pathways of high-latitude dust in the North Atlantic. Earth Planet. Sci. Lett. 2017, 459, 170–182. [Google Scholar] [CrossRef]
- Moroni, B.; Becagli, S.; Bolzacchini, E.; Busetto, M.; Cappelletti, D.; Crocchianti, S.; Ferrero, L.; Frosini, D.; Lanconelli, C.; Lupi, A.; et al. Vertical profiles and chemical properties of aerosol particles upon Ny-Ålesund (Svalbard Islands). Adv. Meteorol. 2015, 2015, 292081. [Google Scholar] [CrossRef]
- Nawrot, A.P.; Migała, K.; Luks, B.; Pakszys, P.; Głowacki, P. Chemistry of snow cover and acidic snowfall during a season with a high level of air pollution on the Hans Glacier, Spitsbergen. Polar Sci. 2016, 10, 249–261. [Google Scholar] [CrossRef]
- Kavan, J.; Láska, K.; Nawrot, A.; Wawrzyniak, T. High Latitude Dust Transport Altitude Pattern Revealed from Deposition on Snow, Svalbard. Atmosphere 2020, 11, 1318. [Google Scholar] [CrossRef]
- Spolaor, A.; Moroni, B.; Luks, B.; Nawrot, A.; Roman, M.; Larose, C.; Stachnik, Ł.; Bruschi, F.; Kozioł, K.; Pawlak, F.; et al. Investigation on the sources and impact of trace elements in the annual snowpack and the firn in the Hansbreen (Southwest Spitsbergen). Front. Earth Sci. 2021, 8, 536036. [Google Scholar] [CrossRef]
- Koziol, K.; Uszczyk, A.; Pawlak, F.; Frankowski, M.; Polkowska, Z. Seasonal and Spatial Differences in Metal and Metalloid Concentrations in the Snow Cover of Hansbreen, Svalbard. Front. Earth Sci. 2021, 8, 538762. [Google Scholar] [CrossRef]
- Cappelletti, D.; Ežerinskis, Ž.; Šapolaitė, J.; Bučinskas, L.; Luks, B.; Nawrot, A.; Larose, C.; Tuccella, P.; Gallet, J.C.; Crocchianti, S.; et al. Long-range transport and deposition on the Arctic snowpack of nuclear contaminated particulate matter. J. Hazard Mater. 2023, 452, 131317. [Google Scholar] [CrossRef]
- Karasiński, G.; Posyniak, M.; Bloch, M.; Sobolewski, P.; Małarzewski, Ł.; Soroka, J. Lidar Observations of Volcanic Dust over Polish Polar Station at Hornsund after Eruptions of Eyjafjallajökull and Grímsvötn. Acta Geophys. 2014, 62, 316–339. [Google Scholar] [CrossRef]
- Burakowska, A.; Kubicki, M.; Mysłek-Laurikainen, B.; Piotrowski, M.; Trzaskowska, H.; Sosnowiec, R. Concentration of 7Be, 210Pb, 40 K, 137Cs, 134Cs radionuclides in the ground layer of the atmosphere in the polar (Hornsund, Spitsbergen) and mid-latitudes (Otwock-Świder, Poland) regions. J. Environ. Radioact. 2021, 240, 106739. [Google Scholar] [CrossRef] [PubMed]
- Kępski, D.; Luks, B.; Migała, K.; Wawrzyniak, T.; Westermann, S.; Wojtuń, B. Terrestrial Remote Sensing of Snowmelt in a Diverse High-Arctic Tundra Environment Using Time-Lapse Imagery. Remote Sens. 2017, 9, 733. [Google Scholar] [CrossRef]
- Đorđević, D.; Tošić, I.; Sakan, S.; Petrović, S.; Đuričić-Milanković, J.; Finger, D.C.; Dagsson-Waldhauserová, P. Can Volcanic Dust Suspended From Surface Soil and Deserts of Iceland Be Transferred to Central Balkan Similarly to African Dust (Sahara)? Front. Earth Sci. 2019, 7, 142–154. [Google Scholar] [CrossRef]
- Baratoux, D.; Mangold, N.; Arnalds, O.; Bardintzeff, J.-M.; Platevoet, B.; Grégorie, M.; Pinet, P. Volcanic sands of Iceland—Diverse origins of aeolian sand deposits revealed at Dyngjusandur and Lambahraun. Earth Surf. Proc. Land. 2011, 36, 1789–1808. [Google Scholar] [CrossRef]
- Birkenmajer, K. Geology of the Hornsund Area, Spitsbergen. Map 1:75000 and Explanations; Uniwersytet Śląski: Katowice, Poland, 1990. [Google Scholar]
- Birkenmajer, K. Precambrian succession at Hornsund, south Spitsbergen: A lithostratigraphic guide. Studia Geol. Pol. 1992, 98, 7–66. [Google Scholar]
- Majka, J.; Mazur, S.; Manecki, M.; Czerny, J.; Holm, D. Late Neoproterozoic amphibolite-facies metamorphism of a pre-Caledonian basement block in southwest Wedel Jarlsberg Land, Spitsbergen: New evidence from U–Th–Pb dating of monazite. Geol. Mag. 2008, 145, 822–830. [Google Scholar] [CrossRef]
- Majka, J.; Czerny, J.; Mazur, S.; Holm, D.K.; Manecki, M. Neoproterozoic metamorphic evolution of the Isbjørnhamna Group rocks from south-western Svalbard. Polar Res. 2010, 29, 250–264. [Google Scholar] [CrossRef]
- Czerny, J.; Kieres, A.; Manecki, M.; Rajchel, J. Geological Map of the SW Part of Wedel Jarlsberg Land, Spitsbergen 1:25000; Manecki, A., Ed.; Institute of Geology and Mineral Deposits, University of Mining and Metallurgy: Cracow, Poland, 1993; pp. 1–61. [Google Scholar]
- Stein, A.F.; Draxler, R.R.; Rolph, G.D.; Stunder, B.J.B.; Cohen, M.D.; Ngan, F. NOAA’s HYSPLIT Atmospheric Transport and Dispersion Modeling System. Bull. Am. Meteorol. Soc. 2015, 96, 2059–2077. [Google Scholar] [CrossRef]
- Moroni, B. Morphochemical Characteristics and Mixing State of Icelandic Dust. Scientific Report. COST Project Action Number: CA16202 STSM. 2020. Available online: https://earth.bsc.es/indust/lib/exe/fetch.php?media=public:stsm-scientific-report_moroni_rev.pdf (accessed on 10 October 2023).


| Sample | Latitude | Longitude | Type/Sampling Time |
|---|---|---|---|
| MYR 1 | 63°29′20.2″ N | 018°46′47.1″ W | dust/273 min |
| MYR 1a | 63°29′20.2″ N | 018°46′47.1″ W | Sediment |
| MYR 1b | 63°29′20.2″ N | 018°46′47.1″ W | Sediment |
| MYR 1d | 63°29′20.2″ N | 018°46′47.1″ W | dust/273 min |
| MYR 2 | 63°30′53.0″ N | 018°39′51.8″ W | dust/35 min |
| DYN 1–5 | 64°54′8.3″ N | 016°39′4.15″ W | Sediment |
| DYN 5b | 64°54′8.3″ N | 016°39′4.15″ W | dust/30 min |
| DYN 6 | 64°54′8.3″ N | 016°39′4.15″ W | dust/30 min |
| S 1 | 76°59′53.9″ N | 015°27′56.2″ E | Sediment |
| S 2 | 77°00′13.5″ N | 015°32′37.7″ E | Sediment |
| S 3 | 77°00′17.4″ N | 015°33′34.0″ E | Sediment |
| HOR 1–13 | 77°00′20.9′’ N | 015°32′46.5′’ E | aerosol * |
| Sample Name | Sampler Start (UTC) | Sampler Stop (UTC) | Air Volume (m3) | ||
|---|---|---|---|---|---|
| HOR 1 | 14 April | 17:15 | 15 April | unknown | 1.00 |
| HOR 2 | 17 April | 9:13 | 17 April | 17:13 | 5.61 |
| HOR 3 | 23 April | 12:40 | 23 April | 20:40 | 4.17 |
| HOR 4 | 24 April | 20:00 | 25 April | 8:00 | 8.91 |
| HOR 5 | 26 April | 17:00 | 27 April | 5:00 | 6.42 |
| HOR 6 | 28 April | 17:45 | 29 April | 8:45 | 5.86 |
| HOR 7 | 2 May | 16:30 | 3 May | 7:30 | 13.4 |
| HOR 8 | 3 May | 17:00 | 4 May | 17:00 | 21.5 |
| HOR 9 | 4 May | 21:10 | 5 May | 21:10 | 11.5 |
| HOR 10 | 5 May | 21:55 | 6 May | 21:55 | 21.5 |
| HOR 11 | 6 May | 23:55 | 8 May | 00:25 | 11.1 |
| HOR 12 | 9 May | 1:37 | 10 May | 2:16 | 21.3 |
| HOR 13 | 10 May | 9:35 | 11 May | 9:35 | 10.7 |
| (a) | ||||||||||||
|---|---|---|---|---|---|---|---|---|---|---|---|---|
| SAMPLE label | M1a 10516b | D6 10688 | M1a 10516a | M1 10463 | M1d 10505a | M1a 10516 | M1a 10523 | D6 10695c | S1 10743d | S1 10743c | S2 10757 | S3 10773 |
| Type | glass | glass | plagioclase | enstatite | augite | metal oxide | metal oxide | titanite | biotite | plagioclase | plagioclase | chlorite |
| Oxygen | 48.48 | 51.30 | 50.54 | 60.92 | 45.64 | 12.64 | 21.05 | 60.81 | 46.87 | 49.66 | 53,10 | 52.28 |
| Sodium | 2.78 | 2.56 | 4.39 | 0.00 | 0.35 | 0.07 | 0.67 | 0.00 | 0.82 | 4.80 | 10.12 | 0.94 |
| Magnesium | 3.55 | 2.61 | 0.37 | 17.62 | 7.64 | 0.44 | 1.63 | 0.54 | 6.88 | 0.61 | 0.40 | 6.68 |
| Aluminium | 7.09 | 7.86 | 14.95 | 1.28 | 0.82 | 1.82 | 1.87 | 1.76 | 9.94 | 15.81 | 10.40 | 12.21 |
| Silicon | 17.84 | 20.53 | 20.43 | 19.12 | 18.81 | 2.90 | 4.22 | 8.26 | 14.61 | 21.12 | 25.08 | 8.91 |
| Phosphorus | 0.22 | 0.14 | 0.00 | 0.00 | 0.00 | 0.00 | 0.03 | 0.00 | 0.00 | 0.09 | 0.08 | 0.00 |
| Sulfur | 0.00 | 0.00 | 0.00 | 0.00 | 0.00 | 0.00 | 0.00 | 0.00 | 0.00 | 0.07 | 0.10 | 0.00 |
| Potassium | 0.46 | 0.44 | 0.24 | 0.00 | 0.00 | 0.04 | 0.12 | 0.00 | 4.39 | 0.31 | 0.34 | 0.20 |
| Calcium | 6.67 | 5.04 | 8.11 | 0.00 | 11.15 | 0.57 | 1.14 | 13.23 | 0.68 | 7.06 | 0.00 | 0.00 |
| Titanium | 2.45 | 1.43 | 0.09 | 0.00 | 0.61 | 15.26 | 29.47 | 13.63 | 0.99 | 0.00 | 0.00 | 0.00 |
| Iron | 10.45 | 8.10 | 0.89 | 1.06 | 14.98 | 66.27 | 39.79 | 1.78 | 14.71 | 0.47 | 0.38 | 18.77 |
| (b) | ||||||||||||
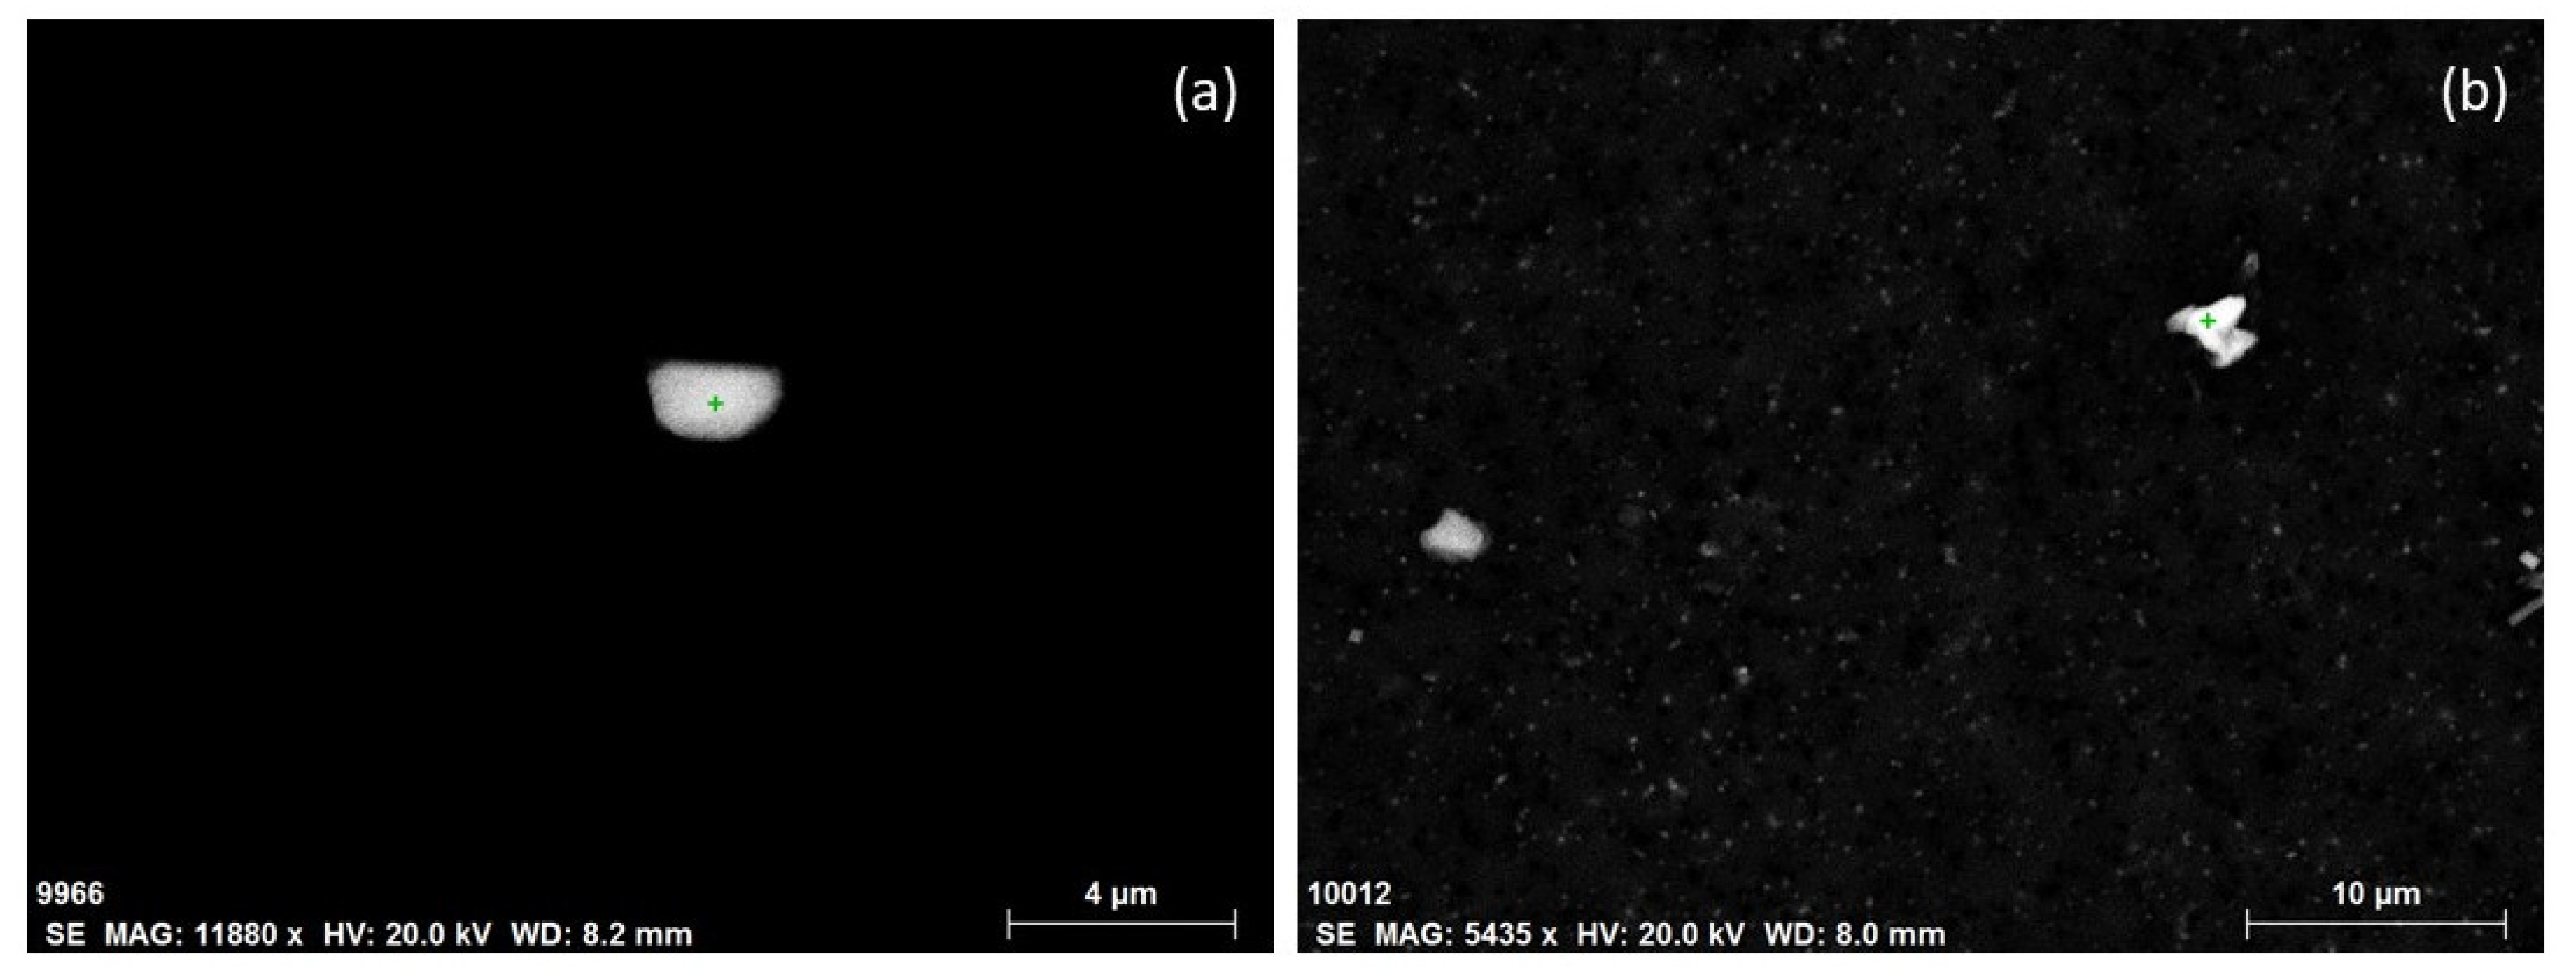
| SAMPLE label | HOR 1 9989 | HOR 1 9966 | HOR 1 9970 | HOR 2 10012 | HOR 2 10003a | HOR 3 10104 | HOR 3 10107a | HOR 6 10165 | HOR 7 10181 | HOR 10 10263a | HOR 11 10277 | HOR 13 10406 |
| Type | chlorite | Pyroxene (?) | plagioclase | Glass (?) | Pyroxene (?) | biotite | chlorite | muscovite | chlorite | feldspar | plagioclase | muscovite |
| Oxygen | 61.38 | 55.97 | 47.56 | 53.86 | 47.53 | 52.20 | 55.02 | 48.18 | 51.15 | 52.30 | 52.83 | 58.82 |
| Sodium | 2.37 | 2.12 | 7.66 | 6.17 | 0.00 | 0.00 | 0.96 | 0.00 | 1.63 | 0.72 | 10.25 | 2.48 |
| Magnesium | 11.27 | 10.22 | 0.00 | 8.86 | 6.28 | 2.97 | 6.07 | 1.44 | 2.72 | 1.75 | 0.00 | 0.76 |
| Aluminium | 9.58 | 3.88 | 13.89 | 5.42 | 3.36 | 8.12 | 11.92 | 18.69 | 17.11 | 7.85 | 11.06 | 8.63 |
| Silicon | 8.28 | 14.78 | 26.63 | 13.08 | 13.31 | 24.23 | 12.54 | 19.47 | 13.74 | 33.07 | 25.33 | 20.57 |
| Phosphorus | 0.00 | 0.00 | 0.00 | 0.24 | 0.00 | 0.00 | 0.00 | 0.00 | 0.00 | 0.00 | 0.00 | 0.00 |
| Sulfur | 0.00 | 0.00 | 0.00 | 0.11 | 0.00 | 0.00 | 0.00 | 0.00 | 0.15 | 0.00 | 0.13 | 0.19 |
| Potassium | 0.33 | 0.16 | 0.33 | 0.33 | 0.84 | 2.57 | 0.00 | 9.30 | 2.67 | 2.26 | 0.00 | 7.81 |
| Calcium | 0.00 | 6.82 | 3.92 | 5.12 | 10.68 | 0.00 | 1.00 | 0.00 | 0.00 | 0.00 | 0.41 | 0.00 |
| Titanium | 0.00 | 0.00 | 0.00 | 0.00 | 0.53 | 0.75 | 0.21 | 0.40 | 0.00 | 0.24 | 0.00 | 0.00 |
| Iron | 6.80 | 6.05 | 0.00 | 6.81 | 17.47 | 9.16 | 12.28 | 2.45 | 10.82 | 1.80 | 0.00 | 0.22 |
| Sample | Mineral/Phase |
|---|---|
| HOR 1 | Plagioclase, alkali feldspar, quartz, rutile, baryte, Mg-Ca-Fe silicate, mica, iron oxide, chlorite, dolomite, titanite |
| HOR 2 | Chlorite, dolomite, plagioclase, iron oxide, Mg-Ca-Fe silicate, Fe-Ti oxide |
| HOR 3 | Gypsum, mica, chlorite, plagioclase |
| HOR 4 | Sodium chloride, gypsum, plagioclase |
| HOR 5 | Alkali feldspar, gypsum, sodium chloride, mica, quartz, aluminum silicate |
| HOR 6 | Mica, plagioclase, quartz, apatite |
| HOR 7 | Chlorite, alkali feldspar, mica, iron oxide, sodium chloride, potassium chloride, (Na-)Ca sulfate, gypsum, dolomite |
| HOR 8 | Chlorite, gypsum, baryte, Fe-Ti oxide |
| HOR 9 | Sodium chloride, gypsum, mica, plagioclase |
| HOR 10 | Sodium chloride, alkali feldspar, mica, iron sulfide, quartz, titanium oxide, apatite |
| HOR 11 | Sodium sulfate, zircon, plagioclase, alkali feldspar, chlorite, apatite, titanite |
| HOR 12 | Chlorite, mica, alkali feldspar, quartz, Na-Ca sulfate, Fe-Zn sulfide |
| HOR 13 | Quartz, chlorite, gypsum, alkali feldspar, titanium oxide |
Disclaimer/Publisher’s Note: The statements, opinions and data contained in all publications are solely those of the individual author(s) and contributor(s) and not of MDPI and/or the editor(s). MDPI and/or the editor(s) disclaim responsibility for any injury to people or property resulting from any ideas, methods, instructions or products referred to in the content. |
© 2024 by the authors. Licensee MDPI, Basel, Switzerland. This article is an open access article distributed under the terms and conditions of the Creative Commons Attribution (CC BY) license (https://creativecommons.org/licenses/by/4.0/).
Share and Cite
Moroni, B.; Crocchianti, S.; Nawrot, A.; Dagsson Waldhauserova, P.; Cappelletti, D. Investigation of Icelandic Dust Presence in the Aerosols Collected at Hornsund (Svalbard, Norwegian Arctic) in Spring 2019. Atmosphere 2024, 15, 322. https://doi.org/10.3390/atmos15030322
Moroni B, Crocchianti S, Nawrot A, Dagsson Waldhauserova P, Cappelletti D. Investigation of Icelandic Dust Presence in the Aerosols Collected at Hornsund (Svalbard, Norwegian Arctic) in Spring 2019. Atmosphere. 2024; 15(3):322. https://doi.org/10.3390/atmos15030322
Chicago/Turabian StyleMoroni, Beatrice, Stefano Crocchianti, Adam Nawrot, Pavla Dagsson Waldhauserova, and David Cappelletti. 2024. "Investigation of Icelandic Dust Presence in the Aerosols Collected at Hornsund (Svalbard, Norwegian Arctic) in Spring 2019" Atmosphere 15, no. 3: 322. https://doi.org/10.3390/atmos15030322
APA StyleMoroni, B., Crocchianti, S., Nawrot, A., Dagsson Waldhauserova, P., & Cappelletti, D. (2024). Investigation of Icelandic Dust Presence in the Aerosols Collected at Hornsund (Svalbard, Norwegian Arctic) in Spring 2019. Atmosphere, 15(3), 322. https://doi.org/10.3390/atmos15030322