Article

Decomposition of Lorenz Trajectories Based on Space Curve Tangent Vector

1
School of Mathematics and Computer Science Institute, Northwest Minzu University, Lanzhou 730030, China
2
Institute of Applied Mathematics and Astronomical Calendar, Northwest Minzu University, Lanzhou 730030, China
*
Author to whom correspondence should be addressed.
Atmosphere 2024, 15(3), 319; https://doi.org/10.3390/atmos15030319
Submission received: 19 January 2024 / Revised: 22 February 2024 / Accepted: 27 February 2024 / Published: 4 March 2024
(This article belongs to the Section Atmospheric Techniques, Instruments, and Modeling)

Abstract

:
This article explores the evolution of Lorenz trajectories within attractors. Specifically, based on the characteristics of the tangents to trajectories, we derive quantitative standards for determining the spatial position of trajectory lines. The Lorenz trajectory is decomposed into four parts. This standard is objective and quantitative and is independent of the initial field of the Lorenz equation and the calculation scheme; importantly, it is designed based on the inherent dynamic characteristics of the Lorenz equation. Linear fitting of the trajectories in the left and right equilibrium point regions shows that the trajectories lie on planes, indicating the existence of linear features in the nonlinear system. This study identifies the fundamental causes of chaos in the Lorenz equation using the microscopic evolution and local characteristics of the trajectories, and indicating that the spatial position of the initial field is important for their predictability. We theoretically demonstrate that mutation is essentially self-regulation within chaotic systems. This scheme is designed according to the evolution characteristics of Lorenz trajectories, and thus has certain methodological limitations that mean it may not be applicable to other chaotic systems. However, it does depict the causes of chaos and elucidates the sensitivity of differential equations to initial values in terms of trajectory evolution.

1. Introduction

In 1963, the Lorenz nonlinear system of differential equations was derived as a description of the nonlinear effects of atmospheric thermal convection motion. Known as the Lorenz equation, this system is the basis for the concepts of deterministic nonperiodic flow, bifurcations, and strange attractors, as well as chaos theory. The Lorenz equation is a system that can produce chaos [1], and has become a classic model for studying chaos theory [2,3,4,5]. Although the Lorenz equation is simple, it has the properties of a nonlinear forced dissipative system.
The Lorenz equation is widely used in the study of complex systems. Because the atmosphere is a typical nonlinear chaotic system, the Lorenz equation can be used to study abrupt climate change, climate forecasting, and extreme weather in atmospheric science [6,7,8,9,10,11,12,13,14,15,16]. In physics, it can be used to study memristors and analog circuits, among a wide range of devices [17,18,19]. The Lorenz equation is also employed to study the nonlinear relationships between different populations in biology [20], and has many applications in finance [21].
The chaotic characteristic of the Lorenz equation is the instability of the solution from the perspective of the definite solution to the differential equation. Research on this problem can be traced back to 1953, when Hadamard studied the Cauchy problem applied to the Laplace equation. He explicitly indicated the instability of the solution to the differential equation for the first time and constructed the famous Hadamard counterexample [22]. This counterexample is sensitive to the parameters of the differential equation, while the Lorenz equation is sensitive to the initial value. Chaos refers to the presence of pseudo-random and limited motion in a deterministic system, characterized by uncertainty, nonrepeatability, and unpredictability, and is generated by the nonlinear action within the system. Nonlinear systems have a high degree of complexity and diversity in their evolution. Chaos is an inherent characteristic and a common phenomenon of nonlinear dynamic systems. The Lorenz system also has the properties of dissipation [23] and long-range correlation [24]. Nonlinearity leads to complex dynamic properties in the system [25,26], while dissipation represents overall stability and local instability [27].
For some nonlinear dynamic systems, there will be two or more equilibrium points, and the trajectories of the system exhibit the characteristics of “jumping” between different equilibrium regions. This can be clearly observed in the evolution of the Lorenz equation trajectories. The external manifestations of uncertainty and disorder in chaotic systems are the irregular transitions of the trajectories between different equilibrium regions. This is the fundamental reason why it is difficult to predict the behavior of the system. Nevertheless, the Lorenz equation is widely applied in studies of nonlinear predictability [28,29,30,31,32,33,34,35,36]. Ding et al. used the Lorenz equation to study the effects of initial and parameter errors on the predictability of chaotic systems. Their results showed that the growth theory of error nonlinearity enables quantitative estimates of the predictability period of chaotic systems, which is suitable for studying predictability [34,35]. Li et al. used the Lorenz equation as an example of the information entropy of nonlinear errors in predictability, and provided the spatial distribution of the overall predictability of the system [37]. Chaos can also be controlled [38], and Yu et al. achieved the control of Lorenz system chaos by constructing a nonlinear controller [39].
In this paper, it is preliminarily speculated that the trajectory transition of the Lorenz equation between different equilibrium regions may be the cause of chaos. Thus, determining the spatial position of the trajectories within the attractor is a fundamental requirement for understanding the mechanism of chaos from a microscopic and local perspective; that is, determining the equilibrium region of the trajectories within the attractor requires an understanding of the characteristics of trajectory evolution within the attractor. The study of this issue is helpful in providing a deeper understanding of chaos, and lays the theoretical foundation for research on abrupt climate change, the predictability of atmospheric numerical models, and predictive effectiveness. In practical applications, theoretical methods provide early warnings and predictions for complex systems. In this paper, a new dynamic transition detection method is proposed, which can detect the transition behavior of Lorenz equation well and decompose the trajectory, with almost no missed or wrong detection compared with abrupt change detection methods based on a traditional statistical principle, such as the moving t-test technique, heuristic segmentation algorithm [40], permutation entropy [41], and power law exponent [42]. The method is a dynamic abrupt change detection method, which can better reflect the physical significance of the system. In addition, the local Lyapunov exponents may provide a fruitful insight into local dynamics: the largest Lyapunov exponent in a particular point of a trajectory defines the divergence or convergence after a small perturbation [43,44], but the local Lyapunov exponent is often used to study the accuracy or predictability of predictions. In this paper, we introduce the problem of detecting the transition point by applying perturbation to the points in the transition region, that is, abrupt change detection, and better explore the properties of the Lorenz equation to understand the mechanism of chaos generation.

2. Perturbation Response of Point on Lorenz Trajectories

The Lorenz equation for an atmospheric system can be written as
{ d x d t = 10 ( x + y ) d y d t = 28 x y x z d z d t = x y 8 3 z ,
where x is the flipping velocity of convection, y is the temperature ratio between the upper and lower fluids, and z is the vertical temperature gradient. Equation (1) has three equilibrium points: the origin O (0, 0, 0) and points L ( 6 2 , 6 2 , 27 )  and R ( 6 2 , 6 2 , 27 ) . The equilibrium points L and R are labeled as the left and right equilibrium points. We took the initial field as (6, 20, 33) and used the fourth-order Runge–Kutta algorithm to solve Equation (1). The integration step size was 0.01, the integration interval was [0, 50], and the truncation error was 0.013.
The black curve in Figure 1a represents the trajectories of system (1) within the time interval [2.90, 4.20], with arrows indicating the direction of the trajectories. Points L and R are equilibrium points. Point T on the trajectories corresponds to time t = 3.55, and points B and A correspond to t = 3.40 and t = 3.70, respectively. Obviously, point B is before point T and point A is after point T. We added random disturbances to the coordinates of point B, with the magnitude of the disturbances ranging from 10−1 to 10−2, and took this as the initial field of the Lorenz Equation (1). Integrating 300 steps forward (three time units), we obtained the red dashed line in Figure 1a, which represents the trajectories corresponding to the initial disturbance field (six sets of experiments); the arrows represent the direction of the trajectories. Similarly, adding random perturbations to point A to form the initial field and integrating 300 steps forward gives the green dashed line in Figure 1a (six sets of experiments). The coordinates on the left of Figure 1b–d are the x, y, and z variable curves corresponding to the trajectories of point B, the black solid lines show the x, y, and z curves of the undisturbed trajectories, and the red dashed lines show the disturbed trajectories. The coordinates on the right are the variable curves corresponding to the trajectories at point A, where the black dashed line shows the undisturbed trajectories and the green dashed lines show the disturbed trajectories. The evolution of the trajectories from the left equilibrium point region to the right equilibrium point region is essentially the same, and will not be described in this article.
Figure 1 illustrates that, before point T on the trajectories, that is, after adding a small disturbance to point B, the trajectories may move in the original equilibrium point region or may transition to another equilibrium point region, as shown by the red lines. There is no such situation at point A after point T, and the trajectories move in the original equilibrium point area within the existing time interval, as shown by the green (curved) lines. This indicates that the responses of point B and point A to small perturbations are significantly different. The former exhibit strong sensitivity and have obvious uncertainty, while the latter are insensitive and have a degree of certainty. Lorenz’s research in 1963 was based on the changes in the trajectories at point B, rather than the evolution of the trajectories at point A. From the perspective of differential equations, the former represents the instability of the solution, while the latter represents the stability of the solution. From the perspective of atmospheric numerical models, the former is sensitive to initial values, while the latter is insensitive to initial values. Hence, the positions of points T, B, and A on the Lorenz trajectories are crucial. We called T the point of transition of the Lorenz trajectories, and B and A were called the Proteus (In Greek mythology, Proteus is a sea god who has the ability to change into various shapes at will) point and Nereus (In Greek mythology, Nereus is a sea god who is trustworthy, amiable, fair, and kind) point [45], representing unstable and stable points, respectively. Quantitatively determining their positions is the main focus of this study. On this basis, the decomposition of the trajectories into stable, unstable, and transition segments is another goal of this research, and the properties of each segment of the trajectories will also be discussed. By comparing Figure 1b–d, adding random disturbances to the coordinates of point B may change the phases of the x and y trajectories, but not the phase of the z trajectories. The components x, y, and z do not change significantly when the coordinates of point A are disturbed.

3. Decomposition of Lorenz Trajectories

3.1. Determination of Transition Points on the Trajectories

This article only considers the inner trajectories of the attractor of the Lorenz equation, so the time intervals for all experiments discussed herein are from t = 0.55 onwards. Taking the numerical experimental data in Section 2 as the research object, numerical solutions within the time interval [0.55, 3.31] were obtained under the assumption that the corresponding points on the trajectories are
P = { P 1 ( x 1 , y 1 , z 1 ) , P 2 ( x 2 , y 2 , z 2 ) , P 3 ( x 3 , y 3 , z 3 ) , , P n ( x n , y n , z n ) } ,
where the tangent vector of the trajectories at  P i = ( x i , y i , z i )  is  α i , the vector connecting the left and right equilibrium points is  L R , and the cosine of the angle  θ i  between these two vectors is
λ i = cos θ i = ( L R , α i ) L R α i ,
where  ( , )  and   are the vector inner product and norm operations, respectively. The tangent is the extreme position of the secant, and so in practical calculations, the secant is used instead of the tangent, that is,
α i p i p i + 1 .
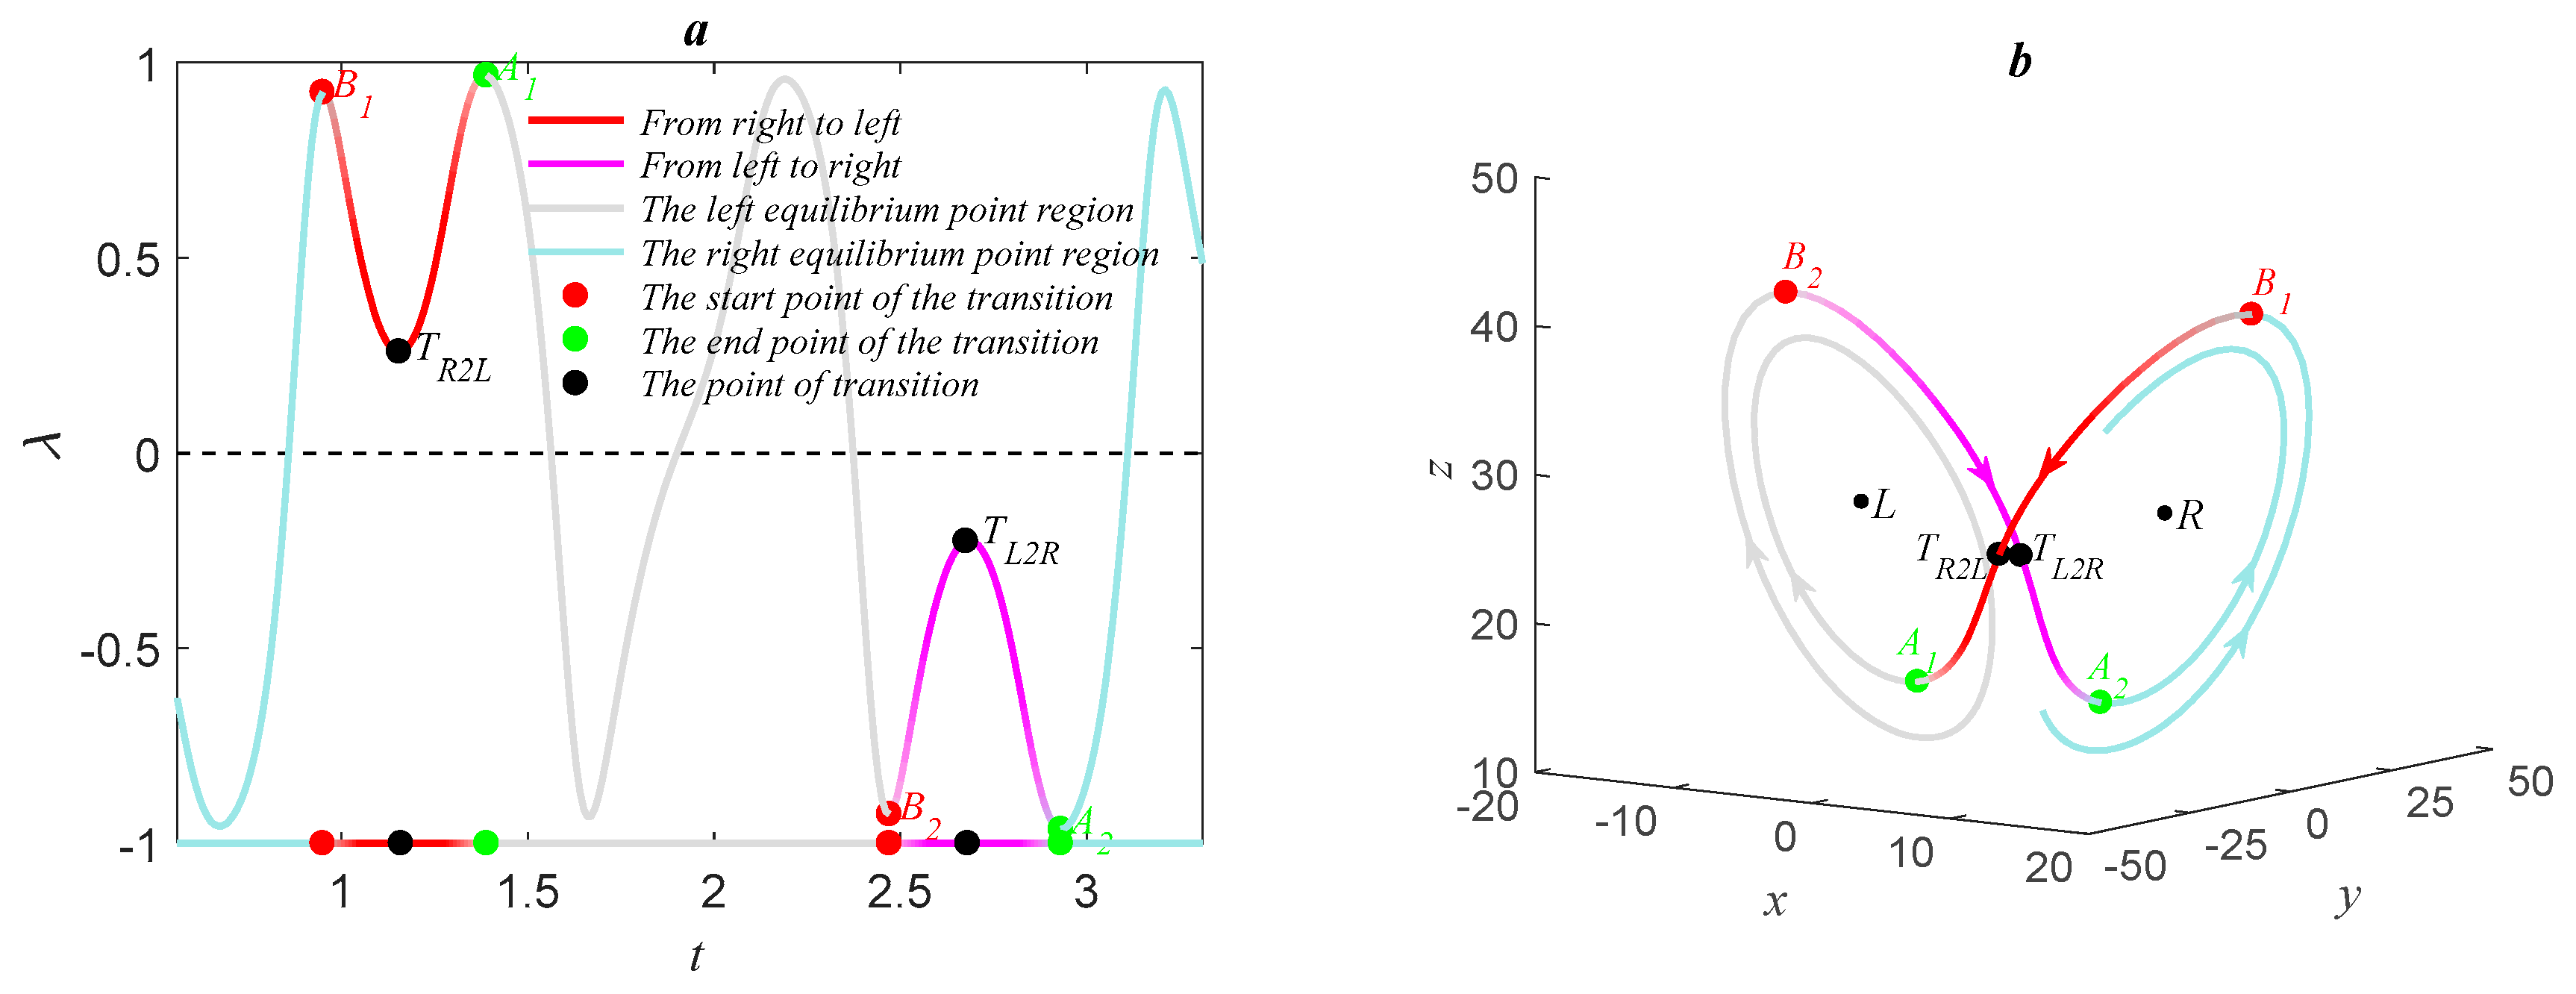
From this, the time series shown by the colored curve in Figure 2a was obtained, where the dashed black line represents the zero value line. At t = 1.17, time series (3) had a positive minimal value, with a saddle-shaped curve marked as TR2L. The two adjacent maxima on the left and right of this point were marked as B1 (red dot) and A1 (green dot), corresponding to t = 0.96 and t = 1.40, respectively. For convenience, this curve is referred to as the positive minimum segment,  B 1 T R 2 L A 1 . At t = 2.69, there is a negative maximum value, and the curve exhibits an inverted saddle shape. This point is marked as TL2R, and the two adjacent minima on the left and right are marked as B2 (red dot) and A2 (green dot), corresponding to t = 2.48 and t = 2.94, respectively. The arc  B 2 T L 2 R A 2  is called the negative maximum segment. The corresponding moments on the abscissa axis are indicated by colored dots. The curves within the time interval [0.55, 0.96] are drawn in light blue and those within the interval [0.96, 1.17] transition from light blue to red. The curves within the interval [1.17, 1.40] transition from red to light gray, while those within the interval [1.40, 2.48] are colored light gray. The curves within the interval [2.48, 2.69] transition from light gray to pink, and those within the interval [2.69, 2.94] transition from pink to light blue. Finally, the curve within the interval [2.94, 3.31] is light blue. Figure 2b shows the trajectories of the Lorenz equation within the time interval [0.55, 3.31]. The trajectory colors in each time interval are consistent with the time series curve in Figure 2a, and the corresponding points, such as A1 and A2, are marked.
Figure 2b clearly indicates that when the cosine value in Figure 2a was in the segment  S B 1 , the trajectories were in the right equilibrium point region. In the positive minimum segment  B 1 T R 2 L A 1 , the trajectories transitioned from the right equilibrium point region to the left equilibrium point region. In segment  A 1 B 2 , the trajectories were in the left equilibrium point region. In the negative maximum segment  B 2 T L 2 R A 2 , the trajectories transitioned from the left equilibrium region to the right equilibrium region. In segment  A 2 E , the trajectories returned to the right equilibrium point region, completing a quasi-periodic cycle. Therefore, the position of the trajectory could be determined by the cosine value in Figure 2a, that is, whether the trajectory was in the left or right equilibrium point region or was transitioning between the left and right equilibrium point regions.
In summary, the positive minimum segment of time series (3), namely the positive saddle curve segment, corresponds to the transition of trajectories from the right equilibrium point region to the left equilibrium point region. The first maximum on the left side of the positive minimum value denotes the start of the transition, and the first maximum on the right side denotes the end of the transition. The minimum value corresponds to the point of transition. The negative maximum segment, also known as the negative inverted saddle curve segment, corresponds to the transition of trajectories from the left equilibrium point region to the right equilibrium point region. The first minimum on the left side of the negative maximum started the transition, the first minimum on the right side ended the transition, and the maximum corresponded to the point of transition. From the end of the positive minimum segment to the beginning of the negative maximum segment, the trajectories were in the left equilibrium point region; from the end of the negative maximum segment to the beginning of the positive minimum segment, the trajectories were in the right equilibrium point region. By taking the cosine of the included angle between the tangent vector  α i  and  L R , the trajectories can be decomposed into four segments: the right equilibrium point region, the transition from the right equilibrium point region to the left equilibrium point region, the left equilibrium point region, and the transition from the left equilibrium point region to the right equilibrium point region.
When the time interval was set to [0.55, 500], the position of the trajectories was determined according to time series (3) and the decomposition of the trajectories was as shown in Figure 3, where the colors of the curves and points were consistent with those in Figure 2b. This decomposition was more reliable and fully decomposed the right equilibrium point region, the transition from the right equilibrium point region to the left equilibrium point region, the left equilibrium point region, and the transition from the left equilibrium point region to the right equilibrium point region.

3.2. Transition Time of Trajectories of the Lorenz Equation

Recall that T is the point of transition, B is the start point of the transition, and A is the end point of the transition. We now discuss the occurrence times of points T, B, and A, and explore their patterns. Point T was divided into two cases: TR2L and TL2R. The former refers to the point of transition from the right equilibrium point region to the left equilibrium point region, and the latter refers to the point of transition from the left equilibrium point region to the right equilibrium point region. Similarly, points B and A were divided into cases BR2L, BL2R, AR2L, and AL2R. The time interval was taken as [0.55, 30], and the occurrence time of each point is listed in Table 1. Table 1 indicates whether the transition is from the left equilibrium point region to the right equilibrium point region or vice versa. The time of point B is about 0.2 time units earlier than that of point T, and point A is about 0.25 time units later than point T. Therefore, the time required for the transition between the left and right equilibrium regions was about 0.45 time units.

3.3. Fitting of Trajectories and Transition Points

3.3.1. Linear Fitting of Trajectories in the Region of Left and Right Equilibrium Points

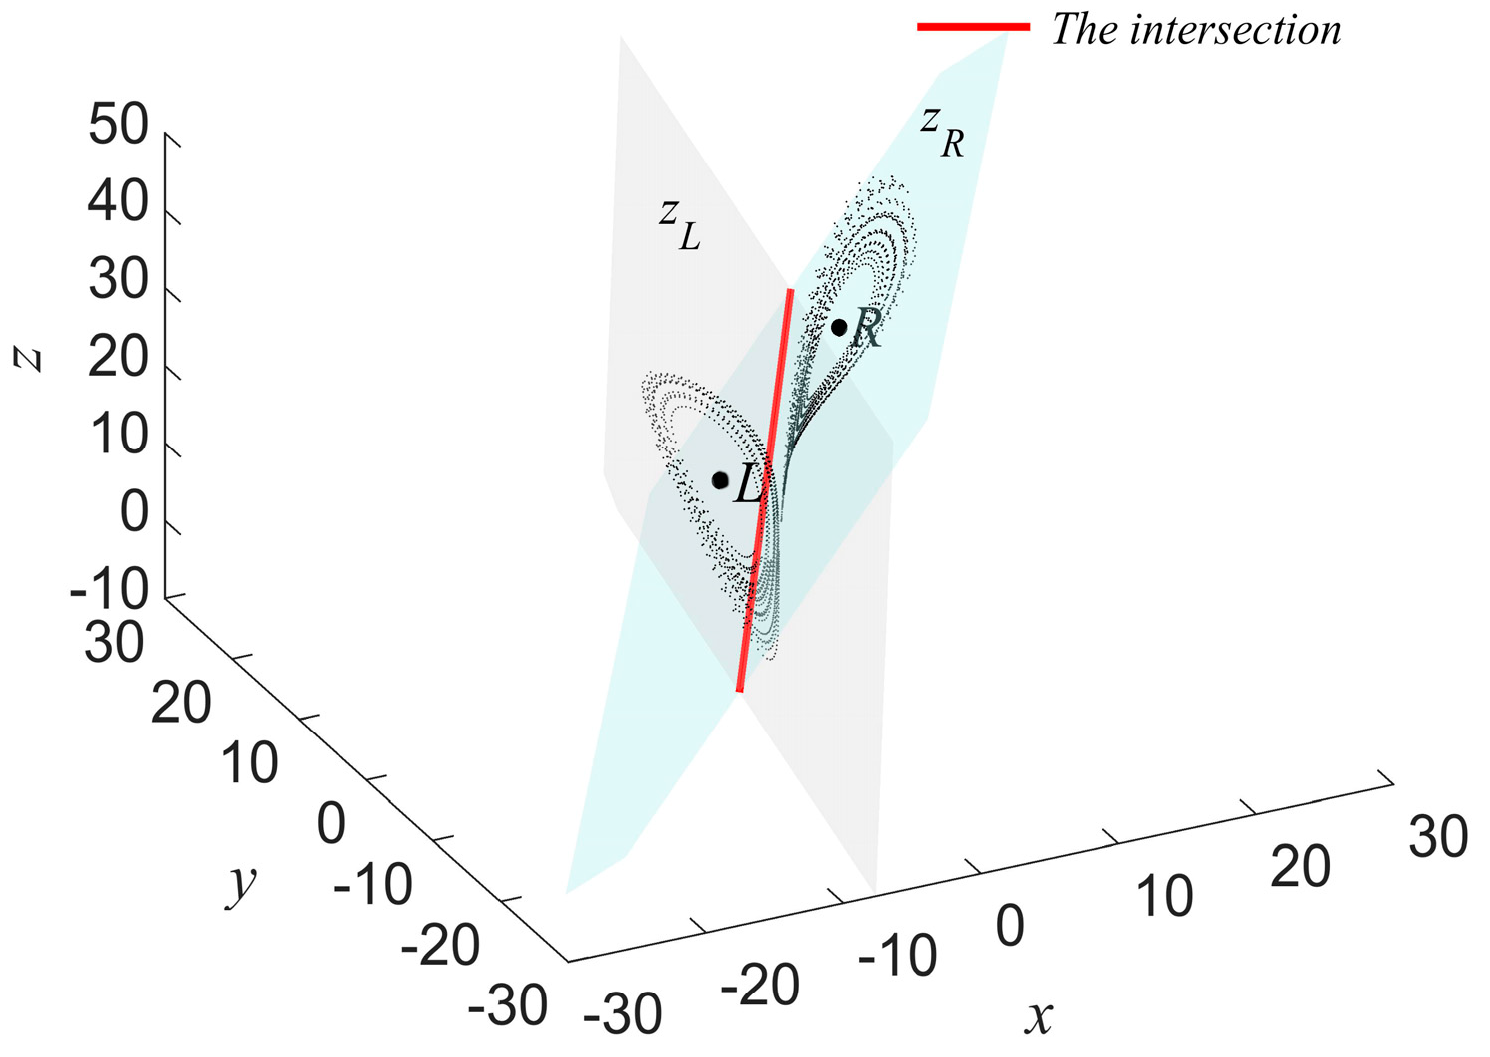
The trajectories within the equilibrium point region, i.e., the light gray (light blue)-colored trajectories in Figure 3, were taken as the research object. For clarity, these are represented by the black dots in Figure 4. The semi-transparent light gray plane in Figure 4 is the fitting of the trajectories in the left equilibrium point region (specifically, the fitting of the points on the trajectories). The equation of the plane is
z L = 3.02 x + 1.54 y + 13.11 .
The semi-transparent light blue plane in Figure 4 represents the fitting of the trajectories in the right equilibrium point region, for which the equation is
z R = 2.88 x 1.49 y + 14.3 .
The solid red line represents the intersection of planes  z L  and  z R . The-root-mean squared error of plane  z L  was 2.64 and that of plane  z R  was 2.01, both of which passed the 95% significance test.
We now discuss the influence of the initial field on the fitting of trajectories. Ten sets of vectors in R3 were selected: (6, 20, 33), (9, 12, 22), (9, 18, 13), (3, 6, 12), (8, 10, 7), (7, 10, 20), (6, 21, 34), (7, 20, 34), (7, 21, 34), and (6, 22, 34). To ensure the relative objectivity of the numerical experiments, the Euclidean distances between these vectors had a certain degree of randomness, which is expressed by the serial numbers 01, 02, … as the initial fields of differential Equation (1). Numerical solutions were obtained with an integration step size of 0.01, integration interval of [0.55, 50], and a truncation error of 0.013. The experimental data were the numerical solution within the integration interval [0.55, 50]. Specifically, after detecting the transition points and decomposing the Lorenz trajectories, the trajectories in the left and right equilibrium point regions were fitted into planes. The 10 vectors considered in the experiments resulted in 10  z L  planes,  z L i ( i = 1 , 2 , , 10 ) , and 10  z R  planes,  z R i ( i = 1 , 2 , , 10 ) .
To test the degree of similarity between the  z L i ( i = 1 , 2 , , 10 )  planes, i.e., the relative size of the modulus of the difference between two functions in a function space, we used the following calculation method in the continuous function space  C ( Ω ) :
N L i j = z L i z L j z L i ( i , j = 1 , 2 , , 10 ) ,
where   is the norm. When  i = j z L i z L j = 0 N L i j = 0 ; when  i j ,
z L i z L j = ( Ω ( z L i z L j ) 2 d x d y ) 1 2 .
The region of integration was  Ω = [ 16 , 0 ] × [ 24 , 1 ] , which was obtained by rounding the values of x and y in the first set of experiments (i.e., plane  z L 1 ). To test the similarity between planes and the control variable in the continuous function space, the integration region for all nine remaining sets of calculated norms was set to  Ω . The results of  N L i j  (to 3 decimal places) are presented in Table 2. Small values indicate that the distance between the two planes is small and the similarity between the two planes is high; larger values indicate that the degree of similarity is low.
The data in Table 2 do not exhibit symmetry. Although the numerator of Equation (7) was the norm of the difference between the two plane equations, the denominator was different, resulting in different values. Observing Table 2, almost all  N L i j  remained stable within the interval [0, 0.03], and most values were within [0, 0.02]. There was a high degree of similarity between any two planes, so  z L  did not change significantly with the initial field.
The same method was used to test the similarity between the  z R i ( i = 1 , 2 , , 10 )  planes, i.e.,
N R i j = z R i z R j z R i ( i , j = 1 , 2 , , 10 ) ,
with the integration region  Ω = [ 0 , 16 ] × [ 1 , 24 ]  obtained by rounding the values of x and y in the first set of experiments (plane  z R 1 ). The conclusion for  N R i j  was consistent with that for  N L i j  (data not presented). The plane  z R  did not change significantly with the initial field. In summary, the changes in planes  z L  and  z R  with the initial field were not significant, and the initial field had little impact on the fitting of trajectories.
To further discuss the impact of the integration step size on the fitting of trajectories, we applied 10 different integration steps to differential Equation (1): 0.01, 0.005, 0.014, 0.015, 0.013, 0.017, 0.016, 0.007, 0.004, and 0.003. These were represented by numbers 01, 02, … The data were numerical solutions within the interval [0.55, 50], and the 10 experiments produced 10  z L  planes,  z L i ( i = 1 , 2 , , 10 ) , and 10  z R  planes,  z R i ( i = 1 , 2 , , 10 ) .
Using the same method as for the initial field to detect the similarity between planes, i.e., Equations (7) and (9), we obtained  N L i j  and  N R i j . The calculation of  N L i j  used the integral interval  Ω = [ 16 , 0 ] × [ 24 , 1 ]  and the calculation of  N R i j  used the integral interval  Ω = [ 0 , 16 ] × [ 1 , 24 ] , consistent with the previous experiment. The values of x and y in the first group of experiments were rounded. The results for  N L i j  are listed in Table 3; those for  N R i j  are not presented.
Table 3 indicates that the integration step size had a relatively small influence on the fitting of trajectories. Though it had a greater impact than the initial field since the integration step size affected the smoothness of the data, it was also considered within the normal range.
In summary, neither the initial field nor the integration step size have a significant influence on the fitting of trajectories. This proves that the fitting of trajectories is an inherent property related to the system or equation itself.

3.3.2. Fitting of Transition Points

Taking the transition points detected in Section 3 as the research object, namely the black point T in Figure 3, we now fitted TR2L and TL2R. The point families TR2L and TL2R were projected onto the xoy, xoz, and yoz coordinate planes for the fitting of a quadratic function. Part of the fitting passed the significance test, and two examples that passed the significance test and had relatively good results were selected for display. Figure 5 shows the fitting of TR2L in the xoy and yoz coordinate planes, with black dots denoting the transition points and the fitting curves shown in purple. The fitted curves are as follows:
x = 0.033 y 2 0.0394 y + 0.1457 ,
y = 0.0422 z 2 + 1.3513 z 10.9099 .

4. Conclusions and Research Significance

This paper has described an innovative method for detecting the transition points of trajectories of the Lorenz equation. By determining the cosine of the angle between the tangent vector  α i  of the trajectories and the vector  L R , a time series  { λ 1 , λ 2 , λ 3 , , λ n }  was obtained. Based on this time series, the Lorenz trajectories were decomposed into four segments: the right equilibrium point region, the transition from the right equilibrium point region to the left equilibrium point region, the left equilibrium point region, and the transition from the left equilibrium point region to the right equilibrium point region. The positive minimum and negative maximum segments of the time series corresponded exactly to the transition segment of the trajectories, while the extrema adjacent to the positive minimum and negative maximum corresponded to the start and end times of the transition. This method is completely based on the inherent dynamic characteristics of the Lorenz equation, making it highly reliable. By decomposing the Lorenz trajectories and linearly fitting the trajectories in the left (right) equilibrium point region, we have shown that the trajectories in a certain equilibrium point region basically lie in a plane, indicating the existence of linear features in nonlinear systems.
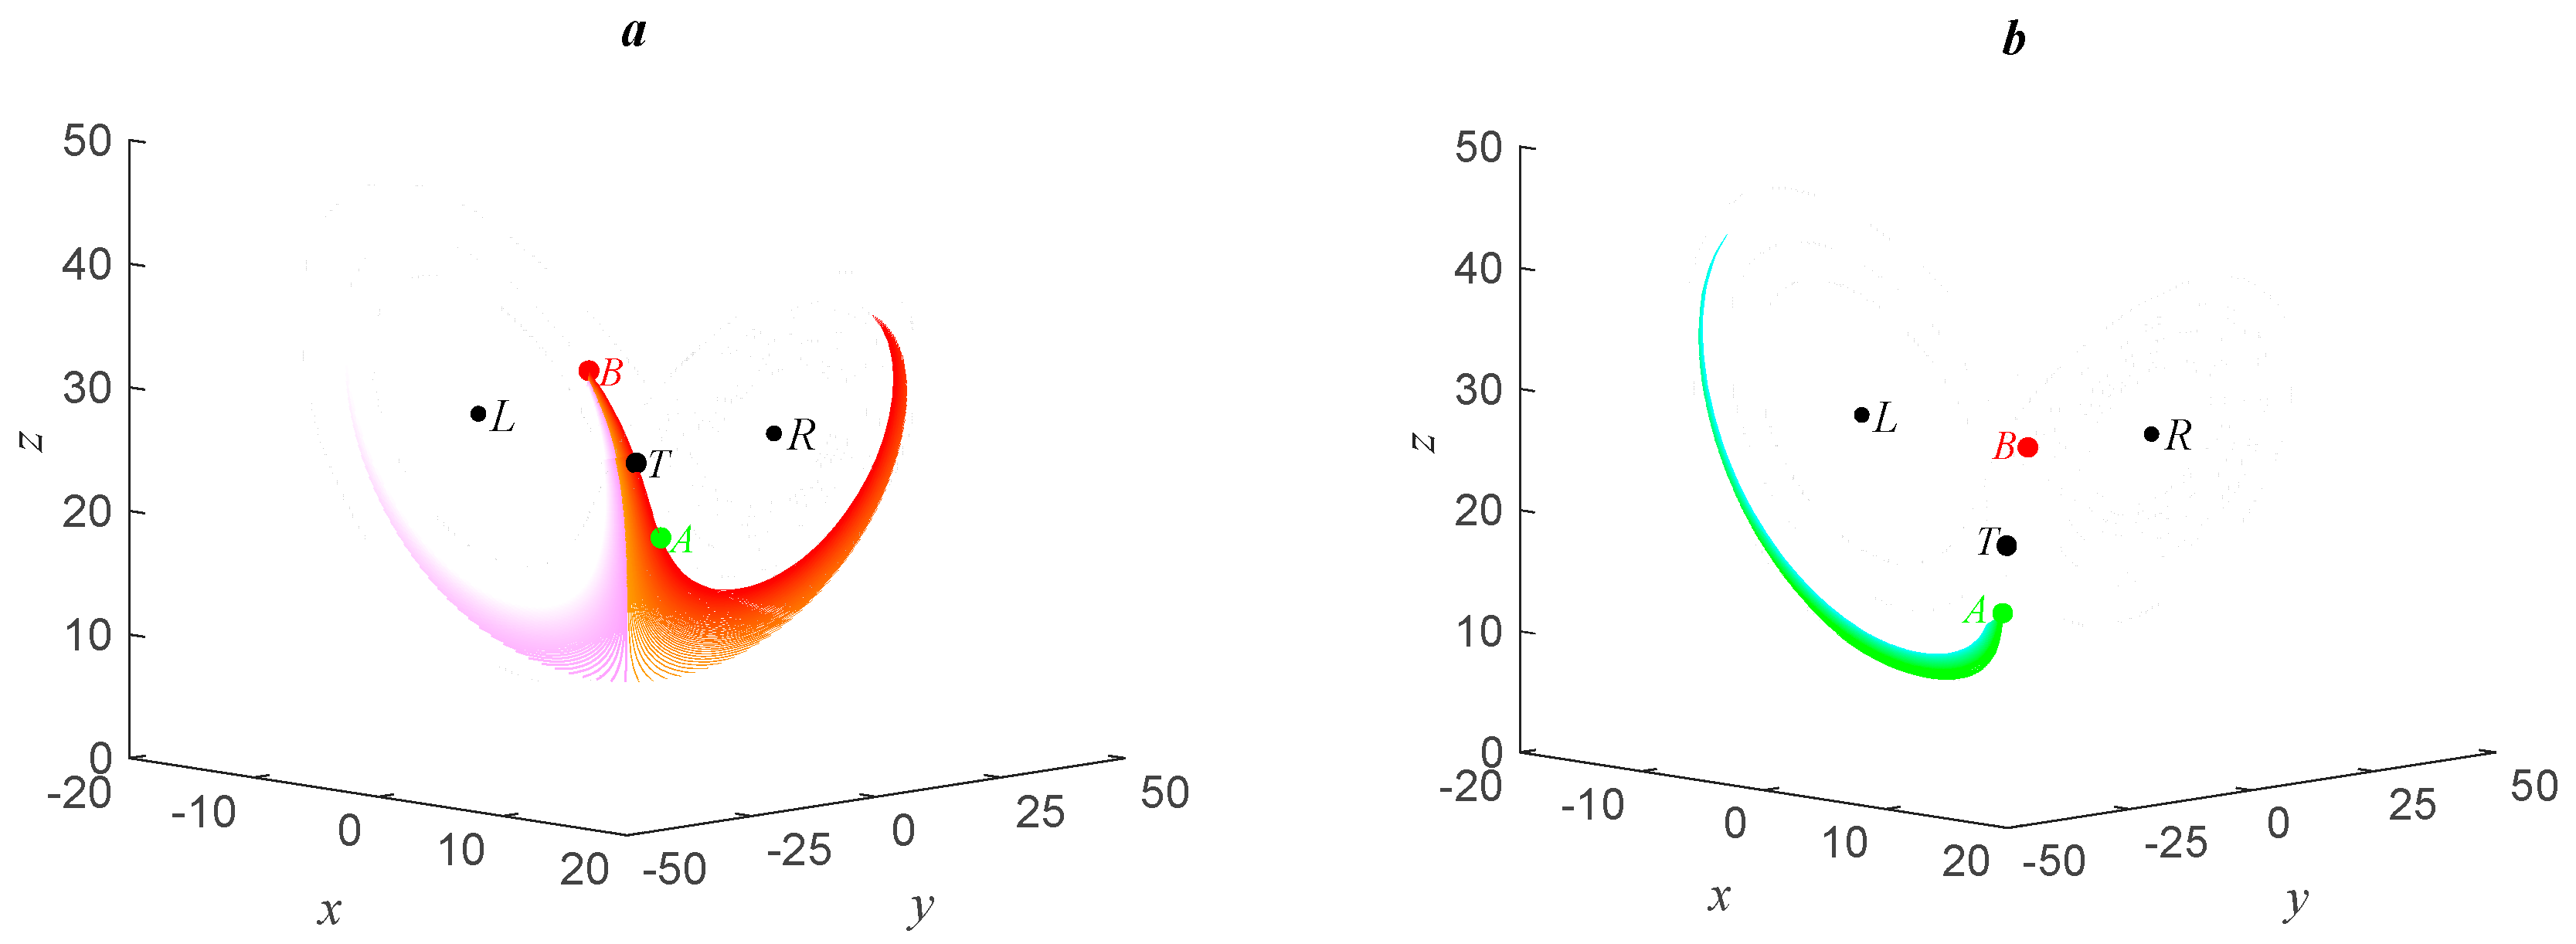
The essence of the transition of trajectories is an abrupt change, which is consistent with the universal definition of abrupt climatic change [46]. When the trajectories are at point B, the system may possibly experience an abrupt change, although further judgment is required to determine whether the abrupt change will occur. However, at point A, the system will not experience an abrupt change. At point T, the system is in the process of an abrupt change, corresponding to the occurrence of transitional weather processes such as drought, flood, and rapid changes in the atmospheric system. Hence, this article undoubtedly provides a new idea for detecting abrupt climatic change and judging transitional weather conditions. The Lorenz equation has two equilibrium points in addition to the origin. If a system of differential equations had only one equilibrium point except the origin, when the system of equations used the abrupt change detection method proposed in this paper, we considered changing the vector composed of the left and right equilibrium points to the vector composed of the origin and the equilibrium point, but the usability remains to be studied. For nonlinear differential equations, predictability analysis is often necessary, and is particularly prominent in atmospheric numerical models. The chaotic nature of atmospheric systems makes it necessary (but difficult) to study their predictability. When the trajectories are at point B, i.e., the Proteus point, the trajectories are indeed unstable. There are two evolution conditions for the Lorenz trajectories, but the atmospheric system has multiple equilibrium regions. Thus, there are multiple possibilities for the evolution of trajectories and the predictability will be negative. Therefore, the trajectories at point B cannot be studied from a dynamic perspective and can only be predicted statistically, as shown in Figure 6a. On the contrary, when the trajectories are at point A, i.e., the Nereus point, the trajectories are very stable, allowing a deterministic prediction with a certain causal relationship. There is only one evolution of the trajectories, and the prediction is inevitable, as shown in Figure 6b. This indicates that it is necessary to discuss whether the position of the initial field is close to the Proteus point or near the Nereus point when conducting predictive research. For the former, the predictive ability will be negative, while the latter can be expected to provide better predictive results.

Author Contributions

J.M.: Conceptualization (equal); methodology (equal); software (equal); writing—original draft (equal). L.H.: software (equal). H.S.: resources (equal). B.F.: data curation (equal). C.D.: conceptualization (equal); formal analysis (equal); funding acquisition (lead); methodology (equal); supervision (equal); writing—review and editing (equal). All authors have read and agreed to the published version of the manuscript.

Funding

Project supported by the Fundamental Research Funds for the Central Universities of China (Grant Nos. 31920220041, 31920230030), the Key Program of the National Natural Science Foundation of China (Grant No. 42130610) and the National Natural Science Foundation of China (Grant Nos. 41765004 and 41875096).

Institutional Review Board Statement

Not applicable.

Informed Consent Statement

Not applicable.

Data Availability Statement

Due to the subsequent work, the data are not public. The data that support the findings of this study are available from the corresponding author upon reasonable request.

Acknowledgments

We thank Stuart Jenkinson, for editing the English text of a draft of this manuscript.

Conflicts of Interest

The authors have no conflicts to disclose.

References

  1. Lorenz, E.N. Deterministic nonperiodic flow. J. Atmos. Sci. 1963, 20, 130–141. [Google Scholar] [CrossRef]
  2. Bao, B.C.; Liu, Z.A. Hyperchaotic attractor coined from chaotic lu system. Chin. Phys. Lett. 2008, 25, 2396–2399. [Google Scholar] [CrossRef]
  3. Li, C.B.; Julien, C.S.; Wesley, T.; Zhu, H.Q. A new piecewise linear hyperchaotic circuit. IEEE Trans. Circuits Syst. II Express Briefs 2014, 61, 977–981. [Google Scholar] [CrossRef]
  4. Sun, K.H.; Sprott, J.C. Dynamics of a simplified Lorenz system. Int. J. Bifurc. Chaos 2009, 19, 1357–1360. [Google Scholar] [CrossRef]
  5. Qiang, J. Hyperchaos generated from the Lorenz chaotic system and its control. Phys. Lett. A 2007, 366, 217–222. [Google Scholar] [CrossRef]
  6. He, W.P.; Feng, G.L.; Dong, W.J.; Li, J.P. On the predictability of the Lorenz system. Acta Phys. Sin. 2006, 55, 969–977. [Google Scholar] [CrossRef]
  7. Ding, R.Q.; Li, J.P. Study on the regularity of predictability limit of chaotic systems with different initial errors. Acta Phys. Sin. 2008, 57, 7494–7499. [Google Scholar] [CrossRef]
  8. Feng, G.L.; Wang, Q.G.; Hou, W.; Gong, Z.Q.; Zhi, R. Long-range correlation of extreme events in meterorological field. Acta Phys. Sin. 2009, 58, 2853–2861. [Google Scholar] [CrossRef]
  9. Li, J.P.; Ding, R.Q. Studies of predictability of single variable from multi-dimensional chaotic dynamical system. Chin. J. Atmos. Sci. 2009, 33, 551–556. [Google Scholar] [CrossRef]
  10. Shi, Z.; Ding, R.Q.; Li, J.P. Impacts of random error on the predictability of chaotic systems. Chin. J. Atmos. Sci. 2012, 36, 458–470. [Google Scholar] [CrossRef]
  11. Wang, Q.G.; Feng, G.L.; Zheng, Z.H.; Zhi, R.; Chou, J.F. The preliminary analysis of the procedures of extracting predicable components in numerical model of Lorenz system. Chin. J. Atmos. Sci. 2012, 36, 539–550. [Google Scholar] [CrossRef]
  12. Zhu, D.W.; Tu, L.L. Adaptive synchronization and parameter identification for Lorenz chaotic system with stochastic perturbations. Acta Phys. Sin. 2013, 62, 98–103. [Google Scholar] [CrossRef]
  13. Huai, X.W.; Li, J.P.; Ding, R.Q.; Feng, J.; Liu, D.Q. Quantifying local predictability of the Lorenz system using the nonlinear local Lyapunov exponent. Atmos. Ocean. Sci. Lett. 2017, 10, 372–378. [Google Scholar] [CrossRef]
  14. Li, B.S.; Ding, R.Q.; Li, J.P.; Zhong, Q.J. Predictability of forced Lorenz system. Acta Phys. Sin. 2017, 66, 35–42. [Google Scholar] [CrossRef]
  15. Liang, D.; Gu, B.; Ding, R.Q.; Li, J.P.; Zhong, Q.J. Comparative study of Lorenz model based ensemble forecasting and single forecasting. Acta Phys. Sin. 2018, 67, 74–82. [Google Scholar] [CrossRef]
  16. Da, C.J.; Shen, B.L.; Song, J.; Cairang, X.W.; Feng, G.L. Abrupt change detection method based on features of Lorenz trajectories. Atmosphere 2021, 12, 781. [Google Scholar] [CrossRef]
  17. Jia, H.Y.; Cheng, Z.Q.; Xue, W. Analysis and circuit implementation for the fractional-order Lorenz system. Acta Phys. Sin. 2013, 62, 56–62. [Google Scholar] [CrossRef]
  18. Ruan, J.Y.; Sun, K.H.; Mou, J. Memristor-based Lorenz hyper-chaotic system and its circuit implementation. Acta Phys. Sin. 2016, 65, 25–35. [Google Scholar] [CrossRef]
  19. Zhang, B.; Deng, F. Double-compound synchronization of six memristor-based Lorenz systems. Nonlinear Dyn. 2014, 77, 1519–1530. [Google Scholar] [CrossRef]
  20. Zhang, Y.F.; Ouyang, Z.Q. Biological synergetics, Lorenz model and population dynamics. J. Biomath. 2003, 18, 218–223. [Google Scholar] [CrossRef]
  21. Ma, R.R.; Wu, J.; Wu, K.Z.; Pan, X.H. Adaptive fixed-time synchronization of Lorenz systems with application in chaotic finance systems. Nonlinear Dyn. 2022, 109, 3145–3156. [Google Scholar] [CrossRef]
  22. Hadamard, J.; Morse, P.M. Lectures on Cauchy’s problem in linear partial differential equations. Phys. Today 1953, 6, 18. [Google Scholar] [CrossRef]
  23. Dong, X.H.; Li, X.H.; Zhang, Y.F. Dissipativeness property in lattices of coupled nonidentical Lorenz equations. J. Henan Univ. Nat. Sci. 2008, 38, 346–348. [Google Scholar] [CrossRef]
  24. Wang, Q.G.; Zhi, R.; Zhang, Z.P. The research on long range correlation of Lorenz system. Acta Phys. Sin. 2008, 57, 5343–5350. [Google Scholar] [CrossRef]
  25. Ding, R.Q.; Li, J.P. Relationships between the limit of predictability and initial error in the uncoupled and coupled Lorenz models. Adv. Atmos. Sci. 2012, 29, 1078–1088. [Google Scholar] [CrossRef]
  26. Ren, H.L.; Chou, J.F.; Huang, J.P.; Zhang, P.Q. Theoretical basis and application of an analogue-dynamical model in the Lorenz system. Adv. Atmos. Sci. 2009, 26, 67–77. [Google Scholar] [CrossRef]
  27. Chiu, C.H.; Lin, W.W.; Peng, C.C. Asymptotic synchronization in lattices of coupled nonidentical Lorenz equations. Int. J. Bifurc. Chaos 2000, 10, 2717–2728. [Google Scholar] [CrossRef]
  28. Lorenz, E.N. A study of the predictability of a 28-variable atmospheric model. Tellus 1965, 17, 321–333. [Google Scholar] [CrossRef]
  29. Lorenz, E.N. Nondeterministic theories of climatic change. Quat. Res. 1976, 6, 495–506. [Google Scholar] [CrossRef]
  30. Casdagli, M. Nonlinear prediction of chaotic time series. Phys. D Nonlinear Phenom. 1989, 35, 335–356. [Google Scholar] [CrossRef]
  31. Palmer, T.N. A nonlinear dynamical perspective on climate prediction. J. Clim. 1999, 12, 575–591. [Google Scholar] [CrossRef]
  32. Feng, G.L.; Dai, X.G.; Wang, A.H.; Chou, J.F. On numerical predictability in the chaos system. Acta Phys. Sin. 2001, 50, 606–611. [Google Scholar] [CrossRef]
  33. Ren, H.L.; Dai, X.G.; Chou, J.F. Statistical analysis of the predictability of the chaotic solution series of Lorenz system. J. Lanzhou Univ. Nat. Sci. 2003, 39, 93–98. [Google Scholar] [CrossRef]
  34. Ding, R.Q.; Li, J.P. Nonlinear error dynamics and predictability study. Chin. J. Atmos. Sci. 2007, 31, 571–576. [Google Scholar] [CrossRef]
  35. Ding, R.Q.; Li, J.P. Comparison of the influences of initial error and model parameter error on the predictability of numerical forecast. Chin. J. Geophys. 2008, 51, 1007–1012. [Google Scholar] [CrossRef]
  36. He, W.P.; Feng, G.L.; Gao, X.Q.; Chou, J.F. Dynamics of the Lorenz system under quasiperiodic driving. Acta Phys. Sin. 2006, 55, 3175–3179. [Google Scholar] [CrossRef]
  37. Li, A.B.; Zhang, L.F.; Wang, Q.L.; Li, B.; Li, Z.Z.; Wang, Y.Q. Information theory in nonlinear error growth dynamics and its application to predictability: Taking the Lorenz system as an example. Sci. China Earth Sci. 2013, 56, 1413–1421. [Google Scholar] [CrossRef]
  38. Miao, J.H.; Liu, Z.Y. Control of Lorenz chaos. Acta Meteorol. Sin. 1999, 57, 751–757. [Google Scholar] [CrossRef]
  39. Yu, J.Z.; Su, N.; Vincent, T.L. Study on control of chaotic Lorenz system. Acta Phys. Sin. 1998, 47, 397–402. [Google Scholar] [CrossRef]
  40. Feng, G.L.; Gong, Z.Q.; Dong, W.J.; Li, J.P. Abrupt climate change detection based on heuristic segmentation algorithm. Acta Phys. Sin. 2005, 54, 5494–5499. [Google Scholar] [CrossRef]
  41. Hou, W.; Feng, G.L.; Dong, W.J.; Li, J.P. A technique for distinguishing dynamical species in the temperature time series of north China. Acta Phys. Sin. 2006, 55, 2663–2668. [Google Scholar] [CrossRef]
  42. Zhi, R.; Gong, Z.Q.; Wang, D.Y.; Feng, G.L. Analysis of the spatio-temporal characteristics of precipitation of China based on the power-law exponent. Acta Phys. Sin. 2006, 55, 6185–6191. [Google Scholar] [CrossRef]
  43. Bruno, E.; Demin, Y. Local Lyapunov exponents in chaotic systems. Phys. D Nonlinear Phenom. 1993, 65, 100–108. [Google Scholar] [CrossRef]
  44. Zhang, Y. New prediction of chaotic time series based on local Lyapunov exponent. Chin. Phys. B 2013, 22, 050502. [Google Scholar] [CrossRef]
  45. Da, C.J.; Mu, S.; Ma, D.S.; Yu, H.P.; Hou, W.; Gong, Z.Q. The theoretical study of the turning period in numerical weather prediction models based on the Lorenz equations. Acta Phys. Sin. 2014, 63, 442–455. [Google Scholar] [CrossRef]
  46. Fu, C.B.; Wang, Q. The definition and detection of the Abrupt Climatic Change. Chin. J. Atmos. Sci. 1992, 16, 482–493. [Google Scholar] [CrossRef]
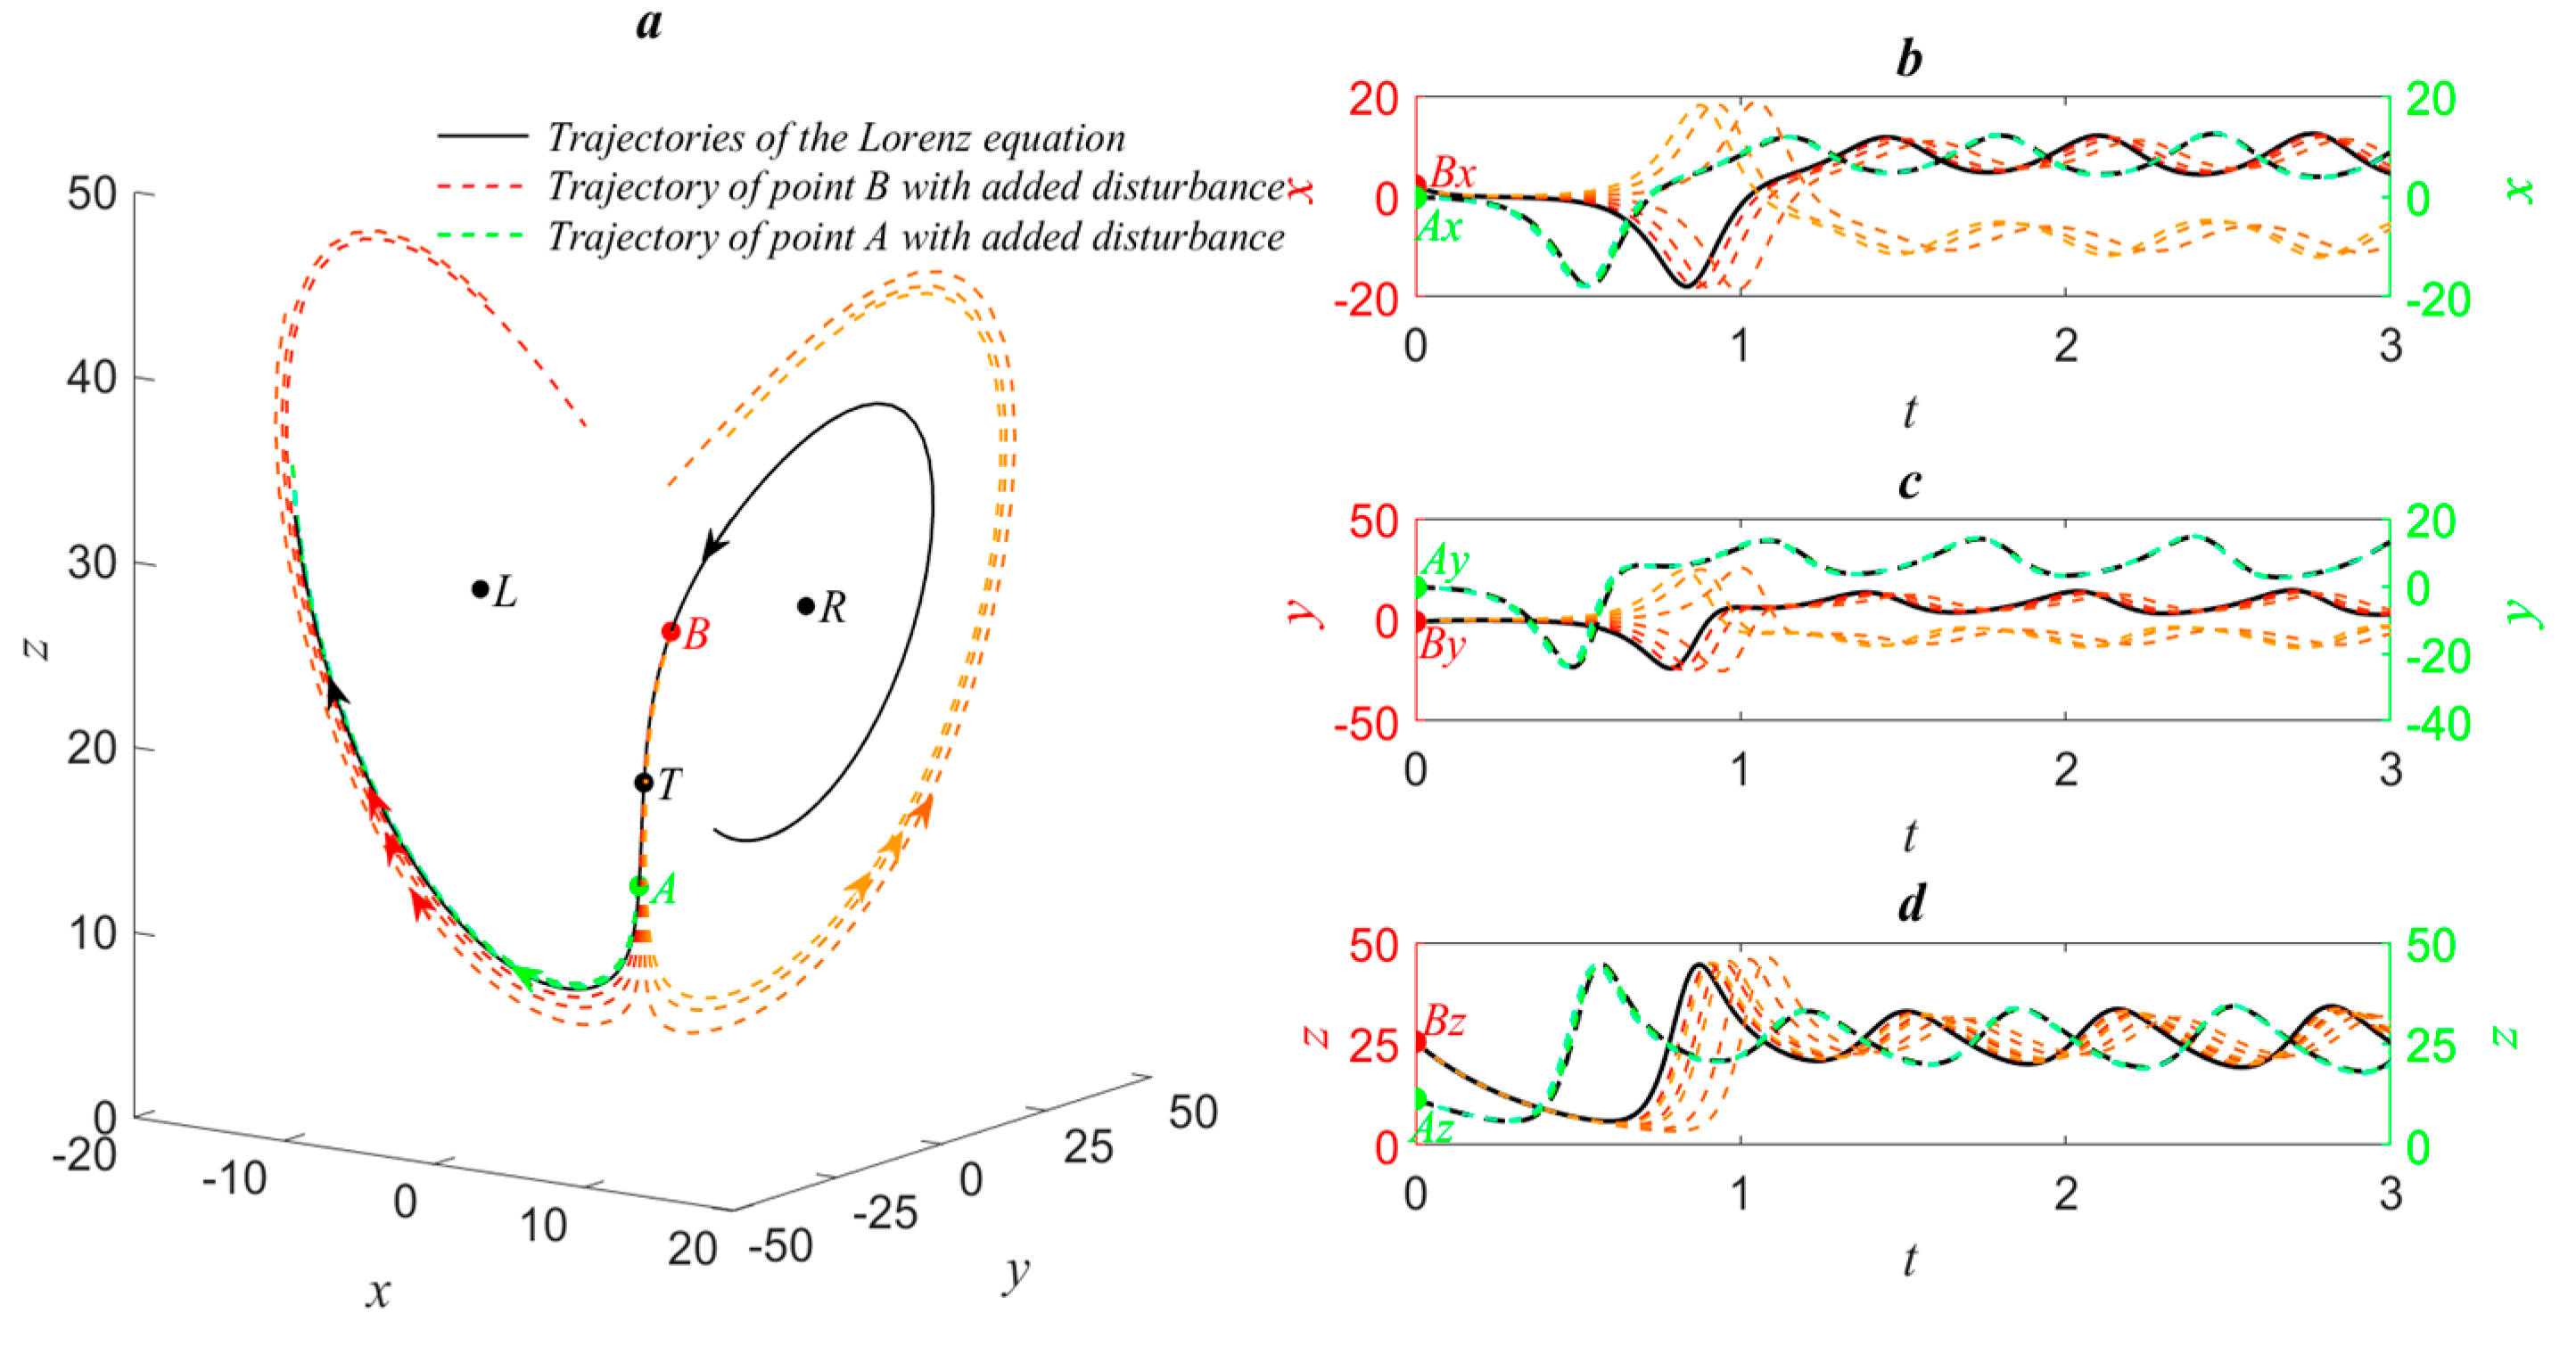
Figure 1. Differences in the response of points on the Lorenz trajectories to disturbances. (a) Trajectories of the Lorenz equation; (b) x−variable curve of the trajectories; (c) y−variable curve of the trajectories; (d) z−variable curve of the trajectories.(The red dashed lines represent the trajectory of point B with added disturbances. The green dashed lines represent the trajectory of point A with added disturbances.).
Atmosphere 15 00319 g001
Figure 2. Decomposition of trajectories of the Lorenz equation. (a) Cosine of the angle between the Lorenz tangent vector and vector  L R ; (b) trajectories of the Lorenz equation.
Atmosphere 15 00319 g002
Figure 3. Trajectory decomposition of the Lorenz equation in time intervals [0.55, 500].
Atmosphere 15 00319 g003
Figure 4. Fitting of trajectories in the equilibrium point region.
Atmosphere 15 00319 g004
Figure 5. Fitting of transition points TR2L. (a) Fitting of transition points TR2L in the xoy coordinate plane; (b) fitting of transition points TR2L in the yoz coordinate plane.
Atmosphere 15 00319 g005
Figure 6. Predictability of trajectories of the Lorenz equation. (a) Negative predictability; (b) positive predictability.
Atmosphere 15 00319 g006
Table 1. Corresponding moments of points B, A, and T on the trajectories within the time interval [0.55, 30].
BR2LTR2LAR2LBL2RTL2RAL2R
0.961.171.402.482.692.94
3.223.553.984.274.444.62
9.129.339.5610.6310.8511.10
11.3811.6712.0312.3112.4912.69
15.1515.3815.6415.9216.1616.45
16.7316.9417.1818.4418.6118.80
21.9522.1722.4221.6722.9922.70
23.6323.8124.0126.4826.7026.96
27.2327.5127.8428.1228.3128.51
Table 2. Results of  N L i j  from different initial field experiments.
z L j z L 1 z L 2 z L 3 z L 4 z L 5 z L 6 z L 7 z L 8 z L 9 z L 10
z L i
z L 1 00.0040.0160.0190.0270.0190.0130.0210.0160.009
z L 2 0.00400.0130.0160.0240.0170.0120.0180.0140.006
z L 3 0.0160.01300.0040.0140.0090.0150.0080.0020.008
z L 4 0.0180.0150.00300.0150.0120.0150.0090.0050.010
z L 5 0.0270.0240.0140.01500.0090.0290.0070.0130.020
z L 6 0.0190.0170.0090.0120.00900.0230.0040.0080.014
z L 7 0.0130.0120.0150.0150.0290.02300.0220.0160.010
z L 8 0.0210.0180.0080.0090.0070.0040.02200.0060.014
z L 9 0.0160.0130.0020.0050.0130.0080.0160.00600.009
z L 10 0.0090.0060.0080.0100.0200.0140.0100.0140.0090
Table 3. Results using different integration step sizes.
z L j z L 1 z L 2 z L 3 z L 4 z L 5 z L 6 z L 7 z L 8 z L 9 z L 10
z L i
z L 1 00.0680.0120.0340.0190.0410.0390.0450.0710.083
z L 2 0.07100.0660.0460.0870.0420.0440.0270.0090.030
z L 3 0.0110.06300.0250.0260.0320.0300.0380.0640.075
z L 4 0.0340.0450.02500.0470.0070.0050.0220.0450.053
z L 5 0.0190.0840.0260.04700.0540.0510.0620.0870.099
z L 6 0.0410.0410.0320.0070.05400.0040.0200.0400.047
z L 7 0.0390.0430.0300.0050.0520.00400.0230.0430.050
z L 8 0.0460.0270.0390.0220.0630.0200.02300.0270.040
z L 9 0.0720.0090.0660.0460.0900.0410.0440.02700.021
z L 10 0.0840.0290.0760.0540.1000.0470.0500.0400.0210
Disclaimer/Publisher’s Note: The statements, opinions and data contained in all publications are solely those of the individual author(s) and contributor(s) and not of MDPI and/or the editor(s). MDPI and/or the editor(s) disclaim responsibility for any injury to people or property resulting from any ideas, methods, instructions or products referred to in the content.