
Exploring the Dynamics of Land Surface Temperature in Jordan’s Local Climate Zones: A Comprehensive Assessment through Landsat Entire Archive and Google Earth Engine


Abstract
1. Introduction
2. Related Work and Original Contribution
3. Materials and Methods
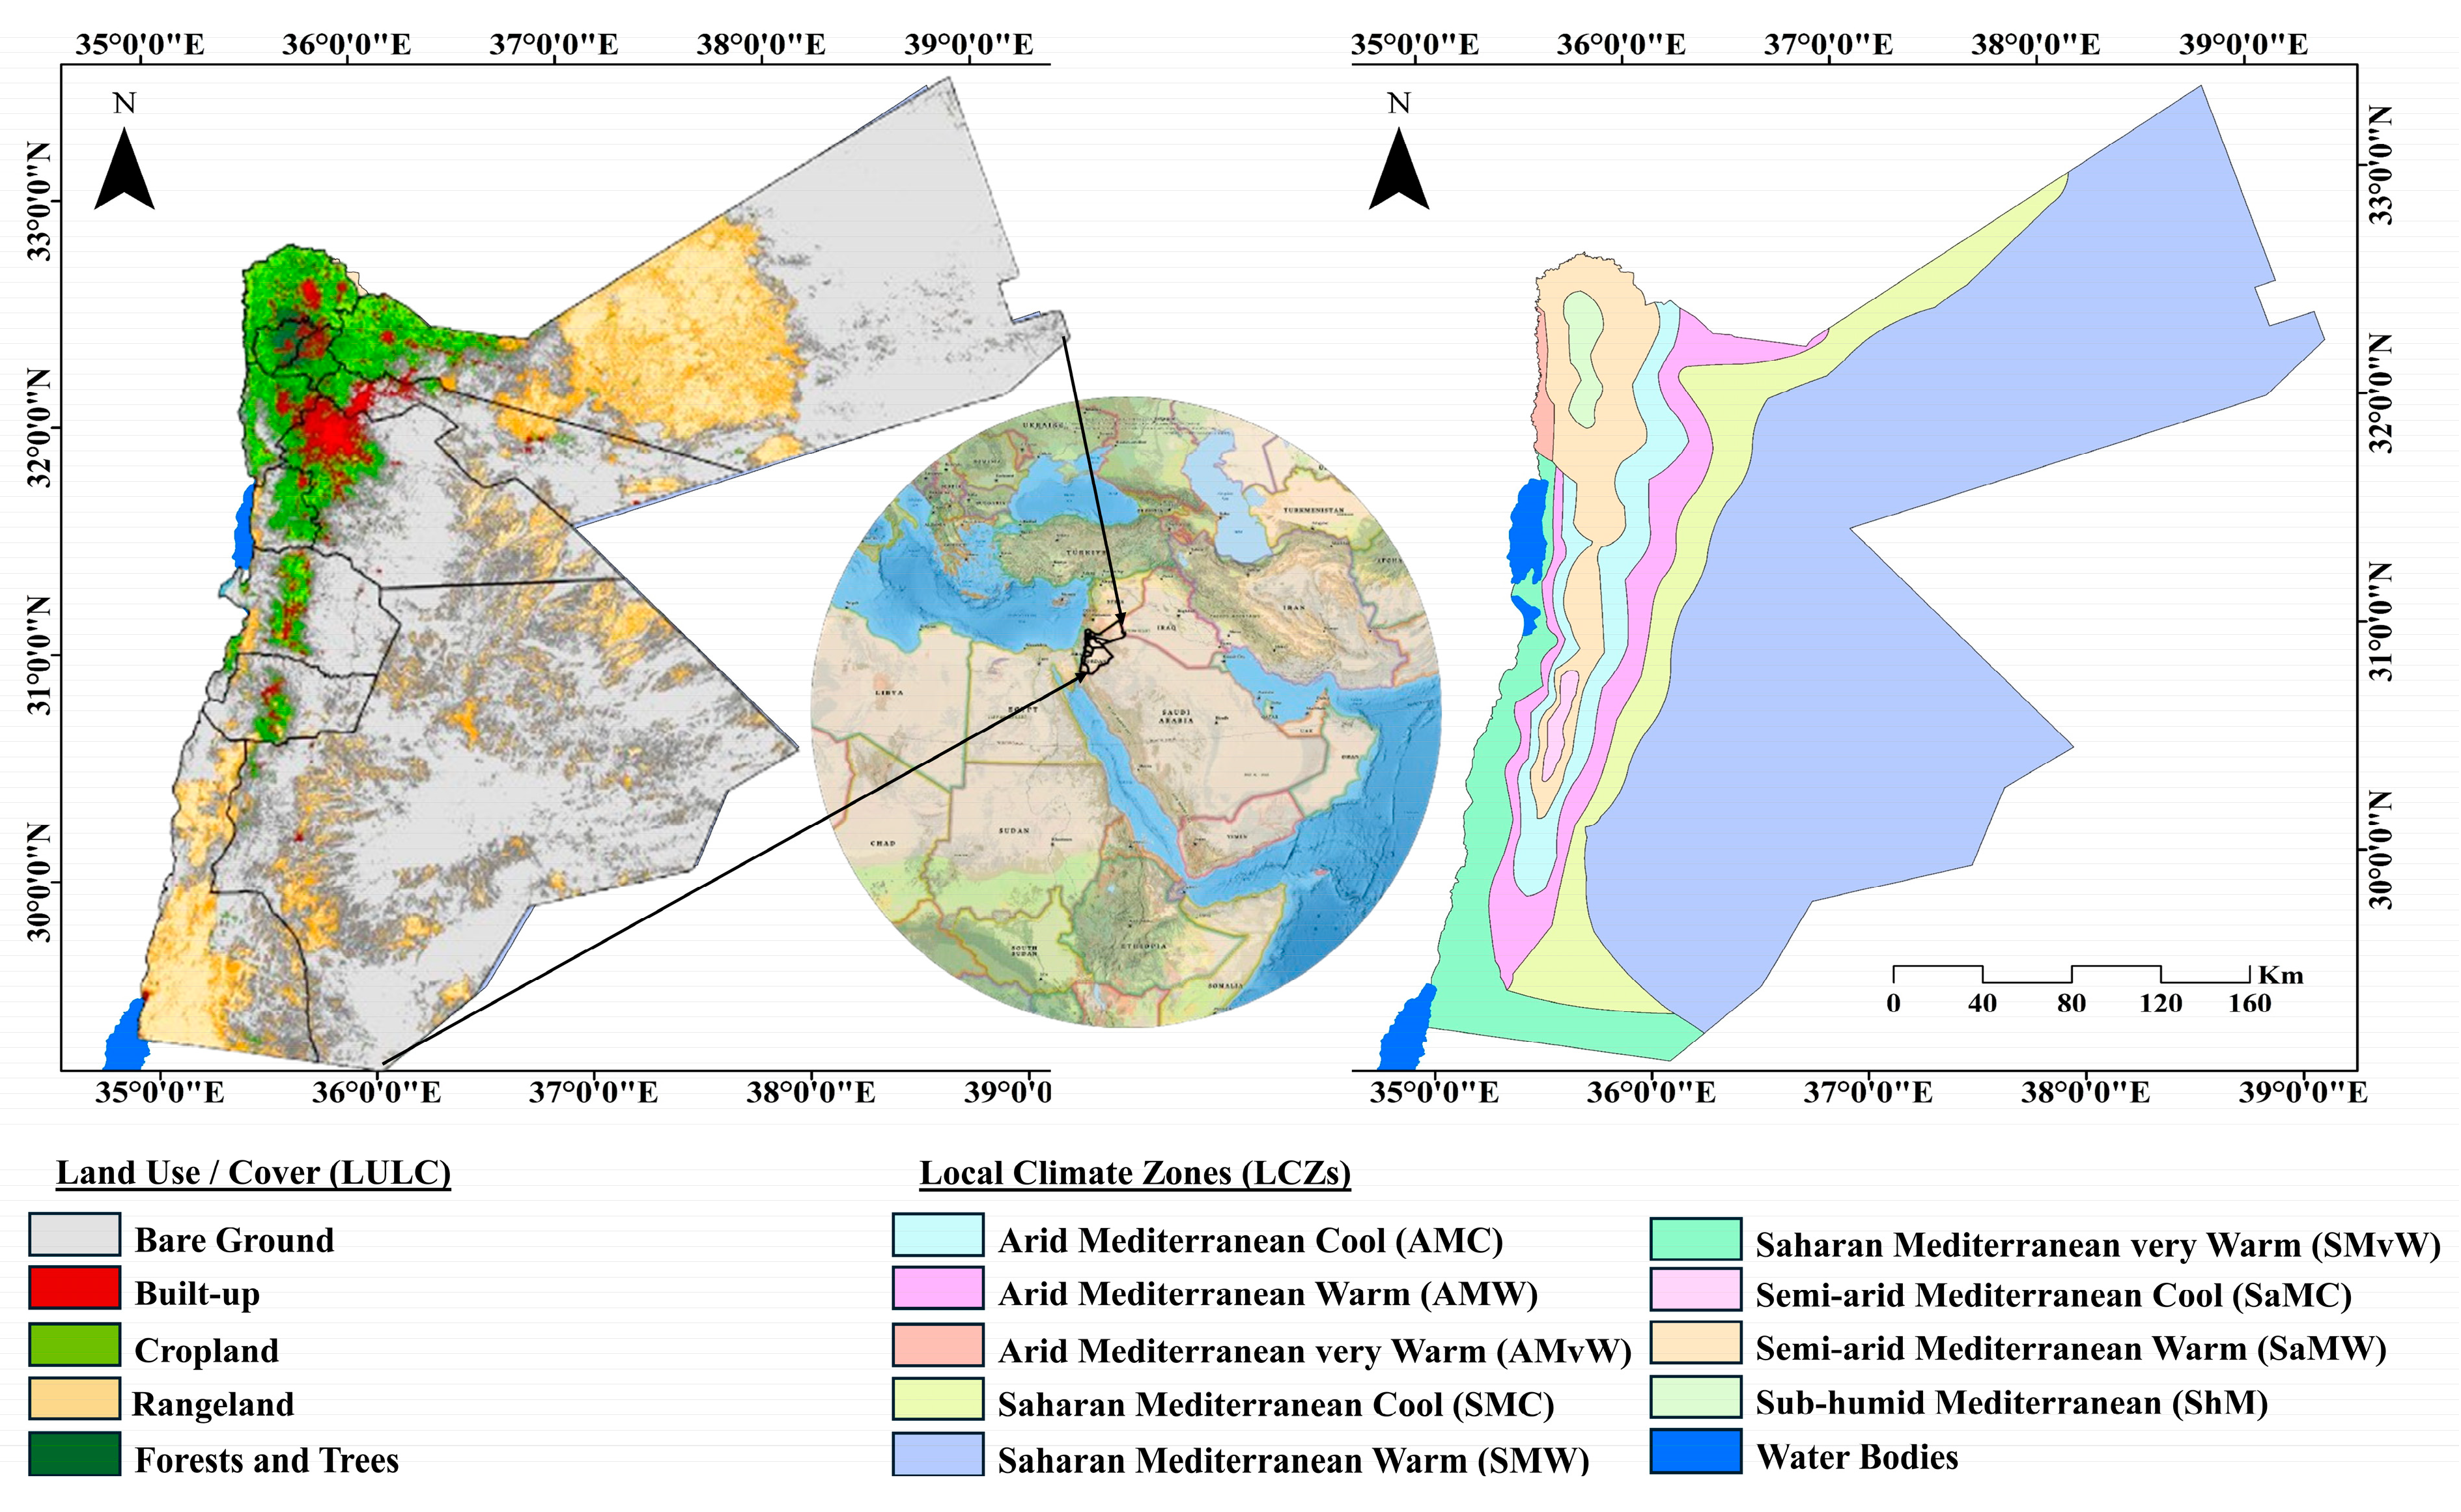
3.1. Study Area
3.2. Data Used
3.3. Landsat Data Preparation
3.4. Estimating the LST Trends in Jordan and at Its LCZs Using Linear Regression Analysis
3.5. Estimating the LST Trends in Jordan and at Its LCZs Using Mann-Kendall Test and Sen’s Slope
4. Results and Discussion
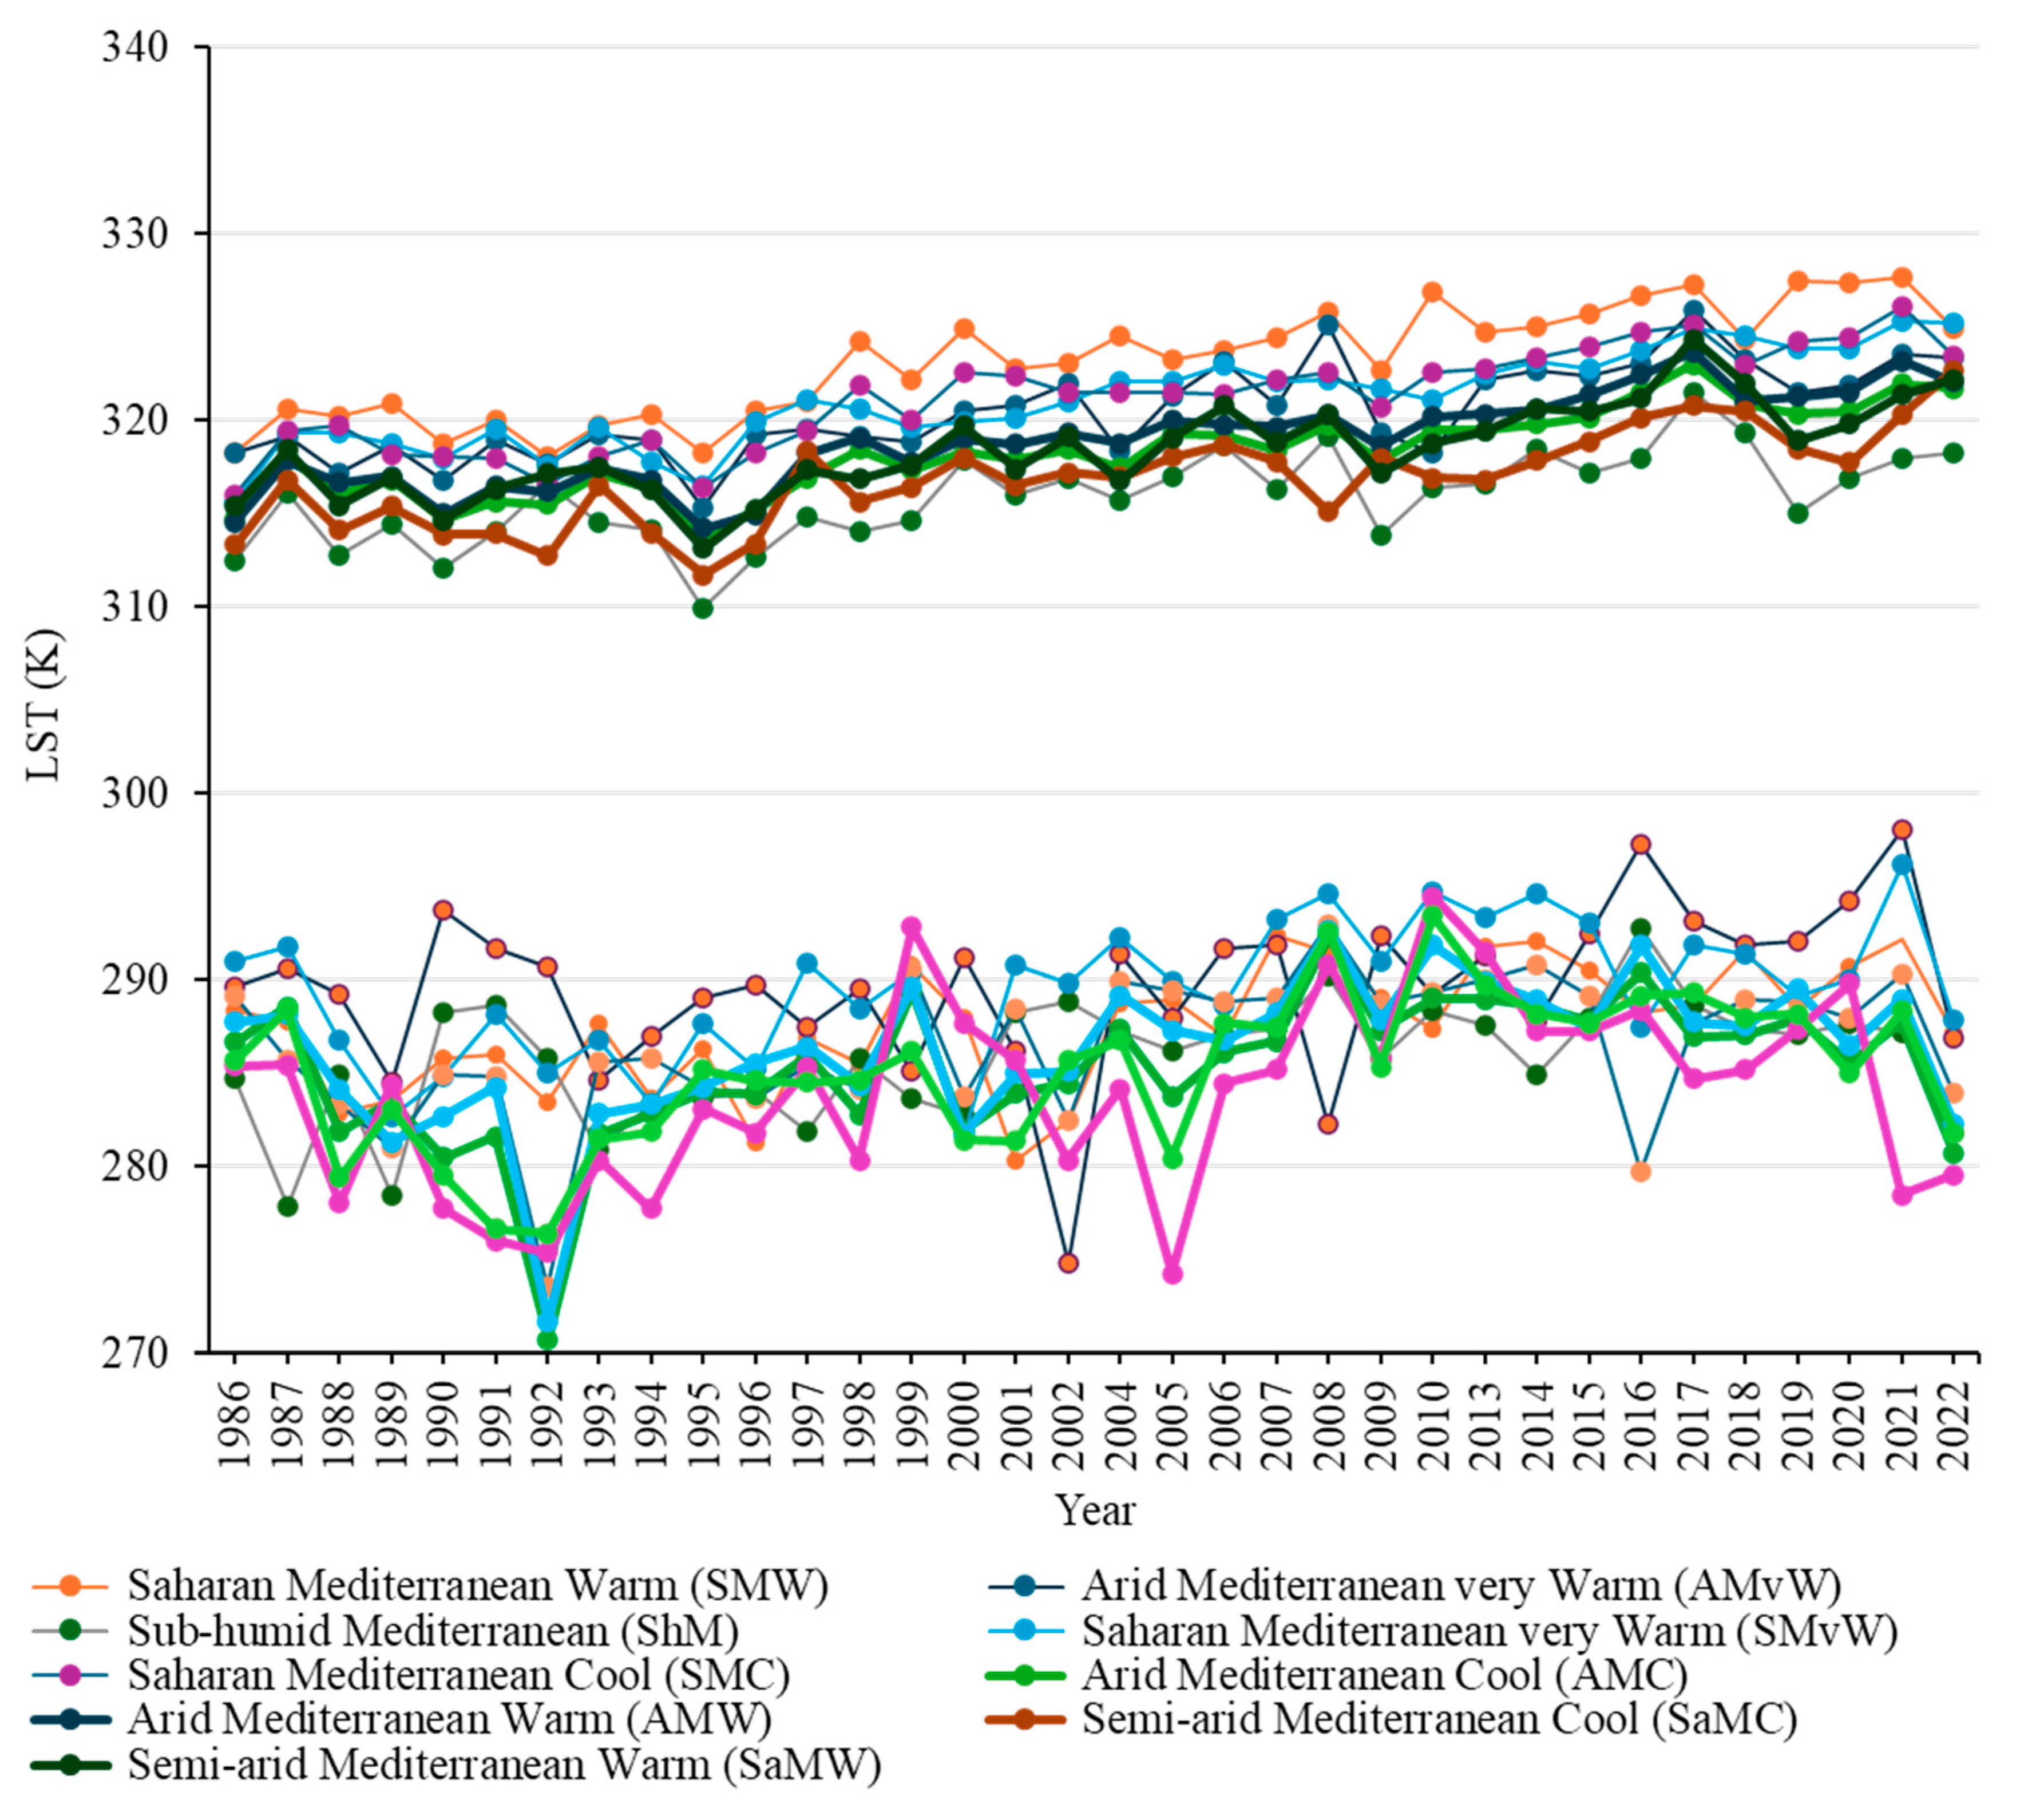
4.1. Analysis of Minimum and Maximum LST Values during 1986–2022
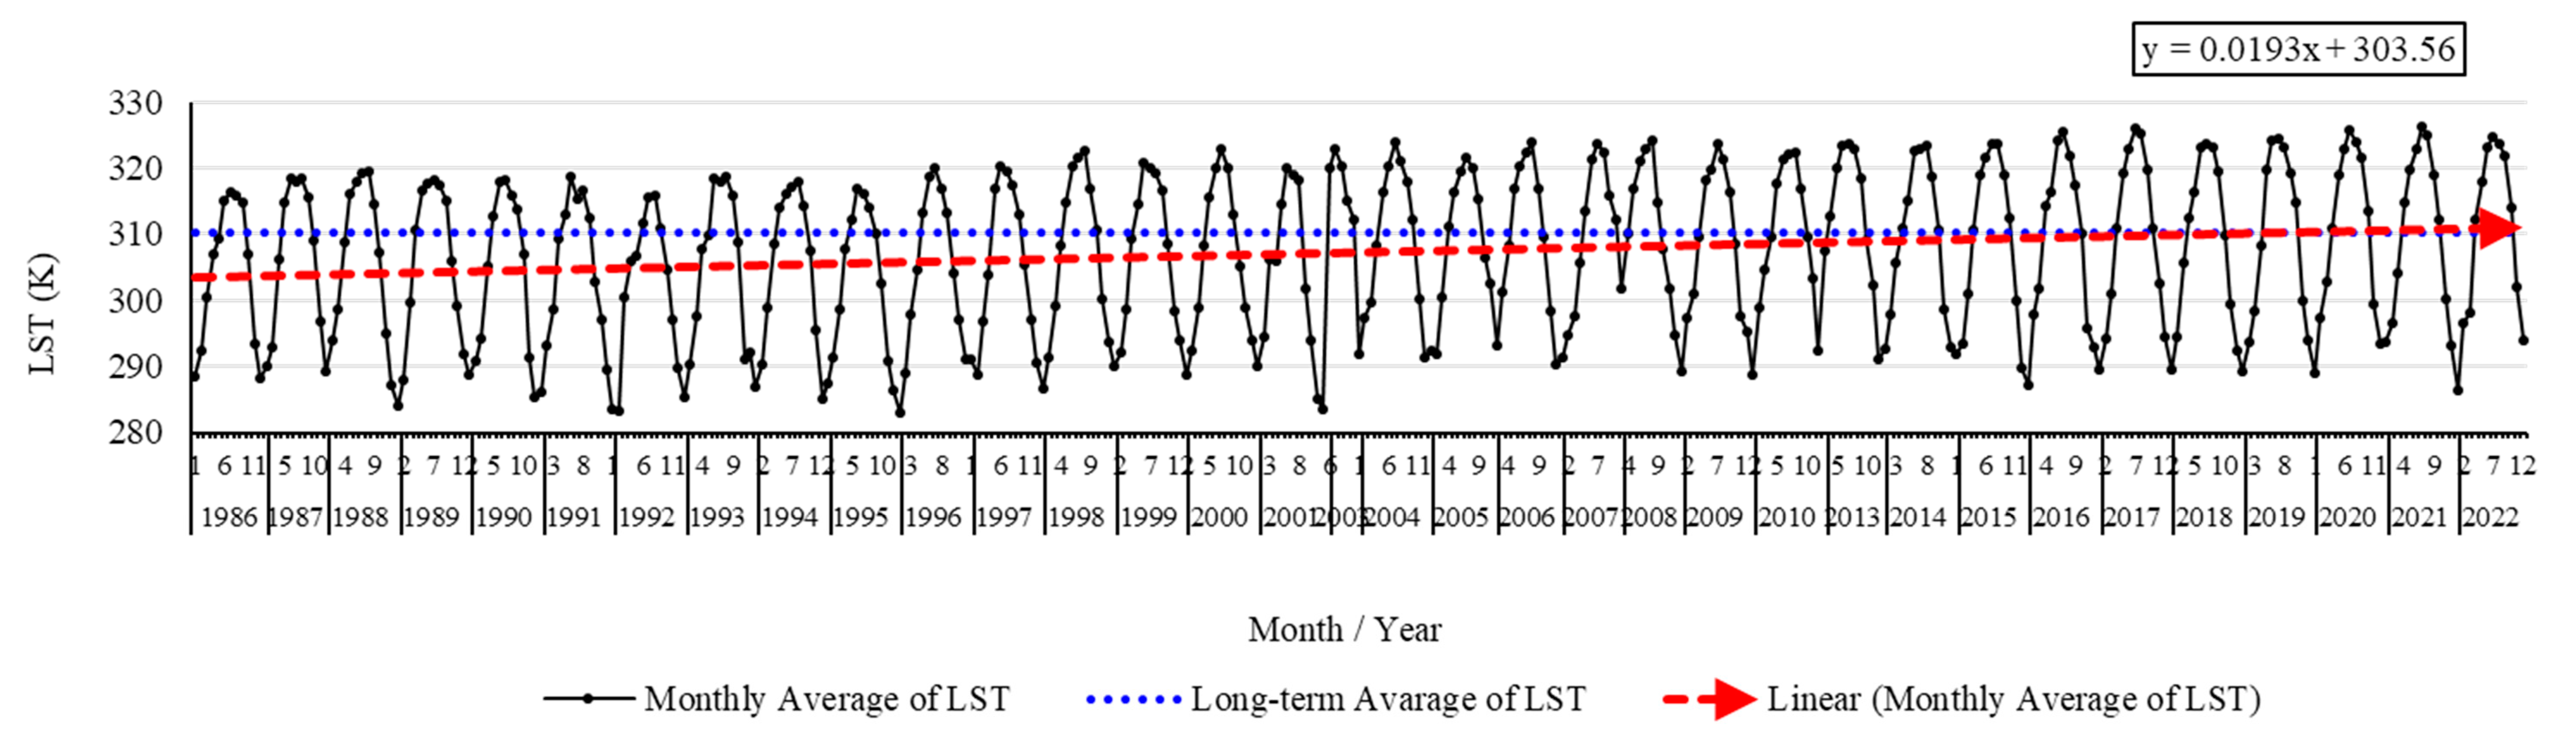
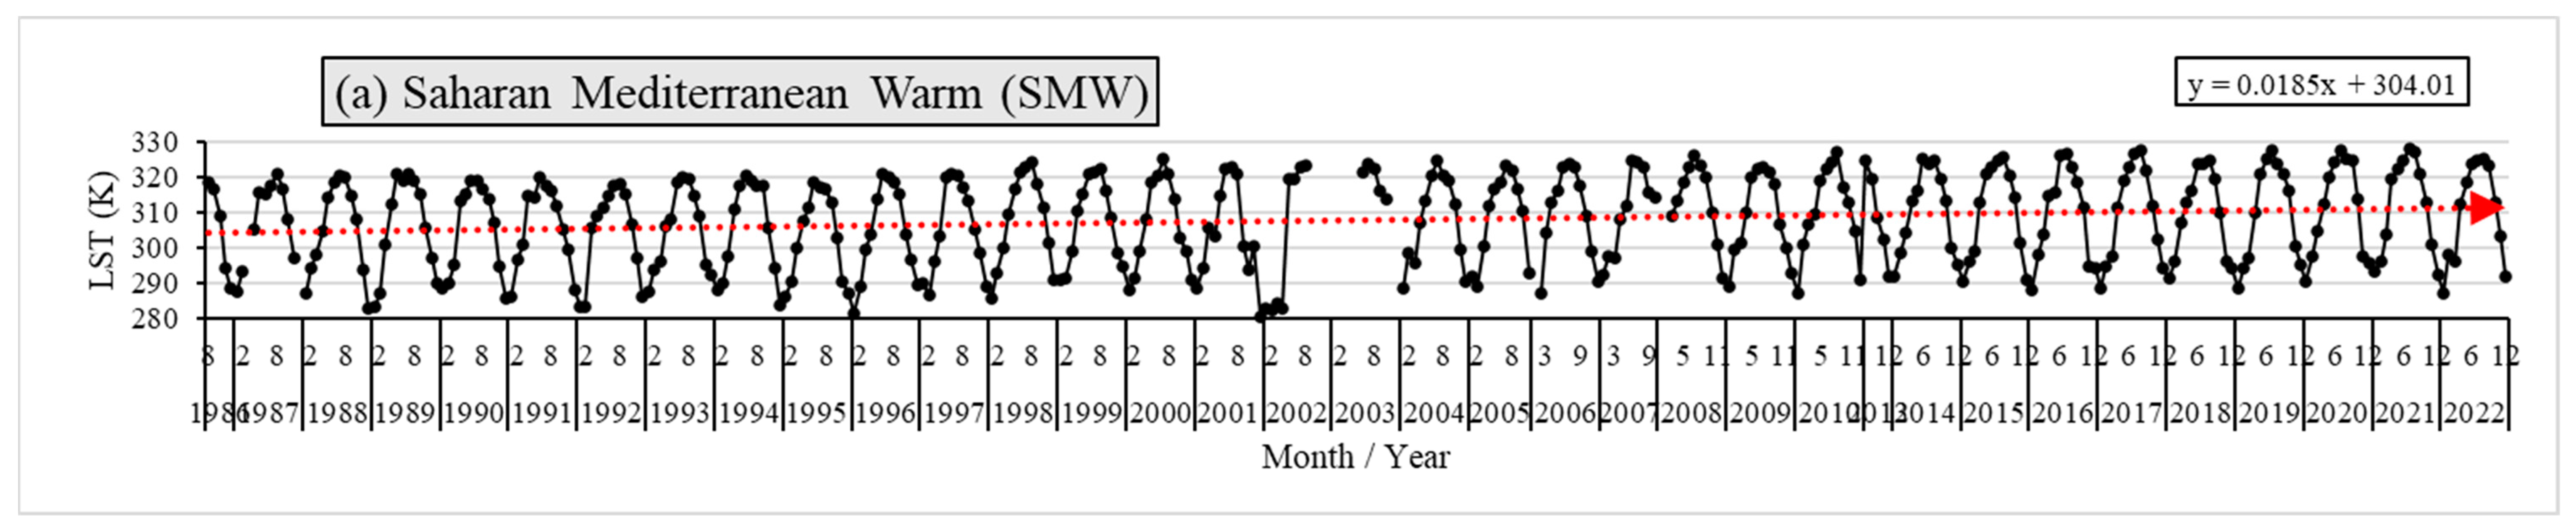
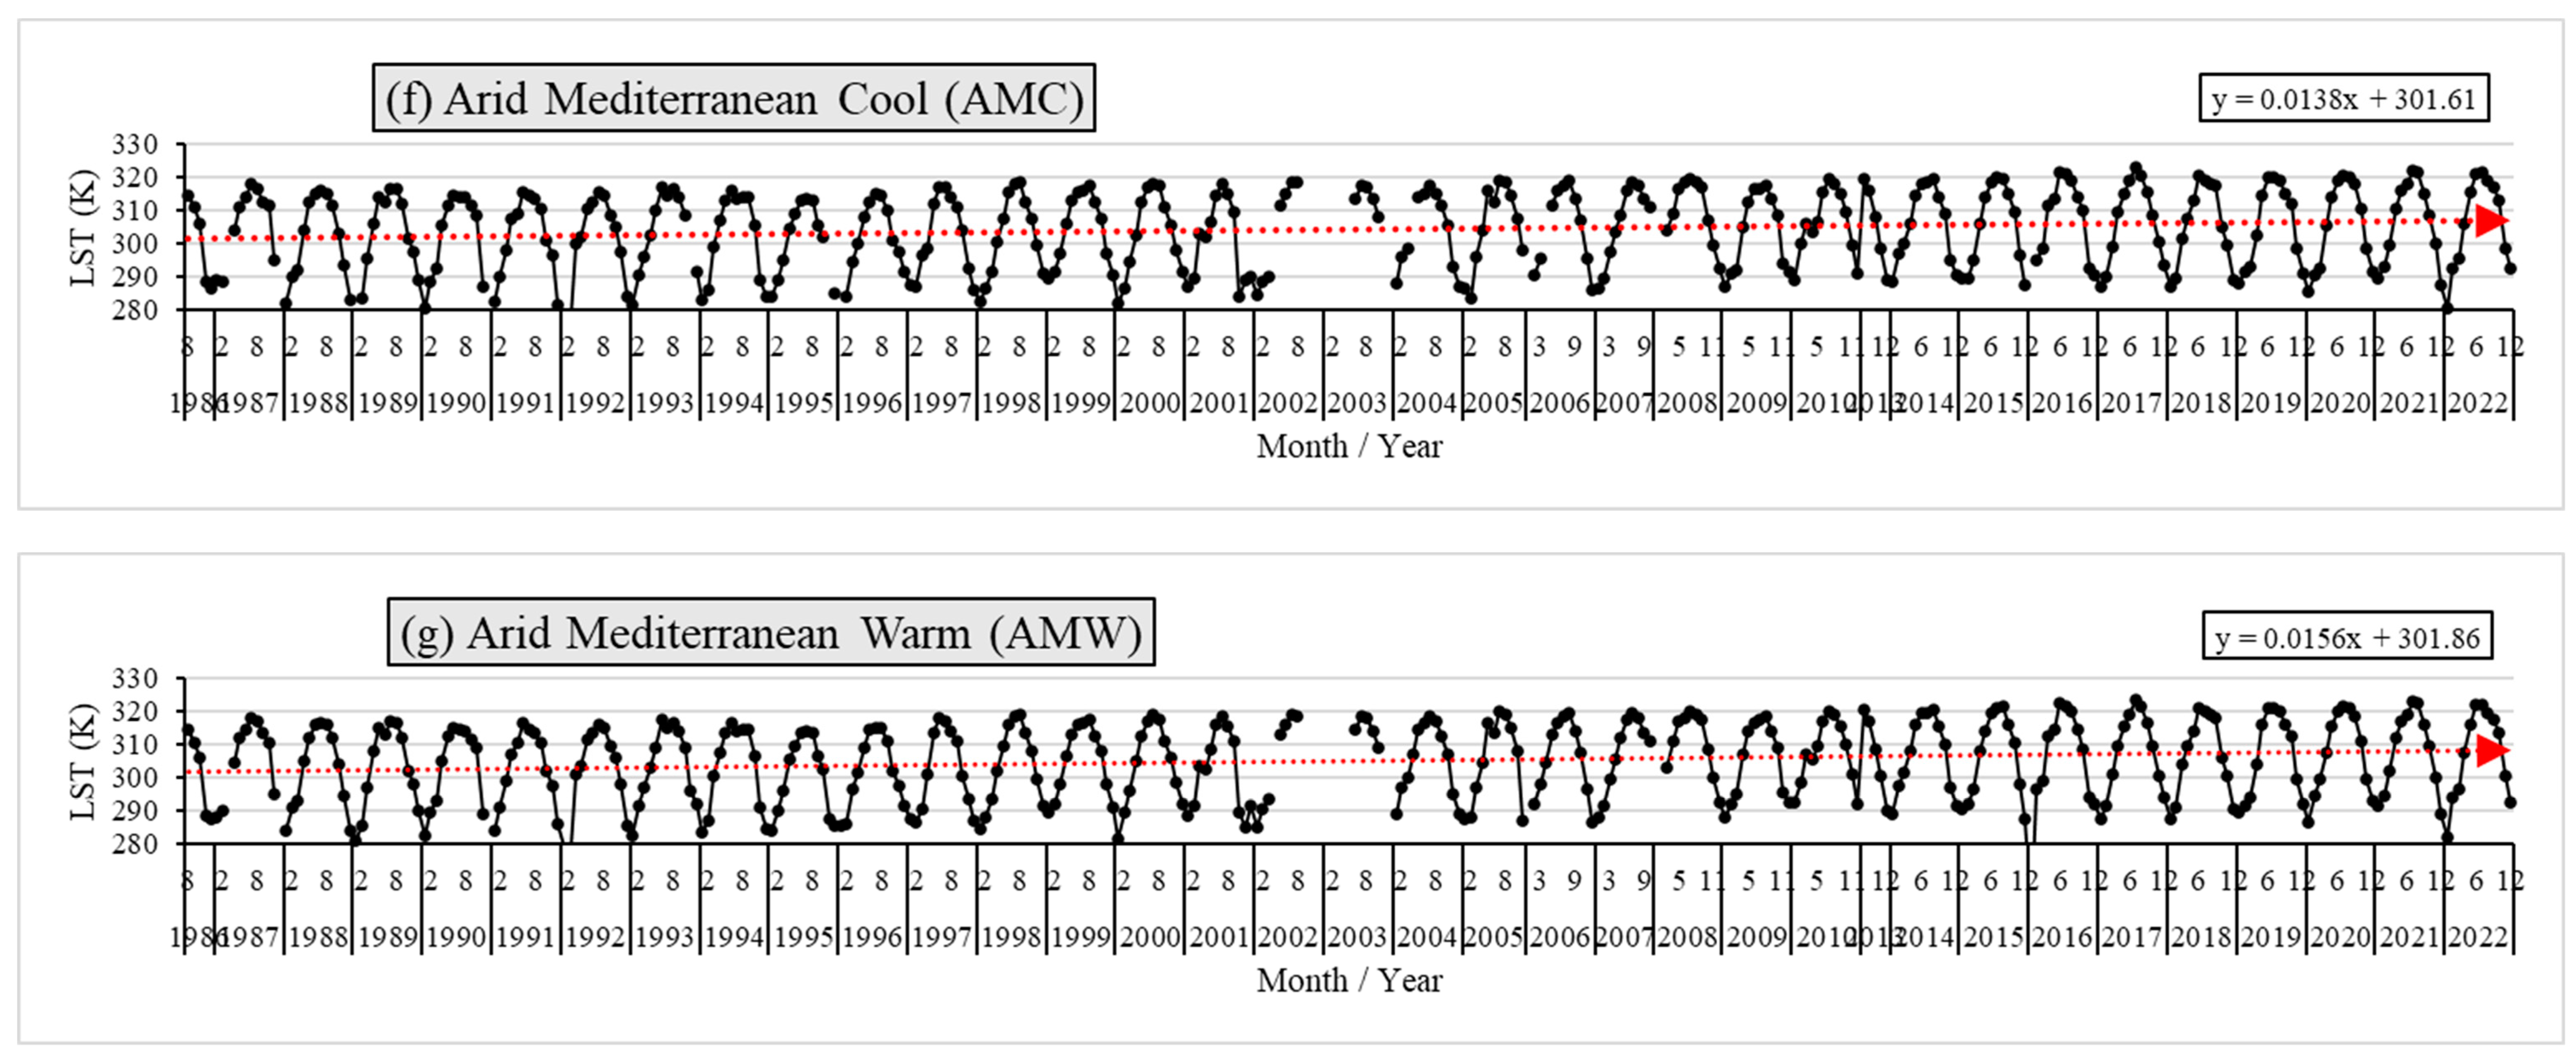
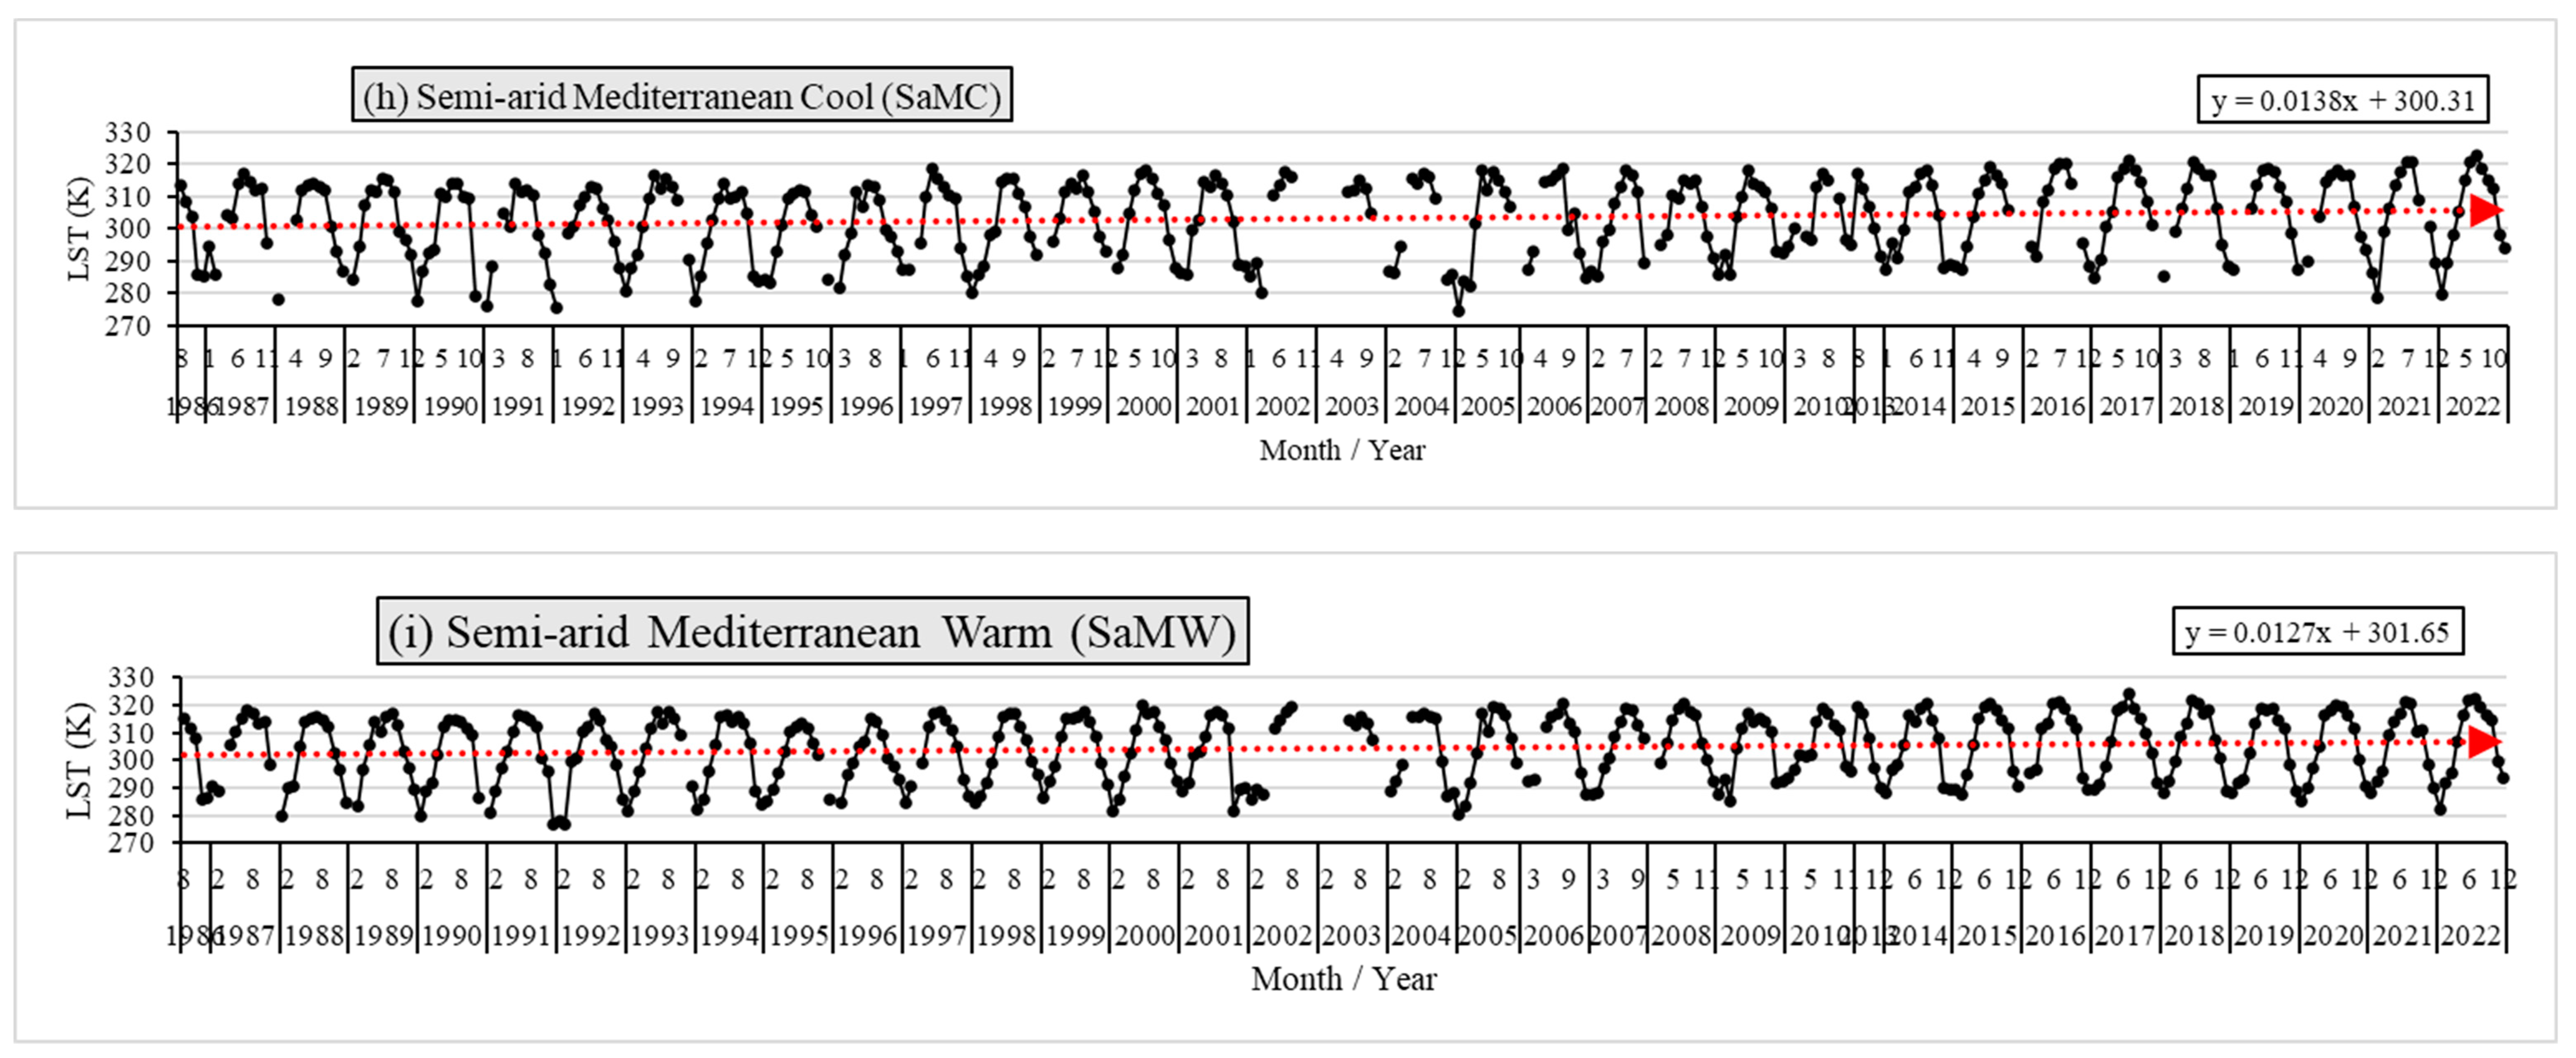
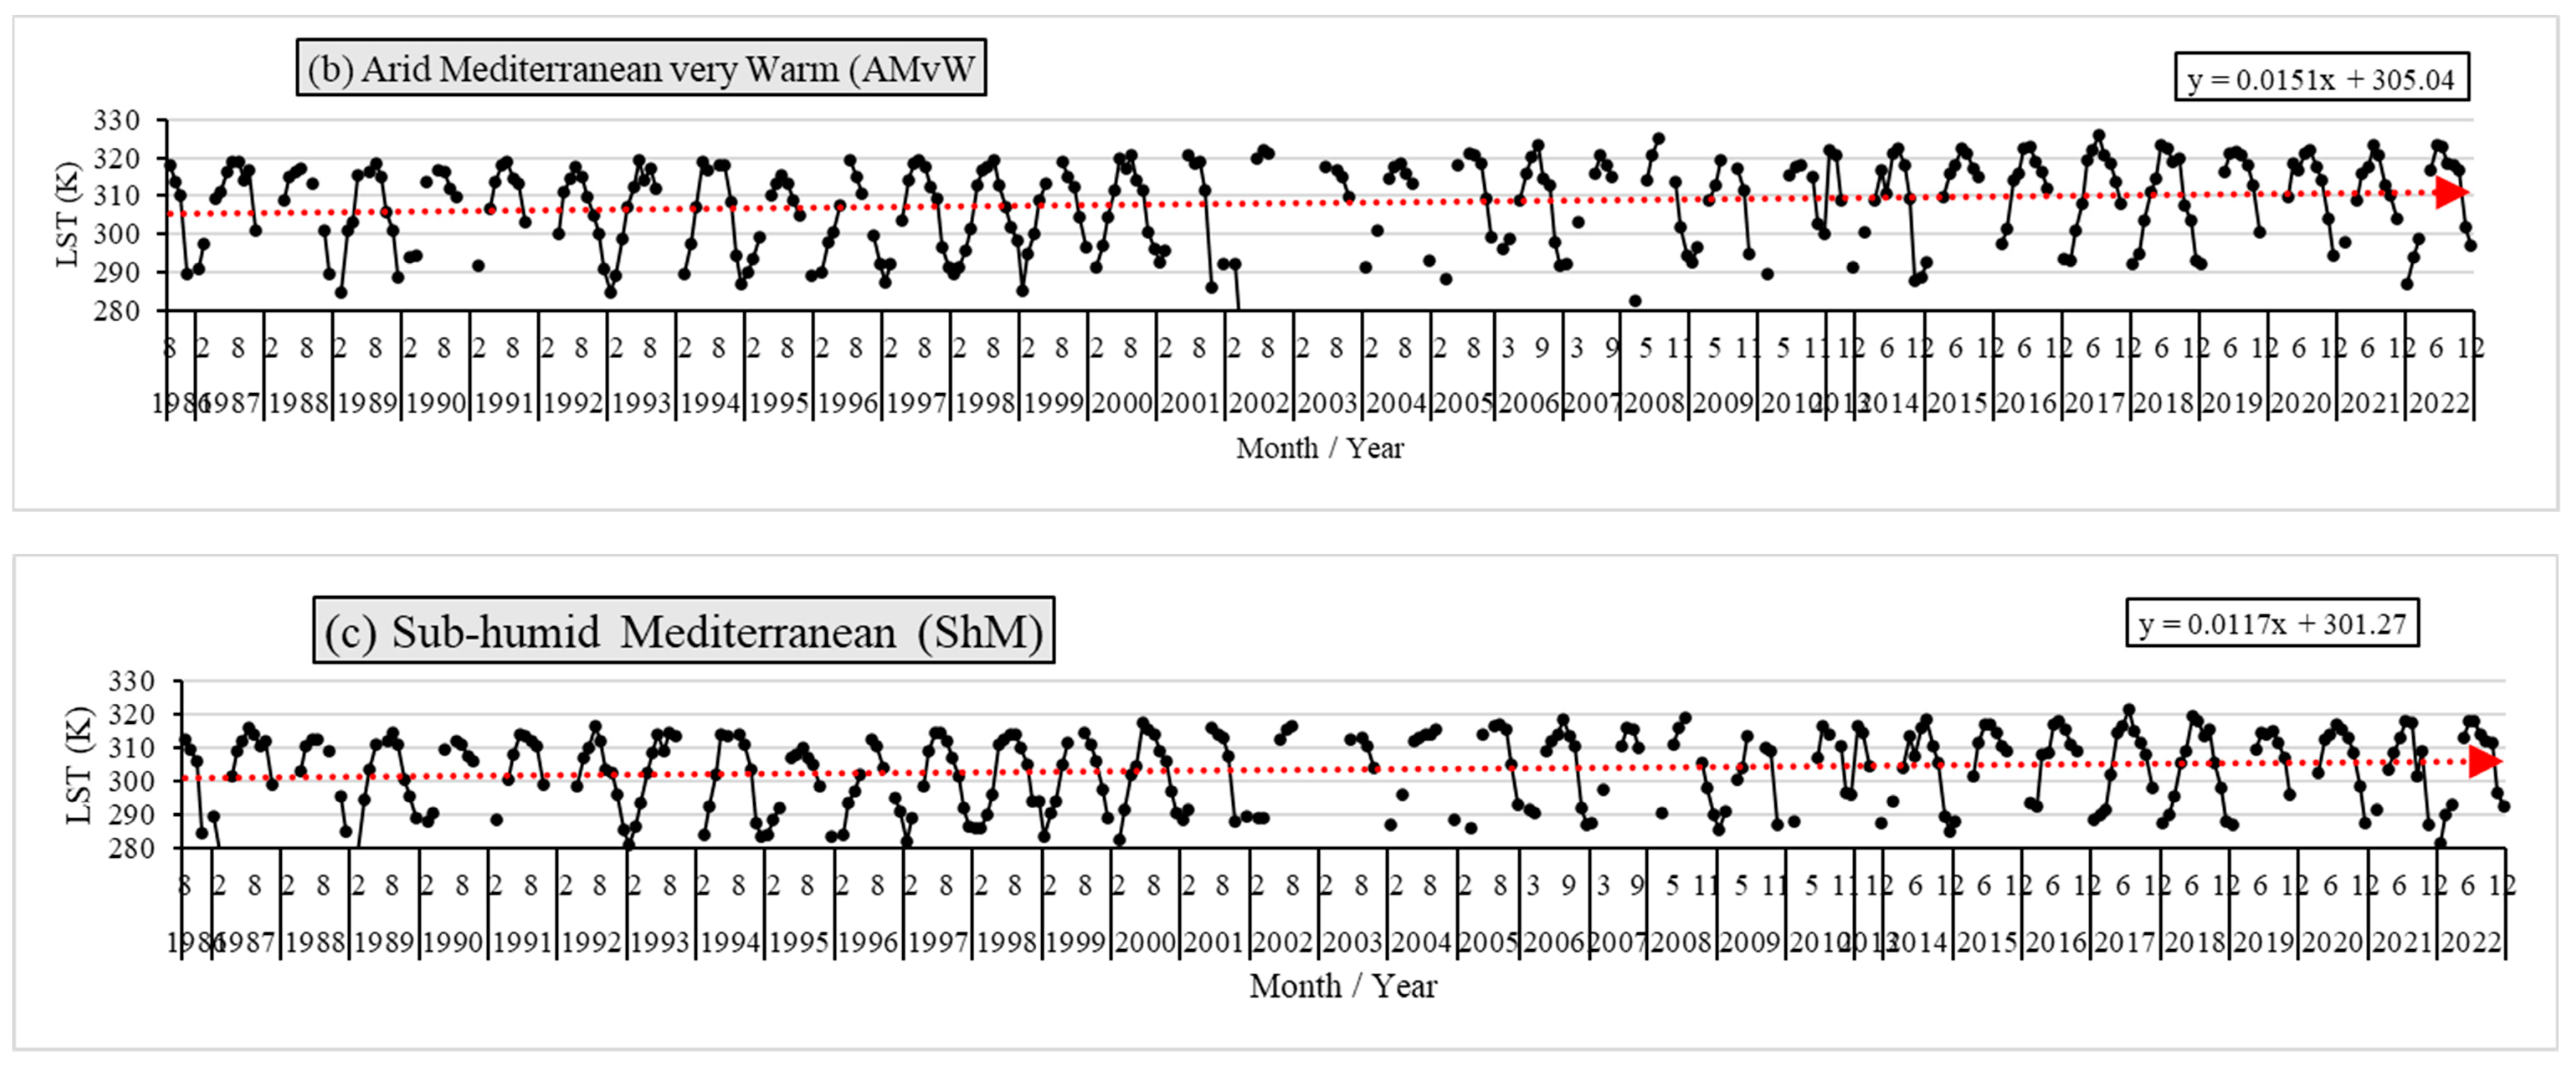
4.2. LST Trend in Jordan and Its LCZs Using Linear Regression Analysis
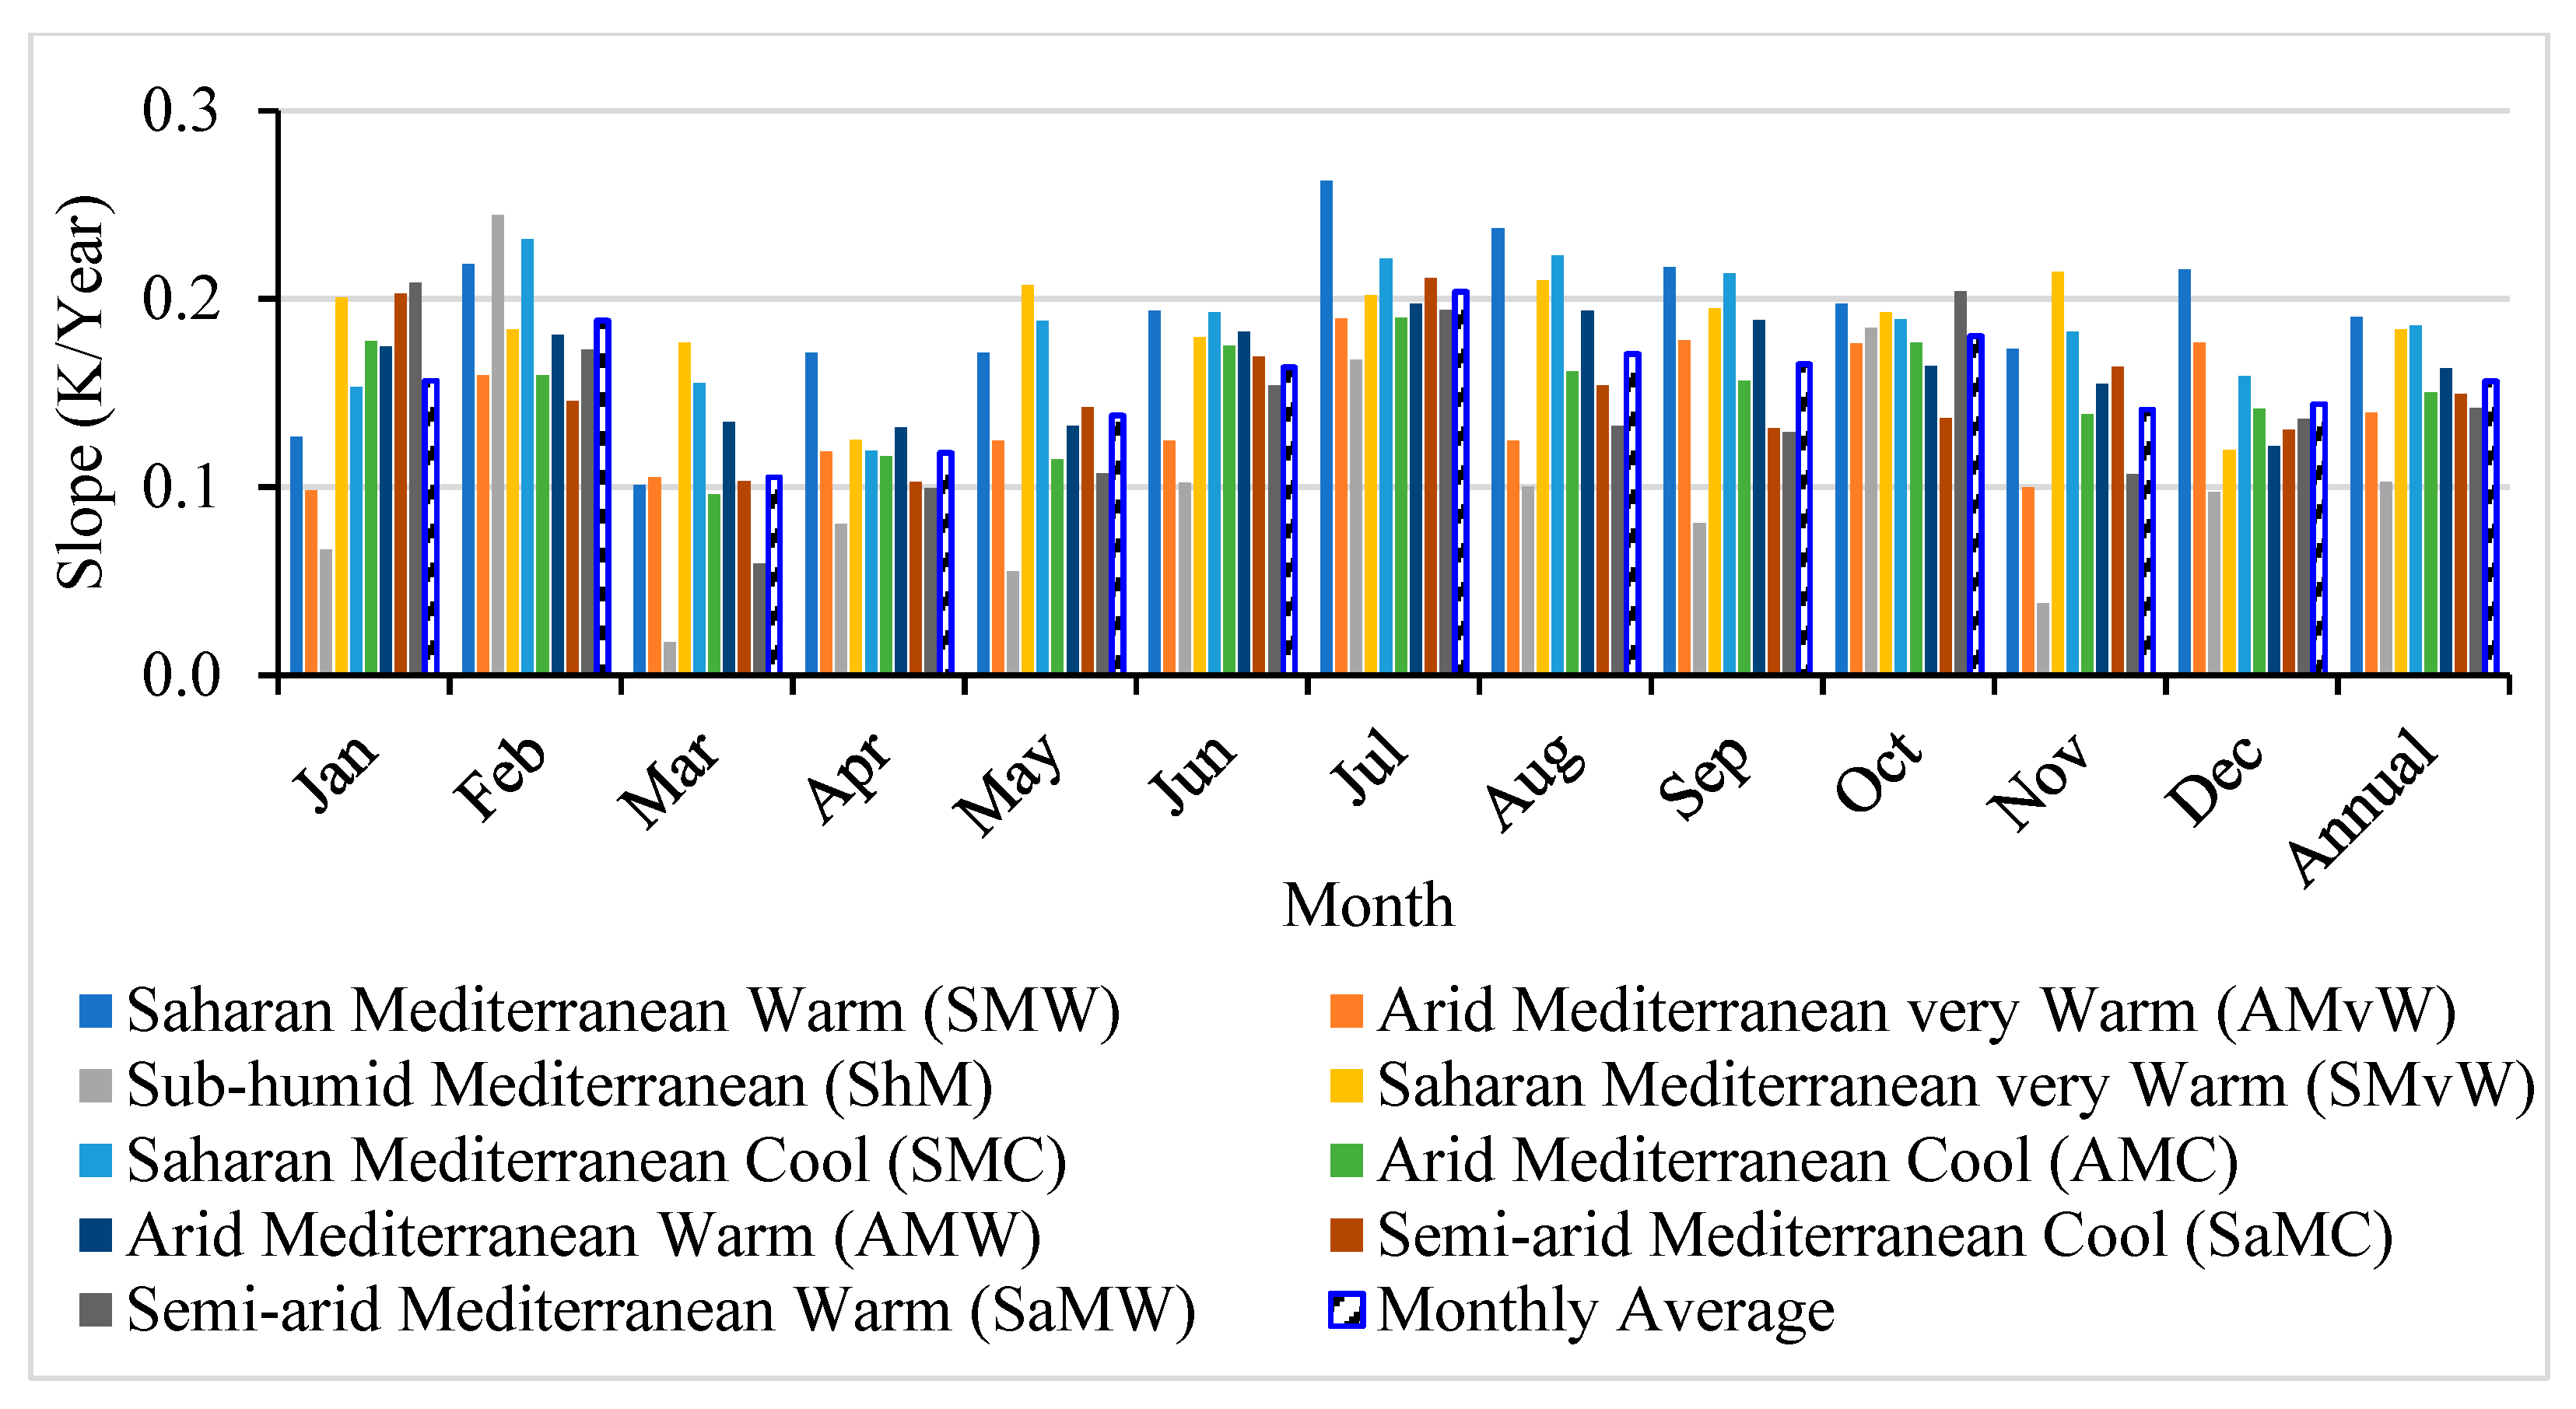
4.3. LST Trend at LCZs in Jordan Using the Mann–Kendall Trend Test and Sen’s Slope Estimator
5. Discussion
6. Conclusions
Author Contributions
Funding
Institutional Review Board Statement
Informed Consent Statement
Data Availability Statement
Acknowledgments
Conflicts of Interest
References
- Yang, J.; Ren, J.; Sun, D.; Xiao, X.; Xia, J.C.; Jin, C.; Li, X. Understanding Land Surface Temperature Impact Factors Based on Local Climate Zones. Sustain. Cities Soc. 2021, 69, 102818. [Google Scholar] [CrossRef]
- Stewart, I.D.; Oke, T.R.; Krayenhoff, E.S. Evaluation of the ‘Local Climate Zone’Scheme Using Temperature Observations and Model Simulations. Int. J. Climatol. 2014, 34, 1062–1080. [Google Scholar] [CrossRef]
- Allan, R.P.; Barlow, M.; Byrne, M.P.; Cherchi, A.; Douville, H.; Fowler, H.J.; Gan, T.Y.; Pendergrass, A.G.; Rosenfeld, D.; Swann, A.L. Advances in Understanding Large-Scale Responses of the Water Cycle to Climate Change. Ann. N. Y. Acad. Sci. 2020, 1472, 49–75. [Google Scholar] [CrossRef] [PubMed]
- Sillero, N. Climate Change in Action: Local Elevational Shifts on Iberian Amphibians and Reptiles. Reg. Environ. Chang. 2021, 21, 101. [Google Scholar] [CrossRef]
- Fricke, C.; Pongrácz, R.; Gál, T.M.; Savić, S.; Unger, J. Using Local Climate Zones to Compare Remotely Sensed Surface Temperatures in Temperate Cities and Hot Desert Cities. Morav. Geogr. Rep. 2020, 28, 48–60. [Google Scholar] [CrossRef]
- Geletič, J.; Lehnert, M.; Dobrovolnỳ, P. Land Surface Temperature Differences within Local Climate Zones, Based on Two Central European Cities. Remote Sens. 2016, 8, 788. [Google Scholar] [CrossRef]
- Yang, X.; Yao, L.; Jin, T.; Peng, L.L.; Jiang, Z.; Hu, Z.; Ye, Y. Assessing the Thermal Behavior of Different Local Climate Zones in the Nanjing Metropolis, China. Build. Environ. 2018, 137, 171–184. [Google Scholar] [CrossRef]
- Wulder, M.A.; Roy, D.P.; Radeloff, V.C.; Loveland, T.R.; Anderson, M.C.; Johnson, D.M.; Healey, S.; Zhu, Z.; Scambos, T.A.; Pahlevan, N. Fifty Years of Landsat Science and Impacts. Remote Sens. Environ. 2022, 280, 113195. [Google Scholar] [CrossRef]
- Sattari, F.; Hashim, M. A Brief Review of Land Surface Temperature Retrieval Methods from Thermal Satellite Sensors. Middle-East J. Sci. Res. 2014, 22, 757–768. [Google Scholar]
- Li, Z.-L.; Wu, H.; Duan, S.-B.; Zhao, W.; Ren, H.; Liu, X.; Leng, P.; Tang, R.; Ye, X.; Zhu, J. Satellite RS of Global Land Surface Temperature: Definition, Methods, Products, and Applications. Rev. Geophys. 2023, 61, e2022RG000777. [Google Scholar] [CrossRef]
- Nega, W.; Balew, A. The Relationship between Land Use Land Cover and Land Surface Temperature Using RS: Systematic Reviews of Studies Globally over the Past 5 Years. Environ. Sci. Pollut. Res. 2022, 29, 42493–42508. [Google Scholar] [CrossRef] [PubMed]
- Jaber, S.M.; Abu-Allaban, M.M. MODIS-Based Land Surface Temperature for Climate Variability and Change Research: The Tale of a Typical Semi-Arid to Arid Environment. Eur. J. Remote Sens. 2020, 53, 81–90. [Google Scholar] [CrossRef]
- Luintel, N.; Ma, W.; Ma, Y.; Wang, B.; Subba, S. Spatial and Temporal Variation of Daytime and Nighttime MODIS Land Surface Temperature across Nepal. Atmos. Ocean. Sci. Lett. 2019, 12, 305–312. [Google Scholar] [CrossRef]
- Dewan, A.; Kiselev, G.; Botje, D.; Mahmud, G.I.; Bhuian, M.H.; Hassan, Q.K. Surface Urban Heat Island Intensity in Five Major Cities of Bangladesh: Patterns, Drivers and Trends. Sustain. Cities Soc. 2021, 71, 102926. [Google Scholar] [CrossRef]
- Eleftheriou, D.; Kiachidis, K.; Kalmintzis, G.; Kalea, A.; Bantasis, C.; Koumadoraki, P.; Spathara, M.E.; Tsolaki, A.; Tzampazidou, M.I.; Gemitzi, A. Determination of Annual and Seasonal Daytime and Nighttime Trends of MODIS LST over Greece-Climate Change Implications. Sci. Total Environ. 2018, 616, 937–947. [Google Scholar] [CrossRef] [PubMed]
- Hassan, Q.K.; Ejiagha, I.R.; Ahmed, M.R.; Gupta, A.; Rangelova, E.; Dewan, A. RS of Local Warming Trend in Alberta, Canada during 2001–2020, and Its Relationship with Large-Scale Atmospheric Circulations. Remote Sens. 2021, 13, 3441. [Google Scholar] [CrossRef]
- Yang, M.; Zhao, W.; Zhan, Q.; Xiong, D. Spatiotemporal Patterns of Land Surface Temperature Change in the Tibetan Plateau Based on MODIS/Terra Daily Product from 2000 to 2018. IEEE J. Sel. Top. Appl. Earth Obs. Remote Sens. 2021, 14, 6501–6514. [Google Scholar] [CrossRef]
- Liu, J.; Hagan, D.F.T.; Liu, Y. Global Land Surface Temperature Change (2003–2017) and Its Relationship with Climate Drivers: AIRS, MODIS, and ERA5-Land Based Analysis. Remote Sens. 2020, 13, 44. [Google Scholar] [CrossRef]
- Yan, Y.; Mao, K.; Shi, J.; Piao, S.; Shen, X.; Dozier, J.; Liu, Y.; Ren, H.; Bao, Q. Driving Forces of Land Surface Temperature Anomalous Changes in North America in 2002–2018. Sci. Rep. 2020, 10, 6931. [Google Scholar] [CrossRef]
- Shawky, M.; Ahmed, M.R.; Ghaderpour, E.; Gupta, A.; Achari, G.; Dewan, A.; Hassan, Q.K. RS-Derived Land Surface Temperature Trends over South Asia. Ecol. Inform. 2023, 74, 101969. [Google Scholar] [CrossRef]
- Fu, P.; Weng, Q. Temporal Dynamics of Land Surface Temperature from Landsat TIR Time Series Images. IEEE Geosci. Remote Sens. Lett. 2015, 12, 2175–2179. [Google Scholar]
- Sekertekin, A.; Arslan, N.; Bilgili, M. Modeling Diurnal Land Surface Temperature on a Local Scale of an Arid Environment Using Artificial Neural Network (ANN) and Time Series of Landsat-8 Derived Spectral Indexes. J. Atmos. Sol.-Terr. Phys. 2020, 206, 105328. [Google Scholar] [CrossRef]
- Athick, A.M.A.; Shankar, K.; Naqvi, H.R. Data on Time Series Analysis of Land Surface Temperature Variation in Response to Vegetation Indices in Twelve Wereda of Ethiopia Using Mono Window, Split Window Algorithm and Spectral Radiance Model. Data Brief 2019, 27, 104773. [Google Scholar] [CrossRef] [PubMed]
- Gorelick, N.; Hancher, M.; Dixon, M.; Ilyushchenko, S.; Thau, D.; Moore, R. Google Earth Engine: Planetary-Scale Geospatial Analysis for Everyone. Remote Sens. Environ. 2017, 202, 18–27. [Google Scholar] [CrossRef]
- Amani, M.; Ghorbanian, A.; Ahmadi, S.A.; Kakooei, M.; Moghimi, A.; Mirmazloumi, S.M.; Moghaddam, S.H.A.; Mahdavi, S.; Ghahremanloo, M.; Parsian, S. Google Earth Engine Cloud Computing Platform for RS Big Data Applications: A Comprehensive Review. IEEE J. Sel. Top. Appl. Earth Obs. Remote Sens. 2020, 13, 5326–5350. [Google Scholar] [CrossRef]
- Tamiminia, H.; Salehi, B.; Mahdianpari, M.; Quackenbush, L.; Adeli, S.; Brisco, B. Google Earth Engine for Geo-Big Data Applications: A Meta-Analysis and Systematic Review. ISPRS J. Photogramm. Remote Sens. 2020, 164, 152–170. [Google Scholar] [CrossRef]
- Ermida, S.L.; Soares, P.; Mantas, V.; Göttsche, F.-M.; Trigo, I.F. Google Earth Engine Open-Source Code for Land Surface Temperature Estimation from the Landsat Series. Remote Sens. 2020, 12, 1471. [Google Scholar] [CrossRef]
- de Almeida, C.R.; Garcia, N.; Campos, J.C.; Alírio, J.; Arenas-Castro, S.; Gonçalves, A.; Sillero, N.; Teodoro, A.C. Time-Series Analyses of Land Surface Temperature Changes with Google Earth Engine in a Mountainous Region. Heliyon 2023, 9, e18846. [Google Scholar] [CrossRef]
- Bera, D.; Chatterjee, N.D.; Ghosh, S.; Dinda, S.; Bera, S. Recent Trends of Land Surface Temperature in Relation to the Influencing Factors Using Google Earth Engine Platform and Time Series Products in Megacities of India. J. Clean. Prod. 2022, 379, 134735. [Google Scholar] [CrossRef]
- Roy, B.; Bari, E. Examining the Relationship between Land Surface Temperature and Landscape Features Using Spectral Indices with Google Earth Engine. Heliyon 2022, 8, e10668. [Google Scholar] [CrossRef] [PubMed]
- Wang, M.; Zhang, Z.; Hu, T.; Wang, G.; He, G.; Zhang, Z.; Li, H.; Wu, Z.; Liu, X. An Efficient Framework for Producing Landsat-Based Land Surface Temperature Data Using Google Earth Engine. IEEE J. Sel. Top. Appl. Earth Obs. Remote Sens. 2020, 13, 4689–4701. [Google Scholar] [CrossRef]
- Murtaza, K.O.; Shafai, S.; Shahid, P.; Romshoo, S.A. Understanding the Linkages between Spatio-Temporal Urban Land System Changes and Land Surface Temperature in Srinagar City, India, Using Image Archives from Google Earth Engine. Environ. Sci. Pollut. Res. Int. 2023, 30, 107281–107295. [Google Scholar] [CrossRef]
- Ababsa, M. (Ed.) Atlas of Jordan: History, Territories and Society; Contemporain publications; Presses de l’Ifpo: Beyrouth, Lebanon, 2014; ISBN 978-2-35159-438-4. [Google Scholar]
- Cook, M.; Schott, J.R.; Mandel, J.; Raqueno, N. Development of an Operational Calibration Methodology for the Landsat Thermal Data Archive and Initial Testing of the Atmospheric Compensation Component of a Land Surface Temperature (LST) Product from the Archive. Remote Sens. 2014, 6, 11244–11266. [Google Scholar] [CrossRef]
- Alwadi, Y.; Abdulla, F. Spatiotemporal Analysis of Heat Waves in Jordan. Available online: https://www.researchsquare.com (accessed on 16 September 2023).
- Al-Hadidi, L.; Sweity, A. Potential Impact of Climate Change on Shifting the Calendar of Rainfed Crops Produced in Jordan. Int. J. Glob. Warm. 2023, 30, 282–295. [Google Scholar] [CrossRef]
- Shehadeh, N.; Tarawneh, F. Impact of Climate Change upon Summer heat Waves in Jordan. J. Am. Sci. 2014, 10, 46–52. [Google Scholar]
- Zeitoun, M.; Jaradat, S. Estimation of the Earth surface temperature using LANDSAT 8 sensor data: In Irbid during the heat waves 2020: A case study. Assoc. Arab. Univ. J. Arts 2024, 21, 21–51. [Google Scholar]
- Zeitoun, M. Analysis of Temperature Anomalies During the Spring Months in Jordan. Int. J. Geoinformatics 2024, 20, 88–98. [Google Scholar] [CrossRef]


| Collection 2 Surface Temperature | Collection 1 Surface Temperature | |
|---|---|---|
| Fill Value | 0 | −9999 |
| Scaling Factor | 0.00341802 + 149.0 | 0.1 |
| Data Type | Unsigned 16-bit integer | Signed 16-bit integer |
| Valid Range | 1–65,535 | 1500–3730 |
| Atmospheric Reanalysis Source | GEOS-5 FP-IT (2000-present) MERRA-2 (1982–1999) | NARR |
| Quality Band | L1 QA_Pixel L1 QA_RADSAT L2 SR_QA_AEROSOL | Level-2 PIXELQA Level-2 RADSATQA Level-2 SRAEROSOLQA |
| Local Climate Zone | LTAmin | LTAmin_std | LTAmax | LTAmax_std |
|---|---|---|---|---|
| Saharan Mediterranean Warm (SMW) | 287.6 | 3.2 | 323.2 | 2.9 |
| Arid Mediterranean very Warm (AMvW) | 289.6 | 4.3 | 320.4 | 2.4 |
| Sub-humid Mediterranean (ShM) | 285.8 | 3.2 | 315.8 | 2.4 |
| Saharan Mediterranean very Warm (SMvW) | 289.5 | 3.6 | 321.1 | 2.4 |
| Saharan Mediterranean Cool (SMC) | 286.5 | 3.8 | 321.2 | 2.6 |
| Arid Mediterranean Cool (AMC) | 285.2 | 3.9 | 318.3 | 2.2 |
| Arid Mediterranean Warm (AMW) | 286.2 | 3.9 | 318.9 | 2.4 |
| Semi-arid Mediterranean Cool (SaMC) | 284.0 | 5.0 | 316.8 | 2.5 |
| Semi-arid Mediterranean Warm (SaMW) | 285.1 | 4.0 | 318.3 | 2.4 |
| Local Climate Zone | Rate of Change (Slope) K/Year |
|---|---|
| Sub-humid Mediterranean (ShM) | 0.0117 |
| Semi-arid Mediterranean Warm (SaMW) | 0.0127 |
| Semi-arid Mediterranean Cool (SaMC) | 0.0138 |
| Arid Mediterranean Cool (AMC) | 0.0139 |
| Arid Mediterranean very Warm (AMvW) | 0.0151 |
| Arid Mediterranean Warm (AMW) | 0.0156 |
| Saharan Mediterranean very Warm (SMvW) | 0.0169 |
| Saharan Mediterranean Cool (SMC) | 0.0184 |
| Saharan Mediterranean Warm (SMW) | 0.0185 |
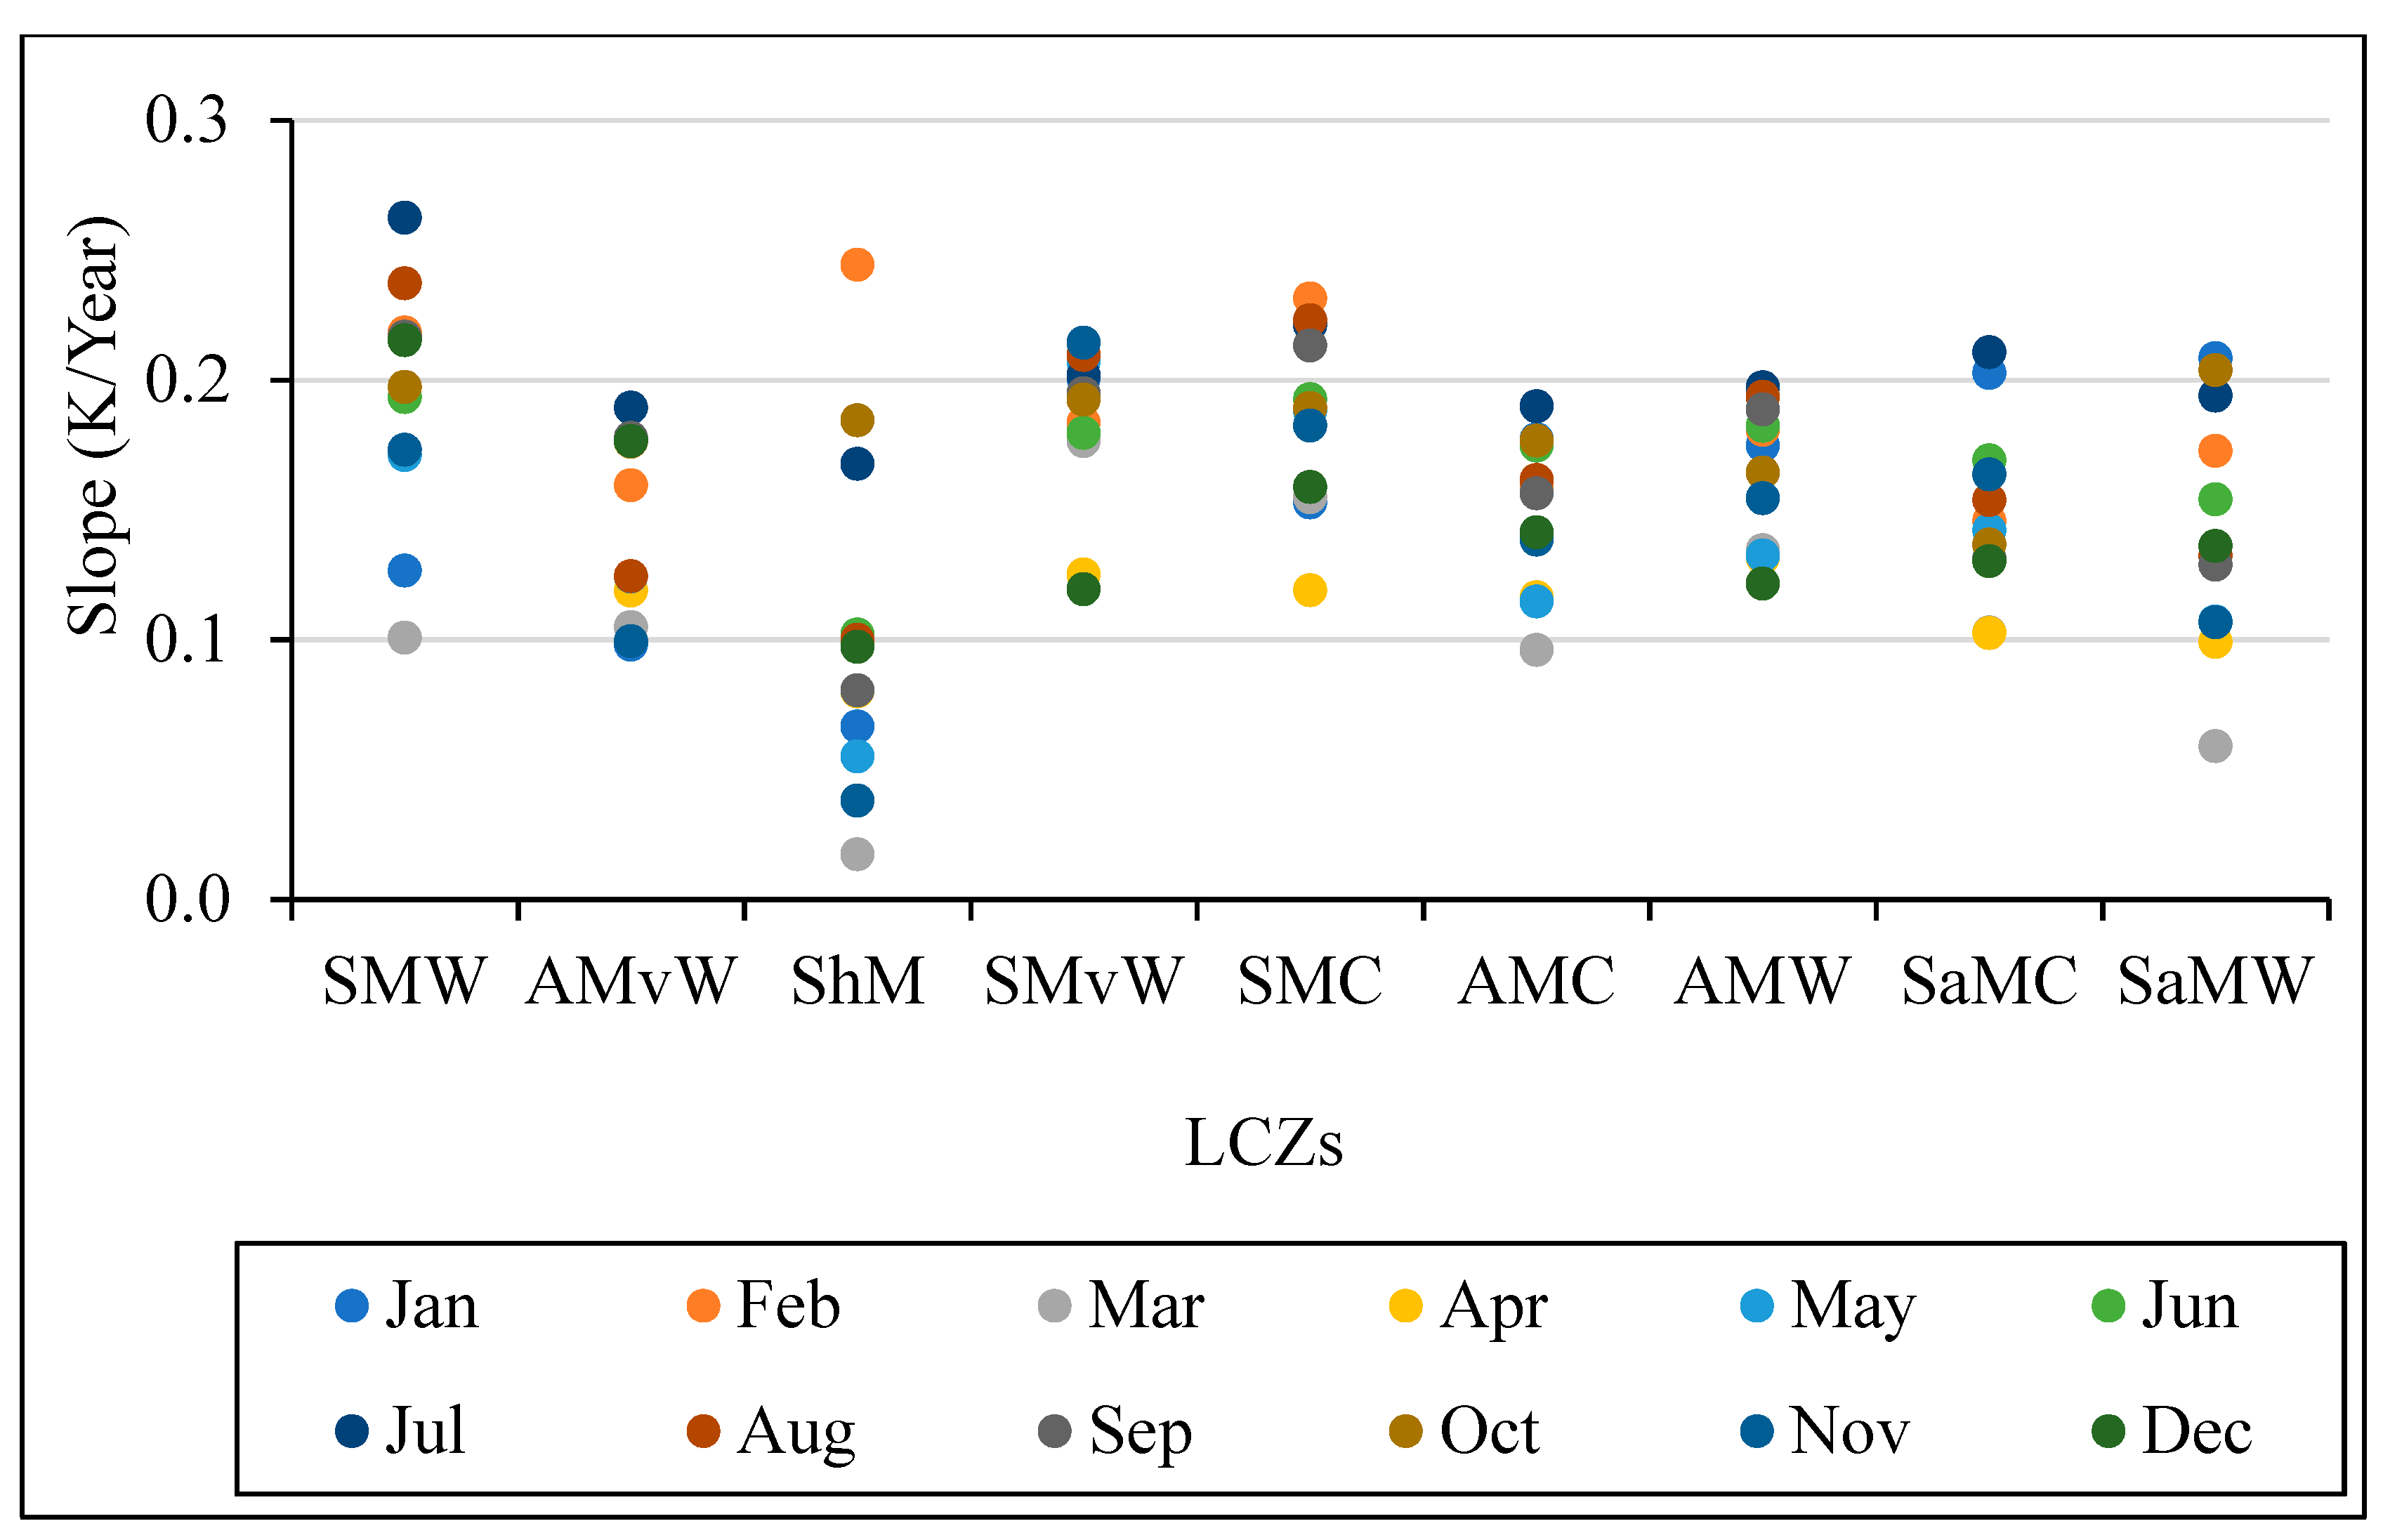
| LCZs | Jan | Feb | Mar | Apr | May | Jun | Jul | Aug | Sep | Oct | Nov | Dec | Annual |
|---|---|---|---|---|---|---|---|---|---|---|---|---|---|
| SMW | 0.127 | 0.218 | 0.101 | 0.171 | 0.171 | 0.193 | 0.262 | 0.237 | 0.217 | 0.197 | 0.173 | 0.215 | 0.190 |
| AMvW | 0.098 | 0.159 | 0.105 | 0.119 | 0.124 | 0.124 | 0.189 | 0.124 | 0.178 | 0.176 | 0.099 | 0.176 | 0.139 |
| ShM | 0.067 | 0.244 | 0.017 | 0.080 | 0.055 | 0.102 | 0.168 | 0.100 | 0.080 | 0.185 | 0.038 | 0.097 | 0.103 |
| SMvW | 0.201 | 0.183 | 0.176 | 0.125 | 0.207 | 0.180 | 0.202 | 0.210 | 0.195 | 0.193 | 0.214 | 0.119 | 0.184 |
| SMC | 0.153 | 0.231 | 0.155 | 0.119 | 0.188 | 0.193 | 0.221 | 0.223 | 0.213 | 0.189 | 0.182 | 0.159 | 0.186 |
| AMC | 0.177 | 0.159 | 0.096 | 0.116 | 0.115 | 0.175 | 0.190 | 0.161 | 0.156 | 0.177 | 0.139 | 0.141 | 0.150 |
| AMW | 0.175 | 0.181 | 0.134 | 0.131 | 0.132 | 0.182 | 0.197 | 0.194 | 0.189 | 0.164 | 0.154 | 0.122 | 0.163 |
| SaMC | 0.203 | 0.146 | 0.103 | 0.102 | 0.142 | 0.169 | 0.211 | 0.154 | 0.131 | 0.137 | 0.164 | 0.130 | 0.149 |
| SaMW | 0.208 | 0.173 | 0.059 | 0.099 | 0.107 | 0.154 | 0.194 | 0.132 | 0.129 | 0.204 | 0.107 | 0.136 | 0.142 |
| Average | 0.156 | 0.188 | 0.105 | 0.118 | 0.138 | 0.164 | 0.204 | 0.171 | 0.165 | 0.180 | 0.141 | 0.144 | 0.156 |
Disclaimer/Publisher’s Note: The statements, opinions and data contained in all publications are solely those of the individual author(s) and contributor(s) and not of MDPI and/or the editor(s). MDPI and/or the editor(s) disclaim responsibility for any injury to people or property resulting from any ideas, methods, instructions or products referred to in the content. |
© 2024 by the authors. Licensee MDPI, Basel, Switzerland. This article is an open access article distributed under the terms and conditions of the Creative Commons Attribution (CC BY) license (https://creativecommons.org/licenses/by/4.0/).
Share and Cite
Hazaymeh, K.; Zeitoun, M.; Almagbile, A.; Al Refaee, A. Exploring the Dynamics of Land Surface Temperature in Jordan’s Local Climate Zones: A Comprehensive Assessment through Landsat Entire Archive and Google Earth Engine. Atmosphere 2024, 15, 318. https://doi.org/10.3390/atmos15030318
Hazaymeh K, Zeitoun M, Almagbile A, Al Refaee A. Exploring the Dynamics of Land Surface Temperature in Jordan’s Local Climate Zones: A Comprehensive Assessment through Landsat Entire Archive and Google Earth Engine. Atmosphere. 2024; 15(3):318. https://doi.org/10.3390/atmos15030318
Chicago/Turabian StyleHazaymeh, Khaled, Mohammad Zeitoun, Ali Almagbile, and Areej Al Refaee. 2024. "Exploring the Dynamics of Land Surface Temperature in Jordan’s Local Climate Zones: A Comprehensive Assessment through Landsat Entire Archive and Google Earth Engine" Atmosphere 15, no. 3: 318. https://doi.org/10.3390/atmos15030318
APA StyleHazaymeh, K., Zeitoun, M., Almagbile, A., & Al Refaee, A. (2024). Exploring the Dynamics of Land Surface Temperature in Jordan’s Local Climate Zones: A Comprehensive Assessment through Landsat Entire Archive and Google Earth Engine. Atmosphere, 15(3), 318. https://doi.org/10.3390/atmos15030318