
Retrieval of Plateau Lake Water Surface Temperature from UAV Thermal Infrared Data


Abstract
1. Introduction
2. Materials
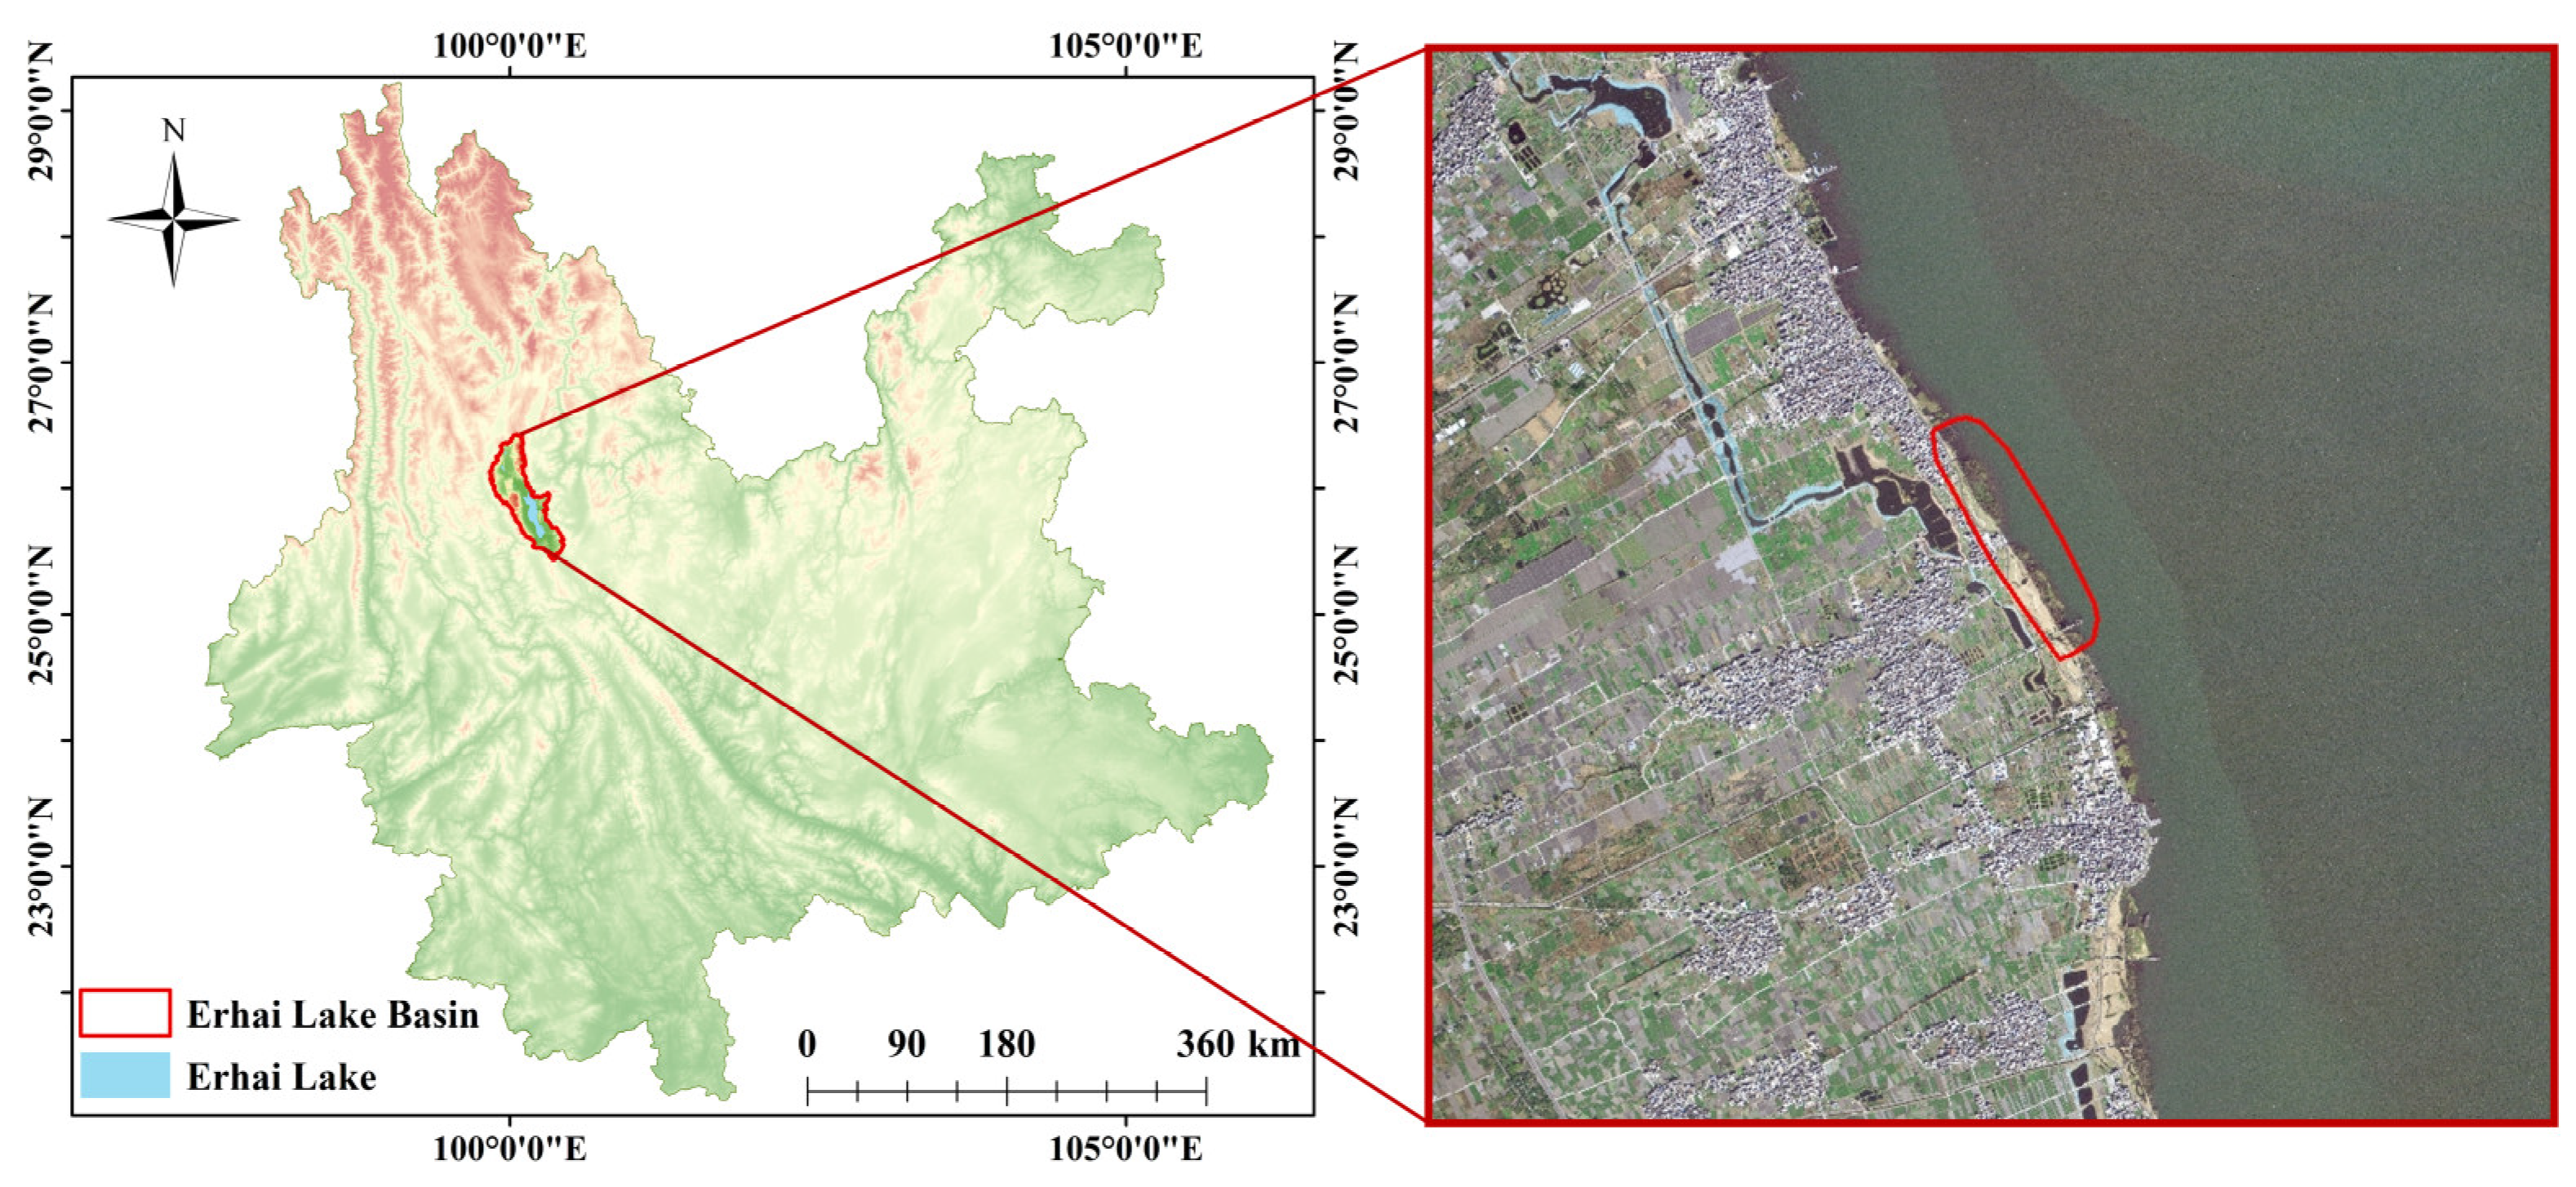
2.1. Study Area
2.2. Air-Ground Synchronization Experiment
2.3. Data Preprocessing
3. Methods
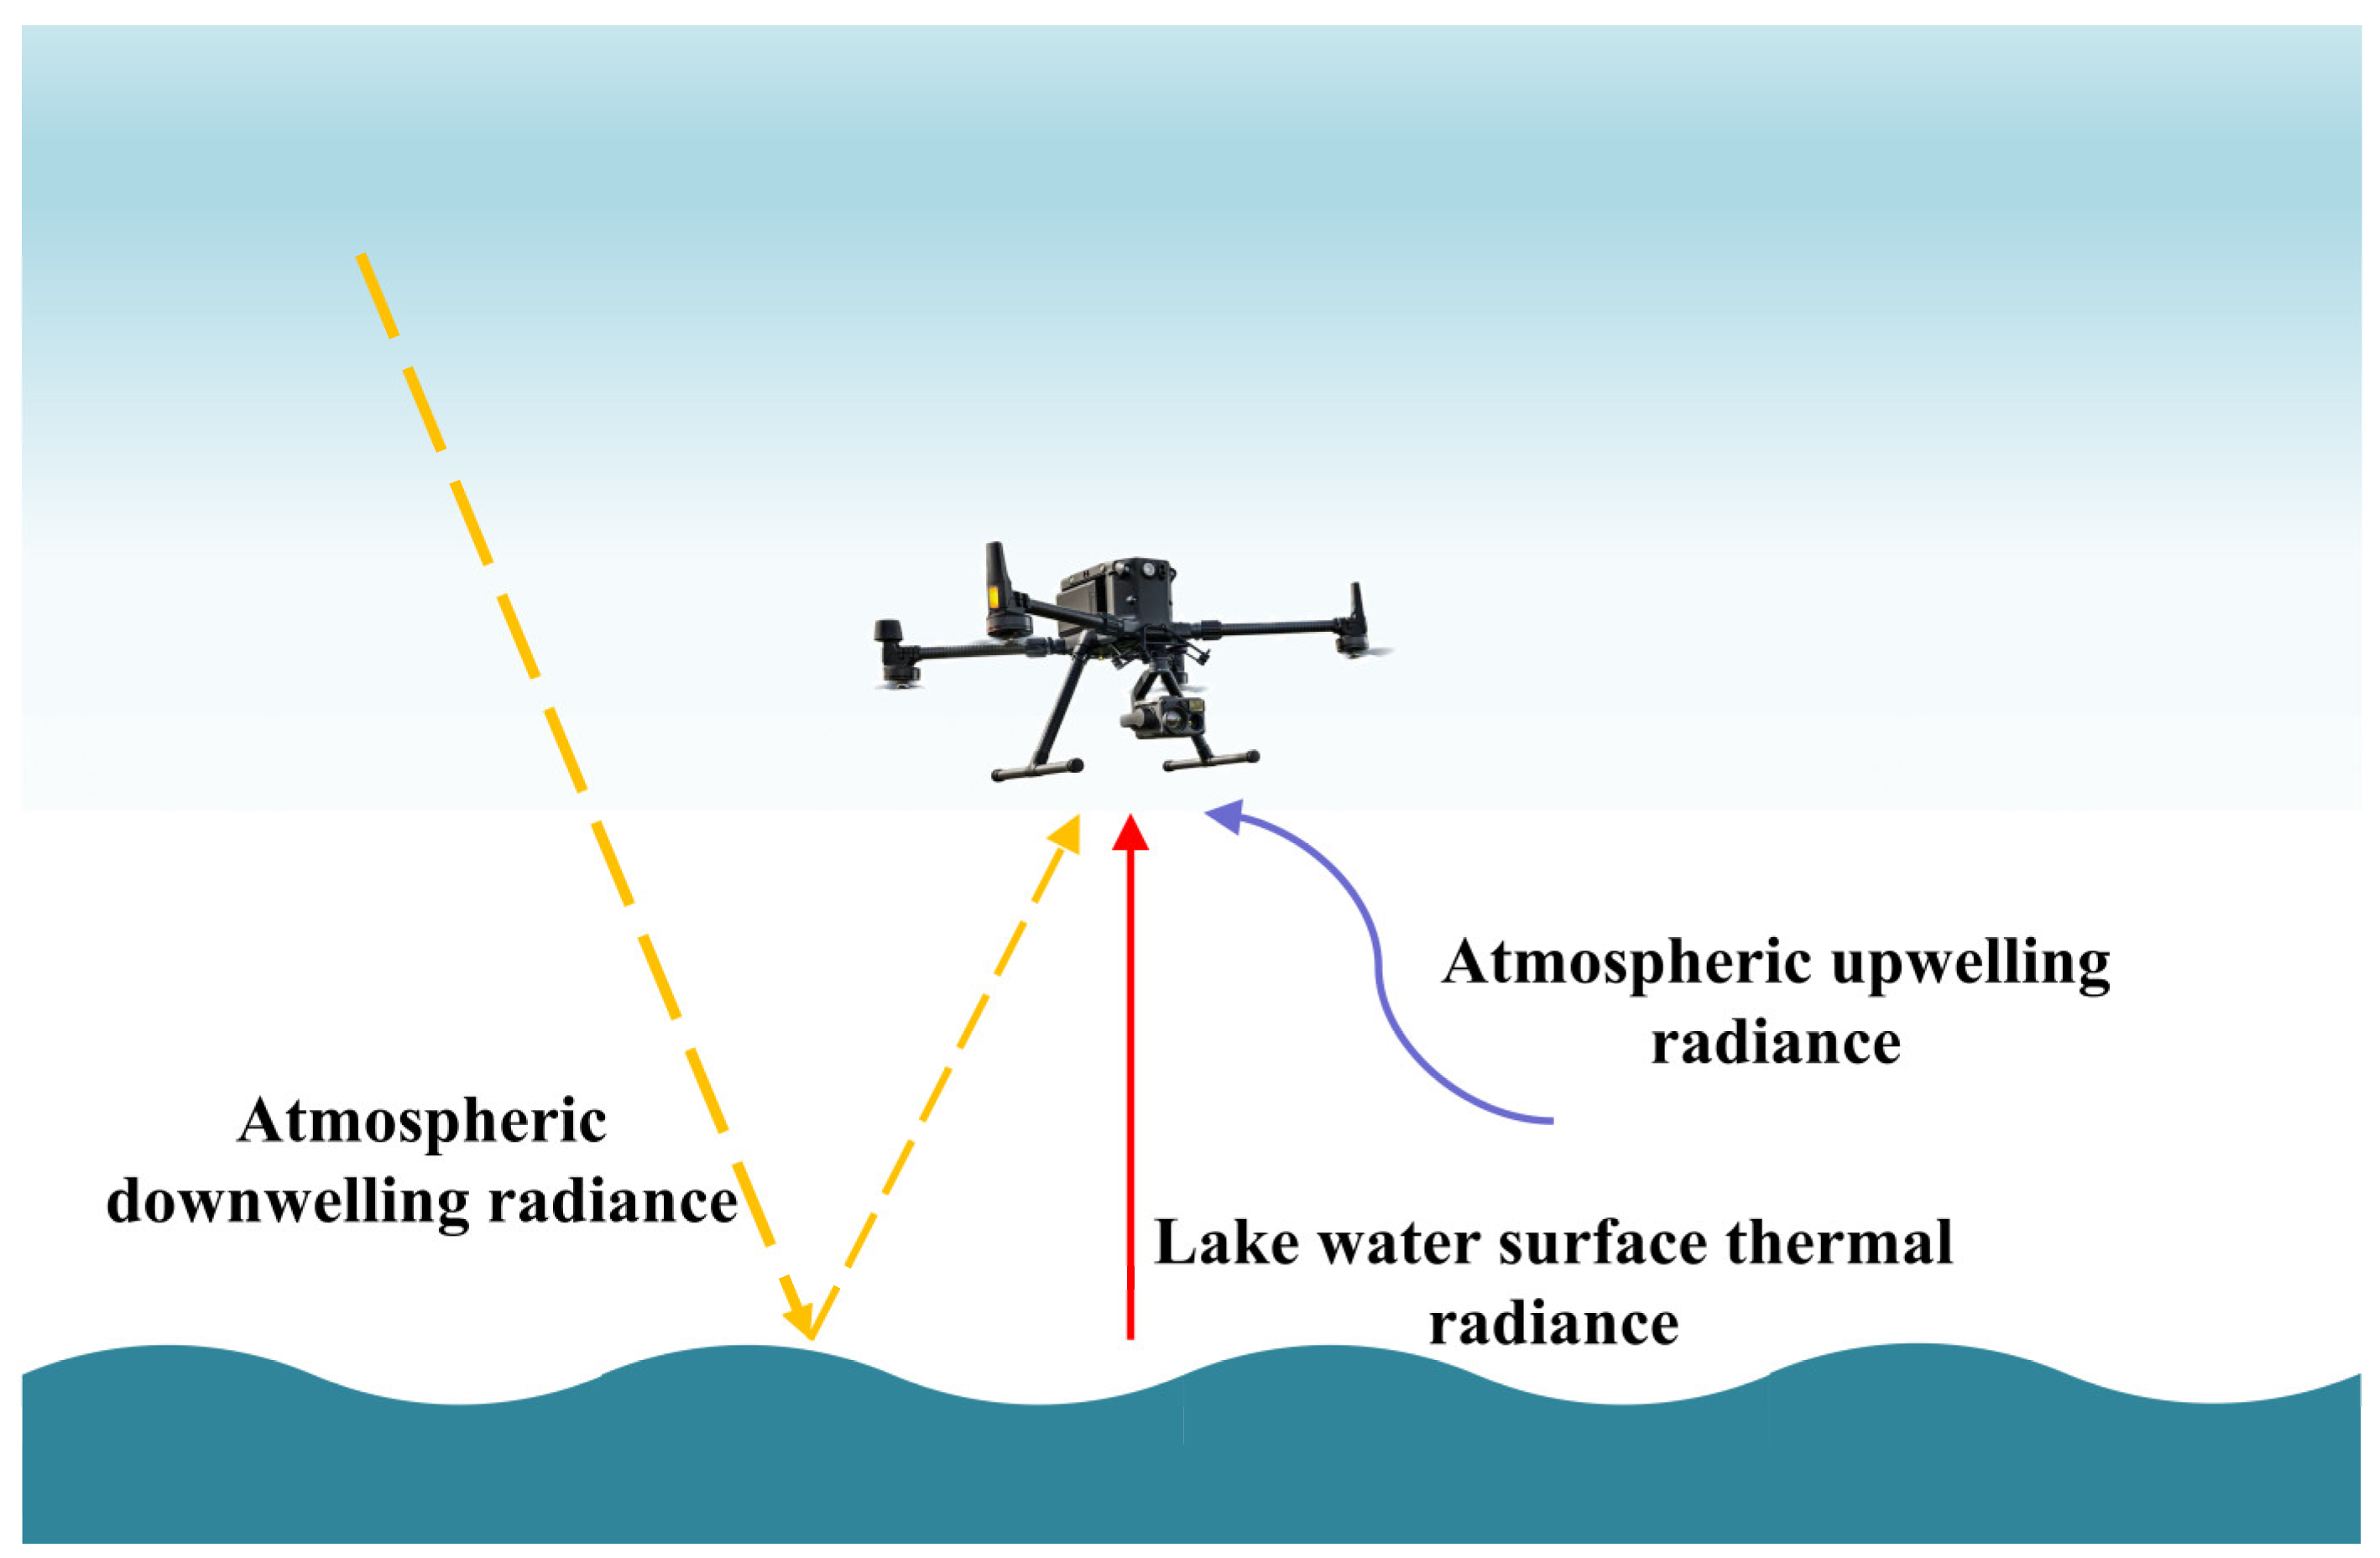
3.1. LWST Retrieval Algorithm Based on Radiative Transfer Equation
3.2. Atmospheric Correction
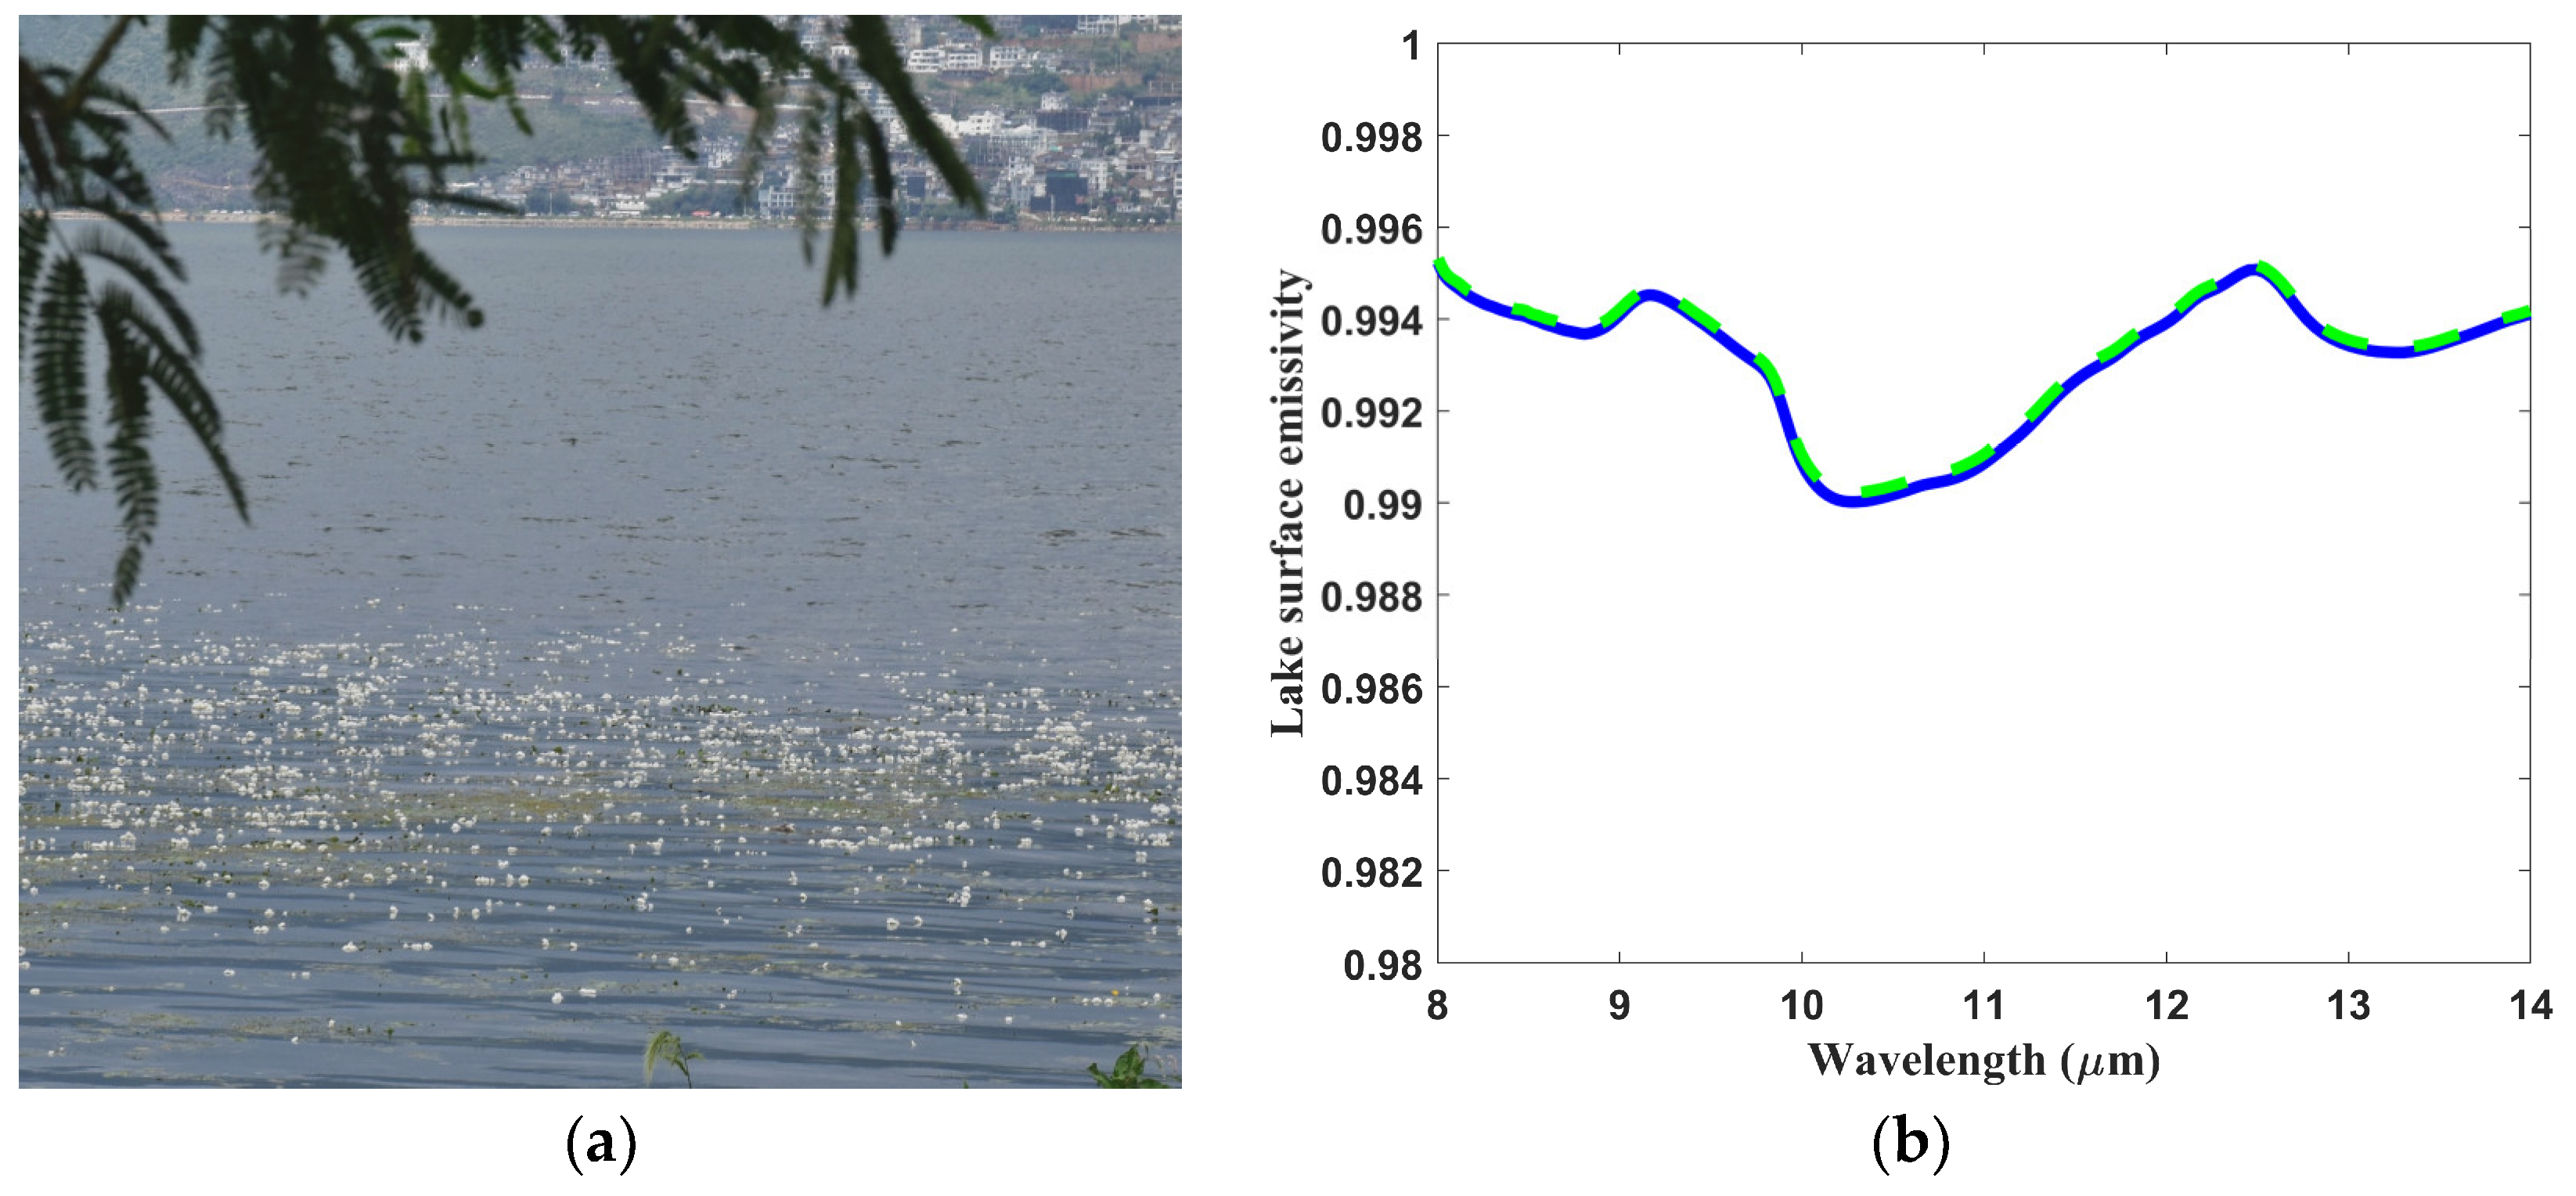
3.3. Estimation of LWSE
3.4. Cross-Calibration
3.5. Retrieval Accuracy Verification of LWST
4. Results
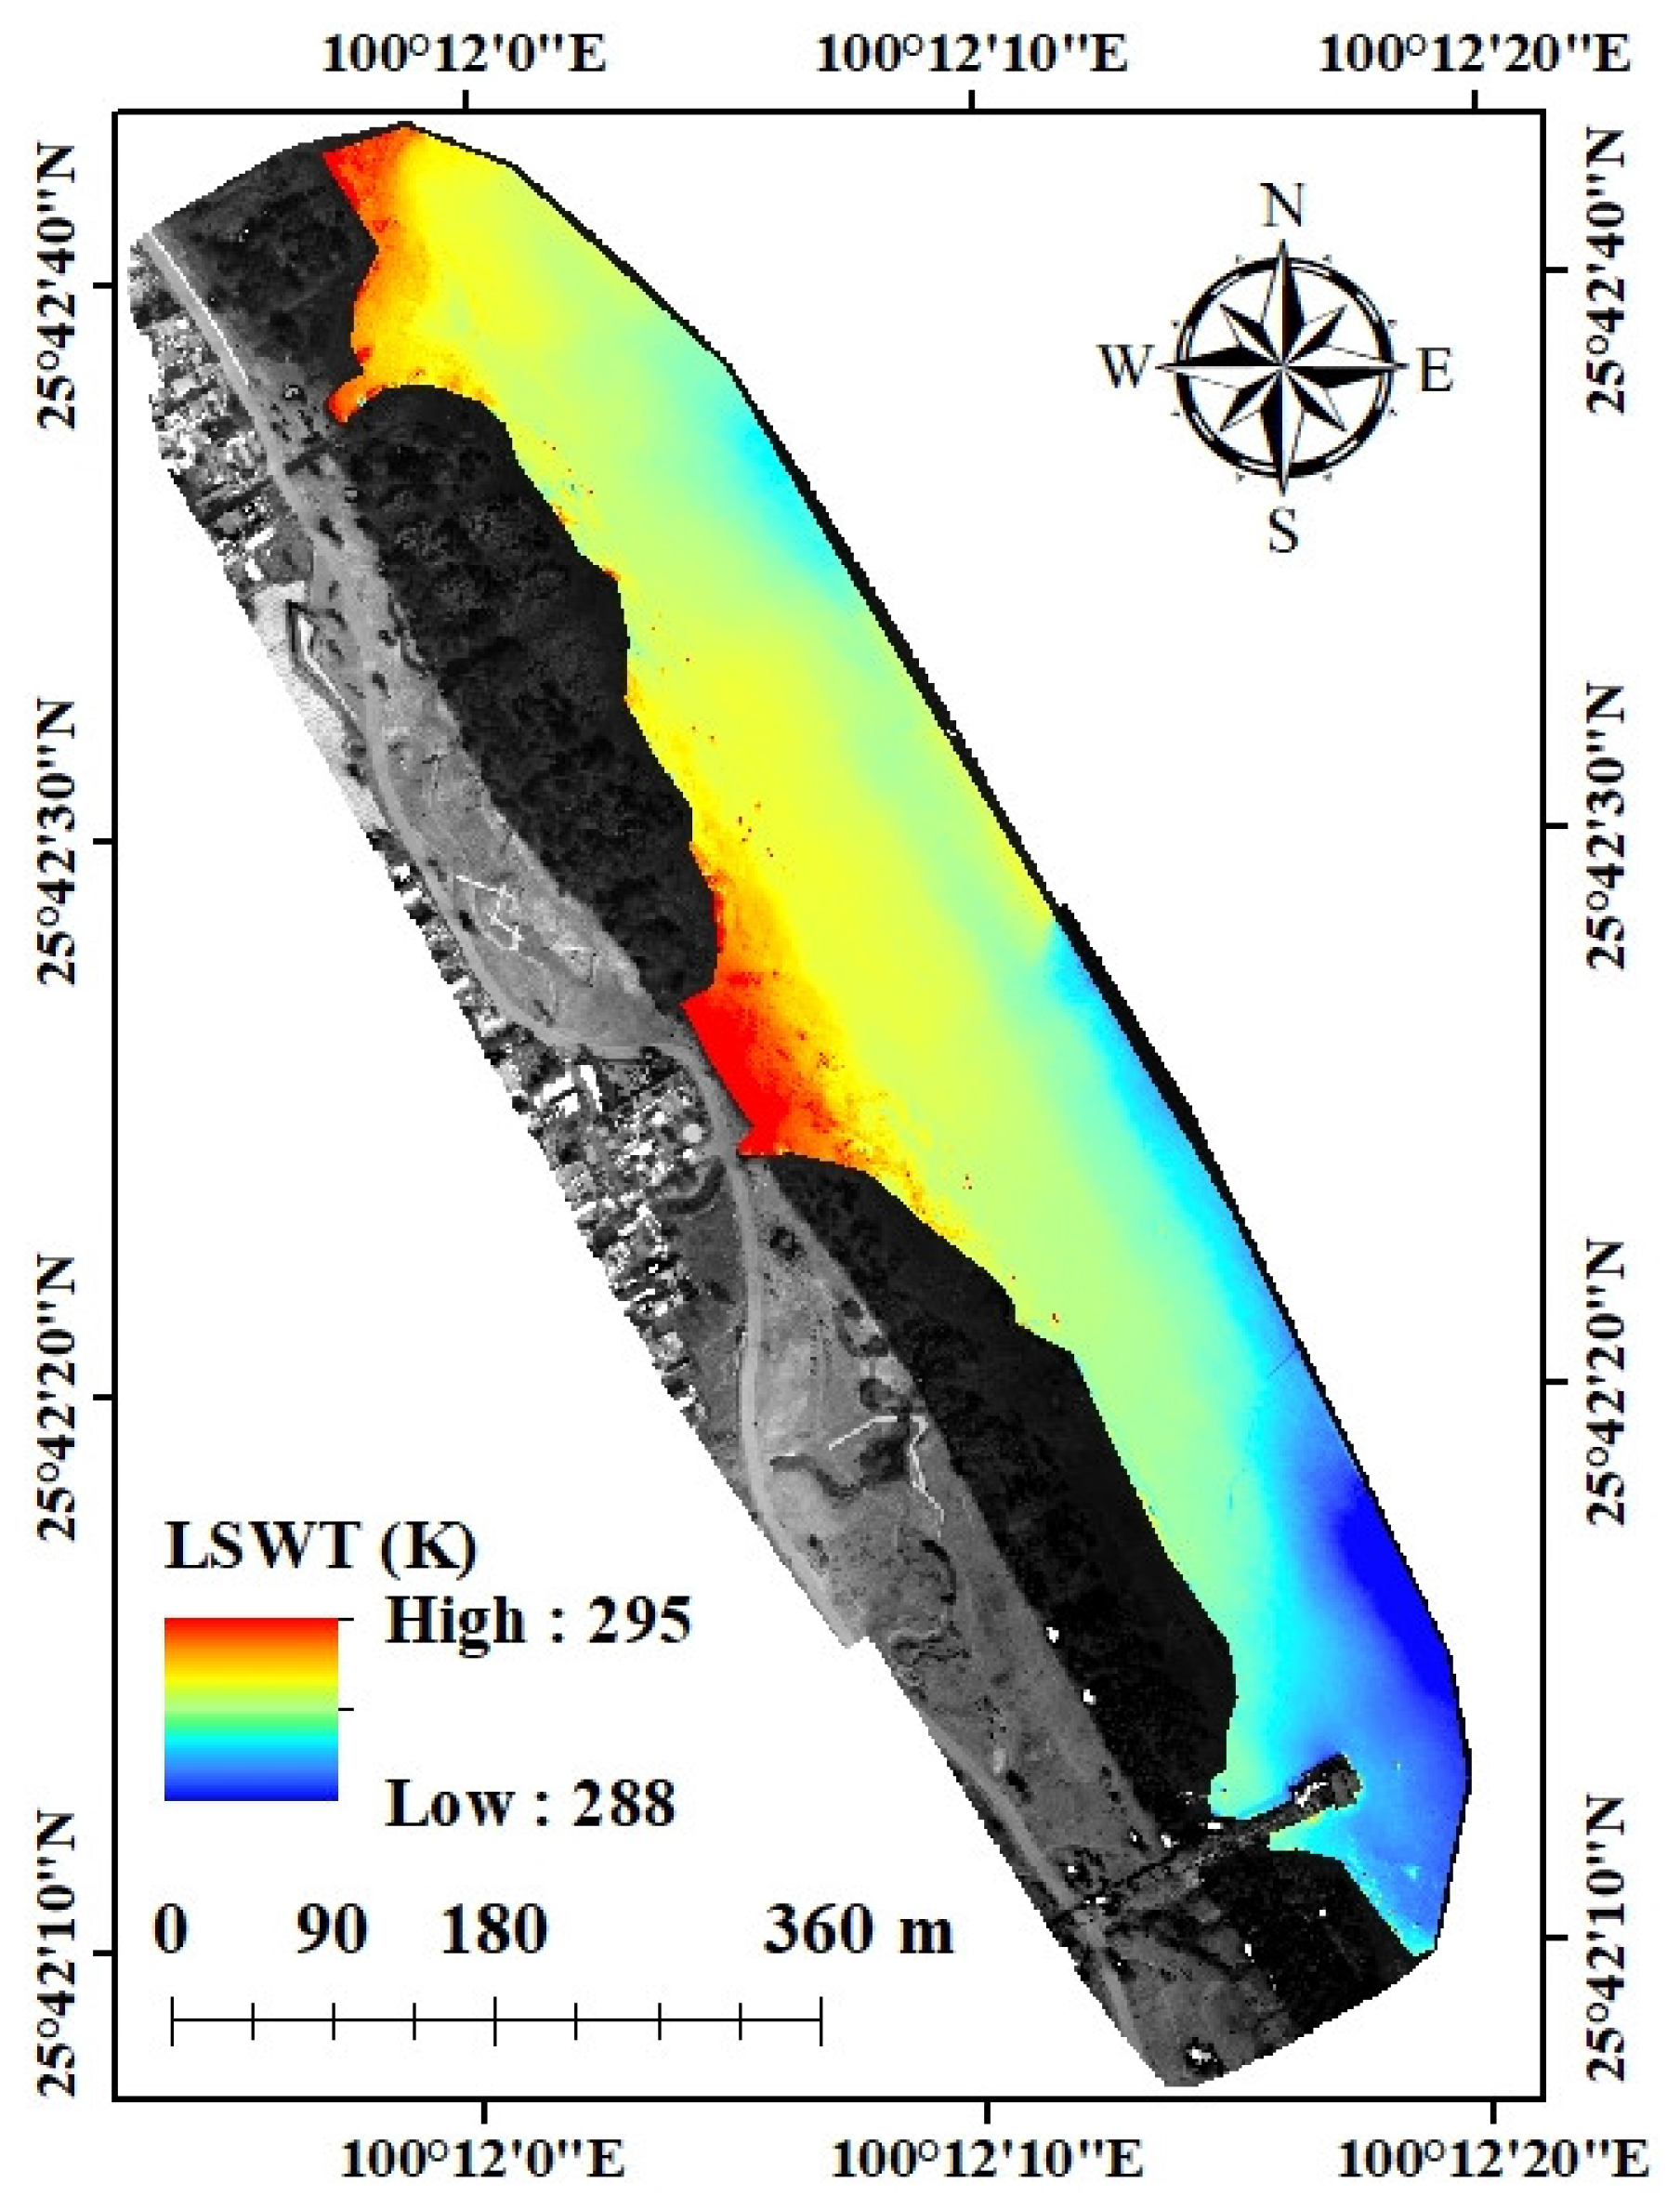
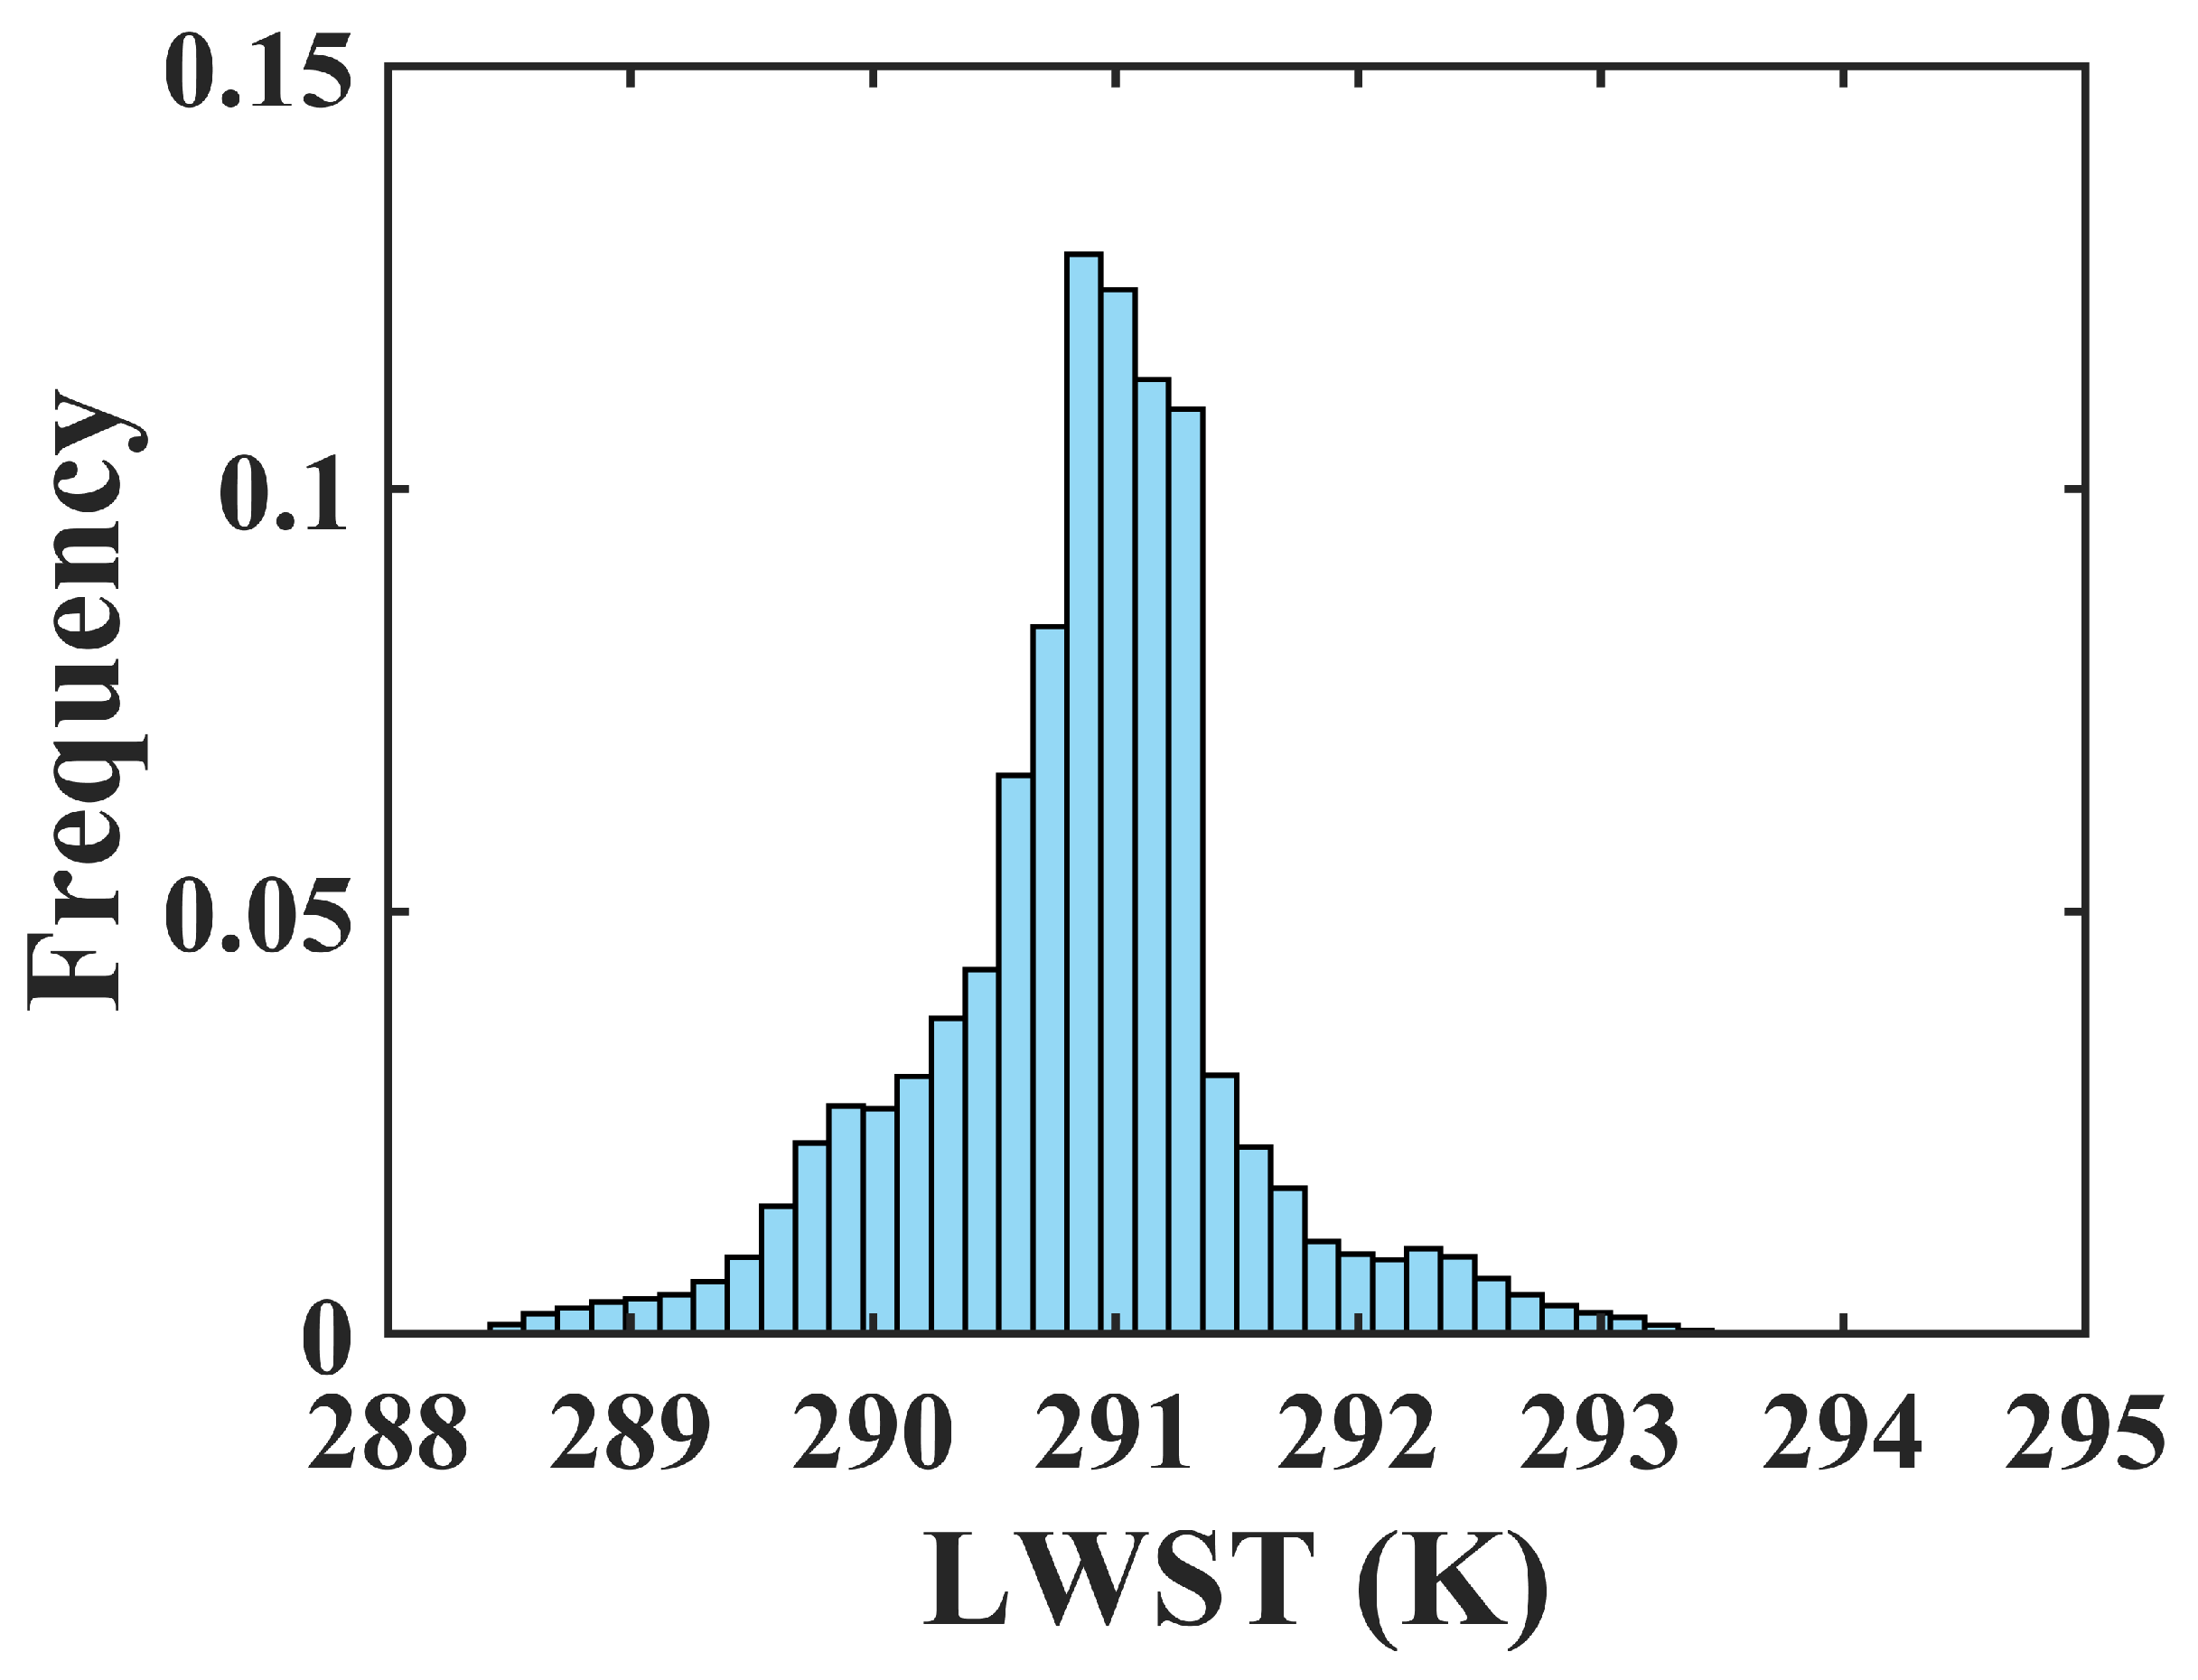
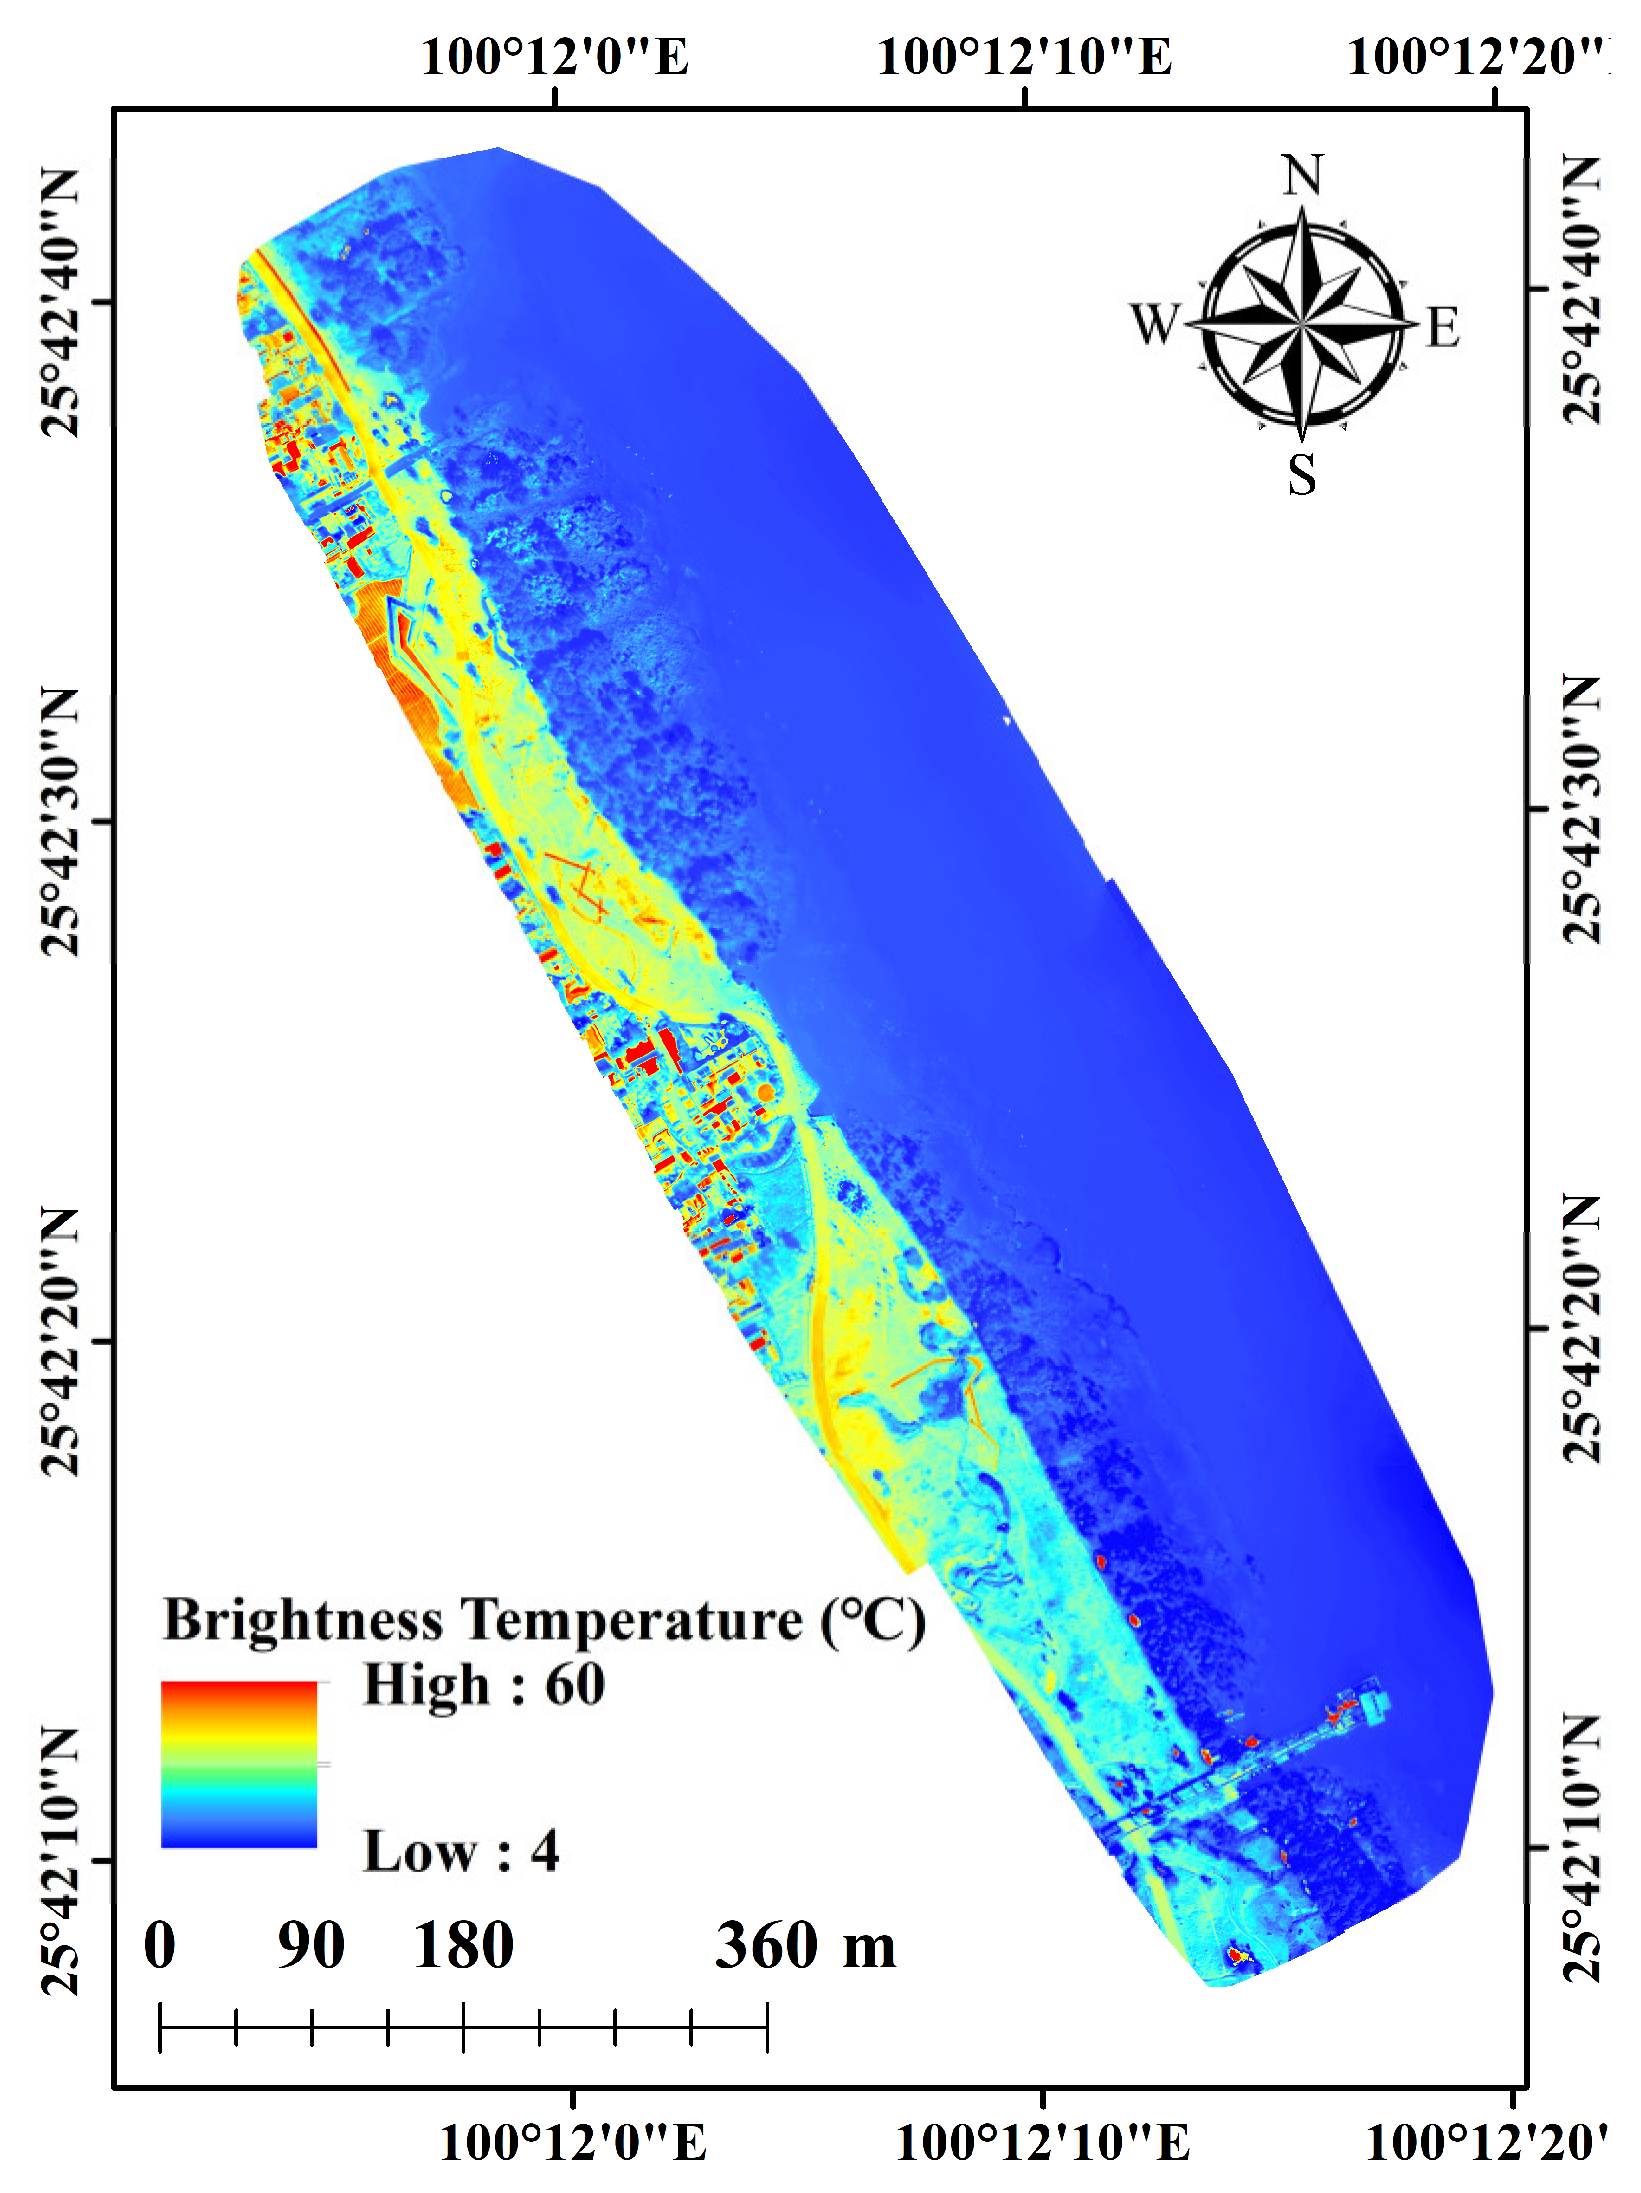
4.1. Results Analysis of LWST Retrieved by the p-LWST Method
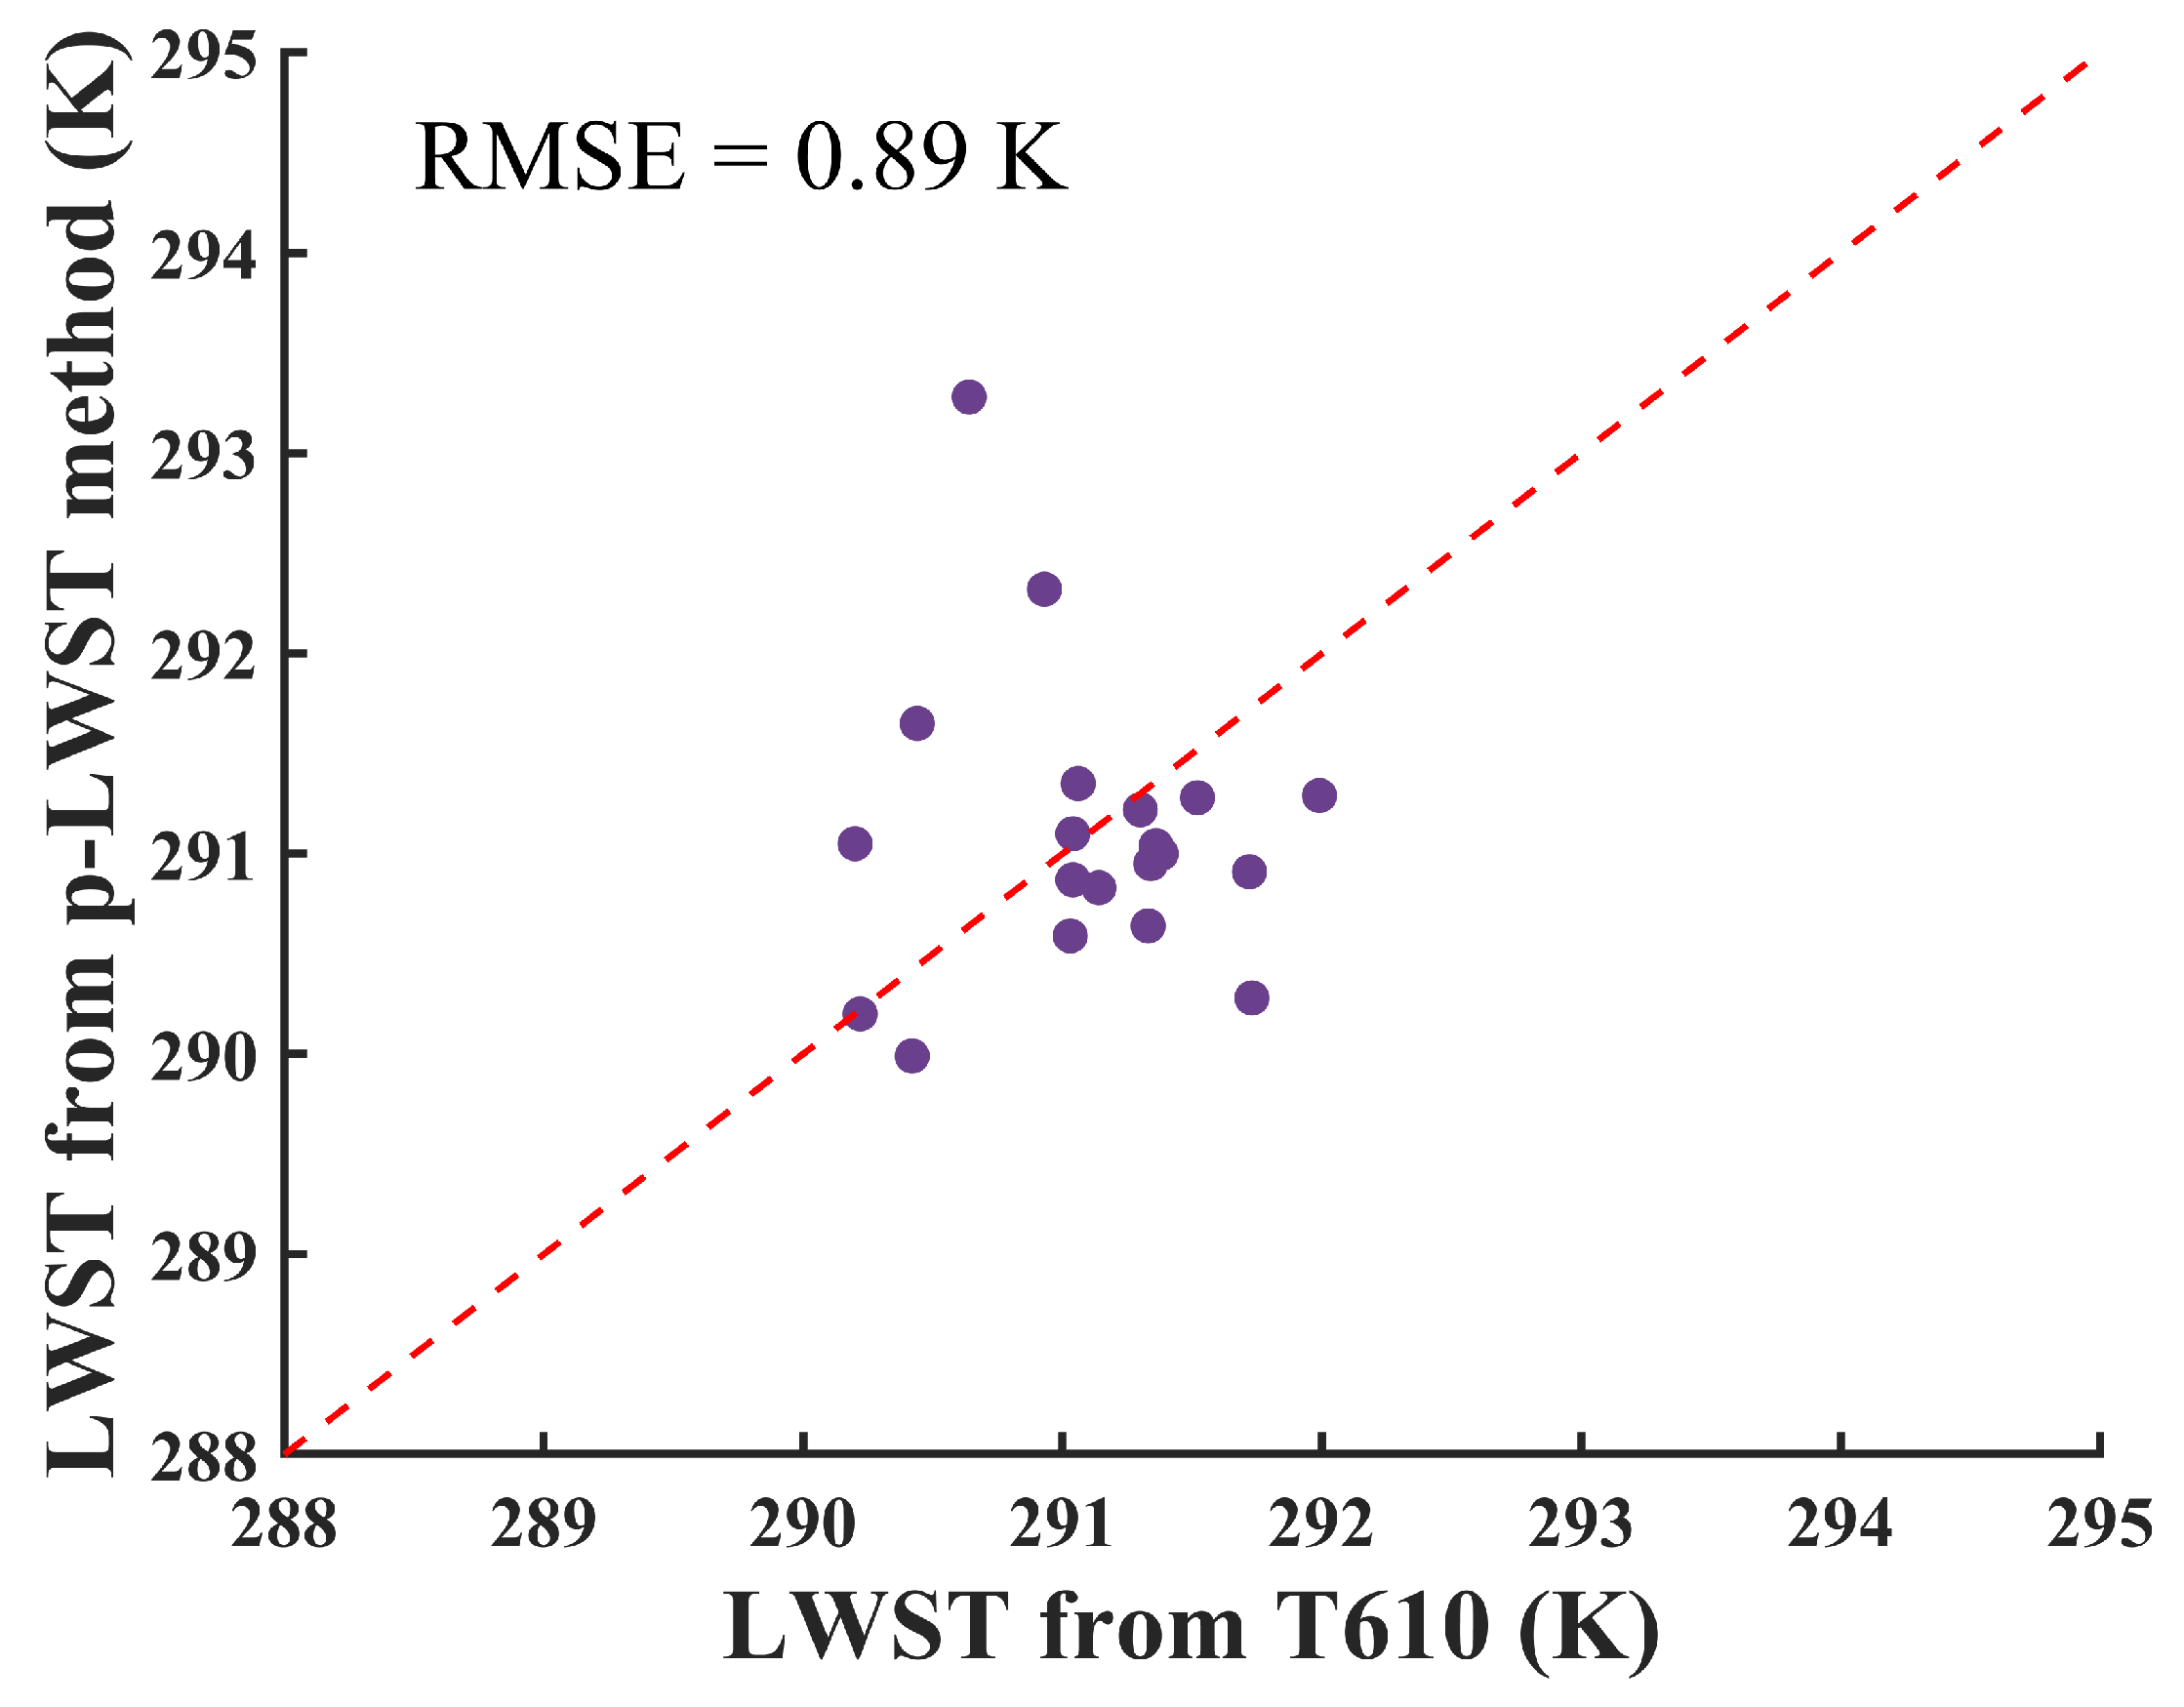
4.2. Accuracy Validation of LWST
5. Discussion
5.1. The Influence of Flight Altitude on Retrieval Results
5.2. The Influence of Cross-Calibration on Retrieval Results
5.3. The Influence of UAV Image Stitching on the Retrieval Results
5.4. The Influence of Water Body Emissivity on Retrieval Results
5.5. Future Work and Prospects
6. Conclusions
Author Contributions
Funding
Institutional Review Board Statement
Informed Consent Statement
Data Availability Statement
Acknowledgments
Conflicts of Interest
References
- Jia, T.F.; Yang, K.; Peng, Z.Q.; Tang, L.F.; Duan, H.M.; Luo, Y. Review on the Change Trend, Attribution Analysis, Retrieval, Simulation, and Prediction of Lake Surface Water Temperature. IEEE J. Sel. Top. Appl. Earth Obs. Remote Sens. 2022, 15, 6324–6355. [Google Scholar] [CrossRef]
- Wang, D.; Tang, B.-H.; Fu, Z.; Huang, L.; Li, M.; Chen, G.; Pan, X. Estimation of Chlorophyll-A Concentration with Remotely Sensed Data for the Nine Plateau Lakes in Yunnan Province. Remote Sens. 2022, 14, 4950. [Google Scholar] [CrossRef]
- Rigosi, A.; Hanson, P.; Hamilton, D.P.; Hipsey, M.; Rusak, J.A.; Bois, J.; Sparber, K.; Chorus, I.; Watkinson, A.J.; Qin, B.Q.; et al. Determining the probability of cyanobacterial blooms: The application of Bayesian networks in multiple lake systems. Ecol. Appl. 2015, 25, 186–199. [Google Scholar] [CrossRef] [PubMed]
- Li, Z.-L.; Tang, B.-H.; Wu, H.; Ren, H.Z.; Yan, G.J.; Wan, Z.M.; Trigo, I.F.; Sobrino, J.A. Satellite-derived land surface temperature: Current status and perspectives. Remote Sens. Environ. 2013, 131, 14–37. [Google Scholar] [CrossRef]
- He, Z.-W.; Tang, B.-H. Retrieval of Rugged Mountainous Areas Land Surface Temperature from High-spatial-resolution Thermal Infrared Remote Sensing Data. IEEE Trans. Geosci. Remote Sens. 2023, 61, 4508216. [Google Scholar] [CrossRef]
- Zhu, X.L.; Duan, S.B.; Li, Z.-L.; Zhao, W.; Wu, H.; Leng, P.; Gao, M.F.; Zhou, X.M. Retrieval of Land Surface Temperature with Topographic Effect Correction from Landsat 8 Thermal Infrared Data in Mountainous Areas. IEEE Trans. Geosci. Remote Sens. 2021, 59, 6674–6687. [Google Scholar] [CrossRef]
- Duan, S.-B.; Li, Z.-L.; Wang, C.; Zhang, S.; Tang, B.-H.; Leng, P.; Gao, M.-F. Land-surface temperature retrieval from Landsat 8 single-channel thermal infrared data in combination with NCEP reanalysis data and ASTER GED product. Int. J. Remote Sens. 2019, 40, 1763–1778. [Google Scholar] [CrossRef]
- Tang, B.-H.; Bi, Y.Y.; Li, Z.-L.; Xia, J. Generalized Split-Window algorithm for estimate of Land Surface Temperature from Chinese geostationary FengYun meteorological satellite (FY-2C) data. Sensors 2008, 8, 933–951. [Google Scholar] [CrossRef]
- Wang, L.J.; Guo, N.; Wang, W.; Zuo, H.C. Optimization of the Local Split-Window Algorithm for FY-4A Land Surface Temperature Retrieval. Remote Sens. 2019, 11, 2016. [Google Scholar] [CrossRef]
- Ye, X.; Ren, H.Z.; Zhu, J.S.; Fan, W.J.; Qin, Q.M. Split-Window Algorithm for Land Surface Temperature Retrieval from Landsat-9 Remote Sensing Images. IEEE Geosci. Remote Sens. Lett. 2022, 19, 7507205. [Google Scholar] [CrossRef]
- Ye, X.; Ren, H.Z.; Zhu, J.S.; Zeng, H.; Wang, B.Z.; Huang, H.; Fan, W.J. Land Surface Temperature Retrieval Based on Thermal Infrared Channel Decomposed Split-Window Algorithm. IEEE J. Sel. Top. Appl. Earth Obs. Remote Sens. 2022, 15, 4971–4979. [Google Scholar] [CrossRef]
- Tang, B.-H.; Wang, J. A Physics-Based Method to Retrieve Land Surface Temperature from MODIS Daytime Midinfrared Data. IEEE Trans. Geosci. Remote Sens. 2016, 54, 4672–4679. [Google Scholar] [CrossRef]
- Tang, B.-H. Nonlinear Split-Window Algorithms for Estimating Land and Sea Surface Temperatures from Simulated Chinese Gaofen-5 Satellite Data. IEEE Trans. Geosci. Remote Sens. 2018, 56, 6280–6289. [Google Scholar] [CrossRef]
- Gillespie, A.; Rokugawa, S.; Matsunaga, T.; Cothern, J.S.; Hook, S.; Kahle, A.B. A temperature and emissivity separation algorithm for Advanced Spaceborne Thermal Emission and Reflection Radiometer (ASTER) images. IEEE Trans. Geosci. Remote Sens. 1998, 36, 1113–1126. [Google Scholar] [CrossRef]
- Liu, W.H.; Shi, J.C.; Liang, S.L.; Zhou, S.G.; Cheng, J. Simultaneous retrieval of land surface temperature and emissivity from the FengYun-4A advanced geosynchronous radiance imager. Int. J. Digit. Earth 2022, 15, 198–225. [Google Scholar] [CrossRef]
- Wan, Z.; Li, Z.-L. A physics-based algorithm for retrieving land-surface emissivity and temperature from EOS/MODIS data. IEEE Trans. Geosci. Remote Sens. 1997, 35, 980–996. [Google Scholar] [CrossRef]
- Coll, C.; Caselles, V.; Galve, J.M.; Valor, E.; Niclòs, R.; Sánchez, J.M. Evaluation of split-window and dual-angle correction methods for land surface temperature retrieval from Envisat/Advanced Along Track Scanning Radiometer (AATSR). J. Geophys. Res. 2006, 111, D12105. [Google Scholar] [CrossRef]
- Li, Z.-L.; Wu, H.; Duan, S.-B.; Zhao, W.; Ren, H.; Liu, X.; Leng, P.; Tang, R.; Ye, X.; Zhu, J.; et al. Satellite Remote Sensing of Global Land Surface Temperature: Definition, Methods, Products, and Applications. Rev. Geophys. 2023, 61, e2022RG000777. [Google Scholar] [CrossRef]
- Zhao, Y.S.; Yang, K.; Luo, Y.; Yu, Z.Y. Spatial-temporal characteristics of surface thermal environment and its effect on Lake surface water temperature in Dianchi Lake basin. Front. Ecol. Evol. 2022, 10, 984692. [Google Scholar] [CrossRef]
- Wang, Z.W.; Zhou, J.; Liu, S.M.; Li, M.S.; Zhang, X.D.; Huang, Z.M.; Dong, W.C.; Ma, J.; Ai, L.J. A Land Surface Temperature Retrieval Method for UAV Broadband Thermal Imager Data. IEEE Geosci. Remote Sens. Lett. 2022, 19, 7002805. [Google Scholar] [CrossRef]
- Song, B.; Park, K. Verification of Accuracy of Unmanned Aerial Vehicle (UAV) Land Surface Temperature Images Using In-Situ Data. Remote Sens. 2020, 12, 288. [Google Scholar] [CrossRef]
- Kelly, J.; Kljun, N.; Olsson, P.-O.; Mihai, L.; Liljeblad, B.; Weslien, P.; Klemedtsson, L.; Eklundh, L. Challenges and Best Practices for Deriving Temperature Data from an Uncalibrated UAV Thermal Infrared Camera. Remote Sens. 2019, 11, 567. [Google Scholar] [CrossRef]
- Kim, D.; Yu, J.; Yoon, J.; Jeon, S.; Son, S. Comparison of Accuracy of Surface Temperature Images from Unmanned Aerial Vehicle and Satellite for Precise Thermal Environment Monitoring of Urban Parks Using in Situ Data. Remote Sens. 2021, 13, 1977. [Google Scholar] [CrossRef]
- Awais, M.; Li, W.; Hussain, S.; Cheema, M.J.M.; Li, W.; Song, R.; Liu, C. Comparative Evaluation of Land Surface Temperature Images from Unmanned Aerial Vehicle and Satellite Observation for Agricultural Areas Using In Situ Data. Agriculture 2022, 12, 184. [Google Scholar] [CrossRef]
- Naughton, J.; McDonald, W. Evaluating the Variability of Urban Land Surface Temperatures Using Drone Observations. Remote Sens. 2019, 11, 1722. [Google Scholar] [CrossRef]
- Heinemann, S.; Siegmann, B.; Thonfeld, F.; Muro, J.; Jedmowski, C.; Kemna, A.; Kraska, T.; Muller, O.; Schultz, J.; Udelhoven, T.; et al. Land Surface Temperature Retrieval for Agricultural Areas Using a Novel UAV Platform Equipped with a Thermal Infrared and Multispectral Sensor. Remote Sens. 2020, 12, 1075. [Google Scholar] [CrossRef]
- Xu, S.S.; Yang, K.; Xu, Y.T.; Zhu, Y.H.; Luo, Y.; Shang, C.X.; Zhang, J.; Zhang, Y.; Gao, M.; Wu, C.H. Urban Land Surface Temperature Monitoring and Surface Thermal Runoff Pollution Evaluation Using UAV Thermal Remote Sensing Technology. Sustainability 2021, 13, 1203. [Google Scholar] [CrossRef]
- Berk, A.; Anderson, G.; Acharya, P.; Shettle, E. MODTRAN 5.2. 2 User’s Manual Spectral Sciences; Spectral Sciences Inc.: Burlington, MA, USA, 2011; p. 69. [Google Scholar]
- Wang, Z.; Zhou, J.; Ma, J.; Wang, Y.; Liu, S.; Ding, L.; Tang, W.; Pakezhamu, N.; Meng, L. Removing temperature drift and temporal variation in thermal infrared images of a UAV uncooled thermal infrared imager. ISPRS J. Photogramm. Remote Sens. 2023, 203, 392–411. [Google Scholar] [CrossRef]


| Height m | Atmospheric Upwelling Radiance W/(m2·sr·μm) | Atmospheric Downwelling Radiance W/(m2·sr·μm) | Atmospheric Transmittance |
|---|---|---|---|
| 300 | 0.8570 | 4.8608 | 0.9035 |
| Code | LWST from T610 | LWST from the p-LWST Method | Bias |
|---|---|---|---|
| 1 | 291.06 | 291.35 | 0.29 |
| 2 | 291.99 | 291.29 | −0.70 |
| 3 | 291.52 | 291.28 | −0.24 |
| 4 | 291.30 | 291.22 | −0.08 |
| 5 | 291.38 | 291.00 | −0.39 |
| 6 | 291.36 | 291.04 | −0.33 |
| 7 | 291.72 | 290.91 | −0.81 |
| 8 | 290.20 | 291.05 | 0.85 |
| 9 | 290.42 | 289.99 | −0.43 |
| 10 | 290.22 | 290.20 | −0.02 |
| 11 | 291.73 | 290.28 | −1.45 |
| 12 | 291.33 | 290.64 | −0.69 |
| 13 | 291.03 | 290.59 | −0.44 |
| 14 | 291.14 | 290.83 | −0.31 |
| 15 | 291.04 | 290.87 | −0.17 |
| 16 | 291.34 | 290.95 | −0.39 |
| 17 | 291.04 | 291.10 | 0.07 |
| 18 | 290.44 | 291.65 | 1.21 |
| 19 | 290.93 | 292.32 | 1.39 |
| 20 | 290.64 | 293.28 | 2.63 |
Disclaimer/Publisher’s Note: The statements, opinions and data contained in all publications are solely those of the individual author(s) and contributor(s) and not of MDPI and/or the editor(s). MDPI and/or the editor(s) disclaim responsibility for any injury to people or property resulting from any ideas, methods, instructions or products referred to in the content. |
© 2024 by the authors. Licensee MDPI, Basel, Switzerland. This article is an open access article distributed under the terms and conditions of the Creative Commons Attribution (CC BY) license (https://creativecommons.org/licenses/by/4.0/).
Share and Cite
Sima, O.; Tang, B.-H.; He, Z.-W.; Wang, D.; Zhao, J.-L. Retrieval of Plateau Lake Water Surface Temperature from UAV Thermal Infrared Data. Atmosphere 2024, 15, 99. https://doi.org/10.3390/atmos15010099
Sima O, Tang B-H, He Z-W, Wang D, Zhao J-L. Retrieval of Plateau Lake Water Surface Temperature from UAV Thermal Infrared Data. Atmosphere. 2024; 15(1):99. https://doi.org/10.3390/atmos15010099
Chicago/Turabian StyleSima, Ouyang, Bo-Hui Tang, Zhi-Wei He, Dong Wang, and Jun-Li Zhao. 2024. "Retrieval of Plateau Lake Water Surface Temperature from UAV Thermal Infrared Data" Atmosphere 15, no. 1: 99. https://doi.org/10.3390/atmos15010099
APA StyleSima, O., Tang, B.-H., He, Z.-W., Wang, D., & Zhao, J.-L. (2024). Retrieval of Plateau Lake Water Surface Temperature from UAV Thermal Infrared Data. Atmosphere, 15(1), 99. https://doi.org/10.3390/atmos15010099