Article

Revisiting the Characteristics of Super Typhoon Saola (2023) Using GPM, Himawari-9 and FY-4B Satellite Data

1
CMA Key Open Laboratory of Transforming Climate Resources to Economy, Chongqing Meteorological Service Centre, Chongqing 401147, China
2
Chongqing Engineering Research Center for Remote Sensing Big Data Application, School of Geographical Sciences, Southwest University, Chongqing 400715, China
3
School of Geography and Planning, Sun Yat-Sen University, Guangzhou 510006, China
*
Authors to whom correspondence should be addressed.
Atmosphere 2024, 15(3), 290; https://doi.org/10.3390/atmos15030290
Submission received: 12 January 2024 / Revised: 23 February 2024 / Accepted: 24 February 2024 / Published: 27 February 2024
(This article belongs to the Special Issue Satellite Remote Sensing Applied in Atmosphere (2nd Edition))

Abstract

:
Typhoon Saola was the ninth typhoon that generated over the Western North Pacific (WNP) in 2023, and it caused severe storm impacts. However, its complex moving track and heavy intensity made it extremely difficult to forecast; therefore, detailed analysis is necessary. In this study, GPM, Himawari-9, and FY-4B satellite data were used to analyze the characteristics of the structure, brightness temperature, and precipitation of the typhoon cloud system. Our results showed that, in the 89 and 183 GHz channels of GPM-1CGMI, the brightness temperature of the typhoon eye was 80–90 K higher than that of the eye wall, and the strong convective areas below 200 K were clearer in these high-frequency channels. GPM-2ADPR estimated heavy rain (over 30 mm/h) area, storm height (5 km), and vertical precipitation rate (30–40 mm/h) more accurately than the GPM-2Aka and GPM-2Aku products. Himawari-9 satellite data showed that the brightness temperature of the eye wall and spiral cloud bands was 180–200 K, the typhoon eye was small and round, and strong convective activities were mostly located in the southwest side of the center. The FY-4B CLP and CLT products showed that, in the mature period of the typhoon, the percentage of supercooled and mixed clouds first stabilized and then rapidly decreased. The trends observed among the three types of ice-phase clouds were characterized by an initial increase, followed by a decrease, and then another increase, with percentages between 10% and 25%, 5% and 15%, and 15% and 30%, respectively.

1. Introduction

Tropical cyclone (TC) is a general term for a non-frontal synoptic scale vortex with organized convection and a definite cyclonic circulation that occurs over tropical or subtropical oceans [1,2]. Typhoons are mature tropical cyclones that develop on the Western North Pacific (WNP). They account for a significant fraction of damage, injury, and loss of life from natural hazards and are the costliest natural catastrophe [3,4]. China is one of the countries that experiences the largest number of landfall typhoons, which have caused considerable personal injury and property damage in the country’s coastal areas throughout history [5,6,7,8].
Typhoon disasters include strong winds, rainstorms, and storm surges, with rainstorm disasters being the most frequent and destructive [9]. Therefore, clarifying the mechanism of typhoon rainstorms and accurately predicting typhoon precipitation have become important areas of concern to meteorologists [10,11]. Typhoon rainstorms are related to three factors: the generation and disappearance of the mesoscale convective system inside the typhoon, the interaction between the typhoon and atmosphere, and the interaction between the landing typhoon and the underlying area; this paper mainly discusses the first factor [12,13]. The internal condition of a TC refers to the spiral cloud or rain band, where small-and medium-scale systems and cloud microphysical processes play important roles [14].
Satellites are a significant tool for typhoon studies. They can detect typhoon clouds without geographical limitation and can continuously observe global atmospheric motions, cloud evolutions, and precipitation [15,16,17,18]. Global Precipitation Measurement (GPM) is a continuation of the Tropical Rainfall Measuring Mission (TRMM), which carried the world’s first satellite-borne Dual-Frequency Precipitation Radar (DPR) and a multi-channel GPM Microwave Imager (GMI), providing quantitative estimates of the particle size distribution of precipitation [19]. GPM satellite data and products play important roles in a lot of typhoon research [20,21]. Taking Typhoon Lekima (2019) as an example, IMERG, GSMaP, and CMORPH data from GPM have been used to quantify the spatiotemporal pattern of typhoon rainfall, compare the differences between IMERG products in different stages and affected areas, and study the microphysical mechanisms of precipitation. The results show that the GPM satellite has the potential to detect typhoon rainstorms [22,23,24,25,26,27,28]. Huang et al. [29] analyzed the precipitation microphysics of typhoons in the SCS by using GPM satellite observations and statistical methods, finding that the heavy precipitation in typhoons in the SCS is composed of a higher concentration of smaller raindrops than that in the Western Pacific (WP). Fan et al. [30] compared satellite precipitation estimation products with meteorological observation station data in several typhoon cases, and evaluated the precipitation in different time scales and the spatial distribution of daily precipitation of varying magnitudes in the southeastern coastal area. Zhu et al. [31] obtained the 2A-DPR and 1C-GMI products of GPM and the precipitation data and analyzed the precipitation rate near the surface, the rain top height, the precipitation type, the microwave signal, the cloud water path, the ice water path, and the 3D structure of the precipitation of Typhoon Doksuri in 2017.
The Himawari-8/9 satellite carries the Advanced Himawari Imager (AHI) with 16 channels, providing high-resolution observations of weather systems. As a geostationary satellite, it scans a fixed area continuously at intervals of 10 min, and its high-precision images, data, and products are widely used in the dynamic monitoring of typhoon moving tracks and cloud system development [32,33,34,35]. Honda et al. [36,37] assimilated infrared radiances from Himawari-8 with a regional numerical weather prediction (NWP) model and investigated its impact on TC analyses. The results showed that Himawari-8 data improved the accuracy of TC structure analysis and intensity forecasts. Li et al. [38] developed a blended method for radar reflectivity based on the Himawari-8 meteorological satellite and S-band dual-polarization weather radar data, and applied them to the observation and analysis of Super Typhoon In-fa in 2021. Tsukada and Horinouchi [39] proposed a method for deriving the tangential winds in tropical cyclones by employing high-frequency cloud imaging from Himawari-8. Tsujino et al. [40] presented a quantitative estimation of inner-core wind fields based on 2.5 min temporal resolution images from Himawari-8 and clarified the dynamics of the inner eyewall decaying of Typhoon Trami in 2018.
FY-4B is the new-generation operational geostationary satellite of China’s Fengyun satellite series, orbiting as the sister star of FY-4A. The Fengyun satellite can provide higher-resolution data, especially related to atmospheric and cloud products, which are significant for typhoon cloud type and phase analysis [41,42,43,44,45,46,47]. Yang et al. [48] evaluated the accuracy of the FY-4B/GIIRS temperature and humidity profile retrievals using radiosonde observations and ERA5 reanalysis data. They then investigated the impact of the satellite retrievals on assimilation and forecasts for Typhoon Chaba and Ma-on in 2022. Wu et al. [49] revealed the cloud dynamic and microphysical characteristics during the rapid intensification (RI) of Super Typhoon Nanmadol in 2022 by using multi-satellite observations; among them, the high-resolution FY-4B satellite observed the structure of the typhoon eye clearly, allowing the structural characteristics of the typhoon eye wall to be identified.
Typhoon Saola was the ninth typhoon generated over the WNP in 2023, lasting for 10 days. A tropical depression born over the ocean east of the Philippines on 24 August strengthened to become a Super TY on 29 August, landing on the coastal area of Southern China twice as a severe typhoon class and an STY, respectively, causing severe storm impacts [50,51]. Typhoon Saola had a complex moving track in the shape of the number “6”, and experienced a weakening to re-strengthening process, which brought a considerable challenge for forecasting. Currently, there are few studies about Typhoon Saola (2023). In this paper, we used GPM-1CGMI, GPM-2ADPR, Himawari-9, and FY-4B satellite data and products to analyze the structure, moving track, intensity, brightness temperature, and precipitation of the cloud system of Typhoon Saola. The research objectives were as follows. The first was to revisit the whole lifespan of the typhoon through high-resolution satellite data. The second was to understand the changing characteristics of brightness temperature, precipitation, and cloud systems in the various stages of the typhoon. The third was to compare the similarities and differences in the typhoon’s features between different satellite data, analyzing the observation results of satellite data for the typhoon.

2. Data and Methods

2.1. Overview of Typhoon Saola

Typhoon Saola (2023) was generated over the Orient Ocean in the Philippines on 24 August 2023, with its center in the northwestern Pacific Ocean about 720 km northeast of Manila. It roamed off the northeastern coast of Luzon and strengthened to become a severe typhoon at 09:00 on 26 August (UTC, hereafter the same), with a maximum wind force of 15 (50 m/s) near the center and a minimum central pressure that reached 950 hPa. Between 26 and 28 August, the typhoon continued to move forward while circling on the ocean east off the Philippines. Once it had been strengthened to a super typhoon, the minimum central pressure reached 940 hPa. After 21:00 on 28 August, the typhoon began to move at a speed of about 10 km/h northwestward, and re-strengthened to a super typhoon at 09:00 on 29 August, with its center located on the sea surface about 385 km southeast of Ngoluanpi. The typhoon was strongest from 30 to 31 August, with a minimum central pressure of 920 hPa. Then, the typhoon landed in Guangdong Province, China, at about 19:30 on 1 September, with a maximum wind force of 14 (45 m/s) and a central pressure of 950 hPa. After landing, it moved along the coastal area of South China and disappeared at 18:00 on 2 September. The moving track, intensity, life stage, and precipitation changes in Typhoon Saola (2023) are shown in Figure 1.

2.2. GPM Satellite Data

The Global Precipitation Measurement (GPM) is an international satellite mission that was jointly launched by the National Aeronautics and Space Administration (NASA) and the Japan Aerospace Exploration Agency (JAXA) on 27 February 2014. The GPM Core Observatory (GPMCO) operates at an altitude of 407 km, in a non-sun-synchronous orbit with an inclination of 65°, a speed of 7 km/s, and an orbital period of 93 min. It orbits the Earth about 16 times a day. The GPMCO carries the world’s first satellite-borne Dual-Frequency Precipitation Radar (DPR), which operates in KuPR and KaPR channels (13.6 and 35.5 Ghz, respectively) and can provide quantitative estimates of the particle size distribution of precipitation. It also carries a multi-channel GPM Microwave Imager (GMI), which has 13 spectral channels and is capable of observing all precipitation within clouds, including micro-precipitation and snowfall [11]. The information on the data provided by the GPMCO is shown in Table 1. In this study, the L1C-GMI, L2A-DPR, L2A-Ka, and L2A-Ku products of GPM were used, which can be obtained from the GES DISC database of NASA (https://disc.gsfc.nasa.gov/datasets; accessed on 22 December 2023).
L1C-GMI contains common calibrated brightness temperatures from the GMI passive microwave instrument flown on the GPM satellite. Swath S1 has 9 channels that are similar to TRMM TMI. Swath S2 has four channels similar to AMSU-B. Data are observed for both swaths in the same revolution of the instrument. The spectral information of the GPM-GMI channels is shown in Table 1.
The objective of Level-2 DPR algorithms is to generate radar-only derived meteorological quantities from the Level-1 DPR products on an instantaneous FOV (field of view) basis. There are three kinds of Level-2 algorithms for the DPR: the DPR algorithm, the Ku-only (KuPR) algorithm and the Ka-only (KaPR) algorithm. The latter two are single-frequency (SF) algorithms, and the DPR algorithm is a dual-frequency (DF) algorithm. The precipitation estimation products L2A-DPR, L2A-Ka, and L2A-Ku can be retrieved according to these algorithms.

2.3. Himawari-9 Satellite Data

Himawari-8 was part of a new generation of Japanese geostationary meteorological satellites. It was launched on 7 October 2014 and became operational on 7 July 2015. The operation was transferred from the Himawari-8 satellite to the Himawari-9 satellite on 13 December 2022. Himawari-9 is located at 140.7 E above the equator, with a monitoring range of 60 N–60 S and 80 E–160 W. The satellite is stabilized in three axes and carries the Advanced Himawari Imager (AHI) with 16 channels, which can provide high-resolution observations of the Earth’s system from space with spatial resolutions between 0.5 and 2 km and temporal resolutions between 0.5 and 10 min. The spectral information of Himawari-9’s channels is shown in Table 2. In this study, Level-1 standard data of Himawari-9 were used, which can be obtained from the Japan Aerospace Exploration Agency (JAXA) P-Tree system (https://www.eorc.jaxa.jp/ptree/index.html; accessed on 30 October 2023).

2.4. FY-4B Satellite Data

Fengyun-4B (FY-4B) is the second satellite of China’s Fengyun-4 geostationary meteorological satellite series, working as the sister star of the FY-4A in orbit. FY-4B was launched on 3 June 2021 and became operational on 1 December 2022. It is located at 123.36 E above the equator [21]. The Advanced Geostationary Radiation Imager (AGRI) on the FY-4B satellite is the major equipment used for high-frequency monitoring of the atmosphere and clouds in a fixed area. FY-4B/AGRI contains 15 channels, each of which has different detection capabilities for clouds, water vapor, and aerosols, generating various cloud physical parameters [52].
Different types and phases of clouds exhibit different effective absorption optical thickness ratios in various channels according to their microphysical structure and thermodynamic properties. Taking advantage of these differences, cloud-top phase and type products can be generated [53,54].
The cloud phase (CLP) and cloud type (CLT) products are two types of Level-2 products of FY-4B. They can be downloaded from the China National Satellite Meteorological Center (NSMC) data website (http://satellite.nsmc.org.cn/portalsite/default.aspx; accessed on 22 December 2023), providing a total of five phases (clear sky, liquid, supercooled, mixed, and ice phases) and seven types of cloud (clear sky, liquid, supercooled, mixed, opaque ice, cirrus, and multi-layer clouds). The time resolution is 15 min and the spatial resolution is 4 km × 4 km.

2.5. Methods of Data Processing

Quality control is a necessary step before using satellite data. In this study, the threshold quality control rules for various types of satellite data are as follows:
(1)
GPM-1CGMI data require the valid brightness temperature of all channels to be between 160 K and 320 K. This is because, in the original datasets, the missing values were marked as −9999.9, which should be deleted. In addition, depending on the physical properties of the atmosphere and clouds, their brightness temperatures have inherent scopes, beyond or below which values are meaningless;
(2)
GPM-2ADPR data require the valid precipitation rate to be between 0 and 999 mm. Similar to GPM-1CGMI, the −9999.9 values in the original datasets were deleted. All the negative values were also deleted since 2ADPR products represent precipitation, which should not be lower than 0;
(3)
Himawari-9 data require the valid reflectivity of Channel03 (visible light band) to be between 0 and 1 and the valid brightness temperature of Channel08 (water vapor band) and Channel14 (long-wavelength infrared band) to be between 160 K and 320 K. For the Himawari-9 datasets, the −32,768 values (missing value), and values out of the reflectivity or brightness temperatures range (meaningless value) were deleted;
(4)
FY-4B CLP and CLT data exclude data with incorrect quality identification codes. In the original datasets, the variable named data quality flags (DQFs) is used to identify the data quality. For the CLP products, 0–4 represent five phases, and 5 represents “Uncertain” values—that is, the retrieval algorithm generating these products cannot determine the phase. For the CLT products, 0, 2–7 represent seven types, and 9 represents “Uncertain” values. In addition, 126 represents the unexplored space region of the satellite and 127 represents the missing value. All the 5, 9, 126, 127 values mentioned above were deleted before using the FY-4B datasets.
The time range of research is the whole lifetime of Typhoon Saola—that is, from 24 August to 2 September 2023. Due to the different time resolutions of different satellites, 116 sets of GPM data, 1280 sets of Himawari-9 data, and 932 sets of FY-4B data were obtained in this paper.

3. Results

3.1. Tracking Typhoon Features with GPM

3.1.1. Brightness Temperature

The cloud-top brightness temperature has different characteristics in different spectral channels. In the low-frequency channel, the brightness temperature increases with the increase in rain intensity when the rainfall is low, while the brightness temperature decreases with rain intensity when the rainfall is high (rain intensity over 20 mm/h) because of the attenuation of large droplet scattering. The high-frequency channel can effectively identify the presence and content of ice crystals because the brightness temperature hardly changes with the rainfall intensity if there are no ice crystals in the cloud top. The brightness temperature decreases rapidly as the ice crystal layer thickens. Channel03 (18.7 GHz), Channel09 (89 GHz), and Channel13 (183 GHz) of the GPM-1CGMI product of Typhoon Saola are shown in Figure 2.
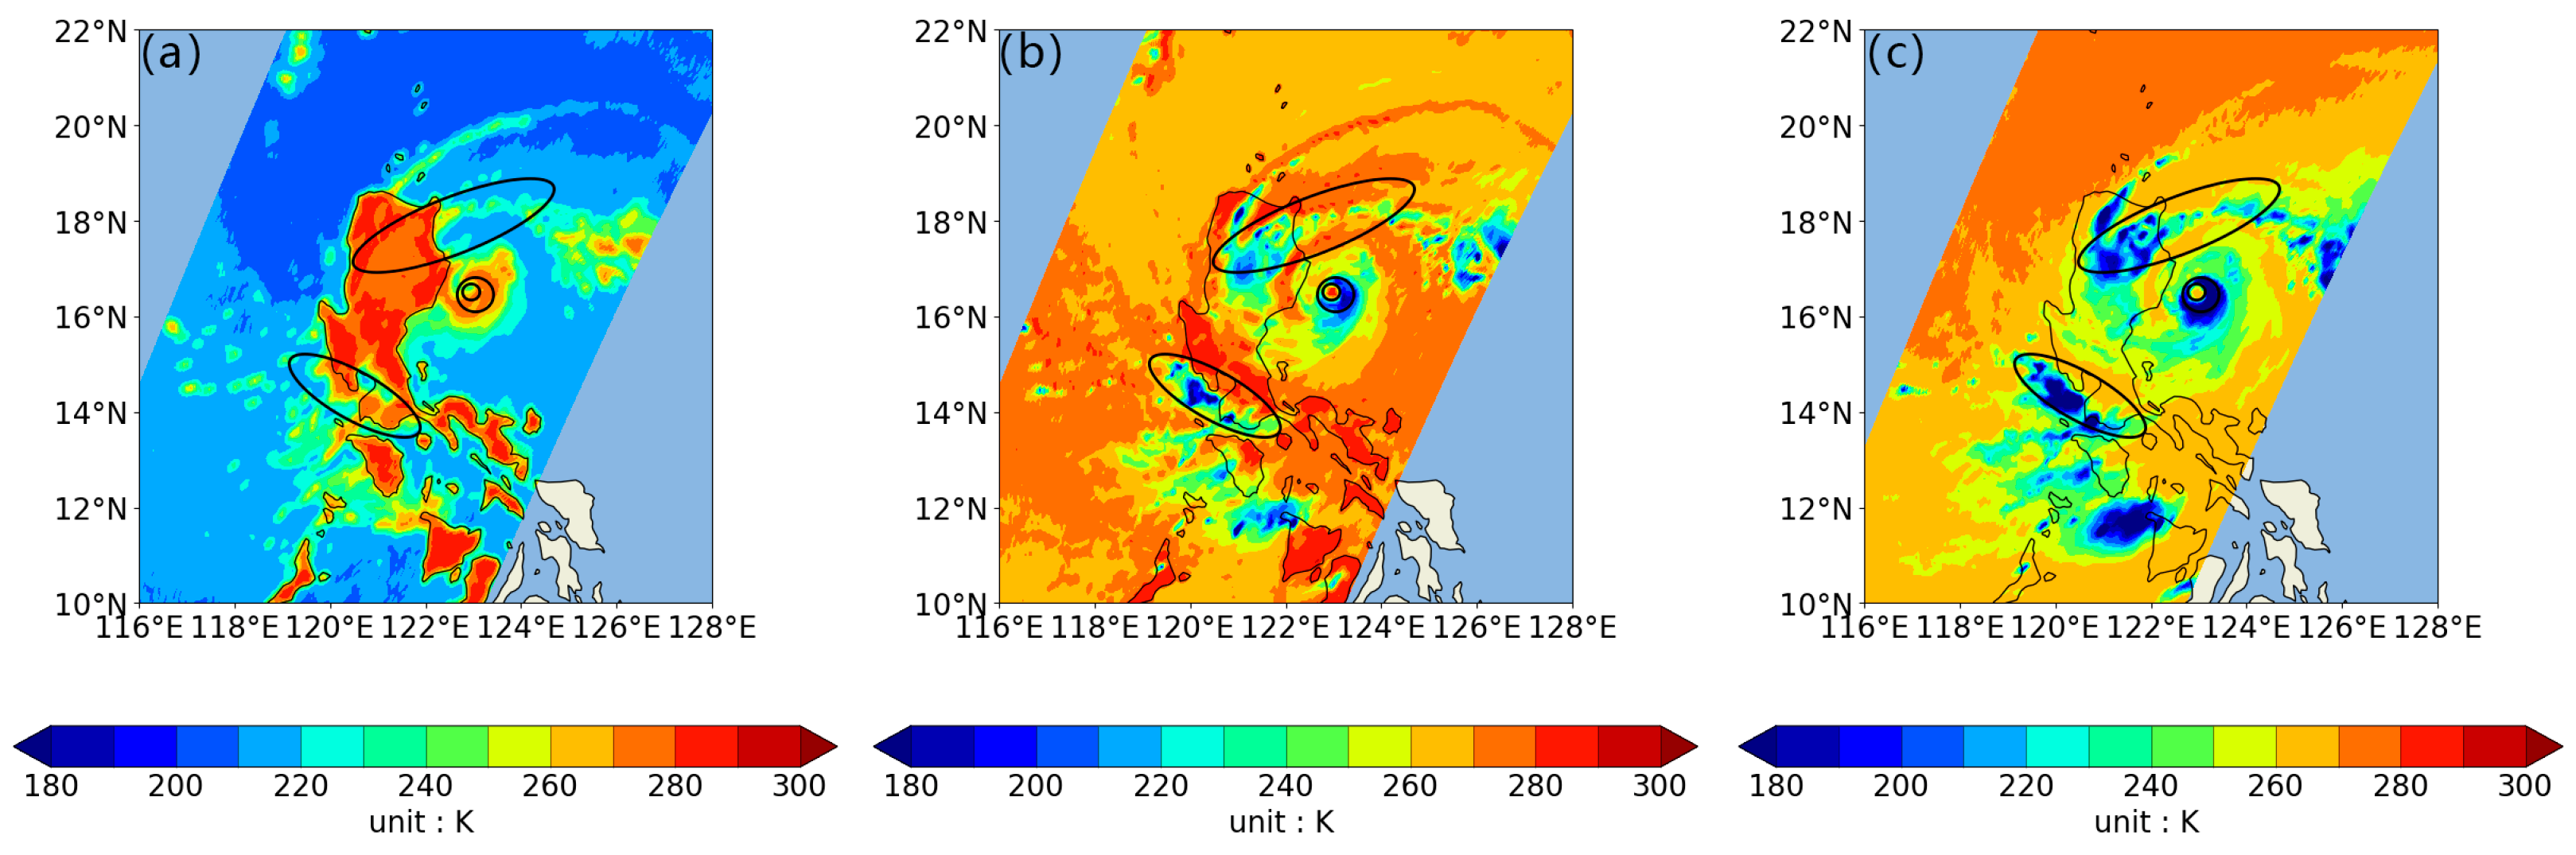
  • In Channel03, the eye of the typhoon was shown as an area with a brightness temperature of around 240 K, but not clear. The brightness temperature of the eye wall was 260–280 K, indicating that the convective development was vigorous and the ice crystal layer was very thick. For the spiral cloud band area, the brightness temperature was 270–300 K, which corresponded to the thinner ice crystal layers (Figure 2a);
  • In Channel09, the eye of the typhoon was clearer than that in Channel03, and the brightness temperature was over 280 K, while that of the eye wall was below 200 K, and the brightness temperature of the spiral cloud band area was 190–250 K (Figure 2b). Compared with the low-frequency Channel03, this channel could distinguish the radiation property differences in various cloud-top phases better, especially for the areas below 200 K in the typhoon eye wall and the spiral cloud band (Figure 2a,b). This is because these areas were highly correlated with the heavy precipitation, owing to the thick ice crystal layer and the attenuation effect of large raindrop particles;
  • In Channel13, the brightness temperature of the typhoon eye was around 260 K, while that of the eye wall and spiral cloud band area was close to that of Channel09 (Figure 2c), indicating that the GMI’s ability to observe high brightness temperatures decreased with the increase in channel frequency. However, the GMI could adequately observe the developing vigorous convective area. The area below 200 K was larger and the shape was more complete on Channel13 compared with Channel09 (Figure 2b,c), indicating that the channel with the higher frequency had a better ability to observe thick ice cloud particles.

3.1.2. Precipitation Estimation

Space-borne radars that use top-down detection methods have smaller beam attenuation than ground-based radars as the particles in the upper part of clouds are smaller than those in the lower part. In other words, DPR can effectively detect the structure of precipitation cloud tops, such as in typhoons with strong convective development. KaPR is more sensitive to the scattering of light rain and cloud drops, while its sensitivity to precipitation and the melting layer (0 °C bright band) is lower than that of KuPR. For the heights below the melting layer, KaPR’s attenuation is stronger than that of KuPR. Due to the different responses of cloud particles in different bands, L2A-DPR (retrieved with the DF algorism) was obtained and compared with L2A-Ka and L2A-Ku in this paper. The DPR product of Typhoon Saola is shown in Figure 3.
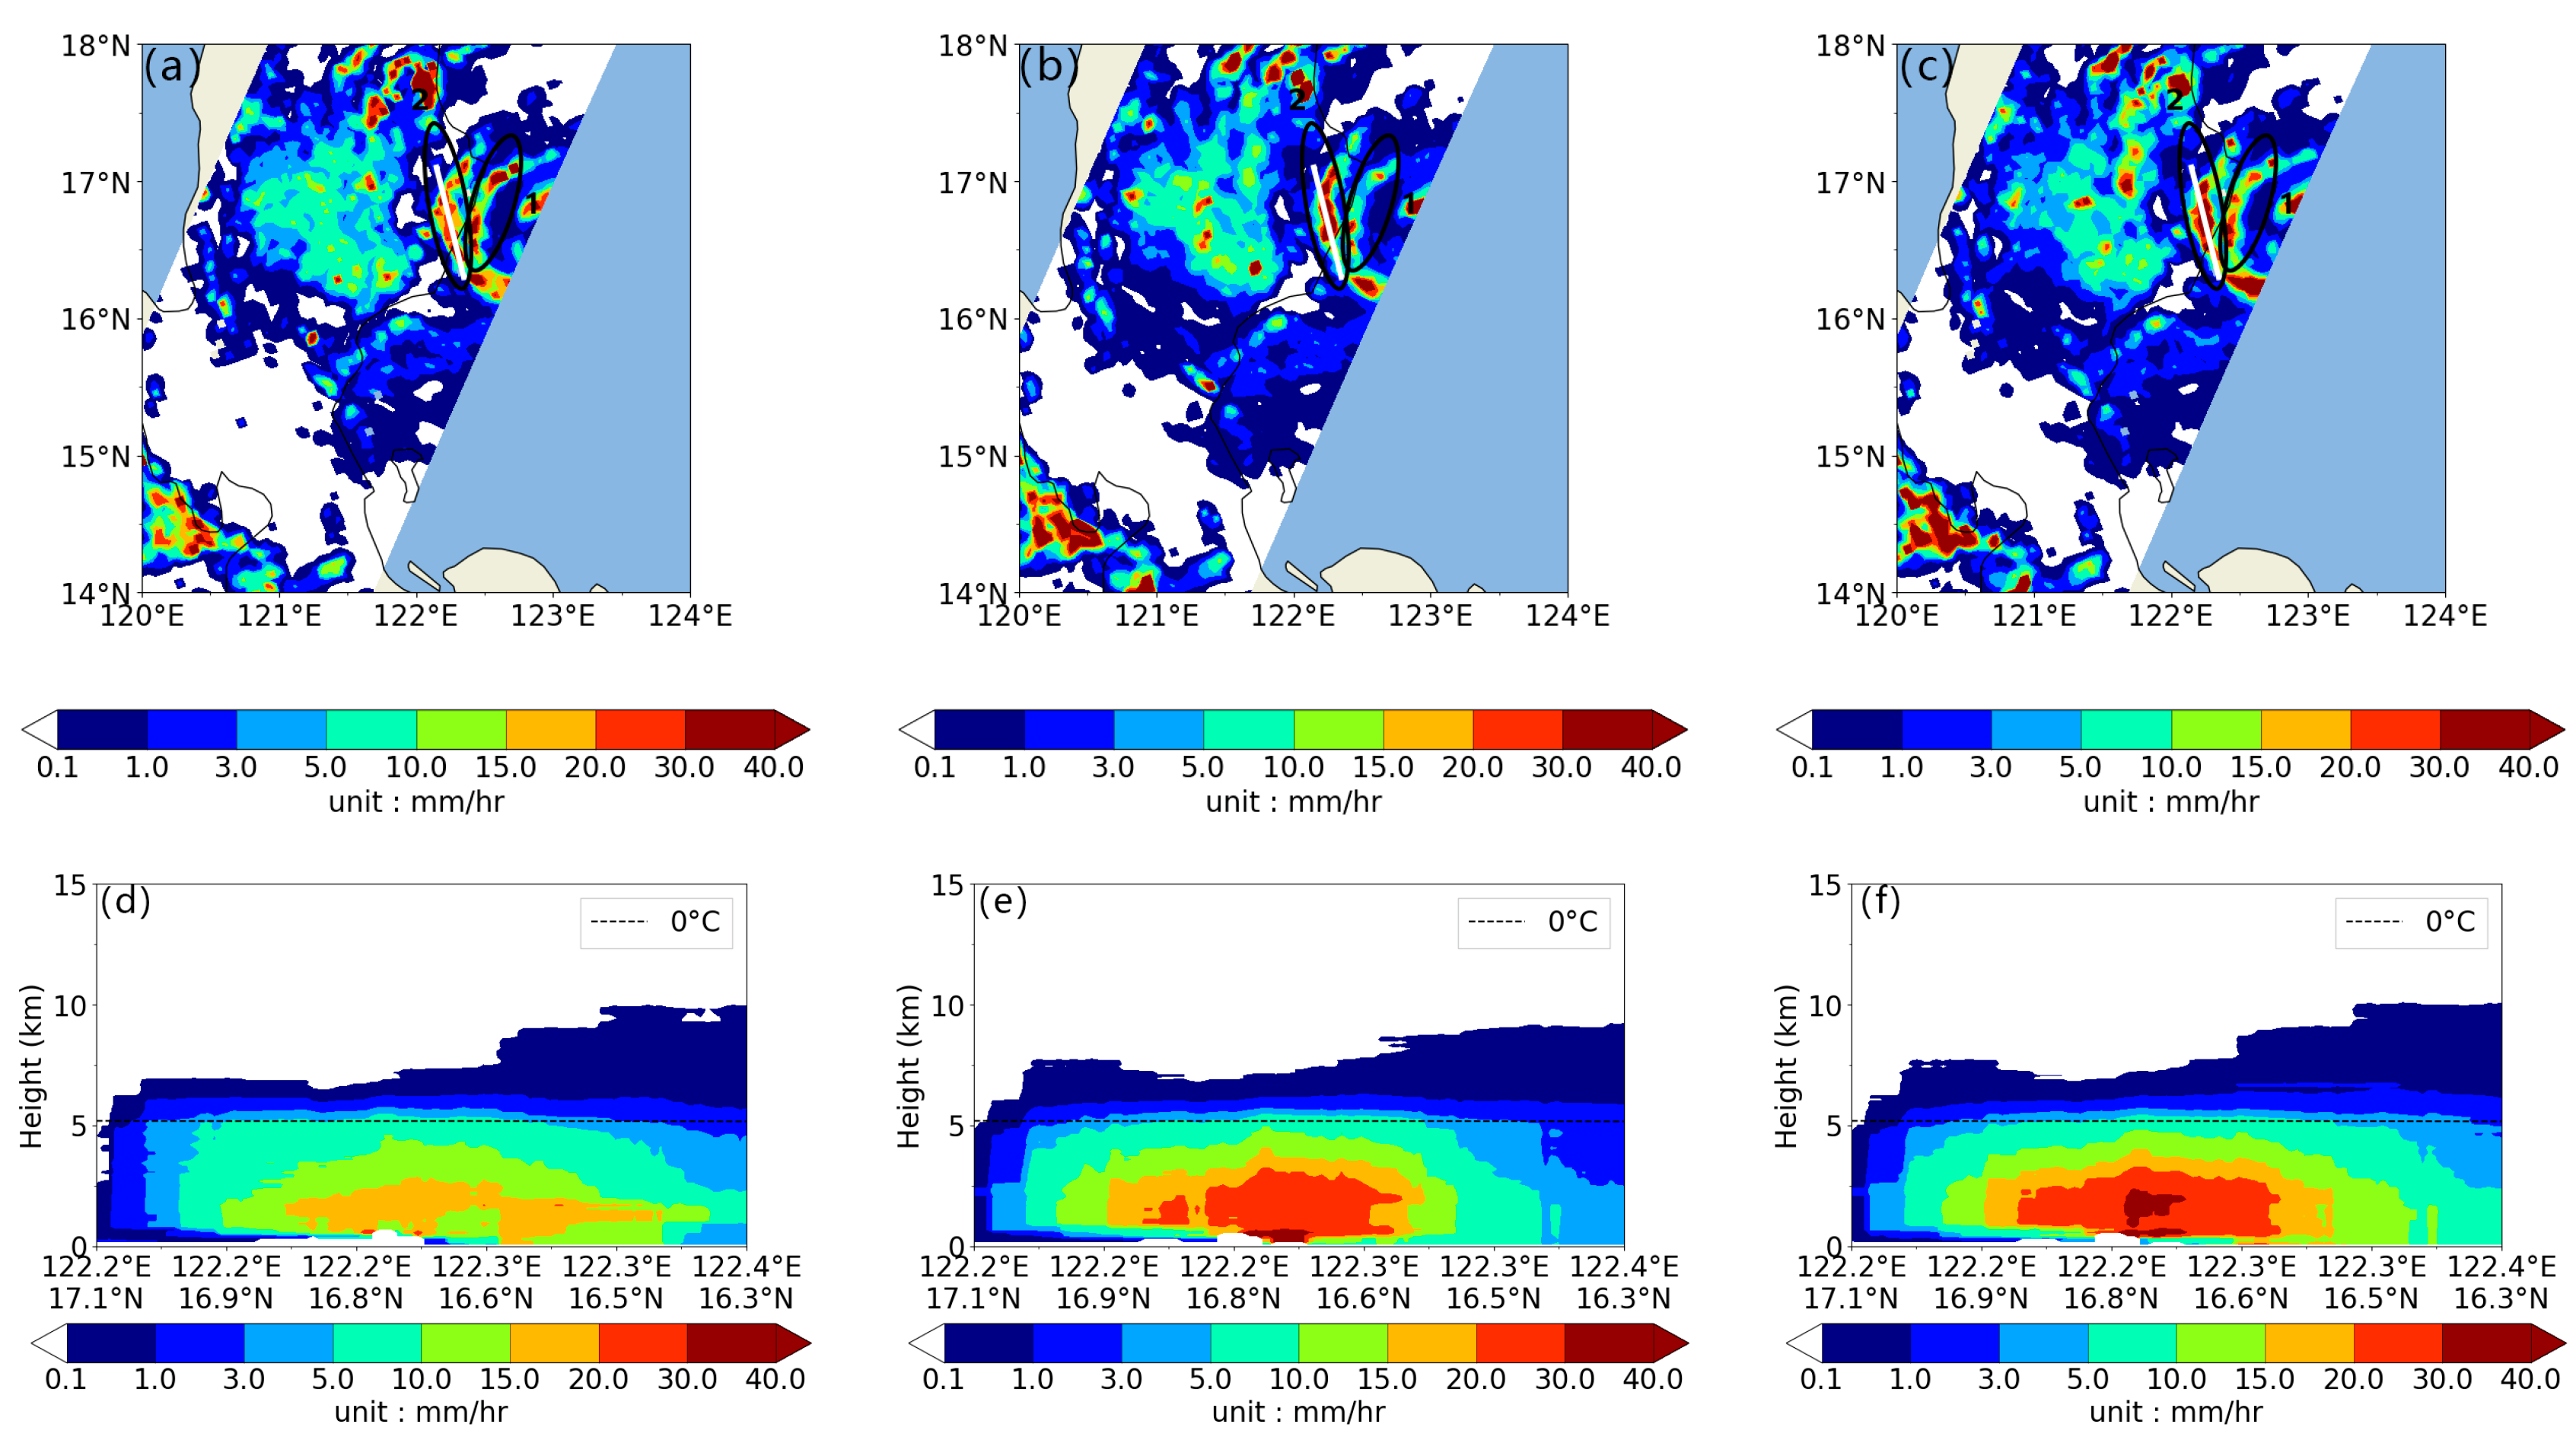
  • In the mature period of Typhoon Saola, two distinct spiral cloud bands were formed. The 2AKa product clearly displayed the shape and location of these clouds and indicated that the near-surface rain intensity was 15–40 mm/h (Figure 3a). 2AKu did not detect the cloud band near the typhoon eye wall, but detected a cloud band that was far from the eye wall. Compared with 2Aka, the estimated near-surface rain intensity was larger, most of which was above 30 mm/h (Figure 3b). 2ADPR not only detected the two spiral cloud bands clearly but also estimated the near-surface rain intensity more accurately than 2Aka and 2Aku. As can be seen from Figure 3c, both the area and intensity of convective cells of the spiral cloud band near the eye wall were smaller than those of the others, indicating that the convective cloud development of the former was weaker;
  • To analyze the precipitation rate at different heights in the vertical direction, the 2AKAa, 2Aku and 2ADPR products were profiled at the same position. The 2AKa product underestimated the storm heights (precipitation rate over 10 mm/h, hereafter the same), which were less than 5 km. The vertical precipitation estimation was also underestimated, with the maximum precipitation rate less than 20 mm/h (Figure 3d). The estimated storm heights of 2AKu were higher, reaching 5 km, and the 2AKu product distinguished the strong convective cloud with the maximum precipitation rate of more than 20 mm/h at around 3 km height (Figure 3e). Similar to 2AKu, the 2ADPR product also accurately distinguished storm heights and convective clouds in the vertical direction. However, compared with 2Aku, the other product also distinguished a height of about 0–2.5 km and a more intense precipitation region, with a precipitation rate of around 30–40 mm/h. Furthermore, the region was similar to the developing convective cloud (Figure 3f). These results illustrate that the product inversed by the DF algorithm has more advantages in identifying the vertical structure of typhoon clouds than the product inversed by the SF algorithm.

3.2. Tracking Typhoon Features with Himawari-9

The radiation data of Channel03 (visible light band), Channel08 (water vapor band) and Channel14 (long-wavelength infrared band) from Himawari-9 was used in this paper to analyze the shape, texture, cloud-top temperature, cloud-top height, and water content of Typhoon Saola. The distributions of the reflectivity and brightness temperature of Typhoon Saola are shown in Figure 4.
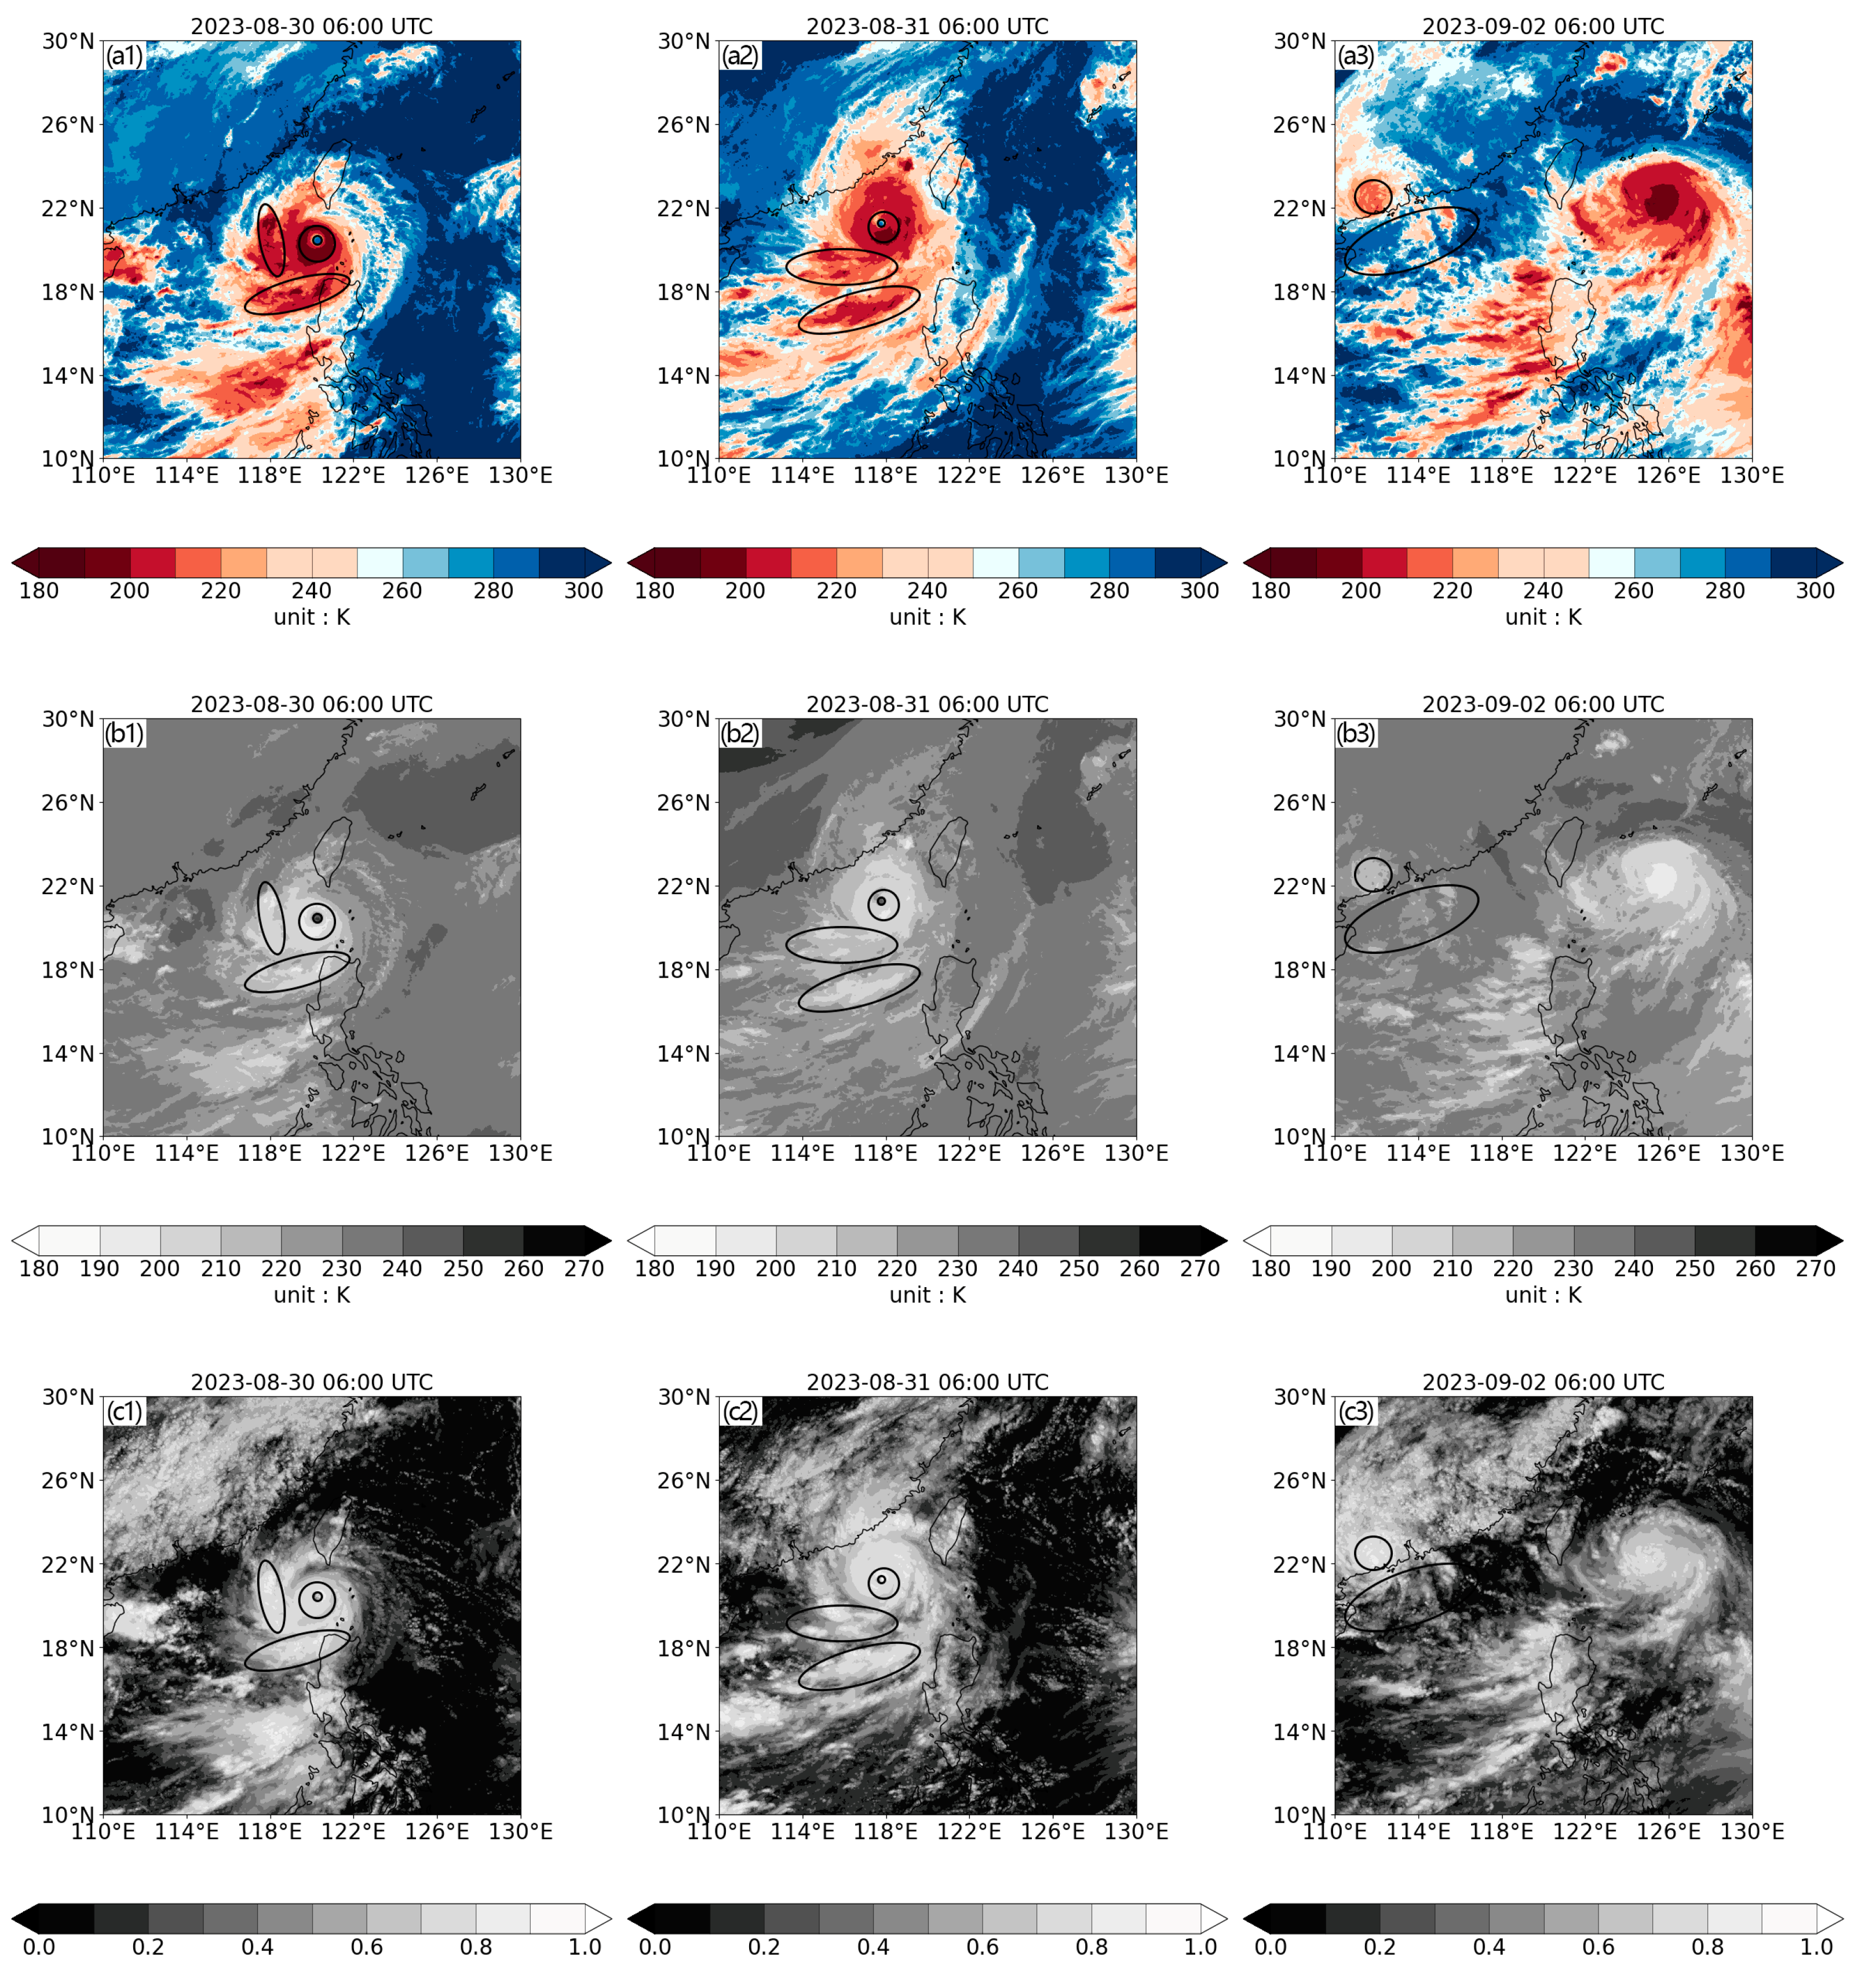
  • In the mature period of Typhoon Saola, the radius of the main body reached over 200 km. The typhoon eye was small and round, and the brightness temperature of the eye area was above 280 K. The eye wall area was clear and complete, represented as a 2° × 2° circular area, and the brightness temperature was 180–200 K. Most of the convective cloud was located on the southwest side of the typhoon center, with several convective cells whose brightness temperature was below 200 K (Figure 4(a1,a2)). These characteristics all indicate that Saola was a typical super typhoon. In the disappearing period, the typhoon eye disappeared, and the brightness temperature of both the eye wall and the outer region increased to 210–240 K (Figure 4(a3));
  • Channel08 detects the water content in the upper layers of clouds. In the mature period of the typhoon, the brightness temperature distributions of Channel08 are similar to those of Channel14. The typhoon eye is represented as a dark area because sinking airflow cuts off the transportation of water vapor (Figure 4(b1,b2)). The brighter the eye wall and outer region of the cloud, the lower the indicated cloud-top brightness temperature and the stronger the convective development; this is because a large amount of water vapor was transported to the upper layers. In the disappearing period, convection in the cloud became weaker, and the water vapor transportation was relatively weakened; these areas on the cloud map also became darker (Figure 4(b3));
  • At Channel03, the typhoon in the mature period had an obvious circulation center and a clear spiral structure. The strong convective activities were mostly located on the southwest side of the center, and the main body of the typhoon was asymmetric (Figure 4(c1,c2)). The brightness of the cloud on the map is also related to the convective development because the convective clouds that reached the tropopause mostly consisted of ice crystals with high reflectivity. In the disappearing period, the circulation center became unrecognizable, the spiral structures became looser and the convective areas became darker (Figure 4(c3)).

3.3. Tracking Typhoon Features with FY-4B

The CLP and CLT products from FY-4B were used for analysis to examine the cloud phases and types of the typhoon, especially those in the upper cloud. The distributions of the cloud phases and types of Typhoon Saola are shown in Figure 5. In the nascent period of the typhoon, the eye had not yet appeared, but the main body composed of ice clouds had already formed. Several spiral cloud bands composed of multi-layer clouds revolved around the main body. Convective clouds occupied the middle and lower layers of the multi-layer cloud, while thin cirrus (ice phase) occupied the upper layer (Figure 5(a1,b1)). In the mature period, the amount of ice cloud increased, and the eye wall area was mostly opaque ice cloud (developing cumulonimbus). In the outer region, spiral cloud bands were mostly composed of multi-layer clouds (Figure 5(a2,b2)). In the disappearing period, the regions of ice cloud and multi-layer cloud shrank, and the areas of supercooled water cloud and mixed cloud expanded, with the convective cloud becoming weak (Figure 5(a3,b3)).
The composition of clouds changes accordingly in each period of a typhoon’s lifespan. The time series diagrams of the cloud phases, cloud types, and central pressure of Typhoon Saola are shown in Figure 6. It should be noted that since the typhoon rarely contains liquid clouds (Figure 5), clear sky and liquid cloud were subtracted in the statistical analysis.
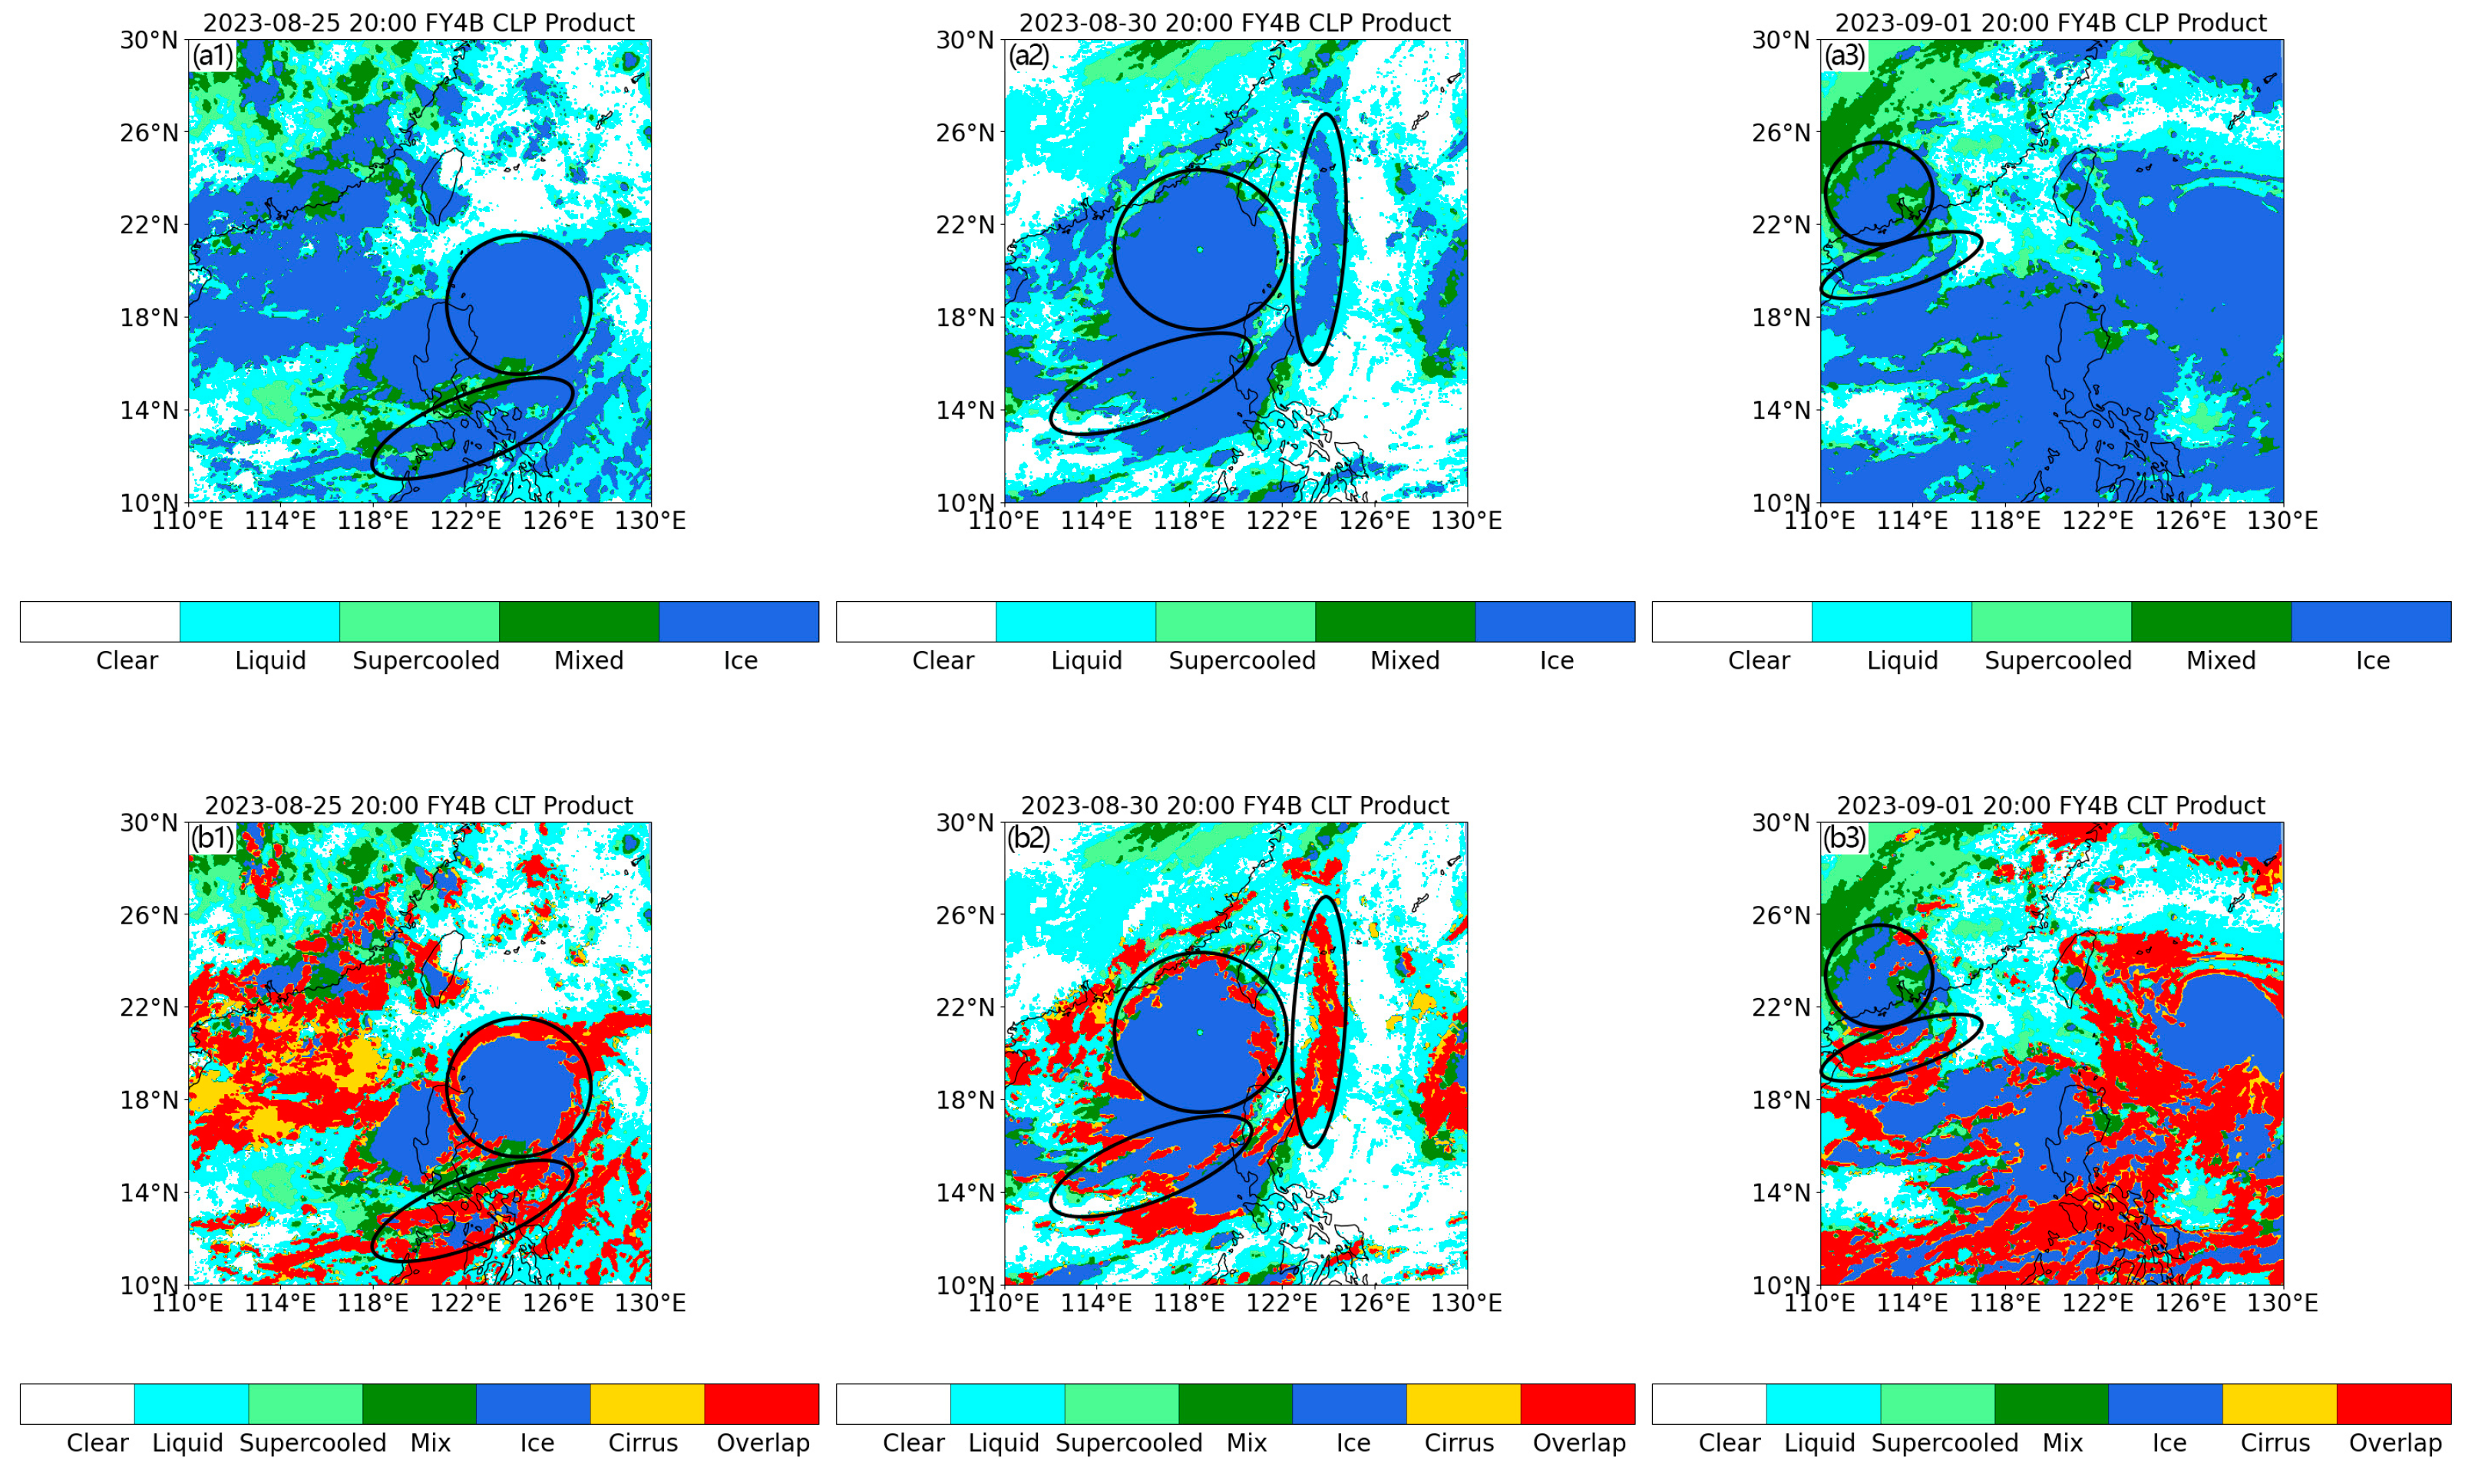
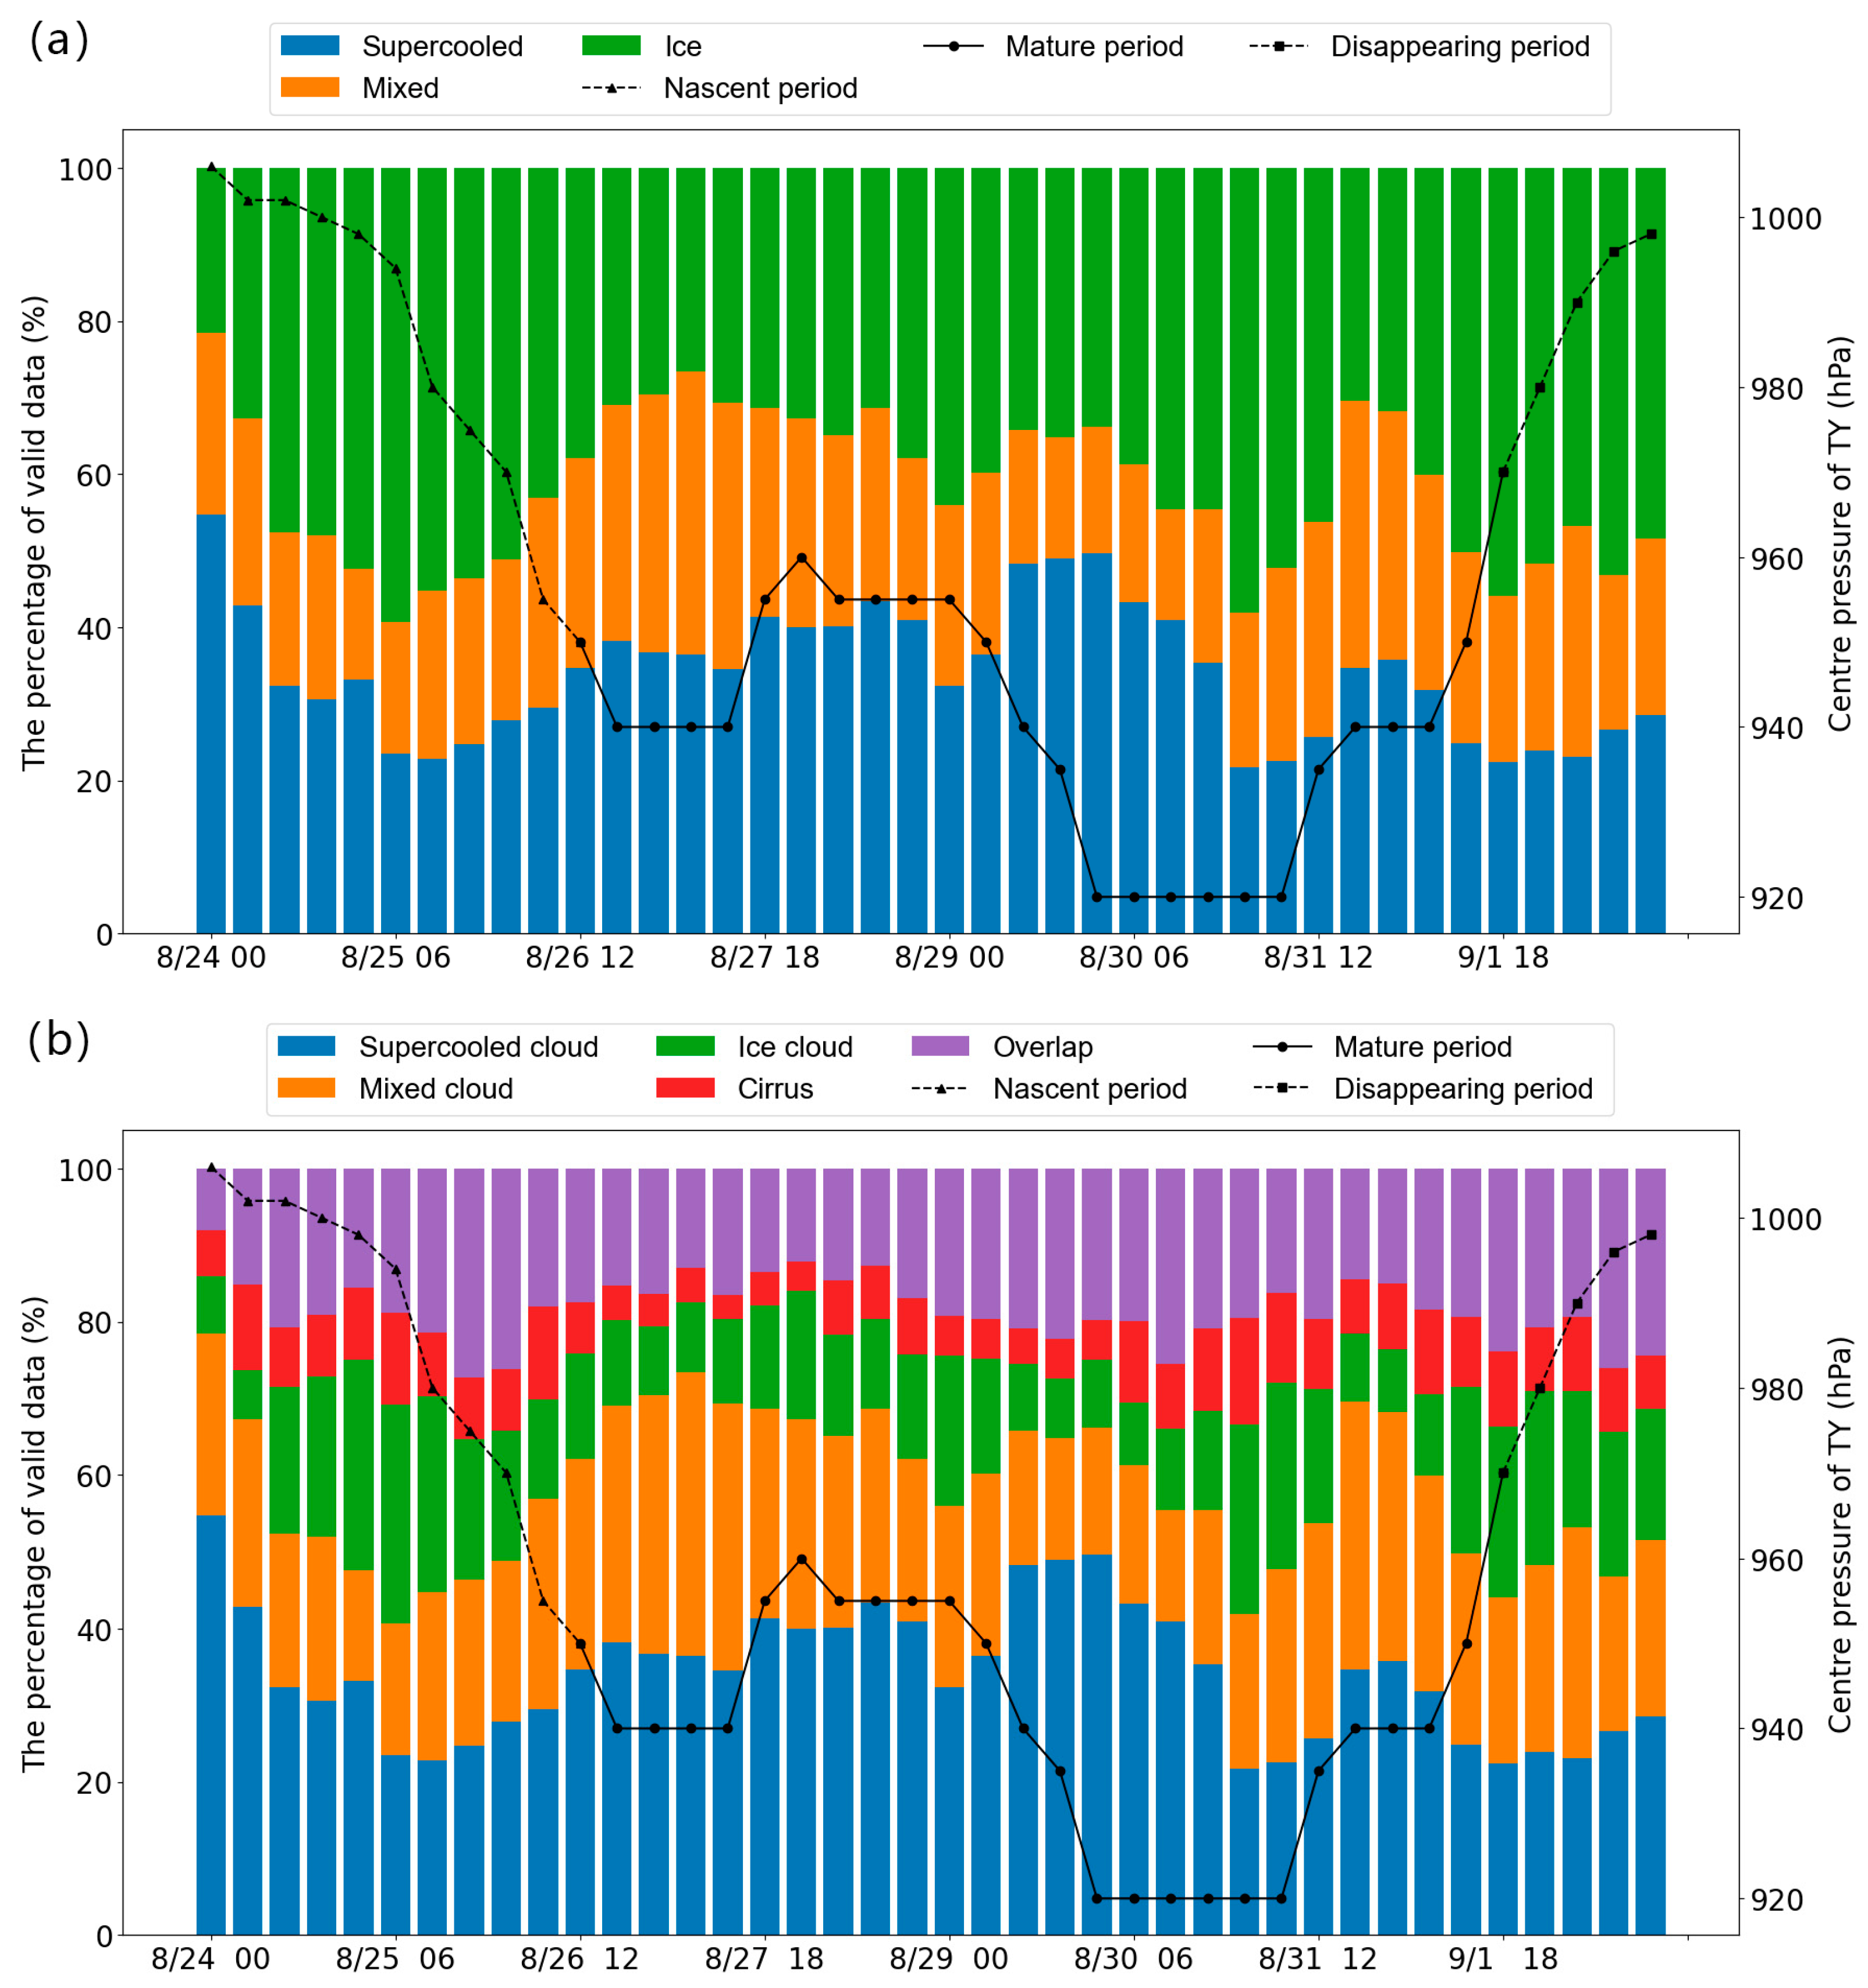
  • In the nascent period of the typhoon, the percentage of the supercooled-phase pixels decreased rapidly from 50% to 20% and then increased to above 40% with the decrease in the typhoon’s central pressure. The mixed phase also displayed a tendency to decrease first and then increase, with an average percentage of about 20–30%. In contrast to the supercooled phase, the ice phase increased rapidly from 20% to 60% and then decreased to 30% (Figure 6a). The ice-phase cloud includes thick opaque ice, thin cirrus and multi-layer clouds. The percentages of these three types were between 5 and 30%, 5 and 10%, and 10 and 30%, and all their trends in this period were consistent with the ice-phase cloud (Figure 6b);
  • In the mature period of the typhoon, the central pressure first increased and then decreased. Correspondingly, the percentage of supercooled-phase pixels first stabilized at between 40 and 50% and then rapidly decreased to 20%. The trend of the mixed phase was similar to that of the supercooled phase, accounting for only 15% at the strongest period of the typhoon (Figure 6a). The trends for all three types of ice-phase cloud were increase–decrease–increase, with percentages between 10 and 25%, 5 and 15%, and 15 and 30% (Figure 6b). In the disappearing period, the percentages of all the cloud phases and types changed similarly to in the nascent period, but with opposite increase and decrease trends;
  • The period when the central pressure of Typhoon Saola reached its lowest (920 hPa) was taken for analysis. The results show that the percentages of various cloud types reached their extreme values at different times. Supercooled and mixed clouds decreased to their minimum levels of 21.7% at 00:00 on 31 August and 14.5% at 12:00 on 30 August, respectively. Ice cloud and cirrus both reached maximum levels of 24.8% and 13.7% at 00:00 on 31 August. Multi-layer cloud reached a maximum of 25.6% at 12:00 on 30 August.

4. Discussion

Typhoon Saola was one of the most destructive super typhoons that occurred in 2023. Its circular moving path meant that it stayed on the WNP for a long time, and the adequate level of water vapor transportation rapidly increased its intensity. After landing, the Central Meteorological Observatory and the Hong Kong Observatory issued the highest-level typhoon red warning signal and typhoon signal No. 10, respectively. Currently, there are few studies on Typhoon Saola (2023); Chan et al. [50,51] compared surface observations, upper-air observations, and weather radar data with numerical weather prediction results, but did not apply high-resolution satellite data. In this paper, satellite data were sufficiently used for revisiting the study of Typhoon Saola. The results show that the characteristics of typhoon brightness temperature, precipitation rate, water vapor content, and cloud types have been analyzed in detail, and the understanding of Typhoon Saola has also been improved.
In previous studies, typhoon cloud characteristics were mostly analyzed using a single satellite source (polar or geostationary) combined with radar or wind field data. In this study, the infrared channels of Himawari-9 and the GPM satellites were jointly used to analyze the brightness temperature features of the typhoon. The polar-orbiting GPM satellite has low temporal resolution but contains multiple frequency channels, which can show the brightness temperature differences between different areas of the typhoon in detail. Himawari-9 makes up for the lack of temporal resolution by performing high-precision fixed-point scans at 10 min intervals and dynamically monitoring the entire lifespan of Typhoon Saola. The results of this study show that the brightness temperatures of the two satellites are consistent in some spectral channels and frequency bands, which will be instructive for the subsequent fusion of multi-source satellite data.
Satellite data were sufficiently applied for the study of typhoon precipitation in this paper. Three kinds of products from GPM-2ADPR were used to analyze the surface precipitation and vertical precipitation rate of Typhoon Saola. Compared with the 2Aka and 2Aku products, the GPM-2ADPR product estimated the convective cloud and precipitation rate of typhoon more accurately. The results are consistent with the conclusions of Lu et al. [20] and Cai et al. [21]. The water vapor band of Himawari-9 was also used to analyze the water vapor transportation in the typhoon cloud system. The temporal consistency of strong water vapor transportations and heavy rainfalls on the ground was found through comparison with the GPM satellite data. The spatial differences between the two show the complexity of the typhoon cloud precipitation mechanism, which will be studied in subsequent work.
The application of the FY-4B satellite product is an innovation point of this paper. FY-4B is China’s newest geostationary satellite, and it provides cloud classification products with the highest temporal resolution. Thus, through its use in this study, changes in various typhoon clouds could be accurately distinguished. Compared with the brightness temperature detected by the GPM and Himawari-9 satellites, the FY-4B CLP and CLT products further reveal the features of the different clouds of the typhoon cloud system. For example, ice clouds and multi-layer clouds with similar brightness temperatures were distinguished by the CLT products. Additionally, the percentage changes of certain types of clouds in the whole lifespan of Typhoon Saola were obtained.
A number of uncertainties still exist in this study. Firstly, satellite data produce errors in the estimations of near-surface elements because the top-down detecting method ignores the attenuation of electromagnetic waves in the atmosphere. Moreover, due to the differences in orbital operation, data transmission and temporal and spatial resolution between different satellites, there are also differences in the data obtained, which can affect the results. In order to reduce errors, the ground observation should be used as the true value for satellite data correction. However, it is difficult to apply ground-based observation data for typhoons whose main activities are over the ocean. In our next work, radar precipitation data will be considered to revise satellite data, and data from different satellites will also be obtained for correlation analysis in order to obtain more accurate results.
The object of this research was a single high-impact weather system (Super Typhoon Saola), so the universality of the conclusions is still uncertain. In subsequent work, we will analyze other typhoons using the methods in this paper and obtain the brightness temperature, precipitation and cloud system features of typhoons in satellite data. The typhoons that have similar features to Saola will be identified, and the conclusions of this paper could thus be further verified. Establishing a “typhoon case library” will allow more general results of typhoon characteristics to be obtained through statistical methods.

5. Conclusions and Implications

The GPM, Himawari-9, and FY-4B satellite data were used in this study to investigate Typhoon Saola (2023) over the Western Pacific from 24 August to 2 September 2023. The changes in structure, moving track, intensity, brightness temperature, precipitation, and cloud system features were analyzed. The main conclusions are as follows:
In terms of brightness temperature, different regions of Typhoon Saola changed regularly during its whole lifespan. This was revealed by the infrared channels of GPM-1CGMI and Himawari-9. In the nascent period, the typhoon eye had not yet formed, and the brightness temperature of the eye wall gradually decreased to 200 K. In the mature period, the brightness temperature of the typhoon eye reached over 280 K at Channel14 of Himawari-9, while that of the eye wall and spiral cloud bands was 180–200 K. In the high-frequency channels (89 and 183 GHz) of GPM-1CGMI, the brightness temperature of the typhoon eye was 80–90 K higher than that of the eye wall and spiral cloud bands, and most regions of the latter had brightness temperatures below 200 K. These results were consistent with those obtained using Himawari-9. In the disappearing period, the brightness temperatures at the infrared channels of the two satellites both increased to 210–240 K.
In terms of precipitation, the GPM-DPR satellite data showed the location and intensity of the near-surface precipitation of the typhoon, as well as the vertical precipitation rate. The 2ADPR product, which was inversed by the DF algorithm, not only clearly detected the two spiral cloud bands in the mature period of the typhoon but also estimated the area of heavy rainfall (over 30 mm/h) more accurately than the 2Aka and 2Aku products. In the vertical direction, 2ADPR also accurately distinguished the storm heights and the shape and precipitation rate of the convective cloud, particularly for the region with heavy rain. According to the results from Channel08 (water vapor band) of Himawari-9, the water vapor transportation in the cloud system changed from weak to strong and then weakened over the whole lifespan of Typhoon Saola. In the mature period, the strongest transportation occurred in the eye wall and spiral cloud band regions, which was consistent with the period when heavy rainfalls were indicated by the GPM-2ADPR product. However, the areas of heavy rain on the ground were obviously smaller than the areas of strong water vapor transportation in the cloud. Furthermore, the maximum precipitation point did not correspond with the lowest brightness temperature at Channel08 of Himawari-9. These results show that more mechanisms exist between the water vapor in convective clouds and the formation of surface precipitation.
In terms of the features of the cloud system, the analysis of the phases and types of typhoon clouds plays an important role. In the nascent and mature periods of Typhoon Saola, ice clouds and multi-layer clouds contained similar ice crystal particles on the cloud tops, which could hardly be distinguished using the brightness temperature of the GPM and Himawari-9 satellites. However, results were generated using the FY-4B CLP and CLT products that showed that the main body of Typhoon Saola was made up of opaque ice clouds, while the spiral cloud band was mostly composed of multi-layer clouds. In the disappearing period, the scope of ice clouds and multi-layer clouds shrank, and that of supercooled water clouds and mixed clouds expanded. In addition, the FY-4B products showed various characteristics of different cloud types during the whole lifespan of Typhoon Saola. The percentages of supercooled and mixed clouds first decreased and then increased in the nascent period, and the thick opaque ice, thin cirrus and multi-layer clouds showed an opposite trend. In the mature period, the percentages of the former two cloud types first stabilized and then rapidly decreased, and the percentages of the latter three types increased, decreased and then finally increased. In the disappearing period, the changes were similar to those of the nascent period, but the trends were opposite.
The conclusions generalize the cloud and precipitation characteristics of super Typhoon Saola, showing the feasibility of using multi-source satellite data to analyze typhoons. Satellites with different resolutions can detect the characteristics of typhoons on different scales and obtain more detailed information. The methods developed in this study can be applied to the following areas of future typhoon studies. Firstly, by studying more typhoons, more features can be identified through the joint application of various satellite data. Secondly, the results of this study will be continuously verified, and more general conclusions will be developed through comparisons with other typhoon cases. For example, comparisons can be carried out between the most likely ranges of brightness temperature, or the most common percentages of cloud types in the mature period of most typhoons. Finally, the results of this study showed that the data from the newest satellite FY-4B can be applied in typhoon analysis, not only for the real-time monitoring of super typhoons but also in satellite assimilations of the NWP to improve the forecasting ability of typhoons and reduce fatalities and economic losses.

Author Contributions

Conceptualization, data collection, and analysis, Y.W., H.C. and B.X.; review, editing, supervision, and funding acquisition, Y.C. and J.X. All authors have read and agreed to the published version of the manuscript.

Funding

This research was jointly supported by the China Meteorological Administration Innovation and Development Special Project (Grant No. CXFZ2024J070), the Chongqing Special Key Projects for Technological Innovation and Application Development (Grant No. CSTB2022TIAD-KPX0123), and the Chongqing Meteorological Department Business Technology Research Project (Grant No. YWJSGG-202310). And The APC was funded by the Chongqing Special Key Projects for Technological Innovation and Application Development (Grant No. CSTB2022TIAD-KPX0123).

Institutional Review Board Statement

Not applicable.

Informed Consent Statement

Not applicable.

Data Availability Statement

Publicly available datasets were analyzed in this study. The information about typhoon can be found here: [https://www.data.jma.go.jp/yoho/typhoon/]. The GPM satellite data can be found here: [https://disc.gsfc.nasa.gov/]. The Himawari-9 satellite data can be found here: [https://www.eorc.jaxa.jp/ptree/index.html]. The FY-4B satellite data can be found here: [https://satellite.nsmc.org.cn/]. (accessed on 22 December 2023).

Conflicts of Interest

The authors declare no conflicts of interest.

References

  1. Tropical Cyclone. (n.d.). Wikipedia.org. 2014. Available online: https://encyclopedia.thefreedictionary.com/Tropical+cyclone (accessed on 25 October 2023).
  2. Typhoon. (n.d.). Wikipedia.org. 2014. Available online: https://encyclopedia.thefreedictionary.com/typhoon (accessed on 25 October 2023).
  3. Emanuel, K. Increasing destructiveness of tropical cyclones over the past 30 years. Nature 2005, 436, 686–688. [Google Scholar] [CrossRef] [PubMed]
  4. Chien, F.-C.; Kuo, H.-C. On the extreme rainfall of Typhoon Morakot (2009). J. Geophys. Res. Atmos. 2011, 116, D05104. [Google Scholar] [CrossRef]
  5. Liu, D.; Pang, L.; Xie, B. Typhoon disaster in China: Prediction, prevention, and mitigation. Nat. Hazards 2009, 49, 421–436. [Google Scholar] [CrossRef]
  6. Yin, J.; Yin, Z.; Xu, S. Composite risk assessment of typhoon-induced disaster for China’s coastal area. Nat. Hazards 2013, 69, 1423–1434. [Google Scholar] [CrossRef]
  7. Zhao, Y.; Chen, Y.; Wu, C.; Li, G.; Ma, M.; Fan, L.; Zheng, H.; Song, L.; Tang, X. Exploring the contribution of environmental factors to evapotranspiration dynamics in the Three-River-Source region, China. J. Hydrol. 2023, 626, 130222. [Google Scholar] [CrossRef]
  8. Mas, E.; Bricker, J.; Kure, S.; Adriano, B.; Yi, C.; Suppasri, A.; Koshimura, S. Field survey report and satellite image interpretation of the 2013 Super Typhoon Haiyan in the Philippines. Nat. Hazards Earth Syst. Sci. 2015, 15, 805–816. [Google Scholar] [CrossRef]
  9. Chen, L.; Xu, Y. Review of typhoon very heavy rainfall in China. Meteorol. Environ. Sci. 2017, 40, 3–10. (In Chinese) [Google Scholar]
  10. Wang, H.P. Research on rainfall forest errors and their sources of typhoon influencing China in 2019. Meteorol. Mon. 2023, 49, 1299–1314. (In Chinese) [Google Scholar]
  11. Ren, F.; Yang, H. An overview of advances in typhoon rainfall and its forecasting researches in China during the past 70 years and future prospects. Torrential Rain Disasters 2019, 38, 526–540. (In Chinese) [Google Scholar]
  12. Chen, L.; Murata, A.M.; Duan, Y.; Duong, L.; Chau, Y.; Li, P.; Black, M.; Cheng, L. Observations and forecasts of rainfall distribution. Sixth Int. Workshop Trop. Cyclones Top. 0.3 2006, 36–42. [Google Scholar]
  13. Chen, L.S.; Li, Y.; Cheng, Z.Q. An overview of research and forecasting on rainfall associated with landfalling tropical cyclones. Adv. Atmos. Sci. 2010, 27, 967–976. (In Chinese) [Google Scholar] [CrossRef]
  14. Xu, X.D.; Lu, C.; Xu, H.X.; Chen, L. A possible mechanism responsible for exceptional rainfall over Taiwan from Typhoon Morako. Atmos. Sci. Lett. 2011, 12, 294–299. (In Chinese) [Google Scholar] [CrossRef]
  15. Pan, Y.; Liu, A.K.; He, S.; Yang, J.; He, M.-X. Comparison of typhoon locations over ocean surface observed by various satellite sensors. Remote Sens. 2013, 5, 3172–3189. [Google Scholar] [CrossRef]
  16. Chen, S.; Hong, Y.; Cao, Q.; Kirstetter, P.; Gourley, J.; Qi, Y.; Zhang, J.; Howard, K.; Hu, J.; Wang, J. Performance evaluation of radar and satellite rainfalls for Typhoon Morakot over Taiwan: Are remote-sensing products ready for gauge denial scenario of extreme events. J. Hydrol. 2013, 506, 4–13. [Google Scholar] [CrossRef]
  17. Pun, I.F.; Lin, I.I.; Ko, D.S. New generation of satellite-derived ocean thermal structure for the Western North Pacific typhoon intensity forecasting. Prog. Oceanogr. 2014, 121, 109–124. [Google Scholar] [CrossRef]
  18. Ma, X.; Wang, J.; Huang, H.; Wang, X.; Wang, Z.; Hu, B. Comprehensive Analysis of Typhoon Nangka Based on the Satellite Data from the GPM, CloudSat and Himawari-8. Atmosphere 2023, 14, 440. [Google Scholar] [CrossRef]
  19. Cosner, C. Precipitation Measurement Missions [EB/OL]. Available online: http://pmm.nasa.gov/GPM/ (accessed on 22 December 2023).
  20. Meiqi, L.; Ming, W. GPM Data Application in Analysis of Vertical Structure of Typhoon ‘Mujigae’ Precipitation. Remote Sens. Technol. Appl. 2017, 32, 904–912. (In Chinese) [Google Scholar]
  21. Cai, Z.; Zheng, Y.; Duan, J.; Zhu, H.; Wu, J. Evaluation and correction of GPM satellite precipitation products during Typhoon “In-Fa” affecting Zhejiang. Torrential Rain Disasters 2023, 42, 704–715. (In Chinese) [Google Scholar]
  22. Chen, T.; Dong, L.; Luo, L.; Yang, S. Convection structure and impact on severe precipitation during landing of Typhoon Lekima. Meteorol. Mon. 2021, 47, 1433–1443. (In Chinese) [Google Scholar]
  23. Qi, W.; Yong, B.; Gourley, J.J. Monitoring the super typhoon lekima by GPM-based near-real-time satellite precipitation estimates. J. Hydrol. 2021, 603, 126968. [Google Scholar] [CrossRef]
  24. Wu, Z.; Huang, Y.; Zhang, Y.; Zhang, L.; Lei, H.; Zheng, H. Precipitation characteristics of typhoon Lekima (2019) at landfall revealed by joint observations from GPM satellite and S-band radar. Atmos. Res. 2021, 260, 105714. [Google Scholar] [CrossRef]
  25. Yu, C.; Hu, D.; Di, Y.; Wang, Y. Performance evaluation of IMERG precipitation products during typhoon Lekima (2019). J. Hydrol. 2021, 597, 126307. [Google Scholar] [CrossRef]
  26. Deng, X.; Wu, Y. Analysis of horizontal precipitation structure of typhoon area based on GPM detection data. Prog. Geophys. 2022, 37, 1799–1806. [Google Scholar]
  27. Liang, J.; Chan, K.T. Rainfall asymmetries of the western North Pacific tropical cyclones as inferred from GPM. Int. J. Climatol. 2021, 41, 5465–5480. [Google Scholar] [CrossRef]
  28. Huang, H.; Chen, F. Precipitation microphysics of tropical cyclones over the western North Pacific based on GPM DPR observations: A preliminary analysis. J. Geophys. Res. Atmos. 2019, 124, 3124–3142. [Google Scholar] [CrossRef]
  29. Huang, X.; Wu, Z.; Xie, Y.; Zhang, Y.; Zhang, L.; Zheng, H.; Xiao, W. Precipitation microphysics of locally-originated typhoons in the South China Sea based on GPM satellite observations. Remote Sens. 2023, 15, 2657. [Google Scholar] [CrossRef]
  30. Fan, N.; Lin, X.; Guo, H. An analysis for the applicability of global precipitation measurement mission (GPM) IMERG precipitation data in typhoons. Atmosphere 2023, 14, 1224. [Google Scholar] [CrossRef]
  31. Zhu, M.; He, J.; Fang, M.; Yin, Q. Application of GPM data in analysis of precipitation structure of Typhoon Doksuri. J. Arid Meteorol. 2018, 36, 997. (In Chinese) [Google Scholar]
  32. Lee, Y.K.; Li, J.; Li, Z.; Schmit, T. Atmospheric temporal variations in the pre-landfall environment of typhoon Nangka (2015) observed by the Himawari-8 AHI. Asia-Pac. J. Atmos. Sci. 2017, 53, 431–443. [Google Scholar] [CrossRef]
  33. Lin, J.Y.; Ho, H.; Zheng, Z.W. Improved Understanding of Typhoon-Induced Immediate Chlorophyll-A Response Using Advanced Himawari Imager (AHI) Onboard Himawari-8. Remote Sens. 2022, 14, 6055. [Google Scholar] [CrossRef]
  34. Tan, J.; Yang, Q.; Hu, J.; Huang, Q.; Chen, S. Tropical cyclone intensity estimation using Himawari-8 satellite cloud products and deep learning. Remote Sens. 2022, 14, 812. [Google Scholar] [CrossRef]
  35. Lu, J.; Feng, T.; Li, J.; Cai, Z.; Xu, X.; Li, L.; Li, J. Impact of assimilating Himawari-8-derived layered precipitable water with varying cumulus and microphysics parameterization schemes on the simulation of Typhoon Hato. J. Geophys. Res. Atmos. 2019, 124, 3050–3071. [Google Scholar] [CrossRef]
  36. Honda, T.; Miyoshi, T.; Lien, G.Y.; Nishizawa, S.; Yoshida, R.; Adachi, S.A.; Terasaki, K.; Okamoto, K.; Tomita, H.; Bessho, K. Assimilating all-sky Himawari-8 satellite infrared radiances: A case of Typhoon Soudelor (2015). Mon. Weather Rev. 2018, 146, 213–229. [Google Scholar] [CrossRef]
  37. Honda, T.; Takino, S.; Miyoshi, T. Improving a precipitation forecast by assimilating all-sky Himawari-8 satellite radiances: A case of Typhoon Malakas (2016). SOLA 2019, 15, 7–11. [Google Scholar] [CrossRef]
  38. Li, C.; Zhuang, X.; Ma, C.; Guo, X. Development of a blended radar reflectivity method based on satellite and radar and its application to the observation of typhoon “In-fa”. Mar. Forecast. 2022, 39, 84–93. (In Chinese) [Google Scholar]
  39. Tsukada, T.; Horinouchi, T. Estimation of the tangential winds and asymmetric structures in typhoon inner core region using Himawari-8. Geophys. Res. Lett. 2020, 47, e2020GL087637. [Google Scholar] [CrossRef]
  40. Tsujino, S.; Horinouchi, T.; Tsukada, T.; Kuo, H.; Yamada, H.; Tsuboki, K. Inner-core wind field in a concentric eyewall replacement of Typhoon Trami (2018): A quantitative analysis based on the Himawari-8 satellite. J. Geophys. Res. Atmos. 2021, 126, e2020JD034434. [Google Scholar] [CrossRef]
  41. Han, Y.; Zou, X.; Weng, F. Cloud and precipitation features of Super Typhoon Neoguri revealed from dual oxygen absorption band sounding instruments on board FengYun-3C satellite. Geophys. Res. Lett. 2015, 42, 916–924. [Google Scholar] [CrossRef]
  42. Zhang, X.; Xu, D.; Liu, R.; Shen, F. Impacts of FY-4A AGRI radiance data assimilation on the forecast of the super typhoon “in-fa” (2021). Remote Sens. 2022, 14, 4718. [Google Scholar] [CrossRef]
  43. Shu, A.; Shen, F.; Jiang, L.; Zhang, T.; Xu, D. Assimilation of Clear-sky FY-4A AGRI radiances within the WRFDA system for the prediction of a landfalling Typhoon Hagupit (2020). Atmos. Res. 2023, 283, 106556. [Google Scholar] [CrossRef]
  44. Niu, Z.; Zou, X. Comparison Among All-Sky Simulations, FY-3E MWTS-3 and FY-4A AGRI Observations of the First Typhoon Malakas in 2022. Earth Space Sci. 2022, 9, e2022EA002498. [Google Scholar] [CrossRef]
  45. Xie, T.; Chen, J.; Yan, J. A New Objective Typhoon Location Algorithm Considering a Perturbation Factor Based on FY-4A Brightness Temperature Data. J. Atmos. Ocean. Technol. 2022, 39, 2023–2038. [Google Scholar] [CrossRef]
  46. Zhang, P.; Xu, Z.; Guan, M.; Xie, L.; Xian, D.; Liu, C. Progress of Fengyun Meteorological Satellites Since 2020. Chin. J. Space Sci. 2022, 42, 724–732. (In Chinese) [Google Scholar] [CrossRef]
  47. Wang, Y.; Sun, Y.; Chen, Y.; Wu, C.; Huang, C.; Li, C.; Tang, X. Non-linear correlations exist between solar-induced chlorophyll fluorescence and canopy photosynthesis in a subtropical evergreen forest in Southwest China. Ecol. Indic. 2023, 157, 111311. [Google Scholar] [CrossRef]
  48. Yang, W.; Chen, Y.; Bai, W.; Sun, X.; Zheng, H.; Qin, L. Evaluation of Temperature and Humidity Profiles Retrieved from Fengyun-4B and Implications for Typhoon Assimilation and Forecasting. Remote Sens. 2023, 15, 5339. [Google Scholar] [CrossRef]
  49. Wu, Z.; Zhang, Y.; Zhang, L.; Zheng, H. Interaction of cloud dynamics and microphysics during the rapid intensification of super-typhoon Nanmadol (2022) based on multi-satellite observations. Geophys. Res. Lett. 2023, 50, e2023GL104541. [Google Scholar] [CrossRef]
  50. Chan, P.; Choy, C.W.; Chiu, Y. Observational Study of Super Typhoon Saola in 2023 When It Was Close to Hong Kong. Preprints 2023, 09, 1688. [Google Scholar] [CrossRef]
  51. Chan, P.; He, Y.; Lui, Y. Super Typhoon Saola (2309) affecting Hong Kong in September 2023—Forecasting Aspect. Preprints 2023, 09, 1634. [Google Scholar] [CrossRef]
  52. Advanced Geostationary Radiation Imager. (n.d.). Available online: http://www.nsmc.org.cn/nsmc/en/instrument/AGRI.html (accessed on 22 December 2023).
  53. Li, B. FY-4B CLP Product Feature Card. 2023. Available online: https://img.nsmc.org.cn/PORTAL/NSMC/DATASERVICE/DataFormat/FY4B/Data/Format/FY-4B_AGRI_L2_CLP_4000M_V1.0.1.pdf (accessed on 7 February 2024).
  54. Li, B. FY-4B CLT Product Feature Card. 2023. Available online: https://img.nsmc.org.cn/PORTAL/NSMC/DATASERVICE/DataFormat/FY4B/Data/Format/FY-4B_AGRI_L2_CLT_4000M_V1.0.1.pdf (accessed on 7 February 2024).
Figure 1. The changes in (a) moving track (solid line) and intensity (dots; different colors represent different typhoon levels), (b) typhoon life stage (lines; different line styles and markers represent different periods), and maximum precipitation (blue bars) of Typhoon Saola (2023).
Atmosphere 15 00290 g001
Figure 2. The brightness temperature distribution of the observation time at 03:16:01 on 27 August 2023 at (a) Channel03, (b) Channel09, and (c) Channel13 of GPM-1CGMI. In the diagrams, the smallest hollow circles with solid black lines indicate the typhoon eye, the area between two hollow circles indicates the typhoon eye wall, and the two ellipses indicate the regions where spiral cloud bands are located.
Atmosphere 15 00290 g002
Figure 3. Precipitation estimation horizontal and vertical distribution diagrams of the products at the cross-section of the observation time at 03:16:01 on 27 August 2023 for (a,d) GPM-2Aka, (b,e) GPM-2Aku, and (c,f) GPM-2ADPR. In the horizontal diagrams (ac), the two ellipses marked separately by 1 and 2 indicate the two spiral cloud bands, and the solid white lines indicate the location of the cross-sections.
Atmosphere 15 00290 g003
Figure 4. The brightness temperature of the Himawari-9 satellite at Channel08 and Channel14 at (a1,b1) 06:00 on 30 August, (a2,b2) 06:00 on 31 August, and (a3,b3) 06:00 on 2 September, and the reflectivity at Channel03 at (c1) 06:00 on 30 August, (c2) 06:00 on 31 August, and (c3) 06:00 on 2 September. In the diagrams, the smallest hollow circles with solid black lines indicate the typhoon eye ((c1c3) have no typhoon eyes), the areas between two hollow circles indicate the typhoon eye wall, and the ellipses indicate the regions where deep convections developed outside the typhoon.
Atmosphere 15 00290 g004
Figure 5. The cloud phases at (a1) 20:00 on 25 August, (a2) 20:00 on 30 August, and (a3) 20:00 on 1 September, and the cloud types at (b1) 20:00 on 25 August, (b2) 20:00 on 30 August, and (b3) 20:00 on 1 September of the FY-4B satellite product. In the diagrams, the hollow circles with solid black lines indicate the typhoon’s main body, and the ellipses indicate the regions where the spiral cloud bands were located.
Atmosphere 15 00290 g005
Figure 6. The time trends of (a) cloud phases and (b) cloud types and central pressure (black solid line) in the whole lifespan of Typhoon Saola. Time series changes with an interval of three hours.
Atmosphere 15 00290 g006
Table 1. Spectral information of GPM-GMI channels.
No. ChannelCentral Frequency (GHz)Band Width
(MHz)
Spatial Resolution
(km × km)
01, 0210.6510032.1 × 19.4
03, 0418.720018.1 × 10.9
0523.840016.0 × 9.7
06, 0736.64100015.6 × 9.4
08, 098960007.2 × 4.4
10, 1116640006.3 × 4.1
12183.31 ± 320005.8 × 3.8
13183.31 ± 720005.8 × 3.8
Table 2. Spectral information of Himawari-9′s channels.
No. ChannelCentral Wavelength (μm)Spatial Resolution (km)
010.471.0
020.511.0
030.640.5
040.861.0
051.62.0
062.32.0
073.92.0
086.22.0
096.92.0
107.32.0
118.62.0
129.62.0
1310.42.0
1411.22.0
1512.32.0
1613.32.0
Disclaimer/Publisher’s Note: The statements, opinions and data contained in all publications are solely those of the individual author(s) and contributor(s) and not of MDPI and/or the editor(s). MDPI and/or the editor(s) disclaim responsibility for any injury to people or property resulting from any ideas, methods, instructions or products referred to in the content.

