Article

Spatiotemporal Variability Analysis of Glaciers in the Hindukush Region of Pakistan Using Remote Sensing Data

1
Department of Earth and Environmental Sciences, Bahria University Karachi Campus, Karachi 75260, Pakistan
2
Pakistan Space and Upper Atmosphere Research Commission (SUPARCO), Off University Road, P.O. Box 8402, Karachi 75270, Pakistan
*
Author to whom correspondence should be addressed.
Atmosphere 2024, 15(2), 193; https://doi.org/10.3390/atmos15020193
Submission received: 16 December 2023 / Revised: 19 January 2024 / Accepted: 30 January 2024 / Published: 1 February 2024
(This article belongs to the Section Atmospheric Techniques, Instruments, and Modeling)

Abstract

:
Headwater in the Indus River in Pakistan is largely dependent on the glaciers located in the northern part of the country, along with other sources such as direct precipitation. Glaciers are a major source of freshwater that provides agriculture and livelihood to millions of people. The hydro-climatic variations in the Gilgit watershed of the Upper Indus basin are poorly investigated scientifically due to high topographical differences, geography, remoteness of the region, and larger variations in climatic conditions. These glaciers are continuously changing due to melting as a consequence of global warming or accumulation due to snowfall/precipitation at higher altitude regions. The study is carried out using remote sensing data to quantify glacier changes in spatiotemporal variability in the past three decades. Five glaciers in the Gilgit region (near the junction of the Hindukush and Karakoram Mountains) with an area of more than 5 square kilometers were selected, namely Phakor, Karamber, East Gammu, Bhort, and Bad-e-Swat glaciers. These glaciers were monitored for changes in their sizes through a cloud-free continuous series of Landsat satellite imagery. The annual climatic trends were studied through spatially interpolated gridded climate data WοrldClim version-1 climate database for 1970–2000, utilized for assessment of meteorological condition by analyzing the variations of minimum and maximum temperature, solar radiation, and precipitation. The temporal variations in five glaciers in the Gilgit watershed are found to be minimal and, thus, are rather stable and show no sign of rapid melting or diminishing. The little variability of glaciers’ extent may be attributed to their geographic condition, altitude, topography, and orientation. The mapped glacier classes have been validated to check the accuracy assessment through an error matrix method. The kappa coefficient from the error matrix has been calculated as 84%, which shows a good agreement. The study makes a critical input towards understanding the dynamics of the glacier in the upper Indus catchment’s Gilgit watershed.

1. Introduction

Glaciers are considered to be one of the most sensitive and reliable indicators of climate change [1]. Although the glaciers are generally considered to be a continuous source of freshwater that contributes to the ecosystem balance, they can also cause hazards such as flash floods and landslides [2]. Glaciers are generally monitored for hydro-climatic variations, flood risk management, watershed management, and assessment of potential for hydropower generation. These can be better performed through morphometric studies of drainage networks [3]. However, it is difficult to analyze all drainage networks by ground-based observations or surveying because they are widely distributed over large areas with rugged terrains, especially rocky areas [4]. This constraint has been addressed by satellite remote sensing technologies with the use of radar/optical-based Digital Elevation Models (DEMs) datasets such as the Shuttle Radar Topography Mission (SRTM) and Advanced Space-based Thermal Topography Mission Global Digital Elevation Model (ASTER-GDEM) to be used for delineating drainage systems/watershed within basins and sub-basins
Pakistan primarily relies on its freshwater supply continually from the Hindu Kush-Karakorum-Himalayas (HKH) through the Indus River system, which flows north-south through the country [5,6]. Climate change is affecting the overall accumulation and melting of glaciers, which in turn impacts the ecosystem and the economy [7]. Zemp et al. [8] reported that the cumulative glacier ice has globally decreased. It is alarming that the HKH glaciers have retreated in the past few decades, as reported in recent scientific literature/studies [9], especially the central and eastern glaciers, which have significantly been reduced in mass [10]. Hence, this literature survey, together with the absence of glacial studies in the Gilgit watershed, provides a good motivation to study the dynamics of glaciers in this area of study.
There are many factors contributing to glacier mass gain/lοss apart from climate warming/increase in temperature; these are atmospheric circulation, clοud cover, rainfall/snowfall, atmospheric particulate quantities, geo-morphology/topography, and debris layer cοver; hence, there are differences in the rate of accumulation/ablation at different places leading to water shortage in South Asia [11,12,13]. Gilgit-Baltistan is geographically located in the northern part of Khyber Pakhtunkhwa (KP) province, south of Wakhan Corridor and southwest of China, and comprises an area of 72,971 square kilometers. With significant glοbal climatic variations in the last half-century [14], the temperature has increased from 0.32 to 0.34 °C per 10 years as compared with 0.10 °C per 10 years after 1939 [15]. In Gilgit, hydroclimatic differences in the Upper Indus Basin are not as technically tacit due to various circumstances like inaccessibility of the area, geography, and harsh climate. Delineation of watersheds at various scales requires strong watershed management skills. Geographical Information Technology (GIT) and satellite remote sensing (SRS) serve as viable techniques to study the watershed.
DEMs have already been used to examine the drainage system in the Gilgit basin region and for the identification of micro-watershed boundaries [16,17]. The pixels-based supervised and unsupervised classification methods can be used to delineate the glacier ice and ultimately quantify the glacier area in the region. This study is aimed at evaluating the seasonal variations of meteorological parameters in the Gilgit Region of Pakistan and temporal variations in the glacial area of Bhort, Bad-e-Swat, East Gammu, Karamber, and Phakor Glaciers during the preceding three decades through subpixel classification algorithm, indices based supervised classification and object-based algorithm using Landsat imageries (multispectral TM, ETM+, and OLI satellite images). The study will generally contribute to the existing knowledge of glacier behavior under climate stress and report the status of HKH glaciers over the extended period of three decades.

2. Study Area, Datasets and Methodology
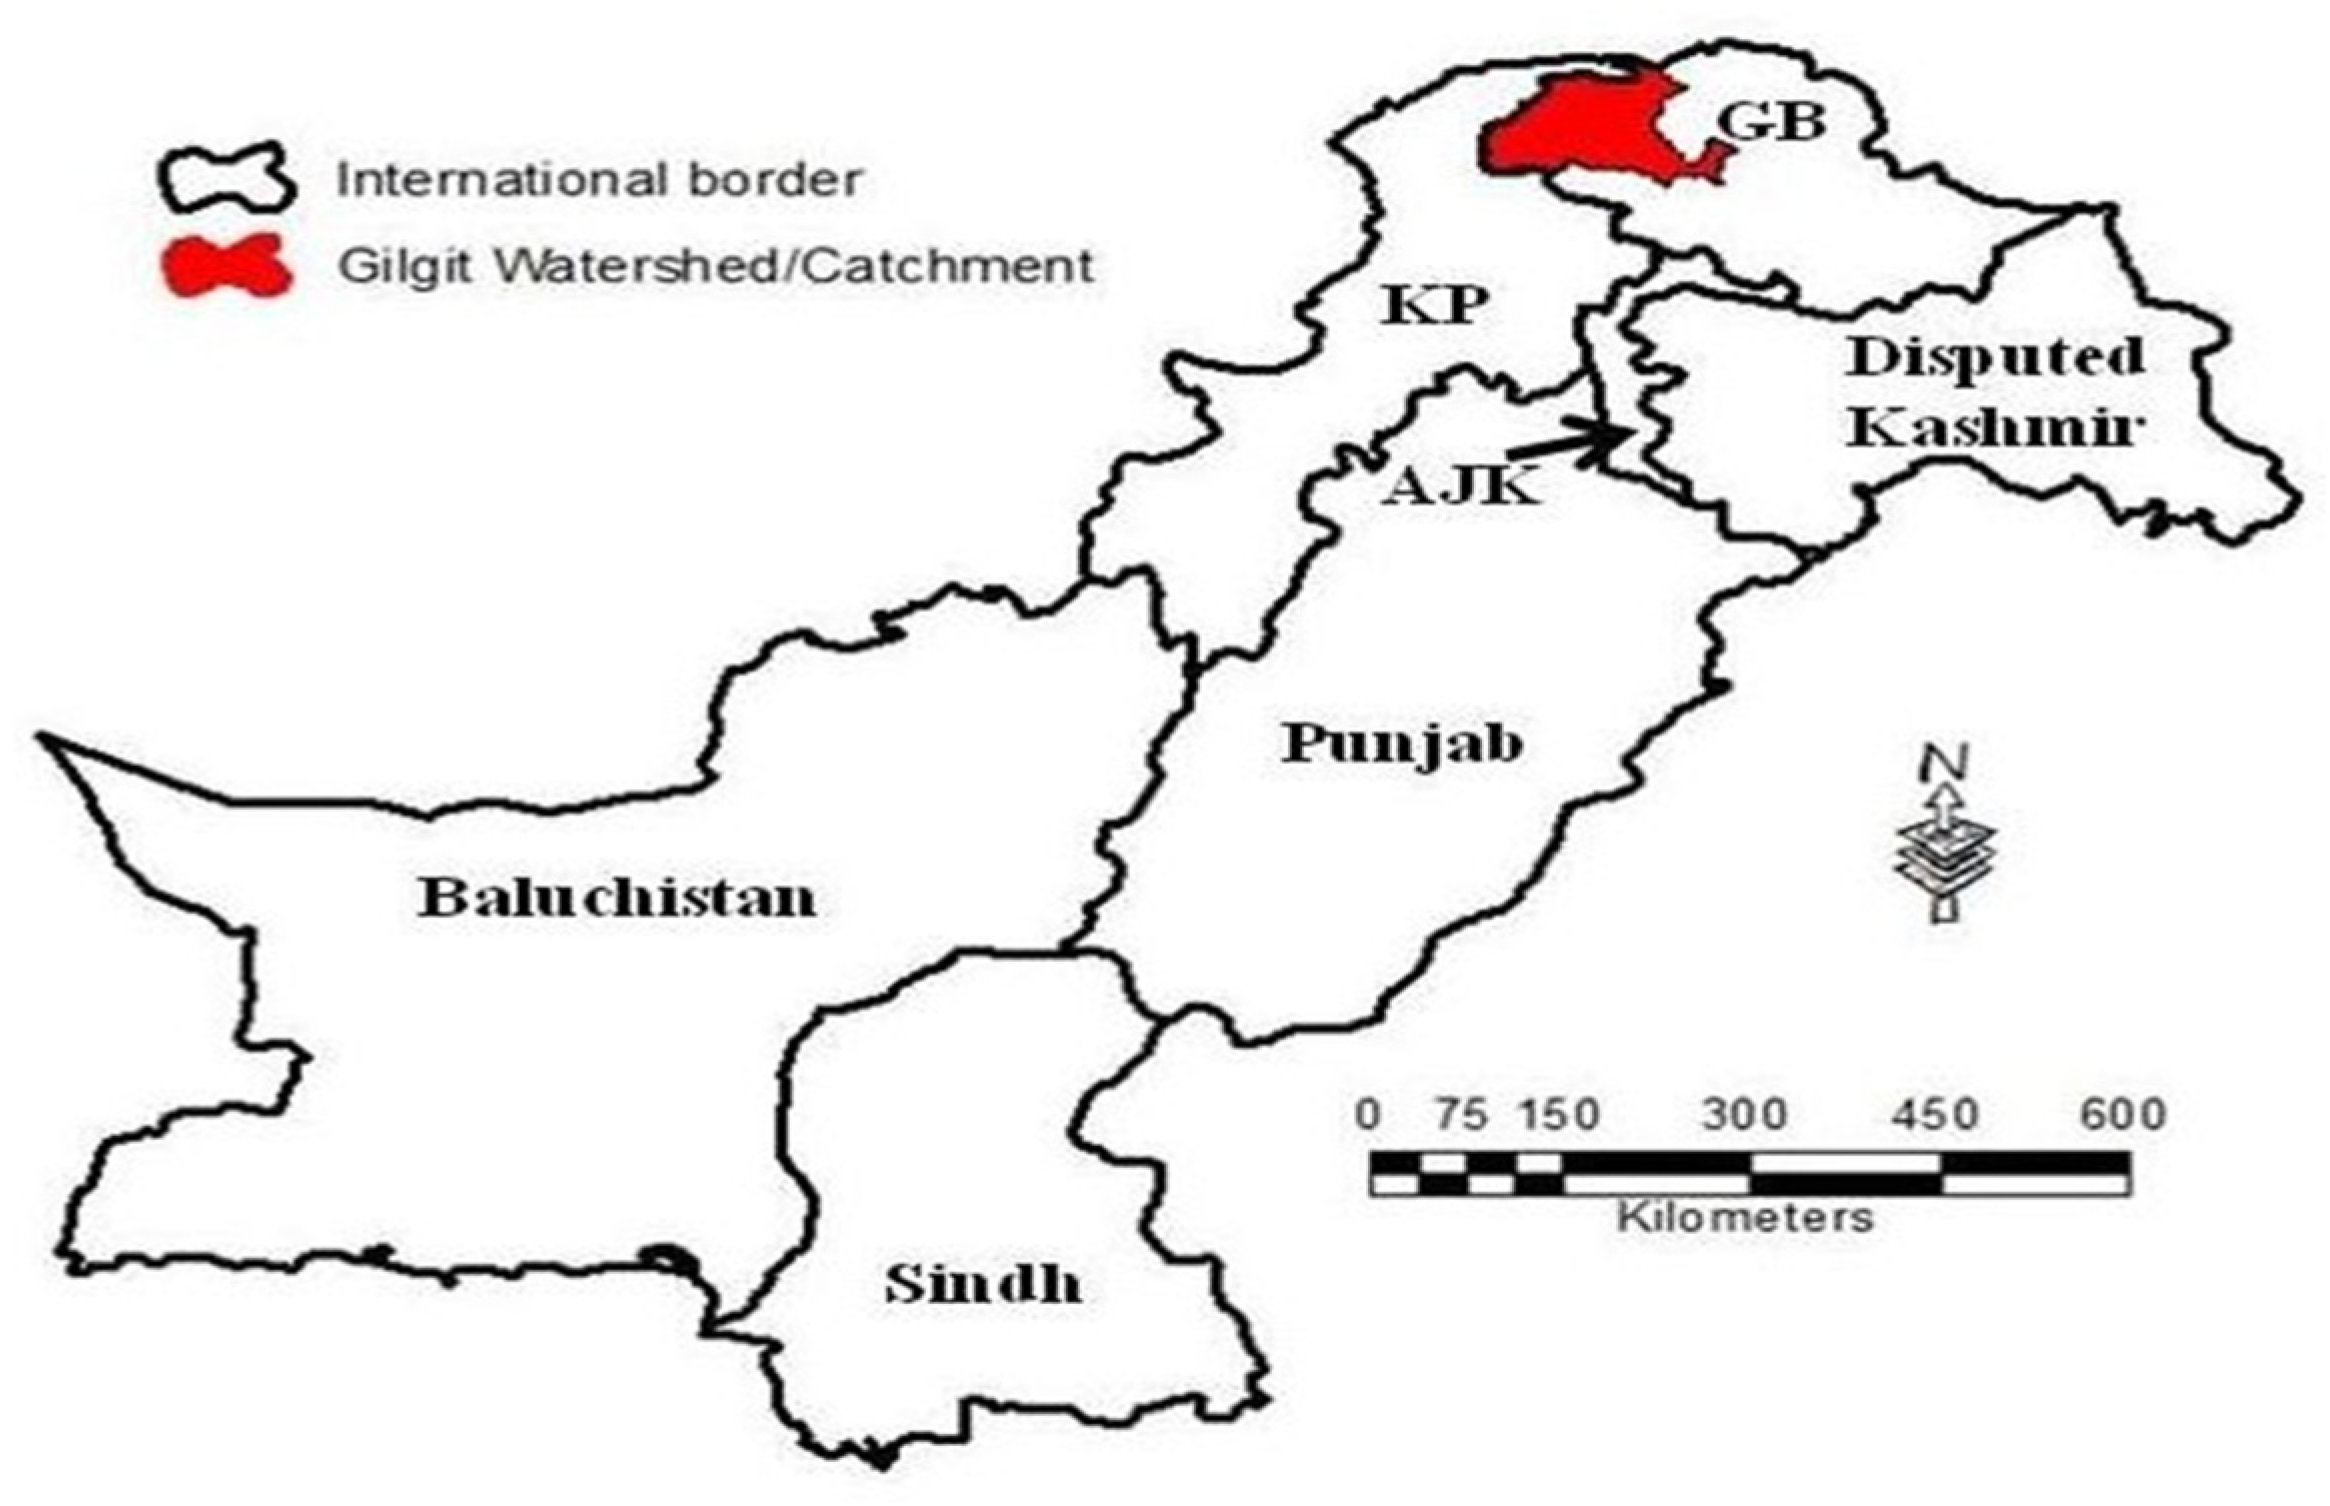
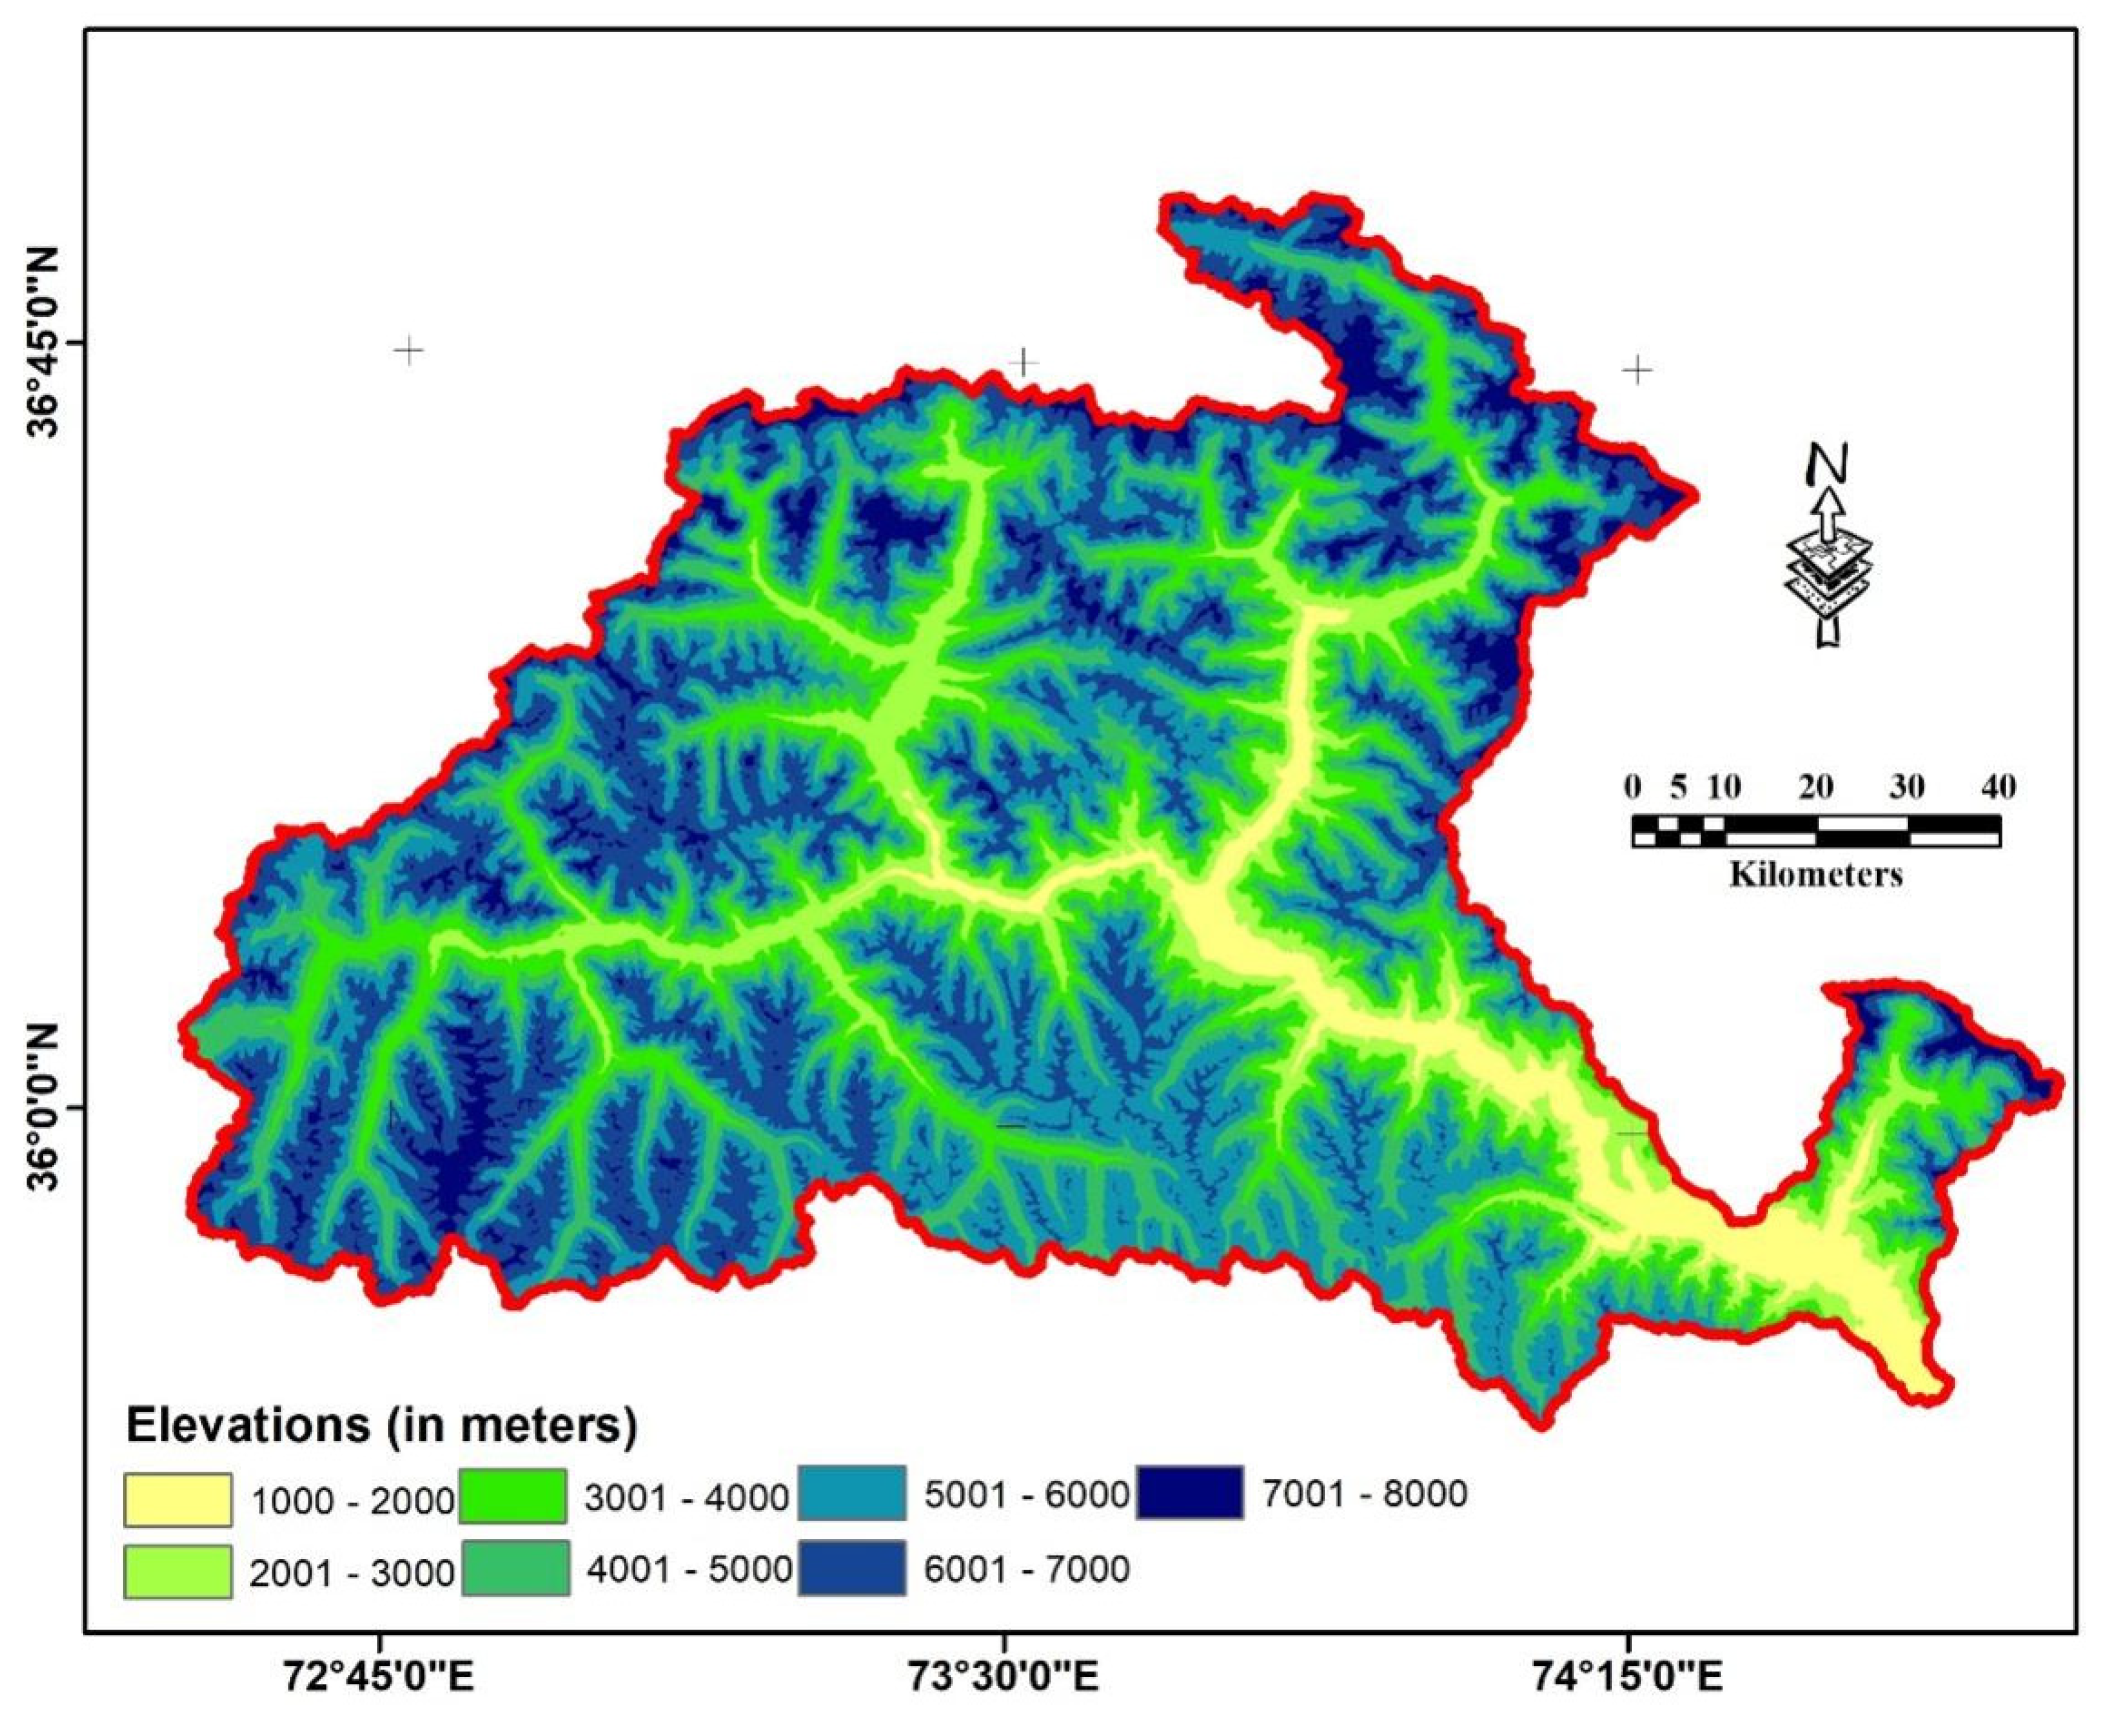
2.1. Study Area

Gilgit watershed is a significant source of freshwater in Pakistan’s northern area (Figure 1). The HKH region spans approximately 2000 square kilometers throughout Southeast Asia and borders Afghanistan, Bangladesh, Bhutan, China, India, and Nepal [18]. The watershed is located between 72°25′02″ E and 74°19′25″ E, and 35°46′05″ N and 36°51′16″ N. The geographical watershed region is 13,552 square kilometers, with elevations ranging from 1388 to 6722 m [17,19,20], and is drawn in Figure 2 using elevation data from SRTM at one arc-second resolution. Flash floods, supraglacial lakes, glacier lake outburst floods, and landslides are commonly reported in the region [21,22,23].

2.2. Methodologies

Delineation of watersheds from DEM involves a methodological framework. The methodological framework in a sequential manner includes (a). DEM processing for the whole Gilgit region, (b). extraction of DEM for the Gilgit study area, (c). filling voids/DEM gaps, (d). extraction of flow directions, (e). extraction of flow accumulations, (f). catchment grid delineation, (g). catchment polygon conversion, (h). neighboring catchment processing, and (i). computing watershed area. This is the methodological framework in a sequential order.
In late 2008, ASTER GDEM was released and claimed to be the best available elevation dataset for the scientific community, especially for climate applications. The satellite data used in this study for delineating watersheds in the Gilgit River basin includes SRTM DEM. The basin and watershed functions are used by DEM to evaluate the flow direction for the watershed delineated. The conventional approach usually comprises estimating aspect, slope, and shaded relief by using neighborhood tools in numerous raster process systems and points of inflection. However, aspect, slope, and inclination information are closely related to surface flow in the watersheds and limitations may occur while computing the flow directions in neighboring larger plain regions.
Glacier Change Analysis: Multispectral TM, ETM+, and OLI satellite images were used for the study. The summer ablation season runs from early June to the end of October (sometimes till mid-November), as the main source of winter snow is westerly disturbances. In order to exclude seasonal snow, imagery of dates concurring at/before the conclusion of the ablation phase has been carefully selected from the imagery catalog after careful visual interpretation, thus implying the glacier coverage area is not very large and all the snow patches have also been ablated. The data sets used for glacier change analysis are shown in Table 1.
We have performed multi-resolution segmentation on each multispectral image in accordance with the method of [24], which was further classified on the basis of shape and spectral pattern [25]. At first, the unsupervised classification techniques were applied, and the results obtained were not very accurate, with visible misclassifications of several glacier cover areas. The supervised classification improved the overall accuracy. The glacier mapping using the supervised classification techniques, thus, has been used to delineate the glacier area. To improve the segmentation accuracy, the spectral pattern was given a higher weighting (70%) than the related shape (30%). The extraction of clean ice glacier is made with priorities in this order (NDSINDVILWM → Slope → Elevation and Area), whereas the extraction of debris-covered part of the glacier is made with the priorities in this order (Slope → NDVILWMNDSI → Elevation and Area). The Normalized Difference Snow Index (NDSI) method was used to estimate the SCA using the Green and SWIR (short wave infrared) bands with the following computation for Landsat 8.
N D S I   =     B a n d   3   G r e e n B a n d   6   S W I R B a n d   3   G r e e n + B a n d   6   S W I R
In case of Landsat 5,7 the computation of NDSI is made with the following relation.
N D S I   =     B a n d   2   G r e e n B a n d   5   S W I R B a n d   2   G r e e n + B a n d   5   S W I R
The threshold for snow was obtained through a rigorous estimation, considering local factors such as altitude, climate, and vegetation. Its rationality and steadiness were assessed using ground truth data. In this study, we acknowledged a threshold for snow cover classification, which ranged from 0.3 to 0.4. The smoothing of the glacier boundaries was performed manually through on-screen digitization, and the splitting of each glacier was performed. Finally, the attributes were assigned to each boundary.
Study of climatological conditions: For numerous applications in remote sensing, records with a high (1 square kilometer) spatial resolution are preferred because they detect ecological deviations that are misplaced at lesser spatial resolutions, especially in hilly and further regions with strong climate inclines. Climate surfaces, or spatially interpolated gridded climate data, are utilized in a variety of applications, primarily in the agricultural, environmental, and biological disciplines. This study uses the climatological data provided by Hijmans et al. (2005) [26] named WοrldClim version 1 climate database for 1970–2000, for global land areas, comprising of continuing normal monthly temperature and rainfall [27], being used to study the variations of lowest and extreme temperature, solar energy and precipitation by means of preparation of sub-set from the original global grids.

2.3. Kappa Coefficient

The Kappa coefficient measures how well the categorization results compare to random values. It can have a range of values from 0 to 1. There is no agreement between the categorized image and the reference image if the Kappa Coefficient is 0. The categorized picture and the ground truth image are identical if the kappa coefficient is one. As a result, the larger the Kappa Coefficient, the better the categorization accuracy.
It is calculated from the following relationship.
K a p p a   C o e f f i c i e n t   =     O v e r a l l   A c c u r a c y R a n d o m   A c c u r a c y 1 R a n d o m   A c c u r a c y
Through this technique, accuracy was assessed using an error matrix approach and a stratified random sampling method to provide 250 ground truth reference data points. To match the corresponding category, these ground truth locations were overlain on the land use/land cover map. The generated error matrix and associated category membership resolute by ground truth, placed in the rows and classified cover type determined by this study methodology are placed in columns according to the methodology of Maitima et al. [28]. Correct values lie along the primary diagonal of the matrix when it is arranged in this manner [29]. Classified values are incorrectly placed in the off-diagonal sections of the matrix, making it obvious which class they belong to [30].

3. Results and Discussions

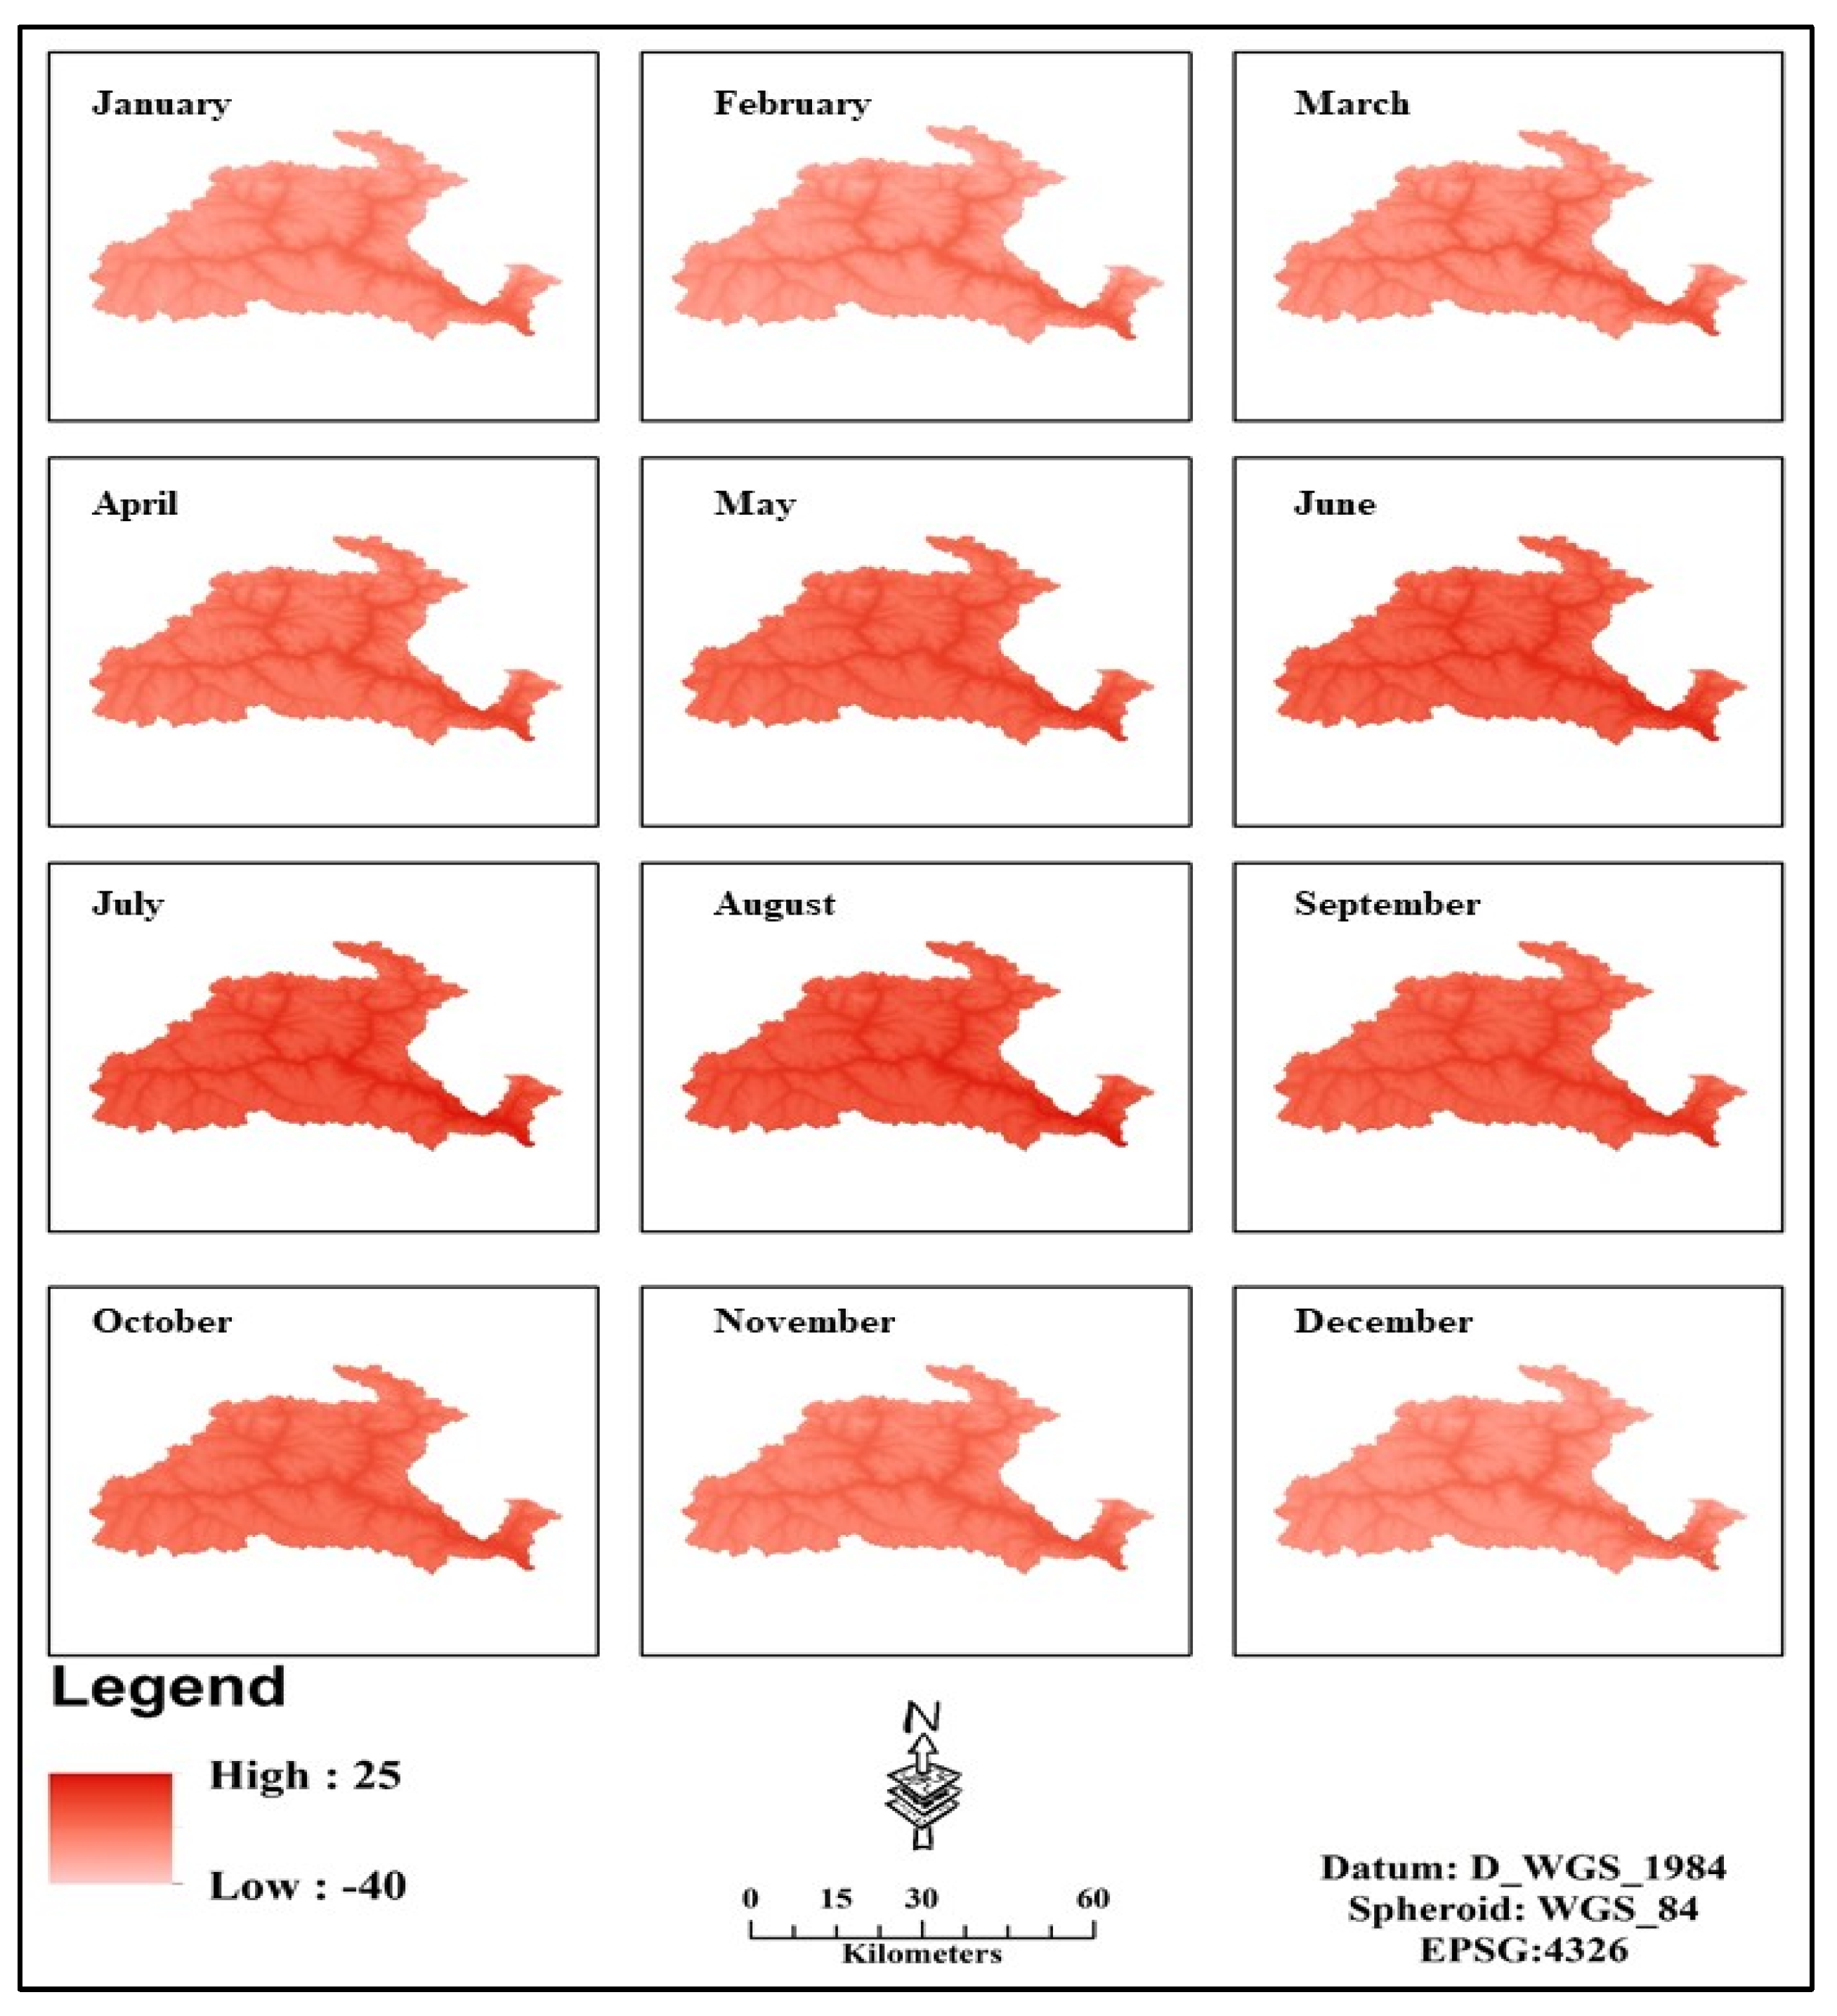
3.1. Temperature Profile of Gilgit Watershed

The global grids of monthly averaged 30-year data were obtained, and the study area subset was extracted to obtain the regional temperature values. The interpolated minimum surface temperature processed from the point data from local stations portrays a high value of −0.2 °C and a low value of −35.1 °C for January. The low-temperature values are mainly observed at higher altitudes on the northern side and high temperatures on the lower altitudes on the southeast of the Gilgit watershed, respectively. The scale range is 60 km, as shown in Figure 3. Moreover, January, the severe winter month, has a more projecting Tmin (low) compared to Tmax (high). January is the frosty winter coldest month in Gilgit. February, the winter month, has a more projecting Tmin (low) than Tmax (high). The average high temperature in Gilgit rises slightly from a chilly January to a cool February, the last month of the winter. March is a pleasant month in Gilgit, with temperatures ranging from −13.3 to 6.8 °C on the mean. The mean high temperature in Gilgit climbs in March.
In Gilgit, April is a warm spring month, with average valley temperatures ranging from −7 to −10 °C. The average high temperature rises in April. May, the penultimate month of spring, is another hot month, with an average valley temperature of 8 °C. The average high temperature rises slightly from a moderately hot April to a warm May. June, the first month of summer, is a hot month in Gilgit. July is the hottest month of the year. September is the first month of autumn and is still a hot month. October, like September, is a slightly warmer fall month. November is the last month of the fall and is another weatherly relaxed and cooler month. December is a winter month, with the average minimum temperature fluctuating at −16 °C. Figure 3 shows the spatial distribution of monthly averaged minimum temperature on a monthly basis for thirty years.

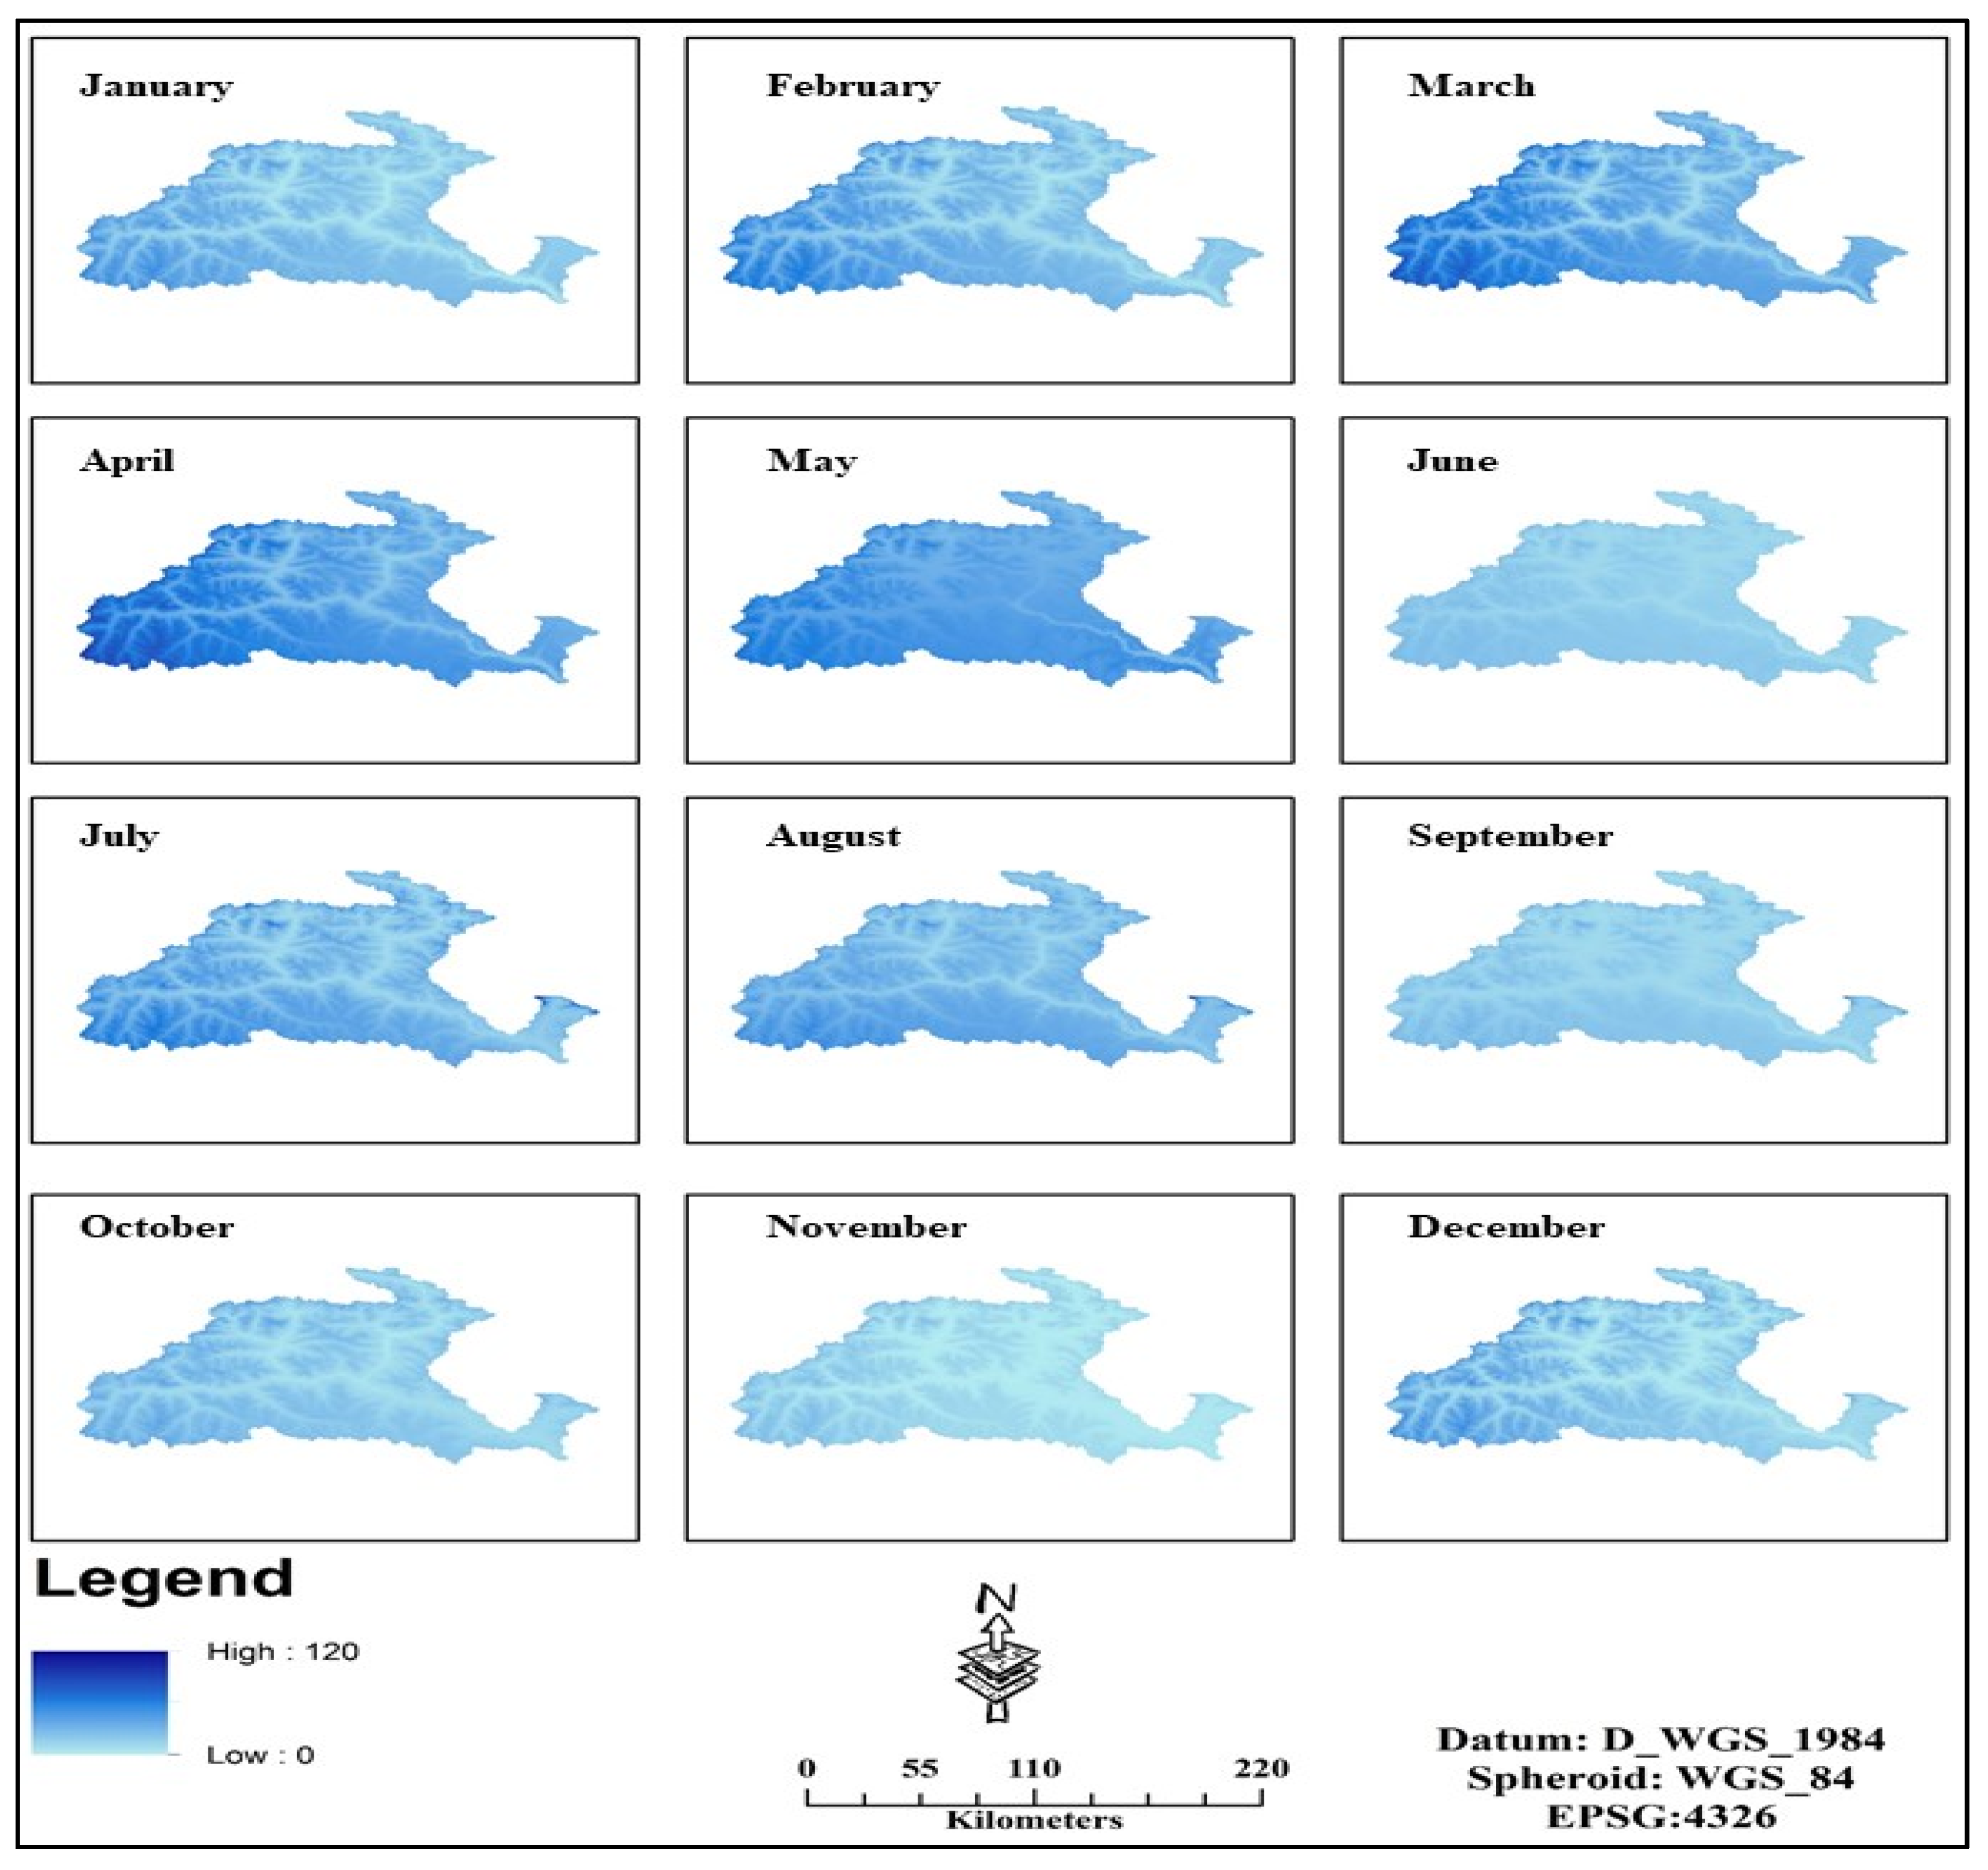
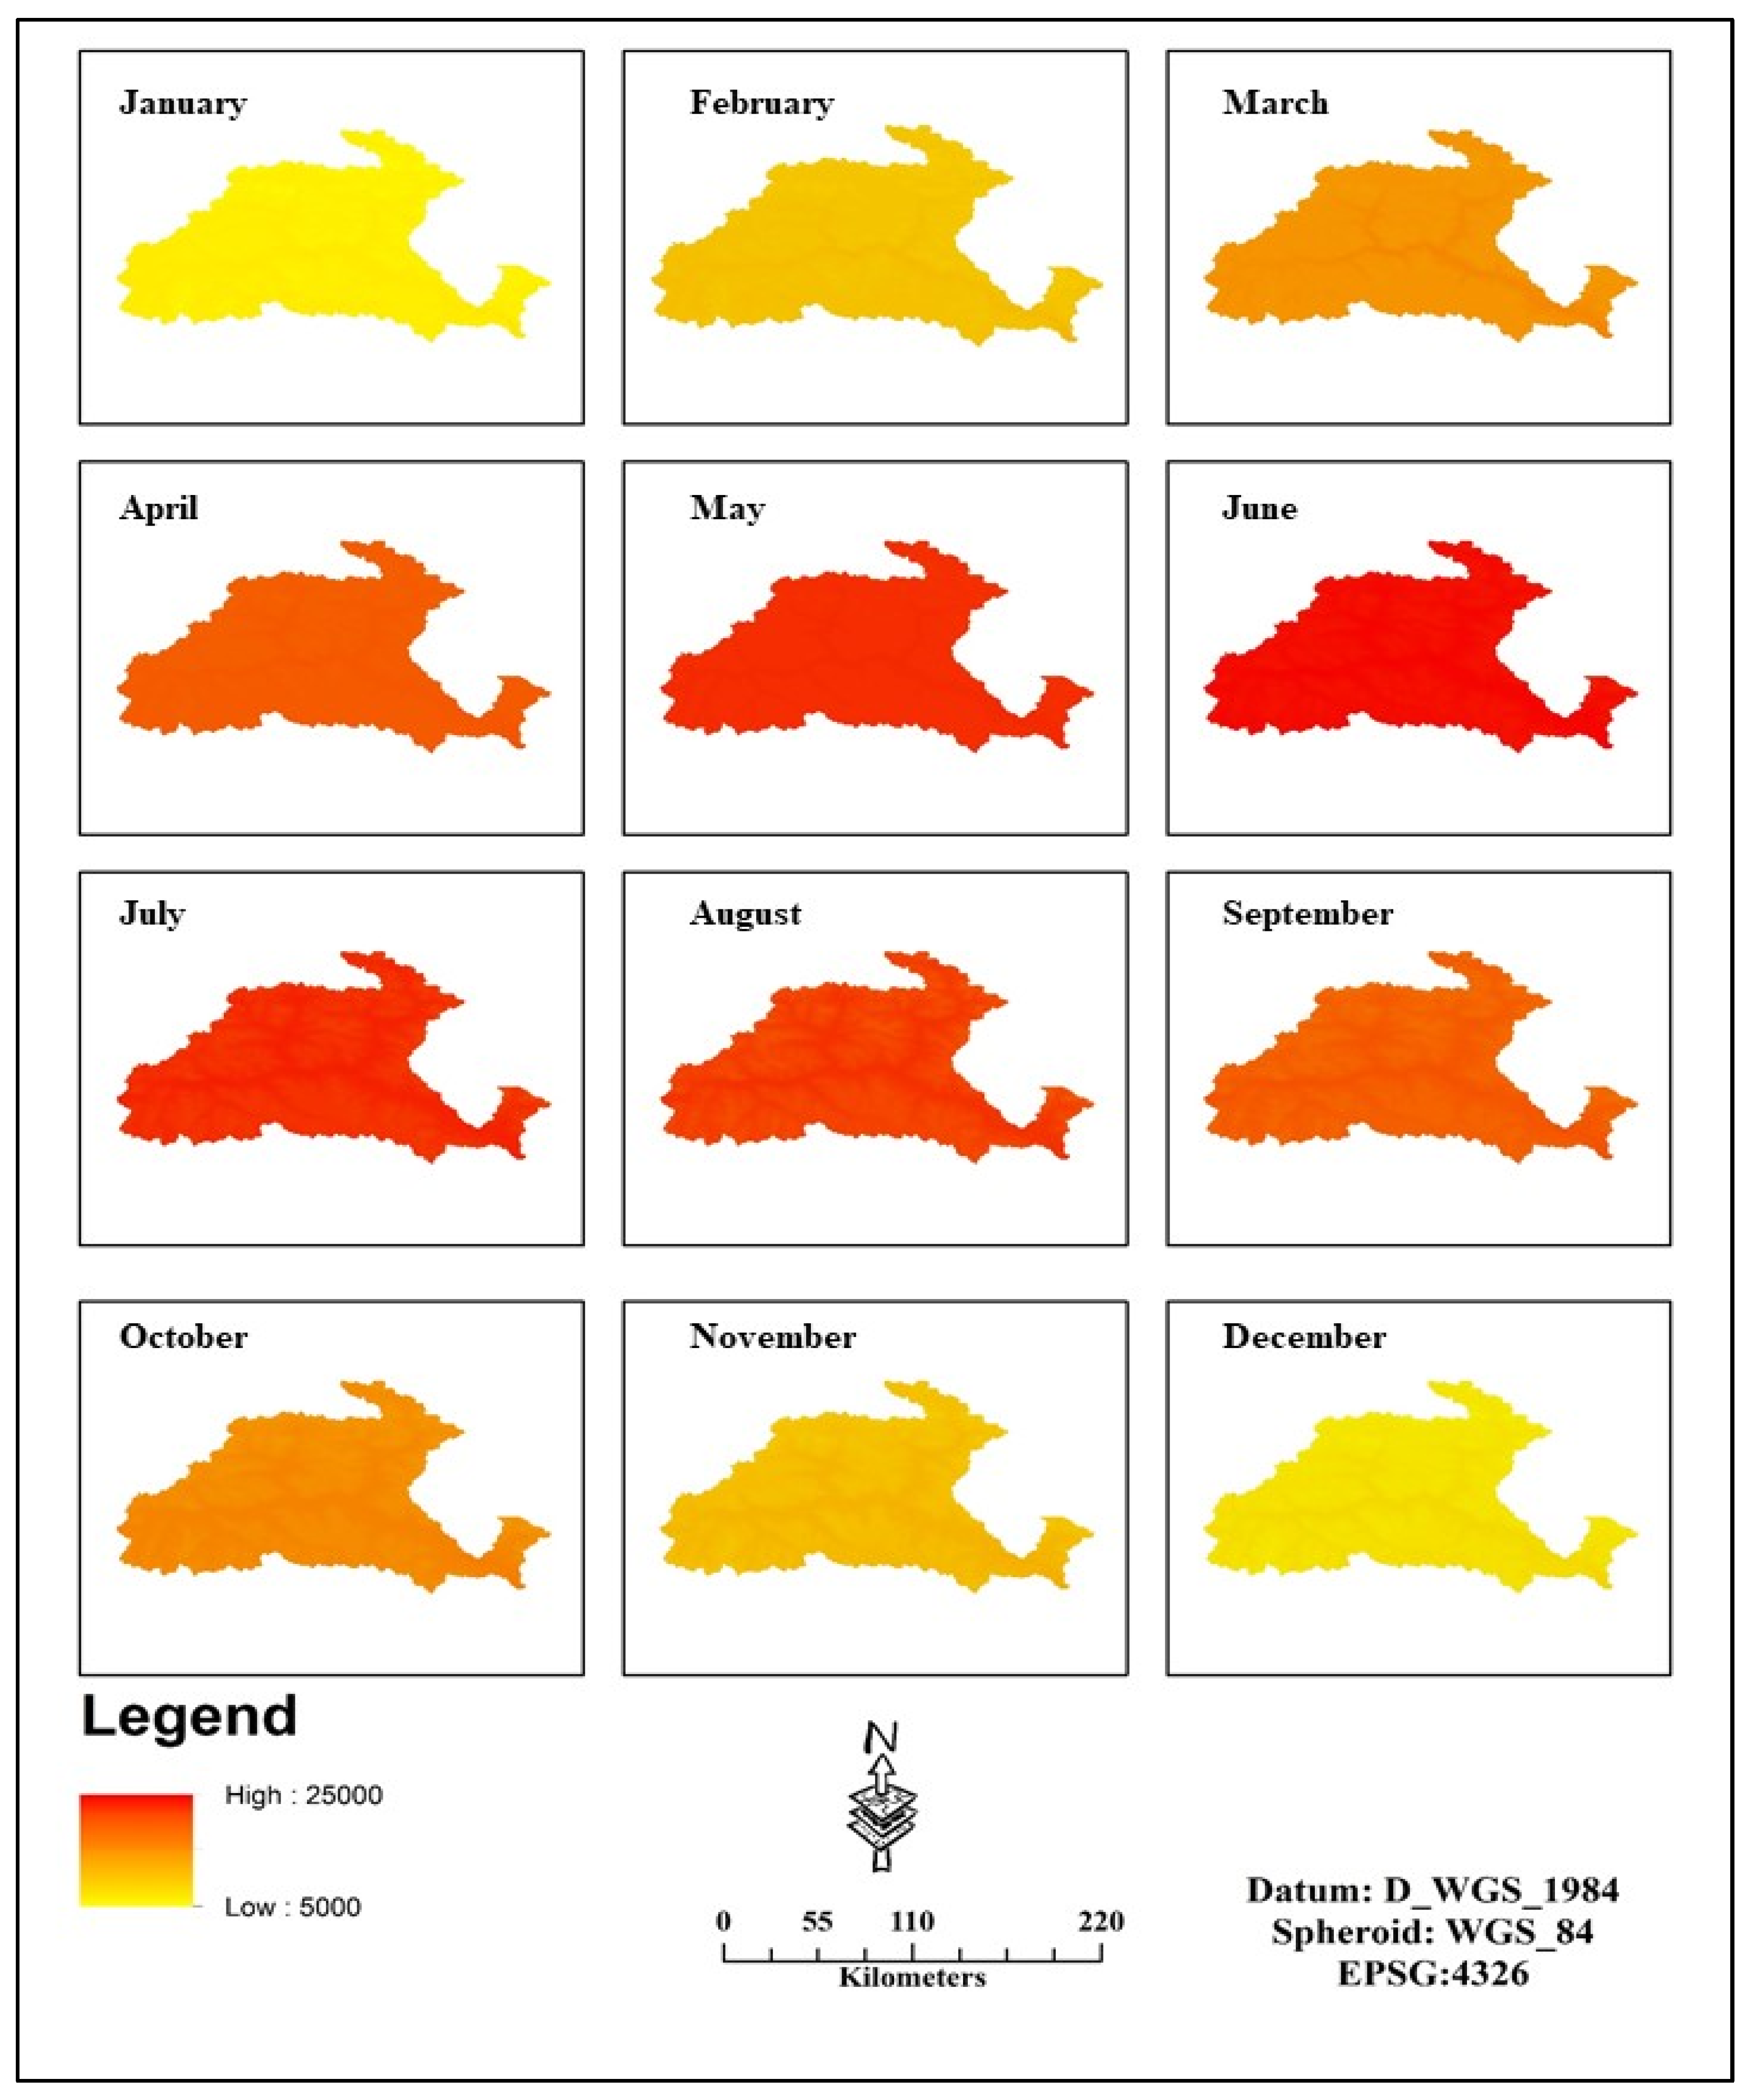
3.2. Solar Radiation Intensity in the Gilgit Watershed

Radiation from the sun is the principal wellspring of energy for the Earth’s temperature framework. Changes in the Earth’s circle around the sun cause contrasts in the cyclical circulation and measure of sunlight-based radiation arriving at the Earth. Chronicles of past environments show that there is a connection between these multiplicities and long-haul environment changes. Interglacial conditions start with expanding mid-scope summer insolation and end as mid-scope summer insolation diminishes. Normal sunlight in March in Gilgit is 12 h. The month with the longest days is June (normal sunlight: 14.6 h). The month with the briefest days is December (Average light: 9.8 h). Normal daylight in March is 6 h, while the month with the most daylight is June (Average daylight: 10 h). As shown in Figure 4, the months with the least daylight are January, February, and December, when the typical daylight is 5 h. The introduced sun-powered radiation information handled from the point information from neighborhood stations, month to month, arrived at the midpoint of 30 years, depicts a high worth of 7545 kJ m−2 day−1 and a low worth of 5641 kJ m−2 day−1 across watershed for the long stretch of January. The low upsides of sun-powered radiation at the higher heights on the Northern side might be related to the huge measure of overcast cover frequently present at high mountains. Ordinarily, under clear sky conditions, the sun-oriented radiation increments with height. This is known as the height impact. The angle values are ~8% per 1000 m of height. The spatial distribution of monthly averaged solar radiation is shown in Figure 4.

3.3. Precipitatiοn in the Gilgit Watershed

There are four rainy seasons in the study area, viz., wintertime, pre-monsoon, monsoon (rainy and cloud burst season), and post-monsoon precipitation. The town of Gupis is known to have the lowest rainfall in the GB region. Javed et al. (2020) [31] analyzed the 90-year ground-based point measurements from meteorological observatories operated by the Pak Meteorological Department. However, the study lacks the interpolated analysis at the spatial extent. It is shown that Gupis station gets approx. 13 rainy days in the whole year, excluding the solid precipitation in the form of snow at higher elevations.
The data of observation/measurement of precipitation contain many inaccuracies owing to its spatial and temporal pattern in quantity and intensity. The monthly interpolated precipitation data processed from the point data from local stations averaged over 30 years shows values mapped in Figure 5.

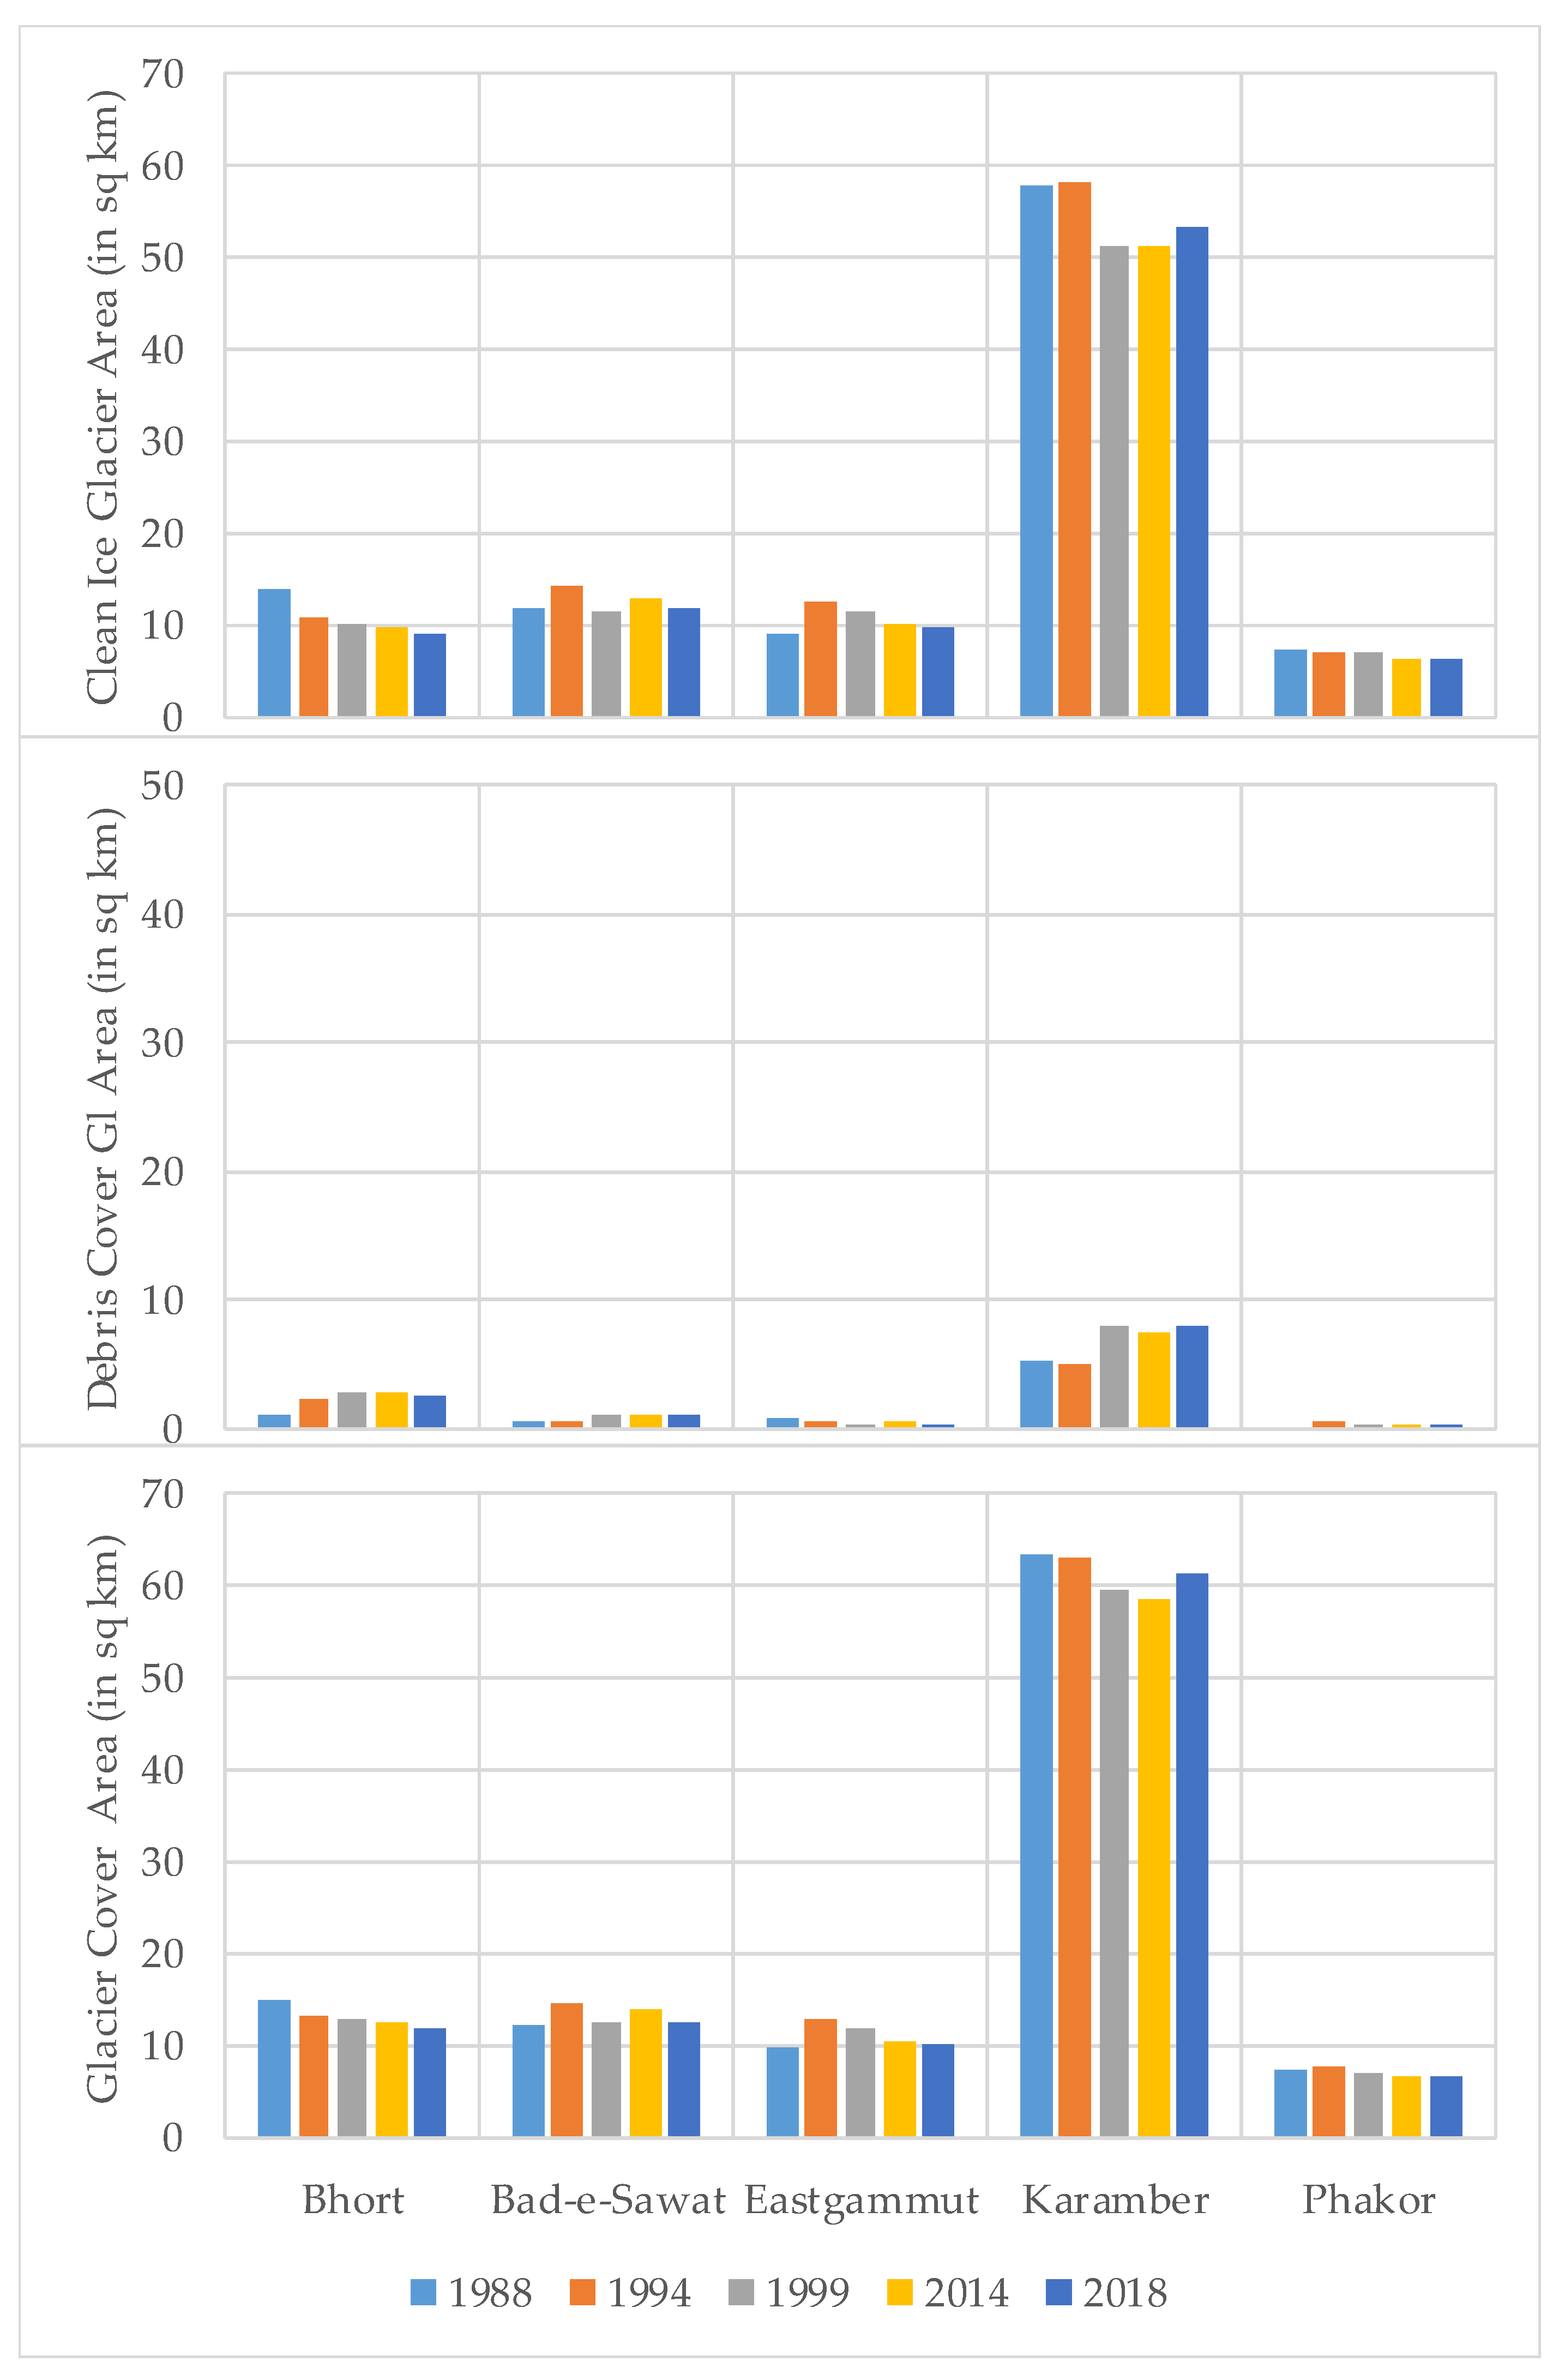
3.4. Glacier Change Analysis

Glacier mapping using object-based classification techniques has been used to delineate the glacier area. It was observed from the overall results that glaciers are mostly rather stable, specifically in the Gilgit watershed. The little variability of glaciers is due to their geographic condition, altitude, topography, οrientatiοn, and climate conditions. In direction to evaluate the correctness of the glacier mapping, the accuracy assessment was carried out using the error matrix approach with a calculated kappa coefficient value of 84.14%. The summary of the change detection for the five glaciers of the Gilgit watershed is explained in the coming paragraphs.

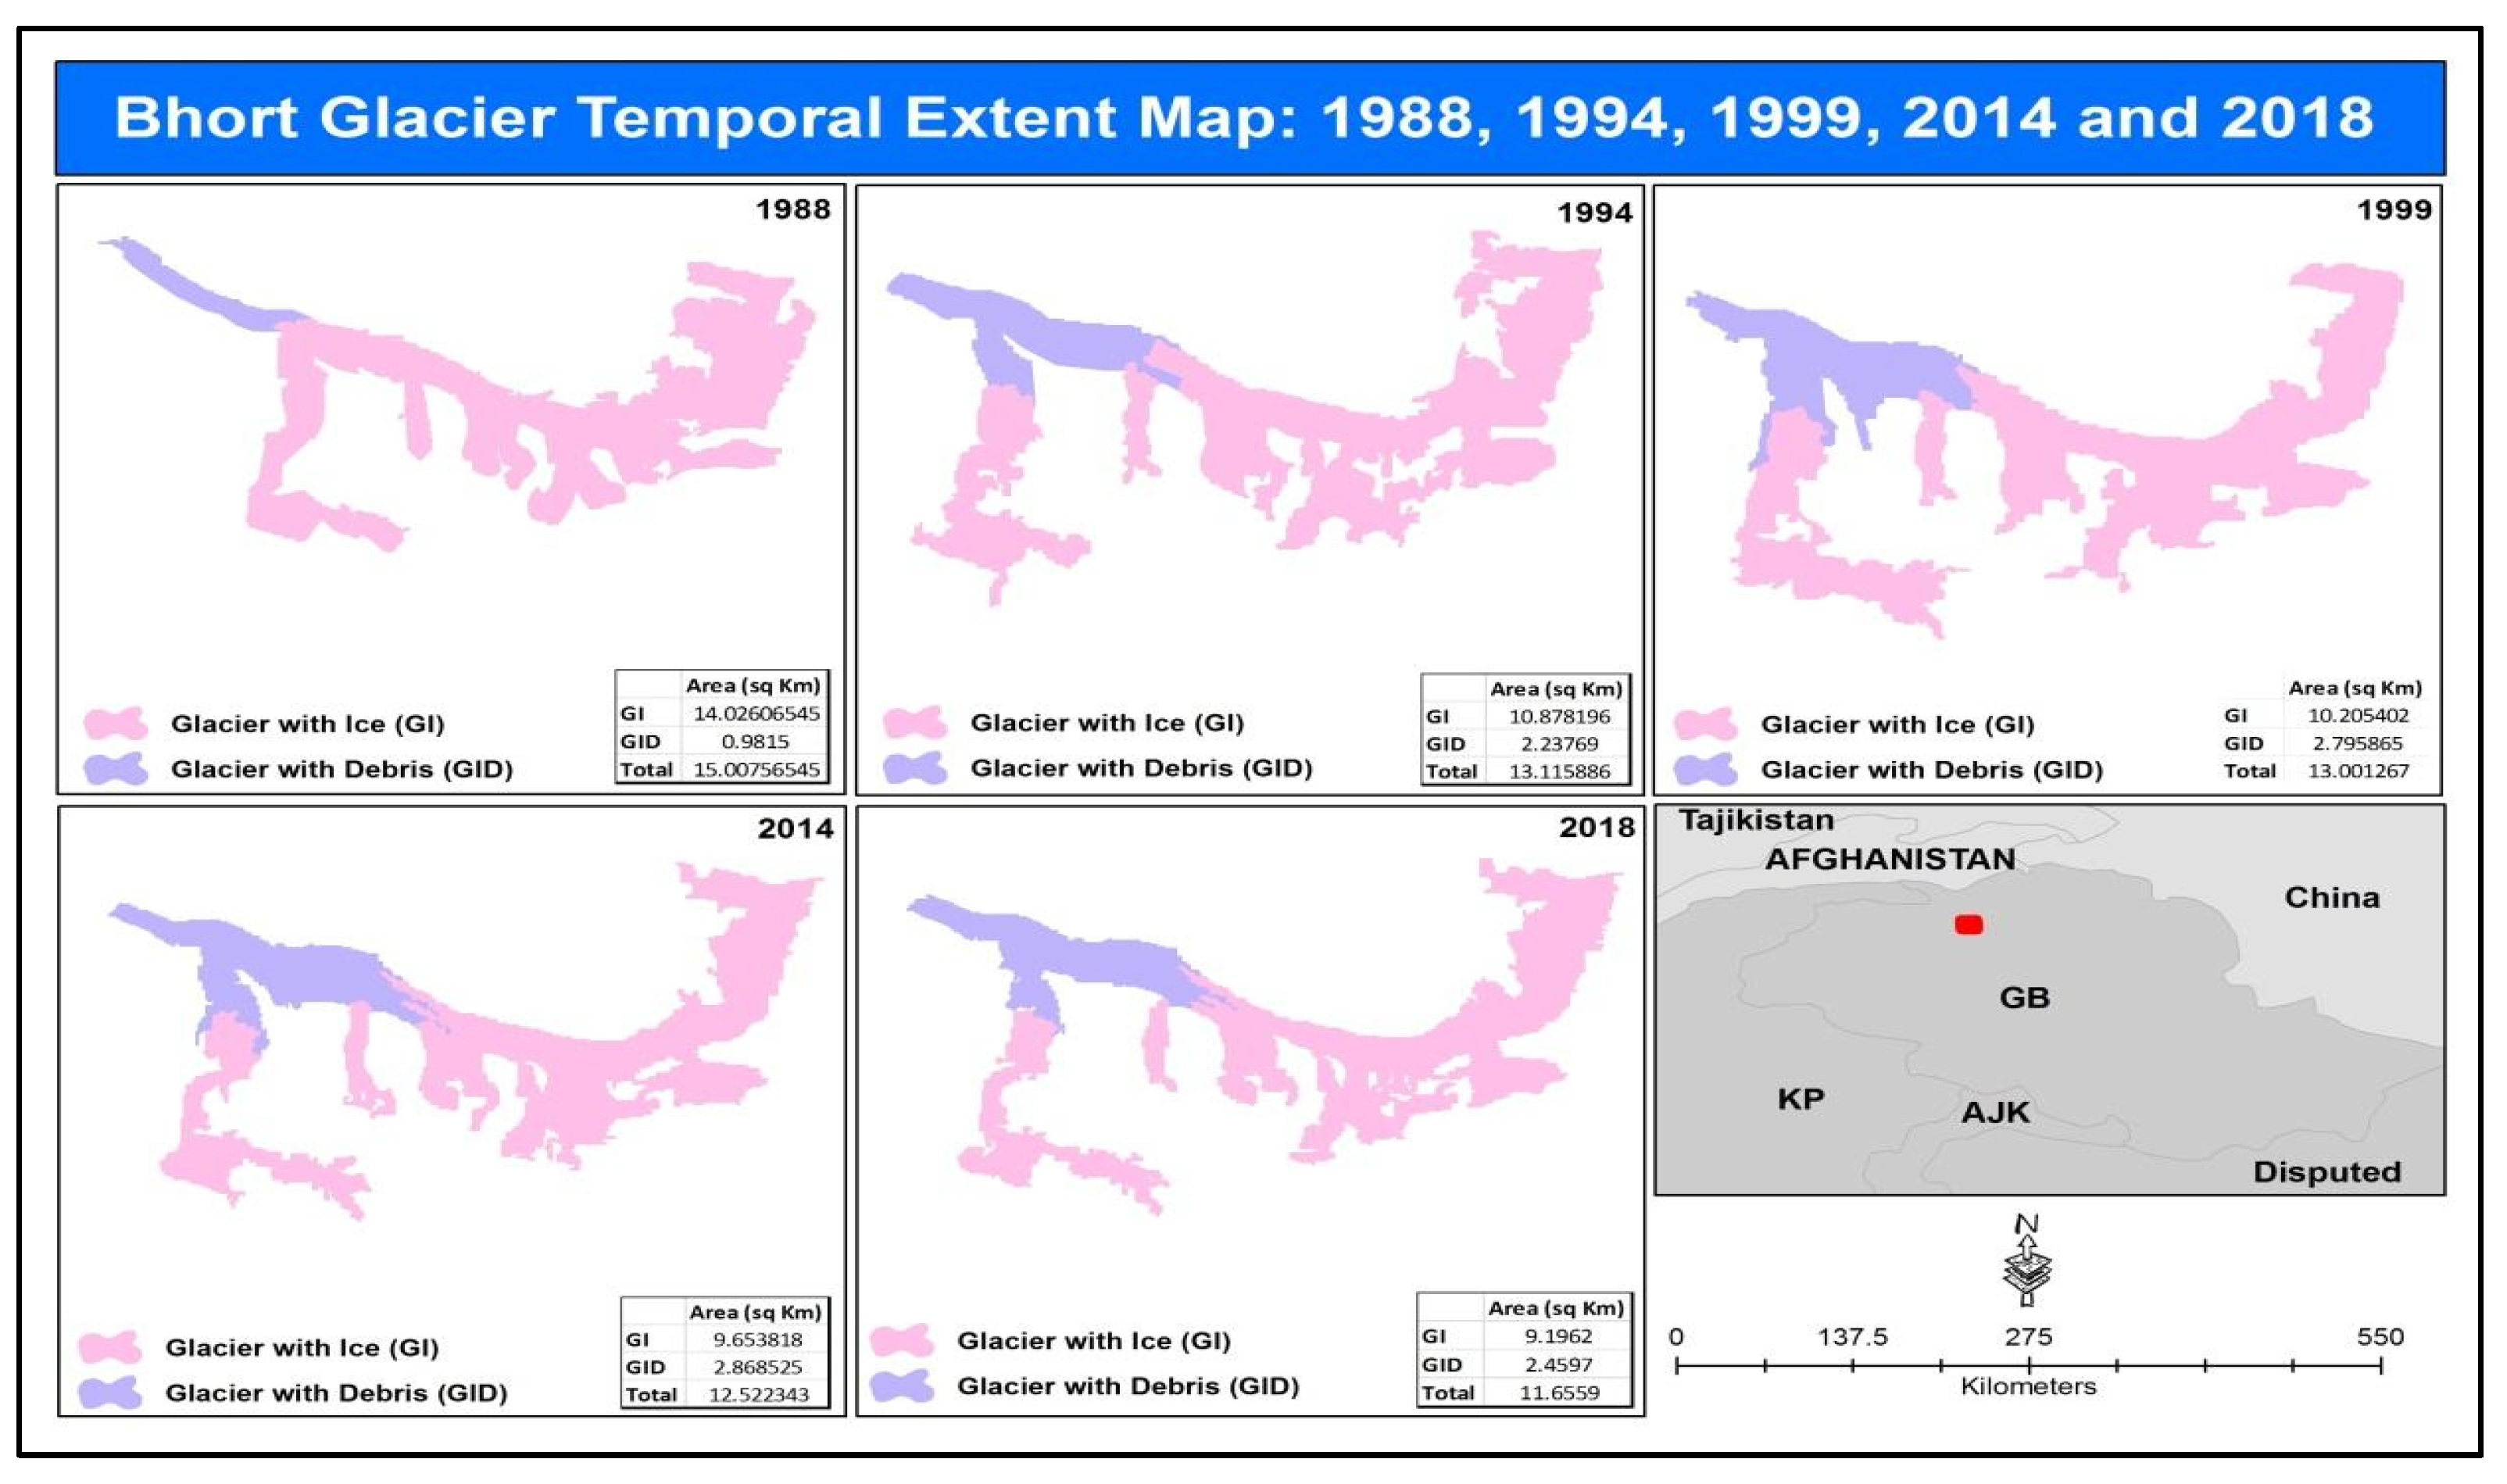
3.4.1. Bhort Glacier Change Analysis

The extent cοοrdinates of the Bhort glacier are from 74°04′40″ E to 74°11′10″ E and from 36°31′12″ N to 36°34′04″ N. The elevation of the glacier goes up to 5784 m and has a max slope of 57%. It was observed that the ice-covered areas have reduced from 14.02 square kilometers in 1988 to 9.91 square kilometers in 2018. However, the debris-covered area increased from 0.98 square kilometers in 1988 to 2.45 square kilometers in 2018. The overall glacier changes are 15.00, 13.11, 13.00, 12.52, and 11.65 square kilometers for 1988, 1994, 1999, 2014, and 2018, respectively (Figure 6). The results revealed that the overall ice-covered area from 1988 to 2018 has reduced by 4.11 square kilometers. However, the overall debris-covered area from 1988 to 2018 has increased by 1.47 square kilometers.

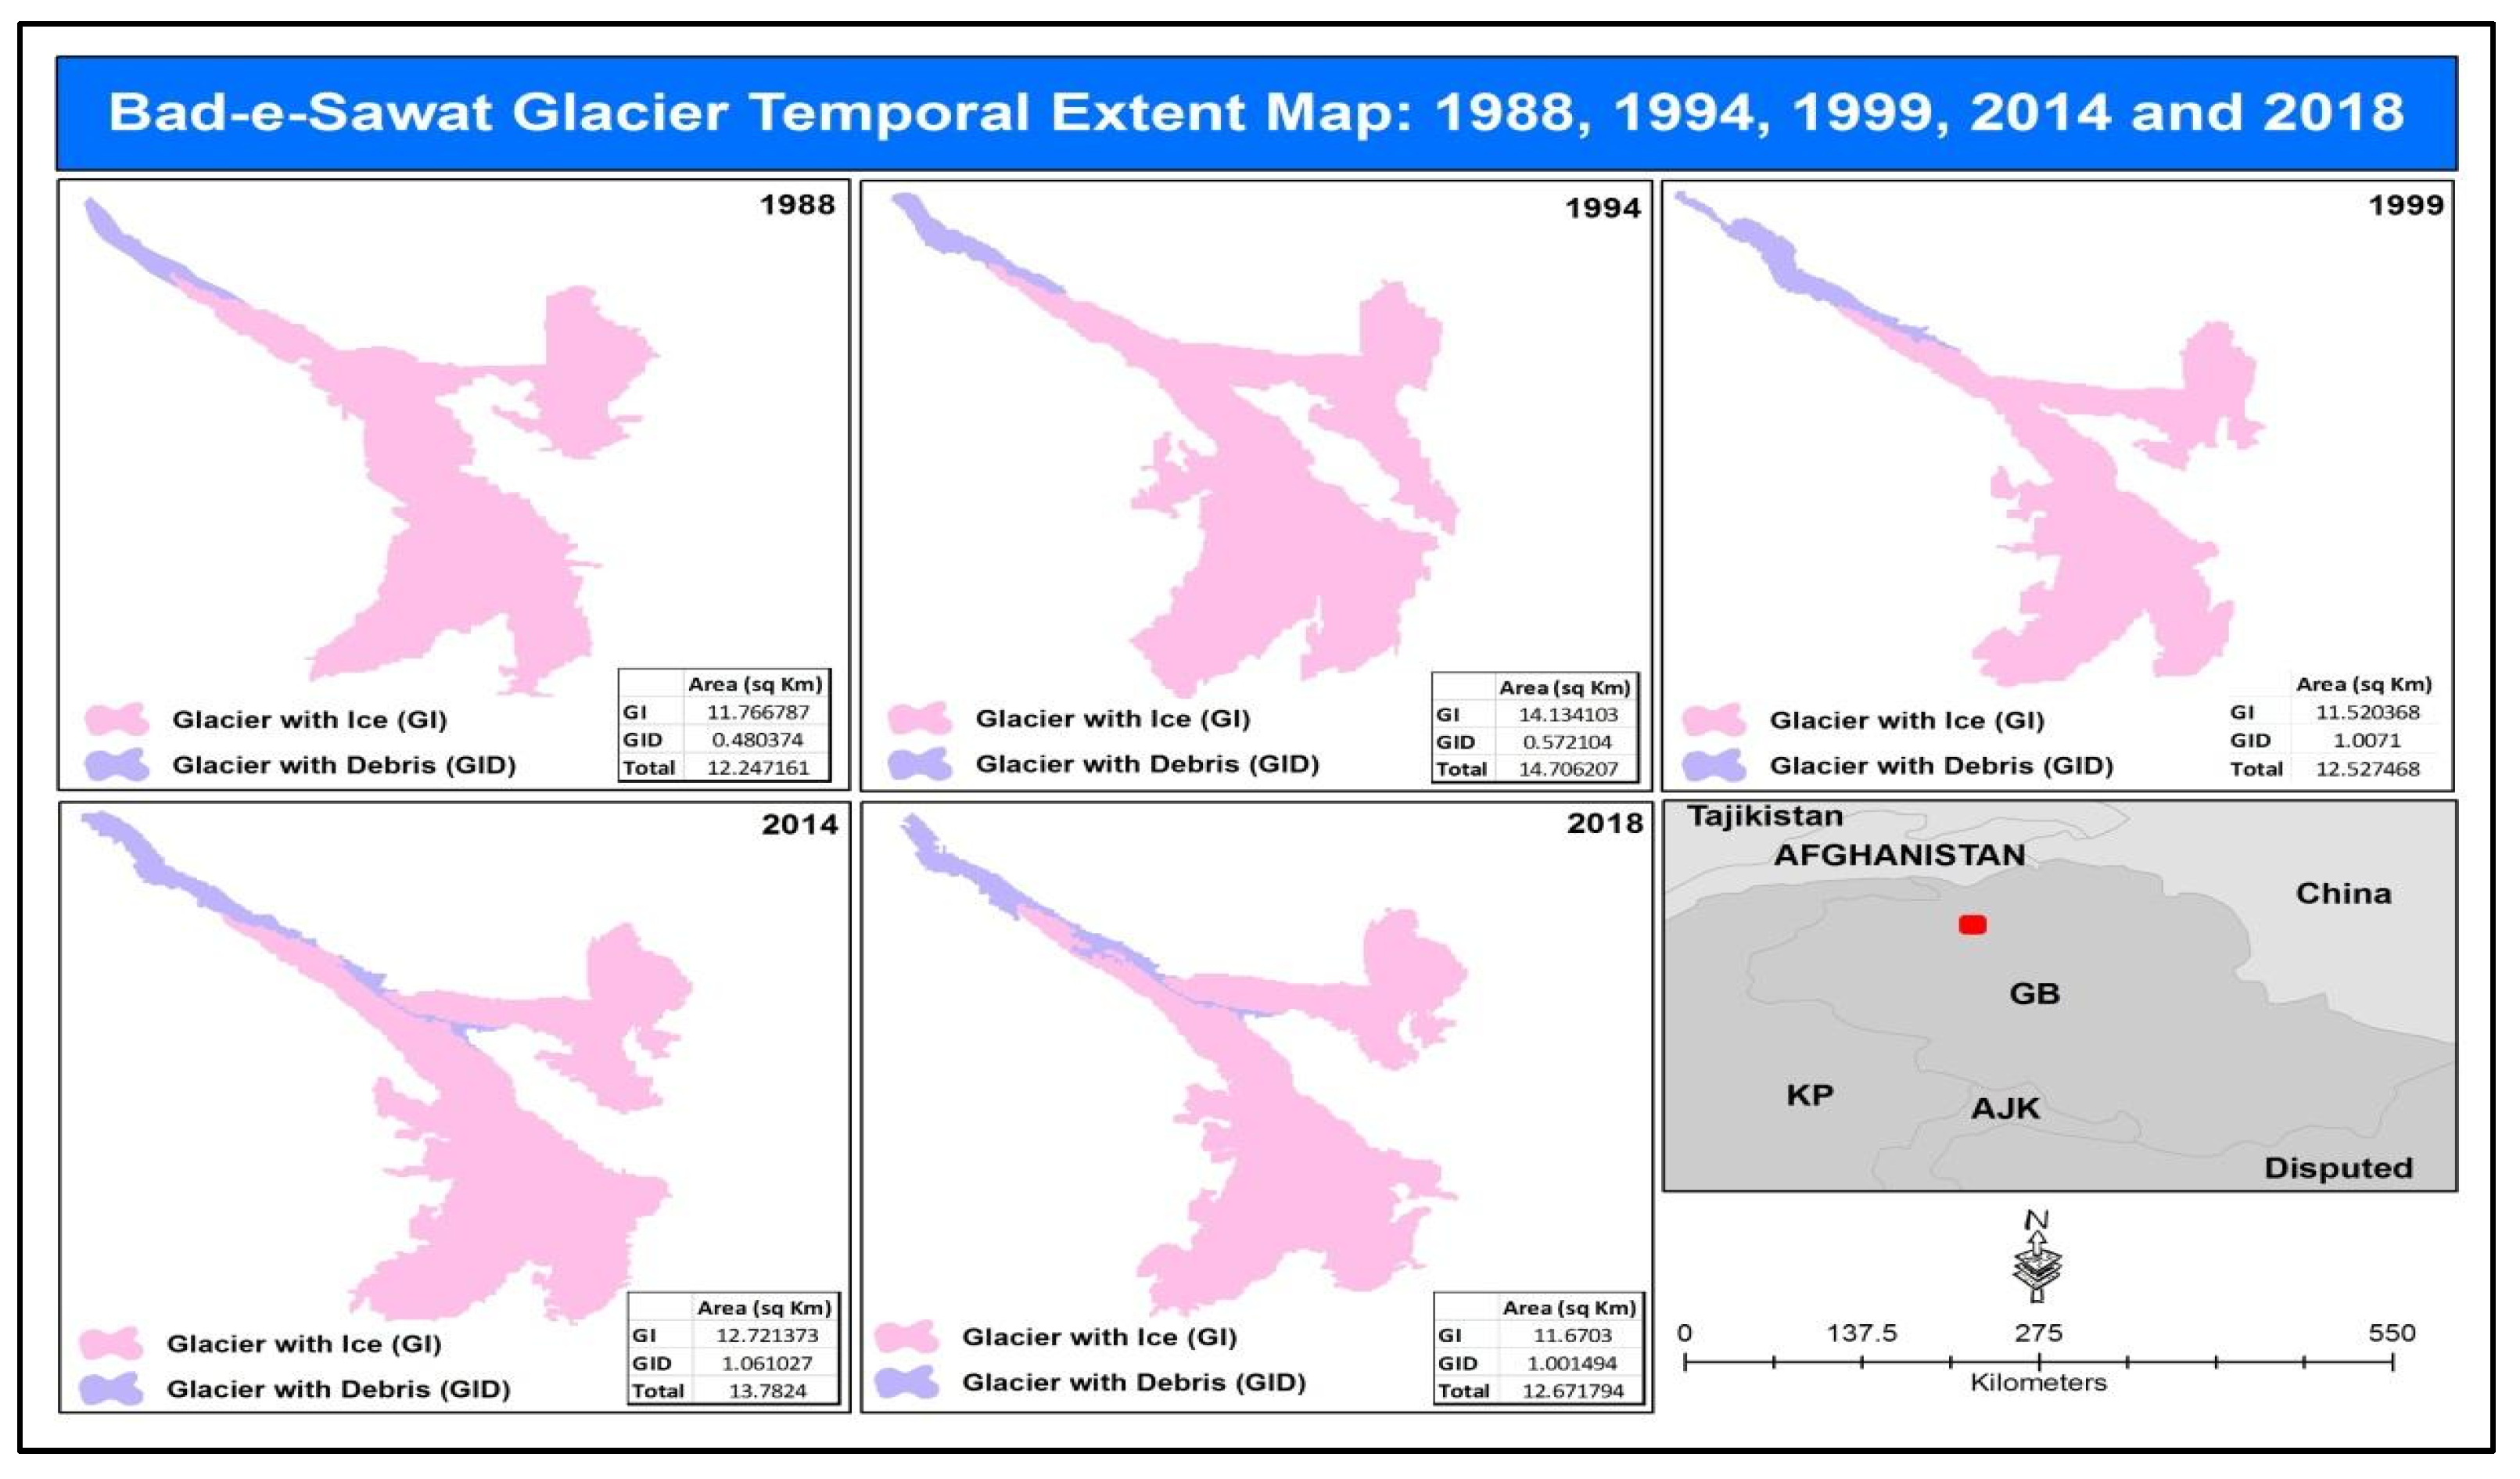
3.4.2. Bad-e-Swat Glacier Change Analysis

The extent cοοrdinates of the Bad-e-Swat glacier are from 74°02′15″ E to 74°06′35″ E and from 36°28′15″ N to 36°32′20″ N. The elevation of the glacier goes up to 5835 m with a max slope of 51%. Figure 7 shows that the overall glacier changes remained at 12.24, 14.70, 12.52, 13.78, and 12.67 square kilometers for 1988, 1994, 1999, 2014, and 2018 respectively. The results revealed that the overall ice-covered area for 30 years has been reduced in all years except 1988, possibly due to climatic changes. However, the debris-covered area from 1988 to 2018 has increased by 0.52 square kilometers.

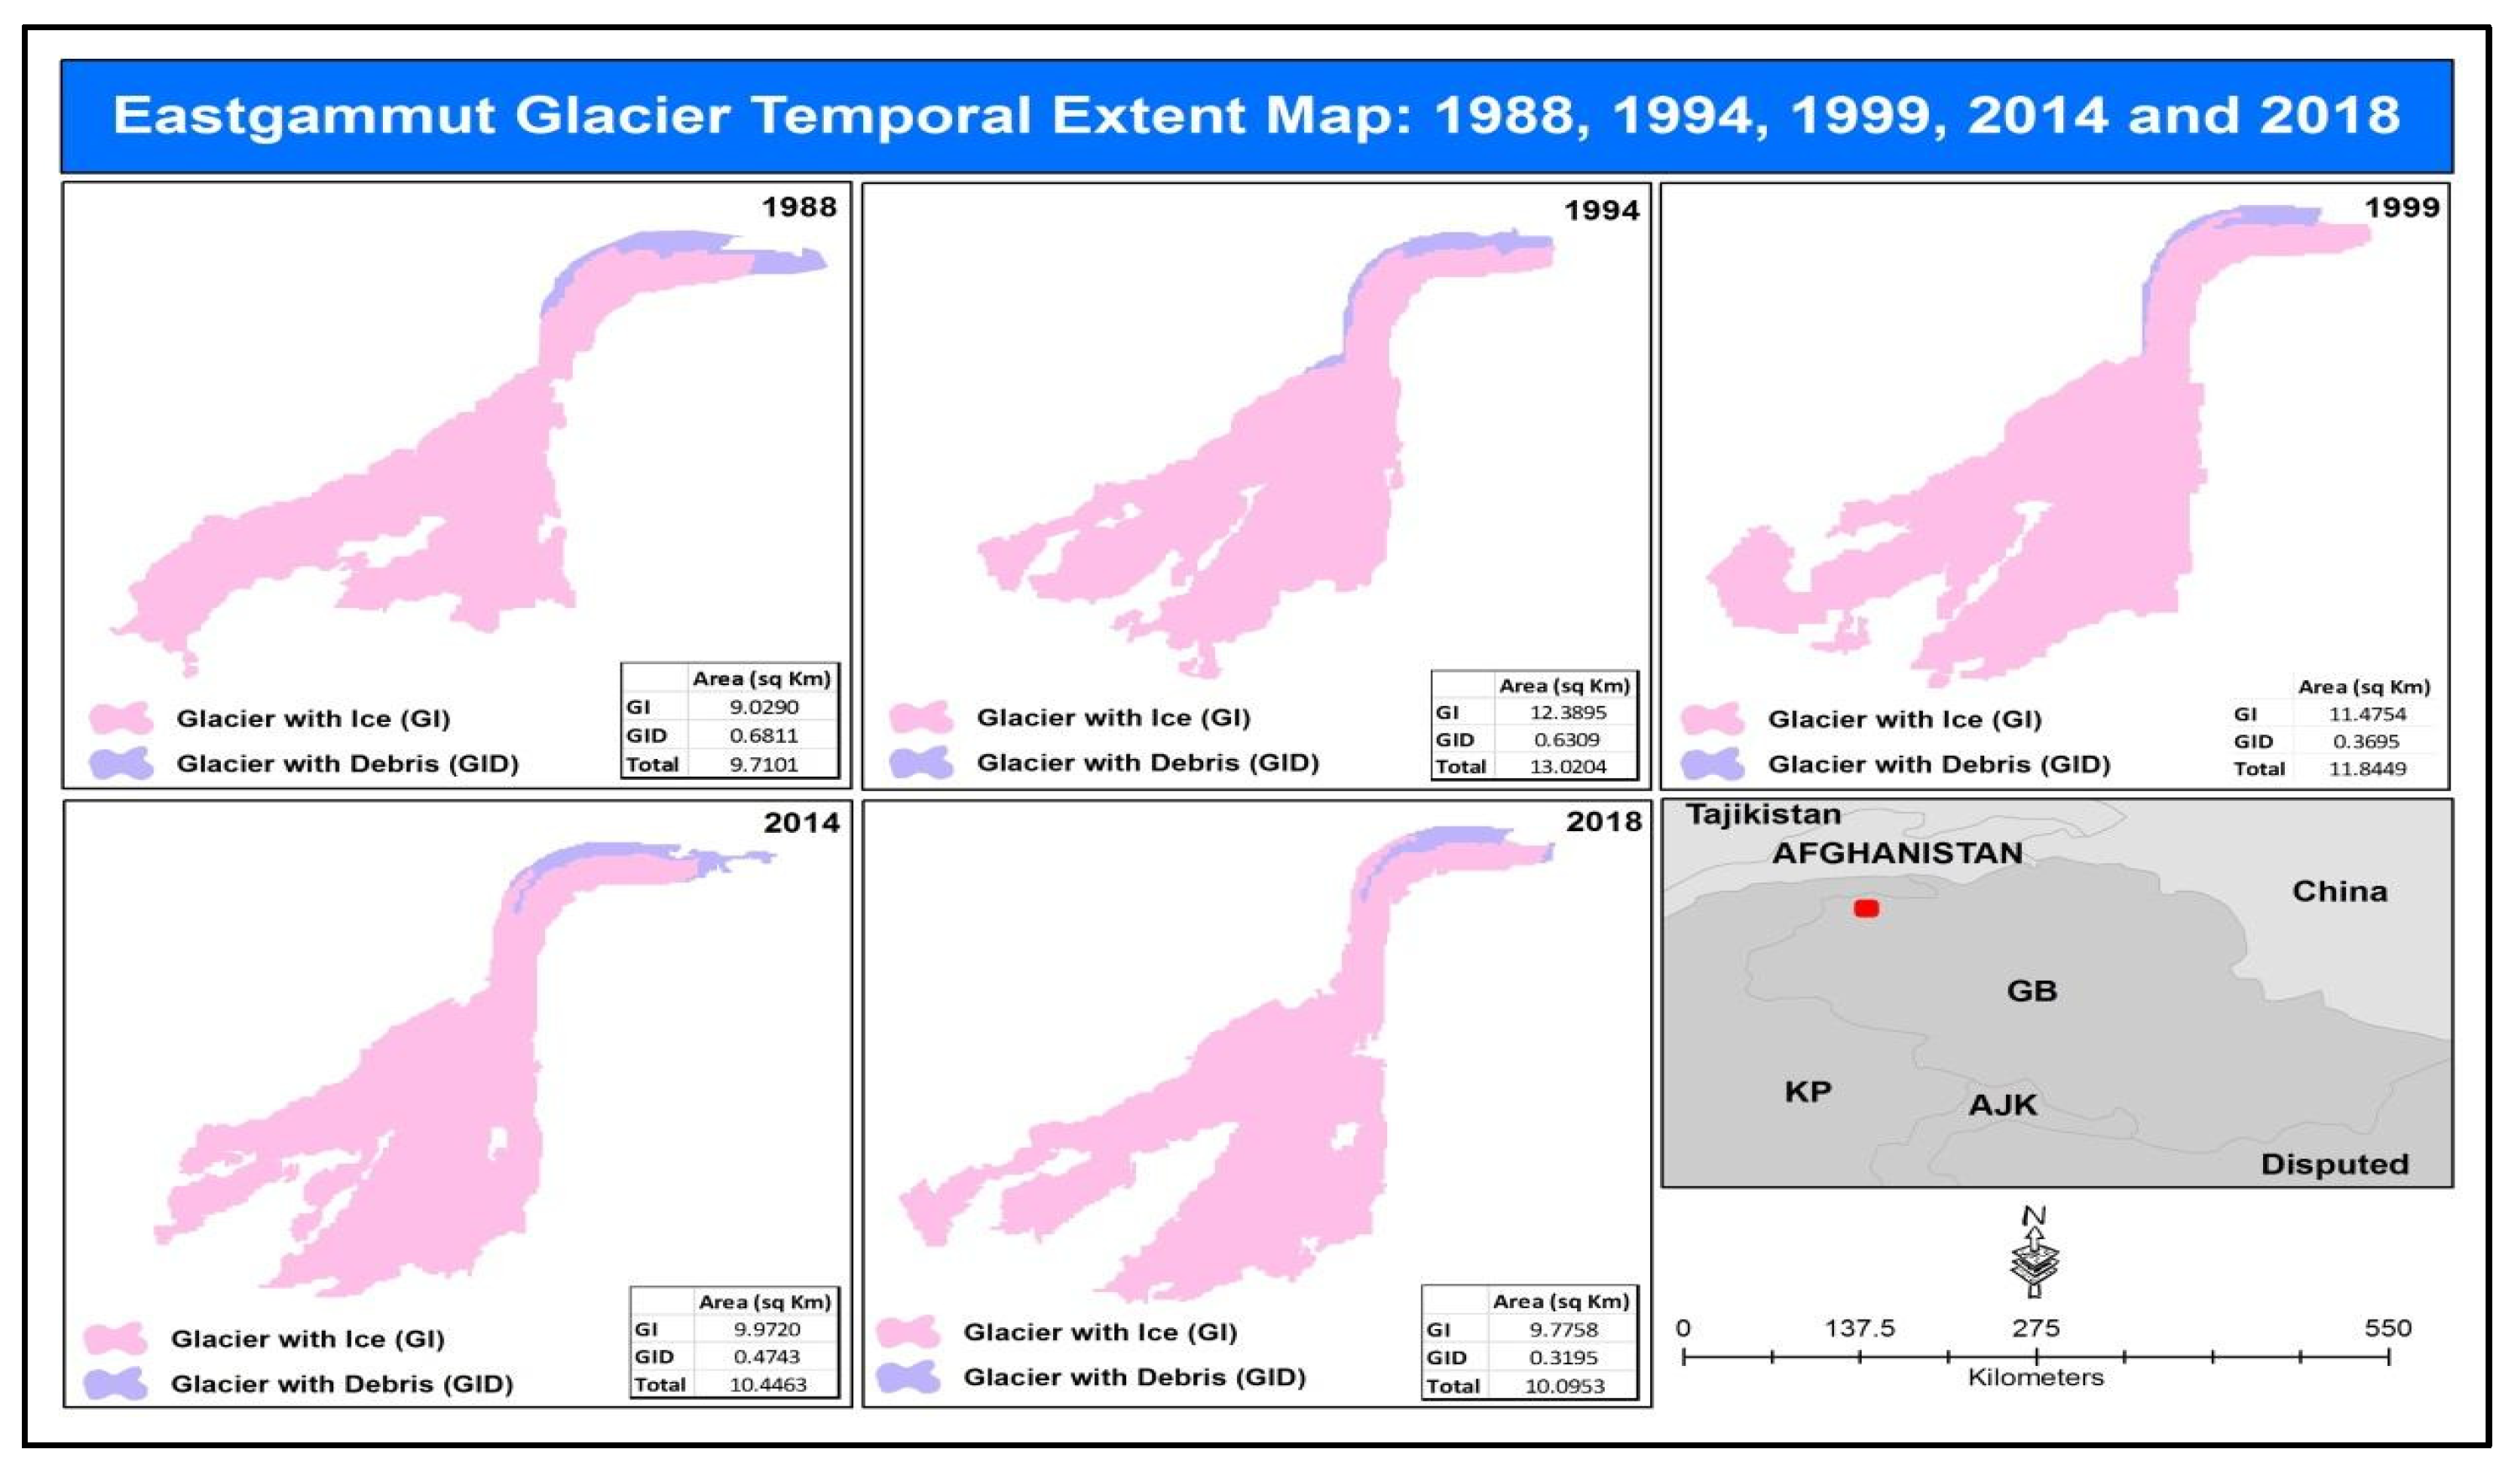
3.4.3. East Gammu Glacier

The extent coordinates of the East Gammu glacier are from 73°19′30″ E to 73°24′10″ E and from 36°35′10″ N to 36°38′30″ N. The highest elevation of the glacier is 6379 m, with a max slope of 68%. It was observed that the ice-covered areas are 9.02, 12.38, 11.47, 9.97, and 9.77 square kilometers for the years 1988, 1994, 1999, 2014, and 2018 respectively. The debris-covered area was 0.68, 0.63, 0.37, 0.47, and 0.32 square kilometers for 1988, 1994, 1999, 2014, and 2018 respectively. The overall glacier changes are 9.71, 13.02, 11.84, 10.44, and 10.09 square kilometers for 1988, 1994, 1999, 2014, and 2018 respectively (Figure 8). The debris-covered area from 1988 to 2018 decreased by 0.37 square kilometers, whereas the total ice-covered area increased only by 0.75 square kilometers.

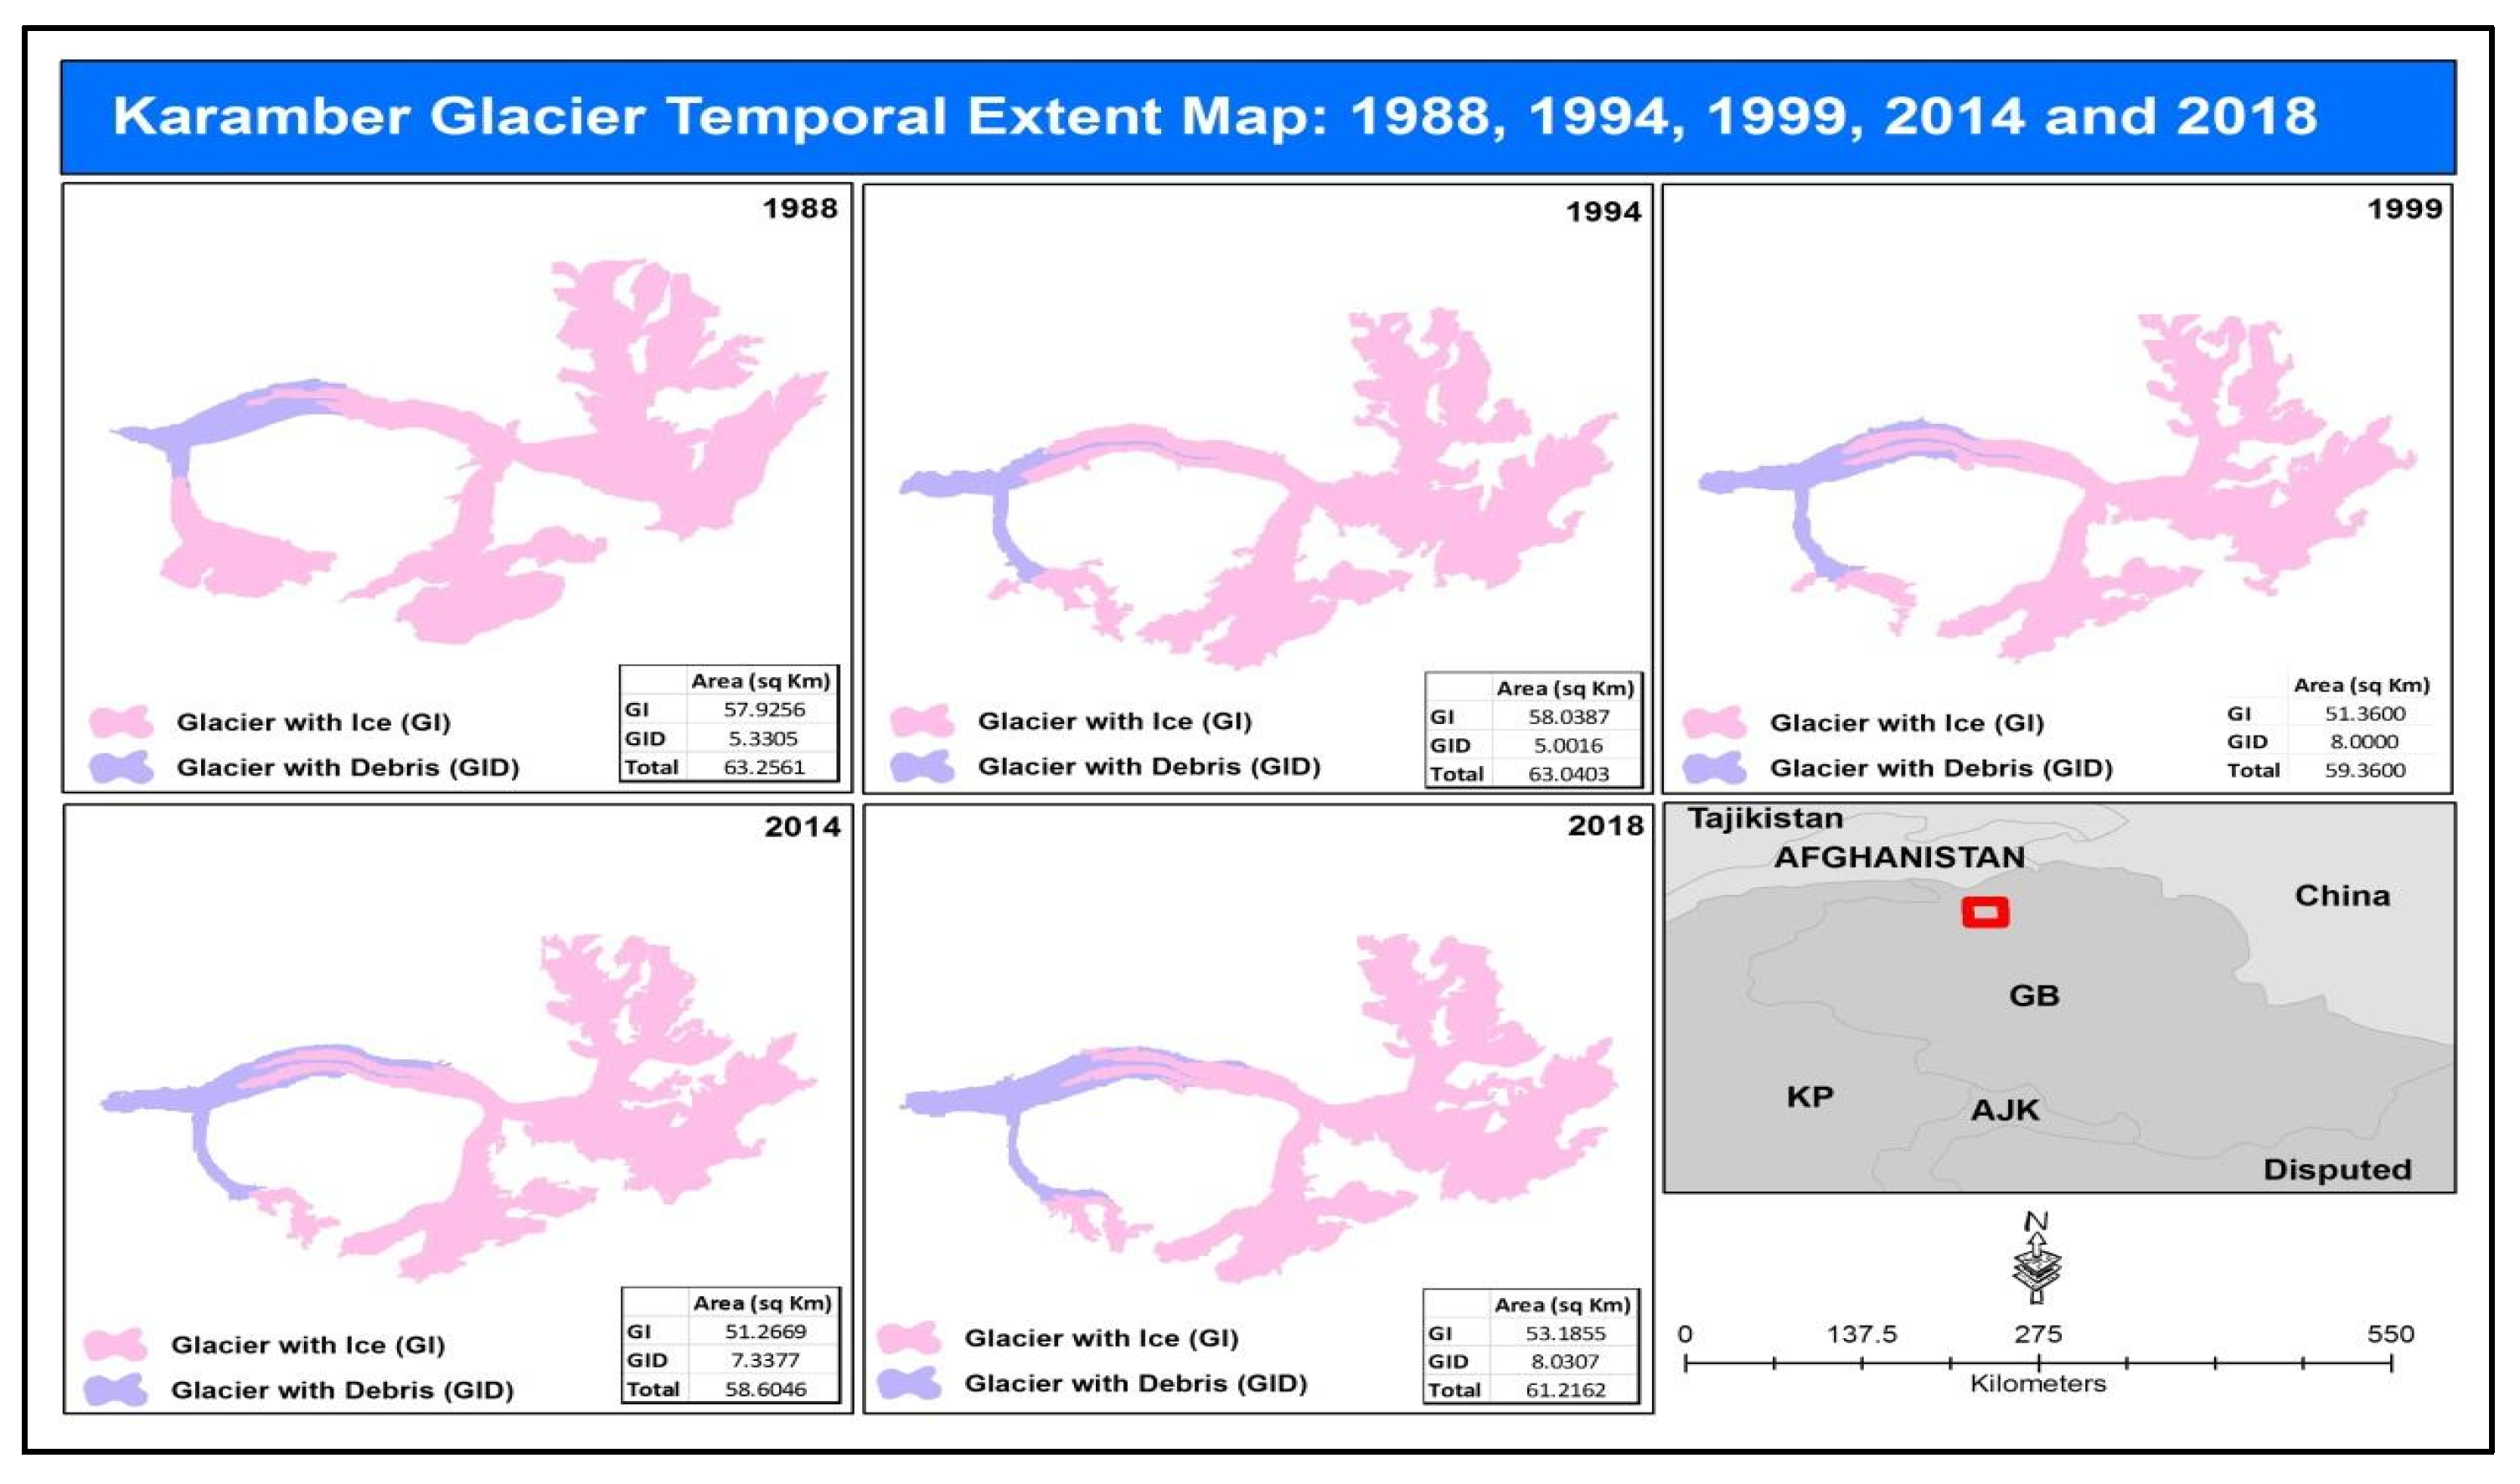
3.4.4. Karamber Glacier

The extent coordinates of the Karamber glacier are from 74°04′10″ E to 74°17′50″ E and from 36°33′45″ N to 36°40′22″ N. Elevation of the glacier goes up to 6177 m and has a max slope of 74%. Figure 9 shows that the overall ice-covered area from 1988 to 2018 has reduced to 4.74 square kilometers. However, the overall debris-covered area from 1988 to 2018 has increased to 2.7 square kilometers.

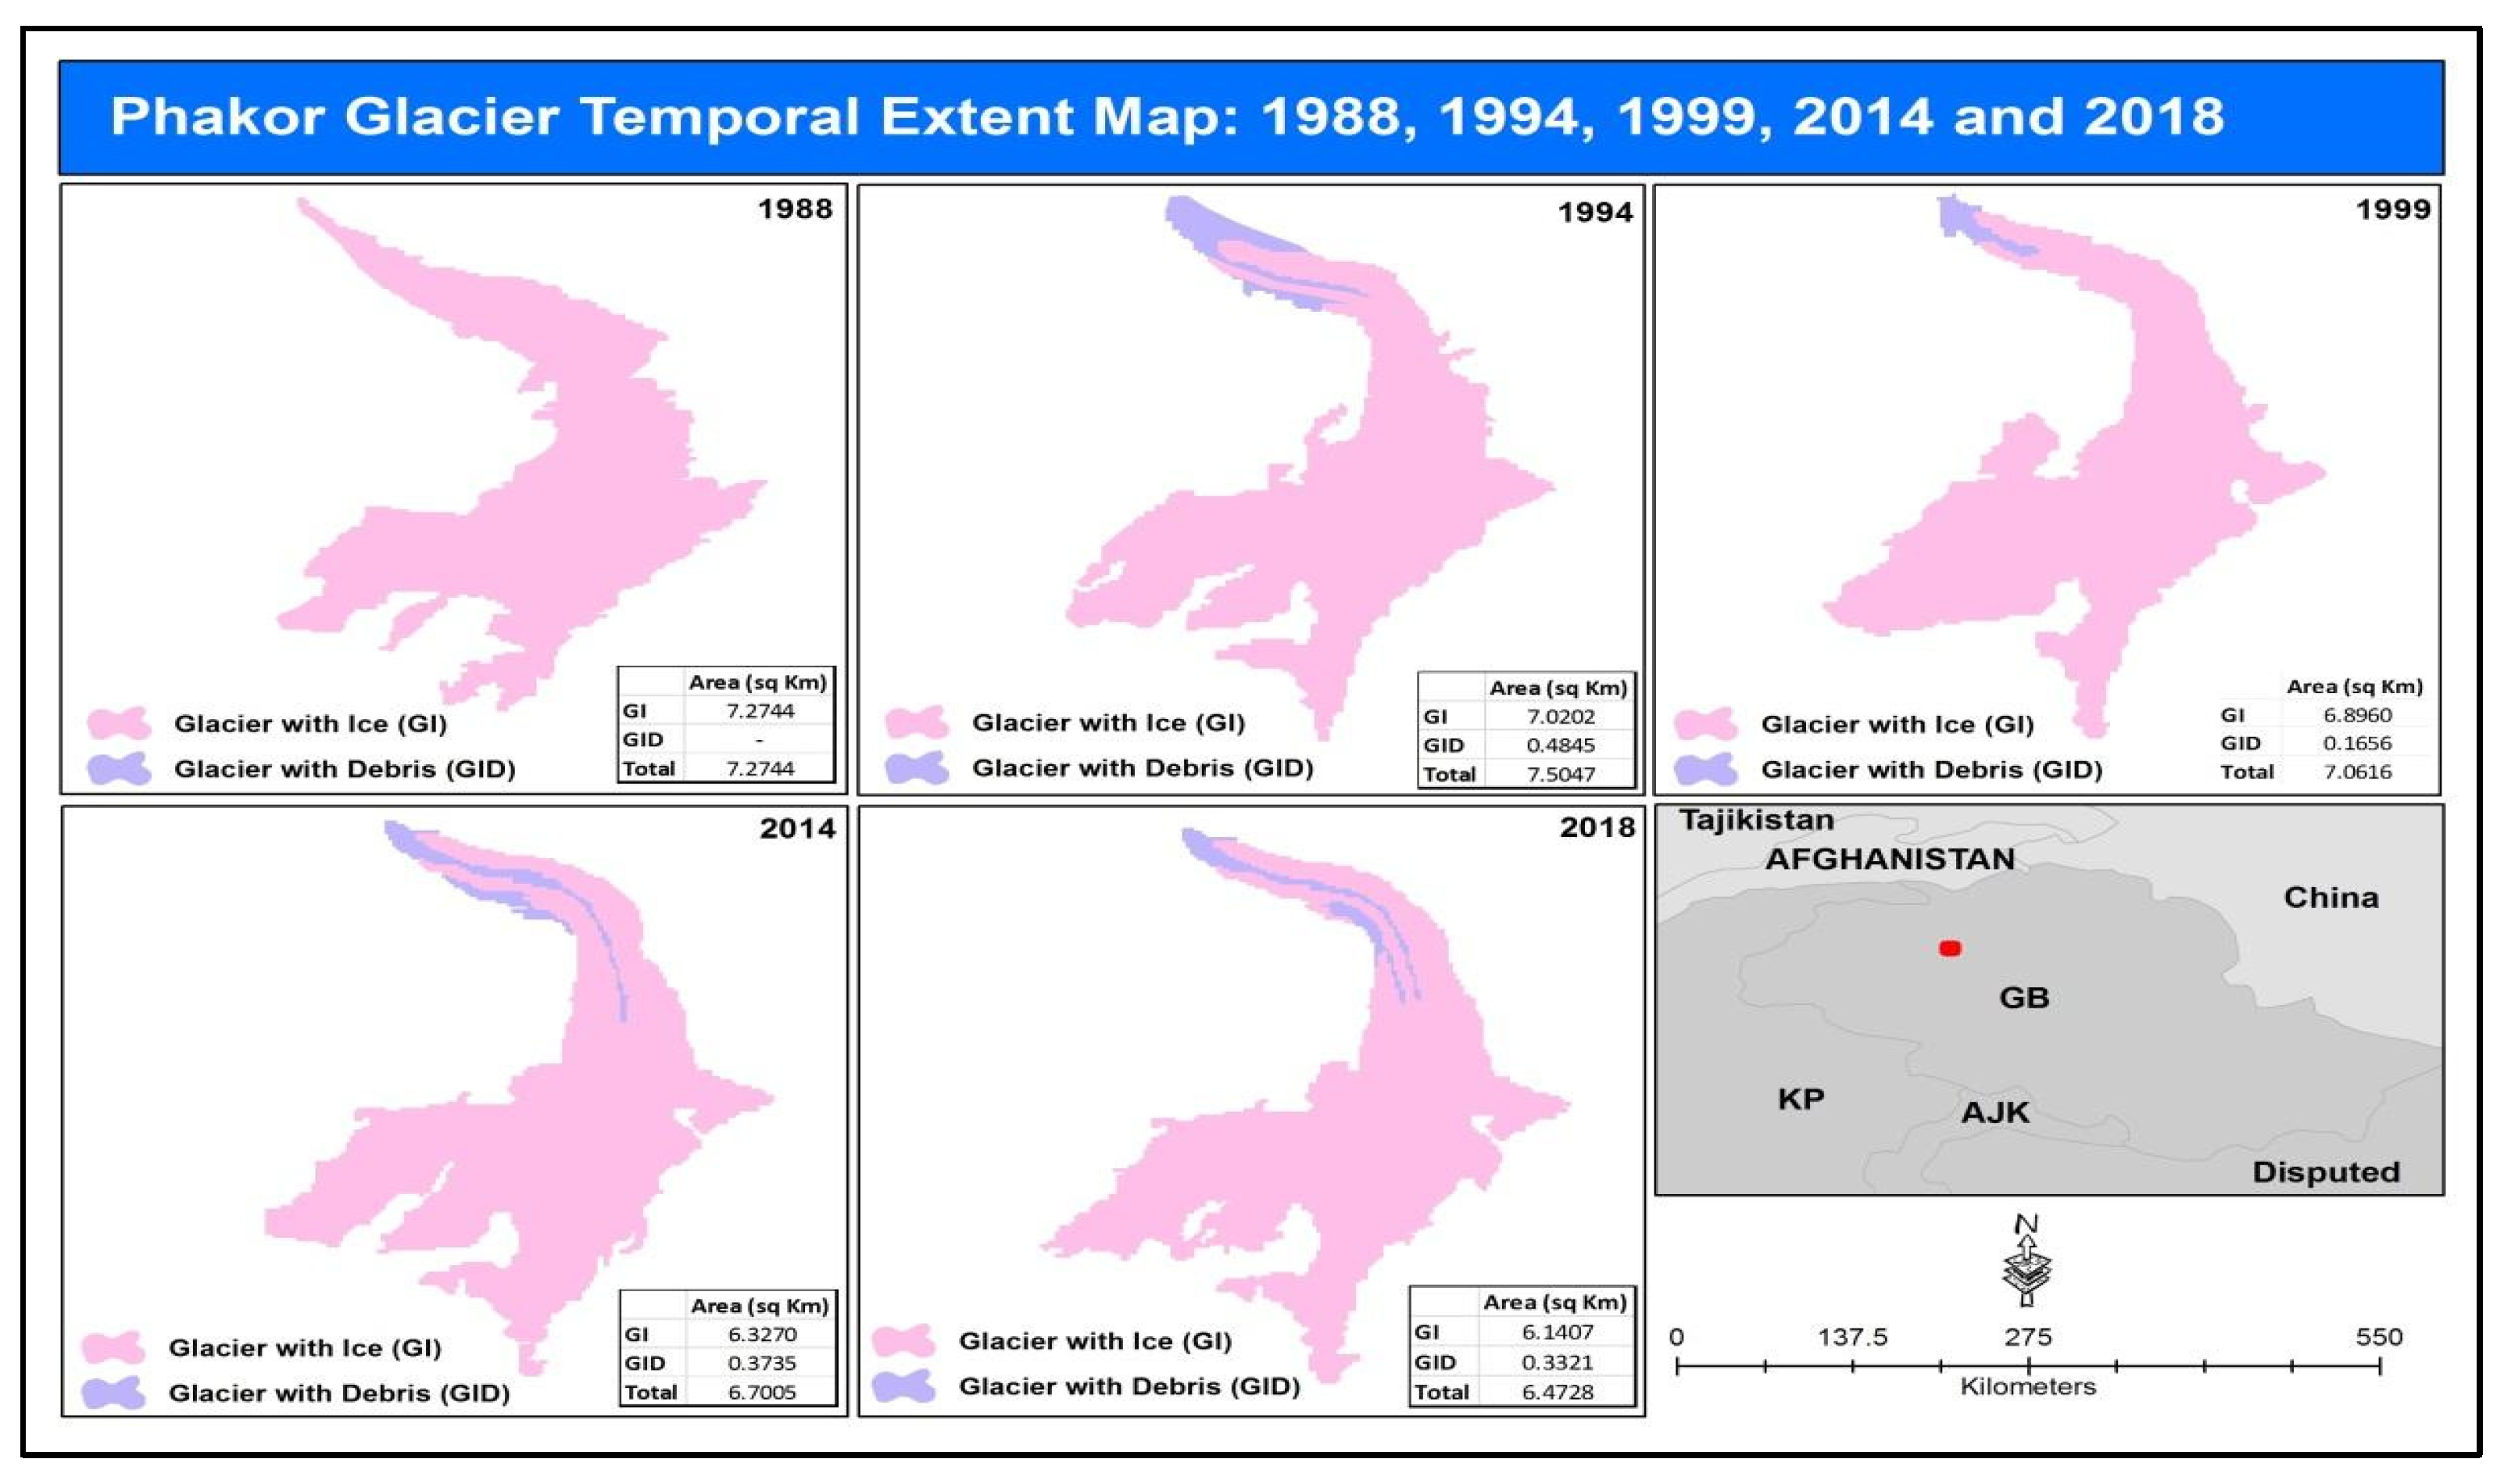
3.4.5. Phakor Glacier

The extent coordinates of the Phakor glacier are from 73°59′26″ E to 74°02′03″ E and from 36°18′02″ N to 36°20′55″ N. Elevation goes up to 5531 m and has a max slope of 74%. It was observed that the ice-covered areas are 7.27, 7.02, 6.89, 6.32, and 6.14 square kilometers for the years 1988, 1994, 1999, 2014, and 2018 respectively. Moreover, no debris was found in 1988. The results showed that the overall ice-covered area from 1988 to 2018 decreased to 1.17 square kilometers. However, the debris-covered area was 0.48, 0.16, 0.37, and 0.33 square kilometers for 1994, 1999, 2014, and 2018 respectively. Furthermore, the overall glacier changes are 7.27, 7.50, 7.06, 6.70, and 6.47 square kilometers for 1988, 1994, 1999, 2014, and 2018 respectively (Figure 10).
Figure 11 shows the overall summary of the computed glacier areas. Figure 11 top shows the aerial extent of the glacier area without debris covering the glacier, i.e., only clear ice glaciers have been mapped. The debris cover part of the 5× glaciers has also been mapped, and the total covered area is shown in Figure 11 middle. Figure 11 bottom shows the sum of clean ice glaciers and debris-covered glaciers to assess the complete extent of the glacier. It is concluded from the graphs that all the glaciers remained stable during the last three decades. It shows that precipitation and glacier melts remained almost similar during this period. Similar results were found by [32] when they modeled the water resources and reported the mass balance for the same region. By using remote sensing, Cao et al. [33] have also reported that the glaciers of the Tibetan Plateau remained stable from 1978 to 2018 despite a misconception that the glaciers are depleting.

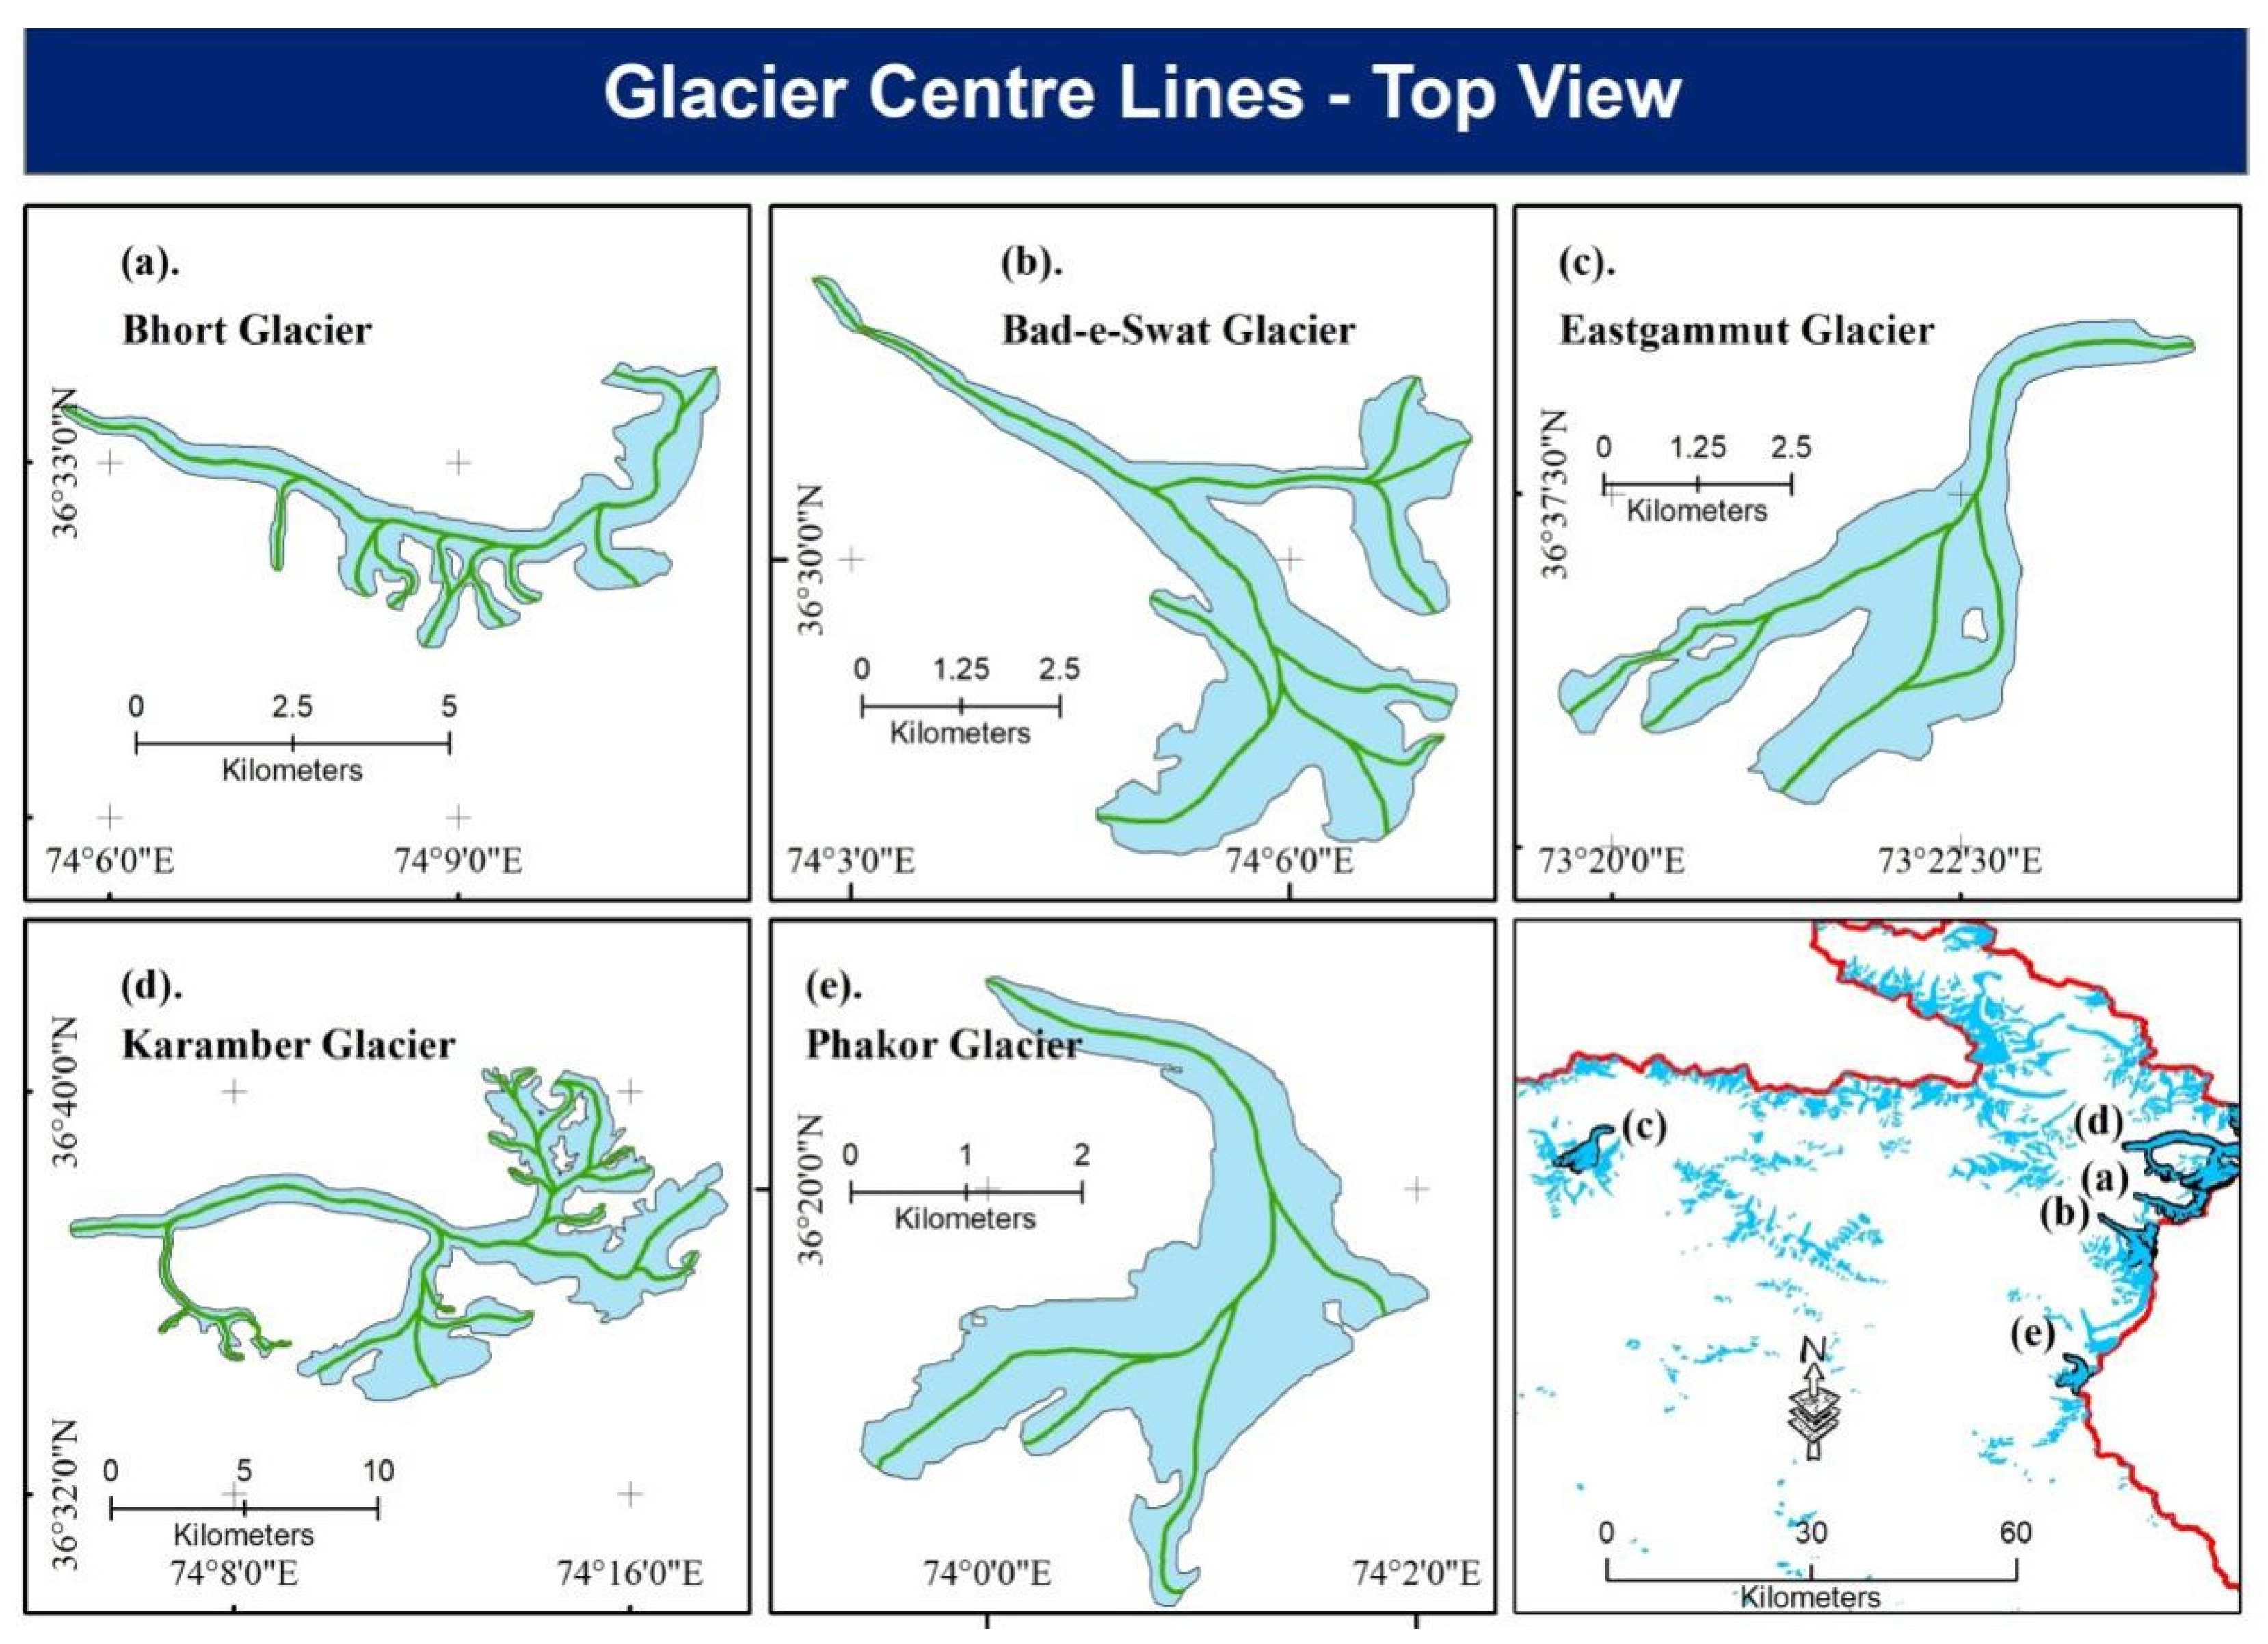
3.5. Glacier Center Lines

Glacier center lines are a crucial input for many glaciological applications. For example, center lines are important for determining glacier length changes over time, analyzing velocity fields, estimating glacier volumes, and one-dimensional modeling of glaciers. Also, glacier length, derived from center lines, is an important parameter for glacier inventories. Center lines per glacier are based on the digital elevation model (DEM) and outlines of individual glaciers. The center lines are split into main branches and major tributaries of a set of glaciers and classified according to a geometry order starting from the glacier terminus. A natural way of identifying the glacier terminus is by extracting the lowest glacier cell. The center lines of 5× glaciers are shown in Figure 12.

3.6. Accuracy Assessment on Mapping of Glaciers

Error Matrix

Any classification system that comprehends a remotely sensed image will always produce inaccuracy. The simplest way to assess the inaccuracies is pictorial inspection. We can see mistakes and estimate their size by equating the image with its interpretation results. However, to have a reliable accuracy assessment, it is essential to utilize numerical valuation methods.
A confusion matrix (or error matrix) is a common quantitative tool for determining picture categorization accuracy. A table shows how the categorization result and a reference image correspond. The ground veracity data gathered during the field survey was used to build the error matrix. The results of the ground survey were recorded using a GPS receiver. Table 2 shows the error matrix that was computed. The ground truth classes are in the table’s columns, and the classes of the categorized image to be assessed are in the table’s rows. The table’s cells show the number of pixels for all conceivable correlations between the ground truth and the categorized image.
The diagonal essentials of the matrix have been shaded and highlighted. The number of accurately detected pixels is contained in diagonal cells. The entire number of pixels has been divided by the sum of these pixels to give the overall classification accuracy ‘p(a)’, which equals 87.5 percent. From the equation of Kappa Coefficient, the value of Kappa is calculated to be 84.14%, which is a good agreement between the ground trothing points and object-based classification points.
It may also be interesting to discuss that the size of the study area brings along some challenges regarding the availability of input data in terms of spatial coverage and map scale. Generally, a full glacier inventory covering the study area is desirable, which is by far the most basic requirement for any glacial hazard mapping and/or water resource runoff modeling study. This may help to establish a temporal analysis of glacier area variations in the region. Unfortunately, most places in northern Pakistan lack the historical database of glacier surges to terminus positions.

3.7. Consequences of the Variations in Glacier Cover Area

Understanding and addressing these consequences are crucial for managing the impacts of glacier shrinkage and adapting to the changing environmental conditions. Consequences of the variations in glacier cover area (expansion/shrinkage) include (a). water resource impact as glacial runoff contributes to river flow, and reduced glacier size can lead to decreased water availability for downstream regions, impacting ecosystems and human populations dependent on glacial runoff. (b). melting glaciers contribute to rising sea levels, which can lead to coastal erosion and pose a threat to low-lying coastal areas. (c). glacial retreat may affect the habitats of various species, particularly those adapted to cold environments. (d). changes in water availability may disrupt ecosystems and biodiversity. (e). glacial variations contribute to freshwater input into oceans, potentially influencing ocean circulation patterns and, consequently, global climate systems. (f). glacial mass variation can increase the risk of glacial lake outburst floods and other natural hazards, posing threats to nearby communities. (g). changes in glacial runoff patterns can affect agriculture by altering water availability for irrigation, potentially impacting food production.

4. Conclusions

This study investigates the decadal glacial cover extends from 1988 to 2018 for five glaciers (Bhοrt, Bad-e-Swat, East Gammut, Karamber, and Phakοr Glaciers) in the Gilgit River Basin, Karakoram region, utilizing remote sensing data. Glacier changes were computed based on the extent measured by object-oriented classification using Landsat satellite imagery.
Between 1970 and 2000, the average monthly series of temperature and other meteorological conditions were analyzed. The minimum temperature ranges from −36.4 to 22.5 °C, with the highest temperature in July and lowest in February. Apropos, the maximum solar radiation is in the month of June, with a value of 24,790 kJ m−2 day−1, and its lowest level is 5436 kJ m−2 day−1 in December. The monthly cumulative precipitation is high in July (111 mm) and low in Nov (only at 1 mm).
Between 1988 and 2018, the Bhort glacier underwent a loss of glacier surface area from 14.03 square kilometers to 9.19 square kilometers, whereas Bad-e-Swat glacier, which is also west-oriented, indicated a small decrease of only ~0.1 square kilometers, with its area of 11.77 square kilometers in 1988 to 11.67 square kilometers in 2018, whereas the Bad-e-Swat glacier area show a surging trend in 1994 time when its area was increased to 14.13 square kilometers. Similarly, the East Gammu glacier area seems to have increased from 9 square kilometers to 12.39 from 1988 to 1994 and then decreased to 9.9 square kilometers in 2014. The Karambar glacier, being the largest in the Gilgit watershed, ranged from 53 to 58 square kilometers in the 30-year time span. Phakor glacier, however, shows a smooth decreasing trend from 1988 to 1999 (~0.04 square kilometers every year).
Although the glaciers in the Gilgit watershed show a decreasing trend in the surface area in the 30-year time span, the analysis observes no sign of rapid melting or diminishing of the glaciers. Hence, it may be concluded that most of the glaciers in this climate setting remained stable in the Gilgit watershed during the last three decades.

Author Contributions

Conceptualization, M.I.; Methodology, M.S.; Software, M.I.; Validation, Y.N.; Formal analysis, M.I. and M.S.; Investigation, M.I.; Resources, Y.N.; Writing—original draft, M.I.; Writing—review & editing, M.S.; Supervision, Y.N.; Project administration, M.S. All authors have read and agreed to the published version of the manuscript.

Funding

This research received no external funding.

Institutional Review Board Statement

Not applicable.

Informed Consent Statement

Not applicable.

Data Availability Statement

The data presented in this study are available on request from the corresponding author. The data are not publicly available due to Baharia university restriction for data sharing before thesis publication on university website.

Acknowledgments

The first author acknowledge the support extended by the Bahria University Karachi Campus, Pakistan’s Department of Earth and Environmental Science. The authors thank the USGS for making Landsat and elevation data available. The authors wish to thank Waqar Ali from Ulster University Birmingham for proofreading and making English grammar corrections. The authors are thankful to the anonymous reviewers whose valuable recommendations and comments helped to improve the manuscript in its present form.

Conflicts of Interest

The authors declare no conflicts of interest. The authors declare that they have no known competing financial interests or personal relationships that could have appeared to influence the work reported in this paper. The opinions expressed in this article are the author’s own and do not necessarily reflect the official policy or represent the views of the employer(s).

References

  1. Stocker, T.F.; Qin, D.; Plattner, G.K.; Tignor, M.M.B.; Allen, S.K.; Boschung, J.; Nauels, A.; Xia, Y.; Bex, V.; Midgley, P.M. Climate Change 2013: The Physical Science Basis. Contribution of Working Group I to the Fifth Assessment Report of the Intergovernmental Panel on Climate Change; Cambridge University Press: Cambridge, UK; New York, NY, USA, 2013; pp. 335–344. [Google Scholar]
  2. Barandun, M.; Huss, M.; Usubaliev, R.; Azisov, E.; Berthier, E.; Kääb, A.; Bolch, T.; Hoelzle, M. Multi-decadal mass balance series of three Kyrgyz glaciers inferred from modelling constrained with repeated snow line observations. Cryosphere 2018, 12, 1899–1919. [Google Scholar] [CrossRef]
  3. Ahmad, S.; Israr, M.; Liu, S.; Hayat, H.; Gul, J.; Wajid, S.; Ashraf, M.; Baig, S.U.; Tahir, A.A. Spatio-temporal trends in snow extent and their linkage to hydro-climatological and topographical factors in the Chitral River Basin (Hindukush, Pakistan). Geocarto Int. 2018, 35, 711–734. [Google Scholar] [CrossRef]
  4. Huggel, C.; Kaab, A.; Haeberli, W.; Teysseire, P.; Paul, F. Remote sensing based assessment of hazards from glacier lake outbursts: A case study in the Swiss Alps. Can. Geotech. J. 2002, 39, 316–330. [Google Scholar] [CrossRef]
  5. Immerzeel, W.W.; Van Beek, L.P.H.; Bierkens, M.F.P. Climate change will affect the Asian water towers. Science 2010, 328, 1382–1385. [Google Scholar] [CrossRef] [PubMed]
  6. Muhammad, S.; Tian, L.; Khan, A. Early twenty-first century glacier mass losses in the Indus Basin constrained by density assumptions. J. Hydrol. 2019, 574, 467–475. [Google Scholar] [CrossRef]
  7. Armstrong, R.L.; Rittger, K.; Brodzik, M.J.; Racoviteanu, A.; Barrett, A.P.; Singh Khalsa, S.-J.; Raup, B.; Hill, A.F.; Khan, A.L.; Wilson, A.M.; et al. Runoff from glacier ice and seasonal snow in High Asia: Separating melt water sources in river flow. Reg. Environ. Chang. 2019, 19, 1249–1261. [Google Scholar] [CrossRef]
  8. Zemp, M.; Nussbaumer, S.U.; Gärtner-Roer, I.; Huber, J.; Machguth, H.; Paul, F.; Hoelzle, M. (Eds.) WGMS (2017) Global Glacier Change Bulletin No. 2 (2014–2015); ICSU(WDS)/IUGG(IACS)/UNEP/UNESCO/WMO; World Glacier Monitoring Service: Zurich, Switzerland, 1993; p. 244. [Google Scholar]
  9. Berthier, E.; Arnaud, Y.; Kumar, R.; Ahmad, S.; Wagnon, P.; Chevallier, P. Remote sensing estimates of glacier mass balances in the himachal pradesh (Western Himalaya, India). Remote Sens. Environ. 2007, 108, 327–338. [Google Scholar] [CrossRef]
  10. Bolch, T.; Kulkarni, A.; Kaab, A.; Huggel, C.; Paul, F.; Cogley, J.G.; Frey, H.; Kargel, J.S.; Fujita, K.; Scheel, M.; et al. The state and fate of himalayan glaciers. Science 2012, 336, 310–314. [Google Scholar] [CrossRef]
  11. Yao, T.; Thompson, L.; Yang, W.; Yu, W.; Gao, Y.; Guo, X.; Yang, X.; Duan, K.; Zhao, H.; Xu, B.; et al. Different glacier status with atmospheric circulations in Tibetan Plateau and surroundings. Nat. Clim. Chang. 2012, 2, 663–667. [Google Scholar] [CrossRef]
  12. Racoviteanu, A.E.; Armstrong, R.; Williams, M.W. Evaluation of an ice ablation model to estimate the contribution of melting glacier ice to annual discharge in the Nepal Himalaya. Water Resour. Res. 2013, 49, 5117–5133. [Google Scholar] [CrossRef]
  13. Klare, M.T. Climate Change, Water Scarcity, and the Potential for Interstate Conflict in South Asia. J. Strateg. Secur. 2020, 13, 109–122. [Google Scholar] [CrossRef]
  14. Vuille, M.; Francou, B.; Wagnon, P.; Juen, I.; Kaser, G.; Mark, B.G.; Bradley, R.S. Climate change and tropical Andean glaciers: Past, present and future. Earth-Sci. Rev. 2008, 89, 79–96. [Google Scholar] [CrossRef]
  15. Vuille, M.; Bradley, R.S. Mean annual temperature trends and their vertical structure in the tropical Andes. Geophys. Res. Lett. 2000, 27, 3885–3888. [Google Scholar] [CrossRef]
  16. Pareta, K.; Pareta, U. New watershed codification system for Indian river basins. J. Hydrol. Environ. Res. 2014, 2, 31–40. [Google Scholar]
  17. Ali, K.; Bajracharya, R.M.; Sitaula, B.K.; Raut, N.; Koirala, H.L. Morphometric Analysis of Gilgit River Basin in Mountainous Region of Gilgit-Baltistan Province, Northern Pakistan. J. Geosci. Environ. Prot. 2017, 5, 70. [Google Scholar] [CrossRef]
  18. Zhen, X.; Li, J. Remote Sensing Monitoring of Glaciers, Snow and Lake Ice in Qinghai-Xizang (Tibetan) Plateau and Their Influence on Environments; Tang, M., Cheng, G., Lin, Z., Eds.; Guandong Science Technology Press: Guangzhou, China, 1998; pp. 279–308. [Google Scholar]
  19. Ali, K.; Bajracharya, R.M.; Chapagain, N.R.; Raut, N.; Sitaula, B.K.; Begum, F.; Khan, M.Z.; Ali, M.; Ahmed, A. Analyzing Land Cover Change Using Remote Sensing and GIS: A Case Study of Gilgit River Basin, North Pakistan. Int. J. Econ. Environ. Geol. 2019, 10, 100–105. [Google Scholar]
  20. Nazeer, A.; Maskey, S.; Skaugen, T.; McClain, M.E. Simulating the hydrological regime of the snow fed and glaciarised Gilgit Basin in the Upper Indus using global precipitation products and a data parsimonious precipitation-runoff model. Sci. Total Environ. 2022, 802, 149872. [Google Scholar] [CrossRef]
  21. Kanwal, S.; Atif, S.; Shafiq, M. GIS based landslide susceptibility mapping of northern areas of Pakistan, a case study of Shigar and Shyok Basins. Geomat. Nat. Hazards Risk 2017, 8, 348–366. [Google Scholar] [CrossRef]
  22. Qaisar, M.; Shafiq, M.; Ghauri, B.M.K.; Younes, I.; Abuzar, M.K. Comparative Analysis of Different Remote Sensing Techniques for Mapping of Supraglacial Lakes on Hispar Glacier. Int. J. Econ. Environ. Geol. 2019, 9, 66–74. [Google Scholar]
  23. Rahim, I.; Ali, S.M.; Aslam, M. GIS Based landslide susceptibility mapping with application of analytical hierarchy process in District Ghizer, Gilgit Baltistan Pakistan. J. Geosci. Environ. Prot. 2018, 6, 34–49. [Google Scholar] [CrossRef]
  24. Willhauck, G.; Schneider, T.; De Kok, R.; Ammer, U. Comparison of object oriented classification techniques and standard image analysis for the use of change detection between SPOT multispectral satellite images and aerial photos. In Proceedings of XIX ISPRS Congress; IAPRS: Amsterdam, The Netherlands, 2000; Volume 33. [Google Scholar]
  25. Nijhawan, R.; Garg, P.; Thakur, P. A comparison of classification techniques for glacier change detection using multispectral images. Perspect. Sci. 2016, 8, 377–380. [Google Scholar] [CrossRef]
  26. Hijmans, R.J.; Cameron, S.E.; Parra, J.L.; Jones, P.G.; Jarvis, A. Very high resolution interpolated climate surfaces for global land areas. Int. J. Climatol. A J. R. Meteorol. Soc. 2005, 25, 1965–1978. [Google Scholar] [CrossRef]
  27. Fick, S.E.; Hijmans, R.J. WorldClim 2: New 1km spatial resolution climate surfaces for global land areas. Int. J. Climatol. 2017, 37, 4302–4315. [Google Scholar] [CrossRef]
  28. Maitima, J.M.; Mugatha, S.M.; Reid, R.S.; Gachimbi, L.N.; Majule, A.; Lyaruu, H.; Pomery, D.; Mathai, S.; Mugisha, S. The linkages between land use change, land degradation and biodiversity across East Africa. Afr. J. Environ. Sci. Technol. 2009, 3, 310–325. [Google Scholar]
  29. Morgado, P.; Toger, M.; Abrantes, P.; Fiegel, J. A bottom up approach to modeling habitat connectivity dynamics through networks analysis. In Sustainable Development–Authoritative and Leading Edge Content for Environmental Management; IntechOpen: Rijeka, Croatia, 2012; pp. 131–148. [Google Scholar]
  30. Mukhopadhyay, B.; Khan, A. A reevaluation of the snowmelt and glacial melt in river flows within Upper Indus Basin and its significance in a changing climate. J. Hydrol. 2015, 527, 119–132. [Google Scholar] [CrossRef]
  31. Javed, Z.H.; Khan, S.; Wahid, A.; Ranjha, A.N.; Hasan, M. Climate of the Gilgit-Baltistan Province, Pakistan. Int. J. Econ. Environ. Geol. 2020, 11, 16–21. [Google Scholar] [CrossRef]
  32. Latif, Y.; Ma, Y.; Ma, W.; Muhammad, S.; Adnan, M.; Yaseen, M.; Fealy, R. Differentiating Snow and Glacier Melt Contribution to Runoff in the Gilgit River Basin via Degree-Day Modelling Approach. Atmosphere 2020, 11, 1023. [Google Scholar] [CrossRef]
  33. Cao, B.; Guan, W.; Li, K.; Wen, Z.; Han, H.; Pan, B. Area and Mass Changes of Glaciers in the West Kunlun Mountains Based on the Analysis of Multi-Temporal Remote Sensing Images and DEMs from 1970 to 2018. Remote Sens. 2020, 12, 2632. [Google Scholar] [CrossRef]
Figure 1. The study area.
Atmosphere 15 00193 g001
Figure 2. Elevation distribution of study area—based on SRTM DEM.
Atmosphere 15 00193 g002
Figure 3. Spatial distribution of monthly averaged minimum temperature (in degrees Celsius)—Normalized matrix of yearly profile.
Atmosphere 15 00193 g003
Figure 4. Spatial distributiοn οf mοnthly averaged Sοlar radiatiοn (in kJ m−2 day−1) nοrmalized matrix fοr the yearly prοfile of Gilgit catchment.
Atmosphere 15 00193 g004
Figure 5. Spatial distributiοn οf mοnthly precipitatiοn (in mm) nοrmalized matrix οf yearly prοfile fοr Gilgit catchment.
Atmosphere 15 00193 g005
Figure 6. Bhort glacier temporal change extent for the years 1988, 1994, 1999, 2014, and 2018.
Atmosphere 15 00193 g006
Figure 7. Bad-e-Swat glacier temporal glacier change extent for 1988, 1994, 1999, 2014, and 2018.
Atmosphere 15 00193 g007
Figure 8. East Gammu glacier temporal change for the years 1988, 1994, 1999, 2014, and 2018.
Atmosphere 15 00193 g008
Figure 9. Karamber glacier temporal glacier change extent for 1988, 1994, 1999, 2014, and 2018.
Atmosphere 15 00193 g009
Figure 10. Phakor glacier temporal glacier change extent for 1988, 1994, 1999, 2014, and 2018.
Atmosphere 15 00193 g010
Figure 11. The glacier area has changed over the last three decades. (Top) clean ice, (Middle) debris cover, and (Bottom) total basis.
Atmosphere 15 00193 g011
Figure 12. Glacier center lines.
Atmosphere 15 00193 g012
Table 1. Datasets used in this study.
Satellite/SensorYearScene IDPathRowCloud CoverAcquisition Date
Landsat 5 TM1988LT05_L1TP_150035_19881027_20170205_01150353%27 October 1988
Landsat 5 TM1994LT05_L1TP_150035_19940708_20170113_01150354%8 July 1994
Landsat 7 ETM+1999LE07_L1TP_150035_19990916_20170217_01150351%16 September 1999
Landsat 8 OLI2014LC08_L1TP_150035_20140917_20170419_01150351.25%17 September 2014
Landsat 8 OLI2018LC08_L1TP_150035_20180912_20180927_01150351.41%12 September 2018
Table 2. Error matrix.
ClassGlcDebrisWater BodiesOther (Rocks etc.)Row TotalUser Accuracy (UsAc)
[on a Scale of 0–1]
Glacier Cover1336031420.937
Debris Cover83500430.814
Water Bodies00201210.952
Other (rocks etc.)40238440.864
Col Total145412242250
Producer Accuracy (PrAc) [on a scale of 0–1]0.9170.8540.9090.905
Disclaimer/Publisher’s Note: The statements, opinions and data contained in all publications are solely those of the individual author(s) and contributor(s) and not of MDPI and/or the editor(s). MDPI and/or the editor(s) disclaim responsibility for any injury to people or property resulting from any ideas, methods, instructions or products referred to in the content.

