Article

Estimation and Analysis of Air Pollutant Emissions from On-Road Vehicles in Changzhou, China

1
Ministry of Education Key Laboratory for Earth System Modeling, Department of Earth System Science, Tsinghua University, Beijing 100084, China
2
Chinese Academy of Environmental Planning, Beijing 100012, China
3
School of Environment, Tsinghua University, Beijing 100084, China
4
State Key Laboratory of Atmospheric Boundary Layer Physics and Atmospheric Chemistry, Institute of Atmospheric Physics, Chinese Academy of Sciences, Beijing 100029, China
5
Center for Monsoon System Research, Institute of Atmospheric Physics, Chinese Academy of Sciences, Beijing 100029, China
6
Environment Research for Temperate East Asia, Institute of Atmospheric Physics, Chinese Academy of Sciences, Beijing 100029, China
*
Authors to whom correspondence should be addressed.
These authors contributed equally to this work.
Atmosphere 2024, 15(2), 192; https://doi.org/10.3390/atmos15020192
Submission received: 11 January 2024 / Revised: 28 January 2024 / Accepted: 30 January 2024 / Published: 1 February 2024
(This article belongs to the Section Air Pollution Control)

Abstract

:
Vehicle emissions have become a significant contributor to urban air pollution. However, studies specific to city-level vehicle emission inventories are still scarce and tend to be outdated. This study introduces a methodology for developing high-resolution monthly vehicle emission inventories. We applied this methodology to Changzhou in 2022 to analyze emission characteristics and generate gridded emission data with a resolution of 0.01° × 0.01°. The results show that the total vehicle emissions of carbon monoxide (CO), volatile organic compounds (VOCs), nitrogen oxides (NOx), and fine particulate matters (PM2.5) in Changzhou are 39.69, 8.68, 18.6, and 0.56 Gg, respectively. Light-duty passenger vehicles are the main contributors to CO (74.3%) and VOCs (86.1%) emissions, while heavy-duty trucks play a significant role in NOx (50.7%) and PM2.5 (34.7%) emissions. Gasoline vehicles are mainly responsible for CO (78.6%) and VOCs (91.4%) emissions, while diesel vehicles are the primary source of NOx (81.1%) and PM2.5 (70.6%) emissions. Notably, China IV vehicles have the highest emission contribution rates (ranging from 32.5% to 44.9%). Seasonally, emissions peak in winter and are lowest in April. Spatially, emission intensity is higher in the northeast of Changzhou compared to the west and south. The methodology presented in this study offers a valuable tool for developing comprehensive city-level emission inventories, and the results provide critical insights that can inform the formulation of effective environmental policies.

1. Introduction

Since 2013, China’s clean air policies have led to notable changes in pollutant emissions and surface air quality [1,2]. Nevertheless, further emission reductions are essential for achieving substantial air quality improvements [3]. China has experienced rapid urbanization and motorization, resulting in a significant increase in the vehicle population, which surged from 224 million in 2012 to 417 million in 2022 [4]. Consequently, vehicles have emerged as a major source of air pollution in China [5]. Vehicle emission inventories quantitatively describe the air pollutants emitted by vehicles, thus providing a scientific basis for the establishment of environmental control policies [6]. The rapid growth and substantial volume of vehicle emissions have attracted increasing attention from researchers [7]. Over the past decade, vehicle emission inventories have been developed at the national, provincial, and city levels in China.
Research on vehicle emission inventories at the national level started relatively early. Cai and Xie (2007, 2013) calculated China’s vehicle emissions from 1980 to 2009, revealing the rapid growth of air pollutant emissions [8,9]. Zheng et al. (2014) established China’s vehicle emission inventory for 2008 with a spatial resolution of 0.05° × 0.05°, based on the vehicle population at the county level and the technology distribution at the provincial level [10]. Jia et al. (2018) calculated vehicle emissions in mainland China from 2011 to 2015 and found an imbalance in the distribution of emissions, with higher total emissions and per capita emissions in developed provinces and higher emissions per unit of gross domestic product (GDP) in developing provinces [11]. Wen et al. (2023) established monthly and provincial vehicle emission inventories in China from 2010 to 2021 and found that vehicle emissions varied widely in different months and regions, emphasizing the need for ambient temperature correction [12].
At the provincial level, there have also been relatively extensive studies on vehicle emissions. Liu et al. (2017) established a vehicle emission inventory in Guangdong Province from 1994 to 2014, and found that changes in carbon monoxide (CO) and volatile organic compounds (VOCs) emissions were closely correlated with the population of yellow-labeled light passenger cars and motorcycles, while changes in nitrogen oxides (NOx) and fine particulate matters (PM2.5) were consistent with the population of yellow-labeled heavy passenger cars and trucks [13]. Lv et al. (2019) estimated vehicle emissions during 2003 to 2015 in Yunnan Province and found that the increase in the vehicle population was the main driver of the increase in vehicle emissions [14]. Xu et al. (2023) developed an air pollutant emission inventory in Hainan in 2017 to analyze the impact of vehicle electrification on improving air quality, and found that this policy will not only reduce air pollutant emissions but also avoid complex ozone pollution in the future [15].
Although studies at the national and provincial levels have improved our understanding of vehicle emissions, their emission inventories often lack the resolution needed for precise policymaking. Therefore, researchers have recently turned their attention to vehicle emissions at the city level. Jing et al. (2016) developed a high temporal-spatial resolution vehicle emission inventory for Beijing in 2013, revealing consistent spatiotemporal trends with human activities [16]. Zou et al. (2023) used a link-based vehicle emission model to establish a real-world vehicle emission inventory for Zhengzhou in 2017, evaluating the impact of traffic restriction policies [17]. These studies show that the spatiotemporal resolution of the city-level emission inventories is generally higher, which is crucial for effective policymaking. Nevertheless, the research years of the previous emission inventories are usually before 2020. Considering that China implemented the vehicular China VI standard nationwide in 2020, there is an urgent need to update vehicle emission inventories. Additionally, previous studies often used non-indigenous models to develop vehicle emission inventories in China, such as the Computer Program to Calculate Emissions from Road Transport (COPERT) [18], the Motor Vehicle Emission Simulator (MOVES) [19], and the International Vehicle Emissions (IVE) [20], which have problems with the applicability of the model and may lead to uncertainty. The Ministry of Ecology and Environment has released technical guidelines on emission inventories (GEI) [21], which incorporates more local studies and has been widely accepted by Chinese researchers. In this study, the GEI is used to compile the vehicle emission inventory.
Changzhou is a prefecture-level city in China, where vehicle emissions have become a significant source of air pollution [22]. There is an urgent need for Changzhou to develop a high-resolution vehicle emission inventory to support air pollution control. To meet this practical need, the objective of this study is to develop a comprehensive vehicle emission inventory for Changzhou in 2022 based on the GEI model. The specific tasks are as follows: (1) propose a monthly vehicle emission estimation approach, (2) estimate vehicle emissions in Changzhou in 2022, (3) investigate vehicle emission characteristics in detail, and (4) obtain a high-resolution gridded emission inventory with a resolution of 0.01° × 0.01°.
Compared with previous studies [5,23], the main innovations of this study are twofold: first, the emission calculation is refined from annual to monthly based on detailed road transportation volume and meteorological data, improving the temporal resolution of the emission inventory; second, by integrating economic activities, road networks, and driving patterns, a comprehensive spatial allocation method is proposed, enhancing the spatial resolution of the emission inventory. The approach proposed in this study offers a valuable tool for developing comprehensive city-level emission inventories, and the results provide critical insights that can inform environmental policymaking in Changzhou and beyond.

2. Methods and Data

2.1. Study Area

Changzhou, a city in the southern part of Jiangsu Province with a population of about 3.9 million, is located in East China (see Figure 1). The administrative divisions of Changzhou include Jintan, Wujin, Xinbei, Tianning, Zhonglou, Economic Zone, and Liyang. In this study, a digital road network map of Changzhou was obtained from OpenStreetMap, and three types of roads were classified, namely, highways, arterials, and streets. Changzhou belongs to the Yangtze River Delta (YRD) region and borders two metropolitan cities, Shanghai and Nanjing. Although there have been studies focusing on vehicle emission inventories in the YRD [24], Jiangsu [25], Shanghai [26], and Nanjing [27], little attention has been paid specifically to Changzhou.

2.2. Vehicle Emission Estimation

Vehicle emissions, including both exhaust and evaporative emissions [28], are estimated using the following equation:
E = E e x + E e v
where E, Eex, and Eev, respectively, represent the total vehicle emissions, exhaust emissions, and evaporative emissions.
Exhaust emissions are estimated using the following equation:
E e x , p , m = i , j , h V P i , j , h × V K T i , m × E F e x , i , j , h , p , m
where p represents the type of air pollutants, including CO, VOCs, NOx, and PM2.5, and m is the month, from January to December. VP and EFex represent vehicle population and exhaust emission factors, respectively, which are further subcategorized by vehicle type (i), fuel type (j), and emission standard (h). The value of vehicle kilometers traveled (VKT) is mainly determined by vehicle type. Besides, VKT and EFex vary in each month, considering changes in transportation volume and meteorological conditions. The units of VP, VKT, and EF are vehicles, km/month, and g/km, respectively.
Previous studies indicated that evaporative emissions mostly come from gasoline vehicles, and the emitted air pollutants are mainly VOCs [29]. Therefore, only the VOCs emitted by gasoline vehicles are considered in the estimation of evaporative emissions, including two processes, running and parking, using the following equation:
E e v , V O C s , m = i , h V P i , g a s o l i n e , h × D m × E F e v , r u n , h + E F e v , p a r k , h , m
where Dm represents the number of days in month m, EFev,run is the evaporative emission factor during the running process, mainly referring to running loss, and EFev,park is the evaporative emission factor during the parking process, including hot soak loss, diurnal breathing loss, and refueling loss [30]. The unit of EFev,run and EFev,park is g/day.
Compared with previous studies [23], this study improved the accuracy by estimating vehicle emissions by month. On the one hand, the annual VKT is divided into each month according to the variation of passenger and freight transportation. On the other hand, the emission factors are simulated based on monthly meteorological conditions.

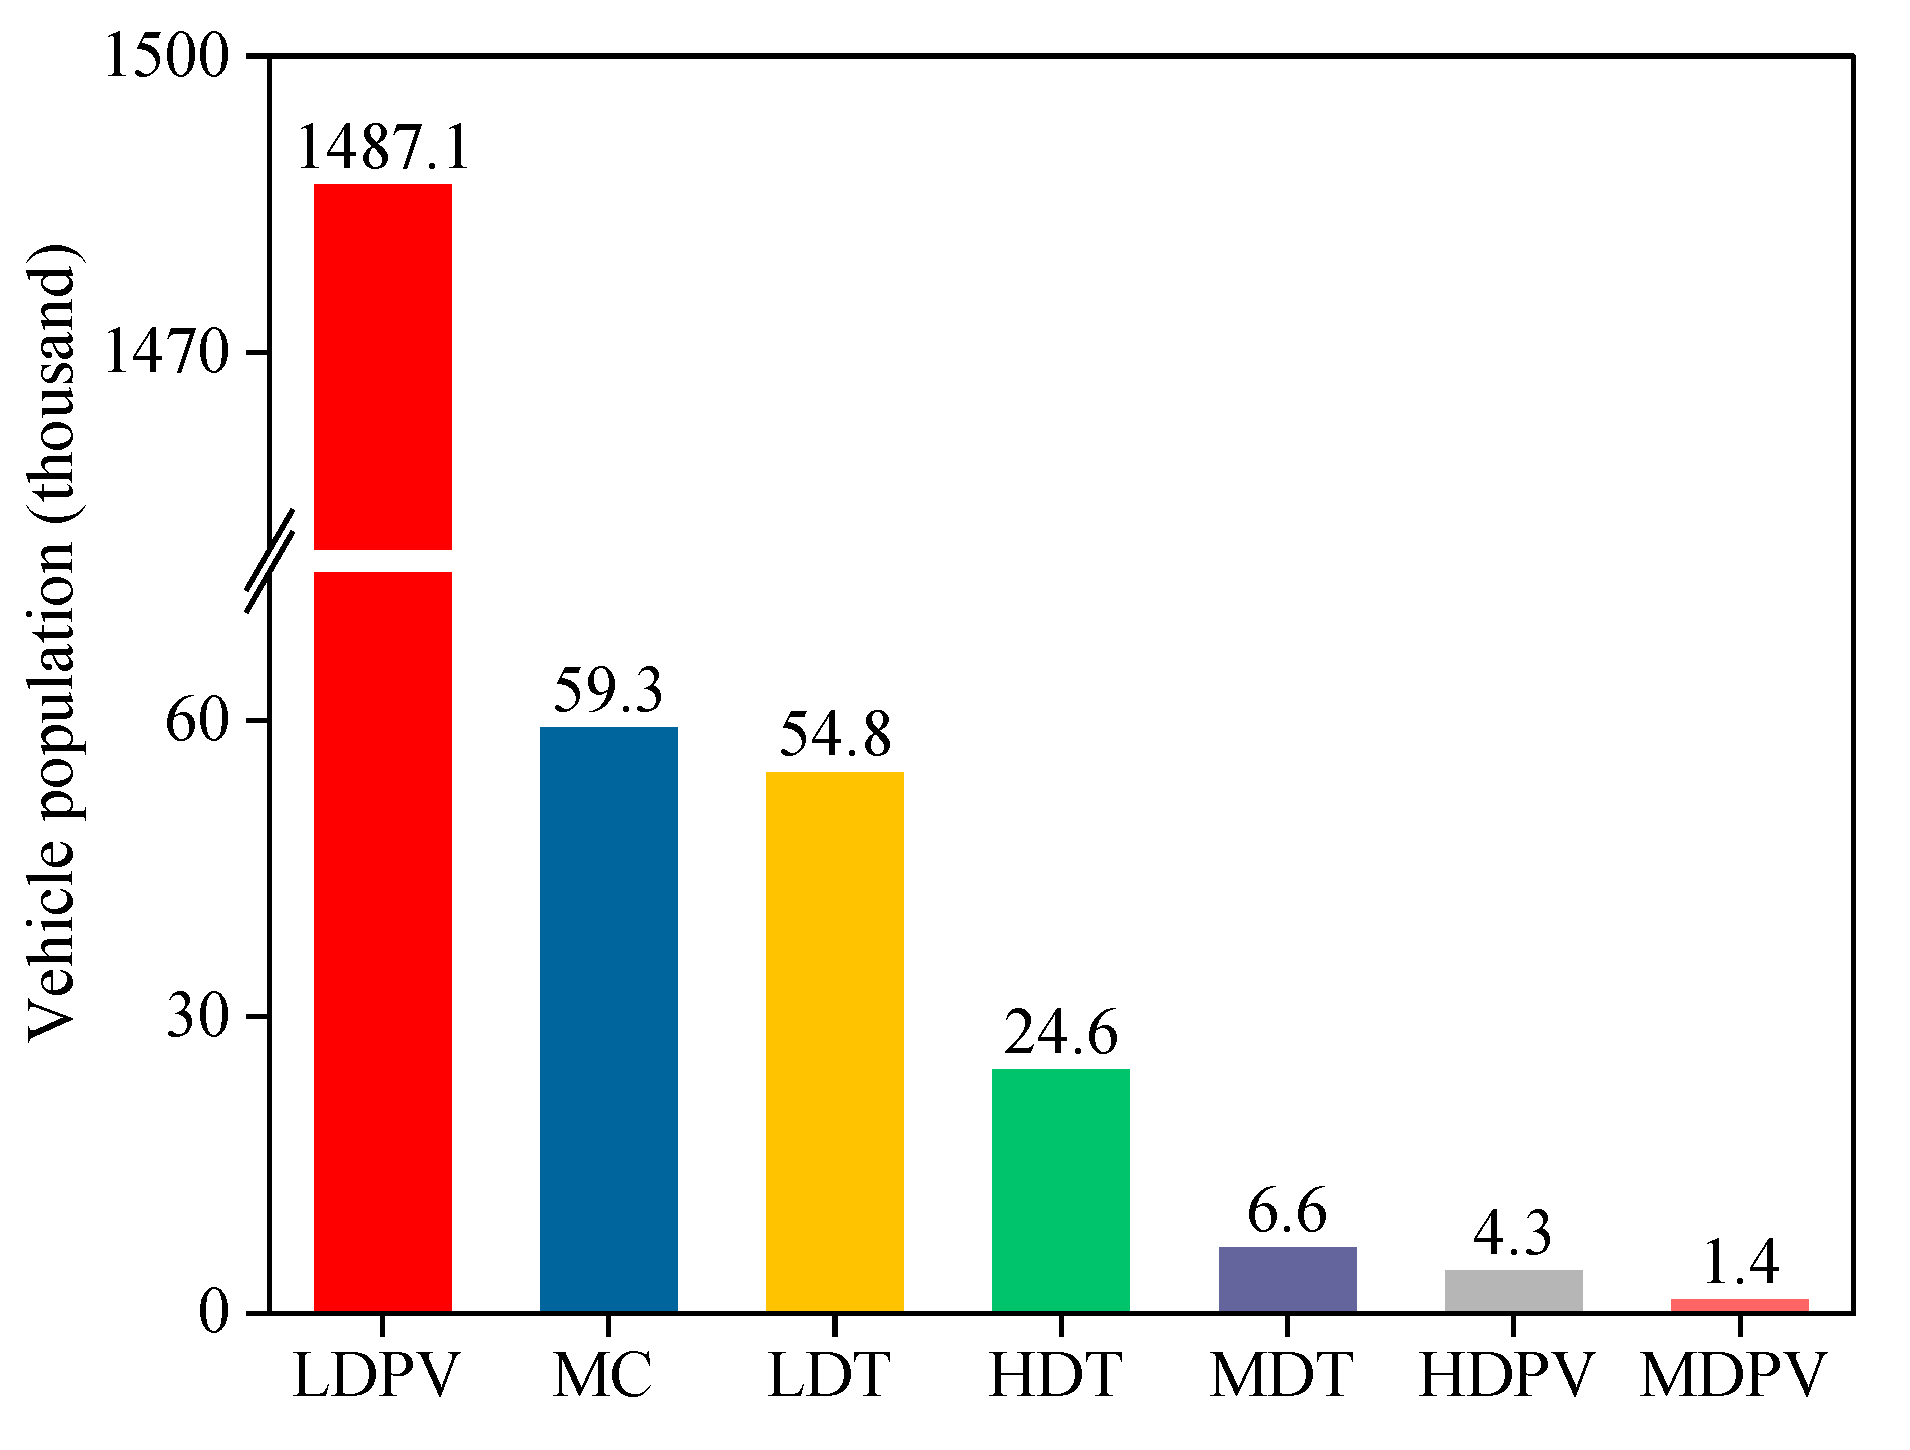
2.3. Detailed Vehicle Population

The vehicle population data were obtained from the vehicle registration database provided by the Changzhou Department of Motor Vehicles. The database records attribute information of local vehicles, including vehicle type (i), fuel type (j), and emission standard (h). Compared to public data sources, such as government websites or statistical yearbooks, registration data provide a much more detailed picture. Many previous studies were conducted to estimate vehicle emissions based on public data [31]. Public data are easily acquired and can indicate the population of different vehicle types, but they typically lack information on fuel types and emission standards. In fact, emission factors vary significantly by fuel type and emission standard, even for the same vehicle type. This study utilized detailed vehicle population data to achieve a closer match between emission factors and vehicle classifications, thereby improving the accuracy of the emission estimation.
According to the classifications in the vehicle registration database and previous studies, this study considered seven vehicle types: light-duty passenger vehicles (LDPVs), medium-duty passenger vehicles (MDPVs), heavy-duty passenger vehicles (HDPVs), light-duty trucks (LDTs), medium-duty trucks (MDTs), heavy-duty trucks (HDTs), and motorcycles (MCs). Additionally, three fuel types were considered: gasoline, diesel, and other fuels (primarily compressed natural gas, liquefied natural gas, and liquefied petroleum gas). Finally, this study considered seven stages of emission standards, ranging from pre-China I to China VI.
In 2022, the total vehicle population in Changzhou amounted to 1637.98 thousand (see Figure 2). The population of light-duty vehicles significantly exceeded that of medium- and heavy-duty vehicles. LDPVs were the dominant type in the vehicle fleet, accounting for 90.8%. MCs were second only to LDPVs and were significantly higher than in many other Chinese cities [32], possibly due to the well-developed local motorcycle industry. The total population of trucks comprised 5.2% of the fleet, with LDTs having the highest share and MDTs the lowest. The population of HDPVs and MDPVs was relatively small, together accounting for less than 0.5% of the total fleet.

2.4. Annual and Monthly VKT

VKT is a key parameter in emission estimation, influenced by various economic, transportation, and geographic factors and, therefore, has different values across regions. Utilizing localized VKT improves the accuracy of emission estimation. However, unlike vehicle population, there is no officially published VKT specific to Changzhou. Previous studies usually determined VKT values based on GEI or literature research [33], which may lead to uncertainty. VKT derived from GEI represents national averages, while VKT from the literature may not accurately reflect local vehicle activity patterns [34].
This study employed a questionnaire survey to collect local vehicle activity data, including VKT and average speed, the latter serving as a critical input for emission factor simulation (see Section 2.5). The survey was divided into two segments: one targeting drivers, conducted in parking lots, bus companies, and highway toll booths, and the other targeting government workers, primarily involving interviews with ecological and environmental departments. Based on these pragmatic investigations, the values of annual VKT and average speed were determined (see Table 1).
Overall, VKT increased progressively with increasing vehicle weight. Heavy-duty vehicles, such as HDPVs and HDTs, have higher VKT values. The higher VKT of HDPVs is due to the widespread use of public transportation. HDTs, frequently employed for long-haul and intercity freight transportation, have a higher VKT. The VKT of LDPVs has decreased compared to previous years, correlating with the significant increase in the vehicle population. According to Huo et al. (2012), there is a negative correlation between VKT and vehicle ownership rates [35]. Regions with higher vehicle ownership rates often have congested roads, and they tend to have more robust public transportation systems, all of which contribute to a lower VKT for LDPVs.
This study used monthly data to estimate vehicle emissions; however, the surveyed VKT data were annual. Based on the methodology introduced by Zheng et al. (2021) [36], this study employed traffic monthly change coefficients (MCCs) to convert annual VKT into monthly VKT.
The MCCs were calculated based on the monthly road passenger and freight transportation volume released by the Ministry of Transport, as shown in the following equation:
M C C t m , m = T V m m T V m
where TV represents the transportation volume, and tm refers to the transportation mode, which includes passenger and freight transportation, expressed in persons and tons, respectively. Note that the unit of MCC is %.
The MCCs for passenger and freight transportation were calculated in Changzhou for 2022, using Equation (4) (see Figure 3). Overall, the MCCs for freight and passenger transportation showed similar trends. Notably, the freight volumes experienced a significant decrease in February, coinciding with the Chinese New Year and a slowdown in industrial production. Both passenger and freight volumes declined significantly in April, which can be attributed to China’s pandemic prevention and control measures implemented during the COVID-19 pandemic.
The MCCs were utilized to disaggregate annual VKT into monthly VKT, using the following equation:
V K T i , m = V K T i × M C C i , m
where VKTi,m is the monthly VKT and VKTi is the annual VKT for vehicle type i, measured in km/month and km/year, respectively.
Specifically, the MCCs derived from passenger volume were employed to describe the activity patterns of passenger vehicles, including LDPVs, MDPVs, and HDPVs. Similarly, the MCCs derived from freight volume were utilized to depict truck activity, including LDTs, MDTs, and HDTs. Additionally, the average MCCs, considering both passenger and freight volumes, were used to analyze the MC activity.

2.5. Emission Factor Simulation

Vehicle emission factors are influenced by several factors, including meteorological conditions, traffic situation, and fuel quality. Meteorological conditions, particularly temperature and relative humidity, exhibit significant variations across different months. Consequently, emission factors are heavily influenced by these conditions, resulting in obvious month-to-month fluctuations. This aspect has received limited attention in previous studies. In this study, we used a method within the GEI framework to simulate monthly emission factors. The GEI methodology incorporates extensive test data from China, effectively capturing the impact of local conditions on emission factors.
The exhaust emission factors were calculated using the following equation:
E F e x , i , j , h , m = B E F e x , i , j , h × φ i , j , h , m × γ i , j , h × θ j , h
where BEFex denotes the base exhaust emission factor in g/km, measured under the typical natural environment, driving conditions, fuel quality, deterioration level, and load ratio in China, as obtained from the GEI. The dimensionless correction parameters φ, γ, and θ quantify the influence of local conditions on emission factors.
φ reflects the impact of meteorological and geographical conditions, including temperature, humidity, and altitude. Monthly φ values were determined based on meteorological data sourced from the Changzhou Statistical Yearbook [37].
γ represents the influence of driving conditions, primarily characterized by average speed derived from traffic surveys (see Table 1). The vehicle emission factor is strongly influenced by speed and generally decreases with increasing speed, first rapidly and then more slowly [38]. Passenger vehicles (LDPVs, MDPVs, and HDPVs) typically operate on urban roads, which tend to be heavily congested, resulting in lower speeds. In contrast, trucks (LDTs, MDTs, and HDTs) have higher speeds, as they often travel on urban ring roads and interurban routes, and many trucks operate at night due to traffic restrictions. The speed of MCs is also relatively high, mainly due to their tendency to operate in the suburbs, influenced by the “ban on motorcycles” policy.
θ accounts for other influencing factors, such as fuel quality and vehicle load. Fuel quality is primarily assessed on the basis of sulfur content. Generally, fuels with lower sulfur content contribute to reduced air pollution. In 2022, both gasoline and diesel sold in Changzhou contained less than 10 mg/kg of sulfur. Vehicle load values were determined using the GEI’s recommended values.
According to the GEI methodology, temperatures and average speeds are segmented into distinct ranges for φ and γ, with each range assigned a constant correction value. However, this approach results in discontinuous simulated emission factors when temperature or speed transitions occur between ranges. To address this issue, we introduced temperature and velocity correction curves. For a detailed discussion on correction curves, please refer to Sun et al. (2020) [32].
Evaporative emission factors include two processes: running (EFev,run) and parking (EFev,park). The base EFev,run and EFev,park represent evaporative emissions during vehicle running and parking at 15 °C, respectively. EFev,run does not require correction, while EFev,park requires a temperature-based correction using the following equation:
E F e v , p a r k , h , m = B E F e v , p a r k , h × φ m
where BEFev,park denotes the base evaporative emission factor, measured in g/d. The meteorological correction parameter φ is determined using temperature correction curves based on values provided by the GEI.
Using the above methods, this study derived vehicle emission factors for Changzhou in 2022 (see Figure 4). The results show that the CO emission factors for heavy-duty vehicles were generally higher than those for light-duty vehicles. Notably, MCs and LDPVs had higher VOCs emission factors, despite being classified as light-duty vehicles, primarily due to the evaporative emissions associated with gasoline-powered vehicles. Regarding NOx and PM2.5 emissions, HDPVs had the highest emission factor, while LDPVs and MCs exhibited considerably lower values.

2.6. Emission Spatial Allocation

Vehicle emissions were spatially allocated to obtain a high-resolution gridded emission inventory. This allocation process used a range of spatial surrogates, including socioeconomic indicators, mileage weights, emission intensity, and road lengths. The methodology is outlined in the following five steps:
(1)
Establishing the target domain. The digital road network map of Changzhou was re-gridded into 4481 grids, each with a horizontal resolution of 0.01° × 0.01° on the WGS84 datum, using ArcGIS software (version 10.4.1) [39].
(2)
Allocating emissions from city to district level. Owing to limited data availability on vehicle populations at the district level, socioeconomic indicators, such as population, were employed to allocate emissions from Changzhou to its constituent districts.
(3)
Assigning emissions to road types. Vehicles have different travel frequencies on different road types, which are described by mileage weights. In this study, mileage weights were used to assign vehicle emissions to specific road types according to the following equation:
E p , d i s t , r = E p , d i s t × M W r
where dist and r represent the districts of Changzhou and road types, respectively (see Section 2.1 for details), and MW refers to mileage weights expressed as percentages and obtained from previous studies (see Table 2). As passenger vehicles predominantly operate in urban areas, their mileage weights are higher on streets, while trucks, primarily used for freight transportation and subject to traffic restrictions, have higher mileage weights on highways and arterials.
(4)
Calculating road emission intensity. This metric is determined by considering the emissions and lengths of different road types within each district, as expressed in the equation:
E I p , d i s t , r = E p , d i s t , r R L d i s t , r
where EIp,dist,r represents the emission intensity of pollutant p on road type r in district dist, while Ep,dist,r denotes the corresponding total emissions. RLdist,r is the total length of road type r in district dist, calculated using ArcGIS.
(5)
Simulating gridded vehicle emissions. Since a grid can include multiple road types, gridded emissions are calculated as the sum of the products of emission intensity and road length for each road type within the grid, as follows:
E p , d i s t , g = r E I p , d i s t , r × R L d i s t , g , r
where g is the grid cell number, Ep,dist,g represents the emissions of pollutant p within grid g in district dist, and RLdist,g,r denotes the length of road type r within grid g, obtained by ArcGIS.

3. Results and Discussion

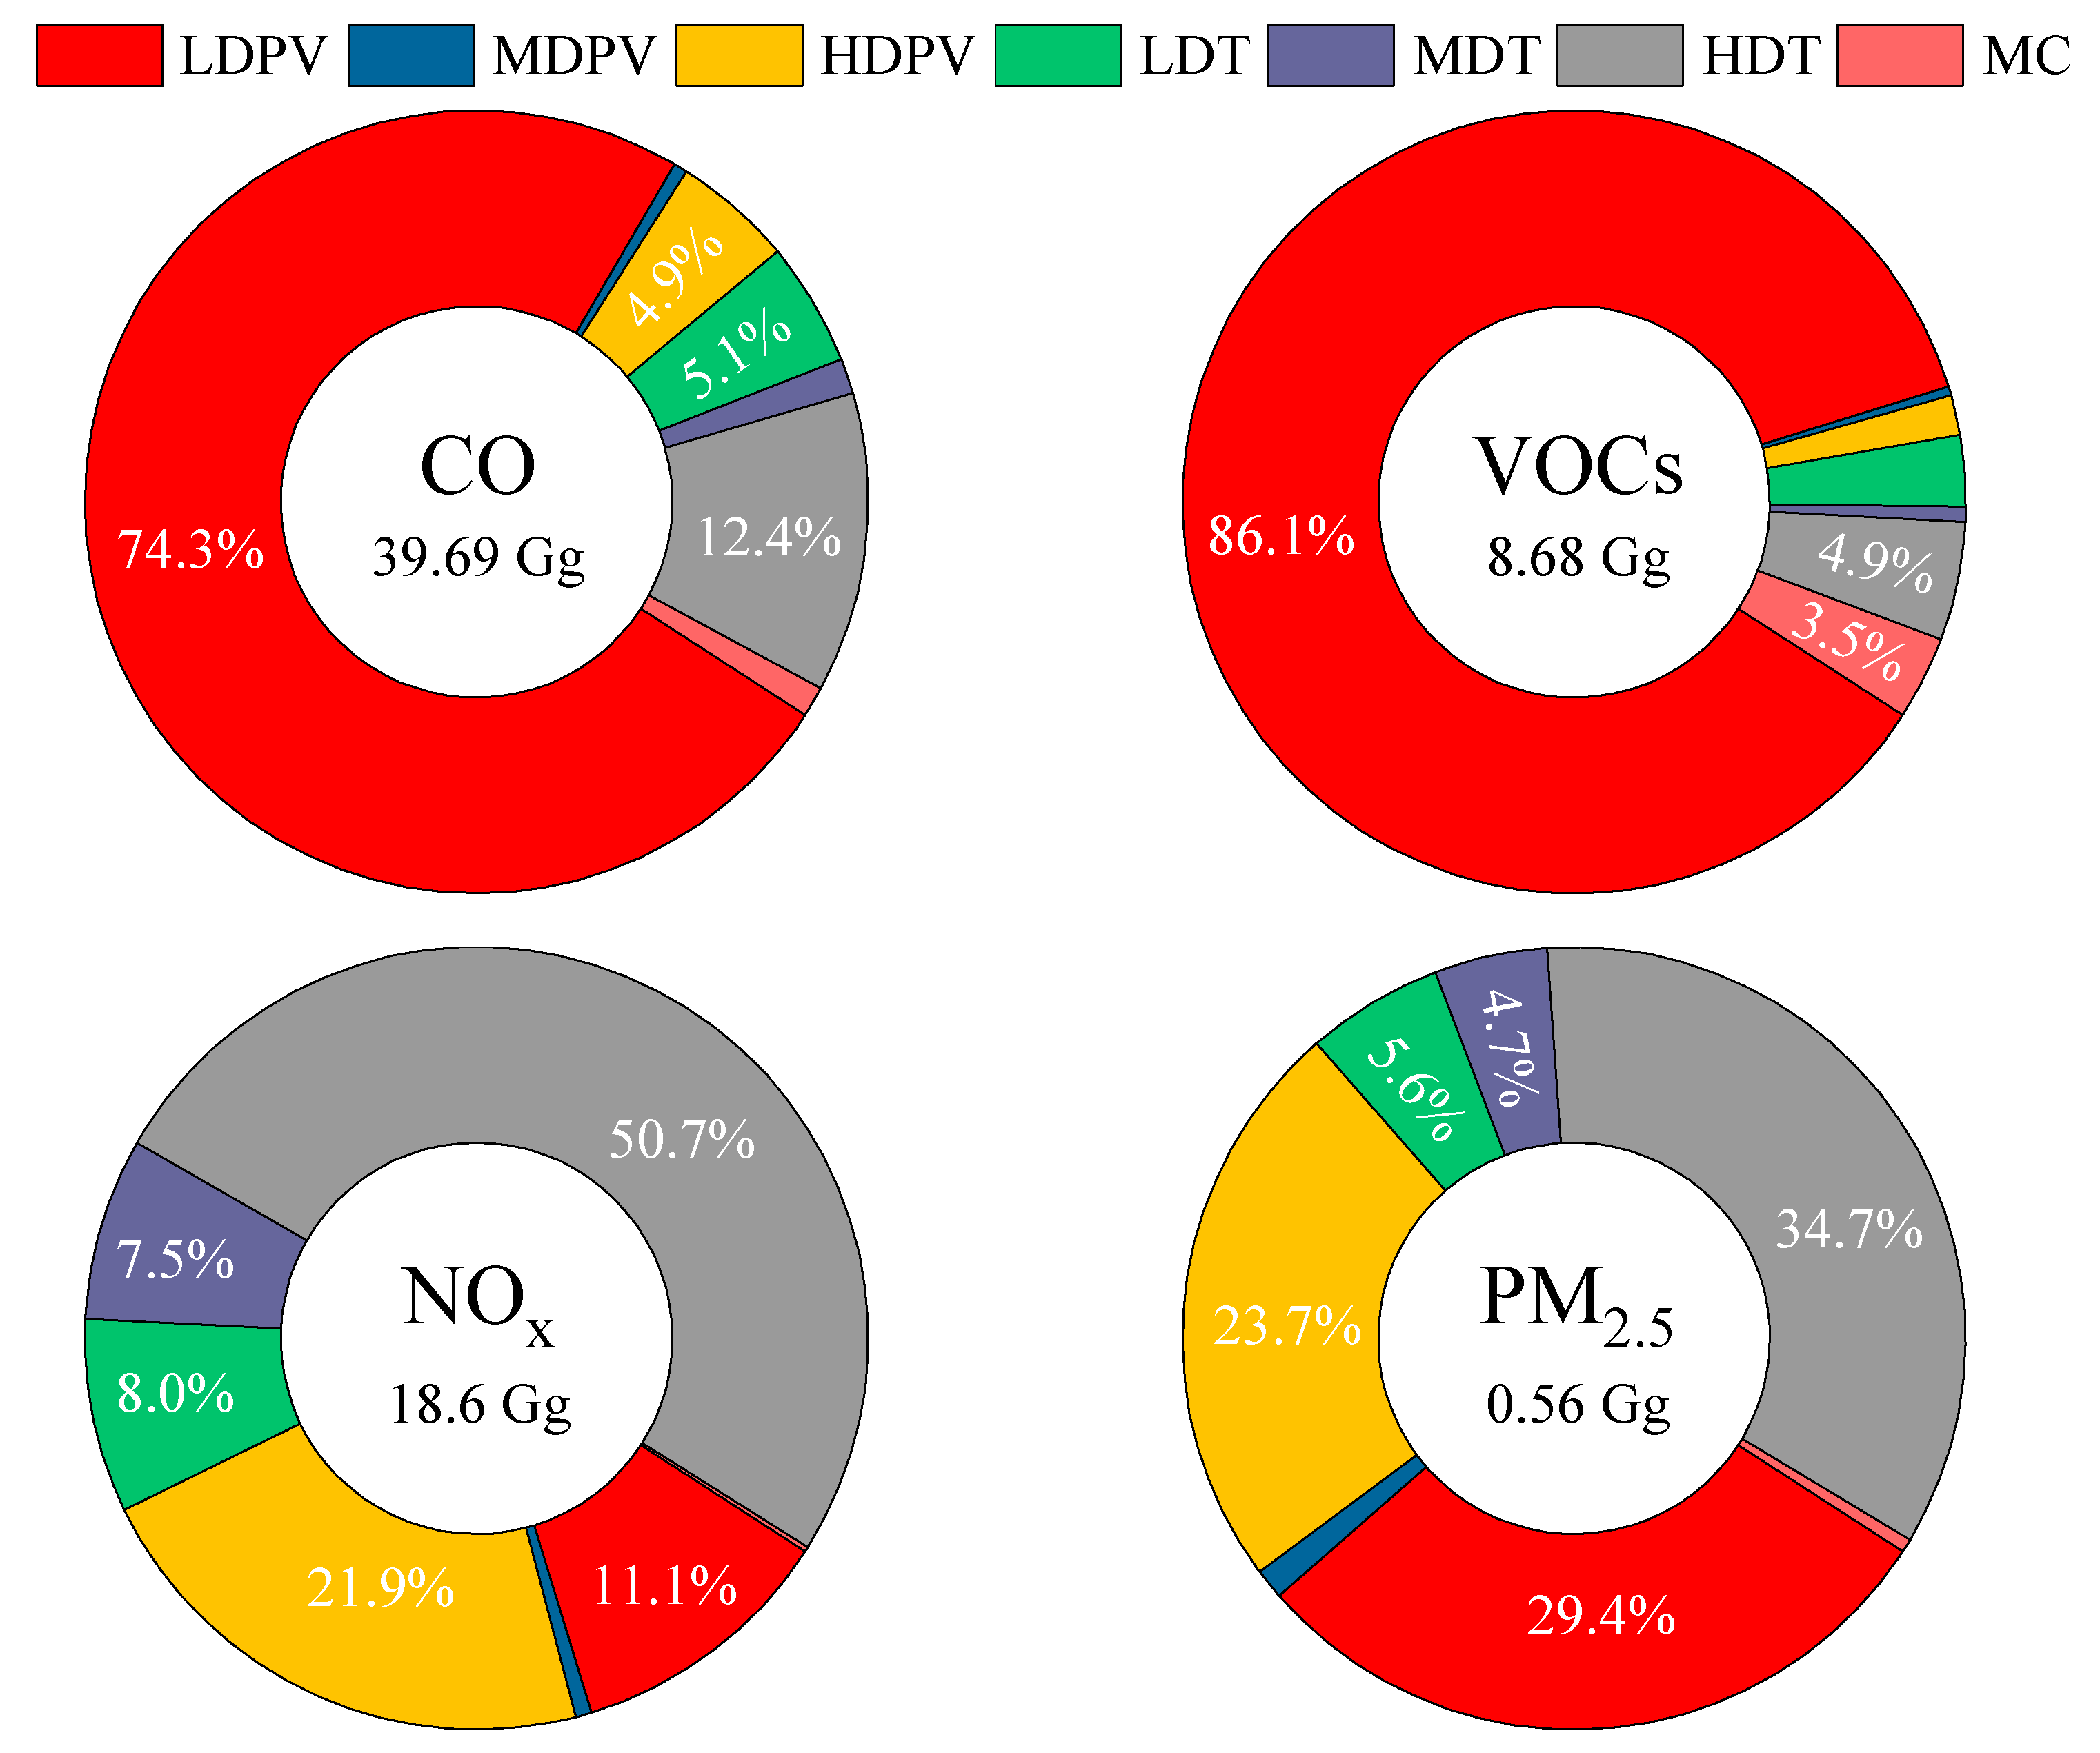
3.1. Total Emissions and Composition

The vehicle emission inventory for Changzhou was developed using the methodology described in Section 2. In 2022, the total emissions of CO, VOCs, NOx, and PM2.5 in Changzhou were 39.69, 8.68, 18.6, and 0.56 Gg, respectively (see Figure 5). Nationally, Changzhou is a medium-sized city with lower vehicle emissions than large cities, such as Beijing [40] and Tianjin [6], but higher than small cities, such as Laiwu and Hebi [41]. Within Jiangsu Province, Changzhou ranks sixth (out of a total of 13 cities) in terms of vehicle emissions [25], placing it at a medium level.
The main contributing vehicle types differ for different pollutants. LDPVs are the main source of CO and VOCs emissions, accounting for 74.3% of CO emissions and an even higher contribution of 86.1% for VOCs emissions. LDPVs are also the second largest source of PM2.5 emissions and the third largest source of NOx emissions, with shares of 29.4% and 11.1%, respectively. The notable contribution of LDPVs to emissions is due to their significant share of the vehicle population, up to 90.8%. Comparable results can be found in previous studies [41]. There is a strong correlation between vehicle population and economic development. Over the past decade, Changzhou’s economy has grown rapidly, and as a result, the LDPV population, especially private cars, has experienced explosive growth, which inevitably increases emissions.
Although HDTs account for only 1.50% of the total vehicle population, they are the main source of NOx and PM2.5 emissions, accounting for 50.7% and 34.7%, respectively. The contribution of HDTs to CO and VOCs emissions is slightly lower at 12.4% and 4.9%, respectively, but still significantly higher than their share of the population. This significant emission contribution of HDTs can be attributed to two main factors. First, HDTs have comparatively high emission factors. Second, the VKT of HDTs has increased due to the rapid growth of freight transport in recent years. Previous studies on multi-year vehicle emission inventories generally assume a gradual increase in the VKT of HDTs, which is in line with the continuous development of the socio-economy and transportation. Overall, the conclusion that HDTs are a critical vehicle type in transportation pollution control is consistent with previous studies [42].
HDPVs are also a significant source of emissions, contributing 21.9% and 23.7% to NOx and PM2.5, respectively, and 4.9% and 1.7% to CO and VOCs, respectively. These contributions are much higher than their population share of 0.26%. HDPVs, mainly buses, have the highest NOx and PM2.5 emission factors and VKTs among all vehicle types. Buses, which operate more than 10 hours a day, cover long distances. At the same time, they make frequent stops, resulting in lower speeds and higher emission factors. Considering the increasing popularity of public transportation, the use of new energy buses should be vigorously promoted through financial incentives, the construction of charging infrastructure, and the phasing out of diesel vehicles to reduce HDPV emissions.
LDTs contribute 5.1%, 2.9%, 8.0%, and 5.6% to CO, VOCs, NOx, and PM2.5 emissions, respectively. MDTs contribute 7.5% and 4.7% to NOx and PM2.5 emissions, respectively, which is comparable to the contribution of LDTs. Currently, while the electrification of HDTs faces challenges, such as range, battery weight, and charging infrastructure, the electrification of LDTs and MDTs is well underway. According to policies released by the Ministry of Industry and Information Technology [43], China aims to increase the electrification rate in the fields of short-distance transportation and urban construction, mainly involving LDTs and MDTs.

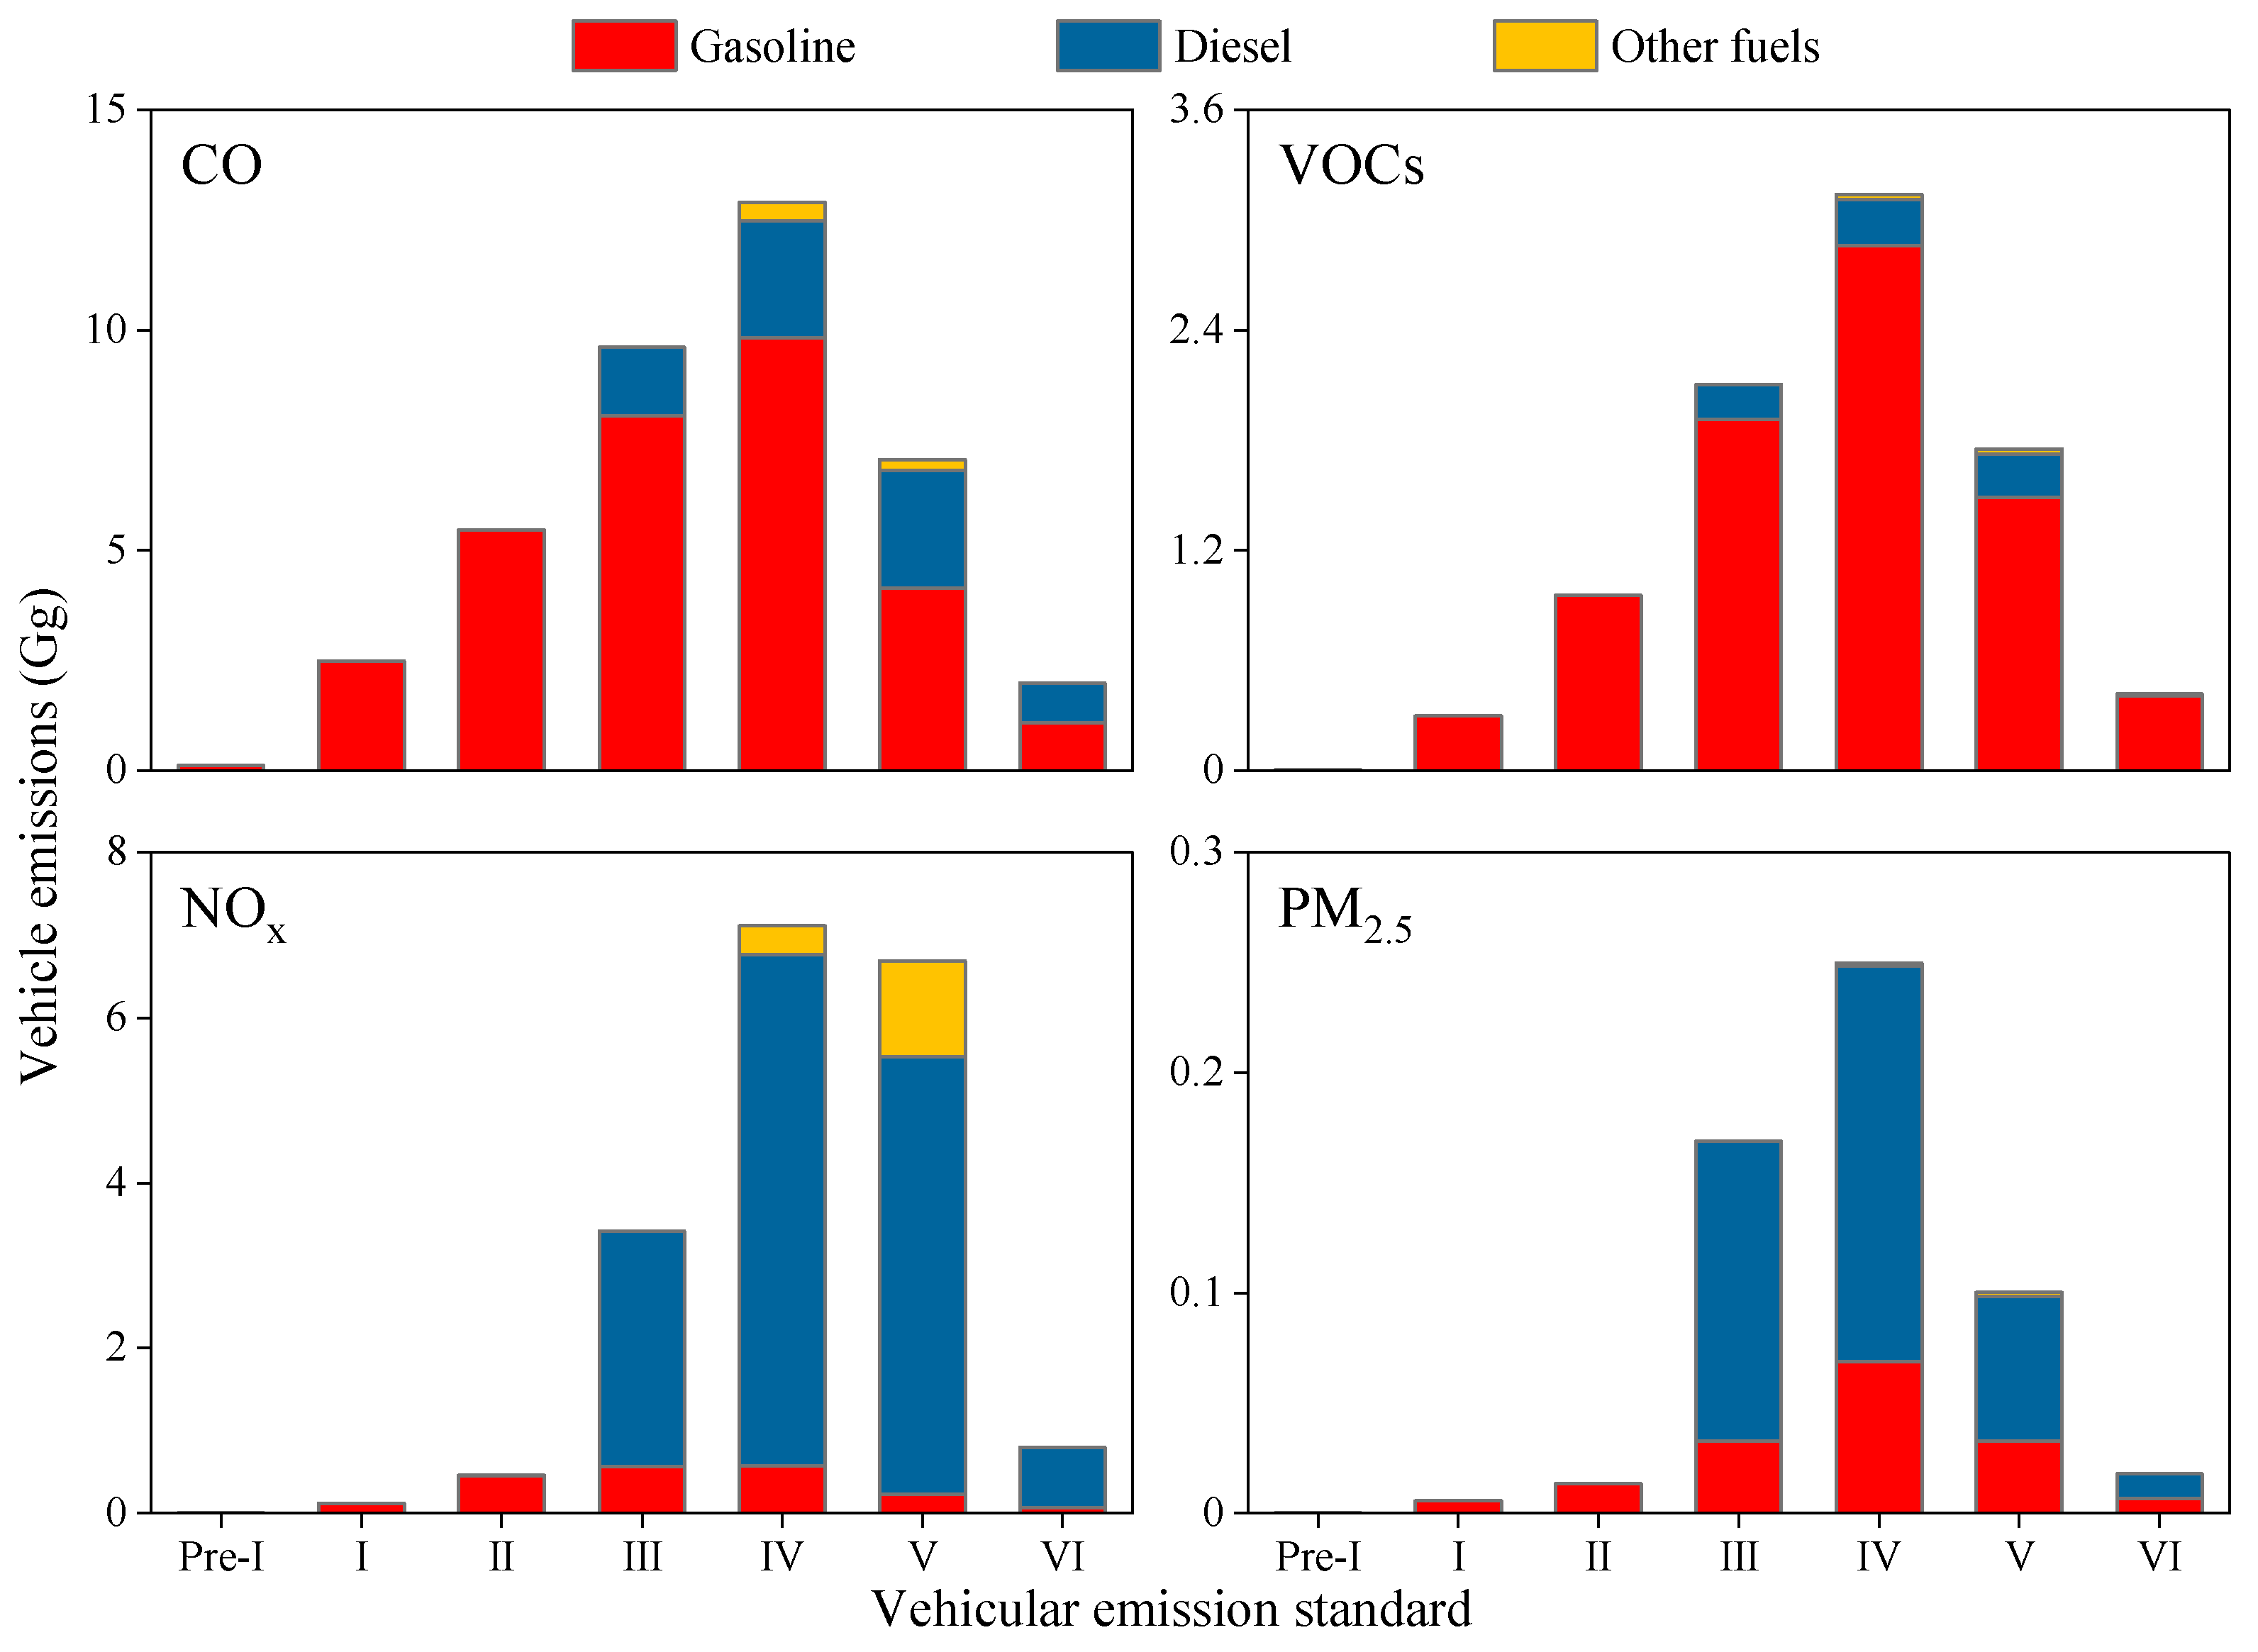
3.2. Emissions by Fuel and Standard

There are significant differences in vehicle emissions by fuel type and emission standard (see Figure 6).
Although China has implemented measures, such as car purchase subsidies and unrestricted driving policies, to encourage the purchase of new energy vehicles, the population of fuel-powered vehicles remains significant. Consequently, the majority of pollutants are emitted from gasoline and diesel vehicles.
Gasoline vehicles are the primary source of CO and VOCs emissions, accounting for 78.6% and 91.4% of the total, respectively. Specifically, VOCs emissions encompass both exhaust emissions (accounting for 53.4%) and evaporative emissions (46.6%), with their respective contribution rates being relatively close. This is consistent with the findings of Yan et al. (2021) [44]. On the other hand, diesel vehicles are the main contributors to NOx and PM2.5 emissions, responsible for 81.1% and 70.6% of the total, respectively. This is due to the high proportion of diesel vehicles among HDPVs (over 50%) and HDTs (almost all) [45]. The inherent characteristics of gasoline and diesel engines lead to distinct emission patterns. Diesel engines, with their compression ignition and diffusion combustion processes, promote complete combustion, but tend to emit higher levels of NOx and PM2.5. In contrast, gasoline engines rely on spark ignition of the air–fuel mixture, which can result in incomplete combustion and higher emissions of CO and VOCs.
China IV vehicles were found to be the largest contributors to emissions, with CO, VOCs, NOx, and PM2.5 emissions of 12.90, 3.14, 7.11, and 0.25 Gg, respectively. These emissions accounted for 32.5%, 36.2%, 38.2%, and 44.9% of the total, respectively. Specifically, China IV gasoline vehicles were the primary emitters of CO and VOCs, accounting for 24.7% and 33.0% of the total, respectively. China IV diesel vehicles, on the other hand, were the primary emitters of NOx and PM2.5 emissions, accounting for 33.3% and 32.3%, respectively.
Previous studies generally identified China III vehicles as the primary emission source for most pollutants. However, in this study, China III vehicles were found to be the secondary emission source of CO, VOCs, and PM2.5, accounting for 24.2%, 24.3%, and 30.4% of the total, respectively. The higher emission contribution of China IV vehicles compared to China III vehicles is mainly attributable to the updated emission standards. The implementation of these standards has accelerated the phase-out of vehicles with lower emission standards, leading to overall lower emissions. Meanwhile, China V vehicles were found to be the secondary source of NOx emissions, contributing 35.9% to the total. Notably, China V HDTs were the top NOx emitters among all vehicle types, accounting for 20.8% of the total. This is due to the fact that the NOx emission factor for HDTs did not decrease as significantly as that for other pollutants with the emission standard update.
Old vehicles (including those meeting pre-China I, China I, and China II standards) constitute 5.0% of the vehicle population but contribute significantly to CO and VOCs emissions, accounting for 20.4% and 14.6% of the total, respectively. However, their contribution to NOx and PM2.5 emissions is relatively low, accounting for only 3.1% and 3.5% of the total, respectively. This indicates that phasing out old vehicles remains an effective measure to reduce CO and VOCs emissions in the short to medium term. The low contributions of NOx and PM2.5 emissions from old vehicles can be attributed to the high scrapping rates of older heavy diesel vehicles, especially HDPVs and HDTs.
China VI vehicles emitted significantly lower amounts of pollutants compared to their population share of 13.4%. Specifically, they emitted 2.00, 0.42, 0.80, and 0.02 Gg of CO, VOCs, NOx, and PM2.5, respectively, representing only 5.0%, 4.8%, 4.3%, and 3.2% of the total. This reflects the importance of continuously upgrading emission standards to reduce vehicle emissions.

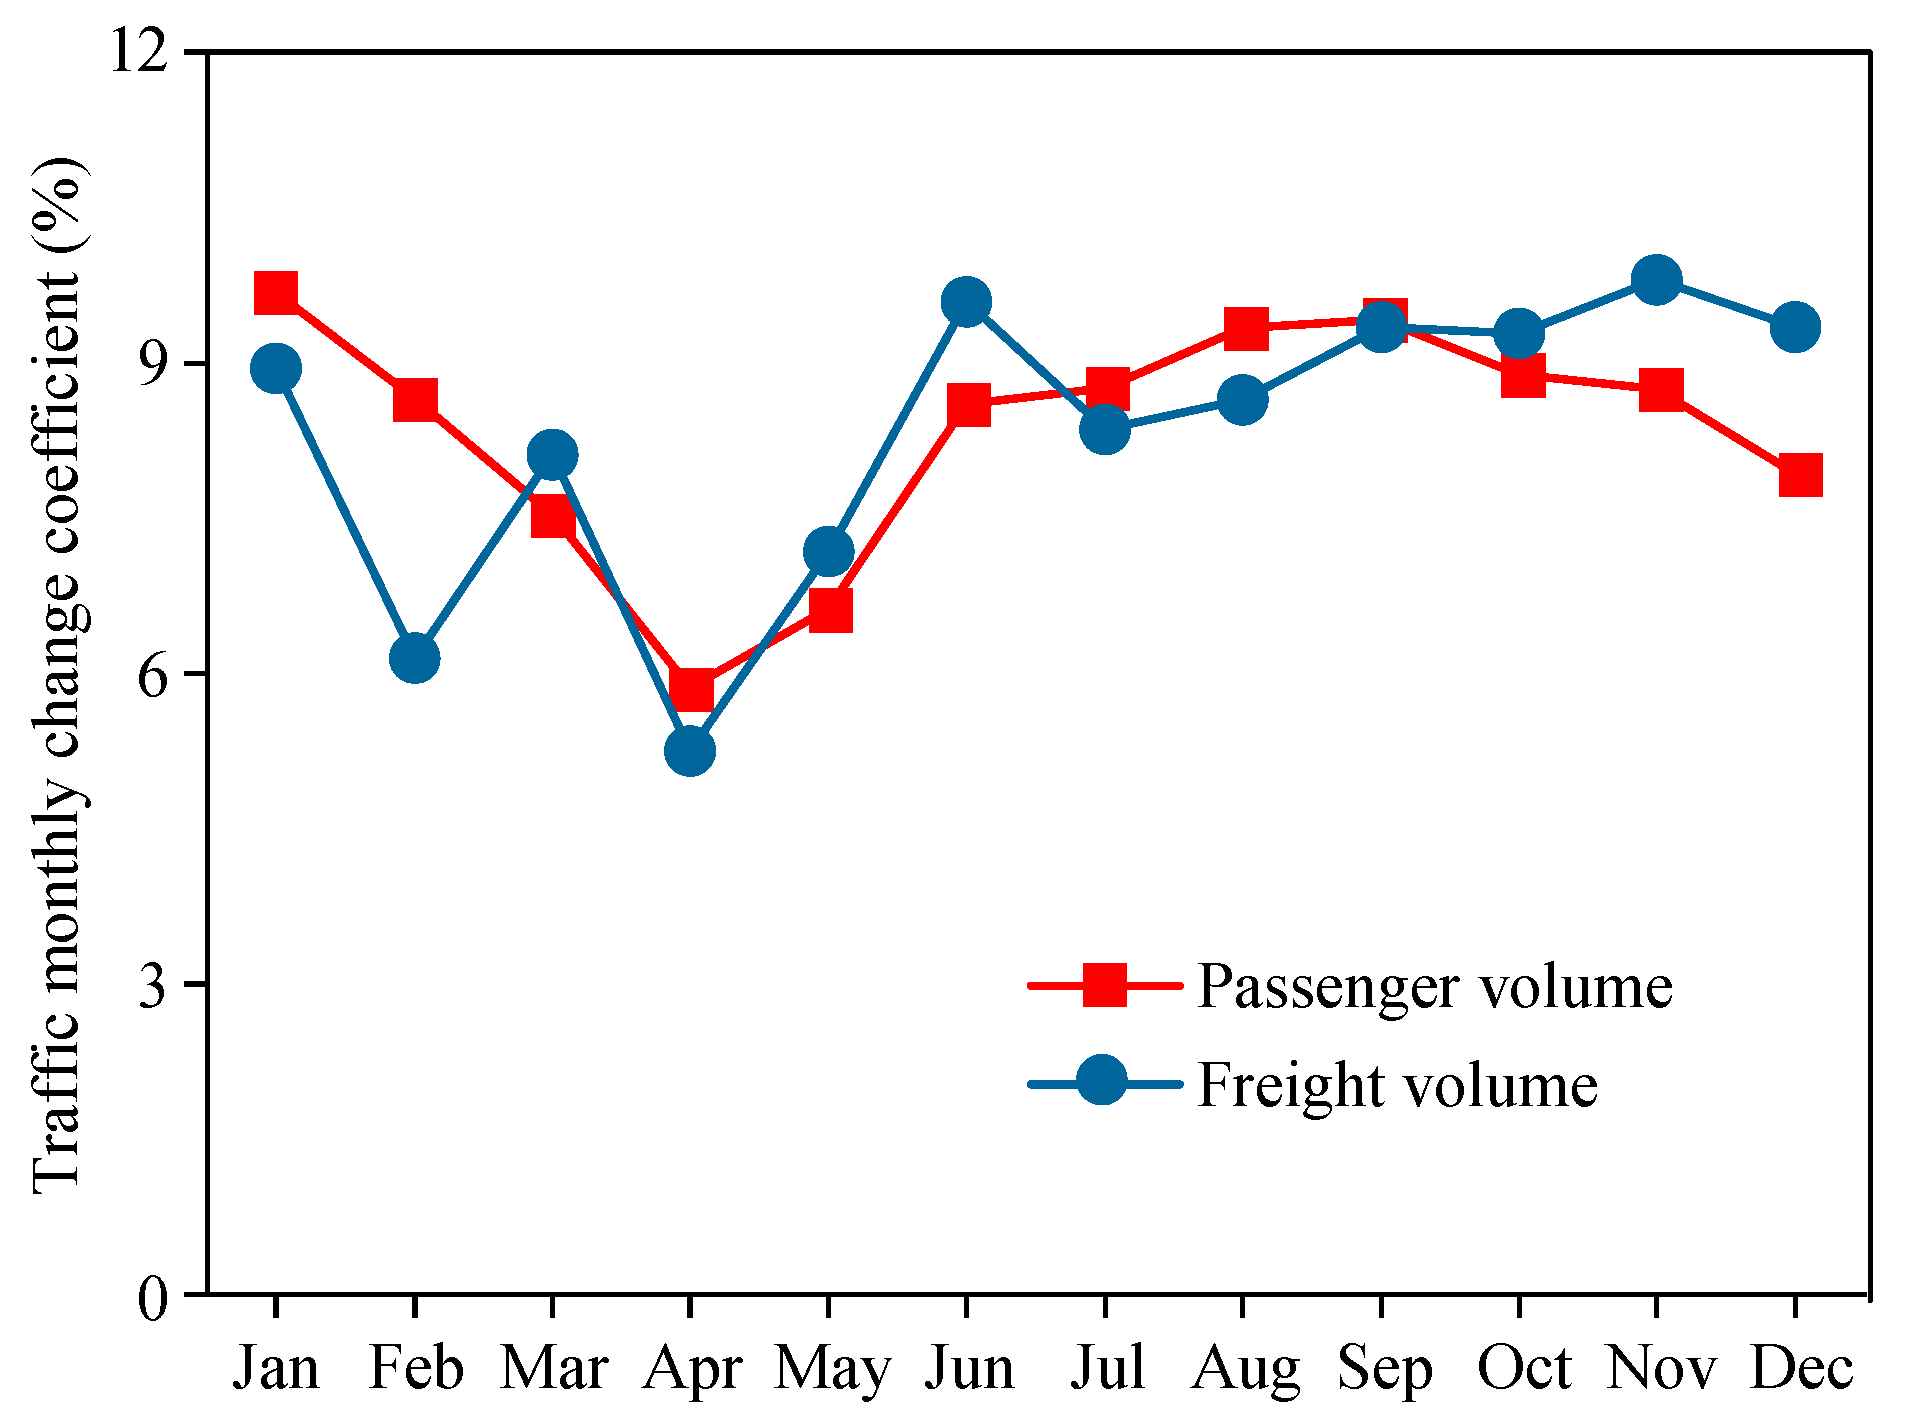
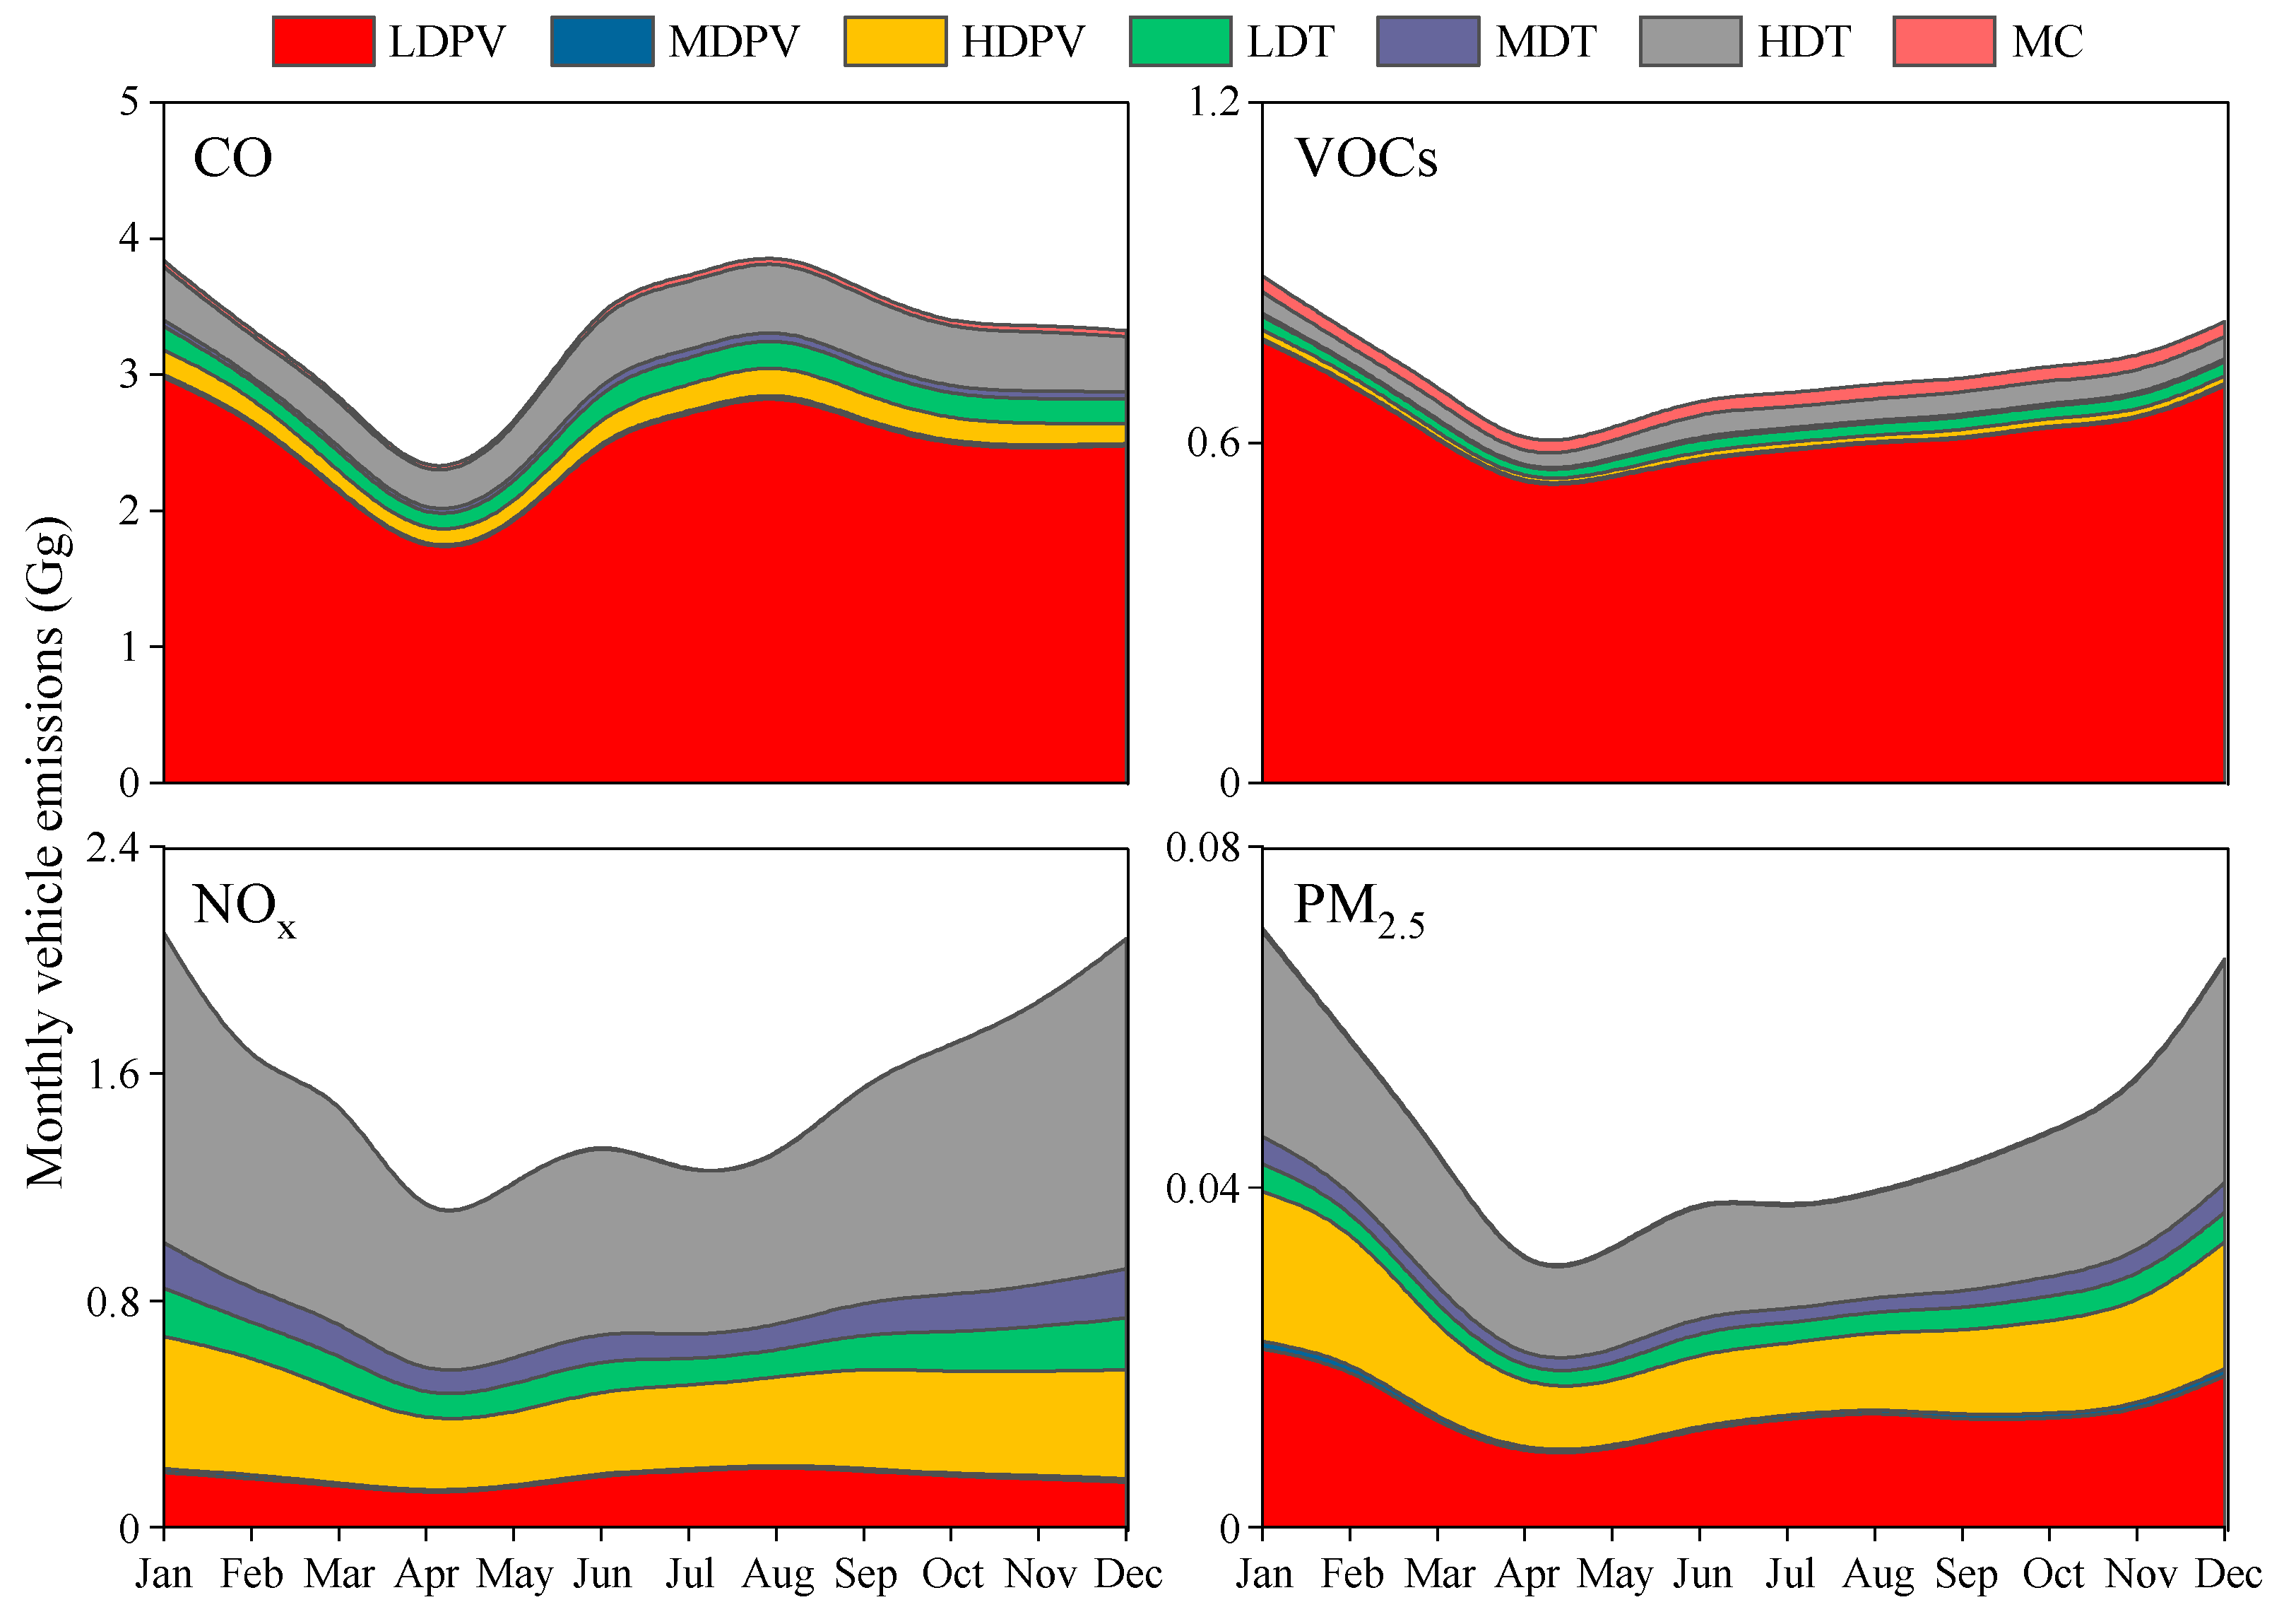
3.3. Monthly Vehicle Emissions

Vehicle emissions vary considerably from month to month, but they show certain consistent trends in terms of pollutant patterns (see Figure 7). Specifically, the emissions of CO, VOCs, and PM2.5 closely follow changes in passenger volume, as evidenced by correlation coefficients of 0.96, 0.66, and 0.50, respectively. This indicates a predominant influence of passenger vehicles on these emission variations. Meanwhile, a notable correlation, denoted by a coefficient of 0.58, links monthly NOx emissions with freight volume trends, indicating that trucks play a significant role in determining emission changes.
Regarding monthly emissions, August stood out with the highest CO emissions of 3.95 Gg, representing 10.0% of the annual total. Meanwhile, January had the highest emissions of VOCs (0.89 Gg, 10.3% annual share), NOx (2.10 Gg, 11.3%), and PM2.5 (0.07 Gg, 12.7%). In contrast, April recorded the lowest emissions for all four pollutants: CO (2.16 Gg, 5.4% annual share), VOCs (0.58 Gg, 6.7%), NOx (1.01 Gg, 5.4%), and PM2.5 (0.03 Gg, 5.1%).
Overall, vehicle emissions tend to be higher in winter due to increased cold-start emissions at lower temperatures. However, an interesting exception occurred from January to February, when emissions decreased despite colder weather. This can be attributed to the reduced social activity and transportation demand during the Spring Festival in February.
Previous studies have often relied on annual emissions and temporal surrogates, such as traffic volume, to derive monthly emissions. Such approaches might lead to the conclusion that February, with its fewer days and the Spring Festival holiday, has the lowest emissions [5]. However, this study incorporated monthly meteorological conditions into the emission factor simulations, providing a more accurate representation of the impact of temperature and humidity changes on emissions. As a result, it became evident that February is not necessarily the month with the lowest emissions due to increased emission factors in winter. It is noteworthy that April showed exceptionally low vehicle emissions, a phenomenon rarely reported in previous studies. In general, the period from March to May marks a period of industrial prosperity, with an expected increase in road transportation volume compared to February. However, in 2022, the COVID-19 pandemic broke out in the YRD region. Due to the interconnected economies and industries within the YRD region, road transportation volumes are typically high. However, the implementation of pandemic prevention and control policies restricted the vehicle travel, resulting in a significant decrease in transportation volumes. Wang et al. (2023) reported that the daily transportation capacity in Jiangsu Province decreased by 14.3% from March to May compared to the previous year, with the largest decrease occurring in April [46]. This finding is consistent with our study’s conclusion of a significant emissions decrease in April. This underscores the complexity of vehicle emission processes, which are influenced by a variety of interacting factors, making it difficult to accurately characterize emission changes by considering only individual factors.

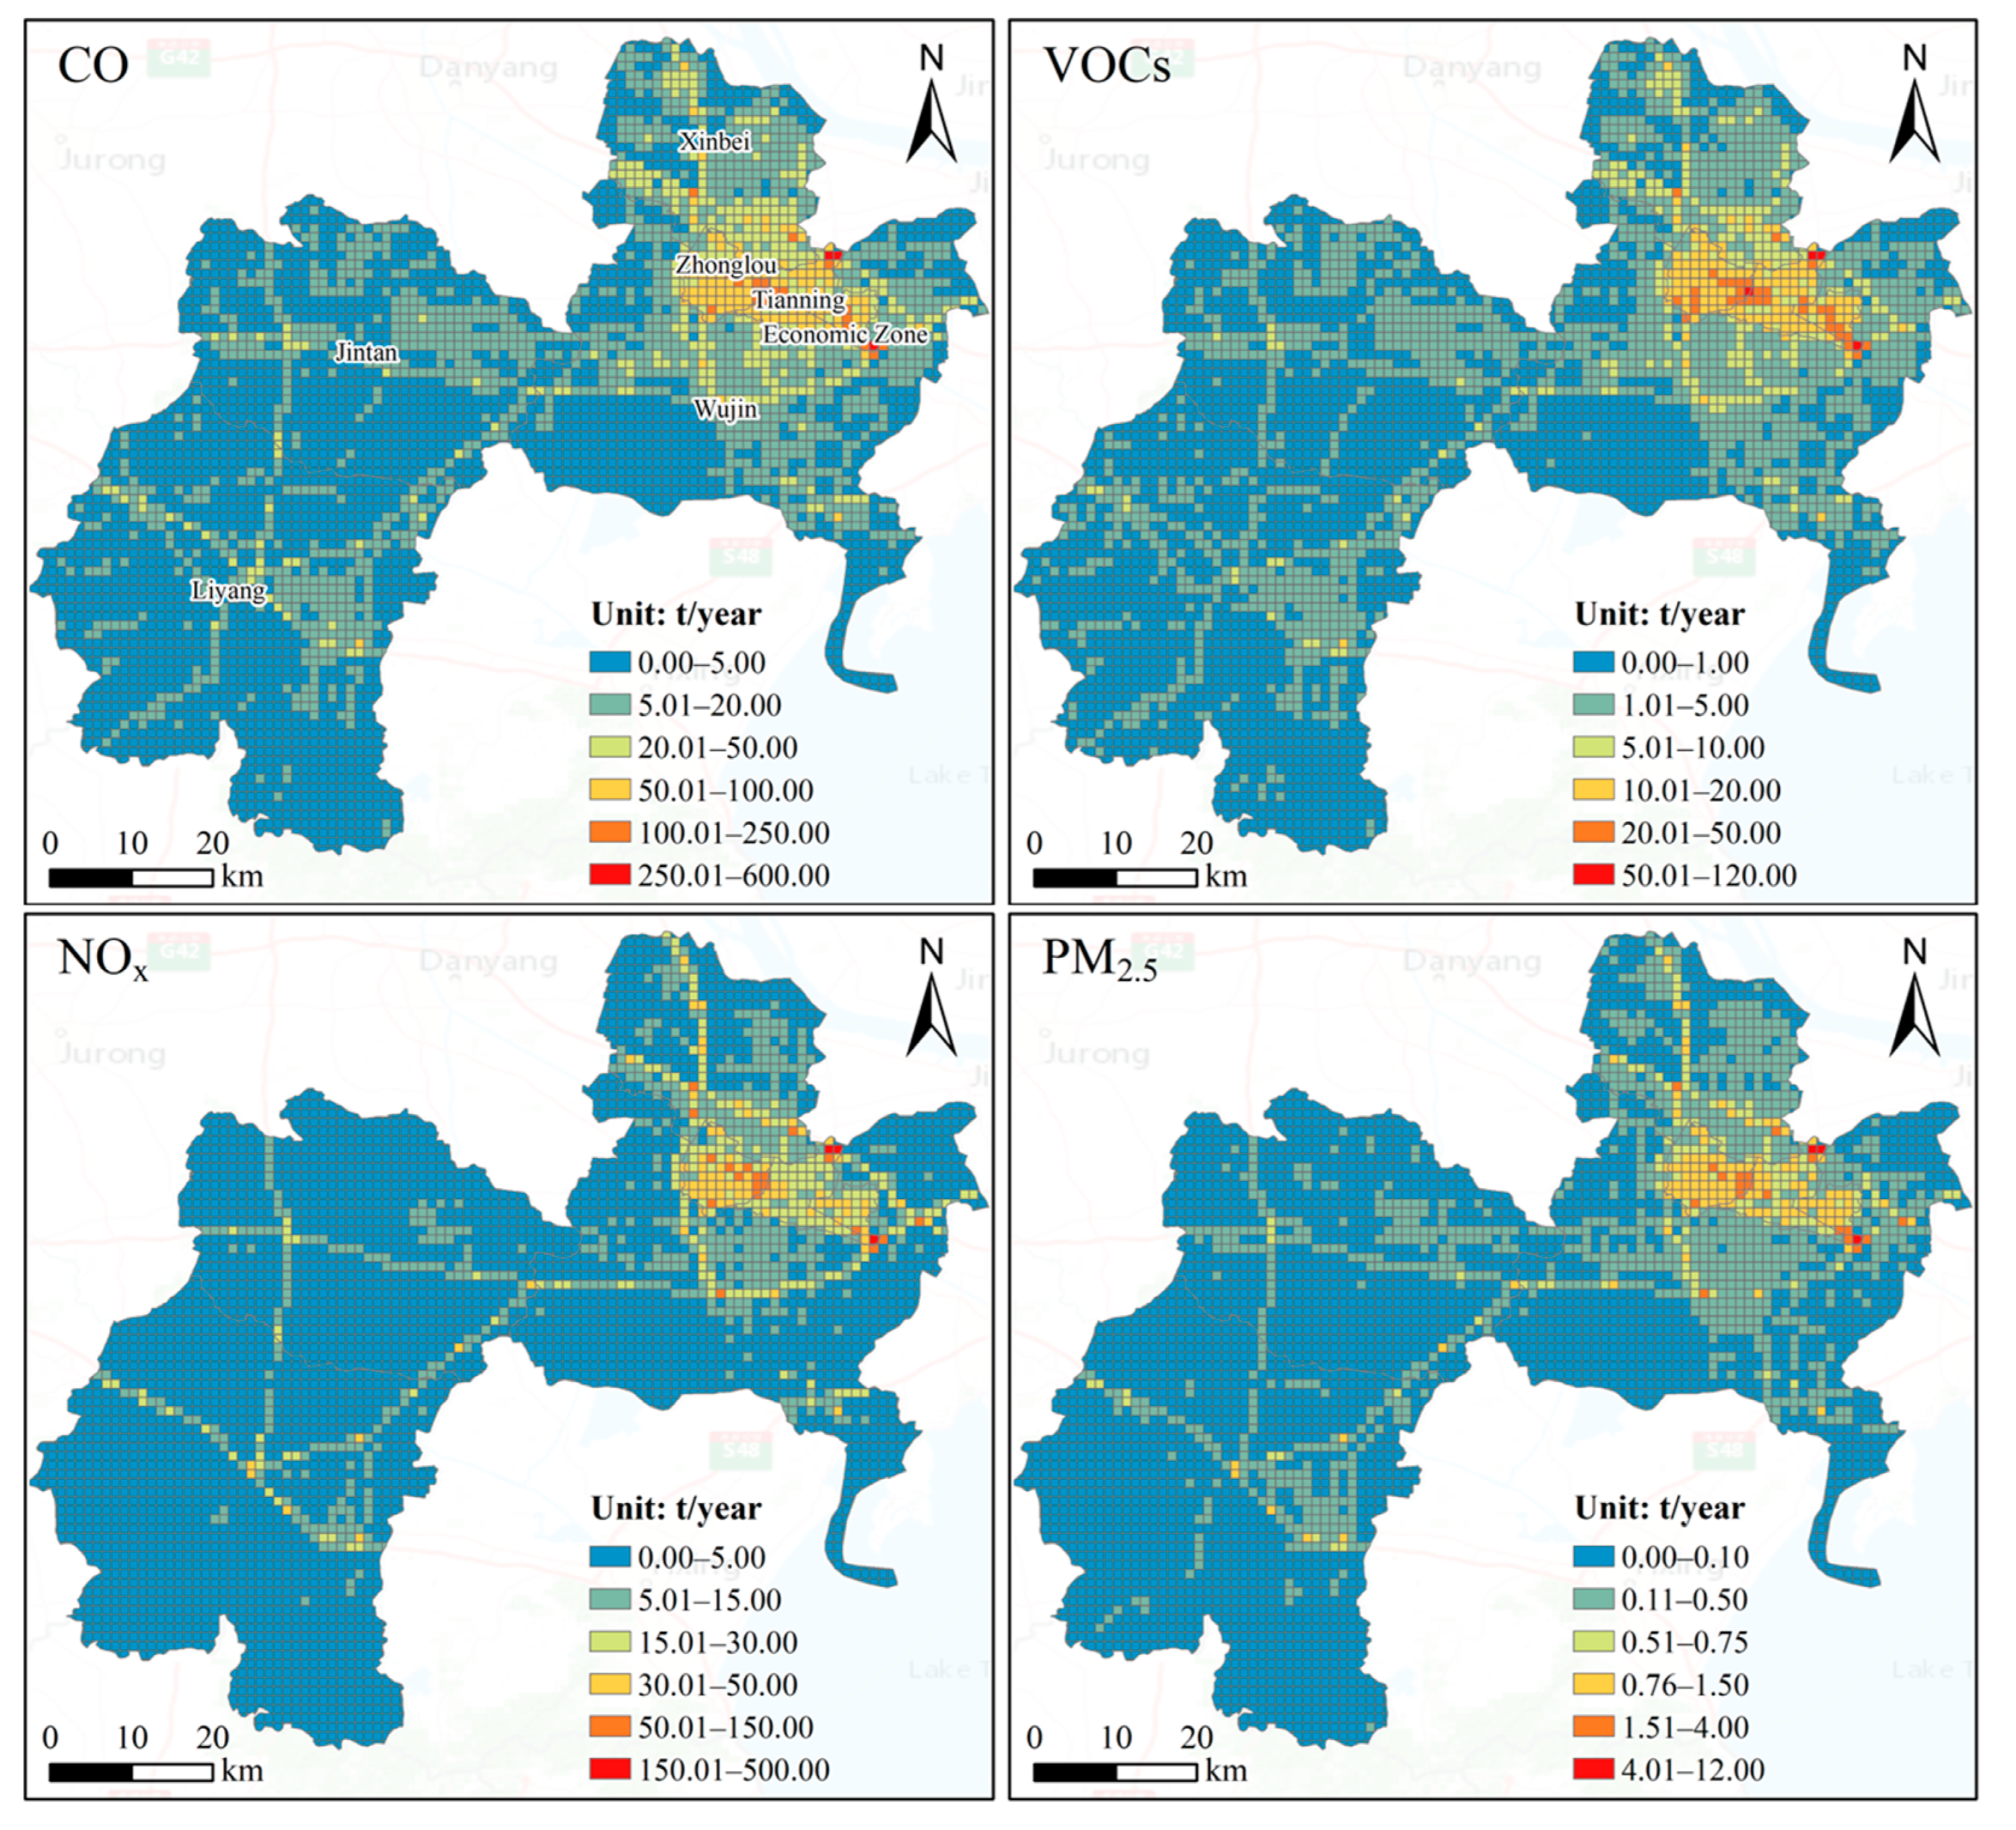
3.4. Spatial Distribution Characteristics

There is obvious heterogeneity in the spatial distribution of vehicle emissions in Changzhou (see Figure 8). The emission intensity is higher in the northeast of Changzhou, especially concentrated in Zhonglou District, Tianning District, and the Economic Zone, whereas it is lower in the west and south, with emissions more scattered in Jintan District and Liyang City.
The spatial distribution of different pollutant emissions exhibits several common characteristics [47]. Firstly, the gridded emissions are superimposed on the road network and show linear characteristics. Secondly, high emission grids tend to be concentrated in the city centers, with emission intensity decreasing as the distance from these centers increases. Lastly, emission intensity varies by road type, being significantly higher on highways and arterials compared to streets.
However, subtle differences exist in the spatial distribution of various pollutants, mainly influenced by the driving patterns of the main emission contributors. CO and VOCs emissions, mainly from LDPVs, are evenly distributed throughout the region due to the widespread presence of these vehicles on streets. Conversely, HDTs, which are the main contributors to NOx and PM2.5 emissions, often operate on highways and arterials. As a result, the distribution of NOx and PM2.5 emissions tends to be more uneven and linear, reflecting the concentrated nature of these roadways.
Specifically, the distribution of vehicle emissions varies by road type. CO and VOCs emissions are predominantly emitted from streets (52.3% and 57.2%, respectively), followed by arterials (26.9% and 25.3%) and highways (20.8% and 17.5%). In contrast, NOx emissions are higher on arterials and highways (37.5% and 34.9%, respectively) and lower on streets (27.5%). Regarding PM2.5 emissions, the highest contribution is observed on streets (37.7%), with relatively small differences observed on arterials and highways (33.0% and 29.3%, respectively).
Previous studies have used various spatial surrogates to allocate vehicle emissions to grids, such as GDP [48], population [49], and road density [24]. While these surrogates provide a partial picture of the spatial distribution of emissions, they could not reflect the comprehensive characteristics of economic activities, road networks, and driving patterns. In this study, emissions were initially allocated to districts based on socioeconomic indicators, followed by a more refined allocation to grids that take into account the road network and travel frequency. The resulting gridded emissions not only closely follow with the road network but also distinguish between different road types. Overall, the methodology employed in this study offers a more accurate representation of spatial emissions’ data than relying on a single spatial surrogate.

3.5. Uncertainty Analysis

Uncertainty in vehicle emission inventories often results from inadequate data on local vehicle populations, VKT, and emission factors. The vehicle population data obtained from local authorities in this study were deemed highly reliable. However, differentiating the vehicle population based on emission standards using the registration date and standard implementation date inevitably introduced uncertainty. VKT and emission factors, influenced by various factors, such as economic development, transportation facilities, and driving conditions, are difficult to accurately simulate.
To improve the accuracy of emission inventories, this study estimated vehicle emissions using monthly VKT and emission factors. Monthly emission factors were simulated with an improved GEI model, utilizing monthly meteorological data to reduce uncertainty. Monthly VKT was derived by disaggregating annual VKT based on the monthly transportation volume. Although this methodology has been employed in previous studies, further validation of its accuracy is warranted.
Taking into account road networks, socioeconomic indicators, and driving patterns, a gridded emission inventory with a resolution of 0.01° × 0.01° was obtained. This gridded emission inventory depicted the spatial distribution of vehicle emissions well, but its accuracy still needs to be validated through integration with air quality modeling and monitoring data.
To ascertain the reliability of the emission inventory, this study compared its results with those from previous studies on vehicle emissions in Changzhou (see Table 3). Despite utilizing differing methodologies and data sources, these studies showed good agreement in their calculation results. In recent years, the vehicle population in Changzhou has increased rapidly, but emissions have decreased. Our results are in close agreement with the 2020 emission inventory [50], where VOCs emissions were 5.2% higher and NOx emissions were 16.0% lower. Compared to the 2018 emissions [25], CO, VOCs, NOx, and PM2.5 emissions were 32.7%, 24.1%, 56.1%, and 62.3% lower, respectively. This decrease in vehicle emissions can be attributed to the policies implemented in Changzhou, including upgrading emission standards, improving fuel quality, and scrapping older vehicles. Future studies should focus on discrepancies in emission inventories due to different methodologies, and quantitatively assess the influence of factors such as data collection and methodological application on these discrepancies.

4. Conclusions

This study presented an approach to develop a high-resolution monthly vehicle emission inventory. Using this approach, we developed a vehicle emission inventory for Changzhou in 2022. The emission estimation was based on the vehicle population obtained from the vehicle registration database, VKT calculated from the monthly transportation volume, and emission factors simulated according to the monthly meteorological conditions. We developed a high-resolution gridded emission inventory with a resolution of 0.01° × 0.01°, considering socioeconomic indicators, mileage weight, emission intensity, and road length.
In 2022, the total vehicle emissions of CO, VOCs, NOx, and PM2.5 in Changzhou were 39.69, 8.68, 18.6, and 0.56 Gg, respectively. LDPVs were the main source of CO and VOCs emissions, while HDTs were a significant source of NOx and PM2.5 emissions. CO and VOCs emissions mainly came from gasoline vehicles, while diesel vehicles were the primary source of NOx and PM2.5 emissions. China IV vehicles were the largest contributors to emissions. Despite the small population of older vehicles, their emissions contribution was comparatively significant.
In terms of temporal variation, vehicle emissions were higher in winter than in other seasons. The lowest emissions of CO, VOCs, NOx, and PM2.5 occurred in April, mainly due to the COVID-19 pandemic prevention and control policies. Regarding spatial variation, the emission intensity was higher in the northeast of Changzhou and lower in the west and south. The gridded emissions exhibited linear characteristics, were concentrated in urban centers, and varied depending on the road type.
The results of this study are consistent with previous studies, indicating the reliability of the proposed method. However, further validation with additional methods and data is necessary to determine the extent to which the emission inventory reflects actual vehicle emissions. In future studies, we recommend combining emission inventories with air quality models to compare simulated pollutant concentration results with monitoring data. Furthermore, it is crucial to analyze the differences in calculation results arising from different emission inventory methods and to quantify the impact of influencing factors on these differences.

Author Contributions

Conceptualization, M.G., M.N., S.S. and Y.B.; data curation, M.G., C.X., R.Z. and J.Z.; formal analysis, M.G., S.S. and G.Z.; funding acquisition, M.N.; investigation, L.Z. and J.Z.; methodology, M.G., M.N., S.S. and L.Z.; project administration, G.Z., C.C. and Y.B.; resources, R.Z. and Z.J.; supervision, Y.B.; validation, C.X.; visualization, S.S. and Y.L.; writing—original draft, M.G.; writing—review and editing, S.S. All authors have read and agreed to the published version of the manuscript.

Funding

This work was funded by the National Key R&D Program of China (2022YFC3702002), the Major Project of High-Resolution Earth Observation System (30-Y60B01-9003-22/23), the Joint Research Project of Ecological Protection and High-Quality Development in the Yellow River Basin (2022-YRUC-01-0406), and the National Natural Science Foundation of China (42375094 and 72274106).

Institutional Review Board Statement

Not applicable.

Informed Consent Statement

Not applicable.

Data Availability Statement

The datasets generated and analyzed in this study are available from the corresponding author upon reasonable request.

Acknowledgments

The authors would like to express our heartfelt appreciation to the reviewers and editors who contributed insightful suggestions that helped improve the paper’s quality.

Conflicts of Interest

The authors declare no conflicts of interest.

References

  1. Zhang, Q.; Zheng, Y.; Tong, D.; Shao, M.; Wang, S.; Zhang, Y.; Xu, X.; Wang, J.; He, H.; Liu, W.; et al. Drivers of Improved PM2.5 Air Quality in China from 2013 to 2017. Proc. Natl. Acad. Sci. USA 2019, 116, 24463–24469. [Google Scholar] [CrossRef]
  2. Li, S.; Wang, S.; Wu, Q.; Zhang, Y.; Ouyang, D.; Zheng, H.; Han, L.; Qiu, X.; Wen, Y.; Liu, M.; et al. Emission Trends of Air Pollutants and CO2 in China from 2005 to 2021. Earth Syst. Sci. Data 2023, 15, 2279–2294. [Google Scholar] [CrossRef]
  3. Cheng, J.; Tong, D.; Liu, Y.; Geng, G.; Davis, S.J.; He, K.; Zhang, Q. A Synergistic Approach to Air Pollution Control and Carbon Neutrality in China Can Avoid Millions of Premature Deaths Annually by 2060. One Earth 2023, 6, 978–989. [Google Scholar] [CrossRef]
  4. National Bureau of Statistics. National Data. Available online: http://data.stats.gov.cn/ (accessed on 9 January 2024).
  5. Liu, G.; Sun, S.; Zou, C.; Wang, B.; Wu, L.; Mao, H. Air Pollutant Emissions from On-Road Vehicles and Their Control in Inner Mongolia, China. Energy 2022, 238, 121724. [Google Scholar] [CrossRef]
  6. Sun, S.; Sun, L.; Liu, G.; Zou, C.; Wang, Y.; Wu, L.; Mao, H. Developing a Vehicle Emission Inventory with High Temporal-Spatial Resolution in Tianjin, China. Sci. Total Environ. 2021, 776, 145873. [Google Scholar] [CrossRef]
  7. Sun, S.; Jiang, W.; Gao, W. Vehicle Emission Trends and Spatial Distribution in Shandong Province, China, from 2000 to 2014. Atmos. Environ. 2016, 147, 190–199. [Google Scholar] [CrossRef]
  8. Cai, H.; Xie, S. Estimation of Vehicular Emission Inventories in China from 1980 to 2005. Atmos. Environ. 2007, 41, 8963–8979. [Google Scholar] [CrossRef]
  9. Cai, H.; Xie, S. Temporal and Spatial Variation in Recent Vehicular Emission Inventories in China Based on Dynamic Emission Factors. J. Air Waste Manag. Assoc. 2013, 63, 310–326. [Google Scholar] [CrossRef] [PubMed]
  10. Zheng, B.; Huo, H.; Zhang, Q.; Yao, Z.L.; Wang, X.T.; Yang, X.F.; Liu, H.; He, K.B. High-Resolution Mapping of Vehicle Emissions in China in 2008. Atmos. Chem. Phys. 2014, 14, 9787–9805. [Google Scholar] [CrossRef]
  11. Jia, T.; Li, Q.; Shi, W. Estimation and Analysis of Emissions from On-Road Vehicles in Mainland China for the Period 2011–2015. Atmos. Environ. 2018, 191, 500–512. [Google Scholar] [CrossRef]
  12. Wen, Y.; Liu, M.; Zhang, S.; Wu, X.; Wu, Y.; Hao, J. Updating On-Road Vehicle Emissions for China: Spatial Patterns, Temporal Trends, and Mitigation Drivers. Environ. Sci. Technol. 2023, 57, 14299–14309. [Google Scholar] [CrossRef] [PubMed]
  13. Liu, Y.-H.; Liao, W.-Y.; Li, L.; Huang, Y.-T.; Xu, W.-J. Vehicle Emission Trends in China’s Guangdong Province from 1994 to 2014. Sci. Total Environ. 2017, 586, 512–521. [Google Scholar] [CrossRef] [PubMed]
  14. Lv, W.; Hu, Y.; Li, E.; Liu, H.; Pan, H.; Ji, S.; Hayat, T.; Alsaedi, A.; Ahmad, B. Evaluation of Vehicle Emission in Yunnan Province from 2003 to 2015. J. Clean. Prod. 2019, 207, 814–825. [Google Scholar] [CrossRef]
  15. Xu, Z.; Chen, S.; Sang, M.; Wang, Z.; Bo, X.; You, Q. Air Quality Improvement through Vehicle Electrification in Hainan Province, China. Chemosphere 2023, 316, 137814. [Google Scholar] [CrossRef] [PubMed]
  16. Jing, B.; Wu, L.; Mao, H.; Gong, S.; He, J.; Zou, C.; Song, G.; Li, X.; Wu, Z. Development of a Vehicle Emission Inventory with High Temporal–Spatial Resolution Based on NRT Traffic Data and Its Impact on Air Pollution in Beijing—Part 1: Development and Evaluation of Vehicle Emission Inventory. Atmos. Chem. Phys. 2016, 16, 3161–3170. [Google Scholar] [CrossRef]
  17. Zou, C.; Wu, L.; Wang, Y.; Sun, S.; Wei, N.; Sun, B.; Ni, J.; He, J.; Zhang, Q.; Peng, J.; et al. Evaluating Traffic Emission Control Policies Based on Large-Scale and Real-Time Data: A Case Study in Central China. Sci. Total Environ. 2023, 860, 160435. [Google Scholar] [CrossRef] [PubMed]
  18. Zhu, C.; Qu, X.; Qiu, M.; Zhu, C.; Wang, C.; Wang, B.; Sun, L.; Yang, N.; Yan, G.; Xu, C.; et al. High Spatiotemporal Resolution Vehicular Emission Inventory in Beijing-Tianjin-Hebei and Its Surrounding Areas (BTHSA) during 2000–2020, China. Sci. Total Environ. 2023, 873, 162389. [Google Scholar] [CrossRef] [PubMed]
  19. Chen, S.; Du, Z.; Shi, X.; Liu, Y.; Li, S.; Shao, C.; Steve-Harold, K.W. MOVES-Beijing-Based High Spatial and Temporal Resolution Ammonia Emissions from Road Traffic in Beijing. Atmos. Environ. 2021, 256, 118443. [Google Scholar] [CrossRef]
  20. Liu, H.; He, K.; Wang, Q.; Huo, H.; Lents, J.; Davis, N.; Nikkila, N.; Chen, C.; Osses, M.; He, C. Comparison of Vehicle Activity and Emission Inventory between Beijing and Shanghai. J. Air Waste Manag. Assoc. 2007, 57, 1172–1177. [Google Scholar] [CrossRef] [PubMed]
  21. Ministry of Ecology and Environment. Announcement on the Release of Five National Technical Guidelines of Air Pollutant Emission Inventory. Available online: https://www.mee.gov.cn/gkml/hbb/bgg/201501/t20150107_293955.htm (accessed on 18 December 2023).
  22. Liu, Z.; Hu, K.; Zhang, K.; Zhu, S.; Wang, M.; Li, L. VOCs Sources and Roles in O3 Formation in the Central Yangtze River Delta Region of China. Atmos. Environ. 2023, 302, 119755. [Google Scholar] [CrossRef]
  23. Sun, S.; Jiang, W.; Gao, W. Vehicle Emission Inventory and Spatial Distribution in Qingdao. China Environ. Sci. 2017, 37, 49–59. [Google Scholar] [CrossRef]
  24. Hao, Y.; Song, X. Research on Trends and Spatial Distribution of Vehicular Emissions and Its Control Measure Assessment in the Yangtze River Delta, China, for 1999–2015. Environ. Sci. Pollut. Res. 2018, 25, 36503–36517. [Google Scholar] [CrossRef] [PubMed]
  25. Sun, S.; Wang, B.; Sun, L.; Huang, X.; Wang, X.; Zhang, S.; Bo, Y. Development and Characteristics of Vehicle Emission Inventory with High Spatiotemporal Resolution in Jiangsu Province. China Environ. Sci. 2023, 43, 4490–4502. [Google Scholar] [CrossRef]
  26. Huang, C.; Wang, H.L.; Li, L.; Wang, Q.; Lu, Q.; De Gouw, J.A.; Zhou, M.; Jing, S.A.; Lu, J.; Chen, C.H. VOC Species and Emission Inventory from Vehicles and Their SOA Formation Potentials Estimation in Shanghai, China. Atmos. Chem. Phys. 2015, 15, 11081–11096. [Google Scholar] [CrossRef]
  27. Zhang, S.; Niu, T.; Wu, Y.; Zhang, K.M.; Wallington, T.J.; Xie, Q.; Wu, X.; Xu, H. Fine-Grained Vehicle Emission Management Using Intelligent Transportation System Data. Environ. Pollut. 2018, 241, 1027–1037. [Google Scholar] [CrossRef] [PubMed]
  28. Sun, L.; Zhong, C.; Peng, J.; Wang, T.; Wu, L.; Liu, Y.; Sun, S.; Li, Y.; Chen, Q.; Song, P.; et al. Refueling Emission of Volatile Organic Compounds from China 6 Gasoline Vehicles. Sci. Total Environ. 2021, 789, 147883. [Google Scholar] [CrossRef]
  29. Sun, L.; Zhong, C.; Sun, S.; Liu, Y.; Tong, H.; Wu, Y.; Song, P.; Zhang, L.; Huang, X.; Wu, L.; et al. Evolution and Characteristics of Full-process Vehicular VOCs Emissions in Tianjin from 2000 to 2020. Environ. Sci. 2023, 44, 1346–1356. [Google Scholar] [CrossRef]
  30. Liu, Y.; Zhong, C.; Peng, J.; Wang, T.; Wu, L.; Chen, Q.; Sun, L.; Sun, S.; Zou, C.; Zhao, J.; et al. Evaporative Emission from China 5 and China 6 Gasoline Vehicles: Emission Factors, Profiles and Future Perspective. J. Clean. Prod. 2022, 331, 129861. [Google Scholar] [CrossRef]
  31. Sun, S.; Zhao, G.; Wang, T.; Jin, J.; Wang, P.; Lin, Y.; Li, H.; Ying, Q.; Mao, H. Past and Future Trends of Vehicle Emissions in Tianjin, China, from 2000 to 2030. Atmos. Environ. 2019, 209, 182–191. [Google Scholar] [CrossRef]
  32. Sun, S.; Jin, J.; Xia, M.; Liu, Y.; Gao, M.; Zou, C.; Wang, T.; Lin, Y.; Wu, L.; Mao, H.; et al. Vehicle Emissions in a Middle-Sized City of China: Current Status and Future Trends. Environ. Int. 2020, 137, 105514. [Google Scholar] [CrossRef]
  33. Liu, G.; Sun, S.; Sun, L.; Jin, J.; Fang, J.; Song, P.; Wang, T.; Wu, L.; Mao, H. Mobile Source Emission Inventory with High Spatiotemporal Resolution in Tianjin in 2017. Environ. Sci. 2020, 41, 4470–4481. [Google Scholar] [CrossRef]
  34. Sun, S.; Jin, J.; Lv, J.; Sun, L.; Zou, C.; Liu, Y.; Liu, G.; Wang, T.; Wu, L.; Mao, H. Developing Vehicle Emission Inventory Based on Refined Annual Average Vehicle Kilometers Traveled. China Environ. Sci. 2020, 40, 2018–2029. [Google Scholar] [CrossRef]
  35. Huo, H.; Zhang, Q.; He, K.; Yao, Z.; Wang, M. Vehicle-Use Intensity in China: Current Status and Future Trend. Energy Policy 2012, 43, 6–16. [Google Scholar] [CrossRef]
  36. Zheng, B.; Zhang, Q.; Geng, G.; Chen, C.; Shi, Q.; Cui, M.; Lei, Y.; He, K. Changes in China’s Anthropogenic Emissions and Air Quality during the COVID-19 Pandemic in 2020. Earth Syst. Sci. Data 2021, 13, 2895–2907. [Google Scholar] [CrossRef]
  37. Changzhou Municipal Bureau of Statistics. Changzhou Statistical Yearbook. Available online: https://tjj.changzhou.gov.cn/class/MFCMMFBD (accessed on 14 December 2023).
  38. Liu, Y.-H.; Ma, J.-L.; Li, L.; Lin, X.-F.; Xu, W.-J.; Ding, H. A High Temporal-Spatial Vehicle Emission Inventory Based on Detailed Hourly Traffic Data in a Medium-Sized City of China. Environ. Pollut. 2018, 236, 324–333. [Google Scholar] [CrossRef]
  39. Lotrecchiano, N.; Sofia, D.; Giuliano, A.; Barletta, D.; Poletto, M. Real-Time On-Road Monitoring Network of Air Quality. Chem. Eng. Trans. 2019, 74, 241–246. [Google Scholar] [CrossRef]
  40. Wu, T.; Cui, Y.; Lian, A.; Tian, Y.; Li, R.; Liu, X.; Yan, J.; Xue, Y.; Liu, H.; Wu, B. Vehicle Emissions of Primary Air Pollutants from 2009 to 2019 and Projection for the 14th Five-Year Plan Period in Beijing, China. J. Environ. Sci. 2023, 124, 513–521. [Google Scholar] [CrossRef]
  41. Jiang, P.; Zhong, X.; Li, L. On-Road Vehicle Emission Inventory and Its Spatio-Temporal Variations in North China Plain. Environ. Pollut. 2020, 267, 115639. [Google Scholar] [CrossRef] [PubMed]
  42. Cheng, S.; Zhang, B.; Zhao, Y.; Peng, P.; Lu, F. Multiscale Spatiotemporal Variations of NOx Emissions from Heavy Duty Diesel Trucks in the Beijing-Tianjin-Hebei Region. Sci. Total Environ. 2023, 854, 158753. [Google Scholar] [CrossRef] [PubMed]
  43. Ministry of Industry and Information Technology. Notice on Organizing and Carrying out the Pilot Work of the Leading Area for Comprehensive Electrification of Vehicles in Public Spaces. Available online: https://www.gov.cn/zhengce/zhengceku/2023-02/03/content_5739955.htm?ivk_sa=1023197a (accessed on 21 December 2023).
  44. Yan, L.; Zheng, B.; Geng, G.; Hong, C.; Tong, D.; Zhang, Q. Evaporation Process Dominates Vehicular NMVOC Emissions in China with Enlarged Contribution from 1990 to 2016. Environ. Res. Lett. 2021, 16, 124036. [Google Scholar] [CrossRef]
  45. Sun, S.; Zhang, G.; Sun, L.; Xu, C.; Guo, M.; Cui, Z.; He, X.; Li, F.; Song, Z.; Bo, Y.; et al. Synergistic Benefits of Pollution and Carbon Reduction from Air Pollution Control in Hebei Province from 2013 to 2020. Environ. Sci. 2023, 44, 5431–5442. [Google Scholar] [CrossRef]
  46. Wang, X.; Xiao, R.; Zhao, N. Analysis of the Pandemic’s Impact on the Logistics Supply Chain in the Yangtze River Delta Region Based on Dynamic Data from Heavy Trucks. China Logist. Purch. 2023, 44, 38–40. [Google Scholar] [CrossRef]
  47. Zhao, D.; Lei, Y.; Zhang, Y.; Shi, X.; Liu, X.; Xu, Y.; Xue, W. Analysis of Vehicular CO2 Emission in the Central Plains of China and Its Driving Forces. Sci. Total Environ. 2022, 814, 152758. [Google Scholar] [CrossRef] [PubMed]
  48. Song, X.; Hao, Y.; Zhang, C.; Peng, J.; Zhu, X. Vehicular Emission Trends in the Pan-Yangtze River Delta in China between 1999 and 2013. J. Clean. Prod. 2016, 137, 1045–1054. [Google Scholar] [CrossRef]
  49. Gong, M.; Yin, S.; Gu, X.; Xu, Y.; Jiang, N.; Zhang, R. Refined 2013-Based Vehicle Emission Inventory and Its Spatial and Temporal Characteristics in Zhengzhou, China. Sci. Total Environ. 2017, 599–600, 1149–1159. [Google Scholar] [CrossRef] [PubMed]
  50. Yu, J.; Zhou, L.; Tang, G.; Wang, G.; Yu, M.; Ding, J.; Shen, G. Study on Distribution Characteristics of Motor Vehicle Emission Pollution and Its Coupling with Air Quality in Jiangsu Province in 2020. Environ. Monit. Forewarning 2022, 14, 53–57. [Google Scholar] [CrossRef]
  51. Li, L.; Zhang, J.; Zhao, Q.; Li, H.; Han, J. Vehicle Exhaust Emission Characteristics and Their Contributions in Jiangsu Province. Environ. Sci. 2018, 39, 3976–3986. [Google Scholar] [CrossRef]
  52. Gao, S.; Zhu, D.; Yang, X. Air Pollution Emission Inventory Based on GIS in Changzhou City. Environ. Sci. Technol. 2015, 38, 241–246. [Google Scholar] [CrossRef]
Figure 1. Location and road network distribution of Changzhou, China.
Atmosphere 15 00192 g001
Figure 2. Vehicle population of different vehicle types in Changzhou in 2022.
Atmosphere 15 00192 g002
Figure 3. Monthly temporal profiles of vehicle activity in 2022.
Atmosphere 15 00192 g003
Figure 4. Emission factors of different vehicle types in Changzhou in 2022.
Atmosphere 15 00192 g004
Figure 5. Emissions and contributions of different vehicle types in Changzhou in 2022.
Atmosphere 15 00192 g005
Figure 6. Vehicle emissions by fuel type and emission standard in Changzhou in 2022.
Atmosphere 15 00192 g006
Figure 7. Monthly vehicle emissions in Changzhou in 2022.
Atmosphere 15 00192 g007
Figure 8. Spatial distribution of vehicle emissions with a resolution of 0.01° × 0.01° in Changzhou in 2022.
Atmosphere 15 00192 g008
Table 1. Status of vehicle operation in Changzhou.
Vehicle TypeVKT (km/Year)Average Speed (km/h)
LDPV12,46422
MDPV31,30018
HDPV81,68318
LDT22,20335
MDT60,00039.5
HDT80,78239.5
MC730328
Table 2. Mileage weights for vehicles on different road types (%).
Vehicle TypeHighwaysArterialsStreets
LDPV182260
MDPV/HDPV252550
LDT404020
MDT/HDT504010
MC24949
Table 3. Changzhou vehicle population (thousands) and emissions (Gg) in this and previous studies.
StudiesYearVehicle PopulationCOVOCsNOxPM2.5
This study20221637.9839.698.6818.600.56
Yu et al. [50]20201565.31-8.2522.150.29
Sun et al. [25]20181412.9058.9511.4442.341.48
Li et al. [51]20151103.2484.308.4028.901.00
Gao et al. [52]2010869.1987.3310.0113.600.82
Disclaimer/Publisher’s Note: The statements, opinions and data contained in all publications are solely those of the individual author(s) and contributor(s) and not of MDPI and/or the editor(s). MDPI and/or the editor(s) disclaim responsibility for any injury to people or property resulting from any ideas, methods, instructions or products referred to in the content.

