


Analysis of Aerosol Types and Vertical Distribution in Seven Typical Cities in East Asia


Abstract
1. Introduction
2. Data and Methods
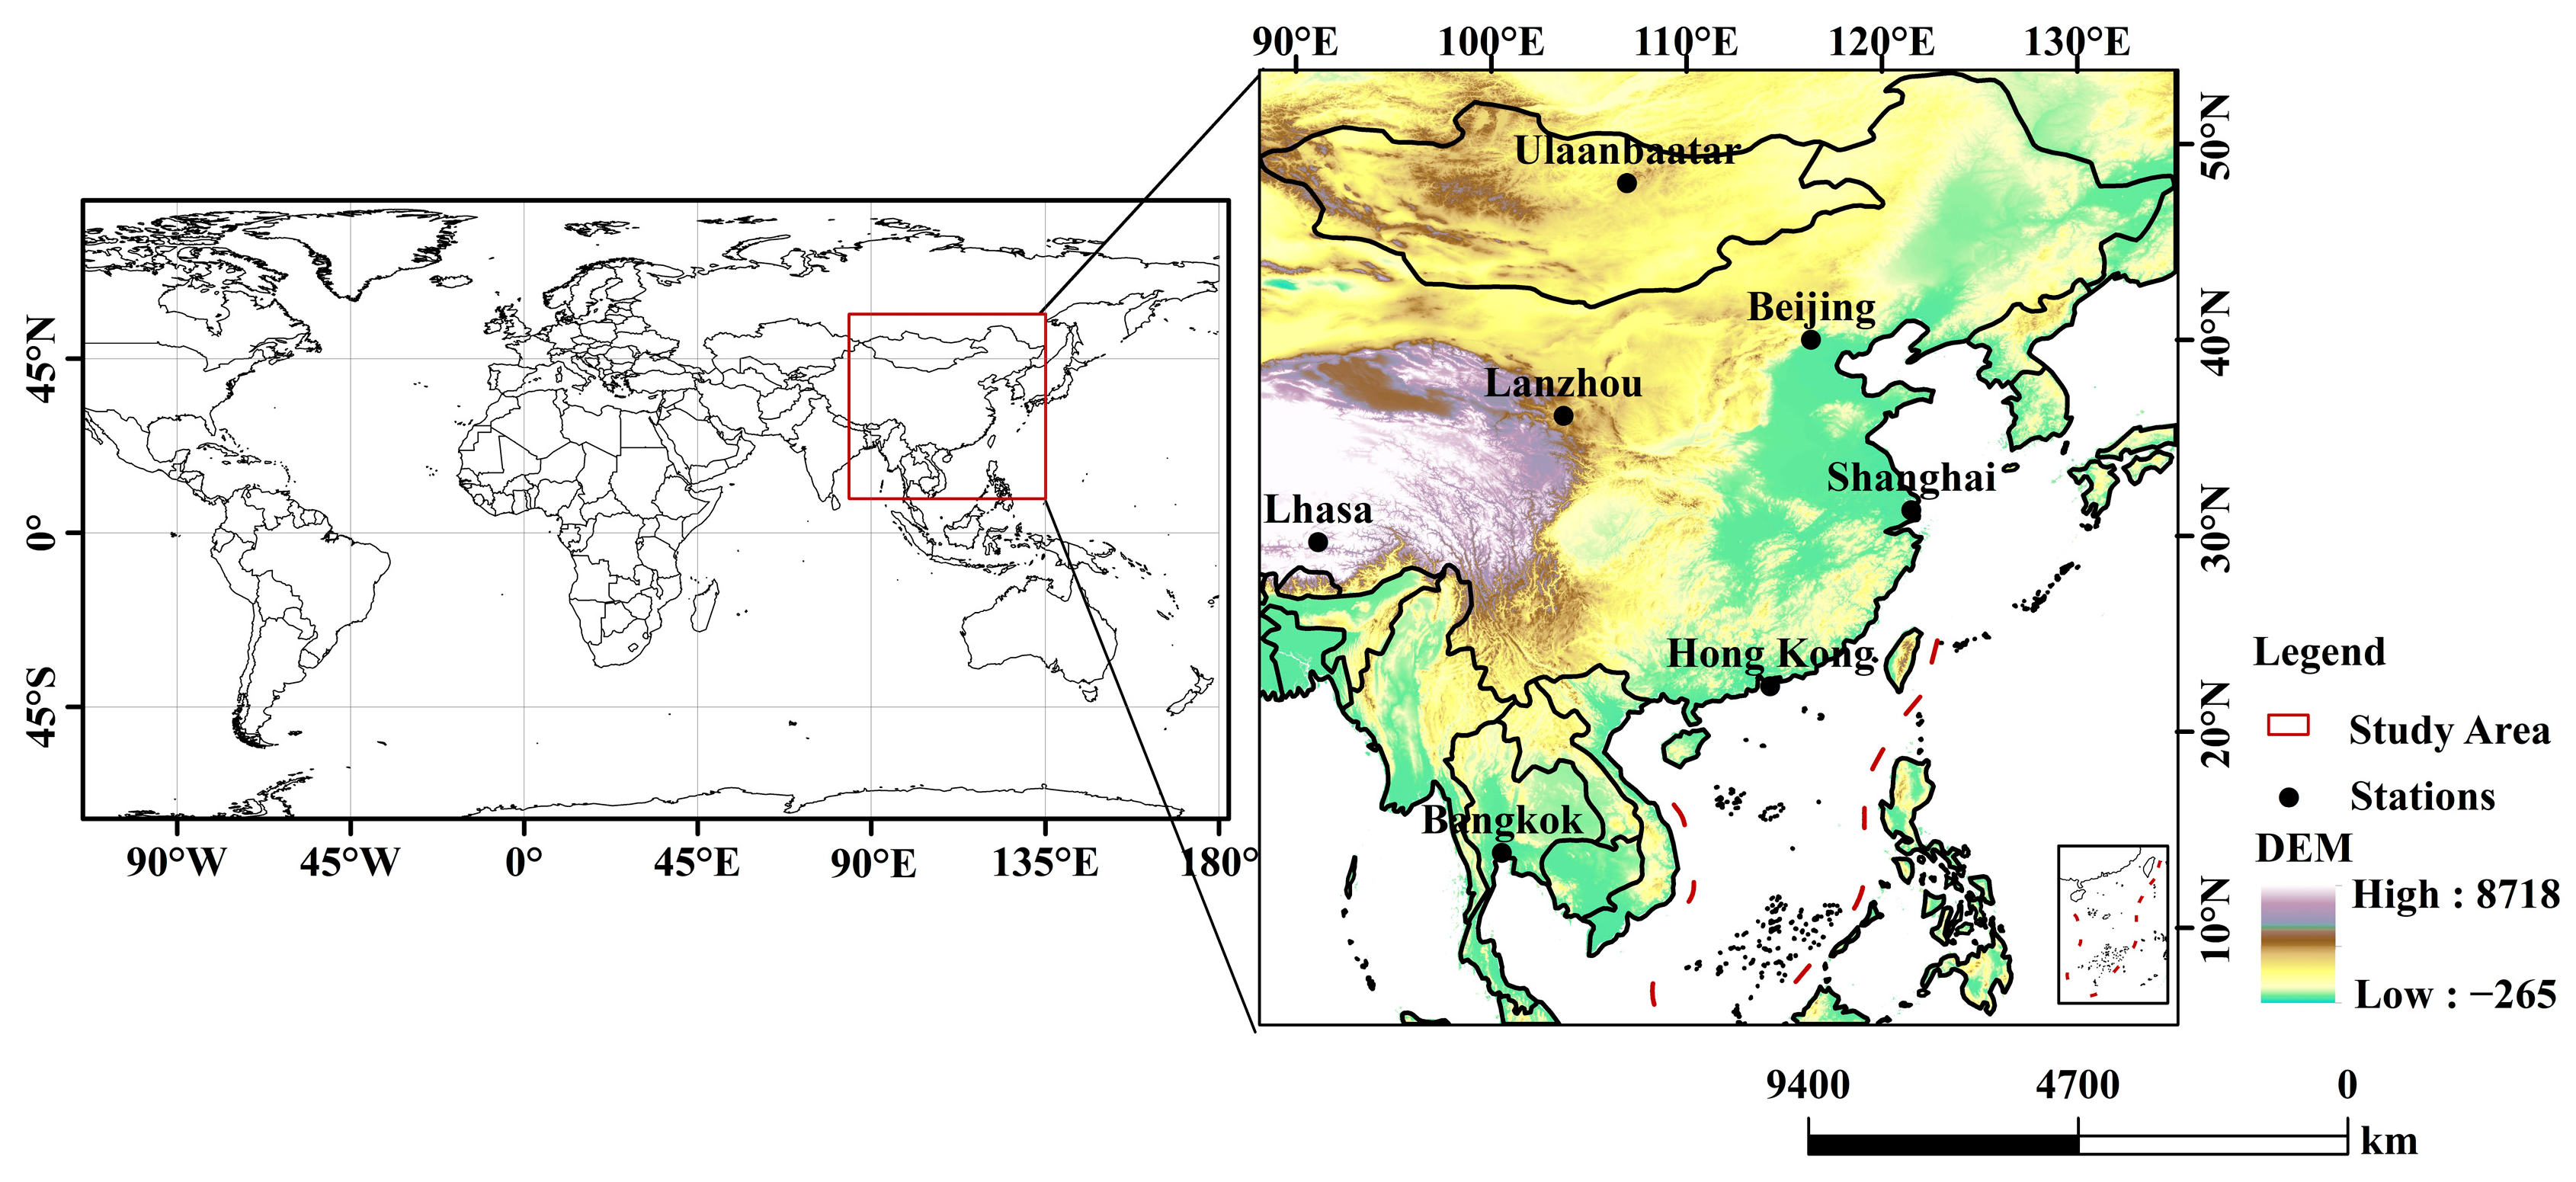
2.1. Study Area
2.2. CALIPSO
2.3. Methods
2.3.1. Cloud Screened and Quality Control (QC) of Extinction Profiles
2.3.2. Extinction Coefficient Arithmetic Rule
3. Results
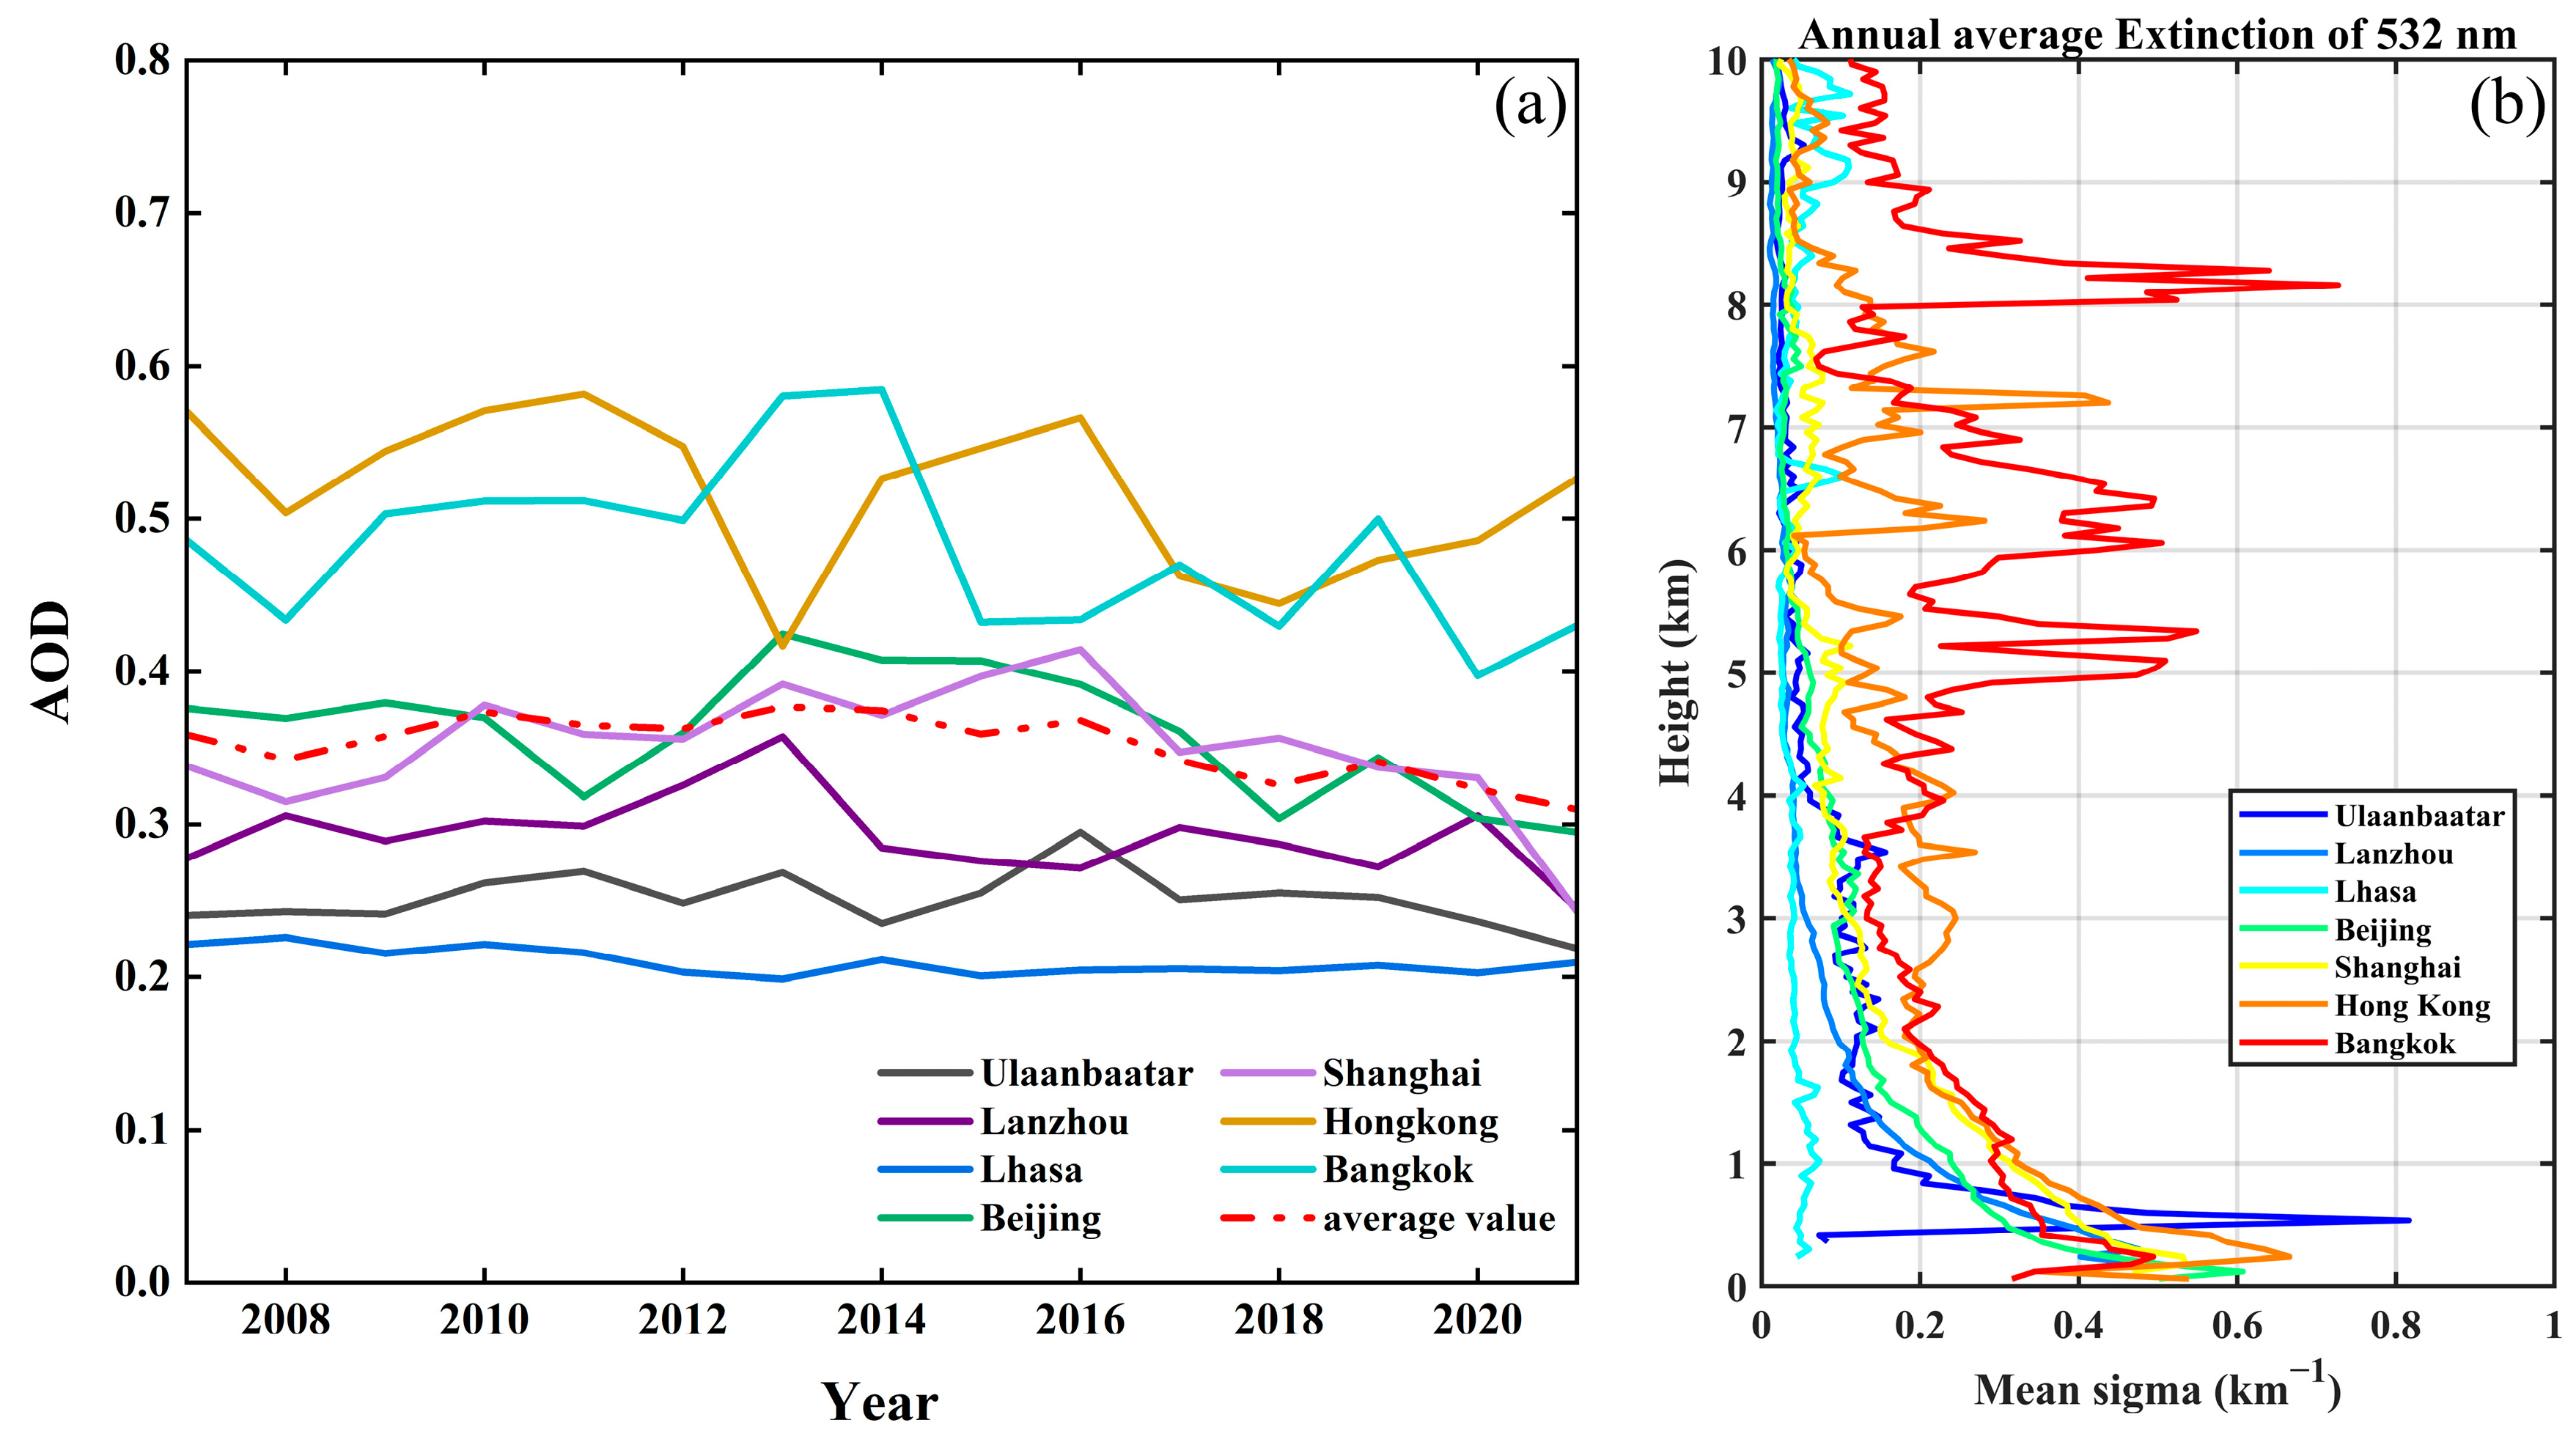
3.1. The Annual AOD and Vertical Extinction Distribution
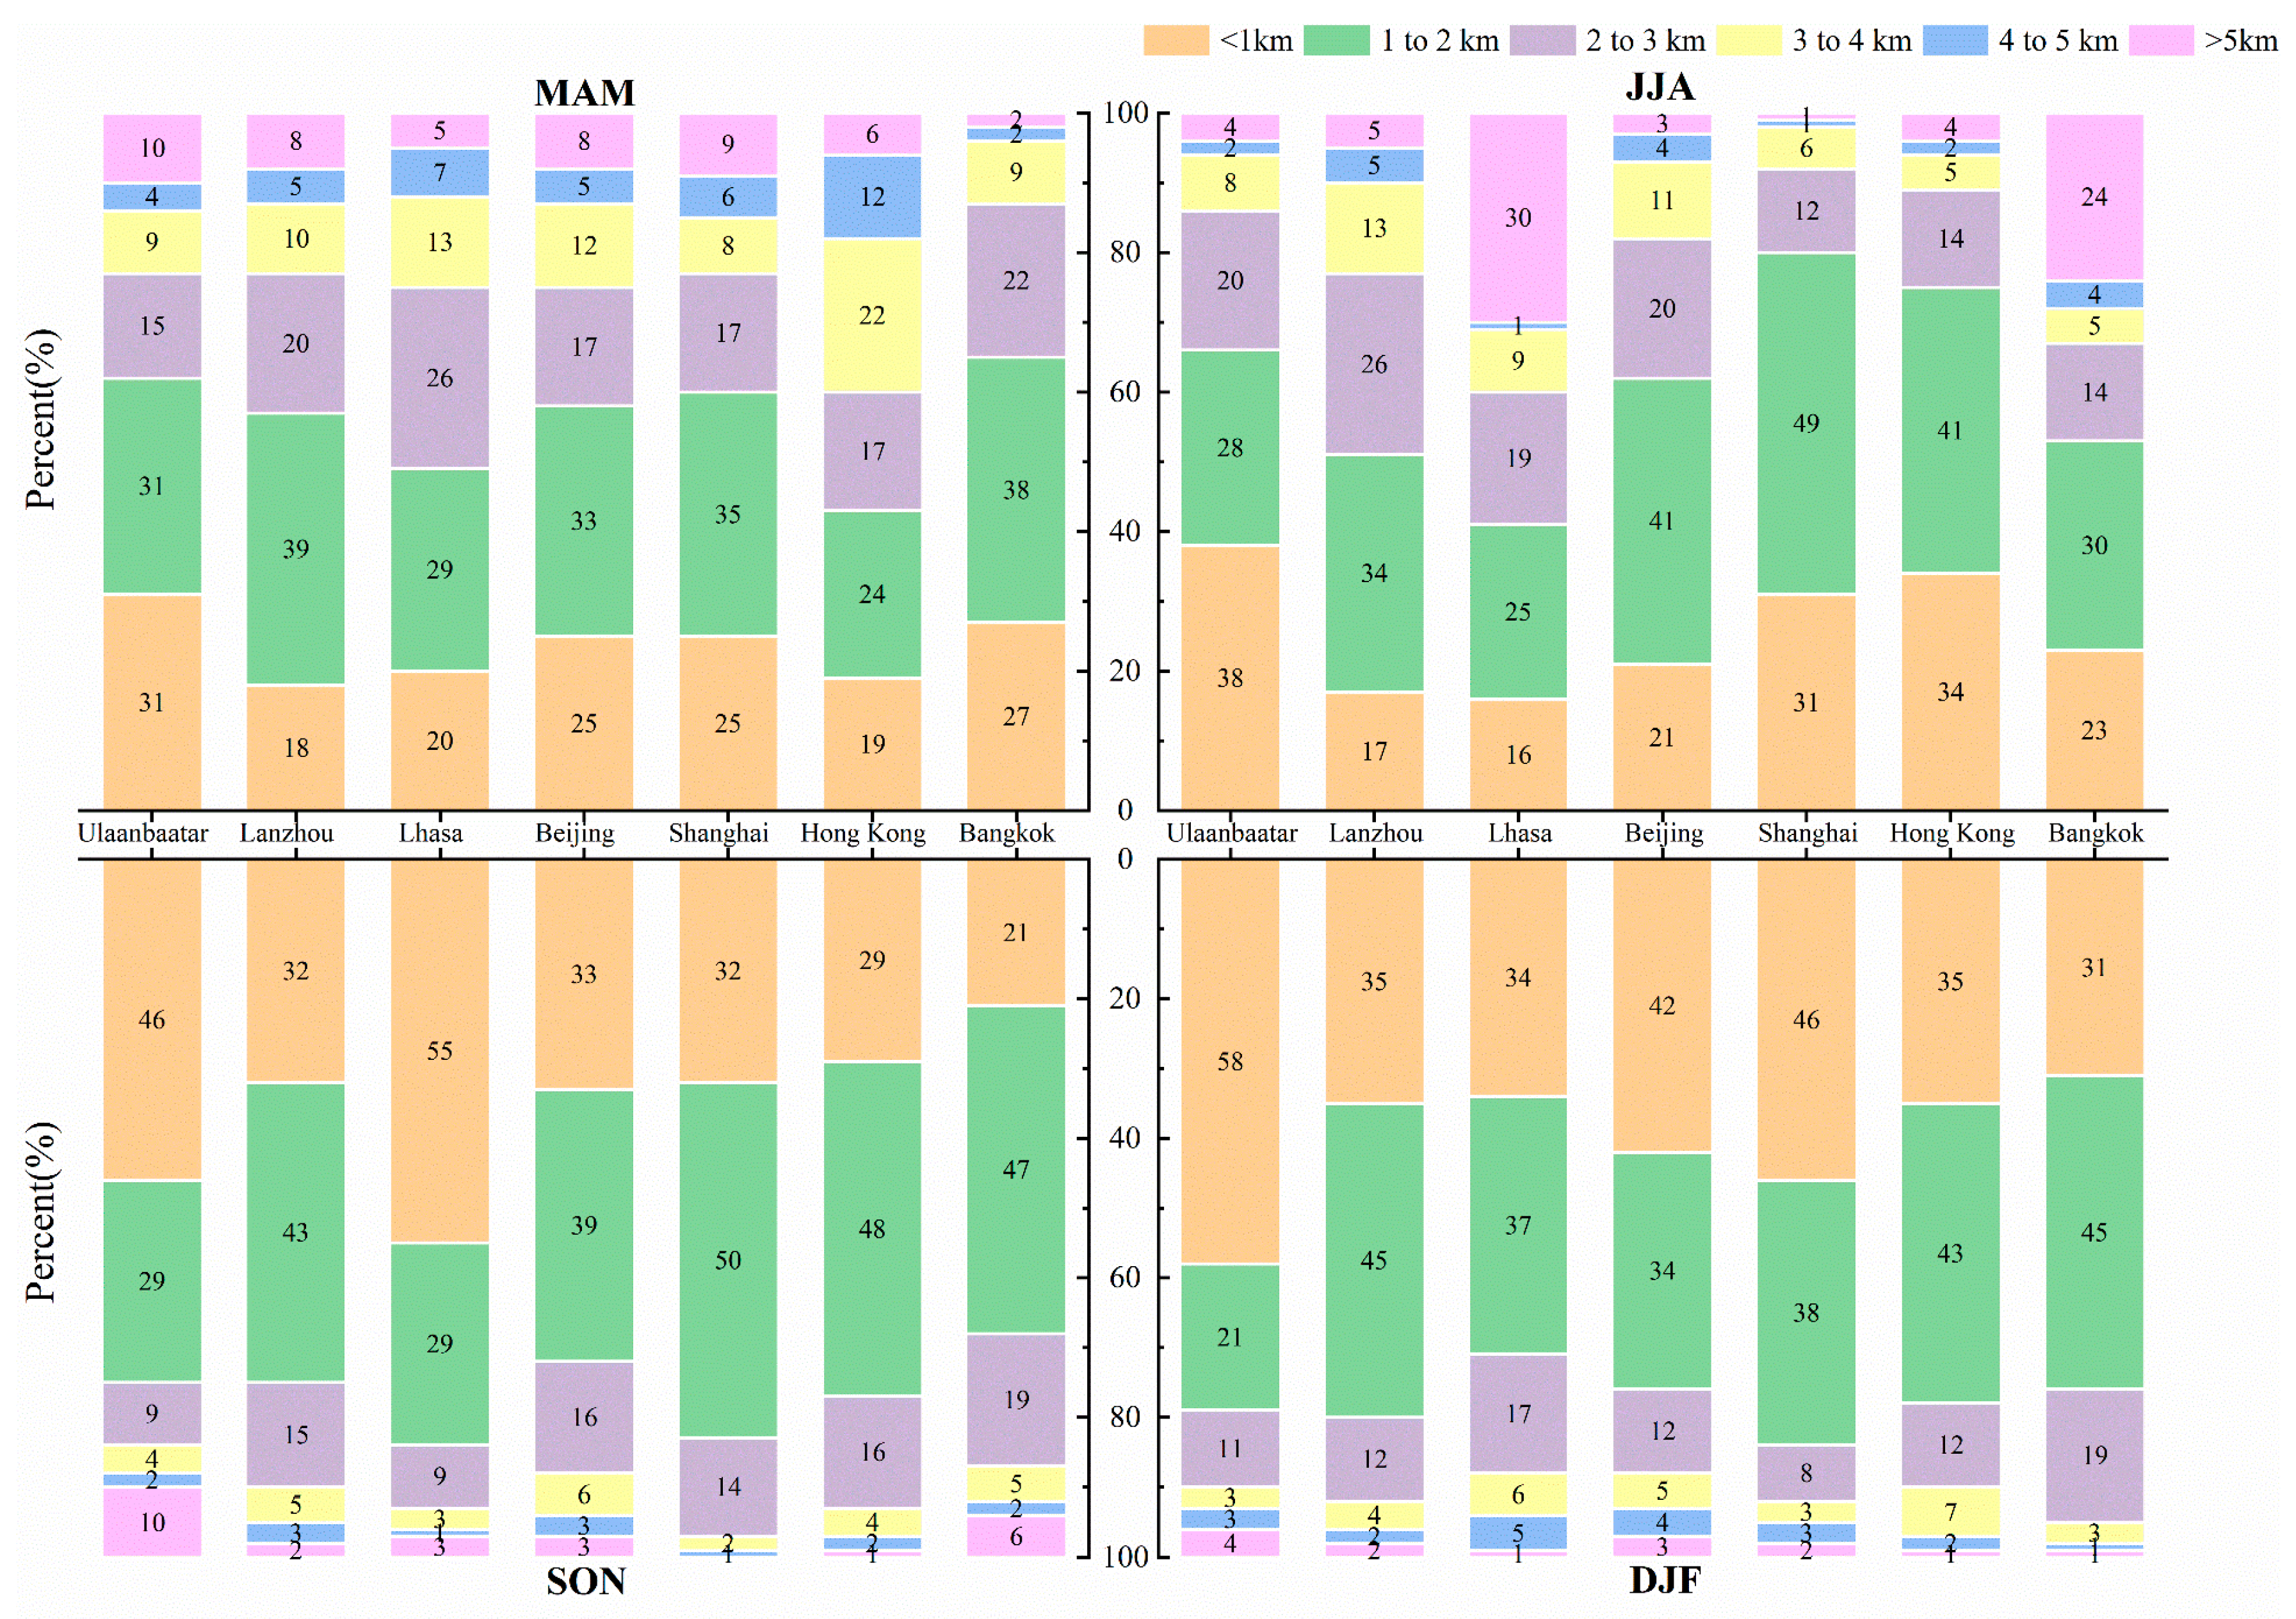
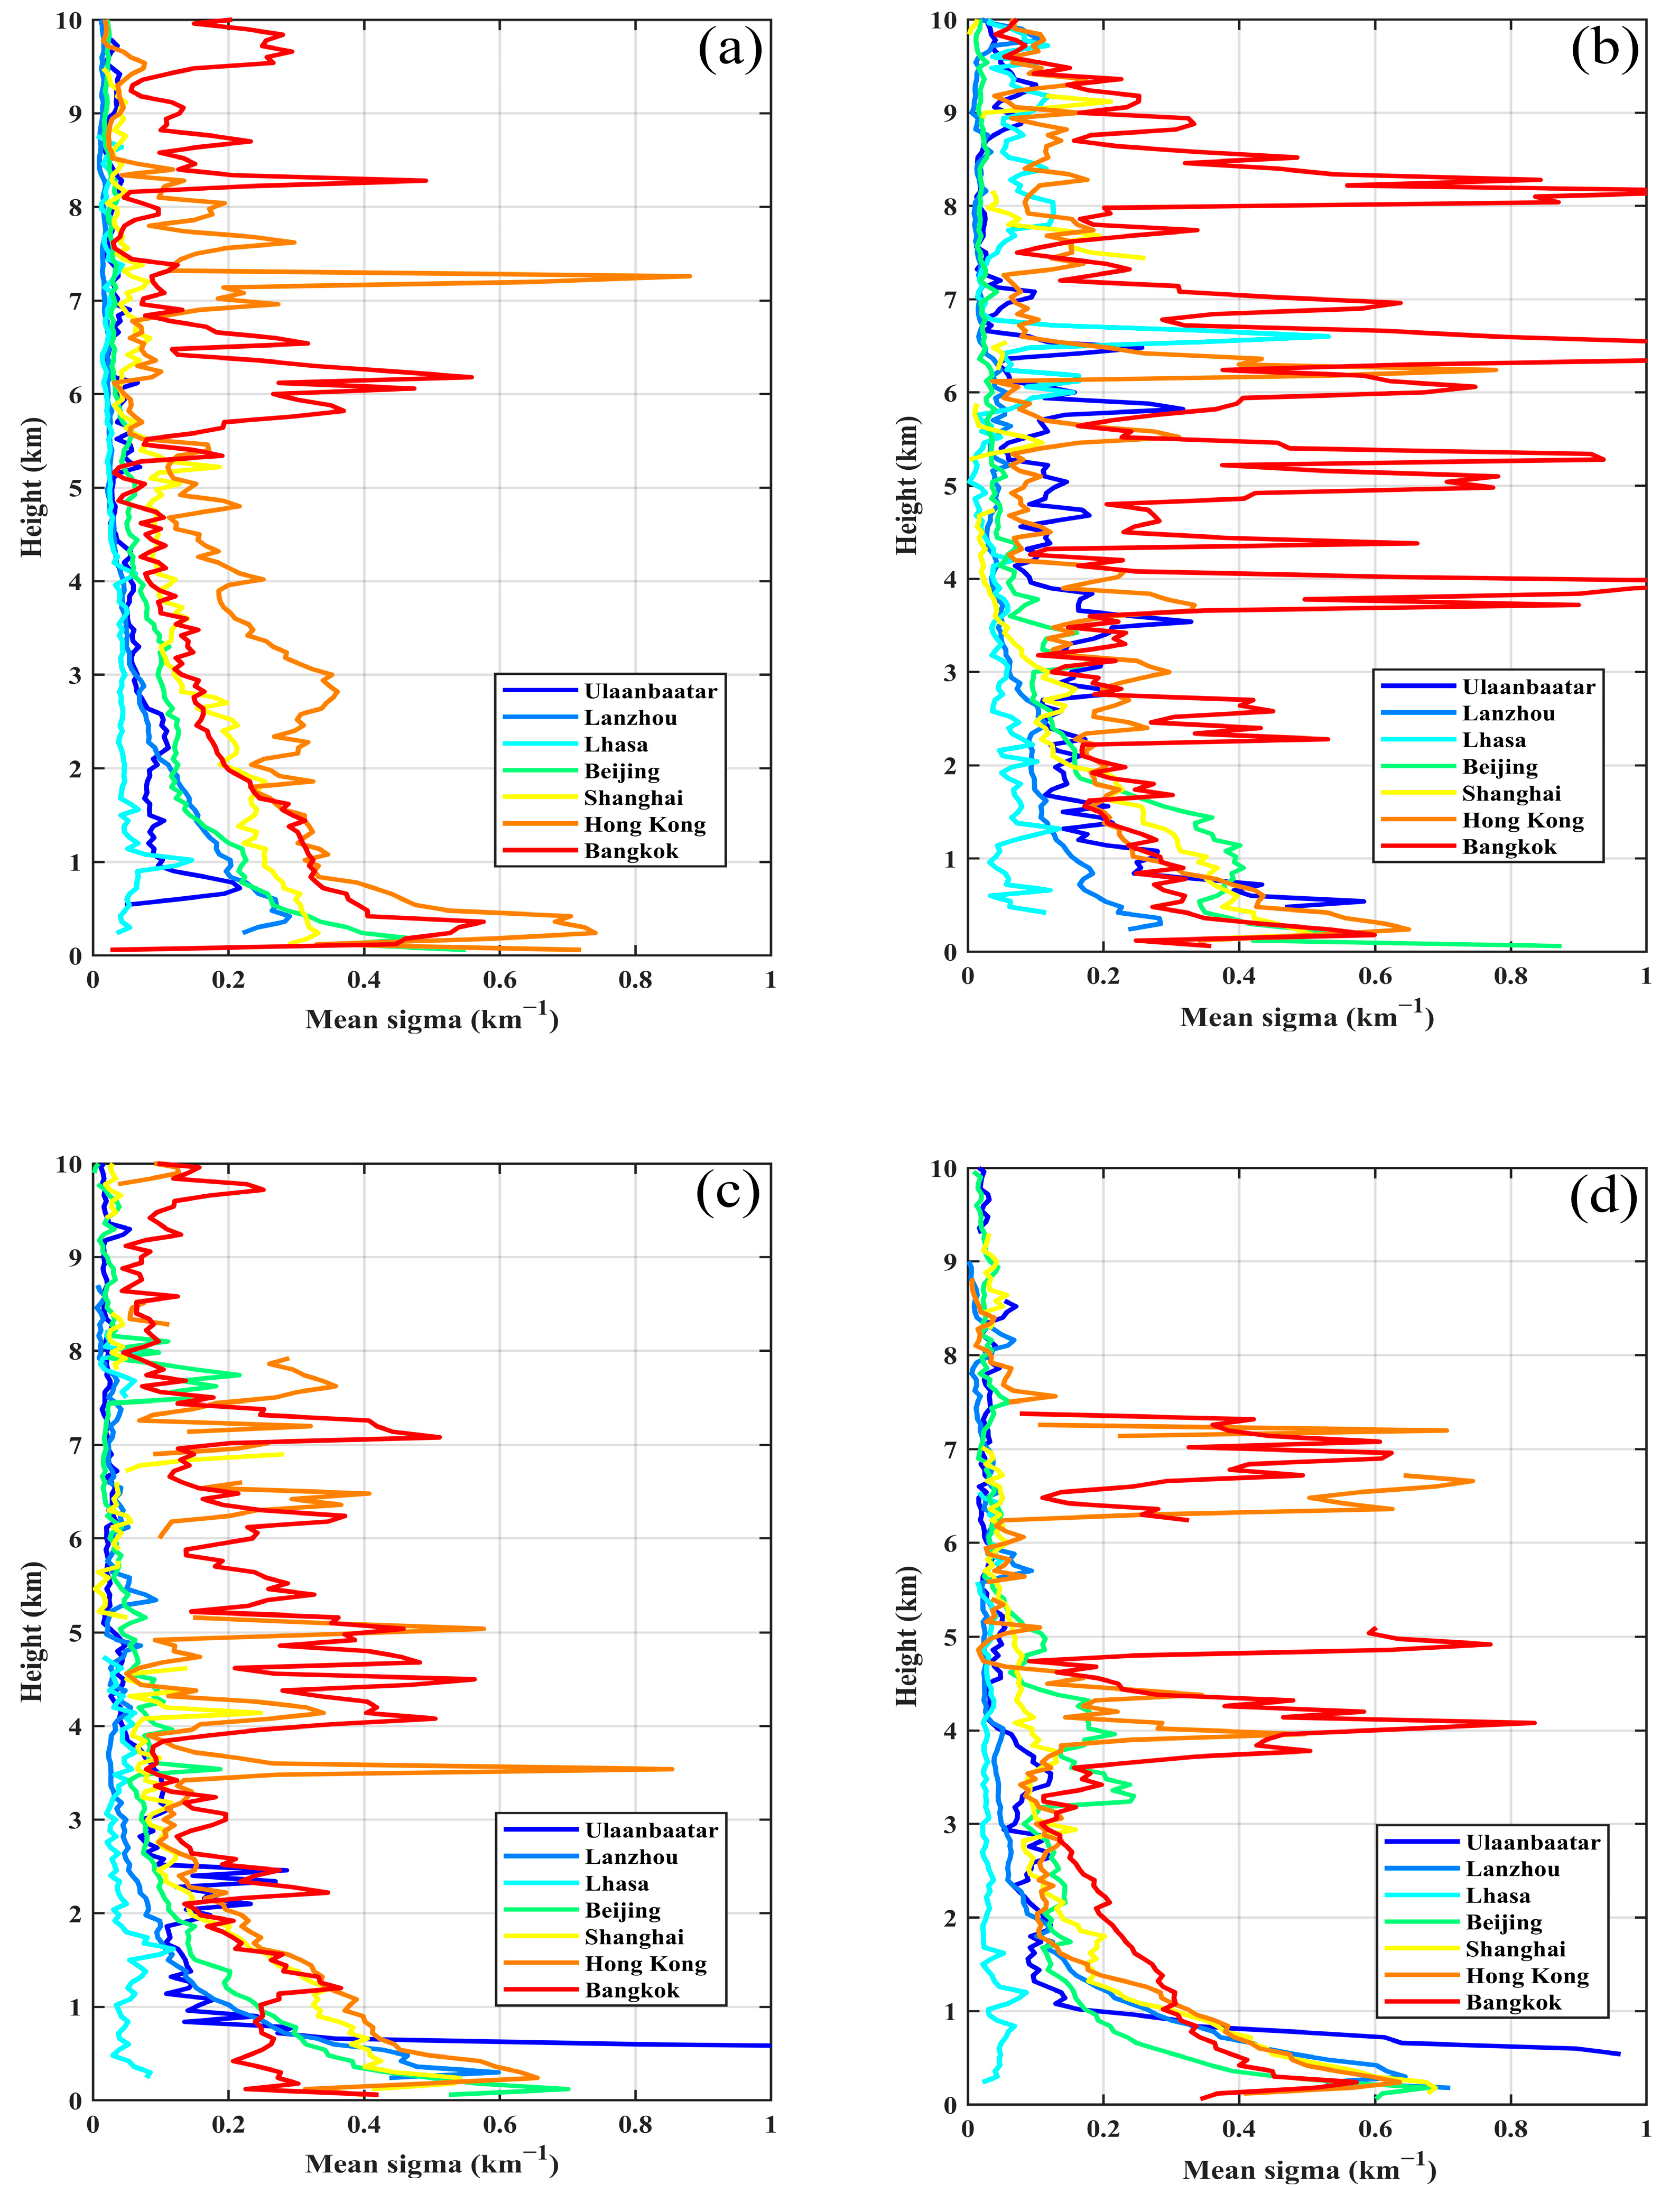
3.2. The Seasonal AOD and Vertical Extinction Distribution
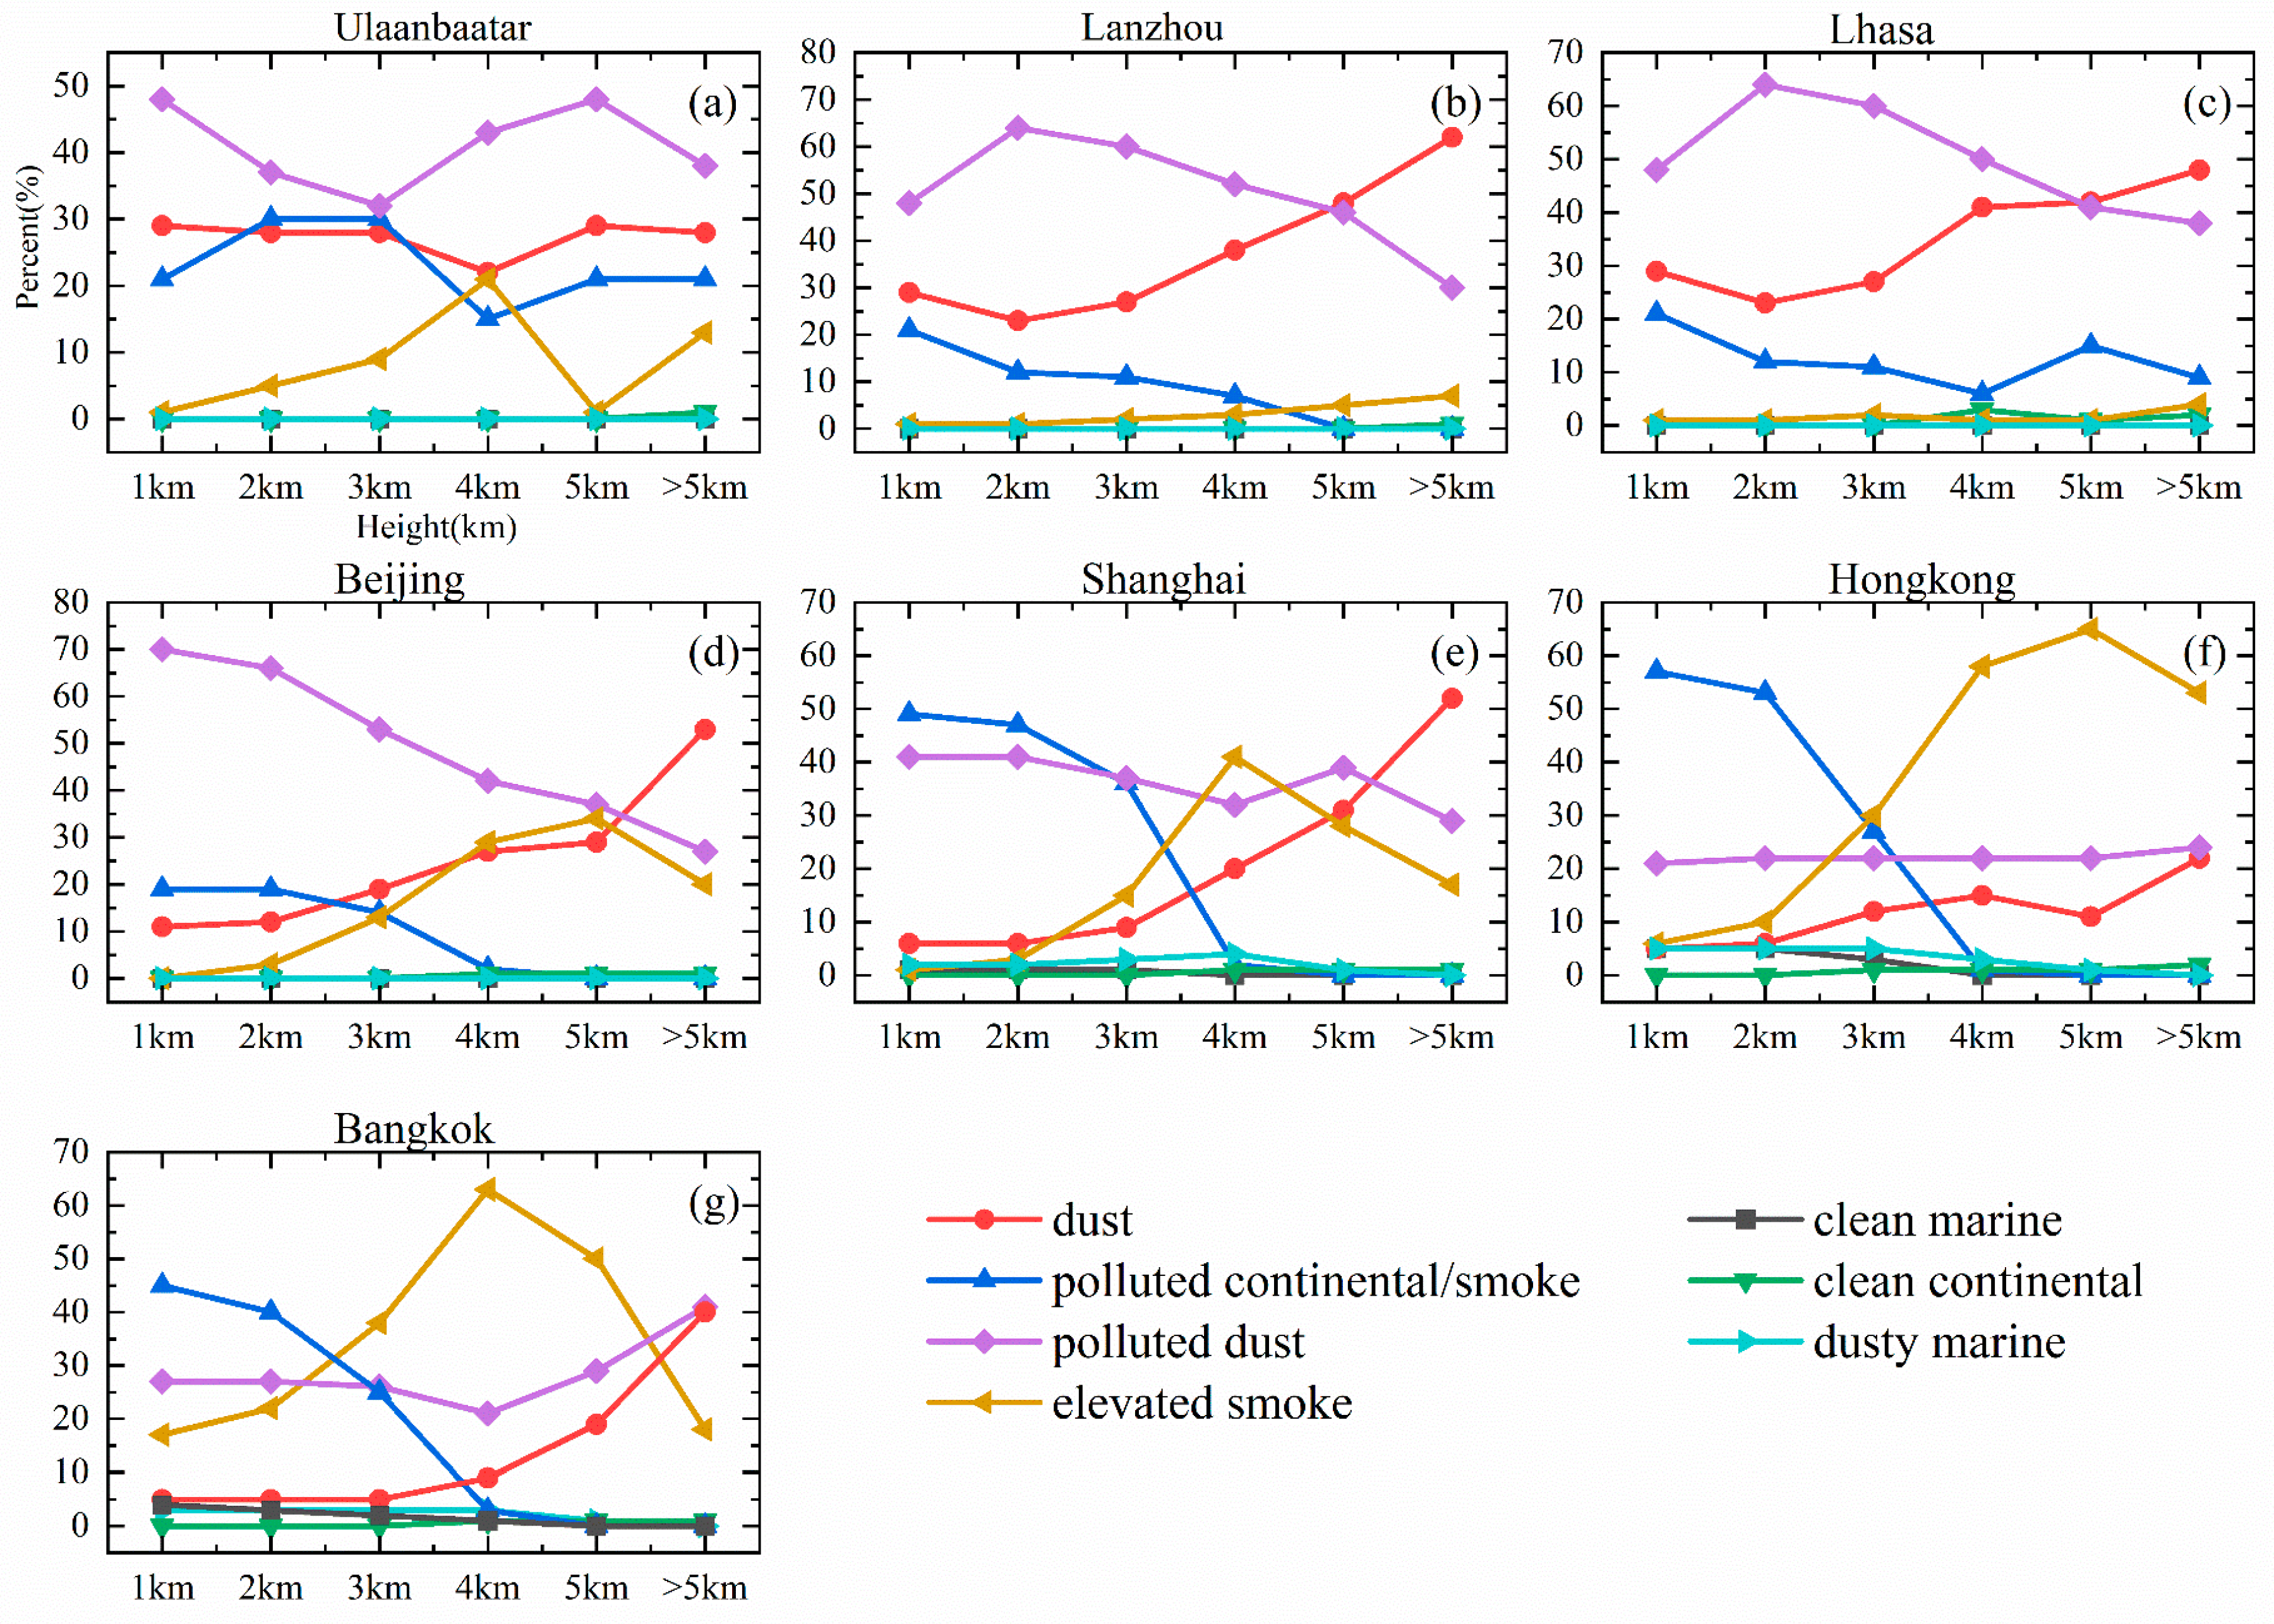
3.3. The Annual AOD Subtype’s Vertical Distribution
4. Discussion
4.1. Analysis of Annual AOD and Vertical Extinction Distribution
4.2. Seasonal AOD Vertical Stratification and Vertical Extinction Distribution Analysis
4.3. Analysis of the Annual AOD Subtype’s Vertical Distribution
5. Conclusions
- Except for Lhasa’s AOD which is steadily low, the AOD values of all the other cities showed an increasing and then decreasing trend during 2007–2021. The peak values occurred mostly in spring and summer, while the lowest values occurred in autumn and winter.
- In all seasons, the proportion of AOD at the altitude of 1–3 km exceeded 50% of the total, with this proportion being even higher than 80% in autumn and winter.
- Except for Lhasa, higher extinction coefficient values were observed below 1 km in all other cities during all four seasons. The highest extinction coefficient value in Lhasa occurred at an altitude of approximately 7 km during summer.
- Dust, polluted continental/smoke, polluted dust, and elevated smoke played dominant roles in various aerosol layers in all cities. On the other hand, the proportions of clean marine, clean continental, and dusty marine were very small, all below 5% in all aerosol layers of all cities.
Author Contributions
Funding
Institutional Review Board Statement
Informed Consent Statement
Data Availability Statement
Acknowledgments
Conflicts of Interest
Appendix A. AOD Subtypes in CALIPSO V4 Profile Products

| Subtype | Denotation |
|---|---|
| dust | Desert dust |
| polluted continental/smoke | Urban/industrial pollution and biomass burning aerosols below 2.5 km |
| polluted dust | Episodes of dust mixed with biomass burning smoke |
| elevated smoke | Biomass burning aerosols above 2.5 km |
| clean marine | Sea salt |
| clean continental | Clean background |
| dusty marine | Mixtures of dust and marine aerosol |
References
- Kahn, R.A.; Andrews, E.; Brock, C.A.; Chin, M.; Feingold, G.; Gettelman, A.; Levy, R.C.; Murphy, D.M.; Nenes, A.; Pierce, J.R.; et al. Reducing Aerosol Forcing Uncertainty by Combining Models with Satellite and Within-The-Atmosphere Observations: A Three-Way Street. Rev. Geophys. 2023, 61, e2022RG000796. [Google Scholar] [CrossRef]
- Huang, L.; Jiang, J.H.; Tackett, J.L.; Su, H.; Fu, R. Seasonal and diurnal variations of aerosol extinction profile and type distribution from CALIPSO 5-year observations. J. Geophys. Res. Atmos. 2013, 118, 4572–4596. [Google Scholar] [CrossRef]
- Schmeisser, L.; Andrews, E.; Ogren, J.A.; Sheridan, P.; Jefferson, A.; Sharma, S.; Kim, J.E.; Sherman, J.P.; Sorribas, M.; Kalapov, I.; et al. Classifying aerosol type using in situ surface spectral aerosol optical properties. Atmos. Chem. Phys. 2017, 17, 12097–12120. [Google Scholar] [CrossRef]
- Cai, Z.; Li, Z.; Li, P.; Li, J.; Sun, H.; Yang, Y.; Gao, X.; Ren, G.; Ren, R.; Wei, J. Vertical distributions of aerosol microphysical and optical properties based on aircraft measurements made over the Loess Plateau in China. Atmos. Environ. 2022, 270, 118888. [Google Scholar] [CrossRef]
- Mhawish, A.; Sorek-Hamer, M.; Chatfield, R.; Banerjee, T.; Bilal, M.; Kumar, M.; Sarangi, C.; Franklin, M.; Chau, K.; Garay, M.; et al. Aerosol characteristics from earth observation systems: A comprehensive investigation over South Asia (2000–2019). Remote Sens. Environ. 2021, 259, 112410. [Google Scholar] [CrossRef]
- Li, Z.; Niu, F.; Lee, K.H.; Xin, J.; Hao, W.M.; Nordgren, B.; Wang, Y.; Wang, P. Validation and understanding of Moderate Resolution Imaging Spectroradiometer aerosol products (C5) using ground-based measurements from the handheld Sun photometer network in China. J. Geophys. Res. Atmos. 2007, 112, D22S07. [Google Scholar] [CrossRef]
- Brakhasi, F.; Hajeb, M.; Mielonen, T.; Matkan, A.; Verbesselt, J. Investigating aerosol vertical distribution using CALIPSO time series over the Middle East and North Africa (MENA), Europe, and India: A BFAST-based gradual and abrupt change detection. Remote Sens. Environ. 2021, 264, 112619. [Google Scholar] [CrossRef]
- Zhang, Z.; Zhang, M.; Bilal, M.; Su, B.; Zhang, C.; Guo, L. Comparison of MODIS- and CALIPSO-Derived Temporal Aerosol Optical Depth over Yellow River Basin (China) from 2007 to 2015. Earth Syst. Environ. 2020, 4, 535–550. [Google Scholar] [CrossRef]
- Yu, H.; Chin, M.; Winker, D.M.; Omar, A.H.; Liu, Z.; Kittaka, C.; Diehl, T. Global view of aerosol vertical distributions from CALIPSO lidar measurements and GOCART simulations: Regional and seasonal variations. J. Geophys. Res. 2010, 115, D00H30. [Google Scholar] [CrossRef]
- Burton, S.P.; Ferrare, R.A.; Vaughan, M.A.; Omar, A.H.; Rogers, R.R.; Hostetler, C.A.; Hair, J.W. Aerosol classification from airborne HSRL and comparisons with the CALIPSO vertical feature mask. Atmos. Meas. Tech. 2013, 6, 1397–1412. [Google Scholar] [CrossRef]
- Li, J.; Han, Z. Aerosol vertical distribution over east China from RIEMS-Chem simulation in comparison with CALIPSO measurements. Atmos. Environ. 2016, 143, 177–189. [Google Scholar] [CrossRef]
- Miao, H.; Wang, X.; Liu, Y.; Wu, G. An evaluation of cloud vertical structure in three reanalyses against CloudSat/cloud-aerosol lidar and infrared pathfinder satellite observations. Atmos. Sci. Lett. 2019, 20, e906. [Google Scholar] [CrossRef]
- Mehta, M.; Singh, N.; Anshumali, N. Global trends of columnar and vertically distributed properties of aerosols with emphasis on dust, polluted dust and smoke—Inferences from 10-year long CALIOP observations. Remote Sens. Environ. 2018, 208, 120–132. [Google Scholar] [CrossRef]
- Liao, T.; Gui, K.; Li, Y.; Wang, X.; Sun, Y. Seasonal distribution and vertical structure of different types of aerosols in southwest China observed from CALIOP. Atmos. Environ. 2021, 246, 118145. [Google Scholar] [CrossRef]
- Niu, H.; Kang, S.; Gao, W.; Wang, Y.; Paudyal, R. Vertical distribution of the Asian tropopause aerosols detected by CALIPSO. Environ. Pollut. 2019, 253, 207–220. [Google Scholar] [CrossRef]
- Song, Z.; He, X.; Bai, Y.; Wang, D.; Hao, Z.; Gong, F.; Zhu, Q. Changes and Predictions of Vertical Distributions of Global Light-Absorbing Aerosols Based on CALIPSO Observation. Remote Sens. 2020, 12, 3014. [Google Scholar] [CrossRef]
- Gupta, G.; Ratnam, M.V.; Madhavan, B.L.; Prasad, P.; Narayanamurthy, C.S. Vertical and spatial distribution of elevated aerosol layers obtained using long-term ground-based and space-borne lidar observations. Atmos. Environ. 2020, 246, 118172. [Google Scholar] [CrossRef]
- Mehta, M.; Khushboo, R.; Raj, R.; Singh, N. Spaceborne observations of aerosol vertical distribution over Indian mainland (2009–2018). Atmos. Environ. 2021, 244, 117902. [Google Scholar] [CrossRef]
- Banerjee, T.; Anchule, A.; Sorek-Hamer, M.; Latif, M.T. Vertical stratification of aerosols over South Asian cities. Environ. Pollut. 2022, 309, 119776. [Google Scholar] [CrossRef]
- Lee, K.H.; Kim, Y.J. Satellite remote sensing of Asian aerosols: A case study of clean, polluted, and Asian dust storm days. Atmos. Meas. Tech. 2010, 3, 1771–1784. [Google Scholar] [CrossRef]
- Nakata, M.; Mukai, S.; Yasumoto, M. Seasonal and Regional Characteristics of Aerosol Pollution in East and Southeast Asia. Front. Environ. Sci. 2018, 6, 29. [Google Scholar] [CrossRef]
- Wang, J.; Allen, D.J.; Pickering, K.E.; Li, Z.; He, H. Impact of aerosol direct effect on East Asian air quality during the EAST-AIRE campaign. J. Geophys. Res. Atmos. 2016, 121, 6534–6554. [Google Scholar] [CrossRef]
- Liu, Y.; Yi, B. Aerosols over East and South Asia: Type Identification, Optical Properties, and Implications for Radiative Forcing. Remote Sens. 2022, 14, 2058. [Google Scholar] [CrossRef]
- Huimin, C.; Bingliang, Z.; Jane, L.; Yinan, Z.; Yaxin, H.; Yang, C.; Yiman, G.; Wen, W.; Huijuan, L.; Shu, L.; et al. Absorbing Aerosol Optical Properties and Radiative Effects on Near-Surface Photochemistry in East Asia. Remote Sens. 2023, 15, 2779. [Google Scholar] [CrossRef]
- Zhang, M.; Wang, L.; Gong, W.; Ma, Y.; Liu, B. Aerosol Optical Properties and Direct Radiative Effects over Central China. Remote Sens. 2017, 9, 997. [Google Scholar] [CrossRef]
- Winker, D.M.; Vaughan, M.A.; Omar, A.; Hu, Y.; Powell, K.A.; Liu, Z.; Hunt, W.H.; Young, S.A. Overview of the CALIPSO Mission and CALIOP Data Processing Algorithms. J. Atmos. Ocean. Technol. 2009, 26, 2310–2323. [Google Scholar] [CrossRef]
- Winker, D.M.; Hunt, W.H.; McGill, M.J. Initial performance assessment of CALIOP. Geophys. Res. Lett. 2007, 34, L19803. [Google Scholar] [CrossRef]
- Winker, D.M.; Pelon, J.; Coakley, J.A.; Ackerman, S.A.; Charlson, R.J.; Colarco, P.R.; Flamant, P.; Fu, Q.; Hoff, R.M.; Kittaka, C.; et al. The CALIPSO Mission: A Global 3D View of Aerosols and Clouds. Bull. Am. Meteorol. Soc. 2010, 91, 1211–1230. [Google Scholar] [CrossRef]
- Kim, M.H.; Omar, A.H.; Tackett, J.L.; Vaughan, M.A.; Winker, D.M.; Trepte, C.R.; Hu, Y.; Liu, Z.; Poole, L.R.; Pitts, M.C.; et al. The CALIPSO version 4 automated aerosol classification and lidar ratio selection algorithm. Atmos. Meas. Tech. 2018, 11, 6107–6135. [Google Scholar] [CrossRef] [PubMed]
- Kalluri, R.O.R.; Gugamsetty, B.; Kotalo, R.G.; Nagireddy, S.K.R.; Tandule, C.R.; Thotli, L.R.; Shaik, N.H.; Maraka, V.R.; Rajuru, R.R.; Surendran Nair, S.B. Seasonal variation of near surface black carbon and satellite derived vertical distribution of aerosols over a semi-arid station in India. Atmos. Res. 2017, 184, 77–87. [Google Scholar] [CrossRef]
- Young, S.A.; Vaughan, M.A.; Garnier, A.; Tackett, J.L.; Lambeth, J.D.; Powell, K.A. Extinction and optical depth retrievals for CALIPSO’s Version 4 data release. Atmos. Meas. Tech. 2018, 11, 5701–5727. [Google Scholar] [CrossRef]
- Boucher, O.; Quaas, J. Water vapour affects both rain and aerosol optical depth. Nat. Geosci. 2012, 6, 4–5. [Google Scholar] [CrossRef]
- Cohen, J.E.; Small, C. Hypsographic demography: The distribution of human population by altitude. Proc. Natl. Acad. Sci. USA 1998, 95, 14009–14014. [Google Scholar] [CrossRef]
- Chengcai, L.; Lau, A.K.H.; Jietai, M.; Chu, D.A. Retrieval, validation, and application of the 1-km aerosol optical depth from MODIS measurements over Hong Kong. IEEE Trans. Geosci. Remote Sens. 2005, 43, 2650–2658. [Google Scholar] [CrossRef]
- Aman, N.; Manomaiphiboon, K.; Suwattiga, P.; Assareh, N.; Limpaseni, W.; Suwanathada, P.; Soonsin, V.; Wang, Y. Visibility, aerosol optical depth, and low-visibility events in Bangkok during the dry season and associated local weather and synoptic patterns. Environ. Monit. Assess. 2022, 194, 322. [Google Scholar] [CrossRef] [PubMed]
- Yu, X.; Wong, M.S.; Liu, C.H. Multi-spatiotemporal AOD trends and association with land use changes over the Guangdong-Hong Kong-Macao Greater Bay Area during 2001–2021. Environ. Sci. Pollut. Res. Int. 2023, 30, 44782–44794. [Google Scholar] [CrossRef] [PubMed]
- Bridhikitti, A. Atmospheric aerosol layers over Bangkok Metropolitan Region from CALIPSO observations. Atmos. Res. 2013, 127, 1–7. [Google Scholar] [CrossRef]
- Cai, S.; Wang, Y.; Zhao, B.; Wang, S.; Chang, X.; Hao, J. The impact of the “Air Pollution Prevention and Control Action Plan” on PM2.5 concentrations in Jing-Jin-Ji region during 2012–2020. Sci. Total Environ. 2017, 580, 197–209. [Google Scholar] [CrossRef] [PubMed]
- Zhao, Q.; Gao, W.; Xiang, W.; Shi, R.; Liu, C.; Zhai, T.; Huang, H.-L.A.; Gumley, L.E.; Strabala, K. Analysis of air quality variability in Shanghai using AOD and API data in the recent decade. Front. Earth Sci. 2013, 7, 159–168. [Google Scholar] [CrossRef]
- Xia, X.; Che, H.; Zhu, J.; Chen, H.; Cong, Z.; Deng, X.; Fan, X.; Fu, Y.; Goloub, P.; Jiang, H.; et al. Ground-based remote sensing of aerosol climatology in China: Aerosol optical properties, direct radiative effect and its parameterization. Atmos. Environ. 2016, 124, 243–251. [Google Scholar] [CrossRef]
- Cao, X.; Wang, Z.; Tian, P.; Wang, J.; Zhang, L.; Quan, X. Statistics of aerosol extinction coefficient profiles and optical depth using lidar measurement over Lanzhou, China since 2005–2008. J. Quant. Spectrosc. Radiat. Transf. 2013, 122, 150–154. [Google Scholar] [CrossRef]
- Chen, S.; Huang, J.; Zhao, C.; Qian, Y.; Leung, L.R.; Yang, B. Modeling the transport and radiative forcing of Taklimakan dust over the Tibetan Plateau: A case study in the summer of 2006. J. Geophys. Res. Atmos. 2013, 118, 797–812. [Google Scholar] [CrossRef]
- Zhang, X.; Xu, X.; Ding, Y.; Liu, Y.; Zhang, H.; Wang, Y.; Zhong, J. The impact of meteorological changes from 2013 to 2017 on PM2.5 mass reduction in key regions in China. Sci. China Earth Sci. 2019, 62, 1885–1902. [Google Scholar] [CrossRef]
- Reddy, K.R.O.; Zhang, X.; Bi, L. Seasonal aerosol variations over a coastal city, Zhoushan, China from CALIPSO observations. Atmos. Res. 2019, 218, 117–128. [Google Scholar] [CrossRef]
- Honglin, P.; Jianping, H.; Kanike Raghavendra, K.; Linli, A.; Jinxia, Z. The CALIPSO retrieved spatiotemporal and vertical distributions of AOD and extinction coefficient for different aerosol types during 2007–2019: A recent perspective over global and regional scales. Atmos. Environ. 2022, 274, 118986. [Google Scholar] [CrossRef]
- He, Q.; Li, C.; Mao, J.; Lau, A.K.-H.; Chu, D.A. Analysis of aerosol vertical distribution and variability in Hong Kong. J. Geophys. Res. 2008, 113, D14211. [Google Scholar] [CrossRef]
- Sahu, L.K.; Kondo, Y.; Miyazaki, Y.; Pongkiatkul, P.; Kim Oanh, N.T. Seasonal and diurnal variations of black carbon and organic carbon aerosols in Bangkok. J. Geophys. Res. Atmos. 2011, 116, D15302. [Google Scholar] [CrossRef]
- Kumharn, W.; Sudhibrabha, S.; Hanprasert, K. Aerosol Optical Depth: A study using Thailand based Brewer Spectrophotometers. Adv. Space Res. 2015, 56, 2384–2388. [Google Scholar] [CrossRef]
- Wang, Y.; Xin, J.; Li, Z.; Wang, S.; Wang, P.; Hao, W.M.; Nordgren, B.L.; Chen, H.; Wang, L.; Sun, Y. Seasonal variations in aerosol optical properties over China. J. Geophys. Res. 2011, 116, D18209. [Google Scholar] [CrossRef]
- Franklin, M.; Enebish, T.; Chau, K. Ulaanbaatar, Mongolia’s coal-driven air pollution crisis and its role on adverse birth outcomes. In AGU Fall Meeting Abstracts; American Geophysical Union: Washington, DC, USA, 2019; p. GH31A–08. [Google Scholar]
- Tian, L.; Yu, W.; Schuster, P.F.; Wen, R.; Cai, Z.; Wang, D.; Shao, L.; Cui, J.; Guo, X. Control of seasonal water vapor isotope variations at Lhasa, southern Tibetan Plateau. J. Hydrol. 2020, 580, 124237. [Google Scholar] [CrossRef]
- Li, C.; Chen, P.; Kang, S.; Yan, F.; Hu, Z.; Qu, B.; Sillanpää, M. Concentrations and light absorption characteristics of carbonaceous aerosol in PM 2.5 and PM 10 of Lhasa city, the Tibetan Plateau. Atmos. Environ. 2016, 127, 340–346. [Google Scholar] [CrossRef]
- Ramachandran, S.; Kedia, S. Aerosol-Precipitation Interactions over India: Review and Future Perspectives. Adv. Meteorol. 2013, 2013, 649156. [Google Scholar] [CrossRef]
- Ostro, B.; Chestnut, L.; Vichit-Vadakan, N.; Laixuthai, A. The Impact of Particulate Matter on Daily Mortality in Bangkok, Thailand. J. Air Waste Manag. Assoc. 2011, 49, 100–107. [Google Scholar] [CrossRef]
- Sooktawee, S.; Humphries, U.; Limsakul, A.; Wongwises, P. Spatio-Temporal Variability of Winter Monsoon over the Indochina Peninsula. Atmosphere 2014, 5, 101–121. [Google Scholar] [CrossRef]
- Chen, Y.; Liu, Q.; Geng, F.; Zhang, H.; Cai, C.; Xu, T.; Ma, X.; Li, H. Vertical distribution of optical and micro-physical properties of ambient aerosols during dry haze periods in Shanghai. Atmos. Environ. 2012, 50, 50–59. [Google Scholar] [CrossRef]
- Xu, X.; Wu, H.; Yang, X.; Xie, L. Distribution and transport characteristics of dust aerosol over Tibetan Plateau and Taklimakan Desert in China using MERRA-2 and CALIPSO data. Atmos. Environ. 2020, 237, 117670. [Google Scholar] [CrossRef]
- Zeng, X.; Li, S.; Xing, J.; Yang, J.; Wang, Q.; Song, G.; Teng, M.; Zhou, D.; Lu, J. CALIPSO-observed Southeast Asia biomass-burning influences on aerosol vertical structure in Guangdong-Hong Kong-Macao Greater Bay Area. Atmos. Res. 2023, 289, 106755. [Google Scholar] [CrossRef]
- Gui, L.; Tao, M.; Wang, Y.; Wang, L.; Chen, L.; Lin, C.; Tao, J.; Wang, J.; Yu, C. Climatology of aerosol types and their vertical distribution over East Asia based on CALIPSO lidar measurements. Int. J. Climatol. 2022, 42, 6042–6054. [Google Scholar] [CrossRef]
- Proestakis, E.; Amiridis, V.; Marinou, E.; Georgoulias, A.K.; Solomos, S.; Kazadzis, S.; Chimot, J.; Che, H.; Alexandri, G.; Binietoglou, I.; et al. Nine-year spatial and temporal evolution of desert dust aerosols over South and East Asia as revealed by CALIOP. Atmos. Chem. Phys. 2018, 18, 1337–1362. [Google Scholar] [CrossRef]
- Bibi, M.; Saad, M.; Masmoudi, M.; Laurent, B.; Alfaro, S.C. Long-term (1980–2018) spatial and temporal variability of the atmospheric dust load and deposition fluxes along the North-African coast of the Mediterranean Sea. Atmos. Res. 2020, 234, 104689. [Google Scholar] [CrossRef]
- Kim, M.H.; Kim, S.W.; Yoon, S.C.; Omar, A.H. Comparison of aerosol optical depth between CALIOP and MODIS-Aqua for CALIOP aerosol subtypes over the ocean. J. Geophys. Res. Atmos. 2013, 118, 13241–13252. [Google Scholar] [CrossRef]
- Huang, J.; Lin, B.; Minnis, P.; Wang, T.; Wang, X.; Hu, Y.; Yi, Y.; Ayers, J.K. Satellite-based assessment of possible dust aerosols semi-direct effect on cloud water path over East Asia. Geophys. Res. Lett. 2006, 33, L19802. [Google Scholar] [CrossRef]


| Stations | Longitude (°E) | Latitude (°N) | Elevation (m) | Population (Million) | Climatic Zones |
|---|---|---|---|---|---|
| Ulaanbaatar | 106.92 | 47.92 | 1300 | 1.49 | Temperate continental climate |
| Lanzhou | 103.67 | 36.05 | 1823 | 4.42 | Temperate continental climate |
| Lhasa | 91.1 | 29.6 | 3738 | 0.87 | Mountain Climate |
| Beijing | 116.33 | 39.93 | 56 | 21.89 | Temperate Continental monsoon climate |
| Shanghai | 121.48 | 31.23 | 11 | 24.89 | Subtropical monsoon climate |
| Hong Kong | 114.25 | 22.25 | 32 | 7.33 | Subtropical monsoon climate |
| Bangkok | 100.51 | 13.75 | 13 | 10.69 | Tropical monsoon climate |
| Stations | MAM | JJA | SON | DJF |
|---|---|---|---|---|
| Ulaanbaatar | 0.134 | 0.264 | 0.126 | 0.107 |
| Lanzhou | 0.300 | 0.267 | 0.224 | 0.289 |
| Lhasa | 0.092 | 0.078 | 0.053 | 0.041 |
| Beijing | 0.370 | 0.423 | 0.394 | 0.373 |
| Shanghai | 0.364 | 0.415 | 0.460 | 0.485 |
| Hong Kong | 0.641 | 0.482 | 0.595 | 0.467 |
| Bangkok | 0.631 | 0.444 | 0.407 | 0.600 |
Disclaimer/Publisher’s Note: The statements, opinions and data contained in all publications are solely those of the individual author(s) and contributor(s) and not of MDPI and/or the editor(s). MDPI and/or the editor(s) disclaim responsibility for any injury to people or property resulting from any ideas, methods, instructions or products referred to in the content. |
© 2024 by the authors. Licensee MDPI, Basel, Switzerland. This article is an open access article distributed under the terms and conditions of the Creative Commons Attribution (CC BY) license (https://creativecommons.org/licenses/by/4.0/).
Share and Cite
Tang, Q.; Zhao, Y.; He, Y.; Yu, Q.; Liang, T. Analysis of Aerosol Types and Vertical Distribution in Seven Typical Cities in East Asia. Atmosphere 2024, 15, 195. https://doi.org/10.3390/atmos15020195
Tang Q, Zhao Y, He Y, Yu Q, Liang T. Analysis of Aerosol Types and Vertical Distribution in Seven Typical Cities in East Asia. Atmosphere. 2024; 15(2):195. https://doi.org/10.3390/atmos15020195
Chicago/Turabian StyleTang, Qingxin, Yinan Zhao, Yaqian He, Quanzhou Yu, and Tianquan Liang. 2024. "Analysis of Aerosol Types and Vertical Distribution in Seven Typical Cities in East Asia" Atmosphere 15, no. 2: 195. https://doi.org/10.3390/atmos15020195
APA StyleTang, Q., Zhao, Y., He, Y., Yu, Q., & Liang, T. (2024). Analysis of Aerosol Types and Vertical Distribution in Seven Typical Cities in East Asia. Atmosphere, 15(2), 195. https://doi.org/10.3390/atmos15020195